Article

Geospatial Analysis of Wind Energy Siting Suitability in the East African Community

by
Samuel Bimenyimana
1,2,*,
Chen Wang
1,3,*,
Godwin Norense Osarumwense Asemota
4,5,
Jeanne Paula Ihirwe
6,
Mucyo Ndera Tuyizere
7,
Fidele Mwizerwa
7,8,
Yiyi Mo
3 and
Martine Abiyese
2,4
1
Intelligence and Automation in Construction Provincial Higher-Educational Engineering Research Centre, Huaqiao University, Xiamen 361021, China
2
Hello Renewables Ltd., Kigali, Rwanda
3
Civil Engineering Department, Huaqiao University, Xiamen 361021, China
4
African Centre of Excellence in Energy for Sustainable Development, University of Rwanda, Kigali, Rwanda
5
Department of Electrical and Electronics Engineering, Morayo College, Thika 7053-01000, Kenya
6
Department of Economics and Management, Hebei University of Technology, Tianjin 300130, China
7
Center for Geographical Information System and Remote Sensing, University of Rwanda, Kigali, Rwanda
8
Department of Spatial Planning, College of Sciences and Technology University, University of Rwanda, Kigali, Rwanda
*
Authors to whom correspondence should be addressed.
Sustainability 2024, 16(4), 1514; https://doi.org/10.3390/su16041514
Submission received: 25 December 2023 / Revised: 3 February 2024 / Accepted: 4 February 2024 / Published: 10 February 2024
(This article belongs to the Section Sustainable Engineering and Science)

Abstract

:
Site investigation is essential for developing and constructing a dependable and effective wind engineering project. Also, the kinetic energy of moving air, used to drive a wind turbine, produces electricity. Having seen the shortage of previous studies on wind energy sites’ suitability across Africa and having read about the abundance of untapped wind energy resources in the East African region, this paper used Geographical Information System (GIS), multi-criteria, and Analytic Hierarchy techniques to provide a geospatial analysis of wind energy technology siting suitability in Eastern African Community Countries. Different data were acquired and processed from numerous open-access databases (Global Wind atlas, Regional Center for Mapping of Resources for Development (RCMRD), African Geoportal, East African community website, and Energy data Info.org). The results reveal Kenya has large parts of its land areas highly appropriate for wind energy siting (15.26%) and 1.55% of its land classified as unsuitable for wind energy generation. The rates of suitability and unsuitability were respectively 26.57% and 4.87% for Burundi, 20.6% and 10.21% for Rwanda, 20.39% and 10.44% for Tanzania, and 4.65% and 27.15% for South Sudan. The findings also show that East Africa exhibits moderate levels of wind energy siting suitability, with an estimated average of around 37.27% of its land area moderately suitable for wind energy technology installation, covering thousands of square kilometers. The study is advantageous to academia and industry-related personnel engaged in renewable energy-related activities in other African countries with similar topographies.

1. Introduction

Regions throughout the world are impacted by climate change. There is a need for quick policy analysis and studies that encourage the use of renewable energy sources, such as wind energy, to enhance the production of green electricity. To achieve a shift toward modern sustainable energy by 2030, 60% of power generation must come from renewable sources (green/clean energy sources technologies should be the first priority when implementing energy-related solutions) [1].
The long-term warming of the Earth’s surface that has existed since the pre-industrial era (between 1850 and 1900) is known as global warming. It is caused by human activities, mainly the burning of fossil fuels, which raises atmospheric concentrations of heat-trapping greenhouse gases. Climate change mitigation refers to activities that either minimize greenhouse gas emissions or eliminate the atmospheric presence of such gases. Different research works [2,3,4,5,6,7,8,9,10,11,12,13,14,15,16,17,18,19,20,21] have listed negative impacts of global warming, such as floods, droughts, and temperature rise. Renewable energy usage is one way to mitigate global emissions, and wind technology is among them. Wind energy is a plentiful, clean, renewable energy source that needs little land surface, has no water requirements, and emits no greenhouse gases. Both onshore and offshore wind farms benefit from the operation and development of specialized applications. The design, location, and maintenance of a wind energy plant depend on the capacity to measure and evaluate available wind resources.
Also, a wind energy project’s potential yield is ascertained by appraising and analyzing wind energy resources. While yield is decided by technical factors like the type of wind turbine and the architecture of the wind farm, available potential depends on meteorological elements. Wind turbine type, rotor diameter, hub height, local wind speeds, wind direction, and wind shear all affect how well a project turns out. Deciding the locations of wind resources, realizing their features, and establishing their quality characteristics are indispensable. Low energy output could arise from improper risk evaluation of these characteristics, which impedes smooth functioning. When a wind farm is installed, the locations of the wind turbines are decided by the wind farm layout. Often, various site analyses, constraint management, and wind speed data lead to an iterative procedure. To mitigate investment risk, wind farm developers are expected to conduct a thorough site analysis that evaluates all available climatic sources.
Often, site wind measurements are unavailable while a wind farm is initially developed. Consequently, to assess a project’s viability and determine the anticipated wind speed, wind energy developers must rely on available climatic data. Climatic data also offer information on the primary wind direction, which is crucial for minimizing wake effects among wind turbines and has substantial power on layout design. The precision of the data is enhanced when multiple climatic sources are combined. Before developing a wind project, wind farm developers are encouraged to thoroughly consider additional factors such as the site’s accessibility, any potential environmental constraints, proximity to the power grid, or land agreements. The success of a wind energy project depends on choosing a suitable wind farm location. When site measurements are unavailable, climatic information on wind direction and wind speed is essential. However, these sources frequently contain significant mistakes in wind speed data and neglect to account for regional influences that could affect generated wind roses. If climatic data are not correctly processed, unrealistic energy forecasts may result [1]. The choice of a location is decided by numerous technical aspects, including adequate wind speed; sufficient area (larger blades can reach quicker wind speeds at higher altitudes above the earth and cover a wider region); appropriate ground conditions (topography’s roughness determined by the quantity and size of barriers, as well as the ground’s composition); access to the electricity grid (connecting wind turbines to the electrical grid may have an impact on power quality and supply reliability.); suitable terrain and topography; and agreements with site landowners. Also, wind monitoring is essential for locating optimal wind turbines for optimal performance. The performance of wind turbines is substantially powered by wind direction and speed. The power produced by the wind turbine rises with increasing wind speed. Additionally, as turbines face the direction of the predominant wind, wind direction is also crucial in determining the ideal locations [22].
Wind turbines are devices that transform wind energy from its kinetic to its electrical form. In wind farms, hundreds of thousands of large turbines produced over 650 gigawatts of electricity as of 2020, with an additional 60 GW installed per year [23]. In many nations, wind turbines operate as a more cost-effective and less-reliant source of intermittent renewable energy to offset rising fossil fuel prices. Compared to solar, hydro, geothermal, coal, and gas energy sources, one study stated that wind had the “lowest relative greenhouse gas emissions, the least water consumption demands, and the most favorable social impacts” as of 2009 [24]. Smaller wind turbines are deployed in remote equipment like traffic warning signals and battery charging. Larger turbines can help with home energy production while reselling excess energy to the utility company through the electrical grid [25]. Horizontal or vertical axes can be found on wind turbines, though horizontal axes are more frequently produced [26]. Different research has been carried out on wind energy, where [27] focuses on the state of the world and China’s existing wind power capacity and shows the consistency of the rising share of wind power in future energy. This research also ascertains a thorough assessment method for choosing wind turbine generators and creates a comprehensive evaluation model for wind turbines based on the BP neural network and particle swarm optimization.
The research work [28] provided a summary of current studies and advancements in electricity production with offshore wind turbines. Reference [29] explained the benefits of both active and reactive power control for wind energy systems in order to raise the quality of the energy generated for the grid. Two control approaches are presented for wind energy conversion systems that have dual power supplies and an asynchronous generator; [30] focused on the improvement of a speed wind turbine through the development of an effective and reliable control system for both active and reactive power using the PI regulators control (FOC) power converters directly connected to the stator and rotor of a Doubly Fed Induction Generator (DFIG) system integrated in a wind turbine, [31] focused on the implementation of a new feature that tracks the maximum power point tracking (MPPT) power for the sliding mode control (SMC) of permanent magnet synchronous generators (PMSG) used in wind systems conversion, [32] carried out the research on wind energy technology with a strong focus on how to maintain resonance and produce electricity, create and simulate a control system, and rebuild the vortex wind turbine mast, [33] carried out the research related to the wind generators’ effect on power system stability and discovered that at varying generator capacities, power system stability is significantly impacted by the generators’ dynamic model, [34] focused on the equivalent models for wind parks utilizing system identification methods based on nonlinear model structures, [35] established research on neural network-based intelligent diagnosis technology for wind turbine drive systems, [36] focused on using a rectifier in a wind system with a nearly sinusoidal input current.
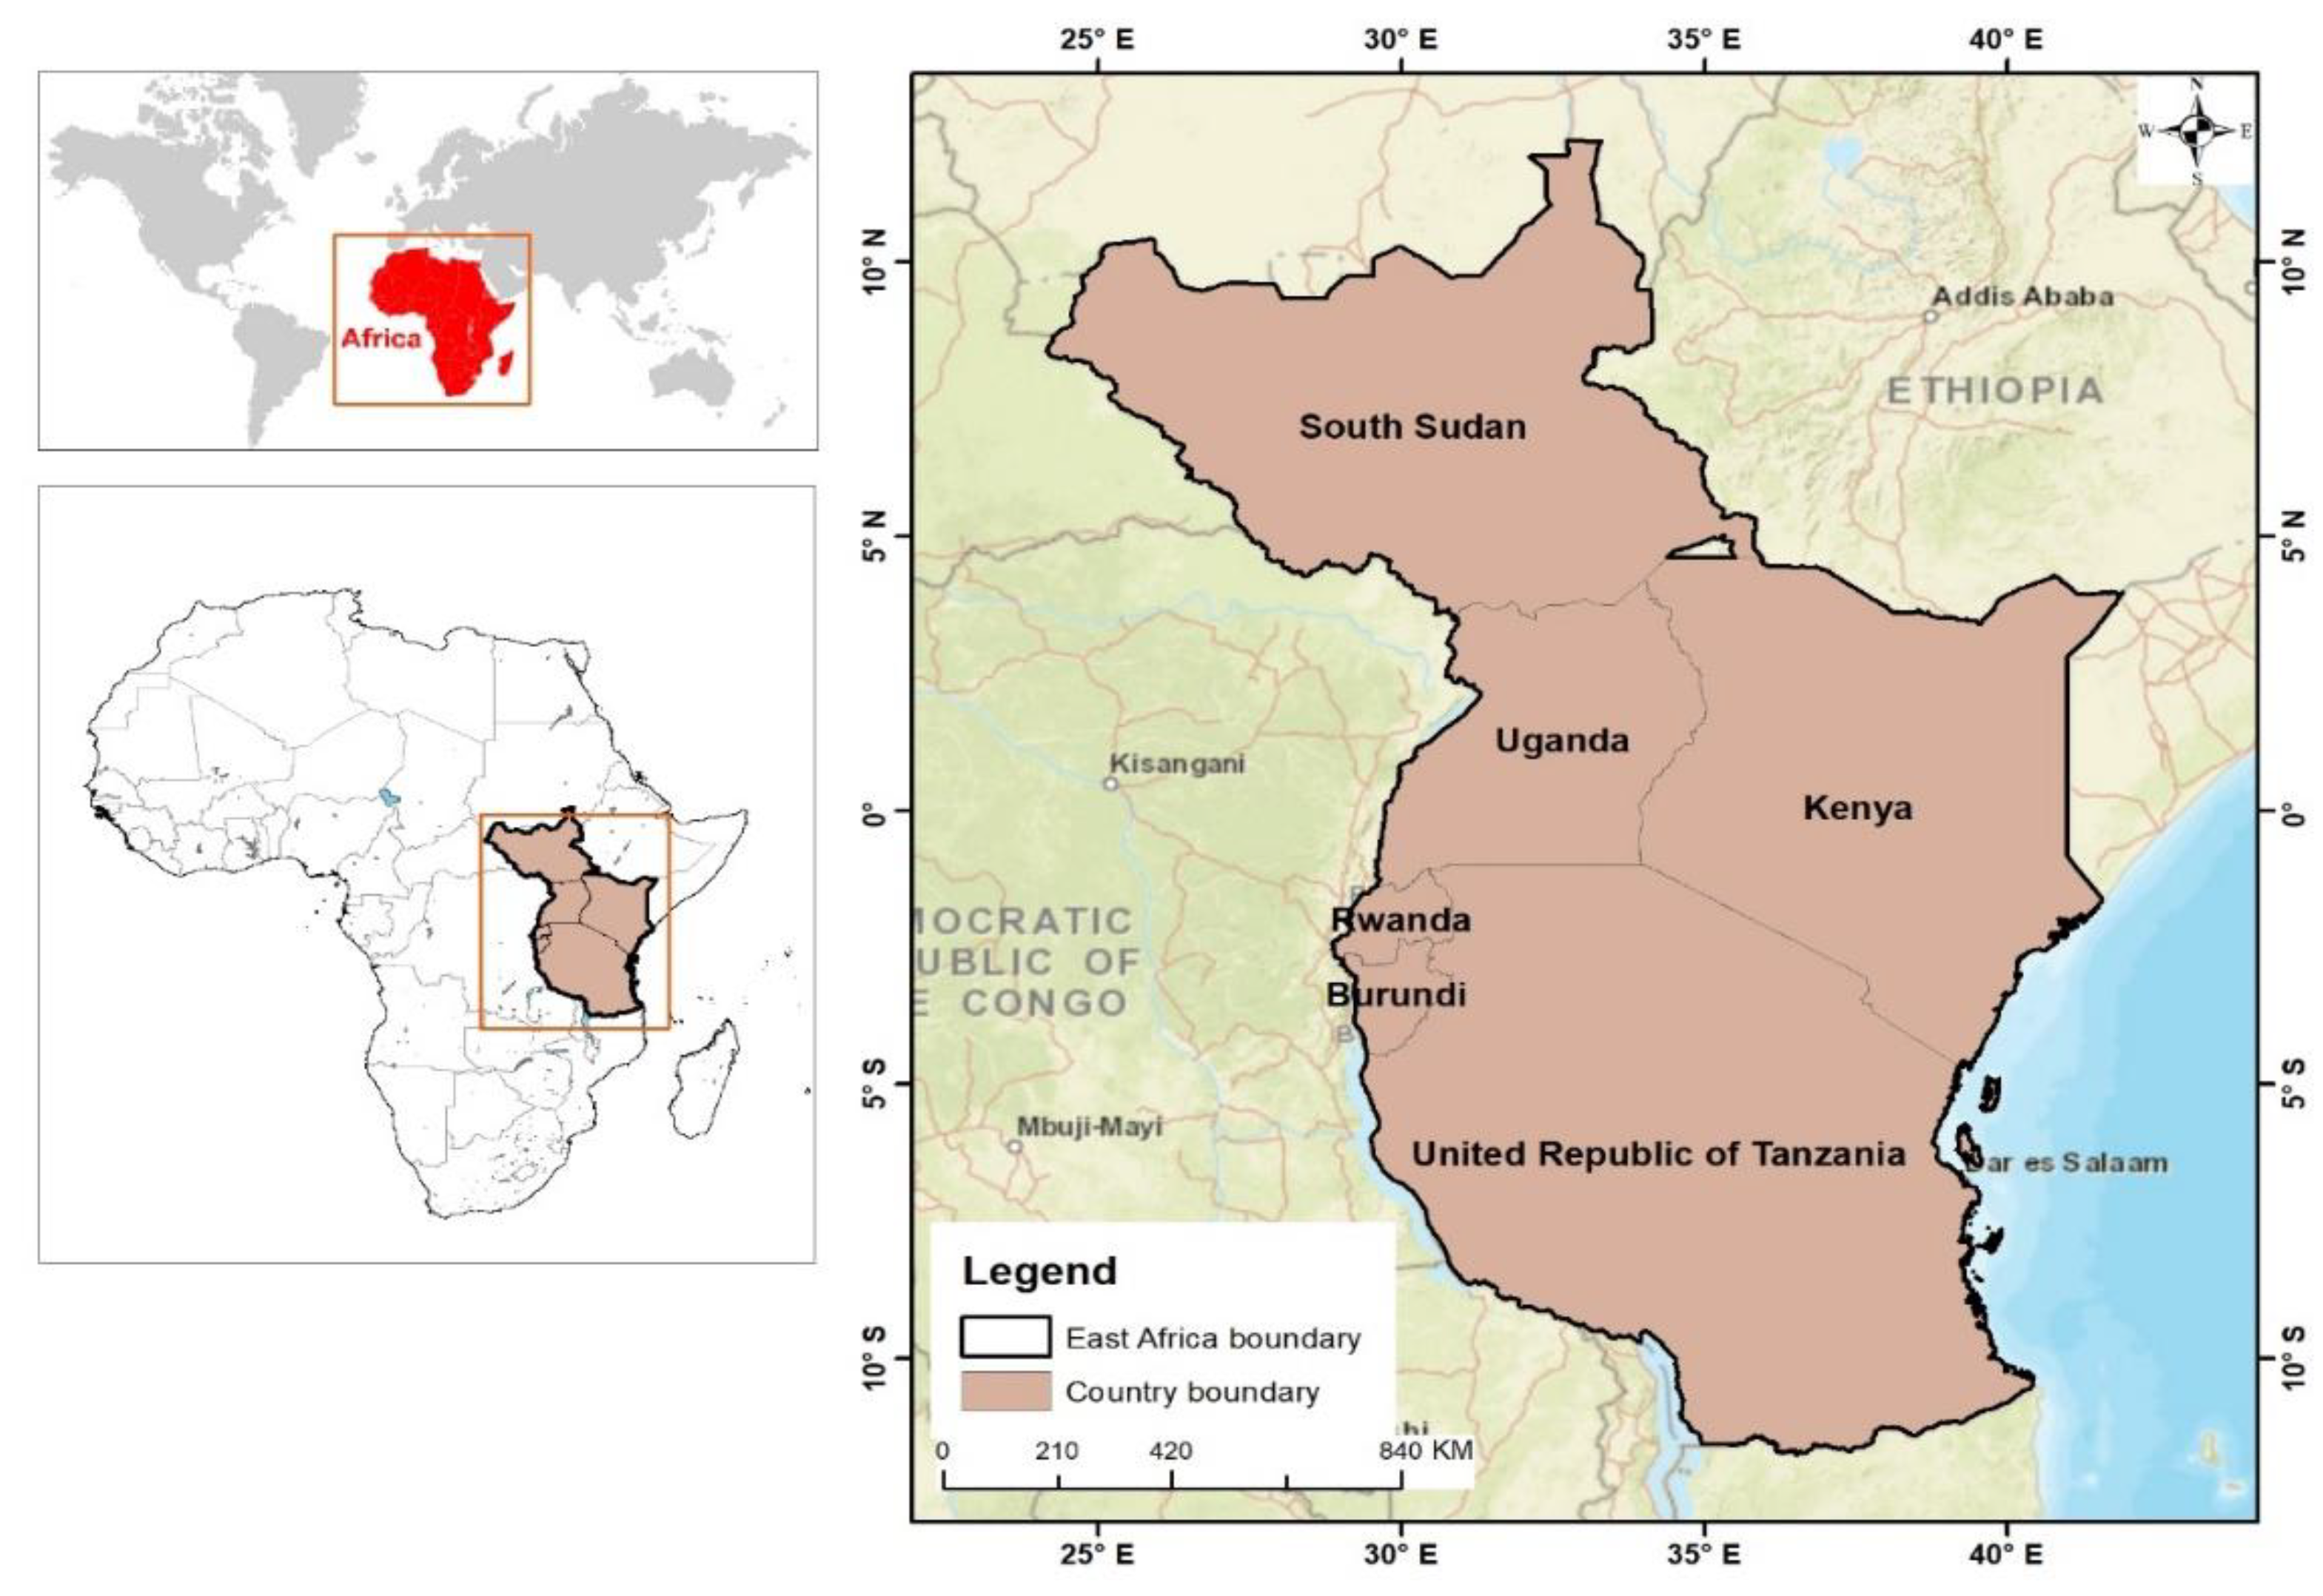
The research work in this paper focused on the site suitability analysis of wind energy technology for the East African Communities countries to find out the extent to which a place satisfies the requirements for wind power generation in terms of technology and environment structure (locating potential wind farm projects and choosing the best location for them, taking into account all limitations and specifications). There are no previous studies related to wind site suitability analysis across the East African region, and only research work [37] focused on the Burundi case study. The research in this paper covered six countries of the East African Community (Uganda, Rwanda, Burundi, South Sudan, Kenya, and Tanzania).

2. Related Work

There are plenty of chances for wind energy growth worldwide. There is growing demand for renewable energy [38,39,40], energy protection [41], energy sector reforms [42,43], and environmental quality [38,41], as cross-cutting opportunities. The primary obstacles to wind energy development are related to site suitability and technical constraints [44]. In contrast to Asia, Europe, and North America, wind power growth has not been particularly noteworthy in Africa. This is partially so because, compared to most other countries in these regions, most African countries have very little wind resources, and there has not been much research on site suitability and the capacity to utilize existing wind resources. Notwithstanding these challenges, from approximately 133 MW in 2000 to nearly 5770 MW in 2019, the cumulative installed capacity in this region has expanded. By the end of 2019, the African region accounted for 0.93% of the global cumulative installed wind power capacity, according to the study by [45].
The EAC region is rich in wind energy among others [46]. The emphasis on renewable energies has led to a surge in interest in wind energy. Understanding the potential of wind energy in detail at a particular place is necessary for its proper utilization [47]. EAC countries are trying to increase their wind capacity, and Kenya plans to add over 400 MW of wind capacity by 2030 [46]. The authors of [48] discussed the technological potential of wind energy in the African nation and also accounted for grid restrictions (as shown in Table 1). From their results, they show that Kenya is the leading country among the East African Community countries, with a high wind energy potential of 0.17% between 20,000–25,000 MWh/km2 and 0.01% of wind potential between 25,000–30,000 MWh/km2. The study shows that most countries in the East African Community have wind power potential that lies between 0 and 5000 MWh/km2.
In the study of [49], it was observed that the nations of the East African Community have substantial wind energy potential. Technical potential outpaces electricity usage in most regions. Burundi has the least potential for wind power, while South Sudan has the best promise for wind power [50] (details are provided in Table 2).
The study of [48,49] (as summarized in Table 3) describes the areas that are suitable for wind farms in the Eastern African Community, using the geographical information system, and shows that Rwanda, Burundi, Kenya, Uganda, and Tanzania indicate high area availability percentages with 100%, 88.86%, 98.66%, 99.27%, and 78.32%, respectively, for distance to the grid; these countries have 100%, 100%, 99.48%, 98.37%, and 99.31%, respectively, for very rural areas, while South Sudan and the Democratic Republic of Congo point toward lower area availability.
Over the past century, the wind potential in the East African Community has not been fully exploited for power generation, despite the potential wind power that EAC has in some areas that could provide possible solutions such as being used in water pumping systems, windmills, economic activities, and electricity generation. A study on wind speed distribution was conducted. In the study of [51], the results found for the average wind potential in the seven countries of the East African Community are presented in Table 3.
Although there has been relatively little research on wind energy resources, Rwanda’s potential for producing electricity from wind has not yet been fully realized. However, the potential wind power Rwanda possesses in some areas may present opportunities for solutions involving the production of electricity, water pumping, and windmills [47]. Therefore, the research conducted by [52] on the utilization of wind in Rwanda shows that the annual wind power densities for Kanombe, Gisenyi, Butare, Kamembe, and Kaniga have been estimated on average as 22.42 W/m2, 13.68 W/m2, 13.17 W/m2, 17.36 W/m2, and 20.75 W/m2, respectively, from the yearly mean wind speeds of 5.1 m/s, 4.1 m/s, 4.0 m/s, 4.3 m/s, and 4.1 m/s. From the results [51] of the five sites examined, Kanombe exhibits the possibility and probability of having the best wind power potential. As a result, it is a good location for installing technological wind instruments for moderate-scale power generation. Mean wind speeds above 7.0 m/s are necessary for large-scale wind power generation to produce at least 200.00 W/m2. According to the results of [47], since a majority of the sites’ mean velocities are below the 4.4 m/s criterion, their potentials should be utilized to generate electricity, because they are categorized as wind power class 1.
Although wind energy estimates are inadequate, current wind observations indicate that Uganda has “low” possibilities for producing a considerable amount of electricity from wind energy resources. Nevertheless, initial research suggests that potential exists in North-Eastern Uganda and along the Lake Victoria shoreline. In Uganda, wind speeds typically range from 3.7 m/s to 6.0 m/s in places surrounding Lake Victoria, the Karamoja region, and steep terrain [53]. Therefore, the application of wind technology in the nation can be sustained by this wind pattern. Furthermore, wind energy assessment and development purposes, rather than weather prediction, were the reasons for taking these wind speeds at places less than 10.0 m/s. Nevertheless, practical data suggest that certain wind speed ranges could be appropriate for specific wind power uses, such as distant water pumping [54]. Research has indicated that wind energy can play a significant role in promoting economic expansion and advancement [44,55,56].
There is currently not much research on wind resource assessment conducted in Burundi, the Democratic Republic of Congo, or South Sudan. Furthermore, the categorization and choice of appropriate wind farm locations have not been the subject of any research. To gain a basic understanding of wind resource potential and its distribution across Burundi, the Democratic Republic of Congo, and South Sudan, more research is necessary. Decision-makers will benefit from knowing what kind of wind farms work best in these nations and what size they can add to upcoming projects.
Installing wind farms in windy regions produces wind energy at a specific scale. When building a sustainable wind farm, choosing a turbine type that meets the topographical, climatic, temporal fluctuations, and other features of the wind farm location is crucial [57]. When there are conflicting decision criteria, various factors frequently influence the decision-making process. Given that choosing turbines involves several factors, there are some tactics used to address these problems [58]. The field of multicriteria decision-making (MCDM) encompasses them. An operating sub-discipline called MCDM evaluates multiple conflicting elements when making decisions. Problems involving numerous aspects of the decision-making process are solved using MCDM techniques. These standards are mutually incompatible and contradict one another. Furthermore, incommensurability indicates a situation where the choice criteria have distinct units and magnitudes [59]. Several MCDMs have been described by researchers, and each has advantages, as well as disadvantages. Consequently, the choice of which one to use is an important decision. Some commonly used techniques are the weighted sum method, PROMETHEE, TOPSIS, VIKOR, ELECTRE, goal programming, AHP, Grey relation analysis, minimum Manhattan distance (MMD) approach, and Fuzzy logic, among others [60].
The Analytical Hierarchy Process (AHP) was defined using paired comparisons for discrete and continuous data. AHP is a measurement theory that creates ratio scales that represent the relative strength of preferences and feelings [61]. In [62], Kenya has identified regions that are appropriate for the building of wind farms. These areas make up about 18,103 square miles or 8% of the country’s total size. With an area of 6456 square miles, Marsabit County in northern Kenya had the highest proportion of places for building wind farms.
According to [63], the study of GIS-based land-use suitability analysis found that AHP is used in the aggregation of priorities for the hierarchy structure by applying the principles of decomposition, comparative judgments, and synthesis of priorities. Measurement for this theory is conducted through pairwise comparisons and relies on the judgments of experts to derive priority scales. According to [61], the scale of absolute judgments shows how much more one element dominates another about a particular attribute to make these comparisons. Over time, GIS systems have developed into helpful resources for choosing sites under different circumstances and competing goals [64]. ArcGIS Pro 2.4.0 was utilized for this study to manage, edit, and overlay the various dataset layers. The appropriateness of a location for the development of wind farms is obtained by a broad range of intricate considerations [64]. Reference [65] determined two categories of criteria to aid in decision-making: constraint criteria and factor criteria. These standards delineate a level of suitability for every field of study. For their project, wind speed, slope, distance from gridlines, and distance from roadways were allowed. The most crucial consideration when choosing a location for a wind farm is wind speed [66]. A viable wind power project requires regular and sufficient wind speed. As referenced in [67,68], citing the National Renewable Energy Laboratory’s (NREL) classification, locations suitable for wind farm sites are those with wind speeds above 4.4 m per second at a height of 10 m above the anemometer, whereas locations below are not. Some sites should be reachable by road to facilitate equipment transfer. Reference [66] states that wind farm locations are determined by evaluating states that are easily accessible or near the current road network. The recommended safe distance to the road network is 500 m, and locations over 10,000 m from roadways are deemed inappropriate [67]. Since project costs are often a significant consideration when establishing wind farms, placing them adjacent to gridlines can lower their initial construction costs. Nonetheless, a gap of 250 m is noted between the wind farm and the gridline [67]. This lessens the difficulties brought on by large transmission routes of power. When selecting an appropriate site for the building of a wind farm, accessibility is an aspect to take into account. For this reason, low-slope locations are ideal for wind farms due to their low turbulence and accessibility [67]. Reference [65] additionally examined other factors about the limitations limiting the options under consideration. These depend on a Boolean criterion wherein things worthy of examination are assigned a code of 1, and those not worthy of consideration are coded 0. Forests and woodlands, lakes and their surroundings within 500 m, areas within 200 m from streams and rivers, areas within 5000 m from airports, and protected areas like historical sites, tourist destinations, and wildlife sanctuaries, are examples of the areas excluded from this study. Wet locations are not ideal for electric connections, so they should not be used for installing wind farms. Woodlands and forest areas are also deemed unsuitable for wind farms due to their obstructive nature [67]. According to [66], locations for wind farms are preferably isolated, desolate areas with little land use. 500 m is kept as a buffer between the wind farm and lakes to protect their shoreline, and according to [64], a safety zone within 200 m from rivers is maintained [67]. River areas are not appropriate for wind farm settings since wind farms have the potential to obstruct waterways. In addition, studies on the suitability of wind farms do not cover places like wildlife, tourist destinations, historic sites, archaeological sites, or locations with cultural significance [67]. Table 4 contains wind site suitability-related works.
The research [37] focused on optimal wind farm site selection using Geographical Information System-Based Mathematical Modeling and Fuzzy Logic Tools. A case study of Burundi’s findings revealed that the best place to build a wind farm in Burundi is in its western region, with Lake Tanganyika housing a majority of these farms. Reference [80] conducted an empirical study in China using geospatial modeling and decision optimization to determine the layout suitability and priority for a wind-photovoltaic-hydrogen-ammonia project. Reference [81] focused on multi-criteria solar power decision-making (a GIS-intuitionistic fuzzy-based technique for wind power plant site selection in the Netherlands). Also, Reference [82] focused on a multi-criteria decision analysis for spatial planning in Norwegian offshore wind generation. Reference [83] conducted research on Polish Offshore Wind Farm Potential and Location, using a multi-criteria analysis using Geographic Information Systems, while [84] studied how Turkey’s railway energy needs may be sustainably met by strategically placing offshore wind farms.

3. Methodology

The research in this paper aims to develop a novel methodology for classifying land into distinct suitability levels for wind farm construction. The categorization is based on various factors specific to the case study and considers the technical challenges. As a result, we must determine which aspects of land suitability for wind farm development hold the utmost significance. Subsequently, specific weights are assigned to each of these factors, culminating in an index designed to evaluate land suitability. The Analytic Hierarchy Process (AHP) plays a pivotal role in deriving these final weights. Ultimately, this research leverages Geographic Information Systems (GIS) to generate a suitability map, enabling spatial analysis, and amalgamating multiple factors within the resultant index. The main objective of this research is to identify and delineate areas suitable for wind energy farm projects to facilitate informed decision-making within the wind energy sector. 
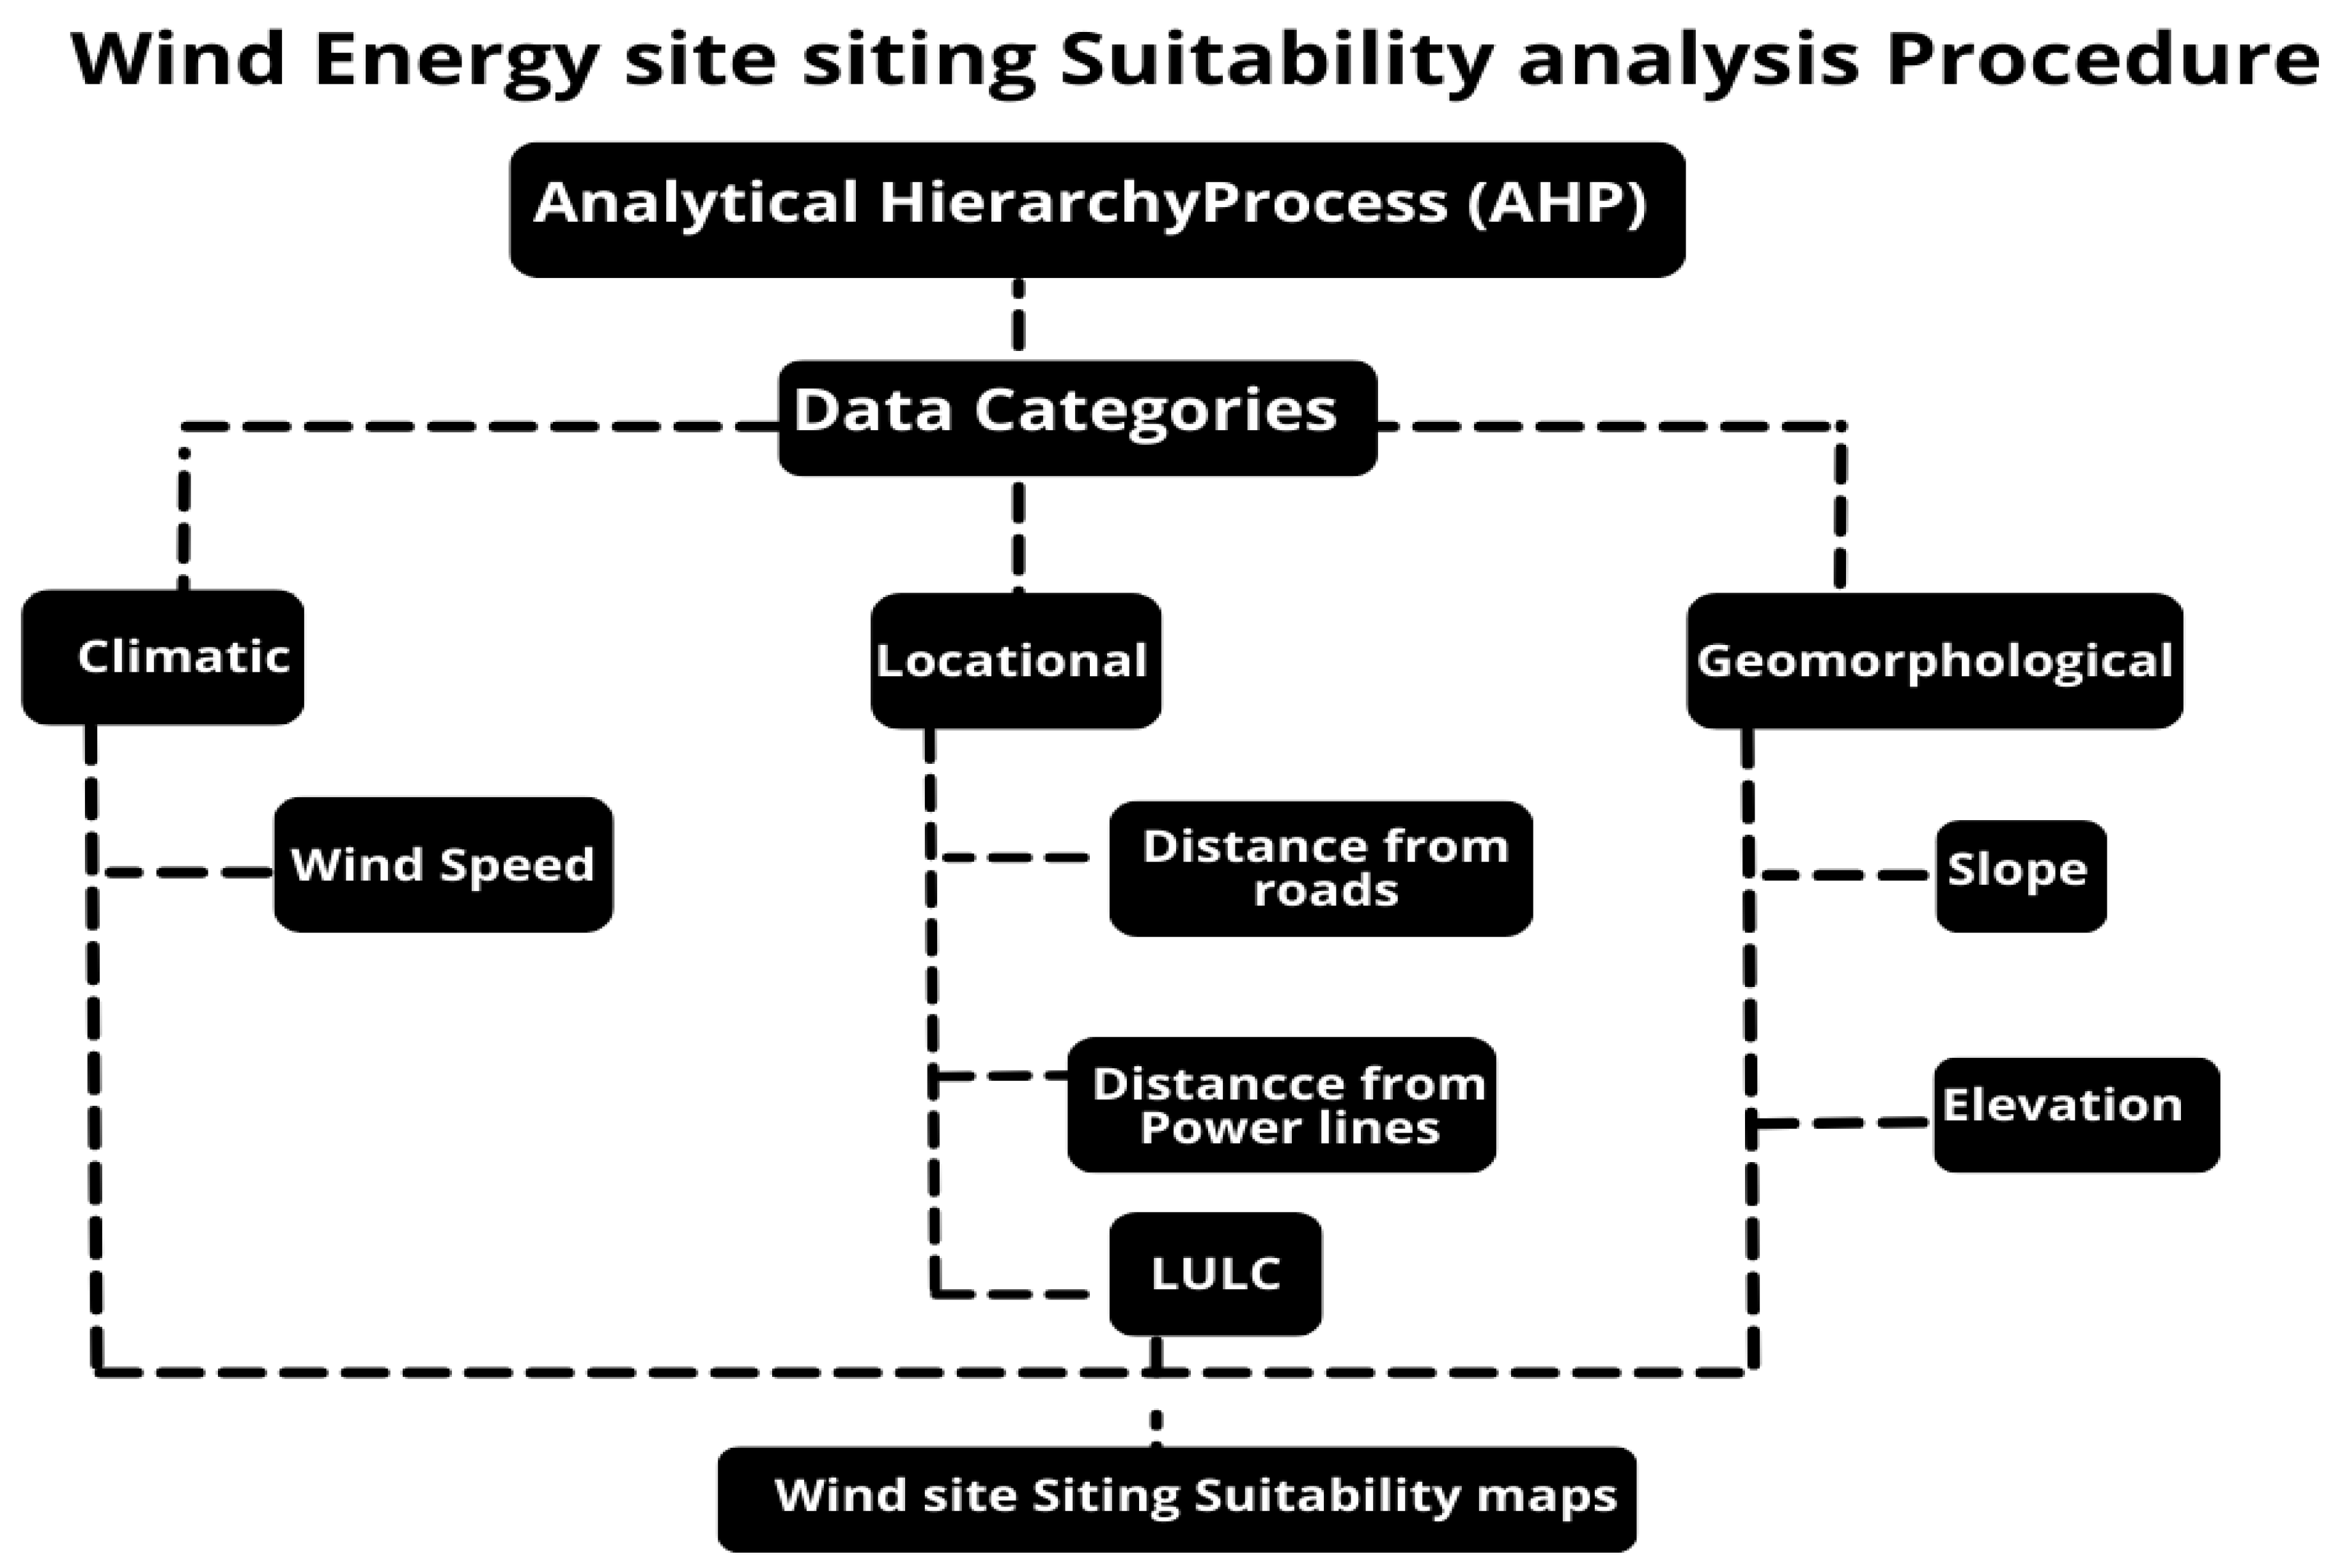
Figure 1 illustrates the location of the research object in this paper, and Figure 2 describes the framework diagram for finding suitable sites for wind energy in East Africa. The Geographic Information System (GIS) was preferred over other methods due to its ability to swiftly and precisely collect data over wider areas and its capability of covering large areas with the additional advantage of repetition. Both multi-criteria and analytic hierarchy techniques were selected because they permit ranking or shortlisting potential options or determining a single favorite option. They allow choices to be made as hierarchies, and each criterion may be assigned a preference scale that is specified by the decision makers. They also offer a systematic way to assist difficult decisions by preset standards and goals.

3.1. Criteria Selection and Relevance

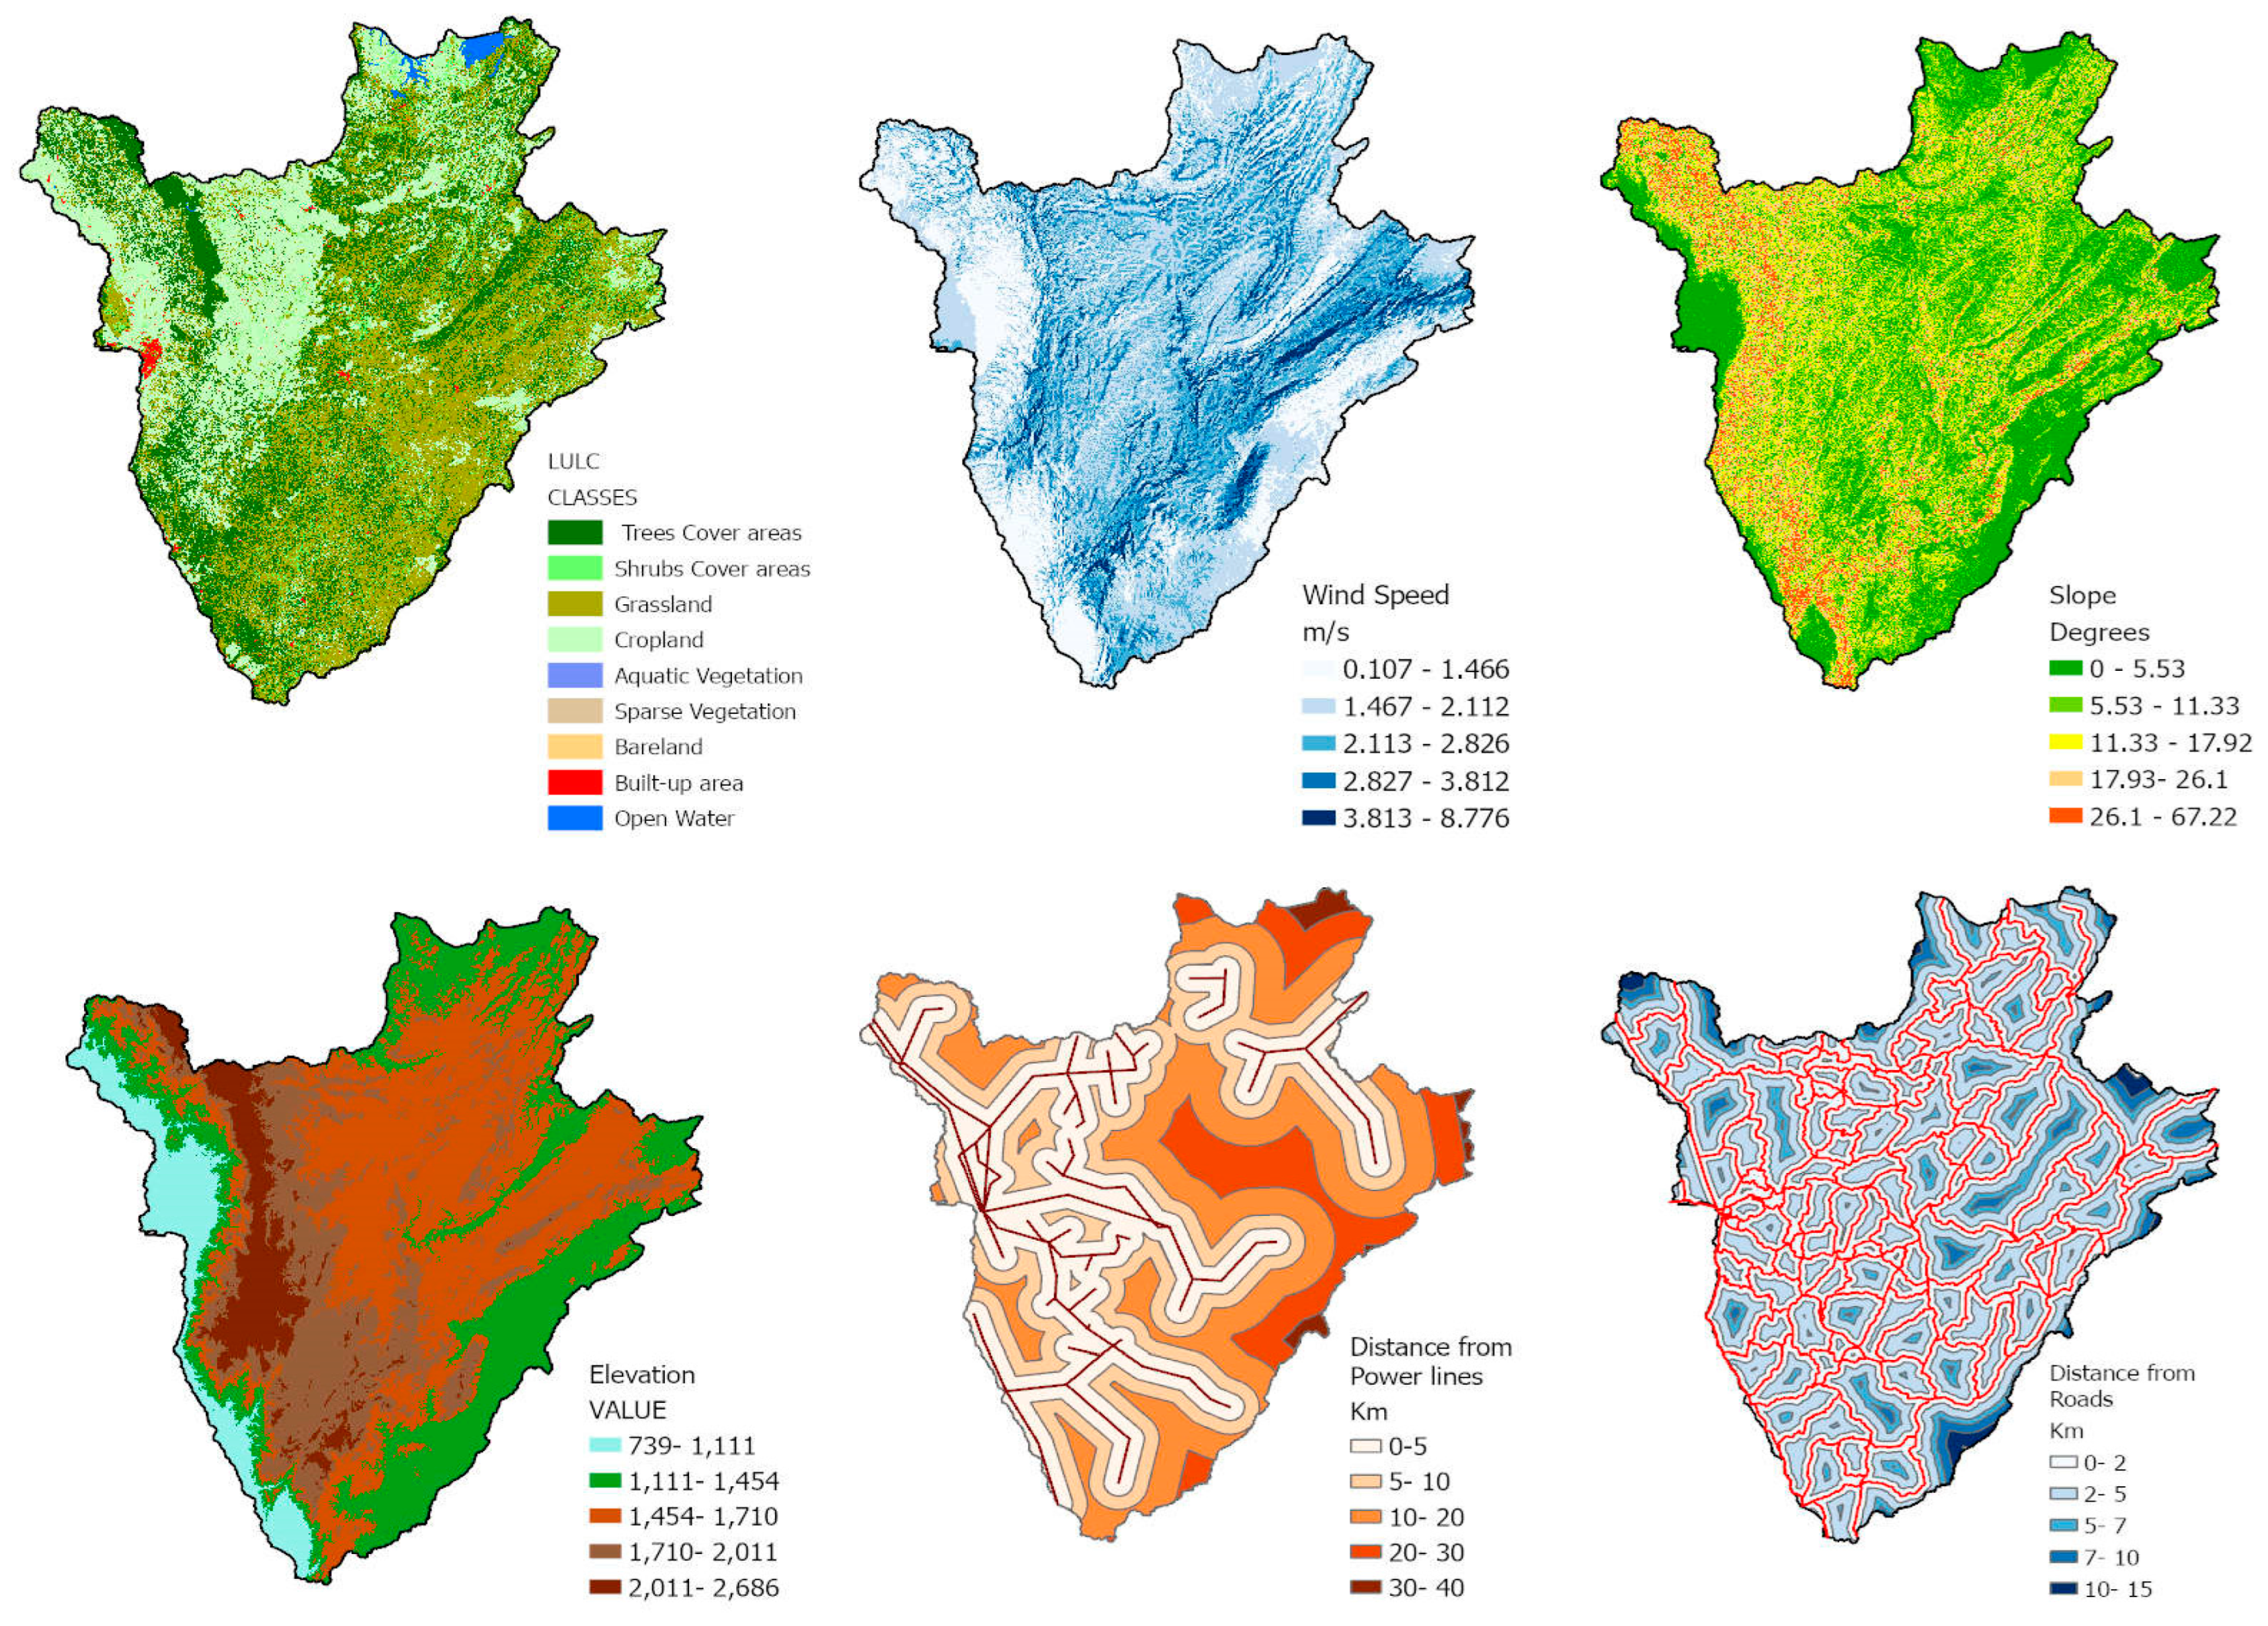
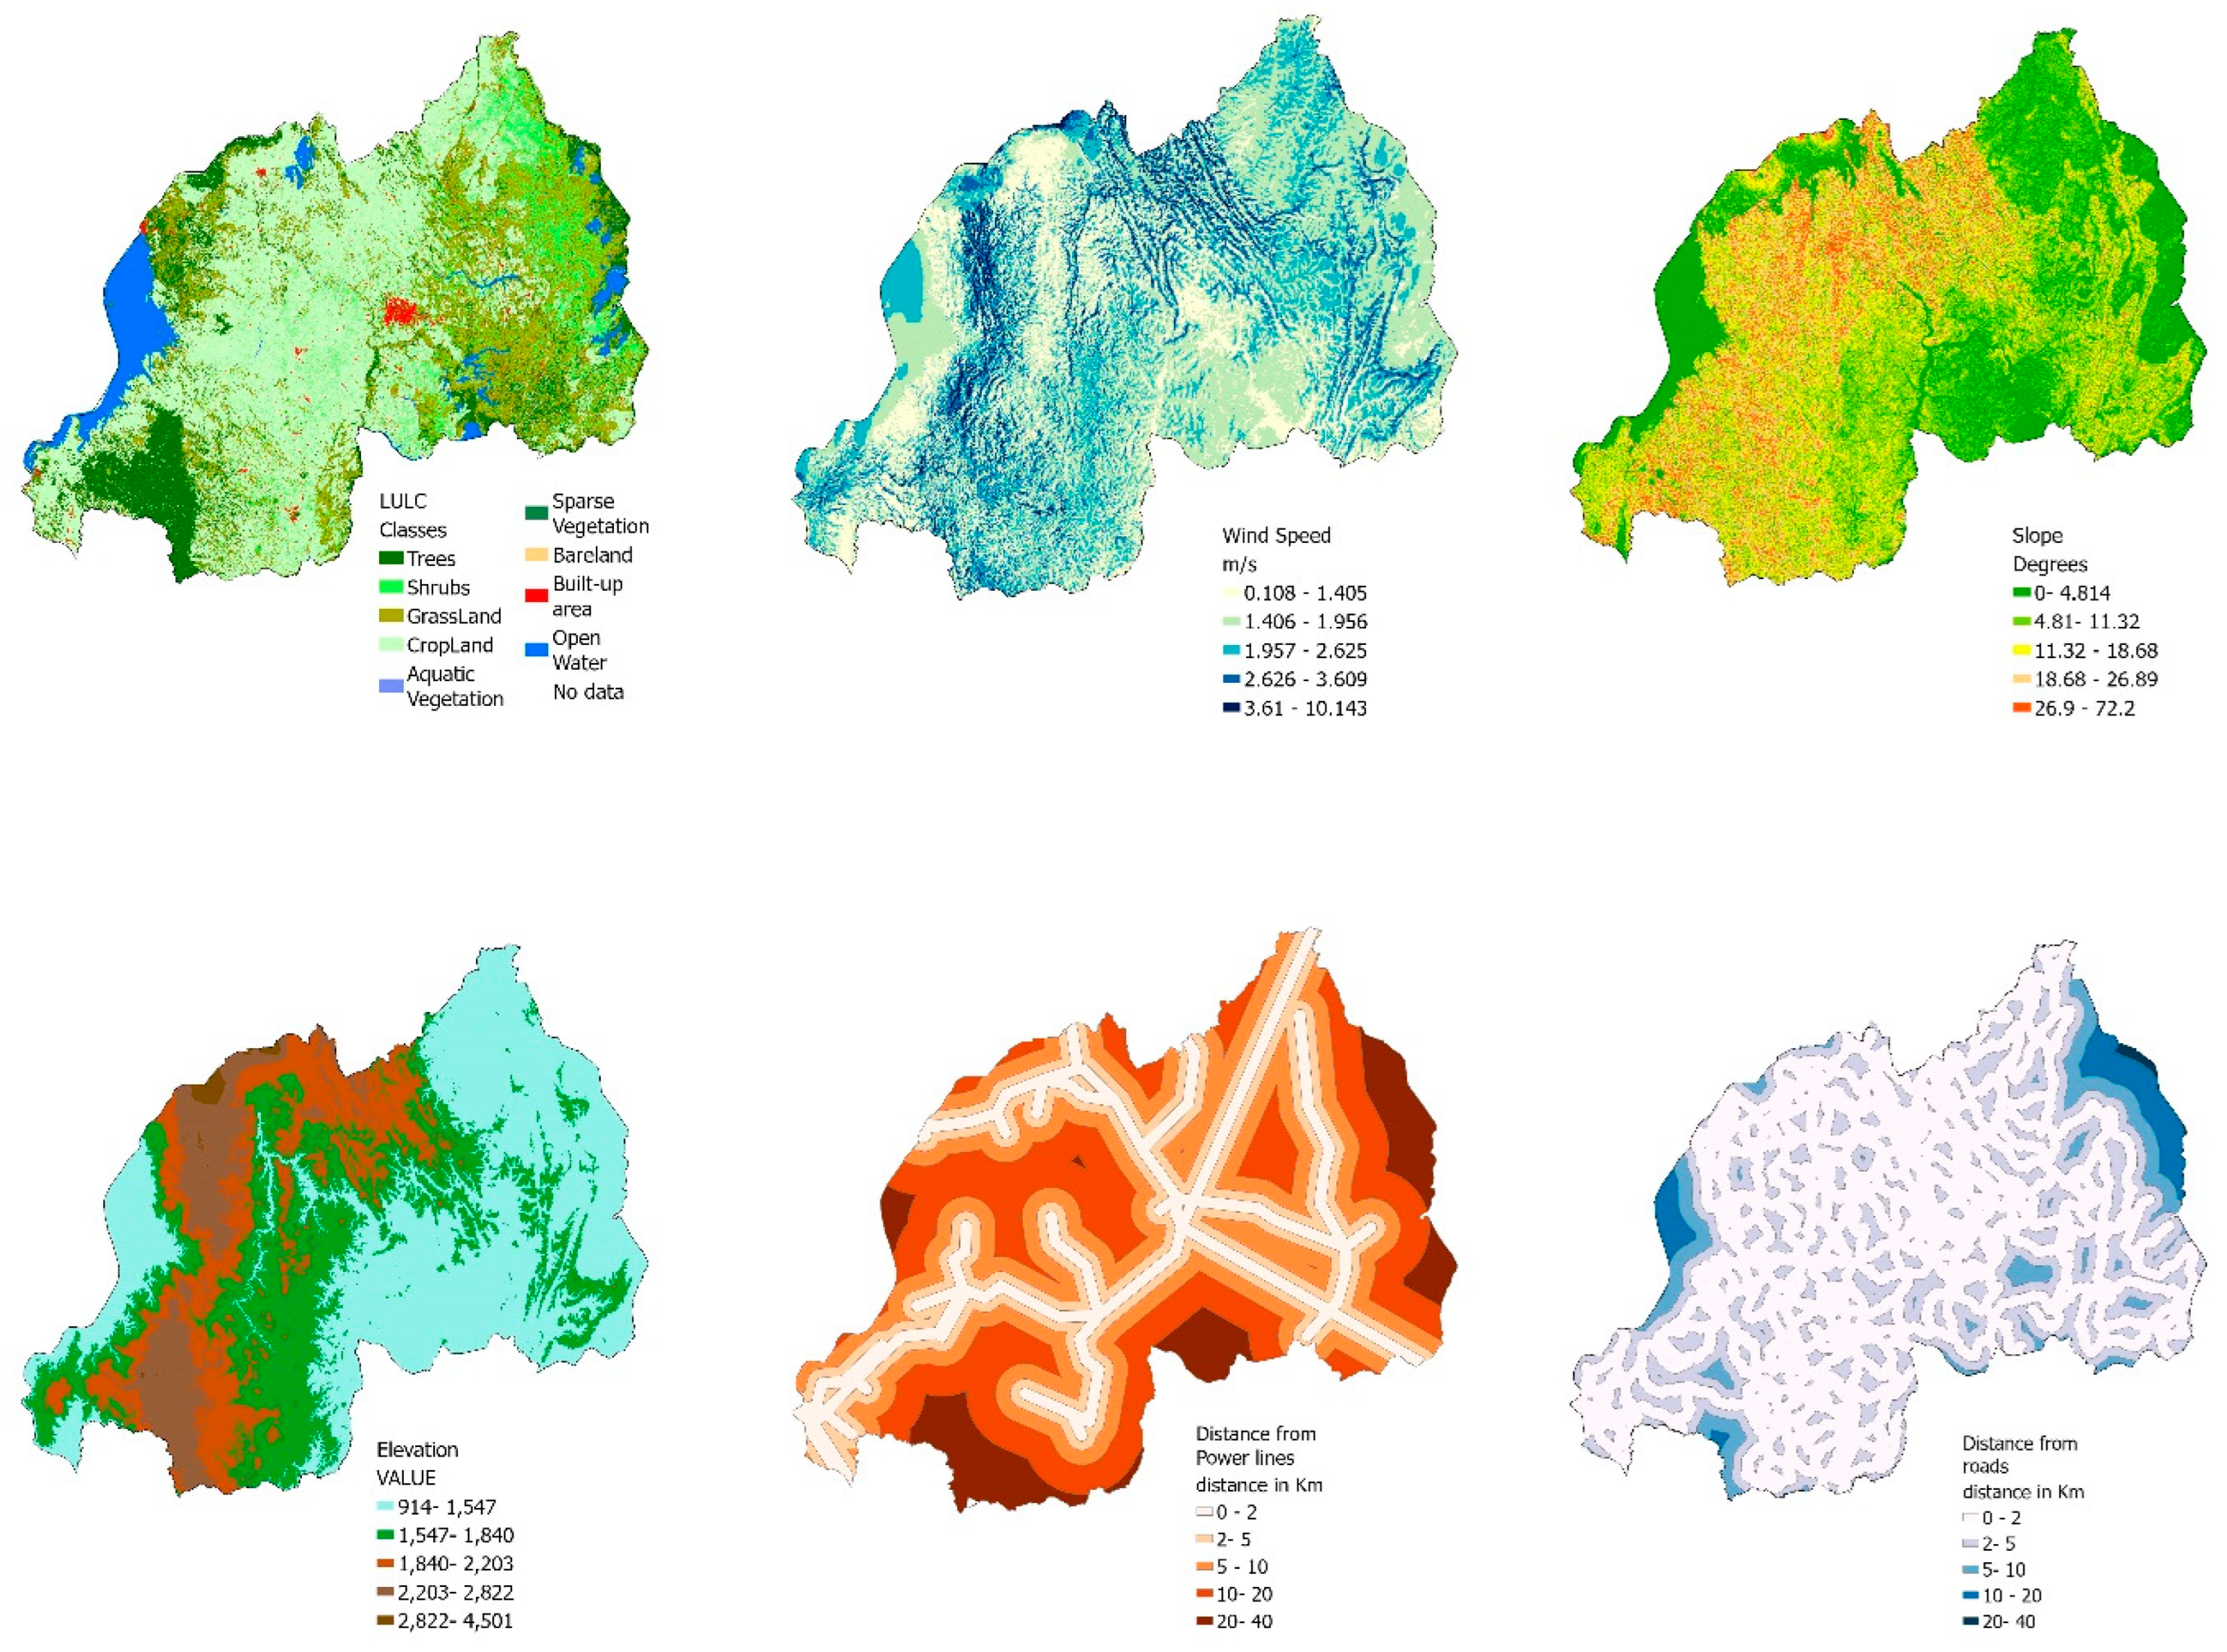
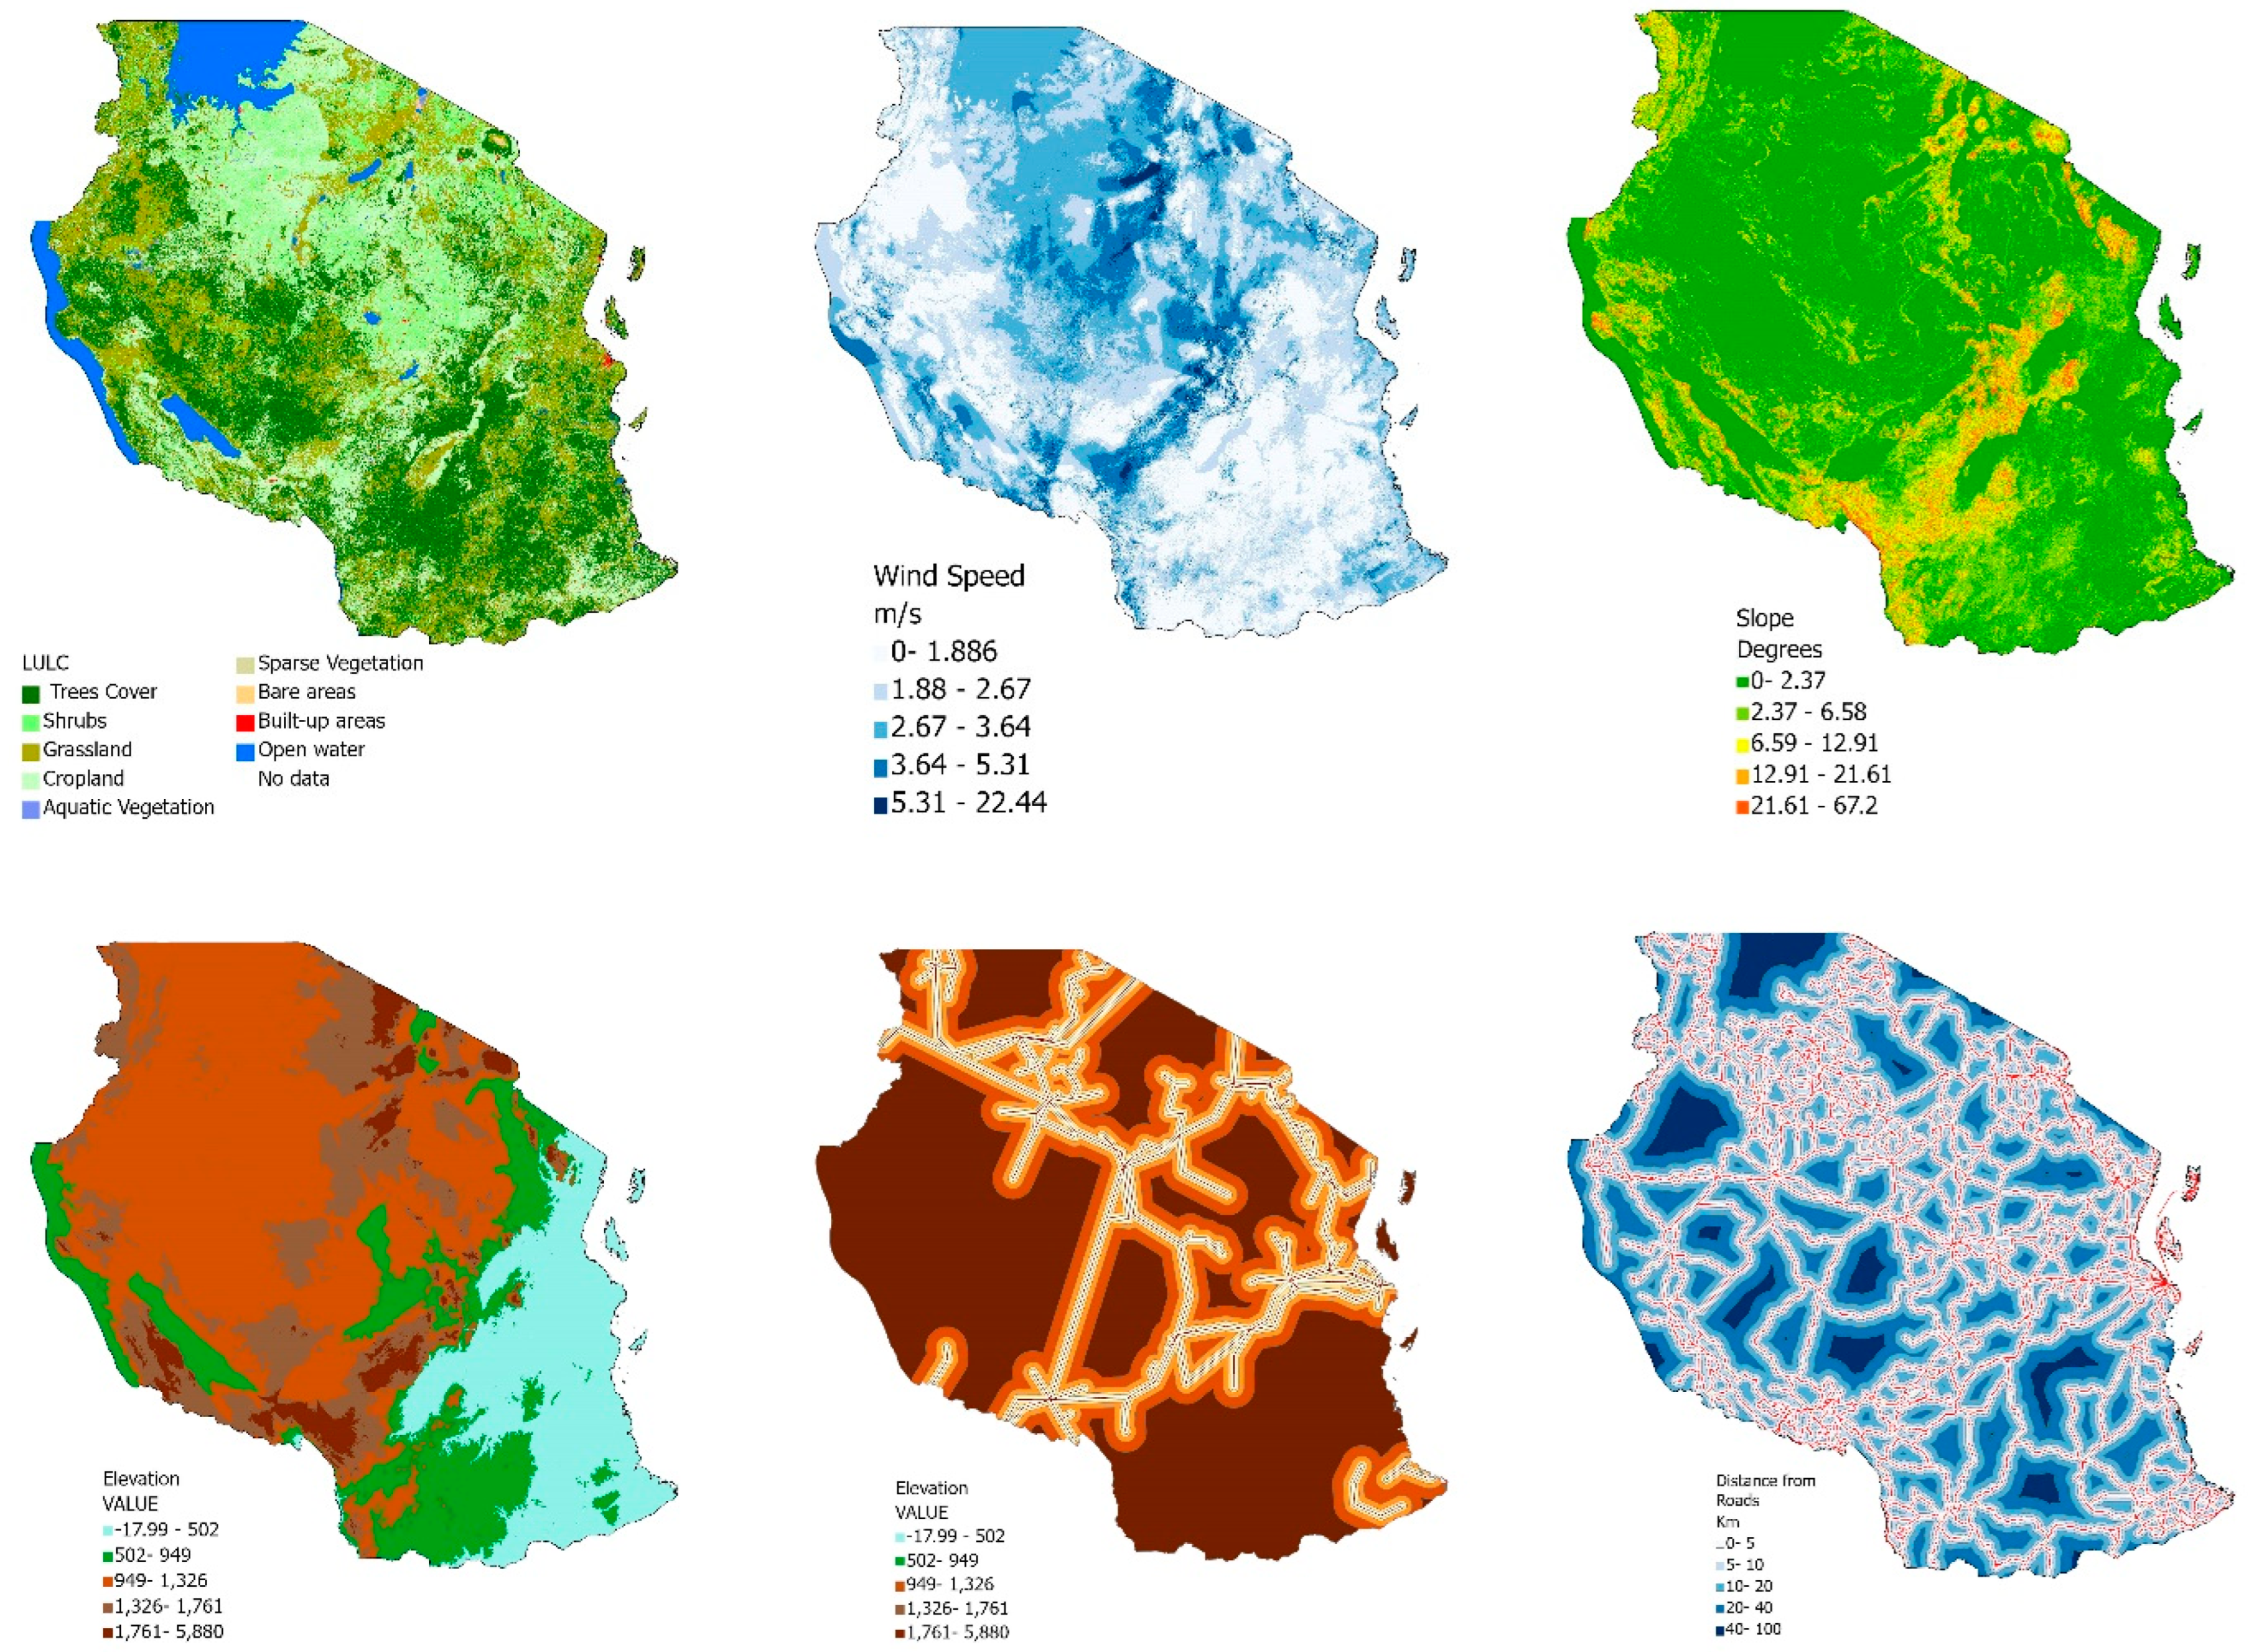
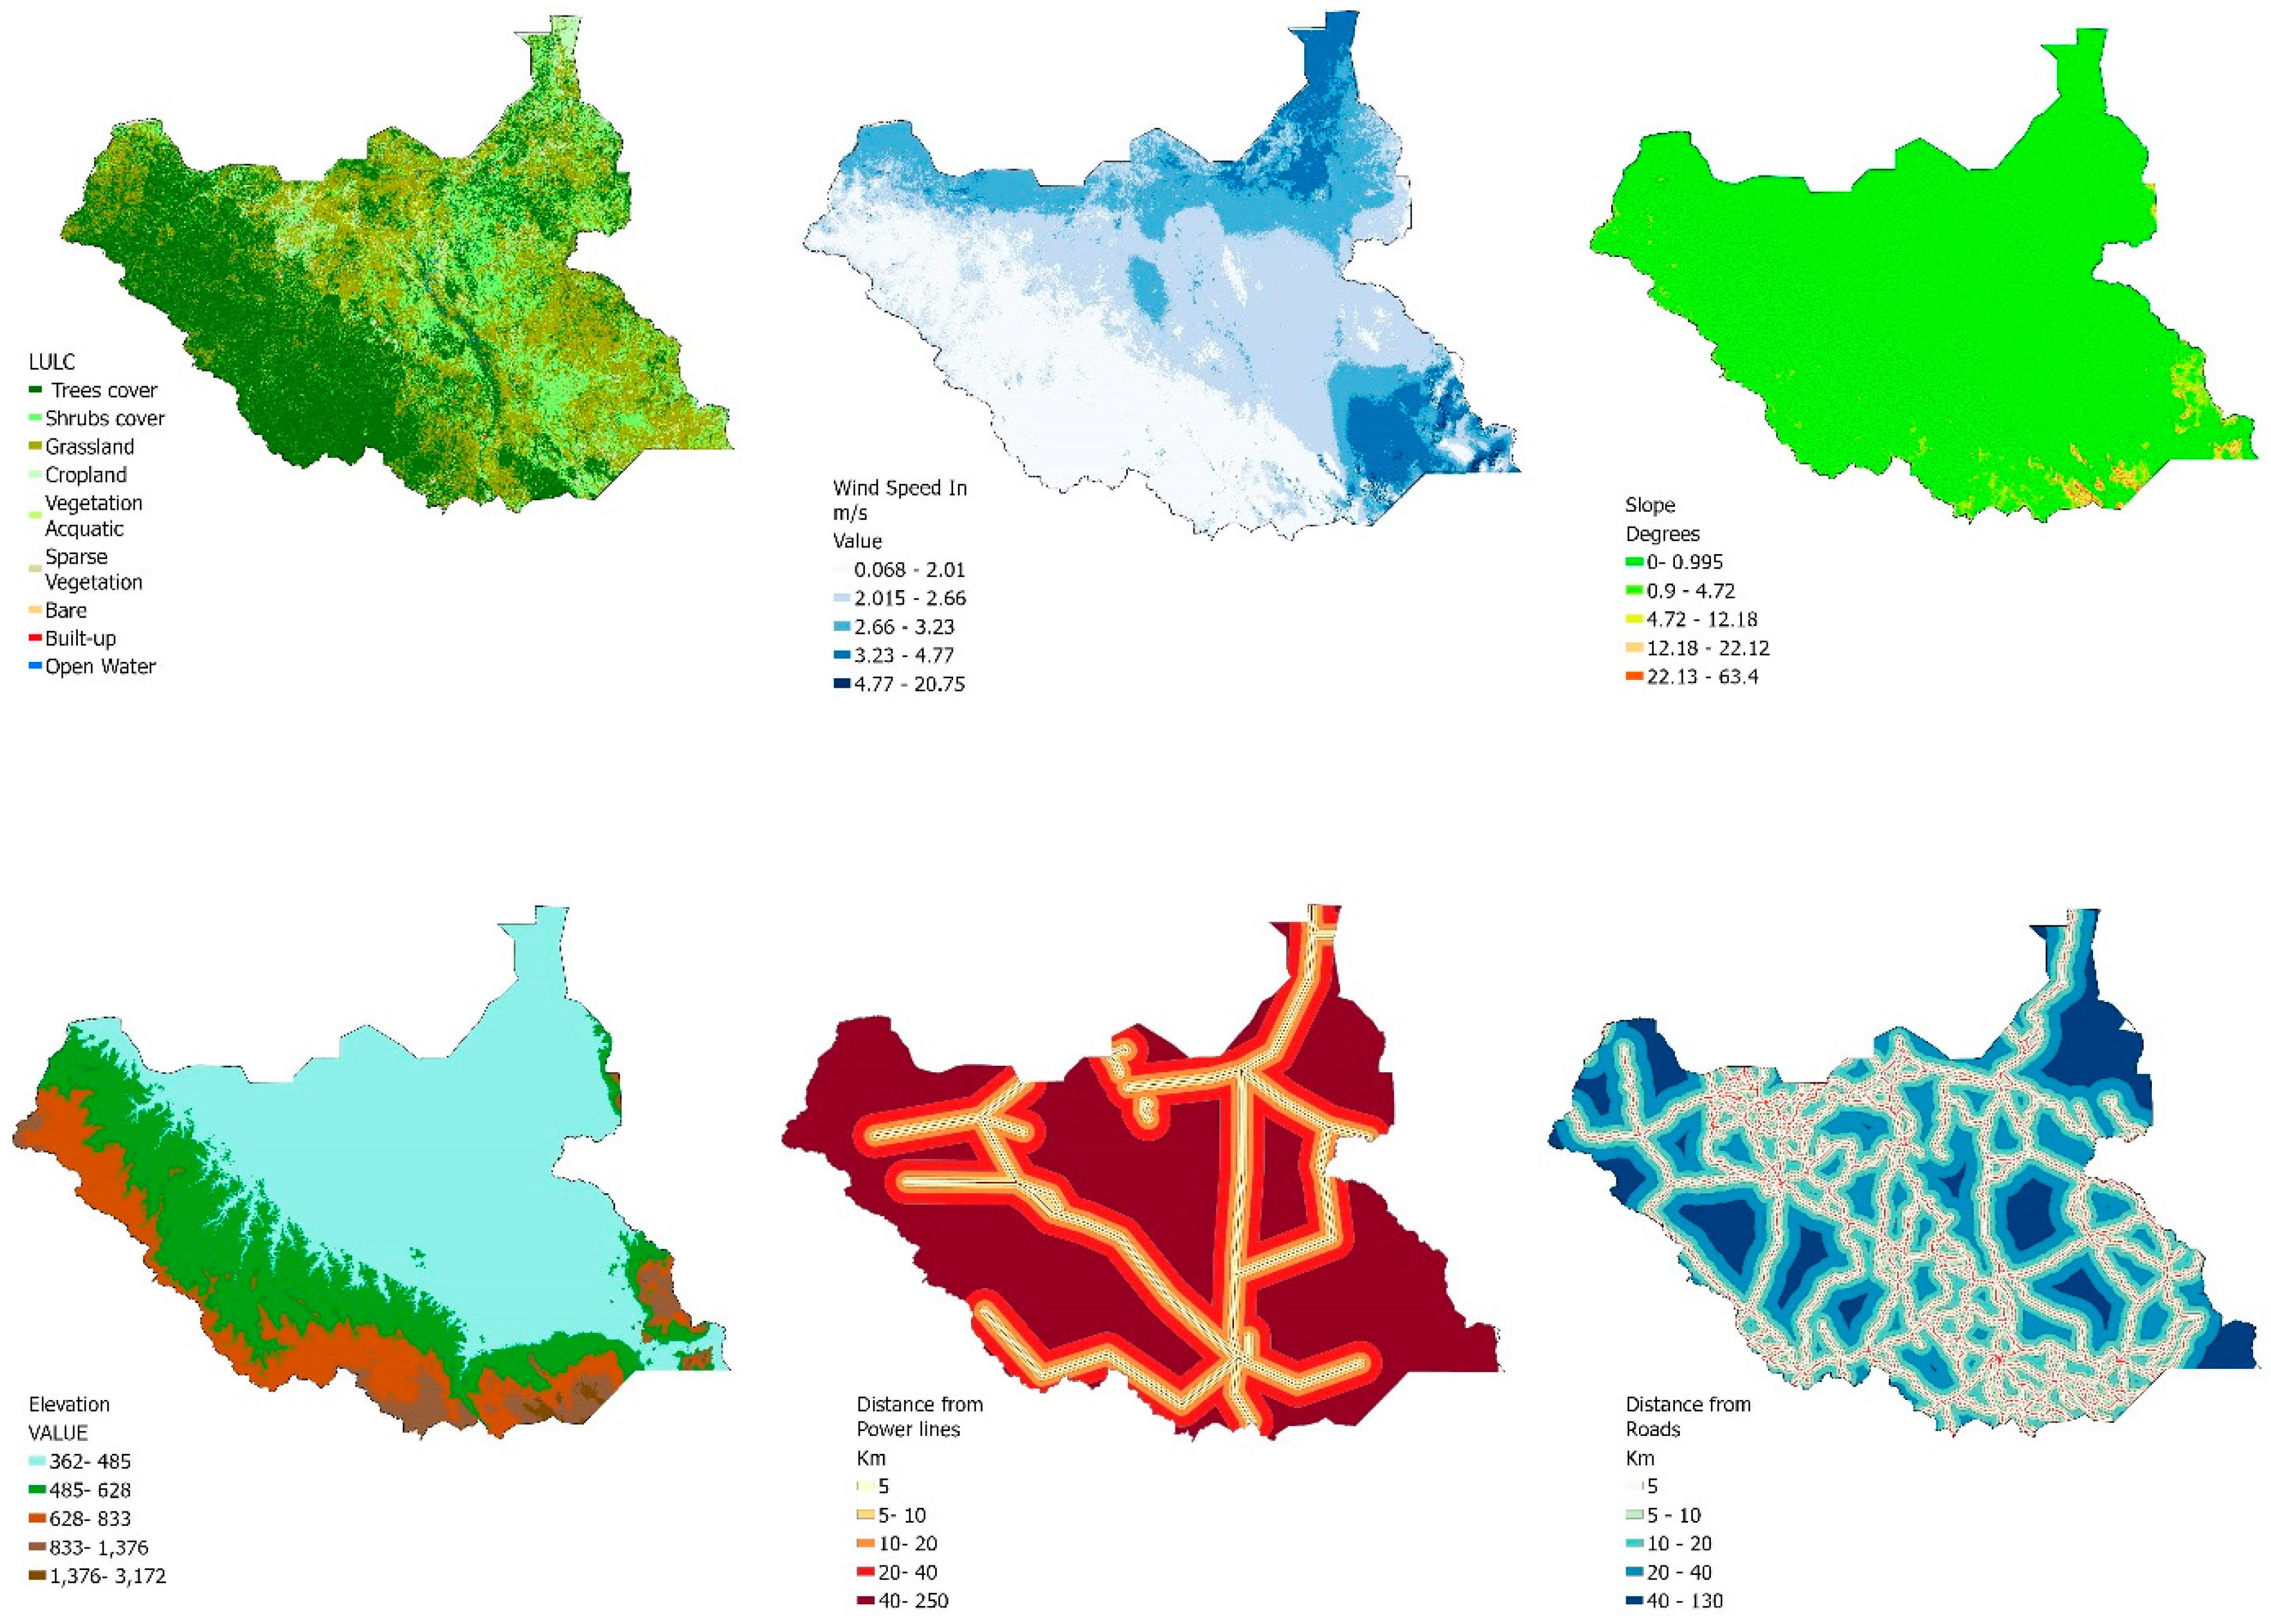
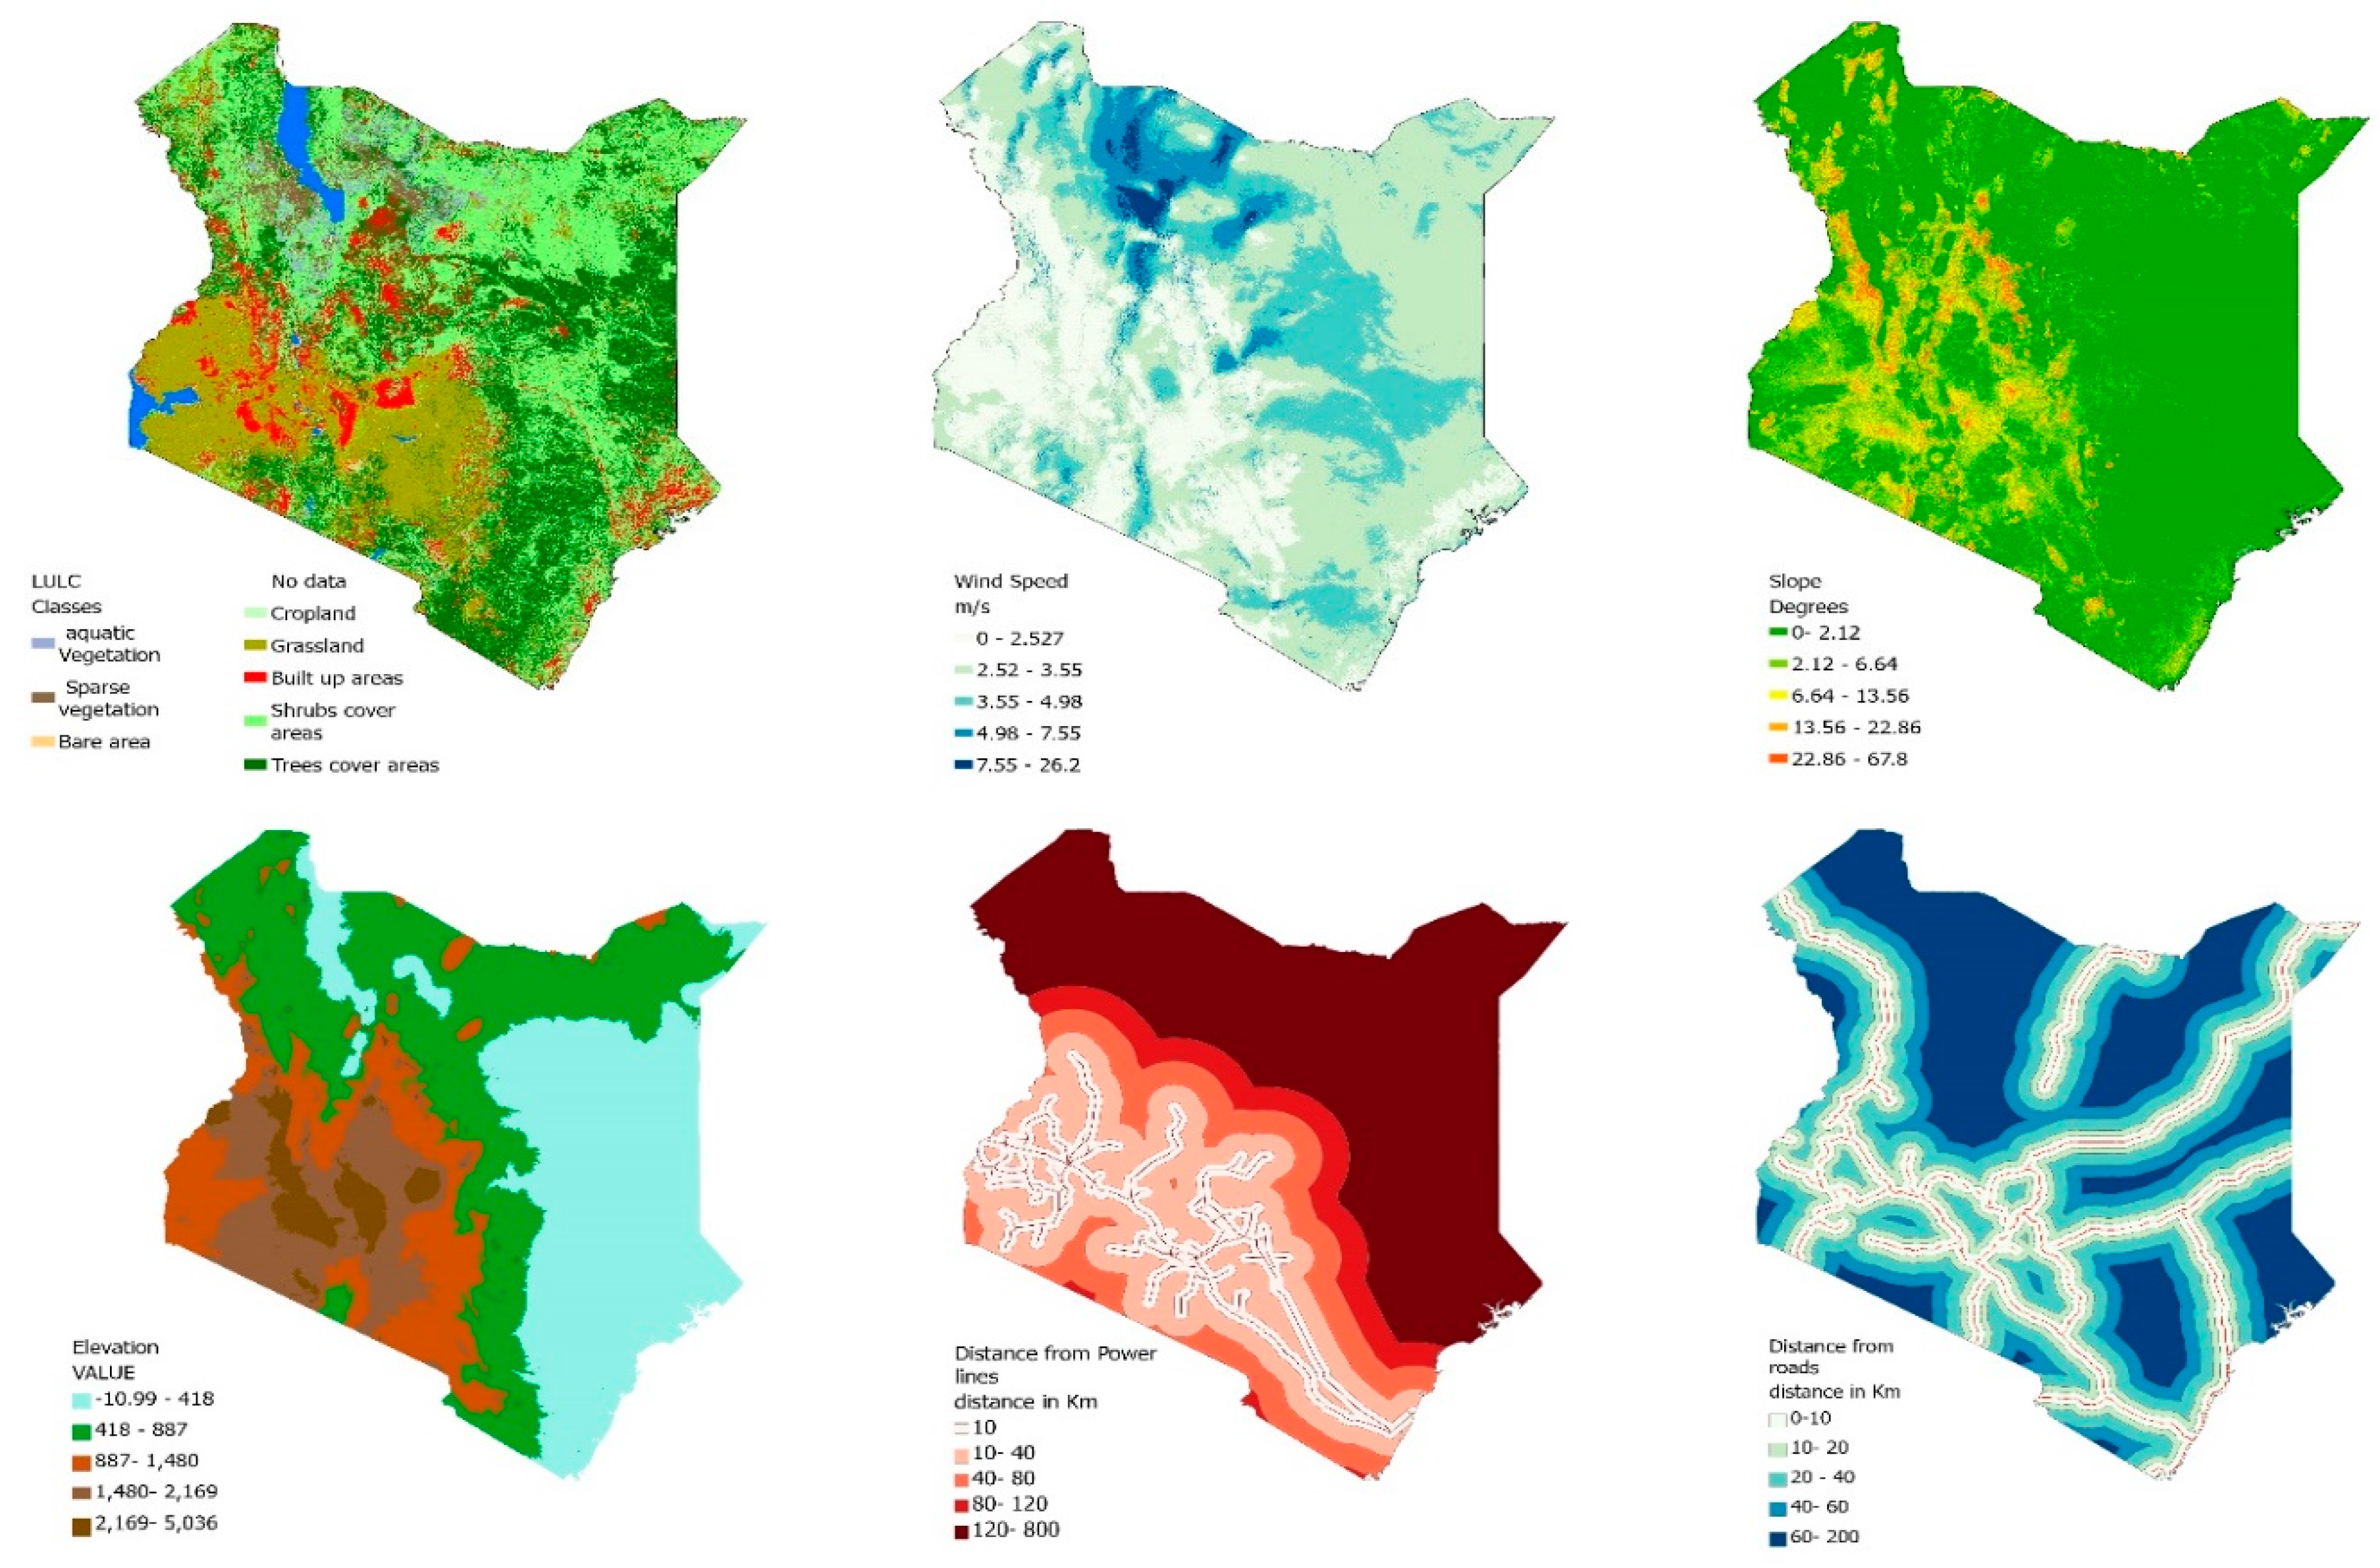
Wind speed, slope, elevation, land use land cover, distance from power lines, and distance from major roads are among the factors that underwent assessment with the help of GIS Software (ArcGIS Pro 3.1) to conduct a geographic study and choose each East African country’s optimal wind farm sites, as detailed in Table 5.

3.2. Constraint Defining and Mapping

In this research, lakes and other sensitive ecosystems such as wetlands have been meticulously defined and mapped for each East African country. Water bodies have been excluded from deployable areas, and others, such as wetlands and national parks, have been assigned a uniform and distinct value of 1, signifying their unsuitability for wind farm development. The mapping aims to identify and categorize regions where wind energy projects should be avoided due to the ecological importance and preservation of these specific areas. This constraint mapping ensures that wind farm site selection considers the critical need to protect and conserve environmentally sensitive regions. Table 6 provides details of the data sources used in this paper.

3.3. Data Preprocessing

In the data preprocessing phase, several crucial steps were taken to ensure data uniformity and compatibility. Initially, a careful data projection check was performed to confirm that all datasets shared the same geographic reference system. Subsequently, data resolution was standardized, where all datasets were reassembled to achieve a consistent resolution of 30 × 30 m. Additionally, a uniform projection of WCS WGS 1984 North or South was applied, aligning with the specific geographic zone of each East African country. These preprocessing steps guarantee that all datasets are harmonized by projection, resolution, and geographic reference, enabling accurate and seamless integration for the subsequent geospatial analysis.

3.4. Analytical Hierarchy Process (AHP) Method

The Analytic Hierarchy Process (AHP) has gained considerable recognition due to its precise mathematical foundation and widespread applicability across diverse fields [91,92]. Its capacity to address complex decision-making involving multiple criteria has made it a valuable tool for researchers from various disciplines [93]. A fundamental feature of the AHP is its ability to enable users to assign specific weights to criteria, facilitating the pursuit of optimal solutions [94]. The AHP method follows a hierarchical model, comprising goals, criteria, sub-criteria, and alternative solutions. Once the problem is structured, the hierarchy is established. Pairwise comparisons use a preference scale, and criteria from one level are contrasted with those from the next level [95]. This matrix requires n (n − 1)/2 comparisons when dealing with n criteria [96].
The assessment of the relative importance of each criterion to each other is shown in Table 7. This is usually performed by experts using a scale from 1 to 5, according to the fundamental scale for pairwise comparison [97].
The weights of the criteria are applicable to the problem-solving process in the AHP technique based on pairwise comparisons. The pairwise comparison matrix is first normalized before the weights are applied. In the Analytic Hierarchy Process (AHP), the components of the pairwise comparison matrix involves systematic comparisons between criteria using a preference scale. The matrix, denoted as A in Equation (1), is formed by expert judgments based on pairwise comparisons. The parameters a, b, c, x, and y represent the intensity of relevance between criteria.
A = | 1   a   b   c   x   y |
 | 1/a 1   d   e   z   w |
 | 1/b 1/d 1   f   u   v |
| 1/c 1/e 1/f 1   t   s |
  | 1/x 1/z 1/u 1/t 1   r |
  | 1/y 1/w 1/v 1/s 1/r 1 |
This normalization requires the creation of a “normalized pairwise comparison matrix” before computation. The elements of each matrix column are divided by the sum of the columns to generate this matrix. The entire value of the row elements in the final matrix must be divided by the total number of row elements.
a i j = a i j k = 1 n a k j
Further normalization is performed by dividing each element in each row by the sum of its row. However, the notation used in the formula is inconsistent, and it should be:
a i j = a i j j = 1 n a i j
priority or weight vector results. The weights have a sum of 1 for the entire matrix, ranging from 0 to 1, indicating the relative importance of criteria in the decision-making process.
ω i = j = 1 n a i j
  • The variables have the following meanings:
  • a: Represents the pairwise comparison matrix.
  • i: Denotes the row index in the matrix.
  • j: Denotes the column index in the matrix.
  • k: Represents the index used in summation within the normalization process.
  • n: Represents the number of criteria or alternatives being compared.
  • ω i : Denotes the weight vector, representing the relative importance of each criterion. Each ω i corresponds to the weight assigned to the ith criterion after normalization.
  • So, in the given context:
  • a i j : Represents the element in the ith row and j-th column of the pairwise comparison matrix a.
  • k = 1 n a k j : Denotes the sum of elements in the j-th column of the matrix a.
  • j = 1 n a i j : Denotes the sum of elements in the i-th row of the matrix a.

3.5. Pairwise Comparison Matrix

In the Analytic Hierarchy Process (AHP), it is crucial to assess and ensure the consistency of the pairwise comparisons made by decision-makers. Dr. Thomas Saaty, the developer of AHP, introduced a metric known as the Consistency Ratio (CR) to quantify the level of consistency within comparisons [97]. The CR determines whether the evaluations made through pairwise comparisons align well with each other. When the number of inconsistencies in the comparisons falls below a predetermined threshold (commonly set at CR = 0.1), the matrix is consistent. If the CR exceeds this threshold, the decision-makers’ judgments need to be evaluated differently. The formula to calculate the CR involves the Consistency Index (CI), the primary eigenvalue of the comparison matrix (m), and the Random Index (RI), which is set by the matrix size (n). In the calculation of the Consistency Ratio (CR) introduced by Thomas Saaty, Equation (1) is utilized. The Consistency Index (CI) formula is: λ ∗ mn / (n − 1), where λ is the primary eigenvalue of the comparison matrix, m is the matrix size, and n is the number of criteria. The Consistency Ratio (CR) is: CR = CI/RI, where RI is the random index.
Thomas Saaty’s recommendation of an upper limit of 0.10 for the Consistency Ratio (CR) serves as a crucial guideline in the Analytic Hierarchy Process (AHP) [97]. When the CR of the judgments is less than 0.10, it signifies that the judgments are reasonably consistent, and the evaluation process can proceed with confidence. However, if the CR exceeds 0.10, it implies that the judgments are inconsistent. In such cases, it is essential to enhance the quality of the decision-making process. The inconsistency in judgments is addressed by scrutinizing and revisiting the pairwise comparisons made by the decision-makers. This iterative process helps improve the overall quality and reliability of the decisions generated through AHP, aligning with the principle of maintaining consistency in the decision-making framework.

3.6. Criteria Standardization

The criteria in this study were standardized on a scale ranging from 1 to 5 to harmonize and put all in the same standard. A value of 1 was allocated to the least suitable range of values, while 5 was assigned the highest range. The suitability levels used in this research were categorized as follows: a rating of 1 indicated the lowest suitability, 2 denoted low suitability, 3 signified average suitability, 4 represented high suitability, and 5 indicated the highest level of suitability. The classification of suitability levels for criteria with continuous values was determined using the concept of natural breaks.

3.7. Weighted Overlay (Criteria Combination)

The assignment of weights (Xi) to these criteria is a critical step in the research. These weights are determined based on their relative importance in decision-making [98]. For instance, wind speed is assigned a higher weight because it is crucial for wind farm success. These weights reflect the significance of each criterion and are determined using the Analytic Hierarchy Process (AHP) methods as discussed above, ensuring a systematic and data-driven approach to assessing site suitability.
The six criteria (C0) are integrated into the research’s GIS platform as raster layers, and each criterion becomes a distinct thematic layer. These thematic layers contain geospatial data corresponding to the characteristic criteria. For instance, the wind speed layer includes data on wind speed values across the study area, while the land use layer categorizes land into different classes, such as cropland, tree cover, or urban areas.
The weighted overlay method, as outlined above, is then employed to combine these criteria and create a final suitability map. This method involves multiplying each criterion’s thematic layer by its respective normalized weight (Wj) for each class within the thematic layer. This multiplication generates weighted layers for each criterion. The values within these weighted layers represent the contribution of each class to the overall suitability. The culmination of this process is the making of a suitability map that reflects the overall suitability of each location for wind farm installation. The suitability index (SI) is calculated for every point on the map, integrating all criteria and their respective weights. This spatially explicit map serves as a valuable decision-making tool, allowing stakeholders to objectively assess and prioritize potential sites for wind energy projects.
The suitability index (SI) is calculated using Equation (2) [99]:
S I = i = 1 m j = 1 n X i · W i j
where:
SI is the suitability index for wind farm sites.
Xi is the normalized weight of the ith feature (criterion). Xi pertains to the overall importance assigned to each criterion in the analysis. It is a single weight representing the significance of the entire criterion, considering all its classes.
Wij is the normalized weight of the jth class of the thematic layer. Wj focuses on the importance of a specific class within a thematic layer. It provides a finer-grained perspective by considering the relative significance of different classes within a given criterion.
m represents the total number of themes (criteria).
n is the total number of classes in a theme (thematic layer).
For each criterion i (from 1 to m), and for each class within that criterion j (from 1 to n), the normalized weight of the i-th criterion (Xi) is multiplied by the normalized weight of the j-th class within that criterion (Wij). The product of each multiplication (Xi ⋅ Wij) is then summed across all criteria i = 1 m and all classes within each criterion j = 1 . n The final result (SI) represents the overall suitability index, indicating the combined contribution of all criteria and classes to assess the suitability of each location for wind farm installation.

4. Results and Discussion

4.1. Analytical Hierarchy Process (AHP) Method Results

The AHP-based Multiple Criteria Decision-Making (MCDM) process was employed to establish the optimal weights for eight influencing criteria (C1: wind speed, C2: slope, C3: elevation, C4: distance from power lines, C5: land use land cover, and C6: distance from roads), as shown in Table 8. The analysis revealed that C1, related to wind speed, held the highest priority weight (40%) in the selection of suitable areas for wind farm construction in the study area. The priority weights for the remaining criteria, C2 through C6, decreased in importance. Notably, the study’s results indicated a consistency ratio (CR) of 0.068, which falls below the threshold of 0.10, signifying a high degree of consistency in the decision-making process.

4.2. Criteria and Factors Affecting Wind Site Suitability

4.2.1. Case 1: Rwanda

The results (detailed in Figure 3 and Table 9) reveal varying suitability levels for wind farm development in Rwanda based on several criteria, including land use and land cover (LULC), wind speed, slope, distance from roads and power lines, and elevation, all presented in both square kilometers and percentages. The lowest suitability category, comprising 6.77% (approximately 1718.87 sq km) of the land area, predominantly represents regions with unfavorable conditions for wind farms. Notably, 60.04% (approximately 15,247.4 sq km) of Rwanda experiences low wind speeds, while 44.49% (around 11,298.80 sq km) showcases the highest suitability, primarily in elevated areas. The data further indicates that proximity to infrastructure, such as roads and power lines, varies across the country, with 15.73% (approximately 3990.23 sq km) of land having low distances from roads.

4.2.2. Case 2: Burundi

In terms of wind speed, Burundi exhibits a challenging landscape with approximately 55.310% of its total land area (about 13,974.590 sq km) experiencing low wind speeds, which could pose limitations for wind energy generation (details shown in Figure 4 and Table 10). When it comes to the slope criteria, over 36.000% of the country has relatively steep terrain, while around 26.500% (approximately 6703.720 sq km) features gentler slopes, potentially favoring wind farm development. The proximity to existing infrastructure, specifically roads and power lines, varies significantly, with 2.872% (around 726.389 sq km) of land having favorable road proximity but less than 1% (approximately 0.995% or 251.625 sq km) having optimal power line proximity. Moreover, elevation plays a pivotal role, as the highest suitability level, covering approximately 51.653% of the land (around 13,062.120 sq km), is concentrated in elevated areas, offering the potential for strong and consistent winds—making these regions attractive for wind farm development.

4.2.3. Case 3: Tanzania

As shown in Figure 5 and Table 11, Tanzania presents a landscape characterized by considerable diversity. Over half of the land (53.310% or approximately 510,861.00 sq km) experiences low wind speeds, indicating potential limitations for wind energy projects. However, the remaining regions offer a range of wind speed conditions, creating opportunities for targeted development in areas with more favorable wind resources.
When considering the slope criteria, around 43.900% of the land (approximately 420,602.83 sq km) falls within the average suitability level. This signifies that many areas exhibit moderate slopes, which can facilitate wind farm development. Moreover, it suggests that the terrain in Tanzania offers a blend of both challenging and promising conditions, emphasizing the importance of careful site selection.
Proximity to infrastructure is another critical factor. While substantial areas have favorable distances from roads, the limited coverage of low distances from power lines (only 7.800% or approximately 37.73 sq km) highlights the need for further investment in electrical infrastructure to harness the full potential of wind energy resources.
Elevation plays a pivotal role, with approximately 63.841% of the land (around 611,240.00 sq km) falling into the highest suitability category, primarily located in elevated regions. These areas benefit from consistent, strong winds, making them prime candidates for wind farm development. Leveraging these elevated zones can substantially contribute to the country’s renewable energy capacity.

4.2.4. Case 4: Uganda

Notably, the lowest suitability level, covering around 15.56% of Uganda’s total land area (approximately 37,559.030 sq km), predominantly represents regions with unfavorable conditions for wind farm development, often attributed to existing land use or land cover (details shown in Figure 6 and Table 12). Wind speed, a critical factor in wind energy generation, varies significantly, with approximately 58.97% of the land (about 142,361.900 sq km) experiencing low wind speeds, presenting a notable limitation for wind farm development. Conversely, areas with gentler slopes, representing around 13.95% of the land (approximately 33,745.600 sq km), have a more favorable suitability level for wind energy projects. While infrastructure support from roads is observed in approximately 5.92% of Uganda (around 14,295.242 sq km), the percentage of land with low distances from power lines is relatively low at 0.59% (around 1432.662 sq km), which may impact the cost-effectiveness of wind energy projects in these areas. Elevation, a crucial factor for wind energy generation, plays a significant role, with approximately 67.37% of the land (around 162,501.000 sq km) showing the highest suitability level in elevated areas, likely to have strong, consistent winds, making them ideal for wind farm development.

4.2.5. Case 5: South Sudan

The suitability for wind farm development in South Sudan, considering the criteria, presents an intricate landscape (Figure 7 and Table 13). When examining wind speed, it is evident that most of the country (around 53.83% or approximately 348,981.00 sq km) falls within the highest suitability category. These regions boast strong and consistent winds, making them prime candidates for wind energy projects. In contrast, approximately 6.59% of the land (about 42,712.00 sq km) experiences low wind speeds, suggesting that careful site selection is necessary in some areas.
The slope criterion reveals a varied topography, with a significant portion of the country (around 34.43% or approximately 223,091.09 sq km) showcasing a low suitability level, which is primarily characterized by gentle slopes. This provides favorable conditions for wind farm development, as they facilitate easier construction and maintenance of wind turbines.
Proximity to infrastructure is a noteworthy factor. While South Sudan has extensive land coverage with low distances from roads, the accessibility to power lines is limited, with only around 0.31% (approximately 2003.36 sq km) of the land having low distances. This underscores the potential need for investment in power infrastructure to fully harness wind energy resources.
Elevation, with approximately 58.24% of the land (around 377,922.10 sq km), falls into the highest suitability category, mainly in elevated regions. These areas offer ideal conditions for wind farm development due to their high elevation, which promotes consistent and strong winds.

4.2.6. Case 6: Kenya

Kenya’s wind energy potential varies significantly across its diverse landscape (Figure 8 and Table 14). Wind speed plays a critical role, with approximately 63.34% of the land (around 374,444.50 sq km) offering the highest suitability for wind farm development, indicating regions with robust and consistent winds, ideal for wind energy projects. Conversely, about 0.36% (approximately 2136.74 sq km) experiences low wind speeds, highlighting the need for more deliberate development efforts and precise site selection. Examining the slope criterion reveals a mixed topography; nearly half of Kenya’s land area (around 46.11% or approximately 277,561.36 sq km) boasts the highest suitability level, characterized by gentle slopes, which is advantageous for cost-effective wind farm construction.
Furthermore, around 3.75% (about 22,571.13 sq km) represents the lowest suitability due to steeper terrain, requiring careful planning. Infrastructure proximity is crucial; Kenya has an extensive road network covering extensive land, but power line accessibility is limited in the northern part of the country, with more than 7866.32 sq km of the land having low distances. This underscores the necessity of investing in electrical infrastructure to fully unlock the wind energy potential in all the country’s parts. Elevation, a vital factor in wind energy generation, plays a significant role, with approximately 34.20% (around 205,799.90 sq km) of the land falling into the highest suitability category.

4.3. Suitability Level Maps

The suitability level maps for every studied country in this paper are represented in Figure 9 and Table 15. Figure 10 represents the suitability map for the global region covered in this paper.

4.3.1. Burundi

Burundi exhibits a relatively balanced distribution across suitability levels, with Moderate Suitability being the most dominant, covering 41.19% (approximately 10,316.02 sq km) of the land. This is followed by Marginal Suitable (20.56%), Suitable (26.57%), Highly Suitable (6.80%), and Unsuitable (4.87%). As indicated on the map, the eastern part of the country prominently features highly suitable areas, offering prime conditions for wind energy projects. Additionally, the northern region showcases a significant number of highly suitable areas alongside a considerable proportion of suitable areas, collectively providing an excellent foundation for wind farm development. The rest of the country predominantly falls within the moderate suitability category, suggesting that strategic planning and site selection are vital to optimize wind energy potential. However, the western part of Burundi represents unsuitable areas, which may pose challenges for wind farm development, unless approached with meticulous planning and significant government investment.

4.3.2. Rwanda

In Rwanda, the distribution of wind farm suitability levels closely mirrors that of Burundi, emphasizing the similarity in wind energy potential between these neighboring countries. Moderate Suitability takes up the largest share at 41.19% (approximately 10,316.02 sq km), followed by Marginally Suitable (20.56%), Suitable (26.57%), Highly Suitable (6.80%), and Unsuitable (4.87%).
Rwanda’s eastern province stands out as a region with substantial opportunities for wind farm development. This area features highly suitable locations, benefiting from optimal wind speed and low slopes, making it particularly favorable for wind energy projects. Additionally, in the western part of the country, especially along the Congo Nile crest and in the Rusizi district, there are significant wind energy prospects, although some regions may present challenges due to moderate wind speed, high elevation, and slope.
In the northern province, the wind energy potential is lower, primarily due to moderate wind speed and challenging topography. However, it is worth noting that there are smaller areas with a high suitability level, indicating that careful consideration of site selection can unlock wind farm development opportunities.

4.3.3. South Sudan

South Sudan’s suitability for wind farm development presents a unique pattern compared to other countries. Moderate Suitability covers a significant portion of the land at 28.04% (approximately 178,983.70 sq km), indicating the presence of regions with favorable wind energy potential. However, both Marginal Suitable and Unsuitable categories also encompass substantial areas, suggesting the need for more in-depth assessments and meticulous planning to effectively harness the wind energy potential across the country.
The topography of South Sudan is favorable in determining suitability levels. The only highly suitable areas are predominantly concentrated in the northeastern part of the country, with a smaller region in the southeast. These areas benefit from the combination of optimal wind speed and low slope, making them attractive for wind farm development. In contrast, substantial portions of the southern and western parts of the country fall within the Unsuitable category, which may pose significant challenges for wind energy projects. The central regions represent a mix of moderate and marginal suitability, indicating the potential for wind development with careful site selection and planning.
In fact, areas with low suitability levels may require more extensive analysis or consideration for alternative energy sources, as they may not be suitable for wind energy development.

4.3.4. Uganda

Uganda’s suitability levels for wind farm development demonstrate a distribution that leans towards Moderate Suitability, covering a substantial portion at 45.27% (approximately 108,581.08 sq km). In addition to this, there are areas falling within the Marginally Suitable, Suitable, and Unsuitable categories, with a smaller proportion of Highly Suitable terrain. This diverse distribution highlights the need for well-planned wind energy projects to optimize resource utilization effectively.
As clearly visible on the map, Uganda’s wind energy potential is primarily concentrated in the far eastern parts of the country, where highly suitable areas offer promising conditions for wind farm development, marked by optimal wind speed and slope. The majority of the nation, however, falls within moderately suitable category, presenting a substantial opportunity for wind energy development when accompanied by careful planning and site selection.
The regional distribution underscores Uganda’s potential in the wind energy sector, particularly in the moderately suitable areas, and emphasizes the importance of strategic decision-making to fully harness the country’s renewable energy resources. With meticulous planning, Uganda can capitalize on its wind energy potential to contribute to energy sustainability and economic growth.

4.3.5. Tanzania

Tanzania’s suitability distribution for wind farm development showcases a significant proportion of Moderate Suitability, covering approximately 34.08% (about 324,220.05 sq km) of the land. The Marginally Suitable category also encompasses a substantial area, while Suitable, Highly Suitable, and Unsuitable levels present diverse opportunities for wind energy projects. This varied landscape underscores the potential for strategic site selection to maximize the utilization of Tanzania’s wind resources effectively.
As revealed on the map, Tanzania boasts a wealth of wind resources, primarily concentrated in the central part of the country, featuring highly suitable areas with optimal wind speed and slope conditions. Additionally, Tanzania presents considerable opportunities for wind development in other regions, particularly in the southeast and along the Atlantic Ocean. While the western and southern parts of the country may initially appear unsuitable for wind energy, careful consideration can identify pockets of highly suitable areas, highlighting the importance of detailed site assessments.
This regional assessment underscores Tanzania’s extensive wind energy potential and the significance of meticulous planning and strategic decision-making to harness these resources efficiently. With the right approach, Tanzania can leverage its wind energy capacity to promote sustainability and economic development.

4.3.6. Kenya

Kenya’s suitability levels for wind farm development notably feature mostly Moderate Suitability, covering approximately 39.44% (around 236,621.84 sq km) of the country’s land. This significant portion emphasizes the substantial potential for wind farm development. The Marginally Suitable and Suitable categories also offer considerable opportunities for harnessing wind energy resources, while the Unsuitable and Highly Suitable levels represent smaller proportions. Kenya’s diverse suitability levels underline its remarkable wind energy potential and the paramount importance of strategic planning for sustainable development.
Kenya indeed stands out among the countries in the study, offering extensive areas for wind farm development. Particularly remarkable is the large highly suitable area in the northern part of the country, notably around Lake Turkana, which presents exceptional conditions for wind energy projects. The entire eastern region of Kenya is characterized by very suitable areas for wind energy development, encompassing significant portions falling within the Moderate, Suitable, and Highly Suitable categories. Furthermore, some areas in the far south, along the border with Tanzania, also offer favorable conditions. The only region that predominantly showcases unsuitable areas is the western part, although this is not significant in comparison to the extensive wind resource-rich areas found elsewhere in the country.

5. Conclusions

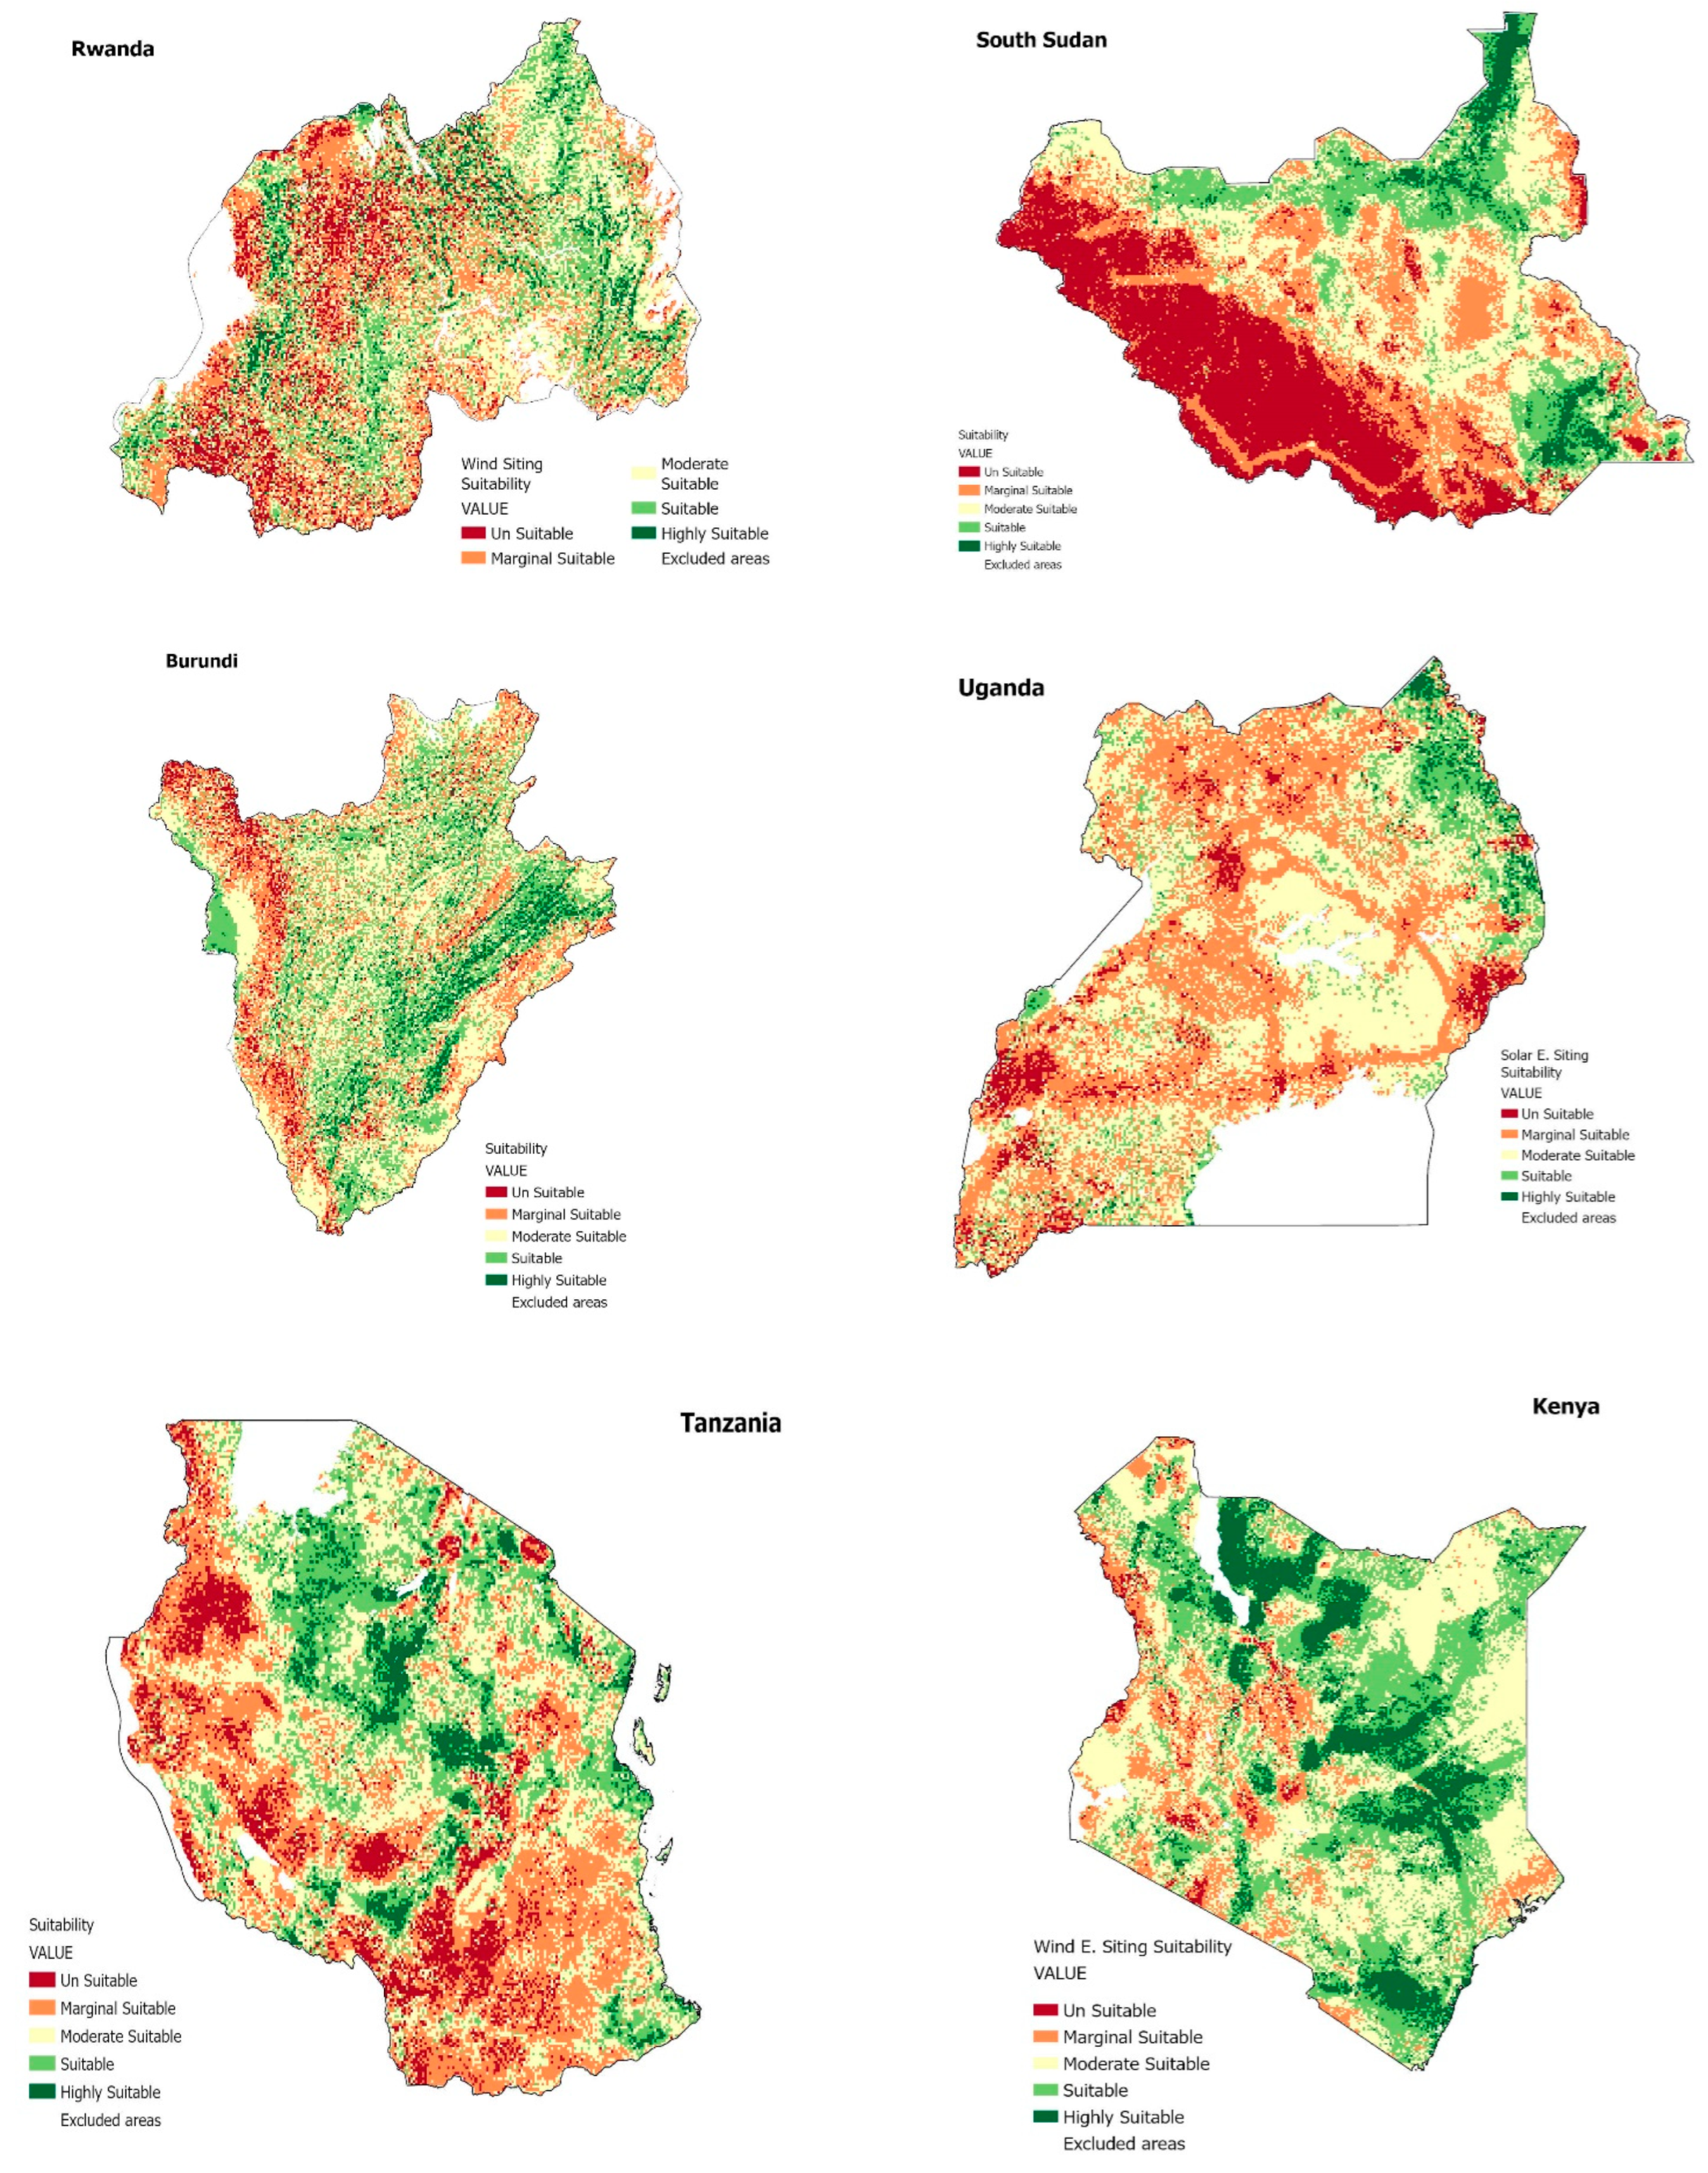
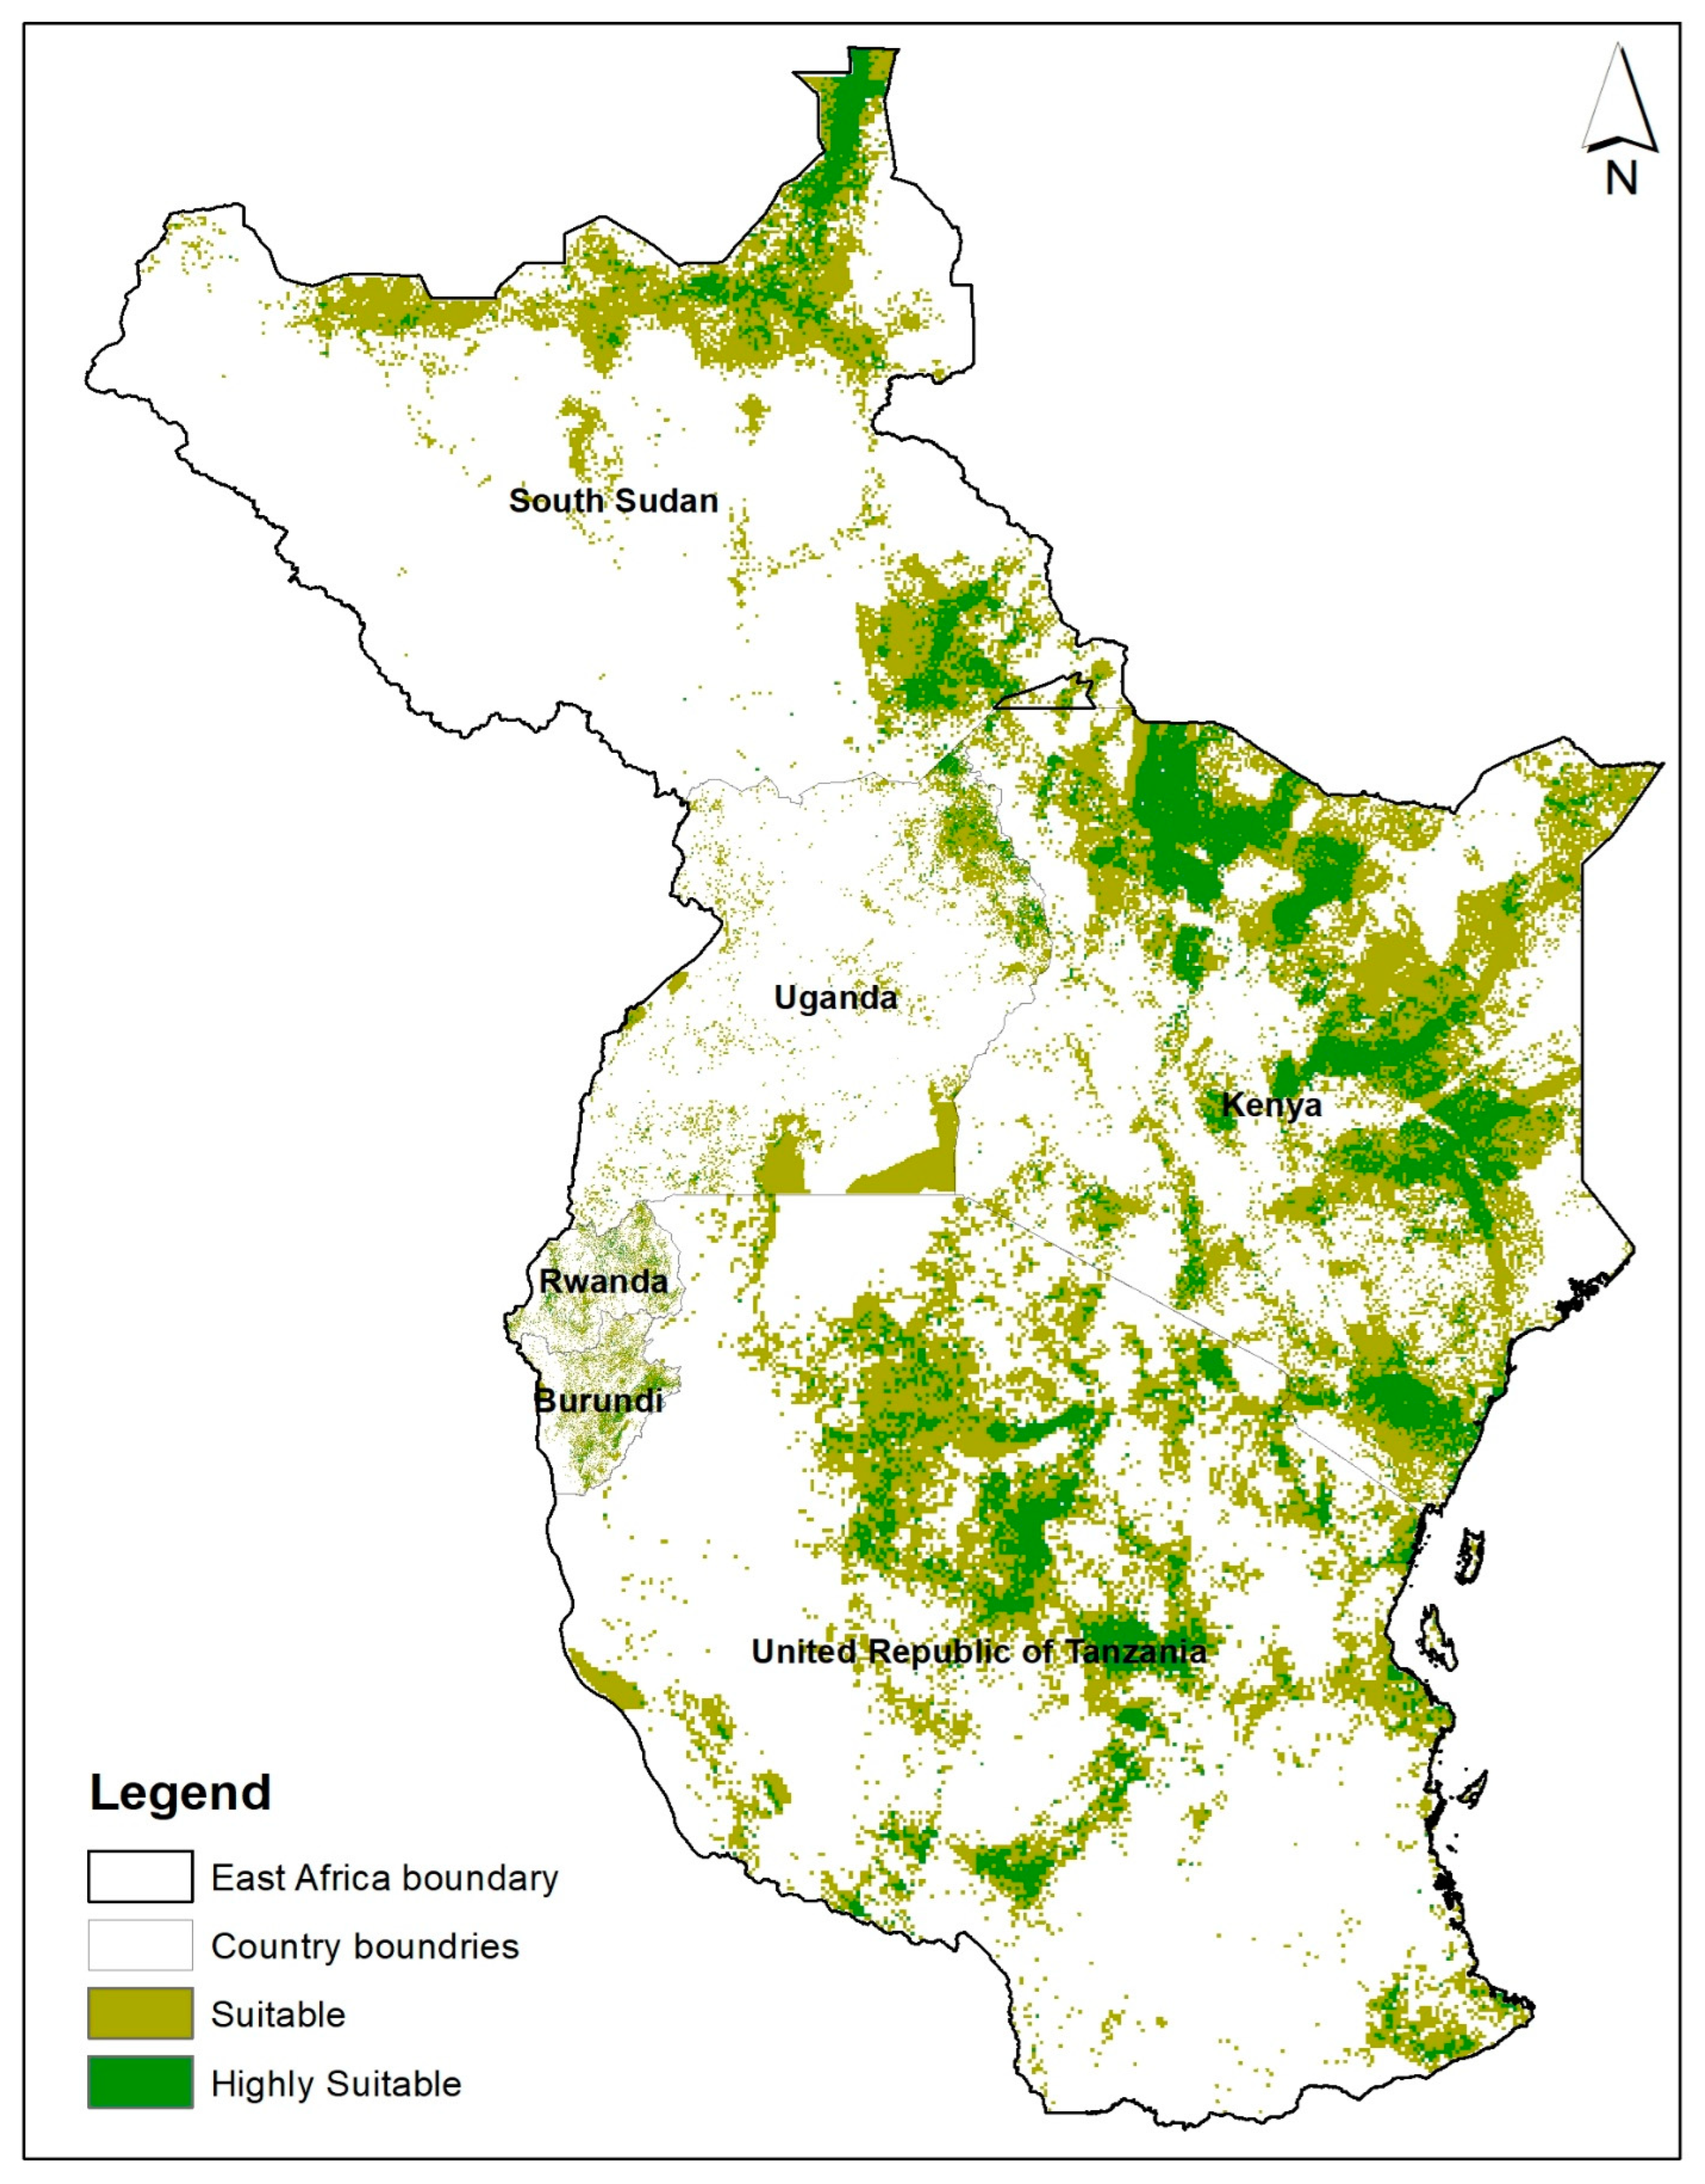
The assessment of wind farm suitability across the East African countries of Burundi, Rwanda, South Sudan, Uganda, Tanzania, and Kenya reveals a diverse landscape of wind energy potential. The results reveal that Kenya has huge parts of its areas highly suitable for wind energy siting, with 15.26% and 1.55% of its land classified as highly suitable and unsuitable, respectively. The rate of suitability and unsuitability were 26.57% and 4.87% for Burundi; 20.6% and 10.21% for Rwanda; 20.39% and 10.44% for Tanzania; and 4.65% and 27.15% for South Sudan. The findings also show that, on average, East Africa exhibits a moderate level of wind suitability, with an estimated average of around 37.27% of its land area moderately suitable for wind energy technology installation, covering thousands of square kilometers. The findings in this paper can serve as a helpful tool for both academia and industry-related personnel engaged in renewable energy-related activities for the East African Countries. The outputs of this research will familiarize the audience with the features and attributes that can be used to locate a new site for the development of high-efficiency wind farm projects in East Africa.
While each nation exhibits its unique pattern, certain common themes emerge. Moderate Suitability dominates the suitability levels in most of these countries, signifying significant potential for wind farm development. Marginal Suitable, Suitable, and Highly Suitable categories offer further opportunities, albeit with variations in their proportions. Unsuitable areas are present but tend to be less extensive, with the exception of South Sudan, which displays a more challenging landscape for wind energy.
In Burundi and Rwanda, the distribution of suitability levels aligns closely, emphasizing comparable wind energy potential in these neighboring countries. The eastern and northern regions of these nations exhibit highly suitable and suitable areas, forming strong foundations for wind farm development. The rest of the countries predominantly fall into the moderate suitability category, underlining the importance of strategic planning and precise site selection.
South Sudan, on the other hand, stands out with a distinct pattern. Moderate Suitability encompasses a significant portion of the land, primarily in the northeastern and southeastern parts, showcasing the unique influence of topography on suitability levels. The western and southern regions pose challenges for wind energy development, underscoring the need for meticulous planning and government investment.
Uganda’s landscape offers substantial opportunities, with highly suitable areas concentrated in the far eastern regions. Most of the nation falls within the moderate suitability category, highlighting the potential for wind farm development with careful planning. Tanzania boasts a rich wind energy resource, primarily concentrated in the central part of the country. The distribution spans highly suitable areas in the central and southeastern regions, as well as pockets of high suitability in the western and southern parts, emphasizing the importance of detailed site assessments. Kenya emerges as a standout in the region, with an extensive area of highly suitable land in the northern part, especially around Lake Turkana. The eastern region also offers vast opportunities for wind energy development. Although the western part showcases some unsuitable areas, the overall landscape is rich in wind potential.
The observed differences in the suitability of the area along the border line between Uganda, Kenya, and Tanzania, as depicted in Figure 10, can be attributed to key factors, specifically wind speed variations and power line limitations. These factors play a significant role in determining the suitability of a location for wind energy projects.
Firstly, the variation in wind speed is a crucial aspect, given its substantial weight of approximately 38% in the criteria weighting. In Kenya, the northern part exhibits higher wind speeds, ranging from 7.55 to 26.2 m per second (m/s). Similarly, Tanzania experiences elevated wind speeds, ranging from 5 to 22.7 m/s in the central East and south. In contrast, Uganda predominantly features high wind speeds in the East, ranging from 4 to 13 m/s. This disparity in wind speed distribution contributes to the differences in the identified suitable areas along the border line.
Secondly, the availability and distribution of power lines also play a role in shaping the suitability map. In Kenya, the limited coverage of power lines in the Northwest reduces the chances of identifying highly suitable areas in that region. This limitation contrasts with Uganda, where the presence of power lines in other areas influences the identification of suitable locations.
Therefore, the combination of these factors results in the observed pattern, where Uganda has a highly suitable area along its Northeastern border with Kenya and Tanzania, while Kenya and Tanzania exhibit suitability in other areas.
In East Africa, the potential for wind farm development is evident, with variations in suitability levels across the different countries. The similarities and differences in the distribution of suitability underscore the importance of tailored planning and site selection to harness this renewable energy source effectively. With strategic decision-making, these nations can unlock their wind energy potential, contributing to sustainable energy production and economic growth in the region.

Author Contributions

Conceptualization, S.B., G.N.O.A., J.P.I., M.N.T., F.M., Y.M. and M.A.; Methodology, G.N.O.A., J.P.I., M.N.T., Y.M. and M.A.; Software, S.B., G.N.O.A., J.P.I., M.N.T., F.M., Y.M. and M.A.; Validation, S.B., G.N.O.A., J.P.I., M.N.T., F.M., Y.M. and M.A.; Formal analysis, S.B., G.N.O.A., J.P.I., M.N.T., F.M., Y.M. and M.A.; Investigation, S.B., G.N.O.A., J.P.I., M.N.T., F.M., Y.M. and M.A.; Resources, S.B., G.N.O.A., J.P.I., M.N.T., F.M., Y.M. and M.A.; Data curation, S.B., G.N.O.A., J.P.I., M.N.T., F.M., Y.M. and M.A.; Writing—original draft, S.B., G.N.O.A., J.P.I., M.N.T., F.M., Y.M. and M.A.; Writing—review & editing, S.B., C.W., G.N.O.A., J.P.I., M.N.T., F.M., Y.M. and M.A.; Visualization, C.W.; Supervision, C.W.; Project administration, C.W.; Funding acquisition, C.W. All authors have read and agreed to the published version of the manuscript.

Funding

The authors gratefully acknowledge the financial support provided by the Fujian Provincial Department of Housing and Urban Rural Development (Grant Number: 2023-K-31, 2023-K-63, 2023-K-73), the Fujian Provincial Department of Science and Technology (Grant Number: 2021I0014) and the Xiamen Municipal Construction Bureau (Grant Number: XJK2022-1-7).

Institutional Review Board Statement

Not applicable.

Informed Consent Statement

Not applicable.

Data Availability Statement

Dataset available on request from the authors.

Conflicts of Interest

Samuel Bimenyimana and Martine Abiyese were employed by the company Hello Renewables Ltd. The remaining authors declare that the research was conducted in the absence of any commercial or financial relationships that could be construed as a potential conflict of interest.

References

  1. Bmt Cordah Ltd and Viking Energy Partnership. Viking Wind Farm Environmental Statement, SiteSelection. Available online: https://www.vikingenergy.co.uk/assets/files/addendum2010/written-statement/Chapter-A3-Site-Selection.pdf (accessed on 24 December 2023).
  2. United Nations Sustainable Renewable Energy Key to Unlocking Developing Countries’ Potential, Achieving Global Goals, Speakers Tell High-Level Political Forum. Available online: https://press.un.org/en/2023/ecosoc7136.doc.htm (accessed on 24 December 2023).
  3. Wen, Z.; Shang, Y.; Lyu, L.; Tao, H.; Liu, G.; Fang, C.; Li, S.; Song, K. Re-estimating China’s lake CO2 flux considering spatiotemporal variability. Environ. Sci. Ecotechnology 2024, 19, 100337. [Google Scholar] [CrossRef] [PubMed]
  4. Lu, S.; Zhu, G.; Meng, G.; Lin, X.; Liu, Y.; Qiu, D.; Xu, Y.; Wang, Q.; Chen, L.; Li, R.; et al. Influence of atmospheric circulation on the stable isotope of precipitation in the monsoon margin region. Atmos. Res. 2024, 298, 107131. [Google Scholar] [CrossRef]
  5. Guan, H.; Huang, J.; Li, L.; Li, X.; Miao, S.; Su, W.; Ma, Y.; Niu, Q.; Huang, H. Improved Gaussian mixture model to map the flooded crops of VV and VH polarization data. Remote Sens. Environ. 2023, 295, 113714. [Google Scholar] [CrossRef]
  6. Wei, W.; Gong, J.; Deng, J.; Xu, W. Effects of Air Vent Size and Location Design on Air Supply Efficiency in Flood Discharge Tunnel Operations. J. Hydraul. Eng. 2023, 149, 4023050. [Google Scholar] [CrossRef]
  7. Wei, W.; Xu, W.; Deng, J.; Guo, Y. Self-aeration development and fully cross-sectional air diffusion in high-speed open channel flows. J. Hydraul. Res. 2022, 60, 445–459. [Google Scholar] [CrossRef]
  8. Li, J.; Wang, Z.; Wu, X.; Xu, C.-Y.; Guo, S.; Chen, X. Toward Monitoring Short-Term Droughts Using a Novel Daily Scale, Standardized Antecedent Precipitation Evapotranspiration Index. J. Hydrometeorol. 2020, 21, 891–908. [Google Scholar] [CrossRef]
  9. He, M.; Dong, J.; Jin, Z.; Liu, C.; Xiao, J.; Zhang, F.; Sun, H.; Zhao, Z.-Q.; Gou, L.-F.; Liu, W.-G.; et al. Pedogenic processes in loess-paleosol sediments: Clues from Li isotopes of leachate in Luochuan loess. Geochim. Cosmochim. Acta 2021, 299, 151–162. [Google Scholar] [CrossRef]
  10. Wang, X.; Wang, T.; Xu, J.; Shen, Z.; Yang, Y.; Chen, A.; Wang, S.; Liang, E.; Piao, S. Enhanced habitat loss of the Himalayan endemic flora driven by warming-forced upslope tree expansion. Nat. Ecol. Evol. 2022, 6, 890–899. [Google Scholar] [CrossRef]
  11. Zhang, S.; Bai, X.; Zhao, C.; Tan, Q.; Luo, G.; Wang, J.; Li, Q.; Wu, L.; Chen, F.; Li, C.; et al. Global CO2 Consumption by Silicate Rock Chemical Weathering: Its Past and Future. Earth’s Future 2021, 9, e1938E–e2020E. [Google Scholar] [CrossRef]
  12. Yin, L.; Wang, L.; Li, J.; Lu, S.; Tian, J.; Yin, Z.; Liu, S.; Zheng, W. YOLOV4_CSPBi: Enhanced Land Target Detection Model. Land 2023, 12, 1813. [Google Scholar] [CrossRef]
  13. Yang, H.; Zhang, X.; Li, Z.; Cui, J. Region-Level Traffic Prediction Based on Temporal Multi-Spatial Dependence Graph Convolutional Network from GPS Data. Remote Sens. 2022, 14, 303. [Google Scholar] [CrossRef]
  14. Lin, X.; Zhu, G.; Qiu, D.; Ye, L.; Liu, Y.; Chen, L.; Liu, J.; Lu, S.; Wang, L.; Zhao, K.; et al. Stable precipitation isotope records of cold wave events in Eurasia. Atmos. Res. 2023, 296, 107070. [Google Scholar] [CrossRef]
  15. Wu, X.; Feng, X.; Wang, Z.; Chen, Y.; Deng, Z. Multi-source precipitation products assessment on drought monitoring across global major river basins. Atmos. Res. 2023, 295, 106982. [Google Scholar] [CrossRef]
  16. Chen, W.; Liu, W.; Liang, H.; Jiang, M.; Dai, Z. Response of storm surge and M2 tide to typhoon speeds along coastal Zhejiang Province. Ocean Eng. 2023, 270, 113646. [Google Scholar] [CrossRef]
  17. Zhou, G.; Liu, W.; Zhu, Q.; Lu, Y.; Liu, Y. ECA-MobileNetV3(Large)+SegNet Model for Binary Sugarcane Classification of Remotely Sensed Images. IEEE Trans. Geosci. Remote Sens. 2022, 60, 4414915. [Google Scholar] [CrossRef]
  18. Zhou, G.; Liu, X. Orthorectification Model for Extra-Length Linear Array Imagery. IEEE Trans. Geosci. Remote Sens. 2022, 60, 4709710. [Google Scholar] [CrossRef]
  19. Zhou, G.; Wang, Z.; Li, Q. Spatial Negative Co-Location Pattern Directional Mining Algorithm with Join-Based Prevalence. Remote Sens. 2022, 14, 2103. [Google Scholar] [CrossRef]
  20. Du, W.; Wang, G. Fully probabilistic seismic displacement analysis of spatially distributed slopes using spatially correlated vector intensity measures. Earthq. Eng. Struct. Dyn. 2014, 43, 661–679. [Google Scholar] [CrossRef]
  21. Dong, W.; Zhao, J.; Qu, J.; Xiao, S.; Li, N.; Hou, S.; Li, Y. Abundance Matrix Correlation Analysis Network Based on Hierarchical Multihead Self-Cross-Hybrid Attention for Hyperspectral Change Detection. IEEE Trans. Geosci. Remote Sens. 2023, 61, 5501513. [Google Scholar] [CrossRef]
  22. Qiu, S.; Yang, H.; Zhang, S.; Huang, S.; Zhao, S.; Xu, X.; He, P.; Zhou, W.; Zhao, Y.; Yan, N.; et al. Carbon storage in an arable soil combining field measurements, aggregate turnover modeling and climate scenarios. CATENA 2023, 220, 106708. [Google Scholar] [CrossRef]
  23. Bulbulia, T. Wind Power Capacity Worldwide Reaches 650.8 GW; Coronavirus Impact Expected. 2020. Available online: https://www.engineeringnews.co.za/print-version/wind-power-capacity-worldwide-reaches-6508-gw-coronavirus-impact-expected-2020-04-17 (accessed on 24 December 2023).
  24. Evans, A.; Strezov, V.; Evans, T.J. Assessment of sustainability indicators for renewable energy technologies. Renew. Sustain. Energy Rev. 2009, 13, 1082–1088. [Google Scholar] [CrossRef]
  25. Installing and Maintaining a Small Wind Electric System. Available online: Energy.gov (accessed on 22 May 2023).
  26. Righter, R.W. Heron’s Inventions includes Holy Water Dispenser and the Aeolipile. In Windfall: Wind Energy in America Today; University of Oklahoma Press: Oklahoma, Norman, 2011; ISBN 978-0-8061-4192-3. Available online: explorable.com (accessed on 19 May 2023).
  27. Sun, W.; Liang, Y.; Ye, M. Research on Wind Turbine Generator Selection and Comprehensive Evaluation Based on BPNN Optimized by PSO. WSEAS Trans. Syst. 2017, 16, 204–217. [Google Scholar]
  28. Basack, S.; Dutta, S.; Saha, D.; Das, G. Power generation by offshore wind turbines: An overview on recent research and developments. WSEAS Trans. Power Syst 2021, 16, 254–261. [Google Scholar] [CrossRef]
  29. El Karaoui, I.; Maaroufi, M.; Bossoufi, B. Power Control Strategies in Wind Turbines using DFIG-Generator: Field Oriented Control FOC and Sliding Mode Control. WSEAS Trans. Syst. 2019, 18, 1–11. [Google Scholar]
  30. Taoussi, M.; Karim, M.; Bossoufi, B.; Hammoumi, D.; El Bakkali, C.; Derouich, A.; El Ouanjli, N. Low-speed sensorless control for wind turbine system. WSEAS Trans. Syst. Control. 2017, 12, 405–417. [Google Scholar]
  31. Laabidine, N.Z.; Errarhout, A.; El Bakkali, C.; Mohammed, K.; Bossoufi, B. Robust Power Control for Wind Power Generation system based on PMSG. WSEAS Trans. Comput. 2020, 19, 129–136. [Google Scholar] [CrossRef]
  32. Yauri Rodríguez, R.; López López, G.L.; Damazo Antunez, J.S. Resonance Control System of a Vortex Wind Turbine for Energy Generation through Structural Redesign. 2023. Available online: https://wseas.com/journals/author_page.php?Author=Gardy+Lopez (accessed on 24 December 2023).
  33. Islam, F.M.; Mamun, K.; Prakash, K.; Lallu, A.; Rattan, A.A. Impact of wind generators in power system stability. WSEAS Trans. Power Syst. 2018, 13, 235–248. [Google Scholar]
  34. Kanellos, F.D.; Tsekouras, G.J.; Mastorakis, N.E. Wind parks equivalent models using system identification techniques based on nonlinear model structures. WSEAS Trans. Circuits Syst. 2009, 8, 745–755. [Google Scholar]
  35. Yang, W.; Chai, Y.; Zheng, J.; Liu, J. Intelligent diagnosis technology of wind turbine drive system based on neural network. WSEAS Trans. Circuits Syst. 2021, 6, 289–296. [Google Scholar] [CrossRef]
  36. Pletea, I.V.; Pletea, M. Performing Wind System with Rectifier with Near Sinusoidal Input Current. WSEAS Trans. Power Syst. 2023, 18, 186–194. [Google Scholar] [CrossRef]
  37. Placide, G.; Lollchund, M.R. Optimal Wind Farm Sites-Selection Using Geographic Information System based Mathematical Modelling and Fuzzy Logic Tools: A Case Study of Burundi. Preprints 2023, 2023092011. [Google Scholar] [CrossRef]
  38. Adaramola, M. Climate Change and the Future of Sustainability: The Impact on Renewable Resources; CRC Press: Boca Raton, FL, USA, 2017. [Google Scholar]
  39. Ouedraogo, N.S. Opportunities, Barriers and Issues with Renewable Energy Development in Africa: A Comprehensible Review. Renew. Energy 2019, 6, 52–60. [Google Scholar] [CrossRef]
  40. Zafar, M.W.; Shahbaz, M.; Sinha, A.; Sengupta, T.; Qin, Q. How renewable energy consumption contribute to environmental quality? The role of education in OECD countries. J. Clean. Prod. 2020, 268, 122149. [Google Scholar] [CrossRef]
  41. Hamed, T.A.; Flamm, H.; Azraq, M. Renewable energy in the Palestinian Territories: Opportunities and challenges. Renew. Sustain. Energy Rev. 2012, 16, 1082–1088. [Google Scholar] [CrossRef]
  42. Dorrell, J.; Lee, K. The Politics of Wind: A state-level analysis of political party impact on wind energy development in the United States. Energy Res. Soc. Sci. 2020, 69, 101602. [Google Scholar] [CrossRef]
  43. Zhang, X.; Wang, D.; Liu, Y.; Yi, H. Wind power development in China: An assessment of provincial policies. Sustainability 2016, 8, 734. [Google Scholar] [CrossRef]
  44. Mckenna, R.; Pfenninger, S.; Heinrichs, H.; Schmidt, J.; Staffell, I.; Bauer, C.; Gruber, K.; Hahmann, A.N.; Jansen, M.; Klingler, M.; et al. High-resolution large-scale onshore wind energy assessments: A review of potential definitions, methodologies and future research needs. Renew. Energy 2022, 182, 659–684. [Google Scholar] [CrossRef]
  45. Adaramola, M.S.; Oyewola, O.M. On wind speed pattern and energy potential in Nigeria. Energy Policy 2011, 39, 2501–2506. [Google Scholar] [CrossRef]
  46. Wabukala, B.M.; Otim, J.; Mubiinzi, G.; Adaramola, M.S. Assessing wind energy development in Uganda: Opportunities and challenges. Wind. Eng. 2021, 45, 1714–1732. [Google Scholar] [CrossRef]
  47. Nalule, V.R. Energy in the East African Community: The Role of the Energy Charter Treaty. Energy Charter Secretariat Knowledge Centre. 2016. Available online: https://www.energycharter.org/what-we-do/knowledge-centre/occasional-papers/energy-in-the-east-african-community-the-role-of-the-energy-charter-treaty/ (accessed on 24 December 2023).
  48. Safari, B.; Gasore, J. Monthly Wind Characteristics and Wind Energy in Rwanda. Rwanda J. 2011, 20, 6–23. [Google Scholar]
  49. Mentis, D. Wind Energy Assessment in Africa; A GIS-Based Approach. 2013. Available online: https://api.semanticscholar.org/CorpusID:128070285 (accessed on 30 October 2023).
  50. Mukasa, A.D.; Mutambatsere, E.; Arvanitis, Y.; Triki, T. Development of Wind Energy in Africa. Available online: https://www.afdb.org/en/documents/document/aec-2012-wind-energy-development-in-africa-29405 (accessed on 15 January 2024).
  51. Center, J.R. Renewable Energies in Africa. 2011. Available online: http://publications.jrc.ec.europa.eu/repository/bitstream/111111111/23076/1/reqno_jrc67752_final%20report%20.pdf (accessed on 30 October 2023).
  52. Niyonzima, C. Wind Power Penetration and Integration in RwandaCelestin Niyonzima. J. Inf. Technol. 2022, 6, 19–46. [Google Scholar]
  53. Maniraguha, E. The Utilization of Wind Power in Rwanda: Design and Production Option. 2013. Available online: http://www.diva-portal.org/smash/record.jsf?pid=diva2%3A740341&dswid=-2631 (accessed on 15 January 2024).
  54. German Technical Cooperation (GTZ). Eastern Africa Resource Base: GTZ Online Regional Energy Resource Base: Regional and Country Specific Energy Resource Database: II; Energy Resource: Kampala, Uganda, 2007. [Google Scholar]
  55. Ohunakin, O.S.; Oyewola, O.M.; Adaramola, M.S. Economic analysis of wind energy conversion systems using levelized cost of electricity and present value cost methods in Nigeria. Int. J. Energy Environ. Eng. 2013, 4, 2. [Google Scholar] [CrossRef]
  56. Gebreslassie, M.G. Public perception and policy implications towards the development of new wind farms in Ethiopia. Energy Policy 2020, 139, 111318. [Google Scholar] [CrossRef]
  57. Ortega-Izquierdo, M.; del Río, P. An analysis of the socioeconomic and environmental benefits of wind energy deployment in Europe. Renew. Energy 2020, 160, 1067–1080. [Google Scholar] [CrossRef]
  58. Mardani, A.; Jusoh, A.; Nor, K.; Khalifah, Z.; Zakwan, N.; Valipour, A. Multiple criteria decision-making techniques and their applications—A review of the literature from 2000 to 2014. Econ. Res. Istraz 2015, 28, 516–571. [Google Scholar]
  59. Atici, K.B.; Simsek, A.B.; Ulucan, A.; Tosun, M.U. A GIS-based Multiple Criteria Decision Analysis approach for wind power plant site selection. Util. Policy 2015, 37, 86–96. [Google Scholar] [CrossRef]
  60. Aktas, A.; Kabak, M. A model proposal for locating wind turbines. Procedia Comput. Sci. 2016, 102, 426–433. [Google Scholar] [CrossRef]
  61. Łaska, G. Wind Energy and Multicriteria Analysis in Making Decisions on the Location of Wind Farms: A Case Study in the North-Eastern of Poland. Model. Simul. Optim. Wind. Farms Hybrid Syst. 2020, 1, 54–73. [Google Scholar]
  62. Saaty, R.W. The analytic hierarchy process—What it is and how it is used. Math. Model. 1987, 9, 161–176. [Google Scholar] [CrossRef]
  63. Pfleeger, T.G.; Olszyk, D.; Burdick, C.A.; King, G.; Kern, J.; Fletcher, J. Using a Geographic Information System to identify areas with potential for off-target pesticide exposure. Environmental Toxicology and Chemistry. Int. J. 2006, 25, 2250–2259. [Google Scholar]
  64. Malczewski, J. GIS-based land-use suitability analysis: A critical overview. Prog. Plan. 2004, 62, 3–65. [Google Scholar] [CrossRef]
  65. Bennui, A.; Rattanamanee, P.; Puetpaiboon, U. Site Selection for Large Wind Turbine Using GIS. In Proceedings of the PSU-UNS International Conference on Engineering and Environment, Songkhla, Thailand, 10–11 May 2007; pp. 1–2. [Google Scholar]
  66. Articte, P.N. Raster Procedures for Multi-Criteria/Multi-Objective Decisions. Photogramm. Eng. Remote Sens. 1995, 61, 539–547. [Google Scholar]
  67. Konstantinos, I.; Georgios, T.; Garyfalos, A. A Decision Support System methodology for selecting wind farm installation locations using AHP and TOPSIS: Case study in Eastern Macedonia and Thrace region, Greece. Energy Policy 2019, 132, 232–246. [Google Scholar] [CrossRef]
  68. Ayodele, T.; Ogunjuyigbe, A.; Odigie, O.; Munda, J. A multi-criteria GIS based model for wind farm site selection using interval type-2 fuzzy analytic hierarchy process: The case study of Nigeria. Appl. Energy 2018, 228, 1853–1869. [Google Scholar] [CrossRef]
  69. Ayodele, T.R.; Jimoh, A.A.; Munda, J.L.; Agee, J.T. Wind distribution and capacity factor estimation for wind turbines in the coastal region of South Africa. Energy Convers. Manag. 2012, 64, 614–625. [Google Scholar] [CrossRef]
  70. Yang, Z. Using Geographic Information System to Identify Areas Suitable for Wind Farm; Department of Resource Analysis, Saint Mary’s University of Minnesota: Minneapolis, MN, USA, 2013. [Google Scholar]
  71. Zalhaf, A.S.; Elboshy, B.; Kotb, K.M.; Han, Y.; Almaliki, A.H.; Aly, R.M.H.; Elkadeem, M.R. A High-Resolution Wind Farms Suitability Mapping Using GIS and Fuzzy AHP Approach: A National-Level Case Study in Sudan. Sustainability 2022, 14, 358. [Google Scholar] [CrossRef]
  72. Xu, Y.; Li, Y.; Zheng, L.; Cui, L.; Li, S.; Li, W.; Cai, Y. Site selection of wind farms using GIS and multi-criteria decision making method in Wafangdian, China. Energy 2020, 207, 118222. [Google Scholar] [CrossRef]
  73. Li, M.; Xu, Y.; Guo, J.; Li, Y.; Li, W. Application of a GIS-based fuzzy multi-criteria evaluation approach for wind farm site selection in China. Energies 2020, 13, 2426. [Google Scholar] [CrossRef]
  74. Kabu, I.K. Wind Farm Site Selection Assessment in the Greater Accra, Volta and Eastern Regions of Ghana: A GIS Spatial Multi-criteria Assessment. Master’s Thesis, Norwegian University of Science and Technology, Tronheim, Norway, 2016. [Google Scholar]
  75. Chamanehpour, E.J.C.E. Site selection of wind power plant using multi-criteria decision-making methods in GIS: A case study. Comput. Ecol. Softw. 2017, 7, 49. [Google Scholar]
  76. Nasery, S.; Matci, D.K.; Avdan, U. GIS-based wind farm suitability assessment using fuzzy AHP multi-criteria approach: The case of Herat, Afghanistan. Arab. J. Geosci. 2021, 14, 1091. [Google Scholar] [CrossRef]
  77. Szurek, M.; Blachowski, J.; Nowacka, A. GIS-based method for wind farm location multi-criteria analysis. Min. Sci. 2014, 21, 65–81. [Google Scholar]
  78. Cunden, T.S.M.; Doorga, J.; Lollchund, M.R.; Rughooputh, S.D.D.V. Multilevel constraints wind farms siting for a complex terrain in a tropical region using MCDM approach coupled with GIS. Energy 2020, 211, 118533. [Google Scholar] [CrossRef]
  79. Moradi, S.; Yousefi, H.; Noorollahi, Y.; Rosso, D. Multi-criteria decision support system for wind farm site selection and sensitivity analysis: Case study of Alborz Province, Iran. Energy Strategy 2020, 29, 100478. [Google Scholar] [CrossRef]
  80. Zhou, J.; Liu, D.; Sha, R.; Sun, J.; Wang, Y.; Wu, Y. Geospatial simulation and decision optimization towards identifying the layout suitability and priority for wind-photovoltaic-hydrogen-ammonia project: An empirical study in China. Energy 2024, 286, 129489. [Google Scholar] [CrossRef]
  81. Şahin, G.; Koç, A.; van Sark, W. Multi-criteria decision making for solar power-Wind power plant site selection using a GIS-intuitionistic fuzzy-based approach with an application in the Netherlands. Energy Strategy Rev. 2024, 51, 101307. [Google Scholar] [CrossRef]
  82. Solbrekke, I.M.; Sorteberg, A. Norwegian offshore wind power—Spatial planning using multi-criteria decision analysis. Wind Energy 2024, 27, 5–32. [Google Scholar] [CrossRef]
  83. Przewoźniak, M.; Wyrwa, A.; Zyśk, J.; Raczyński, M.; Pluta, M. Conducting a Geographical Information System-Based Multi-Criteria Analysis to Assess the Potential and Location for Offshore Wind Farms in Poland. Energies 2024, 17, 283. [Google Scholar] [CrossRef]
  84. Önden, İ.; Kara, K.; Yalçın, G.C.; Deveci, M.; Önden, A.; Eker, M. Strategic location analysis for offshore wind farms to sustainably fulfill railway energy demand in Turkey. J. Clean. Prod. 2024, 434, 140142. [Google Scholar] [CrossRef]
  85. Wang, C.N.; Nguyen, N.A.T.; Dang, T.T. Offshore wind power station (OWPS) site selection using a two-stage MCDM-based spherical fuzzy set approach. Sci. Rep. 2022, 12, 4260. [Google Scholar] [CrossRef] [PubMed]
  86. Islam, M.R.; Islam, M.R.; Imran, H.M. Assessing Wind Farm Site Suitability in Bangladesh: A GIS-AHP Approach. Sustainability 2022, 14, 14819. [Google Scholar] [CrossRef]
  87. Zalhaf, A.S.; Abdel-Salam, M.; Mansour, D.E.A.; Ookawara, S.; Ahmed, M. Assessment of wind turbine transient overvoltages when struck by lightning: Experimental and analytical study. IET Renew. Power Gener. 2019, 13, 1360–1368. [Google Scholar] [CrossRef]
  88. Tabassum, A.; Premalatha, M.; Abbasi, T.; Abbasi, S.A. Wind energy: Increasing deployment, rising environmental concerns. Renew. Sustain. Energy Rev. 2014, 31, 270–288. [Google Scholar] [CrossRef]
  89. Kotb, K.M.; Elkadeem, M.R.; Khalil, A.; Imam, S.M.; Hamada, M.A.; Sharshir, S.W.; Dán, A. A fuzzy decision-making model for optimal design of solar, wind, diesel-based RO desalination integrating flow-battery and pumped-hydro storage: Case study in Baltim, Egypt. Energy Convers. Manag. 2021, 235, 113962. [Google Scholar] [CrossRef]
  90. Schaber, K.; Steinke, F.; Hamacher, T. Transmission grid extensions for the integration of variable renewable energies in Europe: Who benefits where? Energy Policy 2012, 43, 123–135. [Google Scholar] [CrossRef]
  91. Cvetkoska, V. Book Review of “Practical Decision Making: An Introduction to the Analytic Hierarchy Process (AHP) Using Super Decisions v2” by Enrique Mu and Milagros Pereyra-Royas (2017). Manag. J. Sustain. Bus. Manag. Solut. Emerg. Econ. 2022, 27, 83–85. [Google Scholar] [CrossRef]
  92. Madzík, P.; Falát, L. State-of-the-art on analytic hierarchy process in the last 40 years: Literature review based on Latent Dirichlet Allocation topic modelling. PLoS ONE 2022, 17, e0268777. [Google Scholar] [CrossRef] [PubMed]
  93. Vidal, L.A.; Marle, F.; Bocquet, J.C. Using a Delphi process and the Analytic Hierarchy Process (AHP) to evaluate the complexity of projects. Expert Syst. Appl. 2011, 38, 5388–5405. [Google Scholar] [CrossRef]
  94. Albayrak, E.; Erensal, Y.C. Using analytic hierarchy process (AHP) to improve human performance: An application of multiple criteria decision making problem. J. Intell. Manuf. 2004, 15, 491–503. [Google Scholar] [CrossRef]
  95. Karayalcin, I.I. The analytic hierarchy process: Planning, priority setting, resource allocation. Eur. J. Oper. Res. 1982, 9, 97–98. [Google Scholar] [CrossRef]
  96. Wang, T.C.; Chen, Y.H. Applying fuzzy linguistic preference relations to the improvement of consistency of fuzzy AHP. Inf. Sci. 2008, 178, 3755–3765. [Google Scholar] [CrossRef]
  97. Al-Shabeeb, A.A.-A.R.; Mashagbah, A.; Saaty, T.L. The Analytic Hierarchy Process: Planning, Priority Setting, Resources Allocation. Mcgraw-Hill, New York. Int. J. Geosci. 1980, 7, 1208–1221. [Google Scholar] [CrossRef]
  98. Fülöp, J. Introduction to Decision Making Methods. 2001. Available online: https://www.academia.edu/22906650/Introduction_to_Decision_Making_Methods (accessed on 24 December 2023).
  99. Feizizadeh, B.; Jankowski, P.; Blaschke, T. A GIS based spatially-explicit sensitivity and uncertainty analysis approach for multi-criteria decision analysis. Comput. Geosci. 2014, 64, 81–95. [Google Scholar] [CrossRef] [PubMed]
Figure 1. Location map of the study area.
Sustainability 16 01514 g001
Figure 2. Framework diagram for finding suitable sites of wind energy in East Africa.
Sustainability 16 01514 g002
Figure 3. Overview plot of factor levels (LULC, wind speed, slope, distance from road, distance from power lines, and elevation) for the wind energy suitability in Rwanda.
Sustainability 16 01514 g003
Figure 4. Overview plot of factor levels (LULC, wind speed, slope, distance from road, distance from power lines, and elevation) for the wind energy suitability in Burundi.
Sustainability 16 01514 g004
Figure 5. Overview plot of factor levels (LULC, wind speed, slope, distance from road, distance from power lines, and elevation) for the wind energy suitability in Tanzania.
Sustainability 16 01514 g005
Figure 6. Overview plot of factor levels (LULC, wind speed, slope, distance from road, distance from power lines, and elevation) for the wind energy suitability in Uganda.
Sustainability 16 01514 g006
Figure 7. Overview plot of factor levels (LULC, wind speed, slope, distance from road, distance from power lines, and elevation) for the wind energy suitability in South Sudan.
Sustainability 16 01514 g007
Figure 8. Overview plot of factor levels (LULC, wind speed, slope, distance from road, distance from power lines, and elevation) for the wind energy suitability in Kenya.
Sustainability 16 01514 g008
Figure 9. Wind suitability levels’ plot for Rwanda, Burundi, South Sudan, Uganda, Tanzania, and Kenya.
Sustainability 16 01514 g009
Figure 10. Wind suitability levels’ plot (suitable and highly suitable areas) for all of the East Africa Community regions (case study region).
Sustainability 16 01514 g010
Table 1. Annual wind energy potential (technical potential, MWh per annum and km2) for the East African countries (grid restriction included).
Country00–50005000–10,00010,000–15,00015,000–20,00020,000–25,00025,000–30,000
Burundi63.09%36.91%0.00%0.00%0.00%0.00%0.00%
Rwanda62.97%37.03%0.00%0.00%0.00%0.00%0.00%
Kenya81.90%4.97%6.54%5.04%1.38%0.17%0.01%
Tanzania81.89%7.11%8.26%2.54%0.21%0.00%0.00%
Uganda93.96%4.37%1.51%0.16%0.00%0.00%0.00%
South Sudan80.66%0.82%8.34%8.64%1.55%0.00%0.00%
Democratic Republic of the Congo94.74%5.69%0.66%0.00%0.00%0.00%0.00%
Table 2. Country-based suitability parameters.
Distance to the GridExtremely Rural AreasProtected AreasSlopeElevation
CountryPercentage of Area AvailabilityPercentage of Area AvailabilityPercentage of Area AvailabilityPercentage of Area AvailabilityPercentage of Area Availability
Burundi88.86%100.00%96.39%91.74%92.78%
Rwanda100.00%100.00%90.04%95.33%81.66%
Kenya98.66%99.48%73.23%99.86%99.91%
Tanzania78.32%99.31%67.79%93.44%98.54%
Uganda99.27%98.37%85.12%86.31%98.33%
South Sudan39.16%67.02%98.25%99.39%99.95%
Democratic Republic of the Congo43.52%78.54%89.62%98.60%99.42%
Table 3. Geographical wind power potential.
Grid RestrictionNo Grid Restriction
CountryTotal Available Area for Wind Farms (km2)Percentage of Area AvailabilityTotal Available Area for Wind Farms (km2)Percentage of Area Availability
Burundi10,04736.89%11,94143.84%
Rwanda940537.03%940537.03%
Kenya106,23018.10%149,85525.54%
Tanzania174,05718.11%220,35222.93%
Uganda14,6866.04%14,6866.04%
South Sudan520,73319.34%1,028,53038.19%
Democratic Republic of the Congo149,9416.34%193,9258.21%
Table 4. Wind site suitability-related works.
ReferenceStudy Area LocationType of Site SelectionApplied MethodEvaluation Criteria
[69]KenyaWind firmAnalytic Hierarchy Process (AHP), Multi-Criteria Decision making (MCDM)Factor Criterion, Constraint Criteria, Slope, Euclidian Distance, Criteria Weights, Weighted Overlay, Wind, Roads
[70]Burundiwind farmFuzzy Analytic Hierarchy Process (FAHP), Multi-Criteria Decision making (MCDM)Topographical factors (slope, elevation, and aspect), Locational factors (distance to airports/seaports, proximity to main roads, proximity to electricity grids, distance to cities, distance to communication stations)
[48]AfricaWindGIS-basedWind speed, elevation map, wind power density, Weibull distribution, slope impact, and spacing factor
[71]SudanWind firmMulti-Criteria Decision-making Analysis (MCDM), Fuzzy Analytic Hierarchy Process (AHP)Wind speed, Slope, Distance from urban areas, elevation, and distance from transmission lines and power grid, distance from airports, distance from major roads and railways, lighting strike flash rate
[72]China Geographic Information System (GIS), fuzzy Analytic Hierarchy Process (FAHP), and fuzzy VIšekriterijumsko Kompromisno Rangiranje (VIKOR)Slope (geographical factors), wind speed, distance from the main road, and distance from the transmission line (economic factors), building area (social factors), and ecological environment factors
[51]RwandaWindDescriptiveGeographic Diversity, Size, and Distance from Road
[73]GhanaWind firmSMCA, Analytic Hierarchy Process (AHP)Power grid lines, road networks, slope, and elevation
[74]South KhorasanWind firmFuzzy- fuzzy Analytic Hierarchy Process (AHP)Wind speed, temperature, altitude, slope, main and secondary roads, airports, protected areas, land use, rivers, wells, springs, earthquake acceleration, and faults
[75]AfghanistanWind firmMulti-Criteria Decision-making Analysis (MCDA), fuzzy Analytic Hierarchy Process (AHP)Annual average wind speed, slope, distance from residential areas, distance from power transmission lines, distance to roads, and land cover/land use
[76]PolandWind firmAnalytic Hierarchy Process (AHP) and Weighted Linear Combination (WLC)Technical, spatial, social, and environmental
[77]MauritiusWind farmAnalytic Hierarchy Process (AHP)Wind speed, distance from the electricity grid, distance from roads, slope, elevation, and aspects
[78]IranWind farmAnalytic Hierarchy Process (AHP)Wind speed, distance from electricity grid, distance from roads, distance from substations, distance from settlements and slope
[79]VietnamOffshore wind farmSF-AHP, WASPASWind speed, effective wind hours, nautical life coordination, nautical environmental influence, water depth, undersea geological conditions, marine conditions, employment, policy planning, electrical transmission, distance from the power load center, traffic condition, cost-to-benefit ratio, construction and maintenance costs
Table 5. Factors for the wind site suitability assessment.
CriteriaDescription
Wind SpeedWind speed is a critical determinant for wind farm site selection, as it directly impacts electricity generation [85,86]. Various threshold values for wind speed indicate suitability.
SlopeThe slope of the land affects accessibility and installation costs. Flat and low-slope areas are preferable for wind farm construction [87].
ElevationElevation influences wind direction and speed. Wind turbines are often set on elevated terrain, but higher elevations entail increased costs [88].
Distance from Transmission LinesProximity to transmission lines and the power system is vital for electricity integration into the grid [89,90]. A minimum distance of 0.5 km ensures safe power transmission. With the help of GIS, transmission lines over 0.5 km were selected and exported based on studying proximity.
Distance from Major RoadsLocating wind farms near major roads reduces transportation costs and minimizes disruptions, such as noise pollution, to road mobility. A minimum distance of 0.5 km is maintained [86].
Table 6. Data sources.
CriteriaCriteria CategoryDataData sources
Wind speedClimaticAnnual wind speed data. 10 m tiff, m/s.Global Wind atlas.
SlopeGeomorphologicalExtracted from a base data set, Digital elevation model (DEM) Shuttle Radar Topography Mission (SRTM).Regional Center for Mapping Resources for Development (RCMRD).
ElevationGeomorphologicalDigital elevation model (DEM). Shuttle Radar Topography Mission (SRTM).Regional Center for Mapping Resources for Development (RCMRD).
Land use Land coverLocationalCountry-based Land uses land cover data set.African Geoportal, RCMRD Open data site.
Distance from roadsLocationalCountry-level Major roads data set.African Geoportal, RCMRD Open data site, and East African Community website.
Distance from Power linesLocationalCountry-level Transmission network data.Energy data Info.org.
Table 7. The assessment of the relative importance of each criterion to each other.
Intensity of RelevanceDefinitionExplanation
1Equal ImportanceIndicates that two activities or criteria contribute equally to the decision.
2Weak Importance of One Over AnotherSuggests a slight preference for one activity over another based on experience and judgment.
3Essential or StrongSignifies a strong favoritism toward one activity over another, reflecting a clear preference.
4Strong or ExtremeDemonstrates that one activity significantly dominates the other in practice, indicating a strong preference.
5Absolute ImportanceImplies that one activity’s superiority over the other is of the highest possible order of affirmation, based on strong and unequivocal evidence.
Reciprocals If activity i is assigned a value compared to activity j, then activity j has the reciprocal value compared with activity i.
Table 8. Generated weights and normalized weights.
CriteriaSNC1C2C3C4C5C6Weighted Average
C111357390.35
C221/3135370.19
C331/51/3131/350.08
C441/71/51/311/330.06
C551/31/333170.22
C661/91/71/51/31/710.10
Table 9. Details of factor levels for the wind energy suitability in Rwanda.
LULCWind SpeedSlope
SuitabilityKm sq%Km sq%Km sq%
1Lowest1718.8736.7695446.7621.48101809.697.134
2Low15,247.40060.04010,146.0040.01303990.2315.729
3Average5339.38021.0306469.9025.51605409.0021.322
4High43.6950.1722622.6610.34307159.5528.223
5Highest3044.91611.990708.862.79566999.3727.591
5Total25,394.260100.00025,356.50100.000025,367.80100.000
Distance from RoadDistance from Power LinesElevation
SuitabilityKm sq%Km sq%Km sq%
1Lowest56.4170.2222666.3610.50128.590.51
2Low932.1693.6706892.5327.152520.169.92
3Average1552.1186.1116710.4626.434224.4916.64
4High6200.78024.4165066.0219.957222.1928.44
5Highest16,655.30065.5804053.7215.9711,298.8044.49
6Total25,396.785100.00025,389.09100.0025,394.23100.00
Table 10. Details of factor levels for the wind energy suitability in Burundi.
LULCWind SpeedSlope
SuitabilityKm sq%Km sq%Km sq%
1Lowest142.4770.564330.981.311274.625.048
2Low13,974.59055.3102883.1911.403243.7012.846
3Average9166.74936.2806703.7226.505423.6821.480
4High1.0520.0046241.1624.677842.6131.060
5Highest1982.9567.8489139.9536.137465.1929.565
6Total25,267.820100.00025,299.00100.0025,249.80100.000
Distance from RoadDistance from Power linesElevation
SuitabilityKm sq%Km sq%Km sq%
1Lowest251.6250.9955871.5023.211890.067.47
2Low726.3892.8729405.4437.185270.7220.84
3Average2040.8088.0706371.8825.199748.3238.54
4High9207.03536.4092832.0611.206422.0425.39
5Highest13,062.12051.653816.533.231963.367.76
6Total25,287.977100.00025,297.42100.0025,294.49100.00
Table 11. Details of factor levels for the wind energy suitability in Tanzania.
LULCWind speedSlope
SuitabilityKm sq%Km sq%Km sq%
1Lowest61,338.8106.402510,861.053.3113,367.71.396
2Low511,957.10053.440174,741.018.2338,234.33.993
3Average241,133.50025.170115,865.012.0972,210.17.542
4High558.3920.05870,834.77.39222,391.023.228
5Highest143,109.60014.94085,990.68.97611,240.063.841
6Total958,097.400100.000958,292.3100.00957,443.1100.000
Distance from RoadDistance from Power linesElevation
SuitabilityKm sq%Km sq%Km sq%
1Lowest45,904.5834.7901044.3630.00039,078.804.08
2Low154,939.46716.1681150.9335.000163,753.9517.09
3Average215,470.96122.485896.7212.500420,602.8343.90
4High208,732.46221.782299.3411.500159,657.4216.66
5Highest333,245.19434.77537.737.800174,957.8618.26
6Total958,292.667100.0003429.08100.000958,050.85100.00
Table 12. Details of factor levels for the wind energy suitability in Uganda.
LULCWind SpeedSlope
SuitabilityKm sq%Km sq%Km sq%
1Lowest37,559.03015.56039,556.816.3532951.51.22
2Low142,361.90058.97033,745.613.9517286.13.02
3Average48,270.68020.00055,397.422.90215,784.46.54
4High7.1310.00370,444.529.12352,687.421.84
5Highest13,200.0905.46842,742.817.671162,501.067.37
6Total241,398.900100.000241,887.1100.000241,210.4100.00
Distance from RoadDistance from Power linesElevation
SuitabilityKm sq%Km sq%Km sq%
1Lowest14,295.2425.91560,858.553025.0480403301432.6620.592029
2Low13,096.0175.418111,064.790045.7118214108322.0603.438986
3Average32,933.94713.62648,233.359019.85178843051,884.73021.440710
4High50,725.43820.98721,703.87908.932838661155,784.20064.375850
5Highest130,643.95654.0531106.74330.45551116224,568.01010.152420
6Total241,694.601100.000242,967.3200100.000000000241,991.700100.000000
Table 13. Details of factor levels for the wind energy suitability in South Sudan.
LULCWind SpeedSlope
SuitabilityKm sq%Km sq%Km sq%
1Lowest5168.5110.80142,712.06.58812151.180.332
2Low307,246.40047.62040,181.56.19784570.220.705
3Average207,854.50032.22077,924.512.01908907.361.374
4High247.7910.038138,519.021.3660182,096.0028.084
5Highest124,685.80019.330348,981.053.8290450,666.0069.505
6Total645,202.900100.000648,318.0100.0000648,390.76100.000
Distance from RoadDistance from Power linesElevation
SuitabilityKm sq%Km sq%Km sq%
1Lowest78,657.44612.134234,675.110036.2166382102406.5790.370842
2Low140,902.36021.736223,091.090034.42891412027,187.3104.189432
3Average151,670.20923.397132,272.590020.41319351085,241.09013.135240
4High117,372.61718.10755,933.82208.632082698156,192.70024.068530
5Highest159,631.05424.6262003.35680.309171463377,922.10058.235960
6Total648,233.686100.000647,975.9700100.000000000648,949.700100.000000
Table 14. Details of factor levels for the wind energy suitability in Kenya.
LULCWind SpeedSlope
SuitabilityKm sq%Km sq%Km sq%
1Lowest2136.740.36293,588.048.81102136.740.36
2Low12,316.912.0843,910.77.300512,316.902.08
3Average33,733.835.7171,766.511.932033,733.805.71
4High168,580.6028.51118,509.019.7030168,581.0028.51
5Highest374,444.5063.3473,701.312.2530374,445.0063.34
5Total591,212.60100.00601,475.5100.0000591,213.44100.00
Distance from RoadDistance from Power linesElevation
SuitabilityKm sq%Km sq%Km sq%
1Lowest9710.061.64150,077.270024.93173810022,571.133.750379
2Low76,706.8812.97277,561.360046.11015990072,981.6812.126510
3Average127,153.0521.51133,844.040022.23497579096,737.2816.073690
4High130,765.5022.1232,603.71605.416325146203,746.0033.854080
5Highest246,914.6841.767866.32441.306801064205,799.9034.195350
6Total591,250.16100.00601,952.7100100.000000000601,835.99100.000000
Table 15. Wind energy suitability levels for Burundi, Rwanda, South Sudan, Tanzania, Uganda, and Kenya.
Wind Site Siting Suitability Level
Suitable LevelBurundiRwandaSouth Sudan
Sq. Km%Sq. Km%Sq. Km%
Un Suitable 1219.474.872568.2710.21173,262.9727.15
Marginal Suitable5149.8720.566777.7826.95157,358.4224.65
Moderate Suitability10,316.0241.198963.9535.64178,983.7028.04
Suitable6653.5326.575180.7820.6099,000.8415.51
Highly Suitable1803.746.801659.186.6029,661.914.65
Total25,267.82100.0025,149.96100.00638,267.84100.00
Suitable LevelTanzaniaUgandaKenya
Sq. Km%Sq. Km%Sq. Km%
Un Suitable 99,333.6510.4412,451.715.199289.5891.548
Marginal Suitable276,358.6729.0581,231.4633.8774,175.7612.36
Moderate Suitability324,220.0534.08108,581.0845.27236,621.839.44
Suitable193,975.4520.3933,471.0613.96188,31631.39
Highly Suitable57,521.066.054098.861.7191,524.8715.26
Total951,408.88100.00239,834.18100.00599,928.04100.00
Disclaimer/Publisher’s Note: The statements, opinions and data contained in all publications are solely those of the individual author(s) and contributor(s) and not of MDPI and/or the editor(s). MDPI and/or the editor(s) disclaim responsibility for any injury to people or property resulting from any ideas, methods, instructions or products referred to in the content.

