
An Evaluation of the Luminous Performance of a School Environment Integrating Artificial Lighting and Daylight


Abstract
1. Introduction
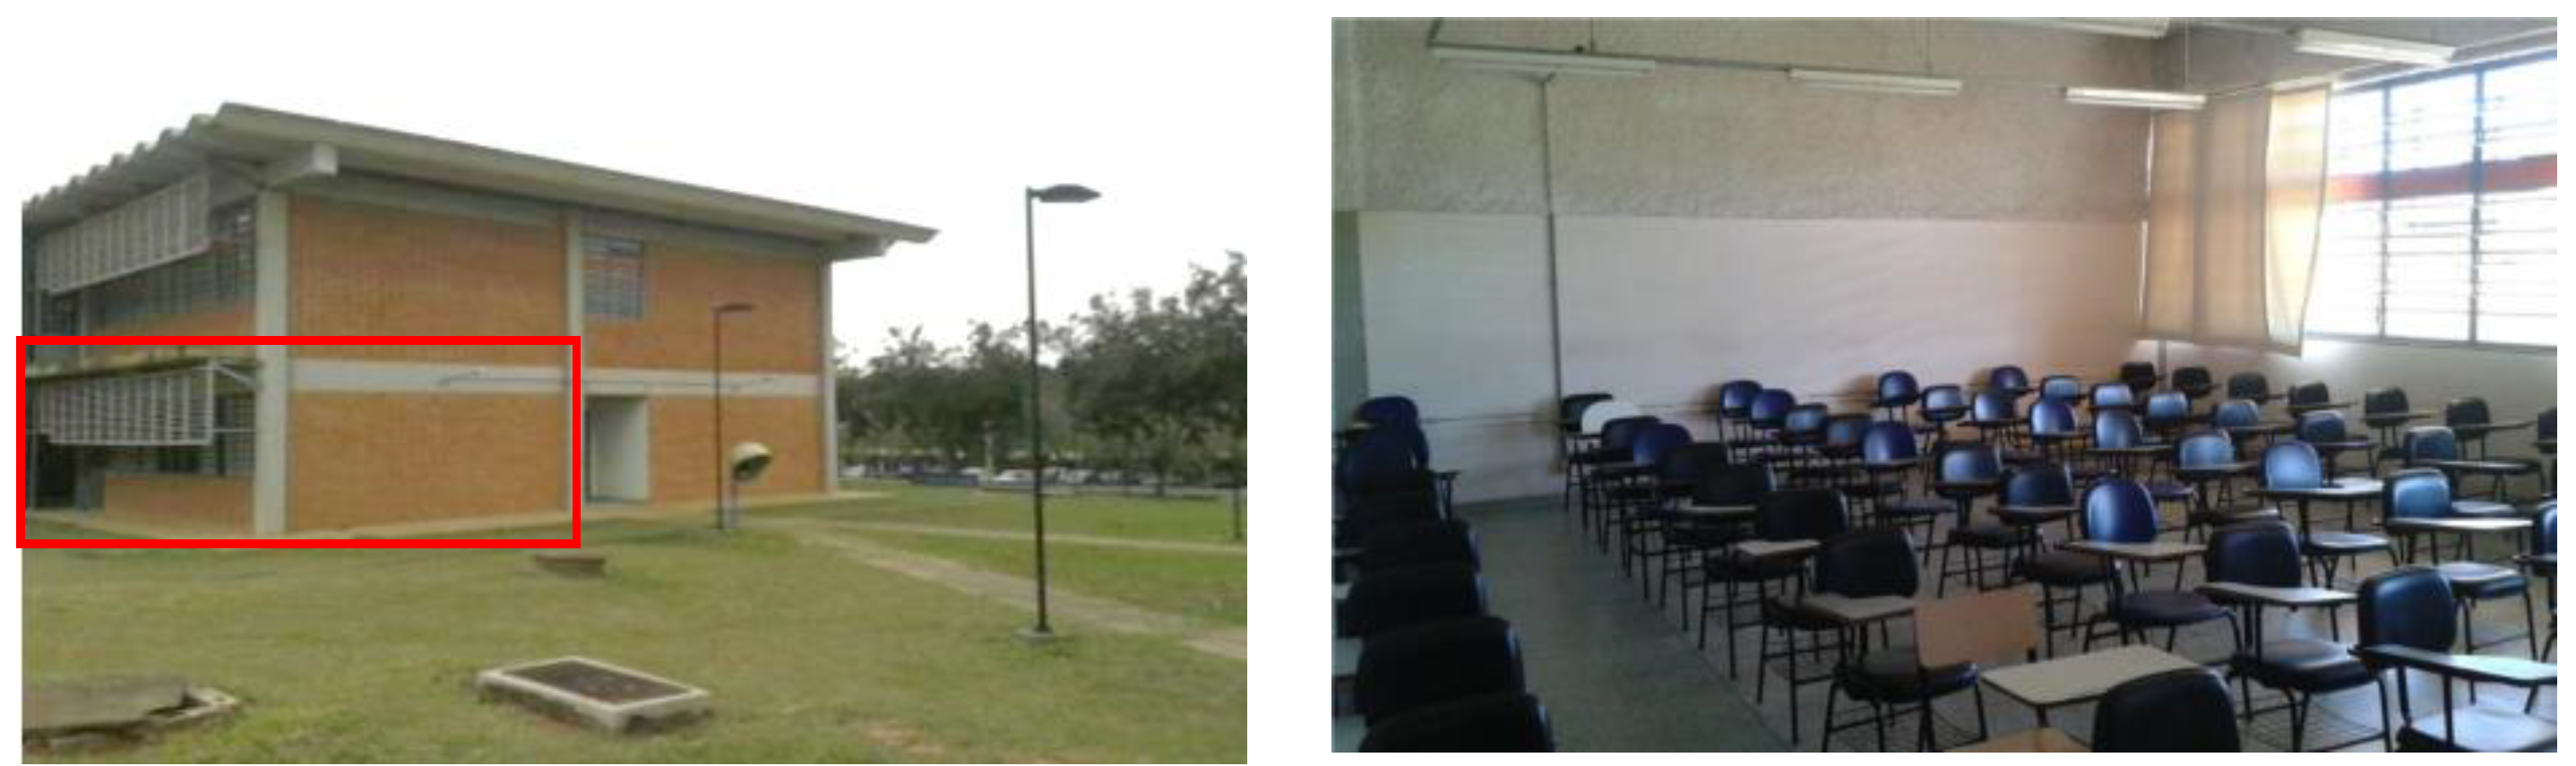
2. Materials and Methods
- Dimensions of 6.80 m in width and 9.80 m in length, totaling 66.64 m2;
- Ceiling height of 3.40 m;
- Openings facing north;
- Windows measuring 9.80 m in length and 1.90 m in height, totaling a glazed area of 18.62 m2;
- Building alignment, specifically a longitude of −47.88° and latitude of −21.98°;
- Time zone range, namely UTC/GMT −3 h.
- Artificial lighting comprising 12 (twelve) luminaires, each with 2 (two) fluorescent lamps of 32 W each and 3.5 W for the ballast, totaling 71 W per luminaire;
- Direct light distribution type;
- Luminaire dimensions of 1.520 m × 0.167 m × 0.076 m each;
- Lighting activation system comprising 3 switches activating the front row of the board, one row in the middle of the room, and two rows at the back;
- Height of 2.35 m between the luminaire and the work surface;
- Common hours of use from 08:00 a.m. to 12:00 p.m., and from 02:00 p.m. to 06:00 p.m., from Monday to Friday for 10 months a year, totaling an average usage of 1760 h per year.
- Maintained Illuminance (Em): On the reference surface of classrooms, the maintained illuminance suggested is not less than 300 lx.
- Uniformity (U): Since it is a classroom and, therefore, students’ arrangements are flexible, the work area considered was the total room area, discounting a range of 0.5 m from the walls, and thus presenting the planned illuminance uniformity of ≥ 0.60 (ratio between the minimum value and the average value).
- Color Aspects: This refers to the qualities of lamp colors, which influence the visual performance and the well-being of users. The appearance of a color can be represented by its correlated color temperature, which can be classified as warm (below 3300 K), intermediate (3300 K to 5300 K), or cool (above 5300 K). The CRI (Color Rate Index) defines the color reproduction, and the quality increases as it approaches the maximum value of 100. Because the object of study is an environment where users remain for long periods, the CRI recommended is greater than or equal to 80.
- Reflectance: All elements inside the classroom were considered (concrete beam: 0.40; walls: 0.81; blackboard: 0.22; door: 0.48; teacher’s desk: 0.15; teacher’s desk structure: 0.31; teacher’s chair: 0.50; student’s chair clipboard: 0.65; student’s chair upholstery: 0.02; student’s chair structure: 0.00; floor: 0.20; roof: 0.40).
3. Results
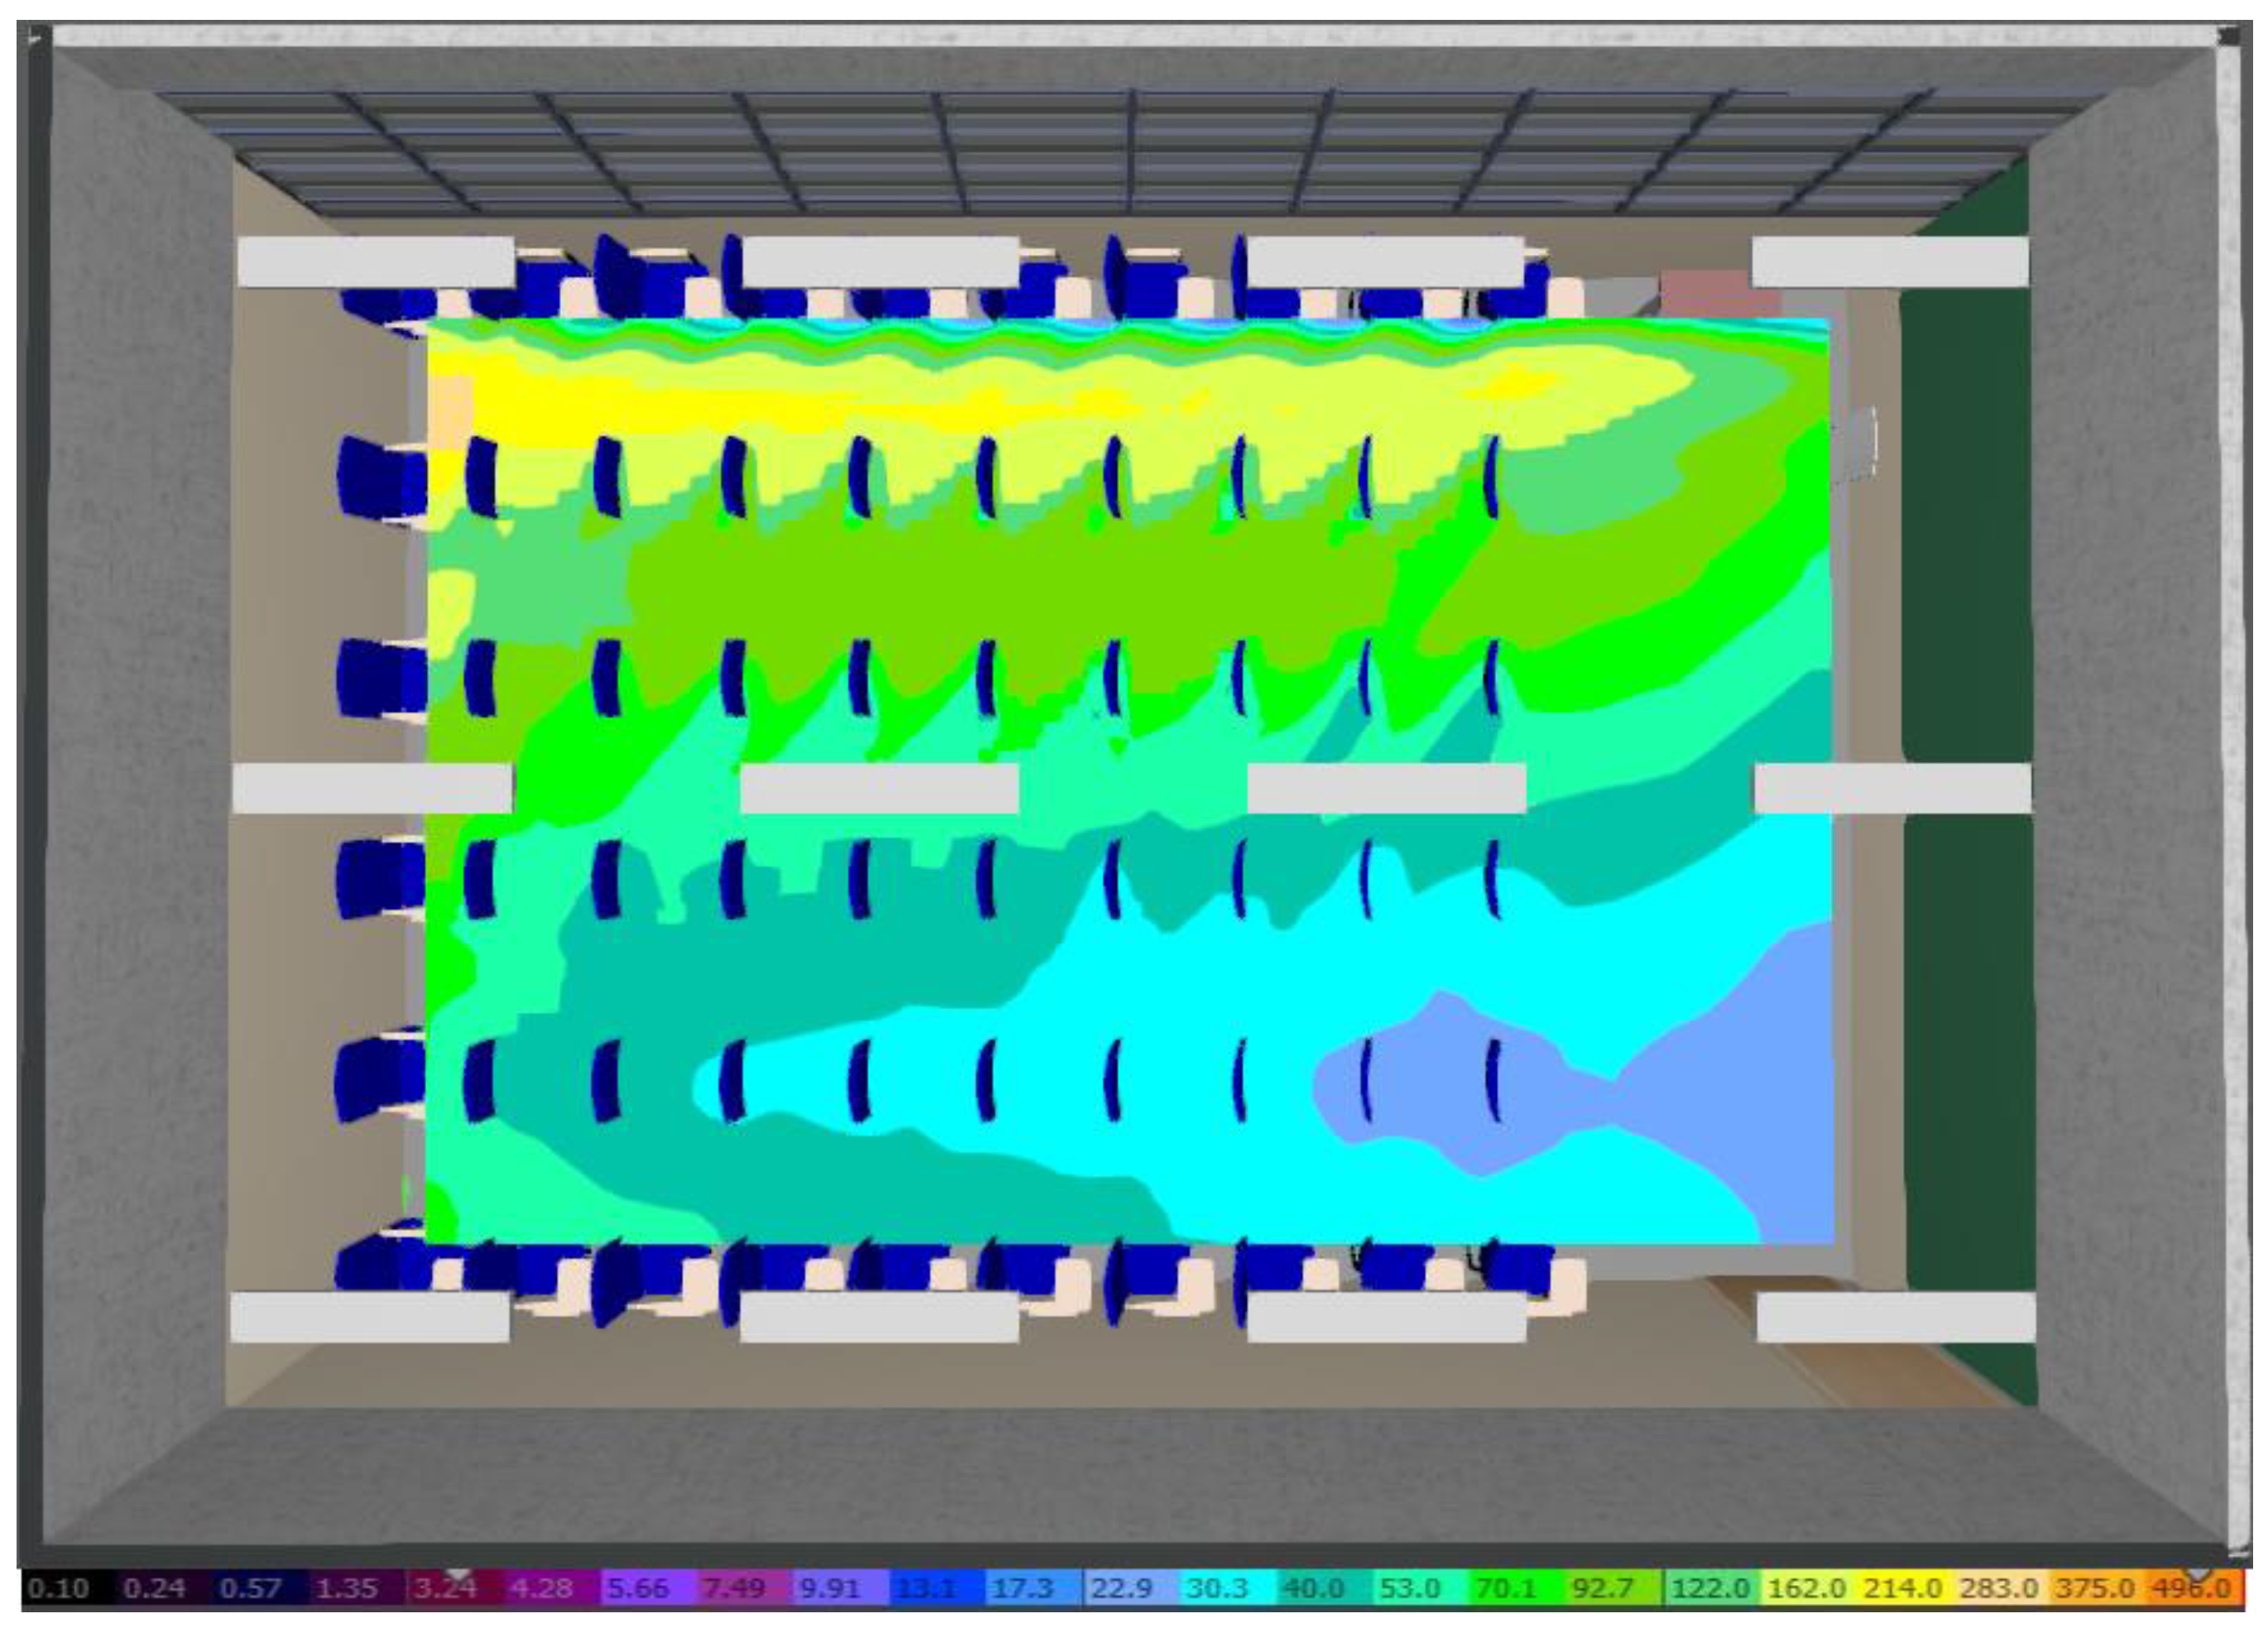
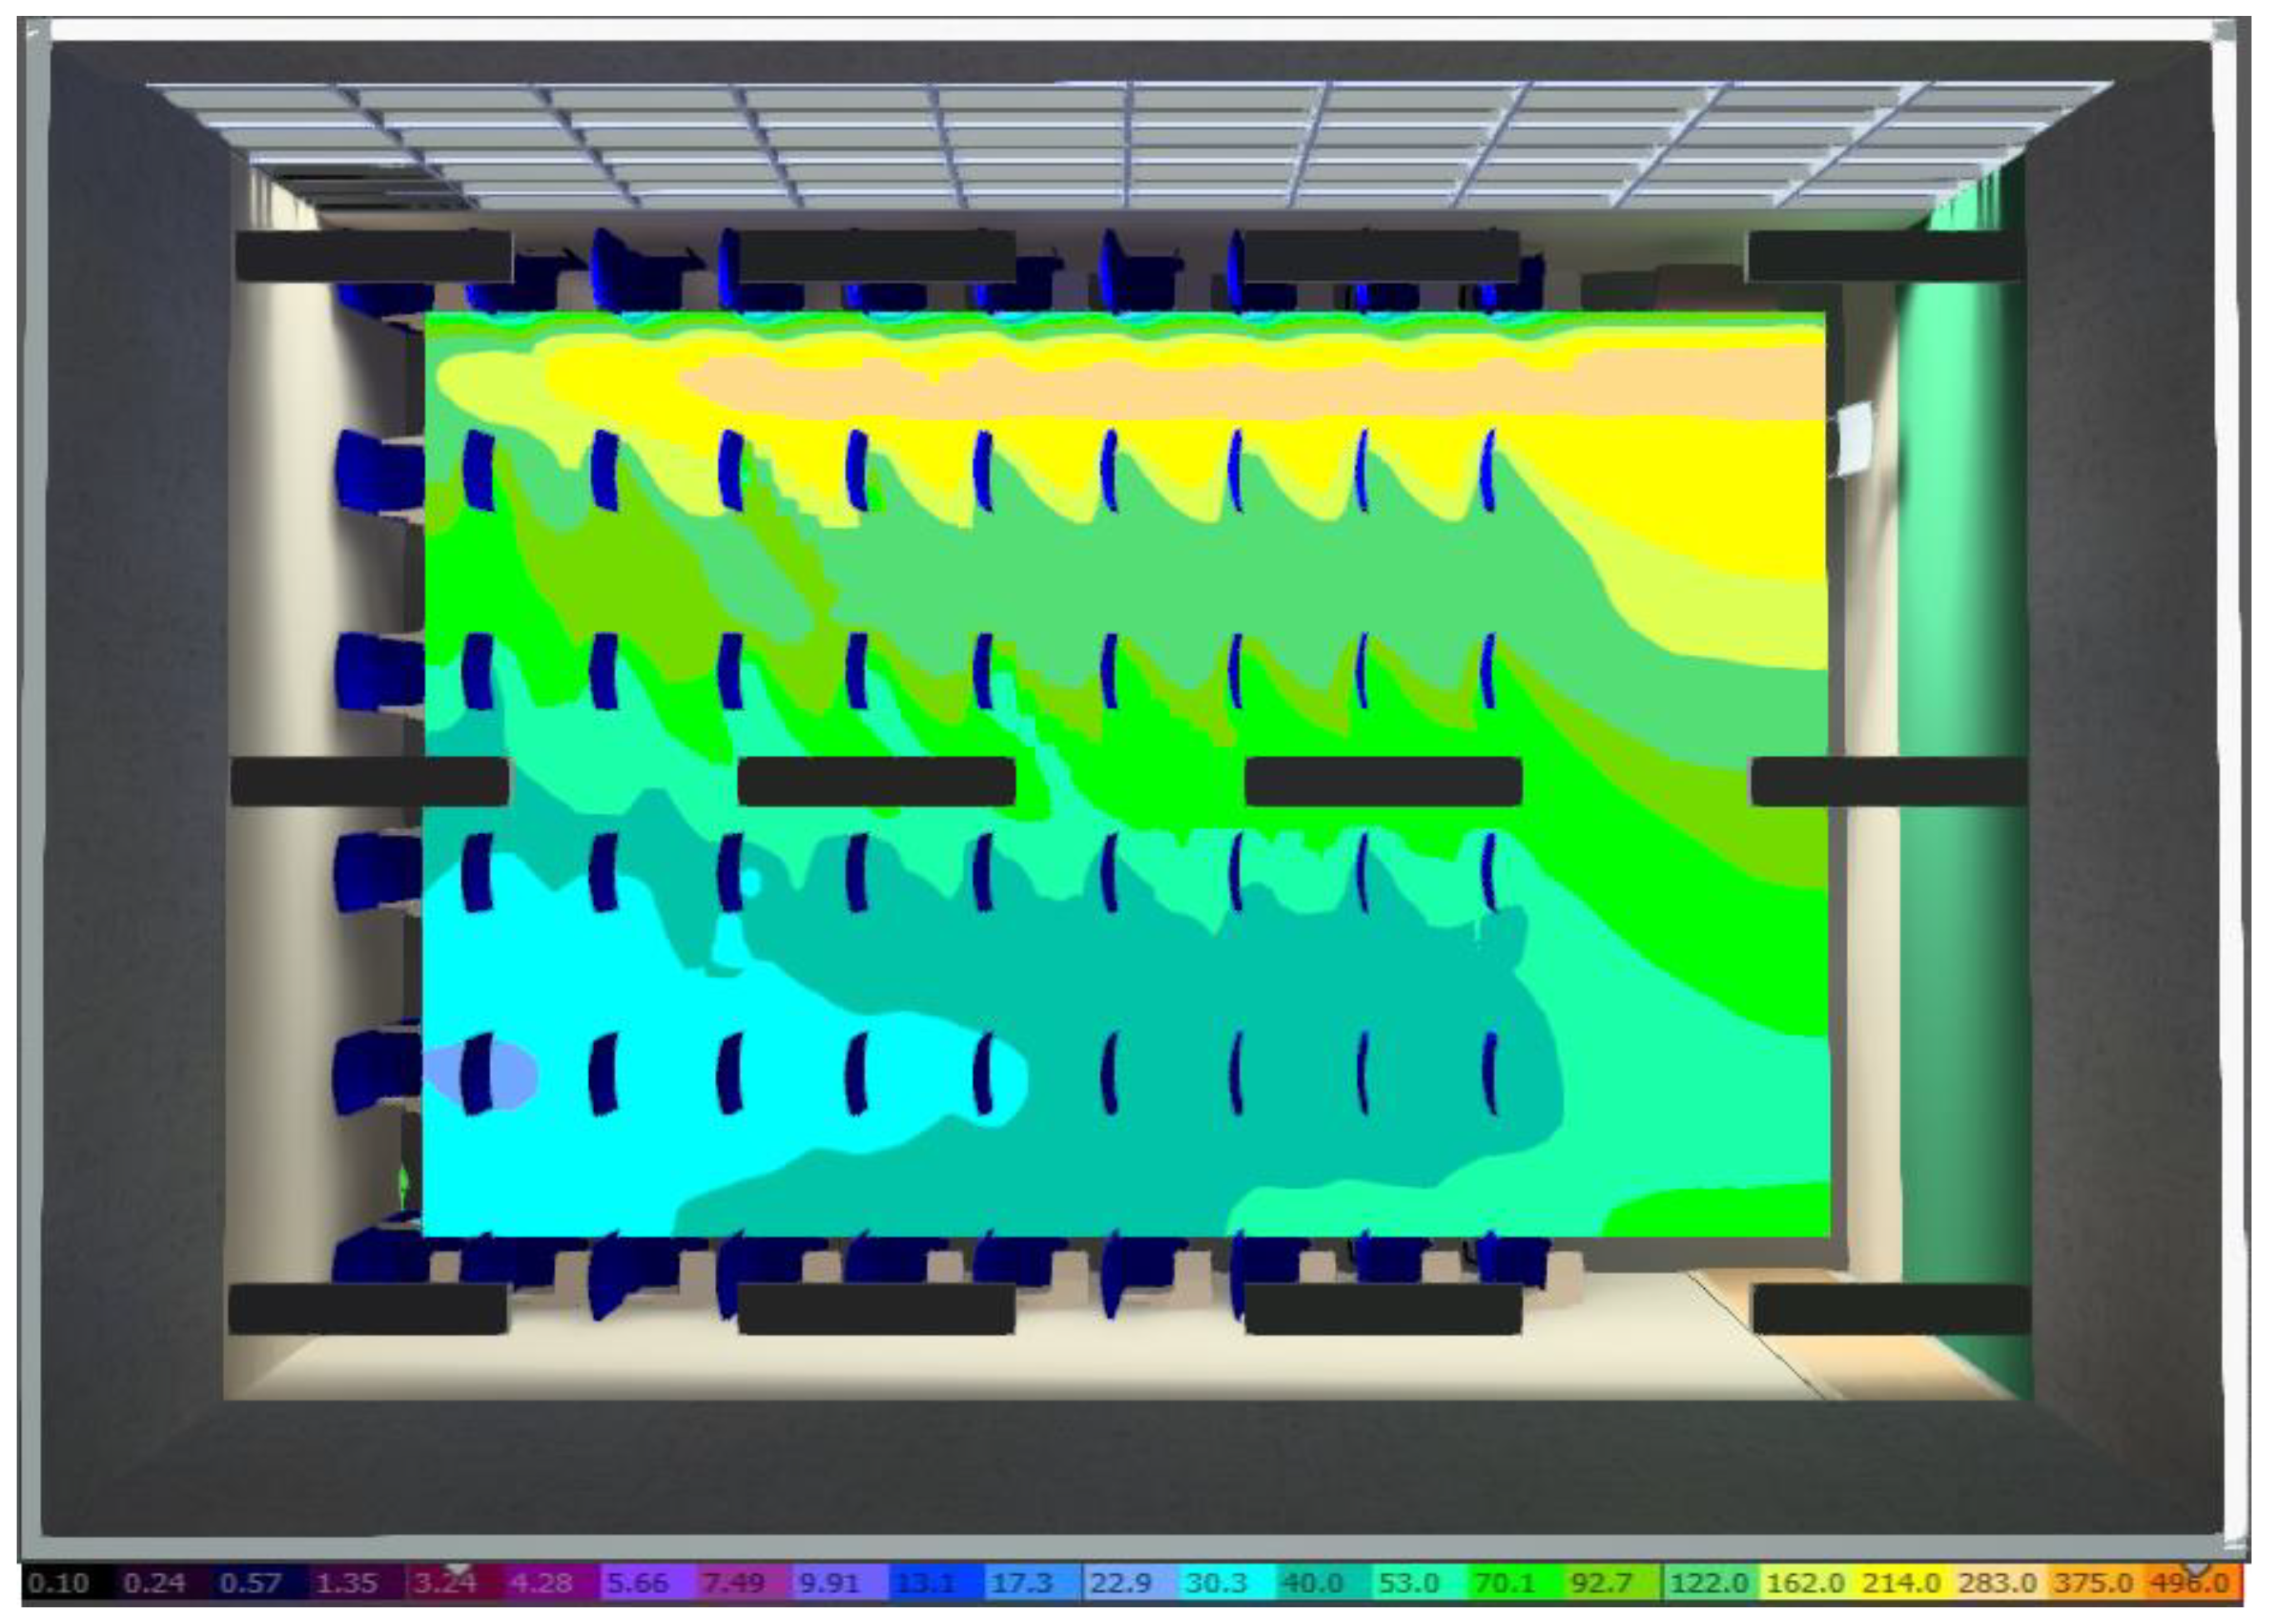
3.1. Daylight
3.2. Artificial Lighting System
4. Discussion
4.1. Integration of Artificial Lighting and Daylight
4.2. Annual Energy Consumption Savings
5. Conclusions
Author Contributions
Funding
Institutional Review Board Statement
Informed Consent Statement
Data Availability Statement
Acknowledgments
Conflicts of Interest
References
- Souza, A.; Guerra, J.C.C.; Kruger, E.L. Brazilian energy efficiency programs as agents for repositioning the electricity sector. Technol. Soc. Mag. 2011, 7, 12. [Google Scholar] [CrossRef][Green Version]
- Brazil. Law No. 10,295, of 17 October 2001. Provides for the National Policy for the Conservation and Rational Use of Energy and Other Provisions; Official Daily of the Federative Republic of Brazil: Brasília, Brazil, 2001. (In Portuguese) [Google Scholar]
- Brazil. Law No. 9,991, of 24 July 2000. Provides for Investments in Research and Development and Energy Efficiency by Concessionary, Permitting and Authorized Companies in the Electric energy Sector, and Provides Other Measures; Official Daily of the Federative Republic from Brazil: Brasília, Brazil, 2000. (In Portuguese) [Google Scholar]
- National Electric Energy Conservation Program (PROCEL). PROCEL 2022 Results, Base Year 2021. 2022. Available online: http://www.procelinfo.com.br/resultadosprocel2022/Procel_rel_2022_web.pdf (accessed on 16 February 2023). (In Portuguese).
- International Energy Agency (IEA). Capturing the Multiple Benefits of Energy Efficiency; OECD/IEA: Paris, France, 2014. [Google Scholar]
- Kazanasmaz, T. Fuzzy logic model to classify effectiveness of daylighting in an office with a movable blind system. Build. Environ. 2013, 69, 22–34. [Google Scholar] [CrossRef]
- Ouahrani, D.; Al Touma, A. Selection of slat separation-to-width ratio of brise-soleil shading considering energy savings, CO2 emissions and visual comfort—A case study in Qatar. Energy Build. 2017, 165, 440–450. [Google Scholar] [CrossRef]
- Alves Netto, A.R. Lighting of Work Environments. Part 1: Interior Improvement in the Lighting and Energy Performance of Buildings with Light Shelves. Master’s Dissertation, Federal University, São Carlos, Brazil, 2015; p. 136. (In Portuguese). [Google Scholar]
- Gago, E.J.; Muneer, T.; Knez, M.; Köster, H. Natural light controls and guides in buildings. Energy saving for electrical lighting, reduction of cooling load. Renew. Sustain. Energy Rev. 2015, 41, 1–13. [Google Scholar] [CrossRef]
- Lee, H.; Jang, H.I.; Seo, J. A preliminary study on the performance of an awning system with a built-in light shelf. Build. Environ. 2018, 131, 255–263. [Google Scholar] [CrossRef]
- Shishegar, N.; Boubekri, M. Quantifying electrical energy savings in offices through installing daylight responsive control systems in hot climates. Energy Build. 2017, 153, 87–98. [Google Scholar] [CrossRef]
- NBR ISO/CIE 8995-1; Lighting of Work Environments. Part 1: Internal, Rio de Janeiro, RJ, Brazil. Brazilian Association of Technical Standards (ABNT): Rio de Janeiro, Brazil, 2013. (In Portuguese)
- Costanzo, V.; Evola, G.; Marletta, L. A Review of Daylighting Strategies in Schools: State of the Art and Expected Future Trends. Buildings 2017, 7, 41. [Google Scholar] [CrossRef]
- Gentile, N.; Dubois, M.-C.; Laike, T. Daylight harvesting control systems design recommendations based on a literature review. In Proceedings of the 2015 IEEE 15th International Conference on Environment and Electrical Engineering, EEEIC 2015—Conference Proceedings, Rome, Italy, 10–13 June 2015. [Google Scholar] [CrossRef]
- Gentile, N.; Laike, T.; Dubois, M.C. Lighting control systems in individual offices rooms at high latitude: Measurements of electricity savings and occupants’ satisfaction. Sol. Energy 2016, 127, 113–123. [Google Scholar] [CrossRef]
- Kumar, A.; Kuppusamy, V.K.; Holuszko, M.; Song, S.; Loschiavo, A. LED lamps waste in Canada: Generation and characterization. Resour. Conserv. Recycl. 2019, 146, 329–336. [Google Scholar] [CrossRef]
- DIAL GmbH. DIALux Evo 12. 2023. Available online: https://www.dialux.com/en-GB/ (accessed on 16 February 2023).
- CIE 171: 2006; Test Cases to Assess the Accuracy of Lighting Computer Programs. Commission Internationale de L’eclairage (CIE): Vienna, Austria, 2006; p. 97.
- DIAL GmbH. DIALux Evo—New Calculation Method. 2016. Available online: https://evo.support-en.dial.de/helpdesk/attachments/9005542781 (accessed on 16 February 2023).
- Acosta, I.; Muñoz, C.; Esquivias, P.; Moreno, D.; Navarro, J. Analysis of the accuracy of the sky component calculation in daylighting simulation programs. Sol. Energy 2015, 119, 54–67. [Google Scholar] [CrossRef]
- Salata, F.; Golasi, I.; di Salvatore, M.; Vollaro, A. Energy and reliability optimization of a system that combines daylighting and artificial sources. A case study carried out in academic buildings. Appl. Energy 2016, 169, 250–266. [Google Scholar] [CrossRef]
- United Nations (UN). The Sustainable Development Goals Report 2023. Available online: https://www.un.org/sustainabledevelopment/energy/ (accessed on 12 December 2023).
- BS EN 15192-1:2017+A1:2021; Energy Performance of Buildings. Energy Requirements for Lighting. Specifications, Module 9. British Standards Institution (BSI): London, UK, 2021.


| Simulation | Luminaire Power Plum (W) | Quantity of Luminaires | Mounting Height of Luminaires hmount (m) | Uniformity at Work Plan U | Lighting Power Density LPD (W/m2) | Luminous Performance (lm/W) |
|---|---|---|---|---|---|---|
| Existing lighting arrangement | 71 | 12 | 3.10 | 0.64 | 12.79 | 65.0 |
| Luminaire | Dimension (L × W × H) in m | Power (Including LED Driver) (W) | Luminous Flux (lm) | Luminous Performance (lm/W) | |
|---|---|---|---|---|---|
| Manufacturer I | A | 1.676 × 0.060 × 0.090 | 28 | 2385 | 85.2 |
| B | 1.119 × 0.060 × 0.090 | 37 | 3180 | 85.9 | |
| C | 1.676 × 0.060 × 0.090 | 56 | 4770 | 85.2 | |
| Manufacturer II | D | 1.340 × 0.240 × 0.049 | 30 | 3500 | 116.7 |
| E | 1.332 × 0.232 × 0.100 | 33 | 4000 | 121.2 | |
| F | 1.340 × 0.240 × 0.049 | 35 | 4100 | 117.1 |
| Luminaire | Plum (W) | Quantity of Luminaires | hmount (m) | Uniformity at Work Plan U | LPD (W/m2) | |
|---|---|---|---|---|---|---|
| Manufacturer I | 2.40 | 0.58 | ||||
| A | 28 | 20 | 2.60 | 0.63 | 8.40 | |
| 2.80 | 0.66 | |||||
| 2.40 | 0.51 | |||||
| B | 37 | 16 | 2.60 | 0.55 | 8.88 | |
| 2.80 | 0.57 | |||||
| 2.40 | 0.57 | |||||
| C | 56 | 12 | 2.60 | 0.60 | 10.08 | |
| 2.80 | 0.60 | |||||
| Manufacturer II | 2.40 | 0.53 | ||||
| D | 30 | 12 | 2.60 | 0.59 | 5.40 | |
| 2.80 | 0.76 | |||||
| 2.40 | 0.57 | |||||
| E | 33 | 12 | 2.60 | 0.75 | 5.94 | |
| 2.80 | 0.74 | |||||
| 2.40 | 0.57 | |||||
| F | 35 | 12 | 2.60 | 0.76 | 6.30 | |
| 2.80 | 0.76 |
| Daytime | Switch 1 | Switch 2 | Switch 3 | Operation Time (%) |
|---|---|---|---|---|
| 08:00 a.m. to 09:00 a.m. | ON | ON | ON | 100 |
| 09:00 a.m. to 12:00 p.m. | ON | ON | OFF | 67 |
| 12:00 p.m. to 02:00 p.m. | OFF | OFF | OFF | 0 |
| 02:00 p.m. to 03:00 p.m. | ON | OFF | OFF | 33 |
| 03:00 p.m. to 06:00 p.m. | ON | ON | ON | 100 |
| 06:00 p.m. onwards | ON | ON | ON | 100 |
| Classroom Lighting Conditions | Luminaries’ Power (W) | Reduction in Power (%) | Quantity (Units) | Use Time (Hours/Year) | Electricity Consumption (kWh/Year) | Estimated Annual Energy Savings (%) |
|---|---|---|---|---|---|---|
| I—Existing arrangement | 71 | 0 | 12 | 1760 | 1499.52 | 0 |
| II—Improved arrangement with LED luminaires | 30 | 58 | 12 | 1760 | 633.60 | 58 |
| III—Optimized arrangement with users operating the luminaries’ switches | 30 | 58 | 12 | 1470 | 529.20 | 65 |
Disclaimer/Publisher’s Note: The statements, opinions and data contained in all publications are solely those of the individual author(s) and contributor(s) and not of MDPI and/or the editor(s). MDPI and/or the editor(s) disclaim responsibility for any injury to people or property resulting from any ideas, methods, instructions or products referred to in the content. |
© 2024 by the authors. Licensee MDPI, Basel, Switzerland. This article is an open access article distributed under the terms and conditions of the Creative Commons Attribution (CC BY) license (https://creativecommons.org/licenses/by/4.0/).
Share and Cite
Miranda, D.T.; Barreto, D.; Flores-Colen, I. An Evaluation of the Luminous Performance of a School Environment Integrating Artificial Lighting and Daylight. Sustainability 2024, 16, 1426. https://doi.org/10.3390/su16041426
Miranda DT, Barreto D, Flores-Colen I. An Evaluation of the Luminous Performance of a School Environment Integrating Artificial Lighting and Daylight. Sustainability. 2024; 16(4):1426. https://doi.org/10.3390/su16041426
Chicago/Turabian StyleMiranda, Débora Thomé, Douglas Barreto, and Inês Flores-Colen. 2024. "An Evaluation of the Luminous Performance of a School Environment Integrating Artificial Lighting and Daylight" Sustainability 16, no. 4: 1426. https://doi.org/10.3390/su16041426
APA StyleMiranda, D. T., Barreto, D., & Flores-Colen, I. (2024). An Evaluation of the Luminous Performance of a School Environment Integrating Artificial Lighting and Daylight. Sustainability, 16(4), 1426. https://doi.org/10.3390/su16041426