1. Introduction
Owing to the increasing demand for transportation efficiency, bridge construction has entered a period of spurts, resulting in more than 870,000 highway bridges being built in China [
1,
2]. Cable-supported bridges, mainly consisting of cable-stayed bridges and suspension bridges, only account for about 1.5% of the total number of bridges while being employed as an effective structural form for large-span requirements and complex environments [
3,
4,
5]. By optimizing the material properties of cables [
6] and increasing the accuracy of numerically simulating their behavior [
7,
8], the introduction of cables in bridges significantly improves their applicable span.
At the end of the last century, researchers built a simplified theory for the dynamic performance of cable-supported bridges under the interaction of axial and bending deformations [
9]. Furthermore, the previous studies also provided design suggestions for tower shapes, anchor locations, and deck cross-sections [
10]. The mechanical performance, including vibration modes and natural frequencies of the complicated cable-supported bridges, was mainly obtained using nonlinear finite element (FE) analysis based on the cable element and its stiffness matrix [
7,
11,
12,
13,
14,
15]. With expressive FE models, a great deal of analyses were conducted for the cable-stayed and suspension bridges under statistical vehicle loads [
16], earthquakes [
17], typhoons [
18,
19], and even fire risks [
20]. However, the accuracy of FE models needs to be verified, and the strength degradation for the structures was not taken into consideration in part of the previously constructed bridges. So far, the longest-serving cable-stayed bridge has been in service for more than 70 years [
21], and it will be quite a threat to the public if the engineers do not understand its present state.
For both concerns, the concept of structural health monitoring (SHM) was introduced [
22]. In a SHM system, different types of sensors, including accelerometers, strain gauges, wind speed transducers, and thermometers, are placed on the target structure (bridge) to collect structural response signals. Cunha et al. [
23] employed this system on the Vasco da Gama Bridge for short-term monitoring, which performed more like a dynamic test. According to the obtained data, Fourier fast transformation (FFT) was used to identify the vibration parameters. Many groups of researchers took a similar exploring strategy to determine the dynamic properties under constant or varying temperature conditions for many representative bridge examples (e.g., the Tsing Ma Bridge [
24], Qingzhou Bridge [
25], and Commodore Barry Bridge [
26]) in the previous several decades.
As data collection, transmission, and storage technologies mature, SHM systems are capable of conducting long-term monitoring, during which the historic sequences of both environment and response will be reserved. The potential damage and real-time status changes, which are the original goals of introducing the SHM system, can only be detected via the comparison analysis among those time series. Additionally, innovative sensors also enable the improvement of state assessment by measuring supplementary information. For example, cables, which are crucial components in load transmission, are inspected by monitoring their tensions using the fiber Bragg grating (FBG) method and acoustic emission technology (AET) [
27,
28,
29]. Additionally, for the high possibility of cracks occurring in decks and connectors, some computer vision (CV)-based methods were adopted with unmanned aerial vehicles (UAVs) figure capture technology for automatic detection [
30,
31,
32].
Multimodal data (e.g., acceleration over time, strain field, and photos) with increasing quantity and separate processing methods are involved in the SHM system, leading to more emphasis being paid to the detailed problems. However, a systematic and general evaluation method with quantitative criteria for each monitoring item is even more important. Data from different sources can be united and simultaneously analyzed with mutual influences in this system to provide a macro status assessment for the target cable bridge. There are several standards (JTG H11-2004 [
33] and AASHTO MBE [
34]) trying to realize this idea both in China and America. They include condition rating, appraisal rating, sufficiency rating, and load rating as the evaluating content for all existing bridges. A complete and reliable state assessment of regular bridges can be acquired through these standards, while incomplete coverage of performances of cable-supported bridges can be discovered due to their complex surrounding environment and inner structure.
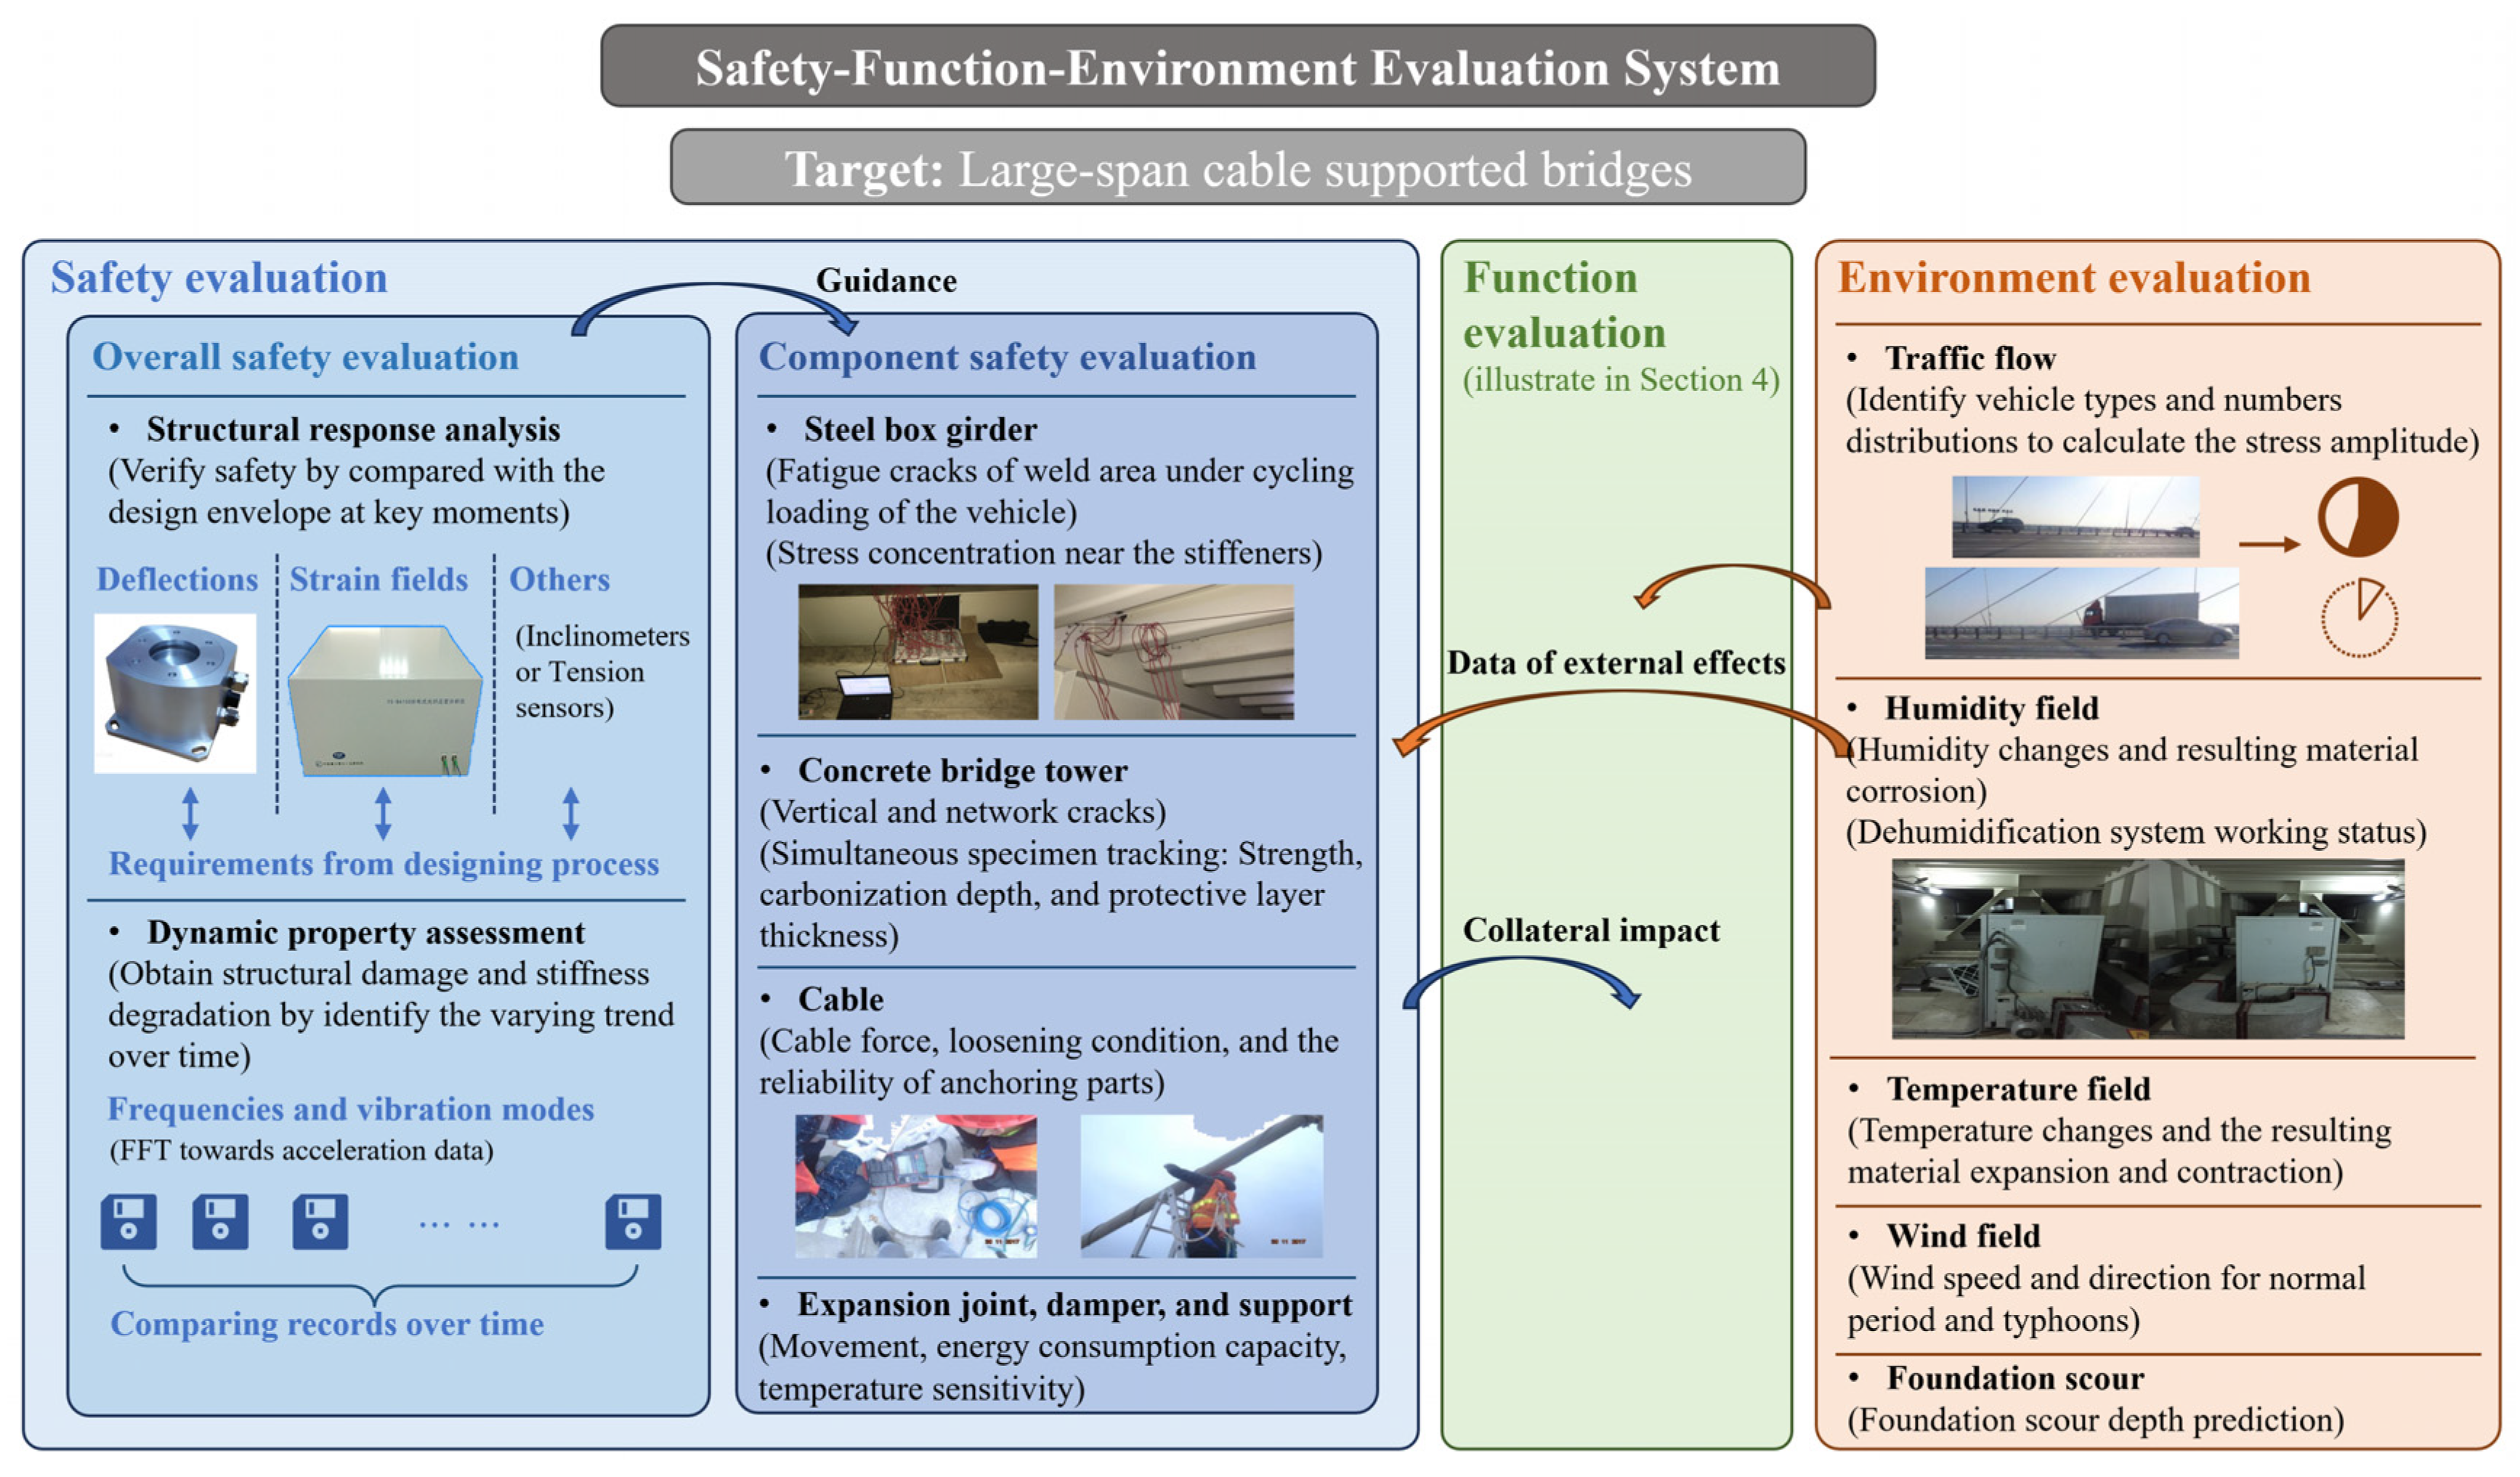
In this study, a general safety–function–environment evaluation system is proposed for cable-supported bridges. The SHM systems and state evaluation process guided by this general method not only produce comprehensive results for the target bridges but can also be transferred to other similar structures with fine-tuning, especially some data-driven models in the evaluation algorithms. The evaluation items are selected based on demand analysis and listed in
Section 2, together with the system architecture.
Section 3 details the practical example bridges with SHM systems (Sutong Bridge, Jiashao Bridge, and Runyang Bridge). There are three main components of the system: safety evaluation, functional evaluation, and environmental evaluation. They are discussed based on data evaluation results in
Section 4. In each subsection, the model settings, data processing, and information-extracting methods are introduced. Conclusions are drawn in
Section 5.
3. Case Studies and SHM Systems for Cable-Supported Bridges
The authors developed SHM systems on cable-supported bridges for comprehensive evaluation using the measured data. A non-permanent SHM system on the Sutong Bridge and a paired long-term SHM system for the other two bridges on the same highway are chosen as examples to illustrate the proposed evaluation system.
The Sutong Bridge (STB), a highway bridge, is located in the Nantong section of the Yangtze River Estuary in southeastern Jiangsu Province, connecting Suzhou and Nantong. It consists of the cross-river main bridge (steel box girder cable-stayed bridge, 2088 m) and southern and northern approach bridges (prestressed concrete continuous girder bridge, 3485 m and 2462 m, respectively). The main bridge adopts two-way six lanes along the entire line. The calculated driving speed is set as 100 km/h. The clear navigation height under the main bridge is 62 m, and the width is 891 m. The main span of the main bridge employs a double-tower and double-cable plane layout, with a span of 1088 m. The side spans are symmetrical, with spans of 100 m, 100 m, and 300 m, respectively. The deployed SHM system is mainly aimed at the main bridge of the STB, as shown in
Figure 2. Distributed fiber optic strain measurement is selected as the basis for judging the structural status. Two optical fibers are arranged longitudinally along the bridge on the upper surface of the steel box girder bottom flange, while two more optical fibers are laid loosely in parallel and in series connection with others at their ends for temperature compensation. A strain analysis device developed based on the Brillouin optical time domain analysis (BOTDA) is used to transform optical shift signals into strain signals. The sampling rate is once every 30 min. Also, the connecting pipe method is employed to realize the displacement measurement by calculating the change in hydraulic pressure or water level. The measuring points placement is also shown in
Figure 2.
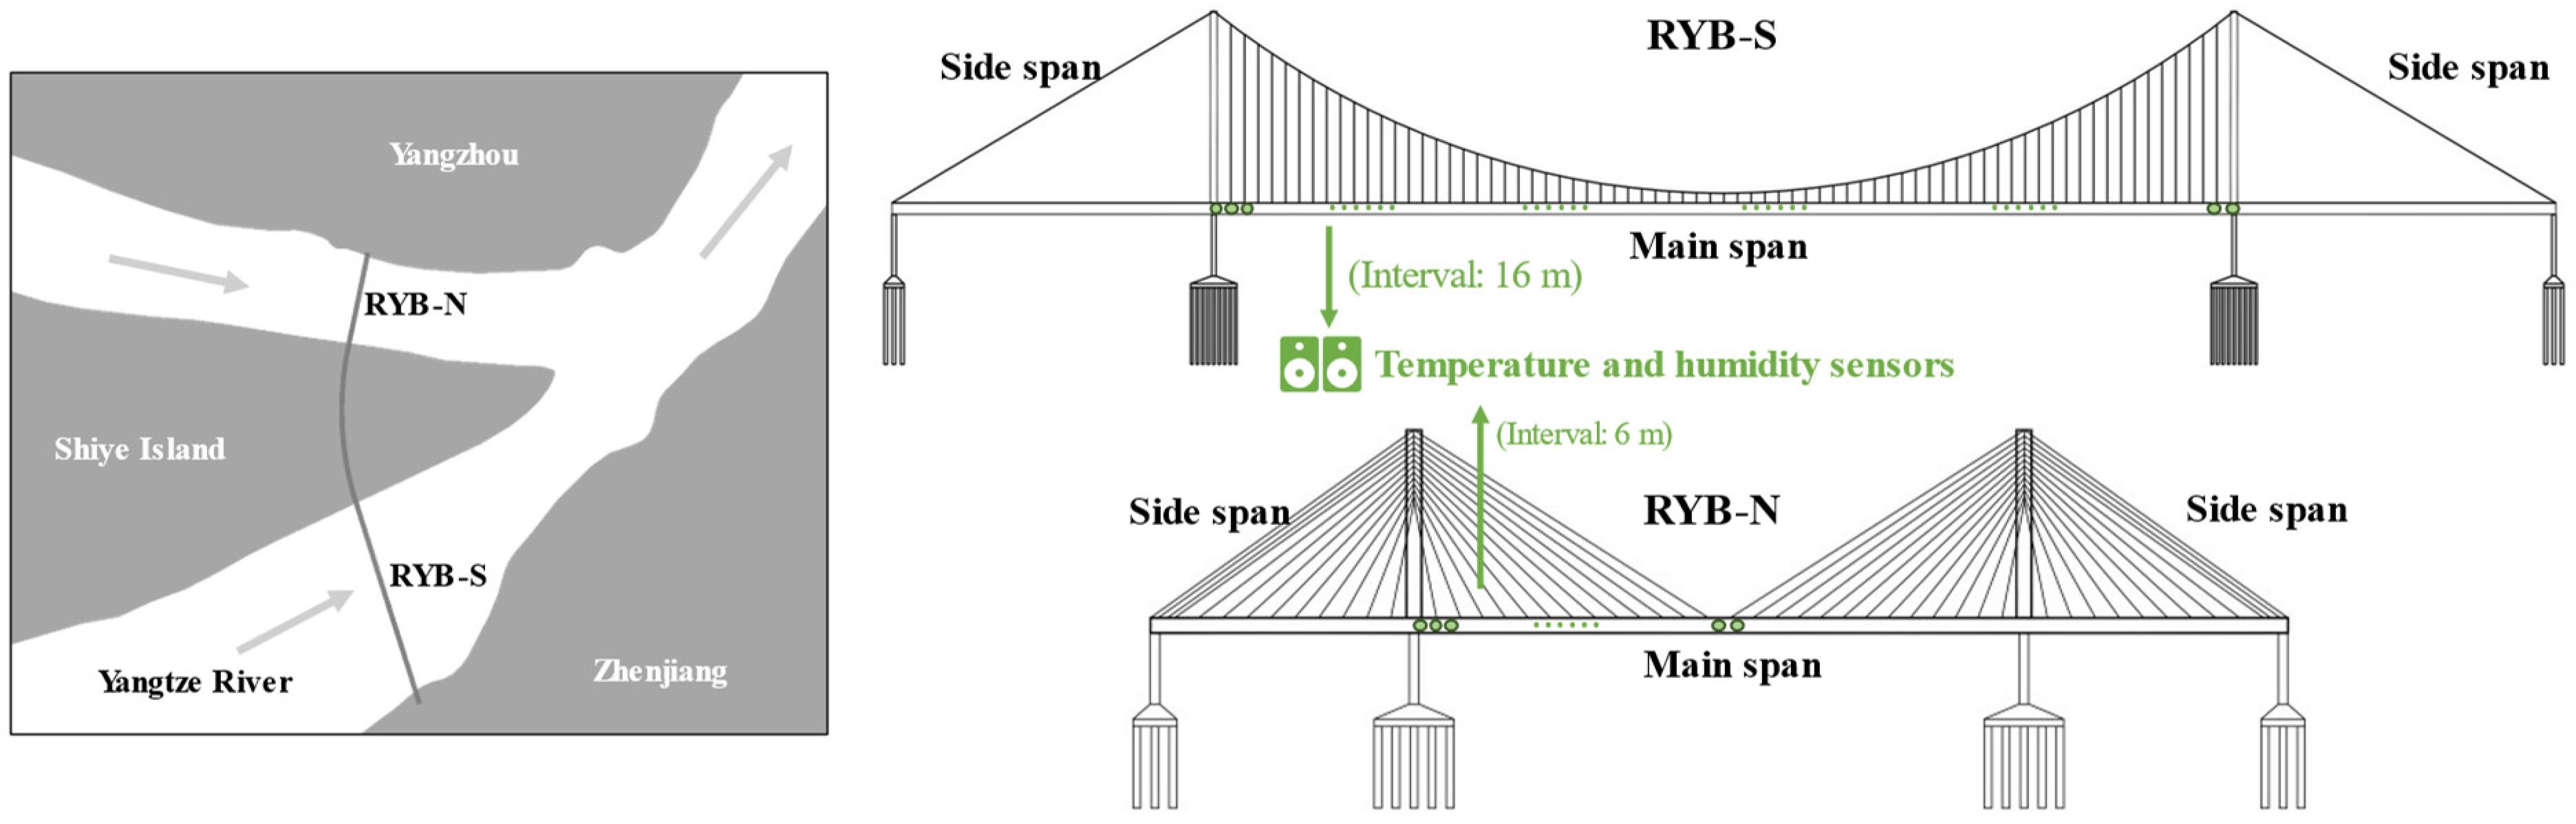
The Runyang Bridge (RYB) is a composite bridge composed of the south branch suspension bridge (RYB-S), the north branch cable-stayed bridge (RYB-N), and related approach bridges connecting Zhenjiang and Yangzhou. RYB-S and RYB-N are connected by a viaduct on Shiye Island in the Yangtze River. The main spans of RYB-S and RYB-N are 1490 m and 406 m, respectively, while the side spans are 470 m and 175.4 m, respectively. Both RYB-S and RYB-N adopt two-way six lanes with the calculated driving speed being 100 km/h. The two cable-supported bridges in the RYB have been built for 20 years. Although the SHM system was not deployed in the early stage, as an important project, we also ensured an annual dynamic property evaluation. And recently, an environmental monitoring system was installed to the RYB, including the temperature and humidity sensors, as shown in
Figure 3. The temperature sensor measurement range is −30 °C to 60 °C, the resolution is 0.1 °C, and the sampling rate is once every 15 min. The humidity sensor uses the same sampling frequency, with a measurement range of 20% to 90% and an accuracy of 0.1%.
4. Results
4.1. Structural Safety Evaluation
Safety evaluation is divided into two levels, that is, the evaluation of discrete components and the evaluation of the whole structure. The data processing and evaluation methods for the representative monitoring items are illustrated in this subsection with practical SHM projects of cable-supported bridges.
4.1.1. Overall Safety Evaluation
Safety evaluation for the whole bridge mainly consists of two items: the comparison analysis between the structural response and design threshold and the degradation of the stiffness. In this study, we select the strain distribution of the girder and the displacement of key points as the representative of structural response, while the first five natural frequencies are used to indicate the damage and degradation of the cable-supported bridges.
We sample the deflection of each key section of the bridge at certain time intervals and obtain its distribution. The displacements of the measuring points on the STB main bridge are shown in
Figure 4, together with the corresponding envelope which is determined using the FE model during the design process. By comparing the displacement distribution within one month (max displacement amplitude: 0.5 m), it can be seen that the deflection of the STB main bridge does not exceed the limit (only accounts for about 29%). The shape of the line connecting the maximum value of the bridge vibration is basically consistent with the envelope, which shows that the bridge is deforming according to the designed mechanical mechanism. Only the displacement at the main span tower occasionally surpasses the design value. The reason may be that the complex connection at the joint of the tower and girder makes the sensor installing location not have a stiffness as high as assumed in the simulation model. In addition, the displacement fluctuation condition of the side spans shows a certain degree of asymmetry, guiding us to carry out the component safety assessment described in
Section 4.1.2 at the corresponding locations.
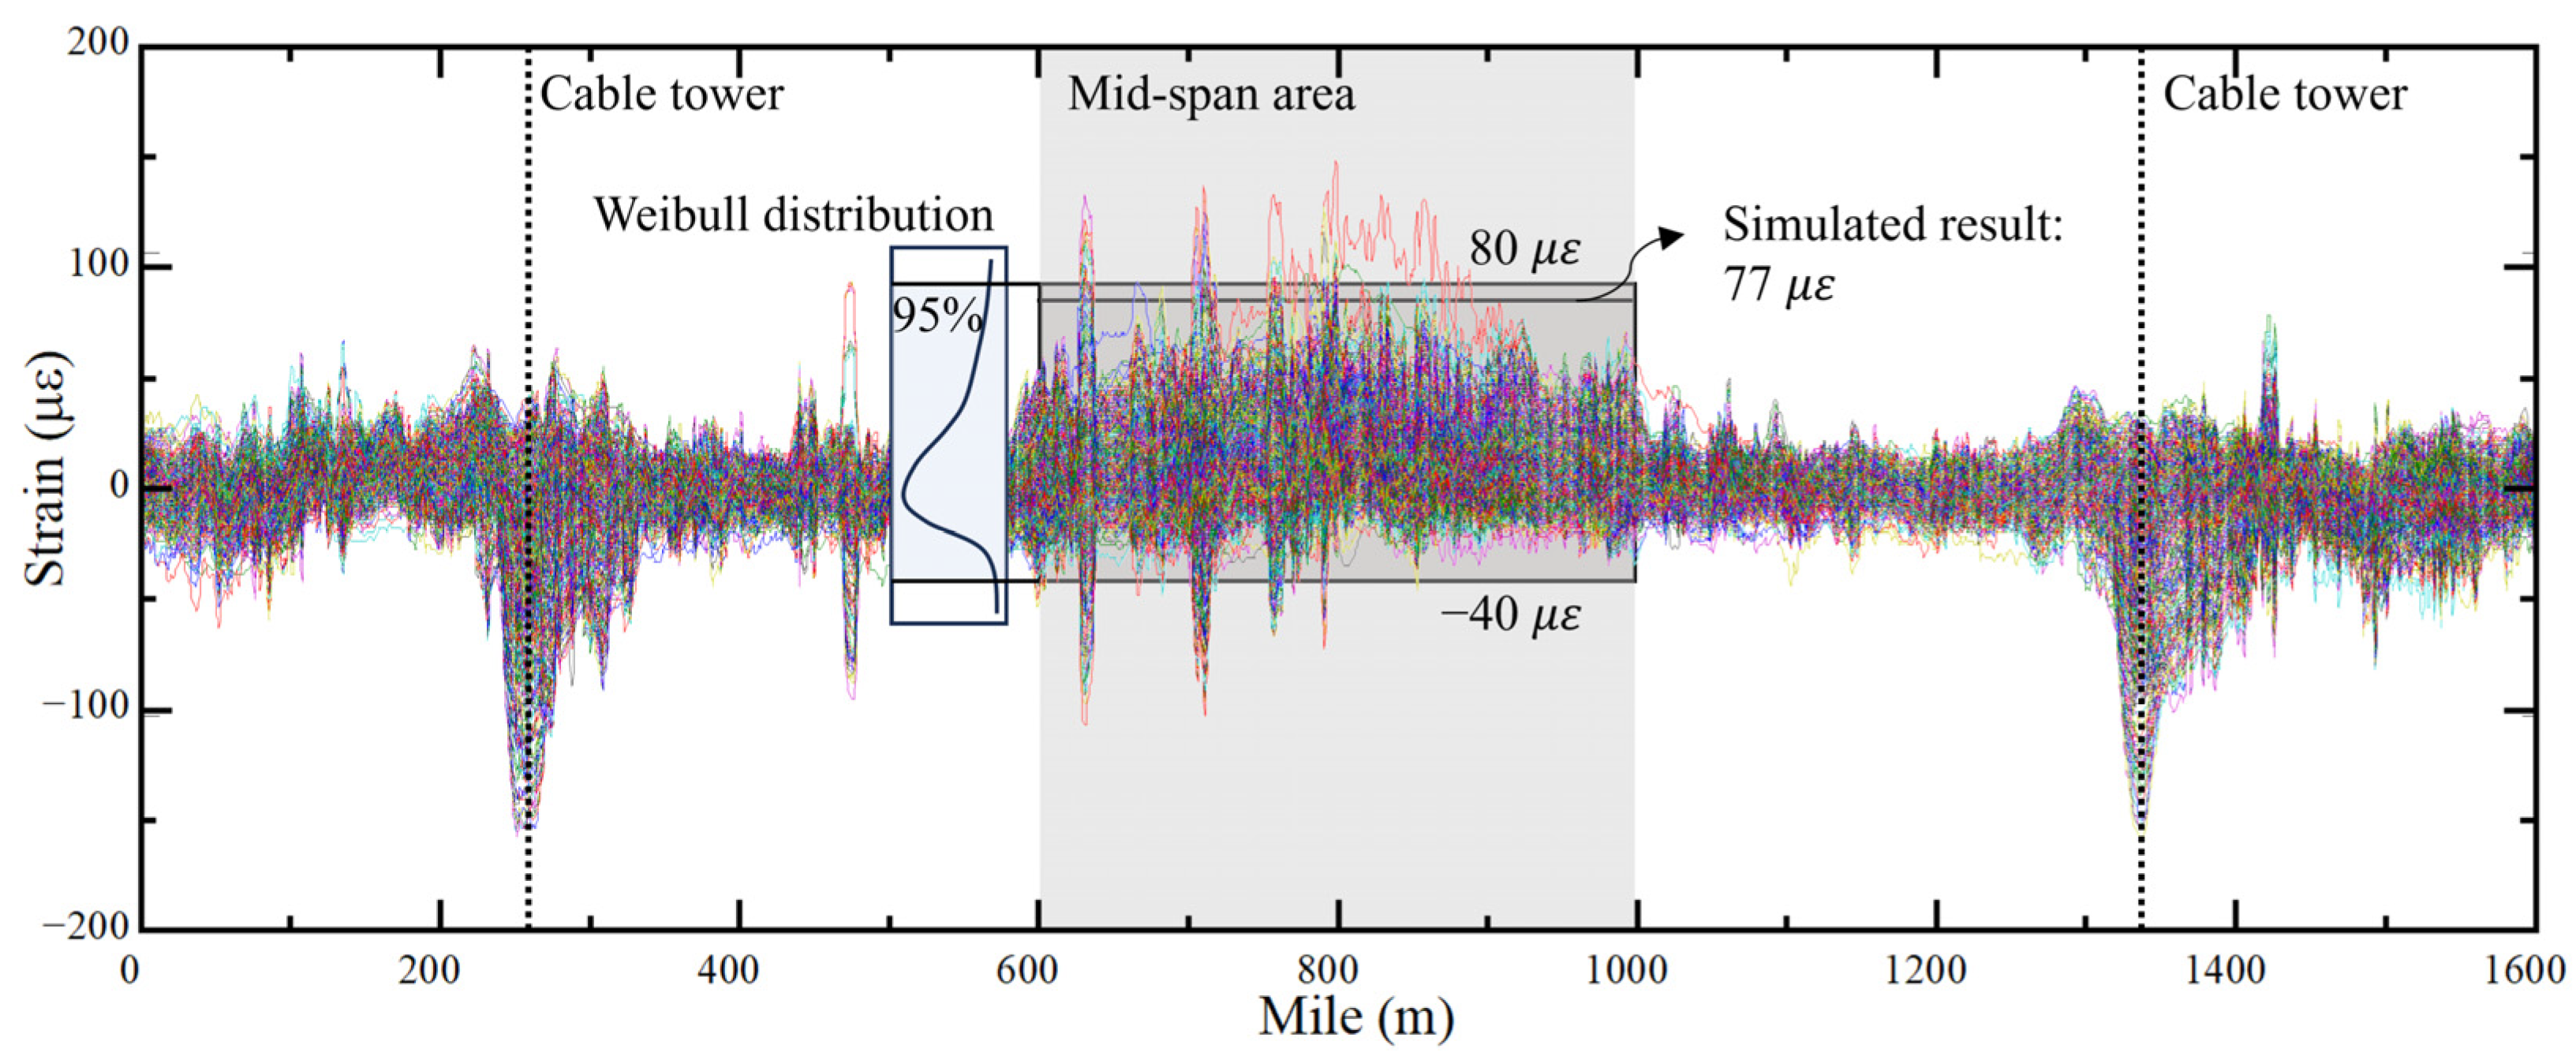
On the other hand, the strain curves of a total of 720 field samplings and the results (95th percentiles) of simulations ten times under random traffic flow loading are shown in
Figure 5. Statistical analysis is performed on the strain data at the mid-span of the main span, and the parameters fitted according to the Weibull distribution are obtained, which are also listed in
Figure 5. Obviously, the monitoring data agrees with the results of the theoretical calculation. Compared with the design limit, the STB in daily work conditions will only use about 24.1% of the safety reserve (compared to the allowable stress calculated using Young’s modulus of 206,000 MPa), which also matches the result acquired in the displacement analysis. Furthermore, two spikes can always be observed in the measured data at the locations of bridge towers, which indicates the potential stress concentrations beyond expectation. The local evaluation and detection for abnormality reasons should be conducted at these locations, as introduced in
Section 4.1.2.
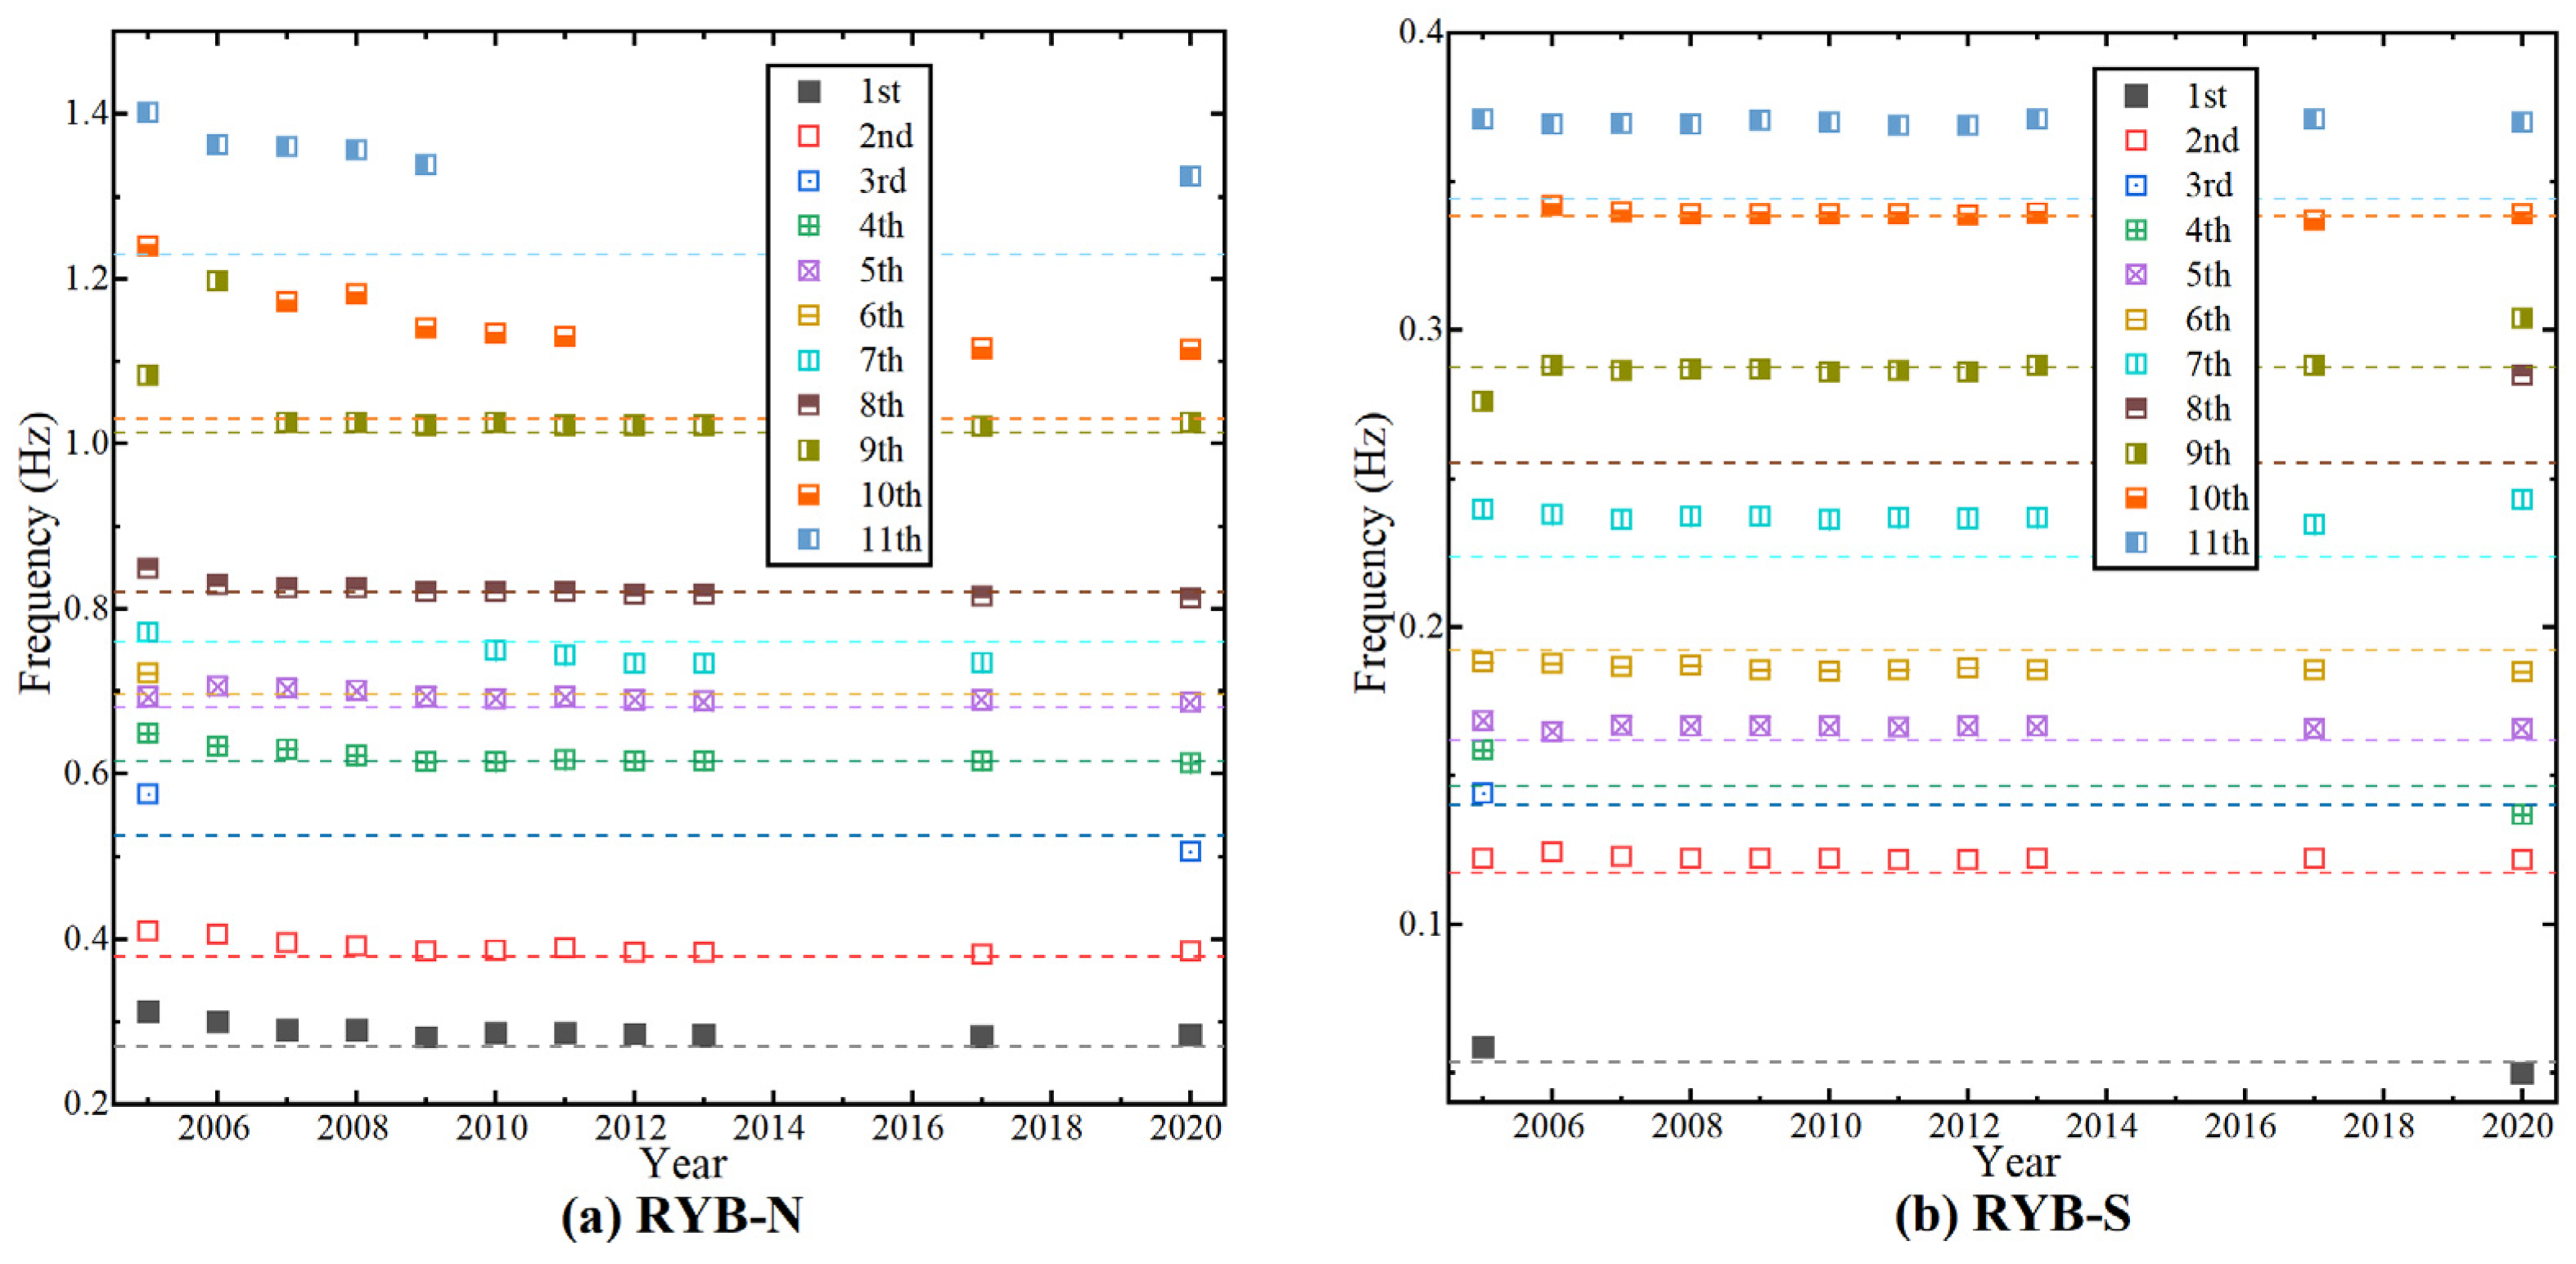
Disruptively obtaining the structural responses (deflection and strain) within a period of time at a large time interval and performing statistical analysis on them is an efficient and rapid method to obtain whether the structural vibration meets the safety requirement. However, this will inevitably lead to a lack of dynamic information. Additionally, this evaluation method is highly random because it is affected by actual load conditions and is insensitive to long-term and slowly developing structural degradation. Therefore, the dynamic parameters of the structure obtained using FFT, which represents the real-time stiffness, should also be taken into consideration. Specifically, a decrease in frequency indicates overall stiffness degradation, while a nearly flat frequency but modes change indicates possible local damage. We summarize the dynamic characteristic experiments of RYB-S and RYB-N from 2005 to 2020 and obtain the changes in the natural vibration frequencies of the two bridges, as shown in
Figure 6.
First, it can be found that the measured initial natural frequencies of the two bridges are generally higher than the theoretical values (shown by the dotted line), which is mainly caused by the material parameters being higher than the design values and structural redundancy. During these 15 years, the frequencies of each order of the two bridges have an attenuation trend, which is caused by normal structural aging. However, compared to RYB-S, which has negligible degradation, the stiffness degradation of RYB-N is almost unacceptable for the cable-stayed bridge. Then, we can infer that there is relatively serious damage to the structure (damage to a large number of components or damage to major components), which will be verified in the component safety evaluation.
4.1.2. Component Safety Evaluation
The main evaluation objects are stay cables (e.g., structural appearance, corrosion damage hotspots, cable force evolution rules, high-order vortex vibration modes, and rain vibrations) and steel box girders (e.g., durability performance, structural stiffness, fatigue cracks development, and local stability of component plates). Therefore, the component performance evaluation of cable-supported bridges is similar to a physical examination of the complex human body, and multiple indicators are usually used for special control. Previous studies set reasonable threshold intervals for each indicator, which can effectively control the performance of the cable-supported bridge system.
Furthermore, the evaluation should also be conducted following the guidance of the overall safety evaluation results. For example, for the abnormal stress-concentration area in the STB discovered in
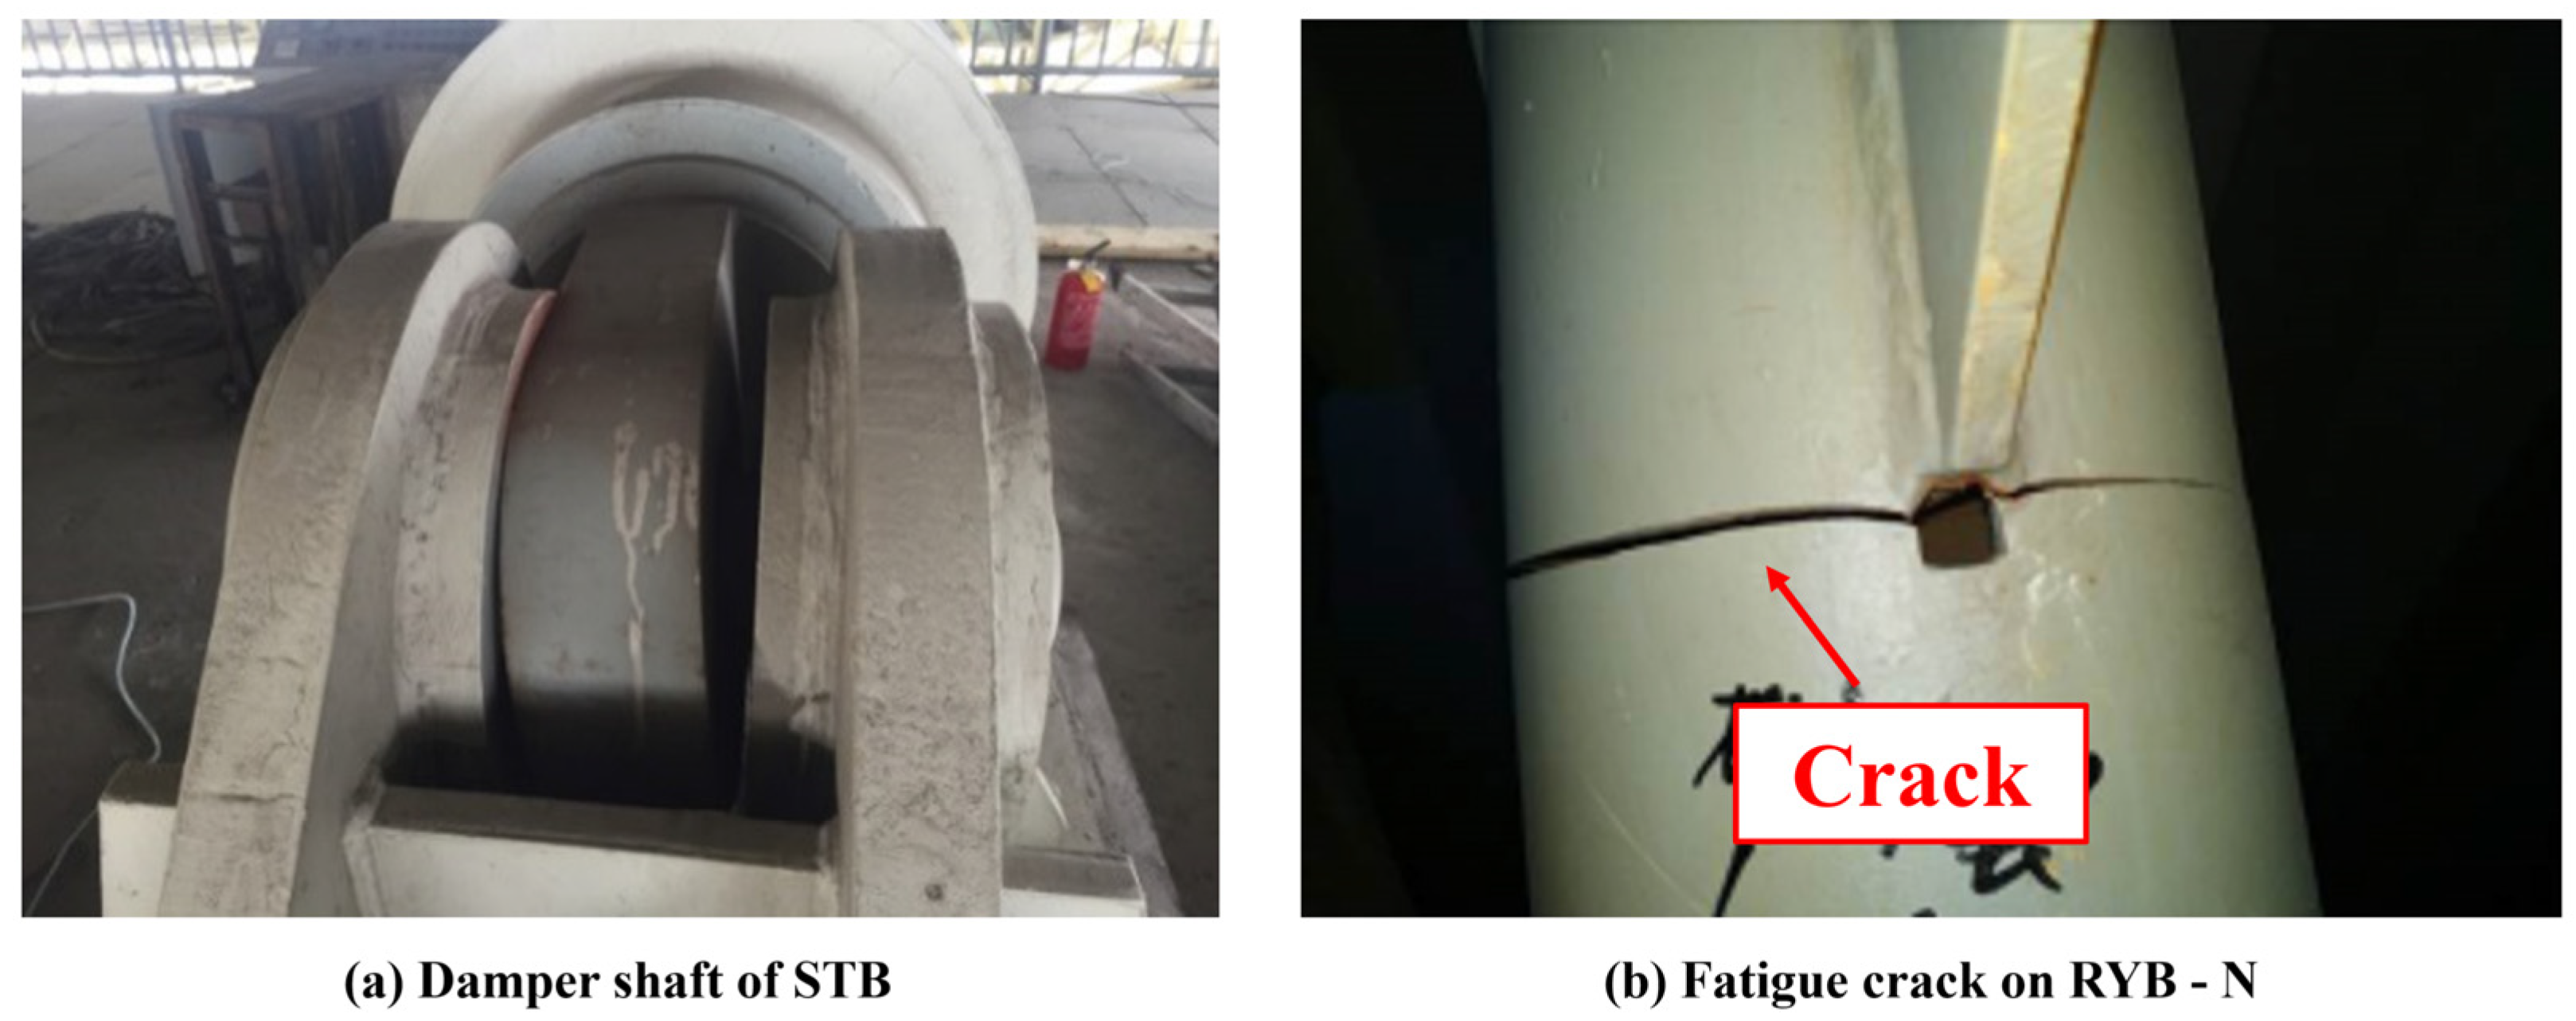
Figure 5, we carry out special testing. The limit of the damper shaft provides an excess support reaction force to the bottom of the main beam, as shown in
Figure 7a. The reaction force generated by the damper acts basically uniformly on the girder, causing abnormal protrusions to be collected from multiple optical fibers laid in parallel. Based on the analysis of the natural vibration frequencies and modal changes of each order of RYB-N, structural damage on the longitudinal diaphragm inside the steel box girder is located. After inspection, a large number of fatigue cracks appeared on it (see
Figure 7b). Especially for the location near the stiffener, a large number of fractures due to stress concentration occurred in about 89% of the truss-type longitudinal diaphragms. The contribution of the truss-type longitudinal diaphragm plate to the shear stiffness of the main beam is basically lost, resulting in a decline of about 5% to 10% in the overall stiffness of the bridge.
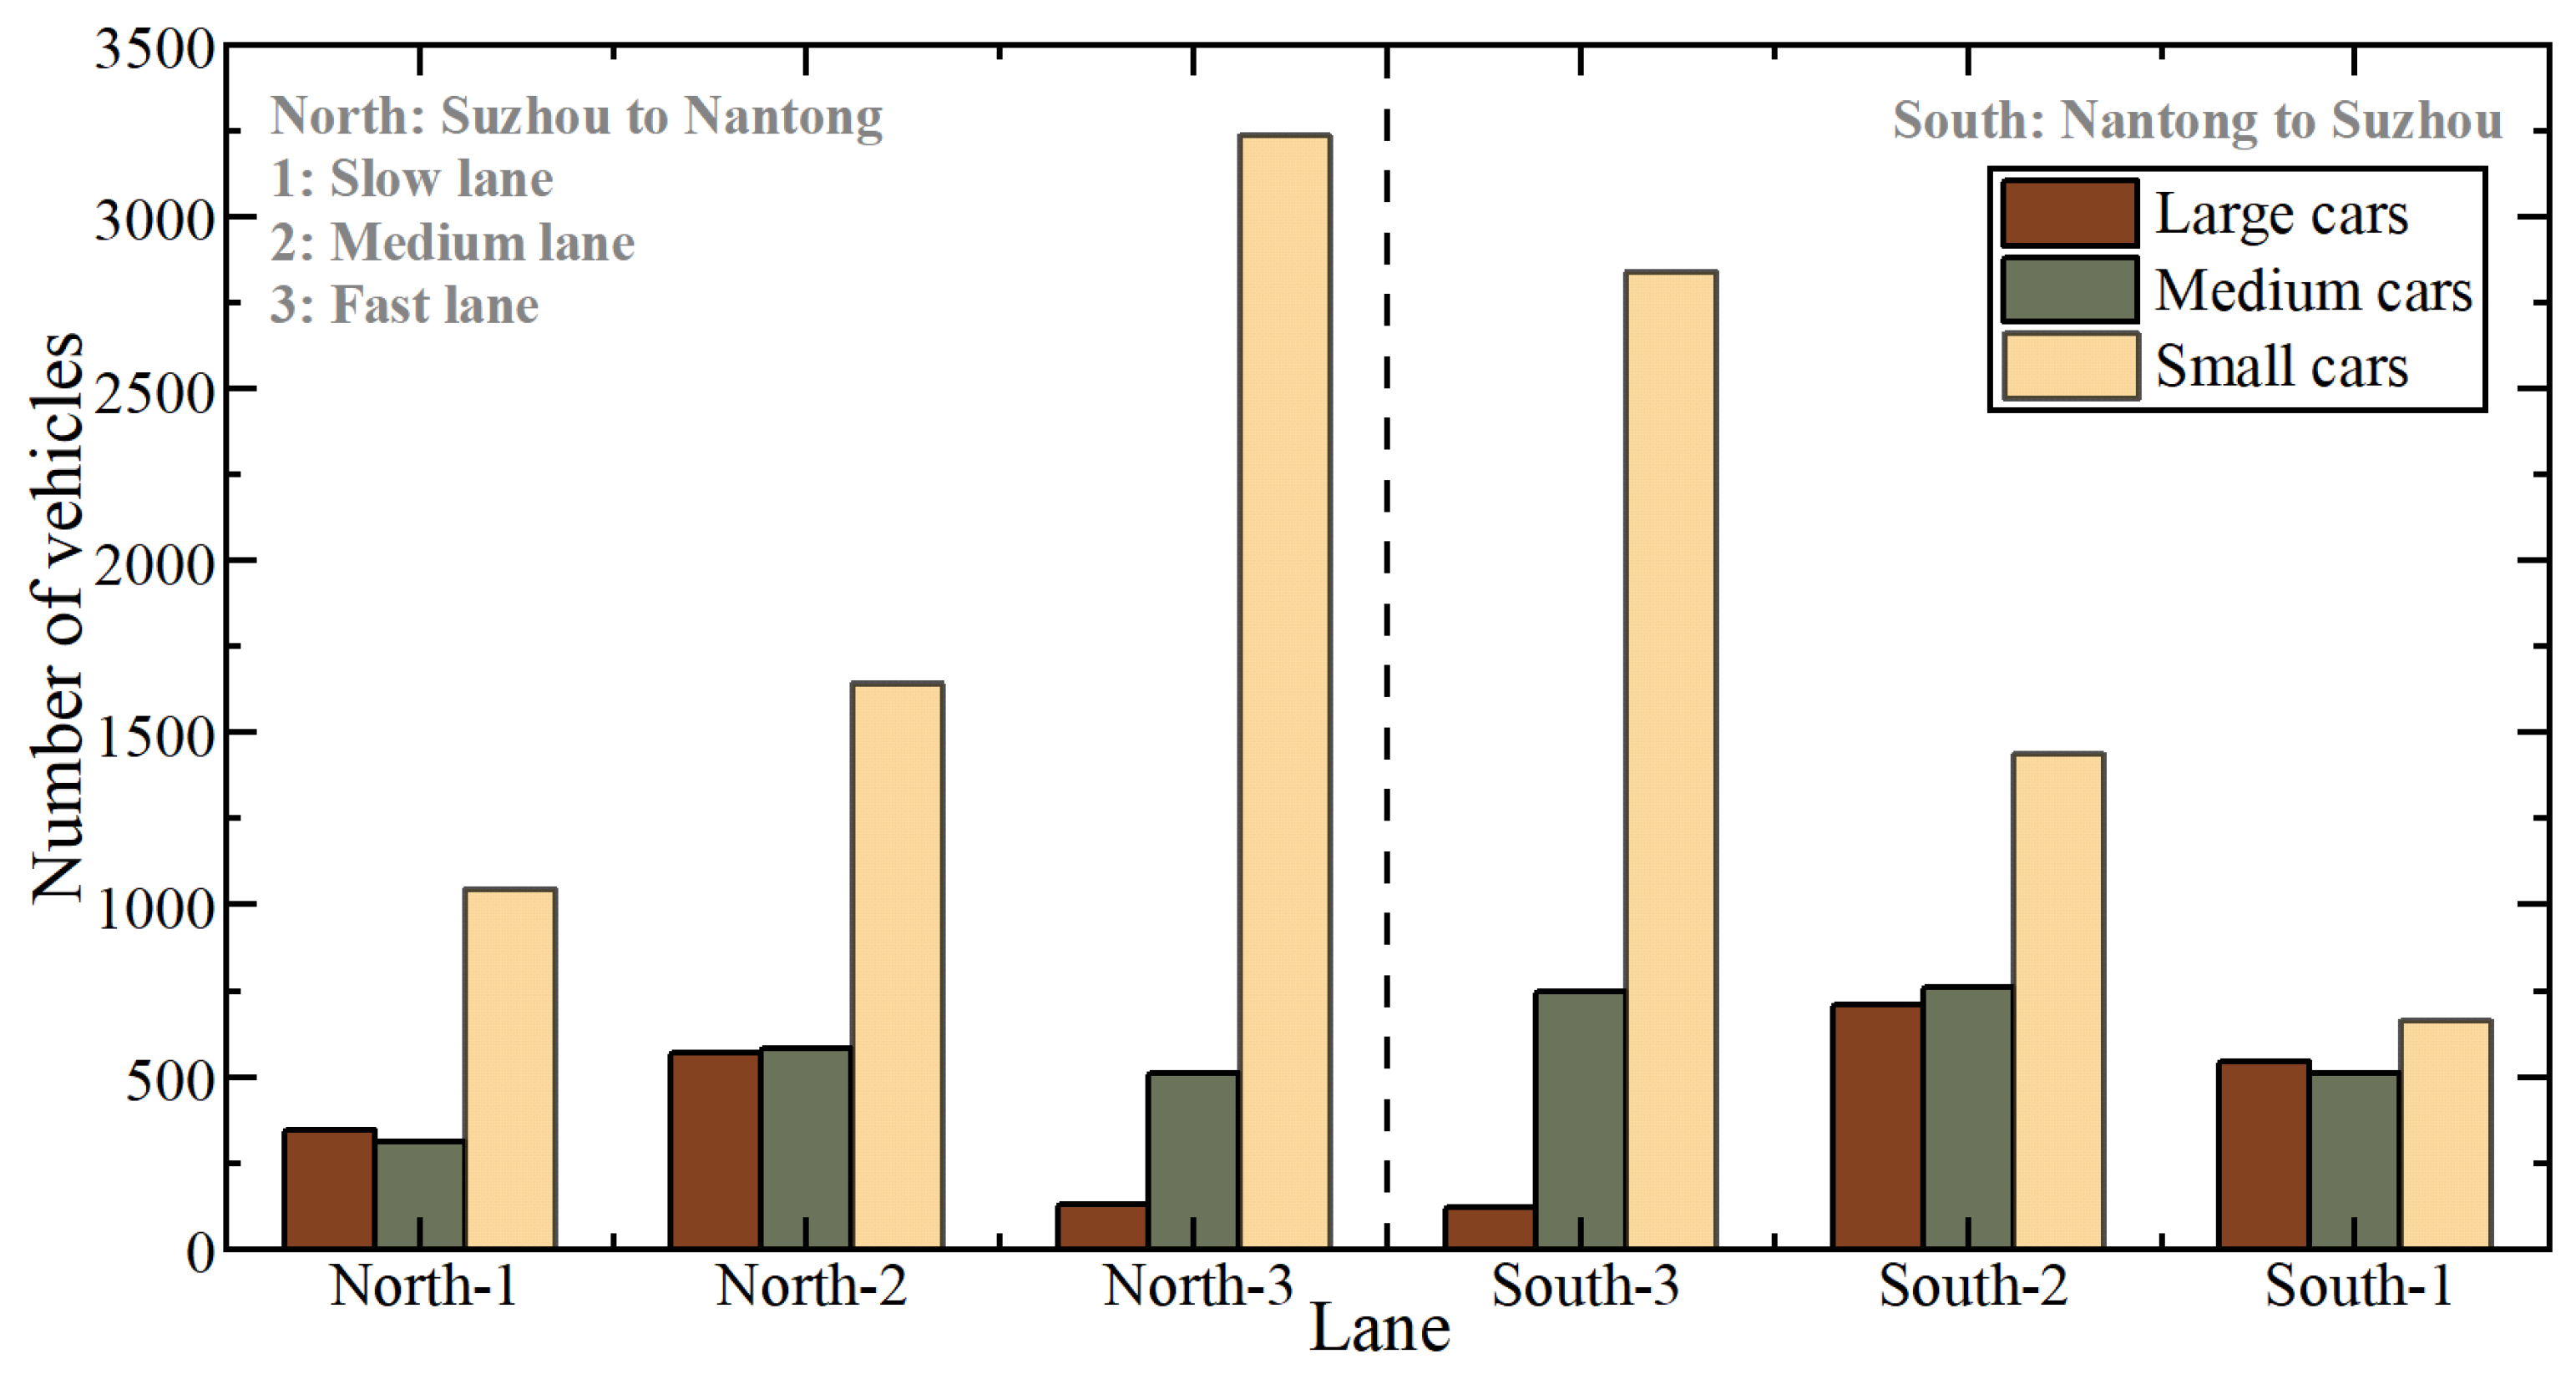
More importantly, large-span cable-supported bridges mainly use steel box beams as the main girder because of their good mechanical properties, light structural quality, and excellent overall cost. However, after many years of operation, the fatigue problem of orthotropic steel bridge decks has become more and more prominent. Especially in the context of China’s high heavy-load traffic rate, this issue has become one of the focus issues of research. Fatigue cracks vary in length, and a single inspection of the entire bridge consumes a lot of human resources and time, making frequent inspections unrealistic. Thus, a digital twin (DT) of the orthotropic decks is recommended for establishment, and the crack development can be simulated and predicted as the reference of field testing. Firstly, the traffic flow should be counted according to the computer vision (CV)-based image identification. The passing vehicles are categorized into three classes: small cars (private cars), medium cars (light trucks and medium buses), and large cars (heavy trucks and large buses). We selected the statistical data of six lanes of the STB main bridge on a certain day and display it in
Figure 8. From this, the distribution (almost Gaussian) of vehicle loads in each lane can be inferred. Also, many small and medium-sized vehicles tend to travel in the fast lane, causing high-frequency but low-amplitude dynamic excitations, while heavy-duty vehicles prefer the slow lane, causing low-frequency but large-amplitude vibrations.
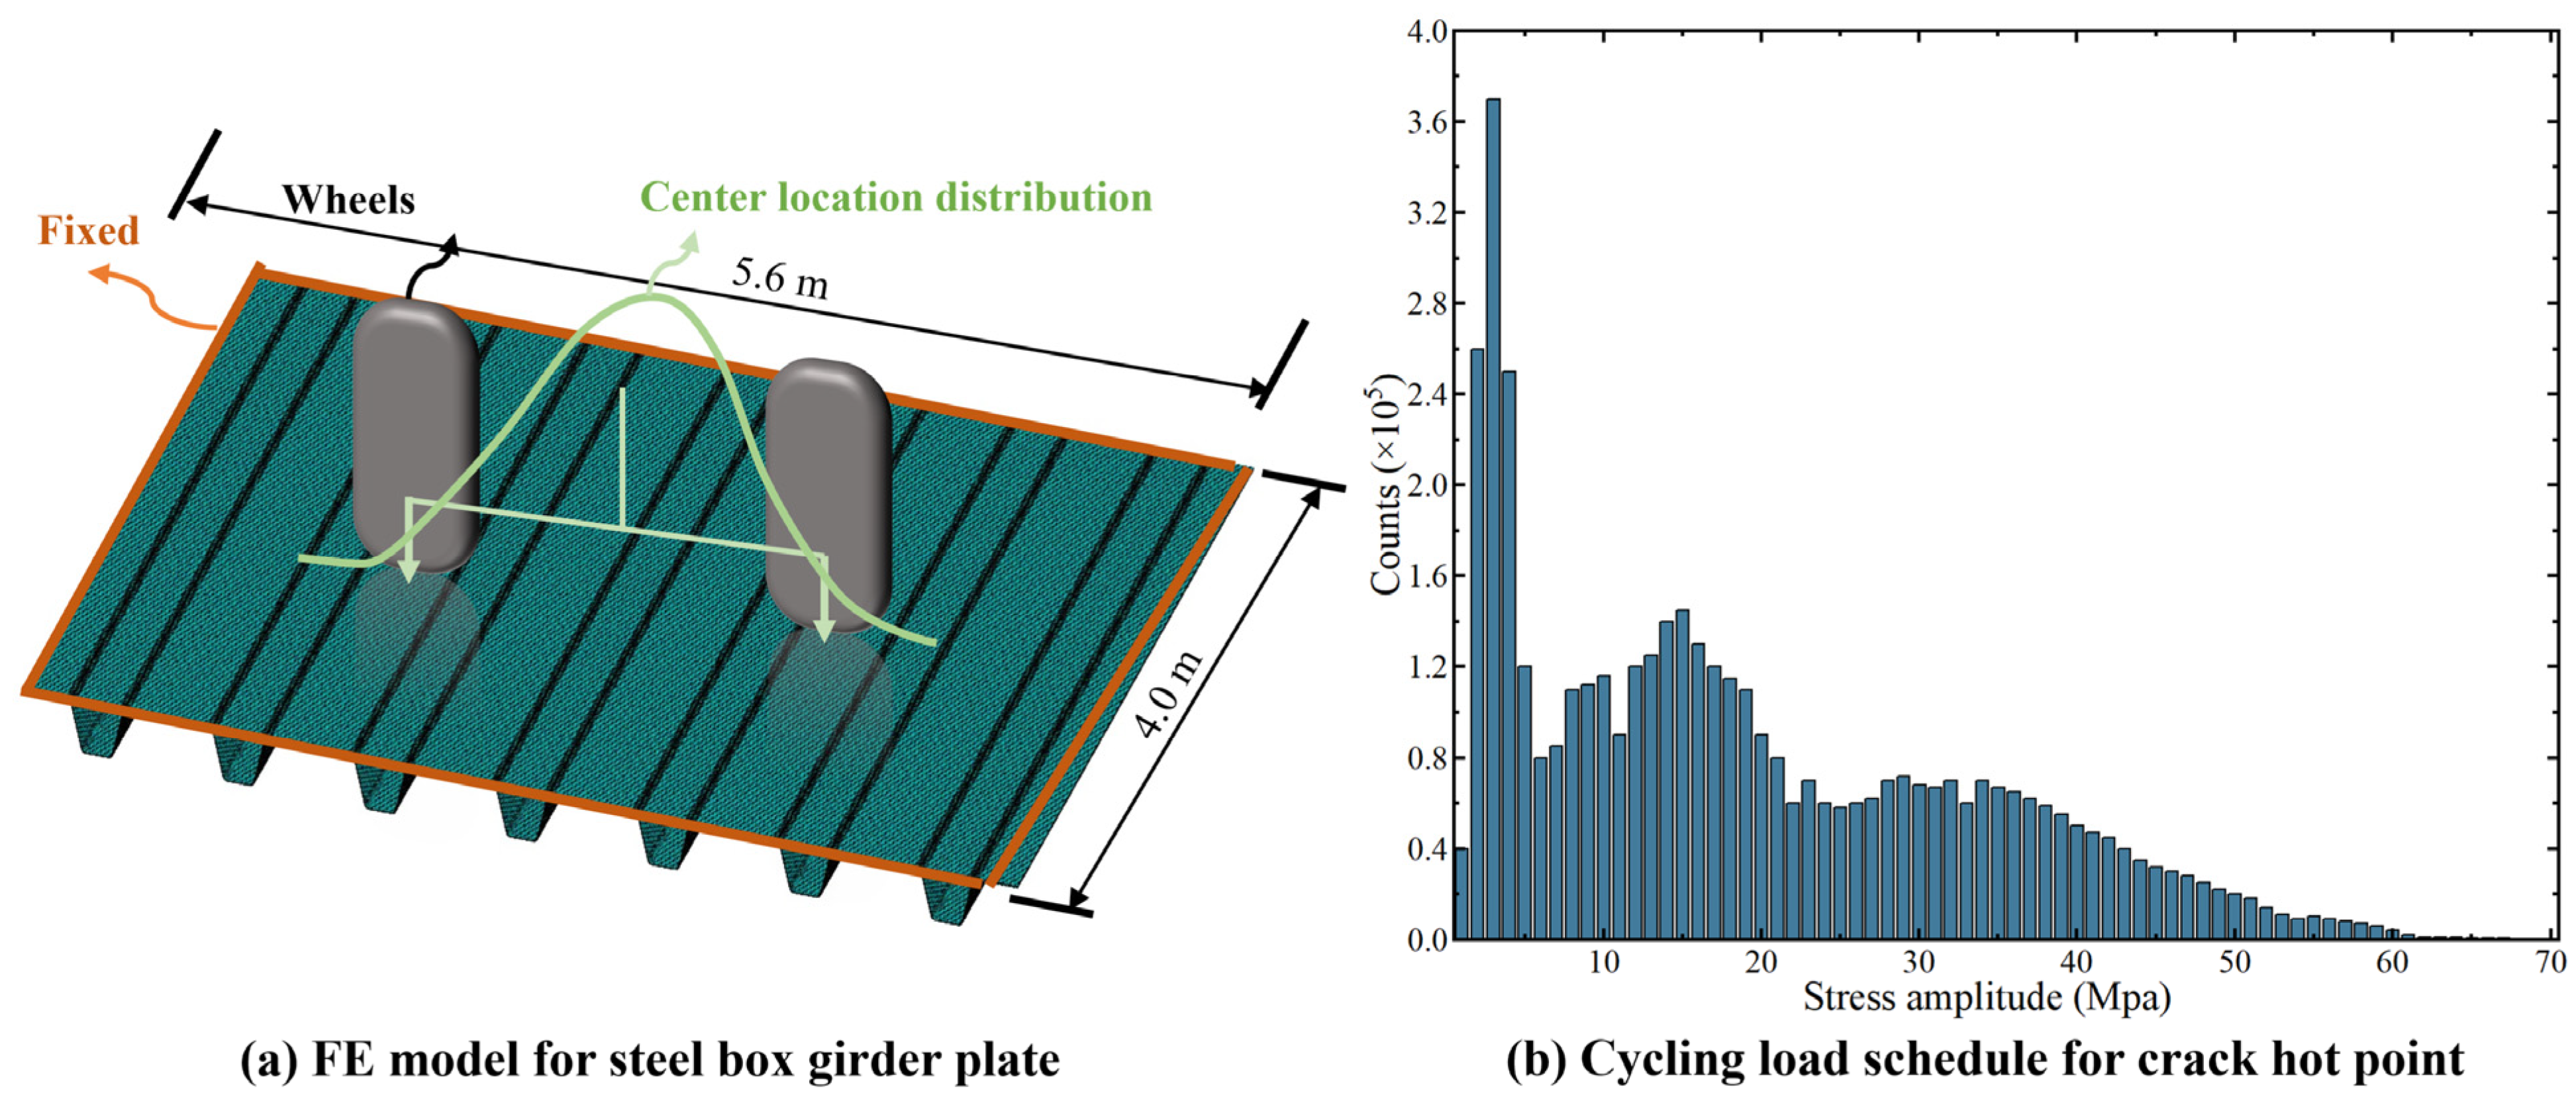
Secondly, an ANSYS FE model for a selected part (length: 4 m, width: 5.6 m) of the orthotropic plate of the box girder is built. The four edges of the selected model are fixed due to the narrow influencing range of the loads applied by wheels. There are a total of 1,293,600 solid185 units in the model, as shown in
Figure 9a. By comparing the relative positions of the vehicle load and its quantity on the steel fatigue S-N curve in the fast and slow lanes, it can be determined that the cyclic loading caused by heavy vehicles is more harmful. So, the average axle weight of the heavy vehicles is applied to the FE model according to the wheel width. At the same time, the position of the center point of the vehicle load in the lane is considered to be Gaussian distributed with the lane centerline as the mean. Take the midpoint of the weld on the U-shaped rib closest to the mid-span as the most likely fatigue fracture area to calculate the stress-influence surface. Combined with the probability of a vehicle appearing at a location, the stress amplitude histogram at that location is obtained (see
Figure 9b).
Thirdly, the fatigue life of the STB hot area can be evaluated. This task can be divided into two stages: calculating the crack initiation life (CIL) and propagation life (CPL). The former represents the time it takes for a structure to go from being crack-free to producing initial microcracks of random length and growing to observable sizes (0.5 mm in this study). The latter is less discrete and represents the time required for the generated observable crack to develop to the unstable expansion stage (length being half the thickness of the plate, i.e., 7 mm). According to the method based on fracture mechanics, the fatigue life of the area of interest is obtained, as shown in
Table 1. This result is in line with the experience gained from similar cases. Although it cannot be guaranteed to be completely accurate, combined with the overall safety assessment results, it can be used as a reference for the detection strategy of key components of cable-supported bridges.
4.2. Functional Performance Evaluation
The functions of a cable-supported bridge are mainly reflected in its trafficability. Furthermore, we also require it to have basic convenience, comfort, and maintainability. Therefore, the functional performance evaluation of this type of bridge is to score the integrity, reliability, and rationality of each component that implements these functions. This process often does not involve complex mechanisms and data processes but is a simple checklist-type inspection work. Therefore, in this subsection, we summarize the functional requirements of related specifications and engineering experience and display the results of its development on the case bridge, as shown in
Figure 10.
The trafficability inspection mainly focuses on the bridge road surface, including road smoothness, rut marks, road cracks and looseness, etc. In addition, auxiliary components of transportation facilities, such as lightning rod systems, traffic signs, and fences, should also be included in functional inspections. According to specification requirements, large bridges must have reliable inspection and emergency maintenance channels and be equipped with inspection vehicles. The smoothness and safety of this channel also fall within the scope of functional checks. Functional inspection is currently dominated by manual inspection. In order to save time and labor costs, it is often performed together with items that also require manual inspection in safety assessment (such as crack detection). During this period, we also put the condition assessment of many non-main structural components into the checklist, such as surface coating peeling off of steel components and spot checks on the loosening of bolt groups.
4.3. Environment and External Excitation Evaluation
This subsection monitors and analyzes two major environmental variables: temperature and humidity fields. For the humidity evaluation, the corresponding locations inside the cable saddles and adjacent to the north and south anchors are also considered to verify the effect of the dehumidification system.
4.3.1. Temperature Field
Temperature changes will cause the material to expand and contract, thereby changing the strain field and dynamic characteristics of the bridge. At the same time, higher requirements are put forward for the expansion joints, bearings, and cable pretension-applying process of the bridge. Temperature monitoring and assessment of temperature effects are required throughout bridge operations. The RYB steel girder temperature fields are shown in
Figure 11. It can be seen that the temperature fields of RYB-N and RYB-S do not change much along the bridge extension direction and fluctuate periodically day and night (the maximum temperature difference between day and night exceeding 12 °C). Moreover, as the date approaches summer, the average temperature in the area near the RYB shows an upward trend. Judging from the test data throughout the year, the temperature distribution around the RYB steel box girder shows obvious bimodal characteristics, and the main temperature data are distributed around 10 °C and 30 °C.
Temperature effects are balanced by expansion joints. Cable-supported bridge expansion joints generally use a combination of special-shaped steel and rubber sealing strips. Under normal conditions, the maximum total longitudinal expansion reaches the meter level, which is achieved through an expansion joint array (the maximum single-joint width does not exceed 100 mm). Each expansion joint unit can expand and contract evenly and meet the three-dimensional deformation requirements. It can adapt to various deformations, including support settlement, braking torque, etc.
Figure 12 illustrates the temperature curves of the RYB main cables. Because of the protective cover with thermal insulation effect, the day and night temperature changes of the cables are not significant, but the temperature climbs slowly with the change in seasons. The stability of the temperature of the main cables can prevent the strain and tension inside the cable from changing drastically in a short period of time, which indirectly ensures the safety of the cable-supported bridges.
4.3.2. Humidity Analysis
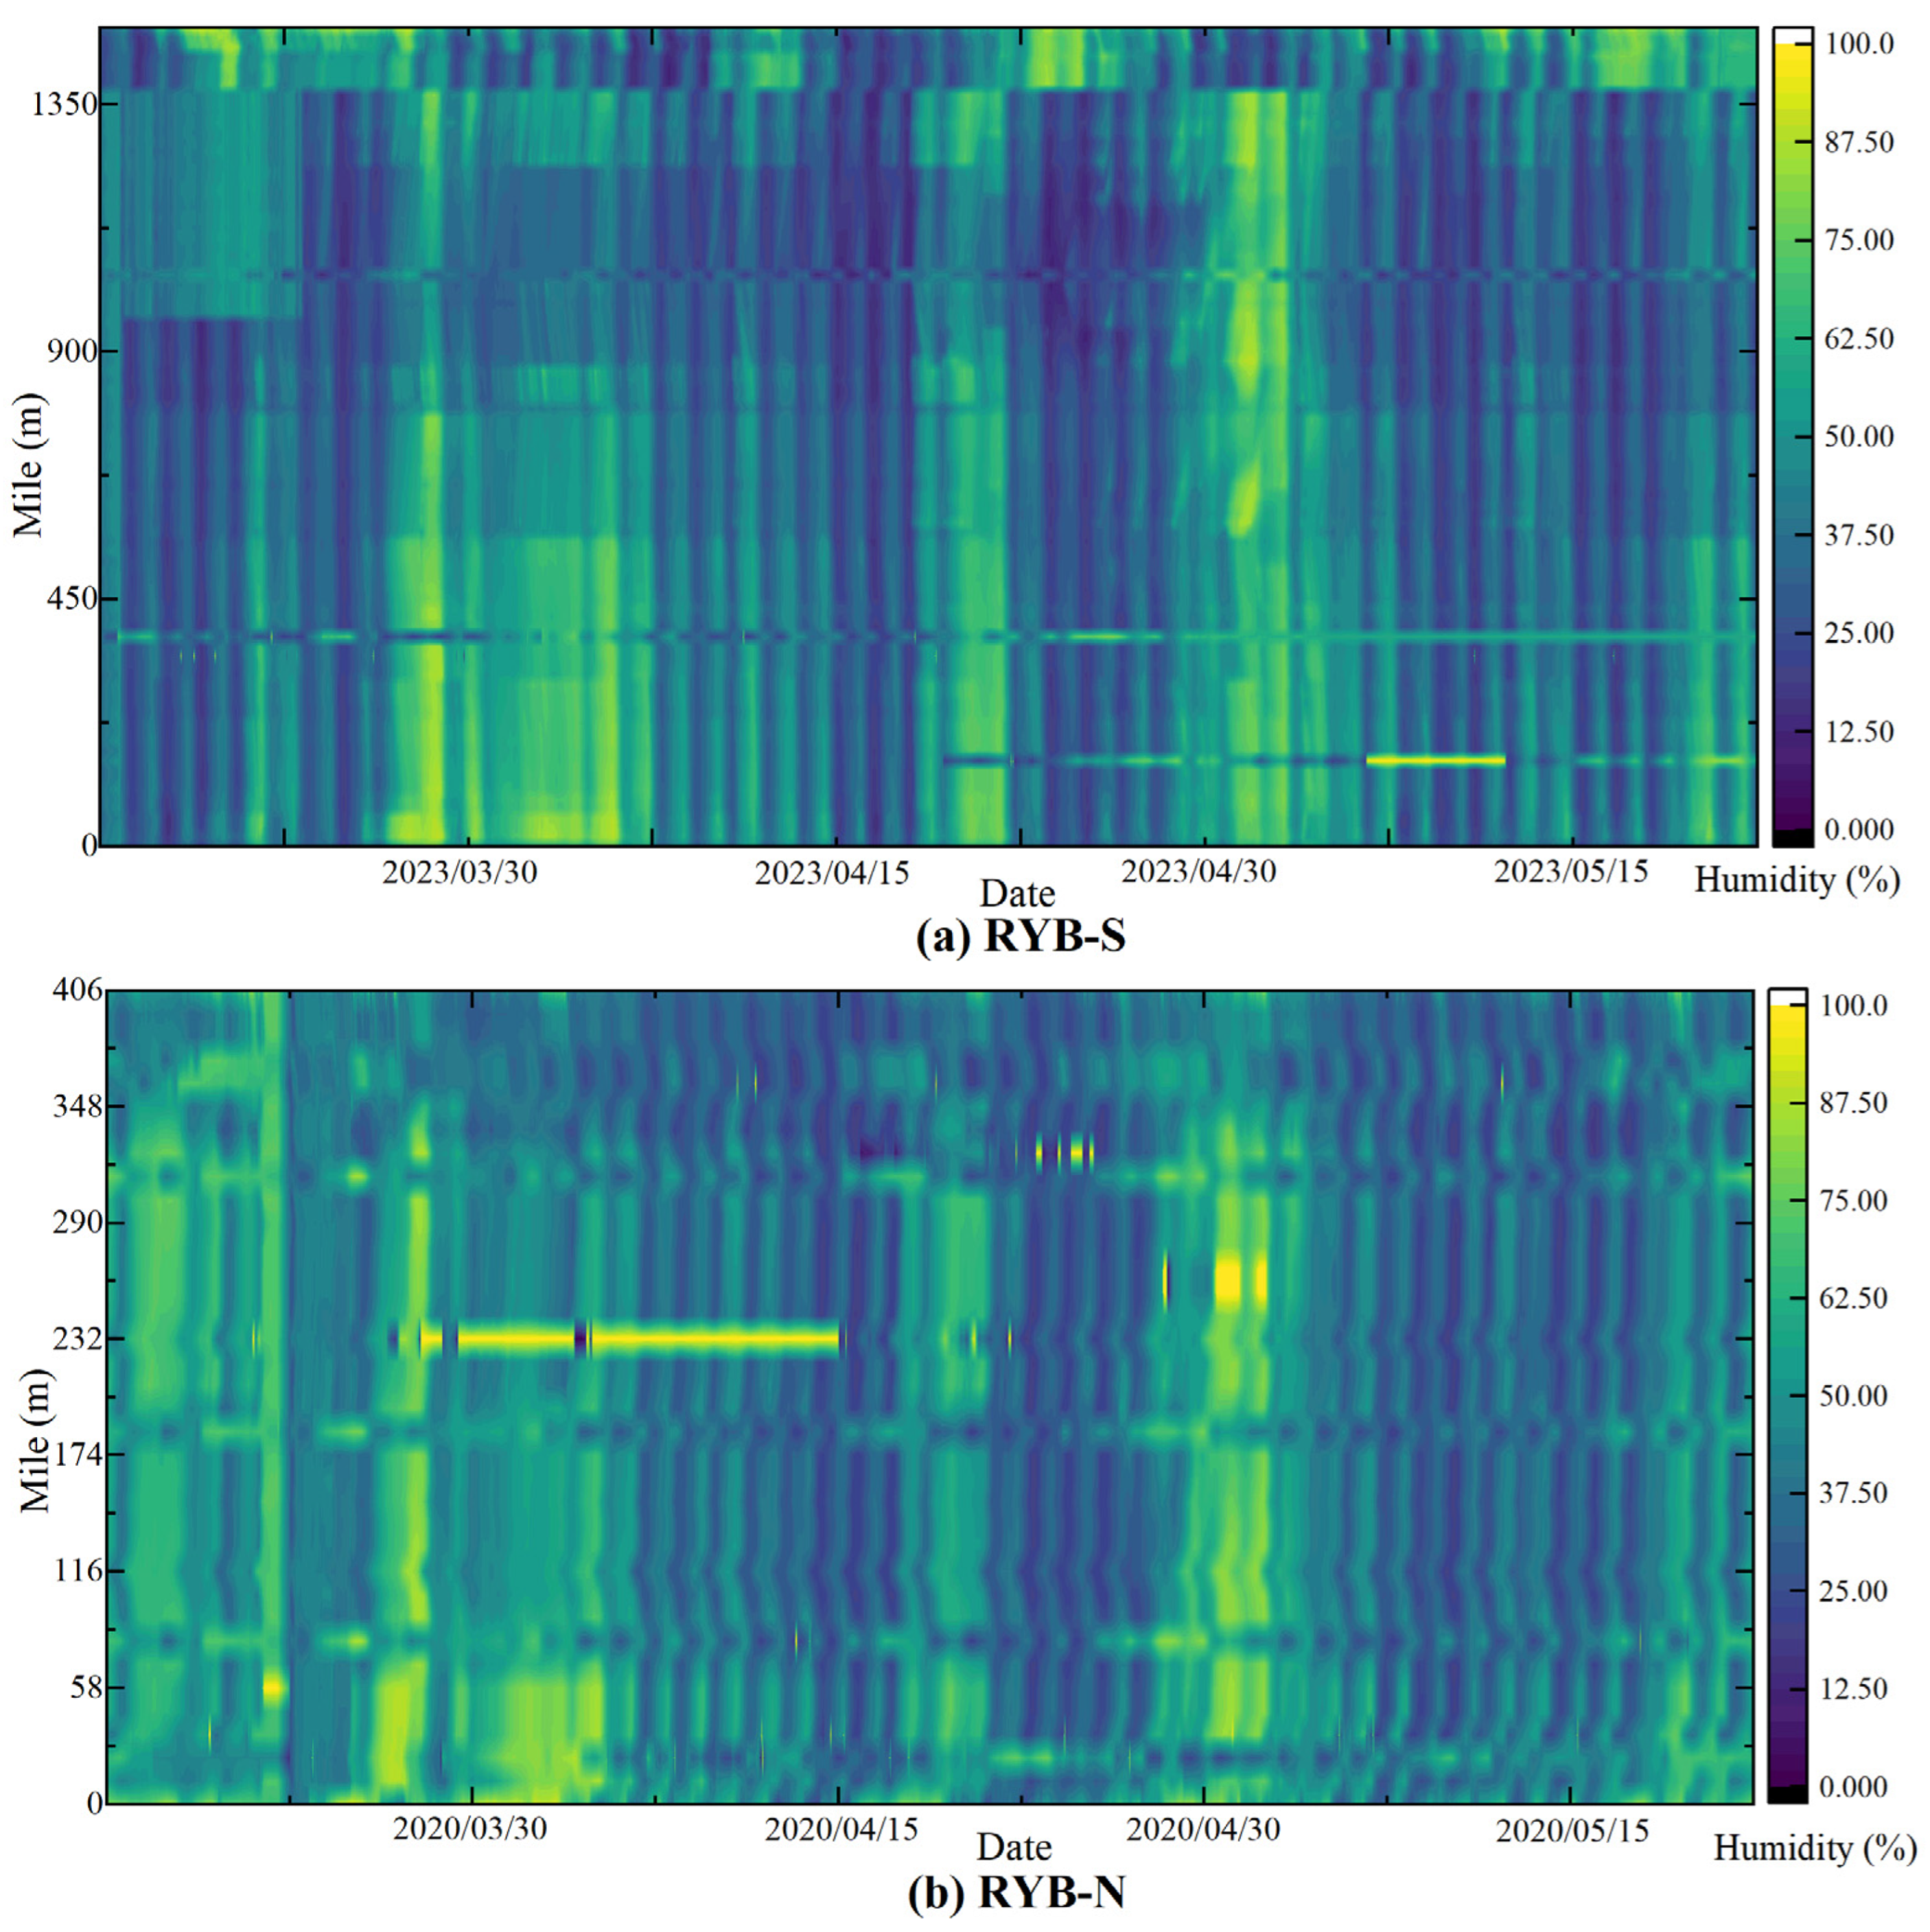
Data from the rainy season (March to May) in the area where the RYB is located are selected to evaluate the environmental humidity of the bridge. The relative humidity cloud charts of both RYB-S and RYB-N steel box girders are plotted in
Figure 13. Obviously, the relative humidity changes of the two bridges are periodic, with a period of about one day. The reason may be related to the fluctuation of water evaporation caused by day and night temperature changes. The humidity fluctuation ranges of RYB-S and RYB-N are basically similar. The average relative humidity of the whole bridge throughout the day is 45.01% and 41.23%, respectively. The number of days with maximum local relative humidity greater than 90% do not exceed 5% of the monitoring period, and those greater than 75% do not exceed 14%, indicating low corrosion risk for steel components. This shows that even if the two bridges are about 1 km apart and located on different tributaries, their ambient humidity is mainly controlled by the weather conditions in the area. In detail, due to the larger span of RYB-S, the air above the riverbed is less affected by the terrestrial environment, and the relative humidity around it is more evenly distributed along the space dimension.
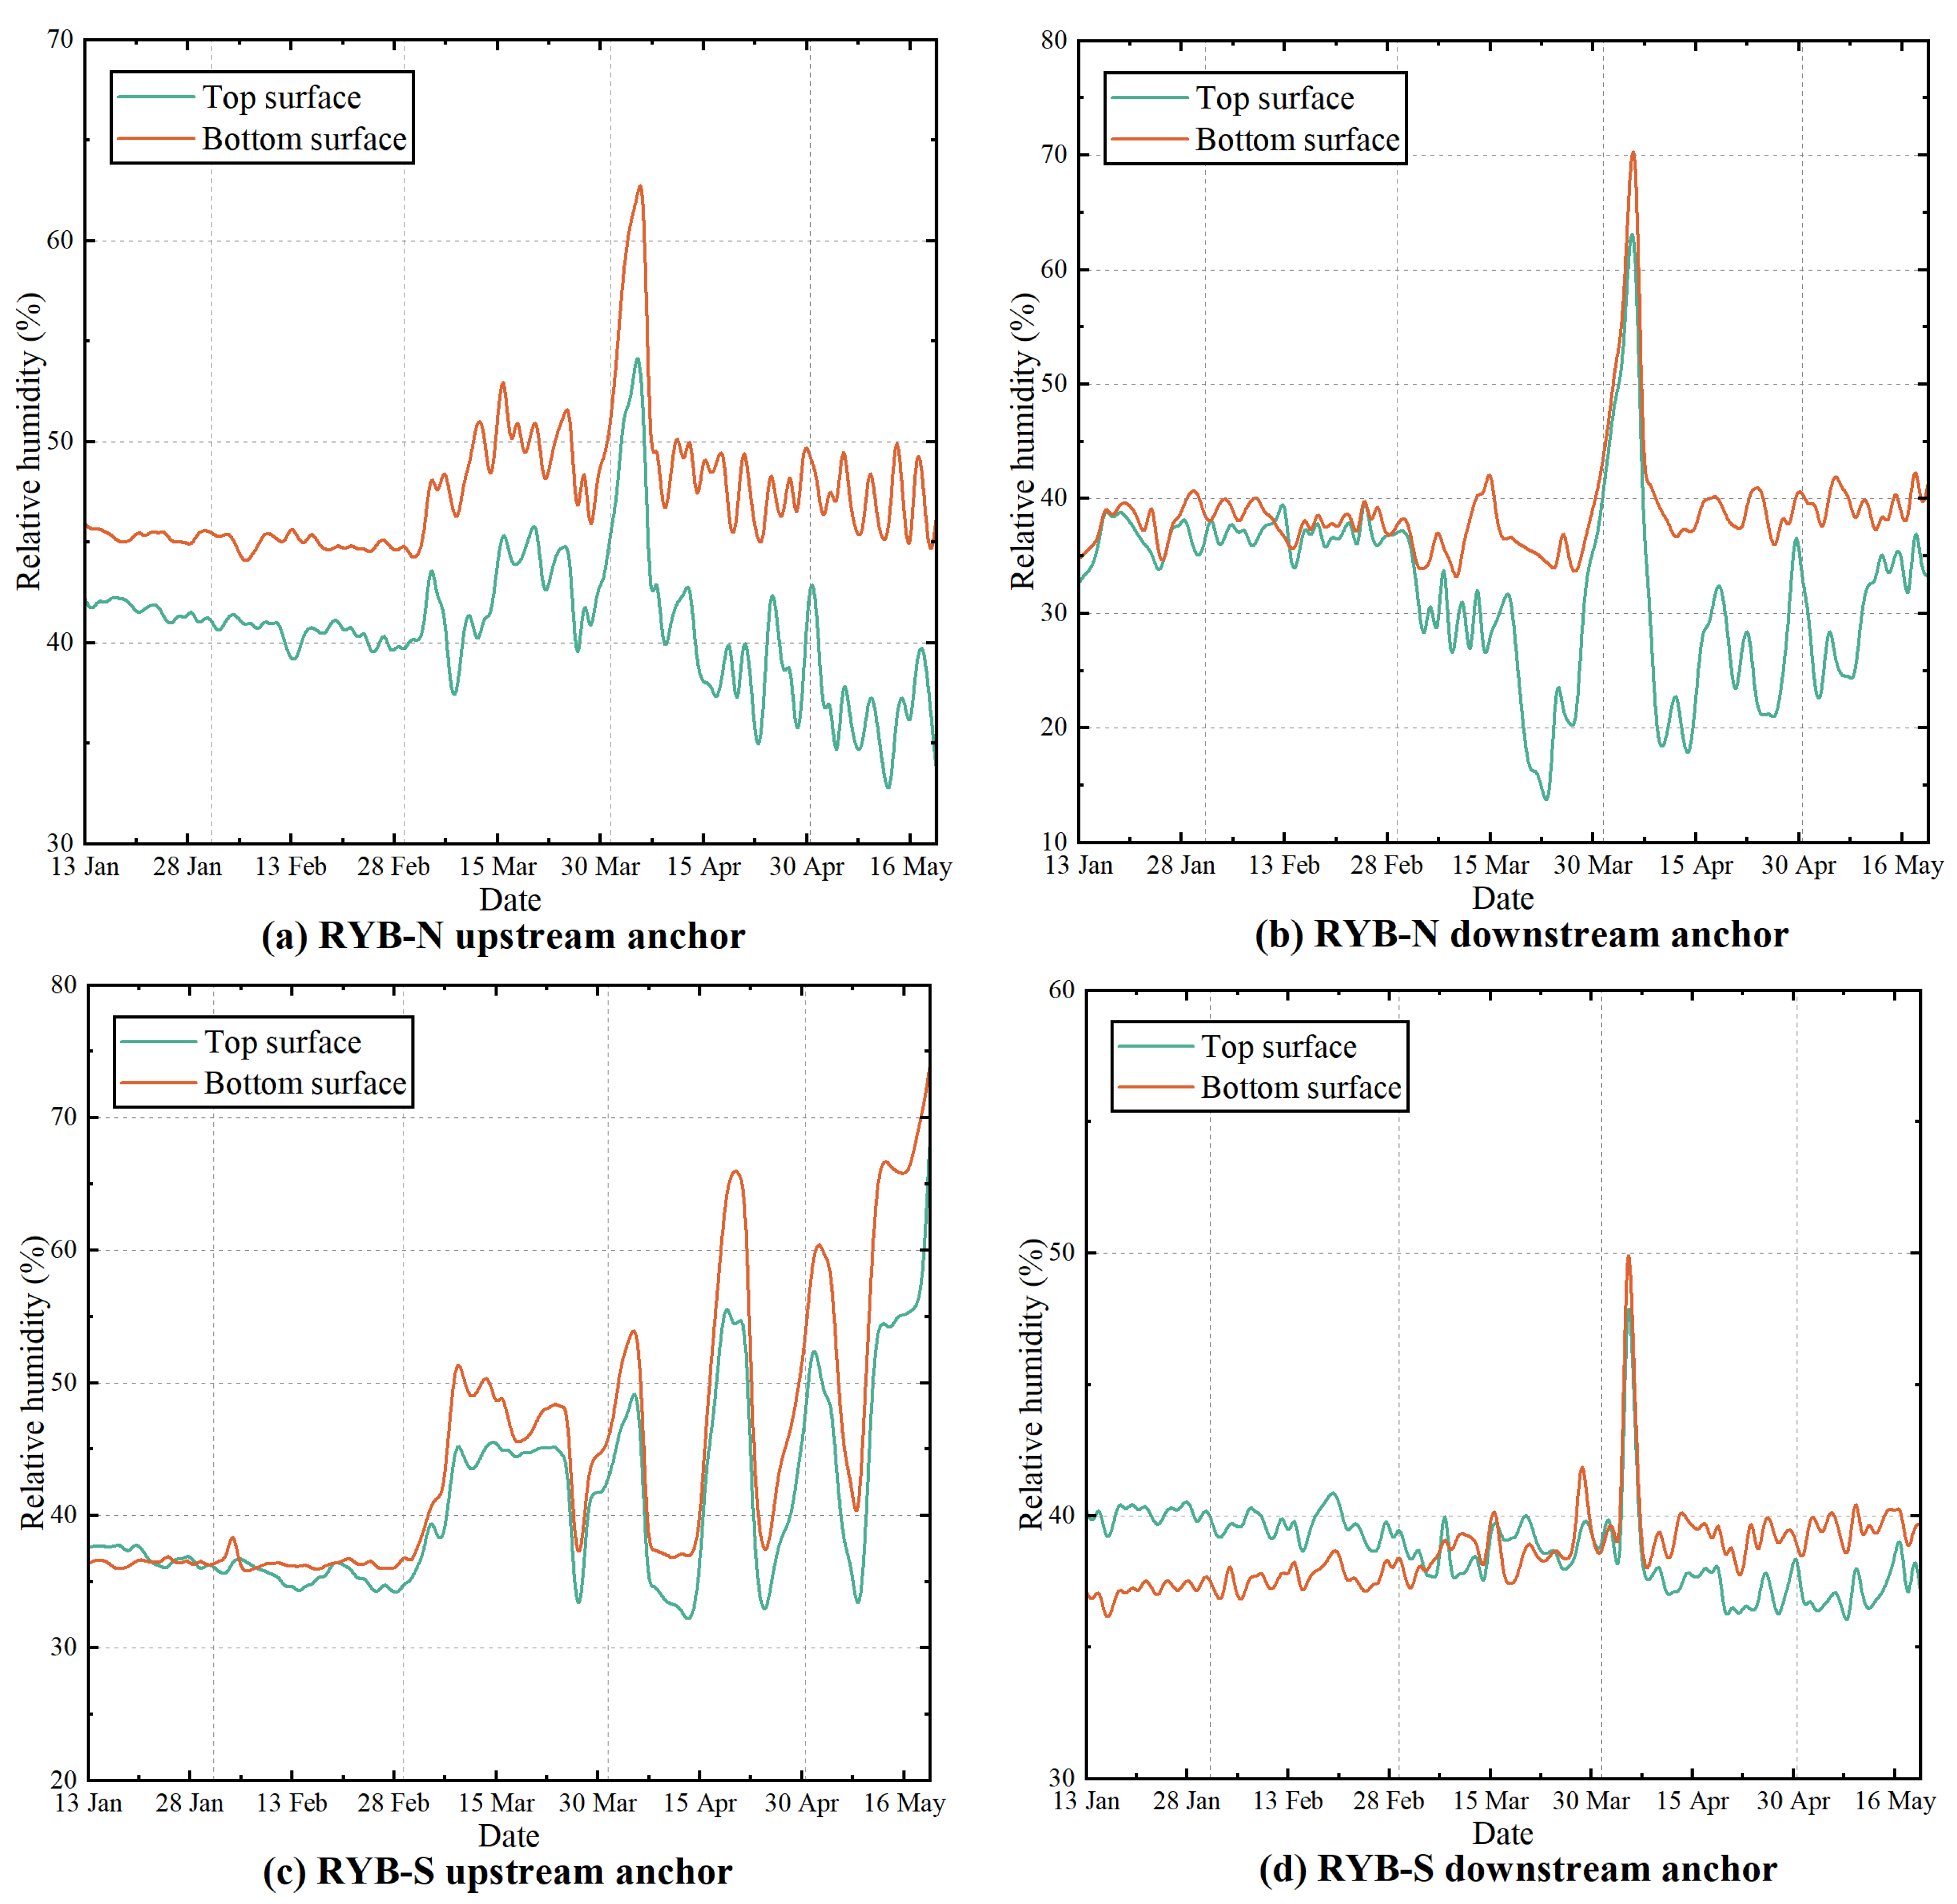
Before the arrival of the rainy season, the relative humidity at the four anchorage locations remains at a low level with almost no fluctuations. After March, rainfall increases, and a dehumidification system is needed to maintain a reasonable and moderate environment. A dehumidification system protects the anchorage facilities of RYB-N and RYB-S in a possibly over-wet environment. The relative humidity of anchors is shown in
Figure 14. Except for the upstream anchorage of RYB-S, the dehumidifiers at other anchorage locations are working normally. The relative humidity in these locations is controlled below 50% most of the time to ensure the long-term reliability of the cables’ supports. It can be observed that in early April of that year, all the anchors experienced a serious dampening, but the power of the currently arranged dehumidification system was enough to quickly restore them to normal levels. The curves at the abnormal location indicate intermittent failure of the dehumidification equipment or the corresponding location suffered unexplained moisture input. In addition to being used to warn of the corrosion risks of its own various metal-like components and fasteners (steel girder, cables, anchors, bolt groups, etc.), the RYB’s humidity changes along the time and space dimensions and the required scale of the dehumidification system can also provide a reference for other cable-supported bridges with similar hydrological conditions.
5. Discussion
By using STB, RYB (RYB-S and RYB-N), and other large-span cable-supported bridges as case studies for a comprehensive evaluation, it can be seen that although bridges with a service time of more than 15 years do not show significant damage on the surface, their local components may have been damaged (steel box girder fatigue cracks of the STB, disrepair emergency access of RYB-S, etc.), and may even have led to stiffness degradation or loss of function of the bridges. The aforementioned potential damage is usually caused by long-term traffic loads, wind pressure, wave erosion, changes in temperature and humidity, or short-term unexpected impacts. The above facts all demonstrate the necessity and importance of long-term monitoring and regular evaluation of this type of bridge.
Among all evaluation items, environmental assessment should be prioritized, as external factors are the cause of bridge degradation. With the maturity of technologies such as computer vision-based vehicle recognition systems, three-dimensional wind speed and pressure sensors, unmanned underwater vehicles, and intelligent temperature and humidity monitoring and adjustment instruments, even for bridges in complex hydrologic, climatic, and traffic environments, we can comprehensively grasp the environmental factors that may have a negative impact on them (
Section 4.3). Based on the results of the environmental assessment, we can establish digital twin models to simulate the fatigue state of important structural components, the corrosion risk of metal components, the deformation of supports and expansion joints, and the wind-induced vibration of cables in real-time for safety concerns towards components (
Section 4.1.2). On the other hand, as distributed dynamic strain measurements become more accurate, combined with the monitoring results of kinematic variables at key measurement points, we can also conduct macroscopic safety assessments (
Section 4.1.1). The bidirectional transmission of information between two levels of safety evaluation results complement and guide each other, consequently forming our proposed safety–function–environment evaluation system. Unlike standard-based general evaluation methods [
33,
34], the evaluation system proposed in this study emphasizes real-time collection and analysis of information, mainly achieved through an environmental evaluation module composed of multiple components. At the same time, this system also focuses more on the fusion of local and overall safety information, which is mainly achieved through a two-level evaluation structure and related positioning algorithms. The only functional evaluation still adopts a checklist approach, but for the complex functional components of large-span cable-supported bridges, this checklist has also been expanded (
Section 4.2).
The implementation of this evaluation system is beneficial for the sustainability improvement of this type of bridge, but it also has drawbacks. Firstly, there is currently no arrangement method for composite sensor systems (accelerators, optical fiber, cameras, etc.). Secondly, there is a lack of scientific arrangement methods for obtaining information approaches with different time distributions, such as long-term monitoring, regular inspections, and key post-event inspections. And these will be the focus of future work.


