Abstract
Responding to the low-carbon demands of power users helps the power industry unlock carbon emission reduction potential, transmit carbon reduction responsibilities, and hold significant importance for energy conservation and carbon reduction. Currently, there is relatively limited empirical research on carbon emission demand responses in different industries. Therefore, this article, based on dynamic carbon accounting technology and combined with power planning and operation simulation data in Fangshan District, proposes a low-carbon demand response mechanism guided by user-side carbon reduction, using dynamic carbon emission factors as guiding signals. Furthermore, an assessment model for the carbon reduction potential of a low-carbon demand response technology is constructed. Finally, empirical research is conducted on the estimated carbon emission reduction of 108 enterprises in 6 different industries in Fangshan District based on the assessment model. The results indicate that carrying out low-carbon demand response can reduce enterprise carbon emissions, and changes in enterprise capacity and industry affiliation will have a significant impact on the carbon reduction effect. This study introduces a novel approach to the low-carbon development of the power system load side, offering a fresh perspective on the empirical analysis of low-carbon development for typical receiving-end power grids.
1. Introduction
A standardized and comprehensive system for measuring and accounting for carbon emissions is foundational to addressing climate change. Governments and international bodies are dedicated to constructing and refining this system [1]. Within the global greenhouse gas accounting system, emissions are classified as direct (emitted directly into the atmosphere) and indirect (resulting from activities but occurring at other emission sources) [2]. Indirect emissions, essentially virtual emissions, represent a distributed responsibility for the emissions produced [3]. Electricity-related carbon emissions in China constitute nearly 50% of the national total emissions [4]. Facilitating the green transformation of the electricity sector is of paramount importance in achieving carbon peak and carbon neutrality targets.
In measuring and analyzing carbon emissions in the power system, it is crucial not only to account for direct carbon emissions from the generation side but also to equitably and effectively allocate responsibility for indirect carbon emissions resulting from electricity consumption on the consumer side [5]. By quantifying and analyzing the responsibility for indirect carbon emissions on the consumer side, carbon emission accountability can be shifted from the production side to the consumption side, thereby achieving coordination of energy-saving and carbon reduction measures between the production and consumption sides. Some scholars have conducted research on the quantification methods for carbon emission flows in power systems [6,7,8,9,10,11]. Kang et al. (2012, 2015) introduced an innovative analytical framework for evaluating consumption-based carbon emission dynamics within power systems [6,10]. This model incorporates the operational attributes and network characteristics inherent in power systems, offering valuable insights for formulating policies concerning carbon emissions within the power sector [6]. Li et al. (2013) introduced a flow-tracing technique for carbon accounting and assessing carbon intensity within electricity systems. This method accounts for both lossless and lossy networks as well as addresses the handling of loop flows [7]. Wang et al. (2017) conducted a comprehensive analysis of the influence of regional carbon intensity and the regional contribution to the national GDP on the overall national carbon intensity in China. Additionally, they developed a methodology for computing CO2 emissions originating from provincial power consumption, taking into consideration the configuration of the regional power grid [9]. In recent work (Yang et al., 2023), an enhanced carbon emission flow model has been introduced. This model incorporates the influence of prosumers on both power flow dynamics and carbon emissions within power grids. Consequently, it yields a more precise assessment of carbon emissions from the demand side [11].
Building upon the aforementioned research, scholars have introduced the concept of guiding users to alter their electricity consumption behavior, thereby achieving a reduction in carbon emissions within the power system and facilitating the integration of renewable energy sources [12]. Traditional demand response mechanisms operate within an “electricity perspective,” primarily employing price signals or incentives to prompt users to proactively modify their electricity consumption patterns, ultimately fostering the secure and economical operation of the power system [13]. Cui et al. (2023) tackled the low-carbon economic dispatch problem in a microgrid. Their approach considered the nonlinear state of energy conversion equipment and integrated the squeeze-and-excitation-MLP model. This led to significant reductions in operating costs, carbon emissions, and curtailment [14]. In their study, carbon emissions were considered as optimization targets. The economic value of carbon emissions was measured by incorporating the cost of carbon trading and the cost of harmful gas treatment. The cost of carbon trading was determined based on the trading price per unit of CO2 and the carbon emission allowances of different equipment. Melgar-Dominguez et al. (2020) proposed a low-carbon planning method for distribution networks with a focus on economic and environmental considerations taking into account carbon trading and demand-side response [15].
Akal (2023) posits a relationship between construction material prices and carbon emissions. Given the establishment of carbon trading markets in China, encompassing the power sector, this paper considers the indirect carbon emissions from electricity as a distinctive commodity. Consequently, the research explores the relationship between electricity-related indirect carbon emissions and overall carbon emissions [16].
The aforementioned studies have explored the application of demand-side resources in reducing electrical carbon emissions, offering valuable insights. However, they are confined to demand-side interactions within the framework of an “electricity perspective”. Their primary approach involves influencing user electricity consumption behavior through signals from electricity and carbon market prices, thereby conducting demand response. This approach fundamentally considers the reduction of electrical carbon emissions from a global perspective within the power system.
Nevertheless, the primary responsibility for carbon emissions in the power industry lies with electricity users. The aforementioned efforts have yet to account for the time-varying characteristics of electricity carbon emission factors and their influence on the electricity consumption behavior of users. Electricity consumption-based emission factors serve as critical indicators for transferring carbon emission responsibilities from the source side to the load side. Users primarily rely on these factors to understand the amount of carbon emissions produced from their own electricity consumption.
On the one hand, with the successive introduction of Carbon Border Adjustment Mechanism (CBAM) implementation plans by international organizations such as the European Union and the United Kingdom, indirect carbon emissions resulting from electricity consumption will be incorporated into the overall carbon emissions of products, subjecting them to corresponding carbon tariffs. This will lead to a decline in the product competitiveness of high-carbon-emitting electricity users, impacting their profitability. On the other hand, the Chinese government has set the goals of achieving a carbon peak by 2030 and carbon neutrality by 2060. Currently, local governments in China are actively promoting the transition from a dual-control policy on energy consumption (a policy restricting both total energy consumption and intensity) to a dual-control policy on carbon emissions (a policy limiting both the total and intensity of carbon emissions). Guided by the aforementioned policies, electricity users with lower total carbon emissions per unit of output will have better development prospects under equivalent production conditions.
Hence, there is a necessity to conduct research on the low-carbon demand response from the perspective of dynamic carbon emission factors. This will facilitate a more effective transmission of carbon emission responsibilities from the power system to the user side.
Adopting a “carbon perspective”, akin to the conventional “electricity perspective”, this study calculates the electricity consumption-based carbon emissions for various user behaviors. It guides users to modify their consumption patterns, thereby enabling carbon emission management on the demand side of the power system. This approach is termed “low-carbon demand response”. Within the low-carbon demand response, discrepancies in electricity consumption-based carbon emissions arising from different behaviors are primarily characterized by distinct consumption-based carbon emission factors. These factors serve to reflect the direct carbon emissions associated with the unit of electricity consumed by the user. This metric serves as a bridge connecting the direct carbon emissions resulting from source-side fuel consumption with the indirect carbon emissions generated from load-side electricity consumption.
In response to the aforementioned issues, this study focuses on the low-carbon demand response approach in the power system, utilizing dynamically changing carbon emission factors. Additionally, it evaluates the potential for carbon reduction for electricity users after implementing this method. Through the established assessment model, empirical research is conducted on the expected carbon emission reductions for 108 enterprises across 6 industries in Fangshan District, Beijing. Furthermore, the study analyzes the influencing factors of a low-carbon demand response in different industries from the “carbon perspective”, providing a basis for the transmission of carbon emission rights and responsibilities in the power system as well as for evaluating its effectiveness.
Addressing the aforementioned issues, this study innovatively proposes a decarbonization approach for electricity users based on dynamic carbon emission factors, introducing a method to assess the carbon reduction potential of electricity users. Furthermore, empirical research on the anticipated carbon emission reduction effects for 108 enterprises across 6 industries in Fangshan District, Beijing, has been conducted using the established assessment model. This marks the first instance of such theoretical assessment work being carried out at a regional level. Lastly, the study analyzes the influencing factors of a low-carbon demand response in different industries from a “carbon perspective”, providing a foundation for the transmission of carbon emission rights and responsibilities in the power system as well as for evaluating their effectiveness.
In the Methodology section, this paper outlines the calculation methodology for dynamic carbon emission factors. Building upon this foundation, it introduces real-time procedures and effectiveness assessment methods for a low-carbon demand response. Furthermore, empirical analysis was conducted on the power grid in Fangshan District, Beijing, China, evaluating the carbon emission reduction potential across various industries. The findings validate the effectiveness of the proposed methodology in this study.
2. Methodology
2.1. Metrics for Carbon Emission Flow
The carbon emission flow in a power system is a virtual network flow that is contingent on and co-moves with active power flow. Kang et al. (2015) have integrated the analysis methodology of electrical power flow into the analysis of CO2 emissions [6]. This has revealed the characteristics and fundamental patterns of CO2 emission flows inherent in various energy networks, leading to the development of a generalized analytical approach. The analysis of carbon emission flows allows for a more intuitive examination of the origins, flow directions, and distribution of CO2 emissions within diverse energy networks in human society. It enables the identification of network nodes with higher emission intensity, providing guidance for the formulation of low-carbon retrofitting strategies.
In a straightforward sense, the carbon emission flow in the power system can be likened to affixing a carbon emission label to the current flowing through each branch. There exists an intrinsic relationship between the carbon emission flow and the current flow. Essentially, in the power system, the carbon emission flow initiates from the power plants (generator nodes), accompanies the power injection from these plants into the grid, moves along with the system’s currents within the grid, and ultimately reaches the consumption terminals (load nodes) on the user end. Superficially, carbon emissions may appear to be emitted into the atmosphere from power plants; fundamentally, however, carbon emissions are discharged into the atmosphere via the carbon emission flow originating from electricity users, as shown in Figure 1.
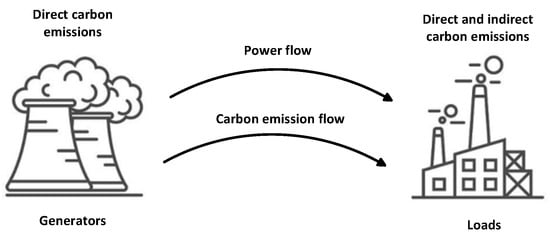
Figure 1.
The relationship between carbon emission flow and power flow in a power system.
- Carbon flux: Carbon flux is the fundamental physical quantity used to describe the magnitude of carbon flow within a system, denoted by the symbol F. The unit of carbon flux is the same as that of carbon emissions, typically expressed as metric tons of CO2 (tCO2) or kilograms of CO2 (kgCO2). Numerically, carbon flux is equivalent to the carbon emissions generated in the generation phase for sustaining a particular generator unit or branch flow that supplies load or network losses to users within a specified time period.
- Branch/Node carbon flow rate (BCFR/NCFR): Carbon flow rate is defined as the accumulation of carbon flux over a unit of time, denoted by the symbol R. The formula for defining branch/node carbon flow rate is
The unit for branch/node carbon flow rate is typically tCO2/h or kgCO2/s. Clearly, branch carbon flux is the integral value of branch carbon flow rate over a given period of time.
- Branch carbon flux density (BCFD): Branch carbon flux density is defined as the ratio of the carbon flow rate (R) to the active power flow (P) on any given branch in the power system. It is denoted by the symbol ρ, and its formula is
The unit of branch carbon flux density is the same as that of emission intensity on the generation side, typically expressed as kgCO2/kWh. In the outgoing lines of power plants, branch carbon flux density is equal to the carbon emission intensity of the generator unit. However, in the lines entering the load terminals, it represents the carbon emissions on the generation side caused by the consumption of one unit of electricity transmitted through the branch.
Since both branch carbon flow rate and active power flow are described as instantaneous values, the branch carbon flux density varies with the fluctuation of the power flow in the system. For ease of description, the average branch carbon flux density within a given time period can be defined, abbreviated as the average carbon flux density.
- Node Carbon Potential (NCP): Branch carbon flux density is used to describe the relationship between current flow and carbon flow on branches in the power system. In regard to the relationship between carbon emission flow and active power flow at nodes in the system, it will be described using the concept of node carbon potential. Denoted by the symbol , the formula for the carbon potential of node n is as follows
In the equation, represents the set of all branches connected to node n where current is injected into node n; denotes the active power of branch i. Node carbon potential shares the same dimensional unit as branch carbon flux density, which is typically expressed as kgCO2/kWh.
- Network Loss Carbon Flow Rate (NLCFR): Corresponding to active power losses within the system, network loss carbon flow rate in the power system can be categorized into two types: losses on the lines and losses at nodes (such as losses from transformers and other equipment). Regarding line losses, there are
- In the equation, represents the active power loss of the branch; represents the carbon flow rate corresponding to the active power loss; is the carbon flux density of the branch.
AC/DC flow calculations form the basis of carbon emission flow calculations, and the two have differences in their calculation frameworks. The goal of carbon emission flow calculations is to trace the carbon emission flow injected from the power generation section into the system, through the power grid, to the user side. The carbon potential of the generation unit can be directly obtained based on unit parameters without the need for carbon flow solving. The specific goals for solving the carbon emission flow in the power system can be summarized as follows: carbon flow density for each branch, carbon potential for each node, branch carbon flow rate, load carbon flow rate, and system network loss carbon flow rate. The known conditions for solving carbon emission flow, in addition to system topology and unit parameters, also include the steady-state flow distribution obtained based on AC/DC flow calculations. Classifying according to different sections of the power system, the contents are summarized in Table 1.

Table 1.
The known parameters and objectives for carbon emission flow calculations.
This study employs the computational approach outlined in reference [6] to trace the carbon emission flow within the power system.
2.2. Calculation Method for Low-Carbon Demand Response
Low-carbon demand response guides electricity users to modify their consumption behavior by providing information on the corresponding carbon emissions generated under different electricity consumption patterns. This, in turn, leads to a reduction in carbon emissions within the power system and promotes the integration of renewable energy sources. The schematic diagram of the decarbonization mechanism for low-carbon demand response is illustrated in Figure 2. In practical operation, the carbon emission reduction achieved through a low-carbon demand response can be quantified through the following steps:
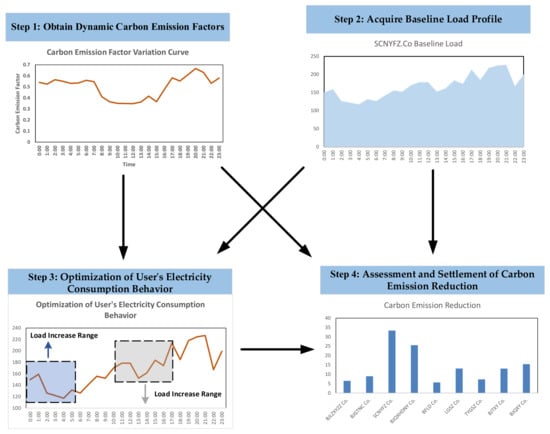
Figure 2.
Decarbonization mechanism for low-carbon demand response.
- Step 1: Obtain Dynamic Carbon Emission Factors
Dynamic carbon emission factors for users are calculated based on the composition of electricity sources consumed by users during different time periods and the corresponding carbon emission information associated with each source.
- Step 2: Acquire Baseline Load Profile
The baseline load profile represents the original load profile of a user before implementing a low-carbon demand response. By utilizing the user’s baseline load profile and the dynamic carbon emission factors corresponding to the given day, the user’s original indirect carbon emissions from electricity consumption prior to low-carbon response can be calculated.
- Step 3: Optimization of User’s Electricity Consumption Behavior
Upon recognizing the variability in carbon emission factors for electricity consumption during different time periods, users adjust their future electricity consumption behavior based on their own carbon reduction requirements, in conjunction with their past carbon reduction achievements. By autonomously planning for carbon reduction in the future, users achieve a reduction in carbon emissions from electricity consumption while maintaining a nearly constant daily electricity consumption level.
- Step 4: Assessment and Settlement of Carbon Emission Reduction
Based on the actual dynamic carbon emission factors and the actual load profile for the given day, the actual indirect carbon emissions from electricity consumption by the user can be determined. By comparing the actual indirect carbon emissions from electricity consumption with the original values, the reduction in carbon emissions resulting from the low-carbon demand response can be assessed.
The dynamic carbon emission factors tailored for the low-carbon demand response can be derived from the spatially averaged processing of node carbon potentials, which are obtained through carbon flow calculations. Expressed as shown in Equation (6).
In the equation, represents the carbon emission factor for regional grid in time period ; denotes the set of nodes covered by regional grid ; signifies the load at node in time period ; and represents the magnitude of the carbon potential at node .
Utilizing dynamic carbon emission factors, the annual carbon emissions from user electricity consumption can be calculated using the following equation:
It is worth noting that, while theoretically, adjusting electricity prices can also influence user behavior and facilitate decarbonization, the low-carbon demand response mechanism proposed in this paper does not transmit guiding signals to users in the form of electricity prices. Instead, it opts to convey this information to users through dynamic carbon emission factors.
2.3. Benefit Assessment Model of Low-Carbon Demand Response
The low-carbon demand response mechanism will have an impact on both users and the entire power system. For users, it allows for a reduction in electricity consumption and carbon emissions by altering their electricity consumption behavior, potentially leading to tangible benefits within the carbon market environment. For grid operators, the adjustment of user electricity consumption behavior also promotes the integration of clean energy sources into the system, thereby lowering the overall carbon emissions level of the entire power system. This paper will evaluate the decarbonization potential of the low-carbon demand response from both the system and user perspectives. The evaluation steps are as follows:
Step 1: Utilizing historical operational data of the power system, simulate the year-round operation scenario to obtain hourly-level data on power flow along transmission lines and generator outputs for the entire year.
Step 2: Obtain the dynamic carbon emission factors for users. Based on the simulation results provided in Step 1 and in conjunction with Equation (6), the hourly dynamic carbon emission factors for the corresponding time periods of the power system are derived.
Step 3: Obtain simulation results for user response behavior. In this study, it is assumed that the predicted curve of dynamic carbon emission factors is released to electricity users one day in advance. Users make adjustments to their electricity consumption behavior on a daily basis. Upon perceiving the differences in carbon emission factors for electricity consumption during different time periods in the future, users, within the range allowed by their own adjustment capacity, respond with the objective of maximizing their own carbon reduction while taking into account the temporal variations in these factors. The objective function of the model is represented by Equation (8); Equations (9)–(11) reflect the constraints on the user’s adjustment capacity when participating in the low-carbon demand response. In these equations, (9) imposes constraints on the maximum/minimum adjustment amount, (10) indicates that the load increase from the baseline load cannot exceed the user’s maximum rated load, and (11) ensures that the load reduction in a given time period cannot fall below the current period’s baseline load. Equation (12) states that the total daily load remains essentially unchanged before and after the adjustment of electricity consumption behavior. Equation (13) is employed to ensure that a user cannot simultaneously be in a load-increasing and load-reducing state in any given time period.
In the equations, represents the daily carbon emission reduction for the electricity user; TD denotes the total number of time periods in a single day; represents the unit time interval (1 h); and represent the load increase and load decrease in time period for the electricity user participating in low-carbon response; represents the upper limits of load adjustment available to the electricity user in each time period; ₜ and ₜ are binary variables indicating whether the user is in a load-increasing or load-reducing state (0 or 1); represents the maximum daily electricity consumption variation value for the electricity user (accounting for the incremental energy consumption due to the impact of energy storage efficiency); represents the baseline load in time period .
Step 4: Calculate the decarbonization benefits. Based on the changes in user electricity consumption behavior over the entire year, the annual decarbonization amount under low-carbon demand response can be calculated using Equations (14) and (15), respectively. These equations yield both the annual decarbonization quantity and the corresponding decarbonization revenue in the carbon market resulting from the low-carbon demand response.
In the equations, and represent the annual decarbonization quantity and the corresponding annual decarbonization revenue for the power company, respectively; pCO2 denotes the carbon price; and TY represents the total number of time periods in a year.
At the system level, the decarbonization benefit assessment model proposed in this paper can be employed to analyze the maximum annual decarbonization achievable by implementing a low-carbon demand response under a given level of load flexibility.
At the user level, the model presented in this paper can be utilized to analyze the maximum annual decarbonization and corresponding benefits achieved by users through adjustments in their electricity consumption patterns, using specified adjustment methods such as energy storage and load flexibility.
3. Empirical Analysis of Low-Carbon Demand Response in Beijing’s Fangshan District
3.1. The Fundamental Overview of the Fangshan District Power System
Fangshan District is located in the southwest part of Beijing, China. The local power generation in Fangshan is primarily limited to a few small-scale photovoltaic power stations, such as the Nanshangle Photovoltaic Power Station and a waste incineration power plant. Over 90% of the district’s electricity supply relies on external power transmission, making it a typical receiving-end power grid where the load is primarily supplied through external transmission channels and delivered to the 500 kV Fangshan substation for further distribution.
The reliance on external power transmission has a significant impact on the carbon emissions of Fangshan’s power grid. Considering that the external electricity supply to Fangshan is predominantly from high-carbon sources such as thermal power, there is a substantial influence on the carbon emission profile of Fangshan’s power grid. To mitigate and reduce the carbon emissions in Fangshan, given the prevalence of high-carbon external power, a low-carbon demand response becomes crucial.
In Fangshan, the primary types of local power sources are waste incineration power and photovoltaic generation, with relatively low installed capacity and output proportions. The total installed capacity is approximately 70,400 kW. This includes four centralized photovoltaic power stations with an installed capacity of around 26,100 kW, residential distributed photovoltaic capacity of about 6500 kW, non-individual distributed photovoltaic capacity of approximately 17,800 kW, and waste-to-energy generation (Dishuiyan Waste Incineration Power Plant) with an installed capacity of roughly 20,000 kW [17]. The topological structure diagram of the Fangshan District power grid is depicted in Figure 3. In the figure, red represents the 110 kV substation and transmission lines, blue represents 220 kV, and green represents 500 kV.
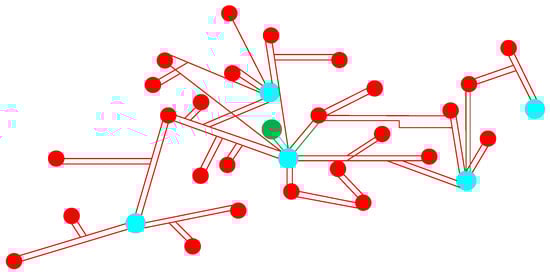
Figure 3.
Topological structure diagram of the Fangshan District power grid.
In this section, we utilize actual system and load data from December 2022 in the Fangshan District’s power grid to conduct carbon emission flow calculations. This is carried out to validate the effectiveness of the proposed method for monitoring carbon emission flows. Subsequently, based on the computed results, an analysis of the actual carbon emission flow distribution in the Fangshan system is performed.
The data used for carbon emission flow calculations, including system power flow and grid structure, are sourced from the operational Fangshan power grid. The temporal resolution for flow information updates is set at one hour, resulting in a total of 24 temporal sections in a day. Carbon emission factors for power generation, both within and outside the Fangshan district, are determined based on default values provided by the IPCC for different types of power sources. The specific values are detailed in Table 2. On the analyzed day, the minimum load in Fangshan occurred at 4:00 a.m., registering at 928 MW, while the maximum load was observed at 7:00 p.m., reaching 1357 MW.
Table 2.
Values of Emission Factors for Different Types of Power Sources [18].
3.2. Analysis of Dynamic Carbon Emission Factors in the Fangshan District
Given that the Fangshan grid is a typical receiving-end grid, with the load mainly supported by external power supply and only a minor contribution from local sources such as Dishuiyan Power Station and some distributed photovoltaics, the overall output proportion is relatively low. Consequently, the carbon emission factors in the Fangshan District are primarily influenced by the carbon emission factors of the external power supply. Figure 4 illustrates the BCFR of the primary external power transmission channels in the Fangshan grid. As all three transmission lines originate from the Hebei power grid, their carbon flow density remains consistent, as depicted by the variation curve in Figure 5.
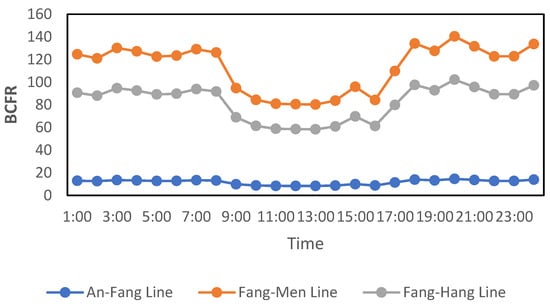
Figure 4.
BCFR in Fangshan.
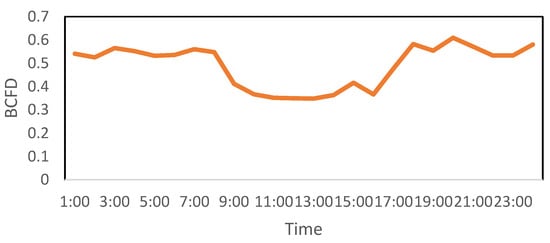
Figure 5.
BCFD in Fangshan.
Figure 6a illustrates the output curve of the Nanshangle Photovoltaic Power Station in the Fangshan district, while the output curves for other photovoltaic generation resources within the Fangshan district are coupled proportionally based on their installed capacities. Correspondingly, Figure 6b represents the output curve of the Dishuiyan Waste-to-Energy Plant at the same moment. By analyzing Figure 6, local carbon emissions from power sources in the Fangshan district can be determined. Combining this information with Figure 4 and the load curve of the Fangshan district, the daily variations in carbon emission factors for the Fangshan district are presented in Figure 7.
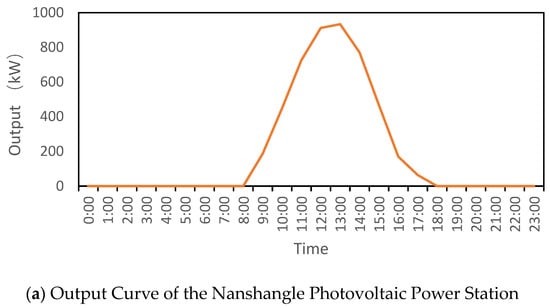
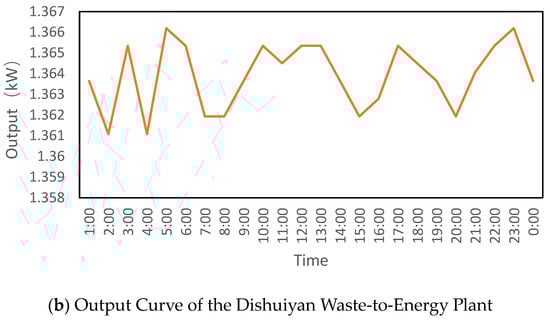
Figure 6.
The carbon emissions from local power sources in Fangshan.
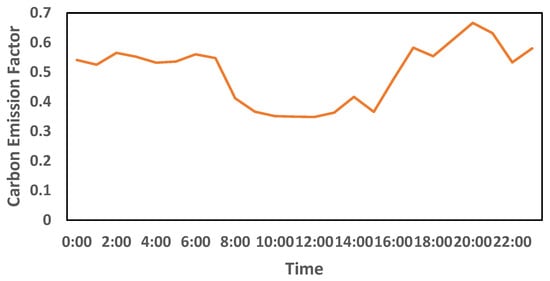
Figure 7.
Carbon emission factor variation curve in Fangshan.
Based on the above data and considering the power generation profiles of various enterprises in Fangshan district, it is possible to calculate the carbon emissions of local businesses within the region. A low-carbon demand response analysis was conducted on 108 users from 6 industries in Beijing’s Fangshan district, including agriculture, animal husbandry, food manufacturing, textile and apparel manufacturing, non-metallic mineral product manufacturing, and construction. The involved enterprises are represented by English abbreviations due to data requirements. The analysis was carried out following a stepwise approach with a factor of 2.3. The carbon emissions of each enterprise and the anticipated carbon emissions after a low-carbon demand response are illustrated in Figure 8.
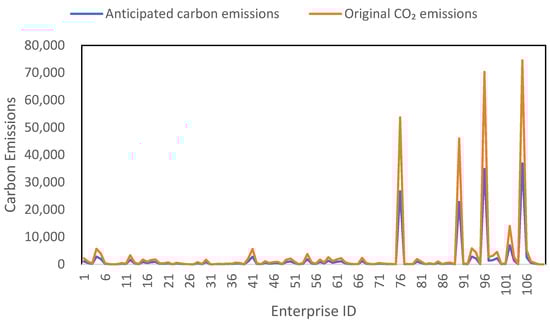
Figure 8.
Carbon emissions of each enterprise and anticipated carbon emissions after low-carbon demand response.
To achieve carbon reduction benefits, adjustments in the load of different industries and enterprises are necessary. The variation in load adjustments can be obtained according to Equation (9). To simulate the low-carbon demand response load adjustment that ensures normal production for enterprises, this study sets the load adjustment range not to exceed 10% of the original load. The load adjustment trends for each industry are depicted in Figure 9.
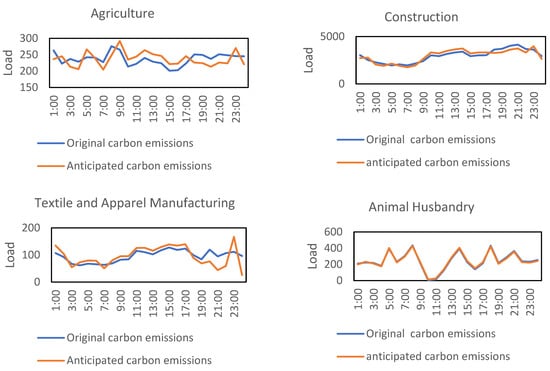
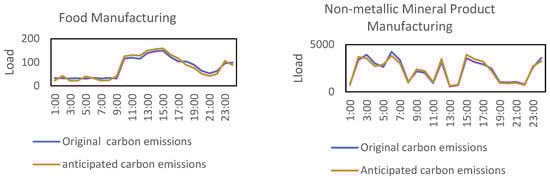
Figure 9.
Load adjustment trends for each industry.
An analysis of the response to low-carbon demand yields Figure 10, which depicts the distribution of the average reduction in carbon emissions across six major industries following the implementation of a low-carbon demand response. It is evident from the graph that the response to low-carbon demand can result in varying degrees of reduction in carbon emissions for each user.
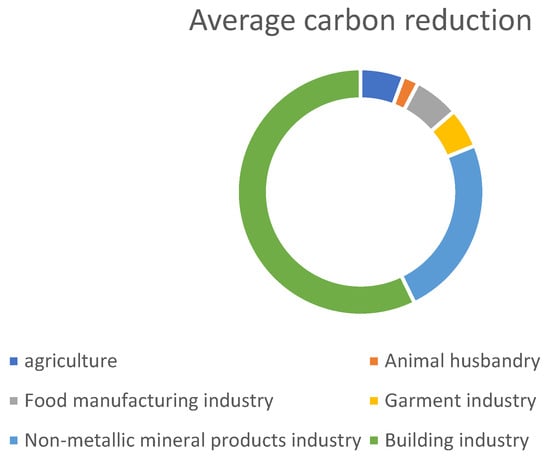
Figure 10.
Distribution of the average reduction in carbon emissions.
After classifying 108 users based on load capacity and conducting comparative analysis, it was observed that as the load capacity increases, the carbon reduction effect induced by the low-carbon demand response becomes more pronounced. The analytical findings are presented in Figure 11.
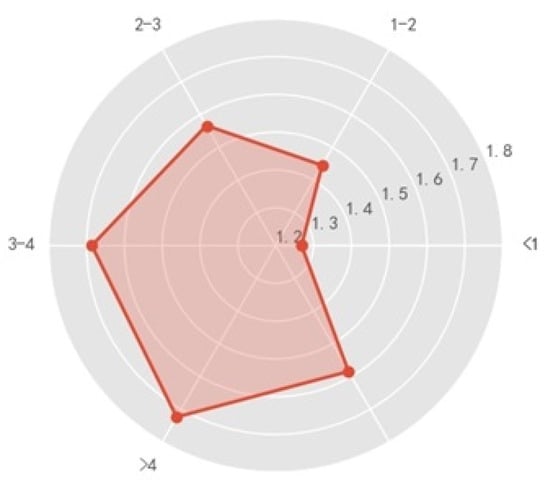
Figure 11.
Percentage of carbon emission reduction after low-carbon demand response across different load capacities.
In analyzing the distribution of the same industry across various carbon reduction percentage intervals and the average carbon reduction percentages across six industries, it is evident that low-carbon demand response exhibits a slight advantage in emission reduction for the non-metallic mineral products industry, textile, clothing, and apparel industry, as well as the food manufacturing industry when compared to the livestock industry.
4. Discussion
From the case analysis, it can be observed that, as a receiving-end grid, the carbon emission factor of the Fangshan grid significantly decreases when the local new energy output increases. Meanwhile, the impact of carbon flow rates from external power sources on the carbon emission intensity of the Fangshan grid is substantial. To reduce carbon emissions in the Fangshan area, the proportion of renewable energy in the power transmission lines needs to be further increased.
From the perspective of users, under the condition of constant total power demand, implementing a low-carbon demand response and redistributing loads to increase operational loads when the regional carbon emission factor is lower can effectively reduce the carbon emissions of enterprises. Additionally, there are variations in the expected carbon reduction across different industries after implementing low-carbon demand response. The construction and non-metallic mineral product industries exhibit better emission reduction potential compared to livestock and agriculture. The larger the electricity load of the enterprise, the more significant the emission reduction effect.
Taking a specific enterprise in Fangshan District as an example, with a maximum load of 2605 kW, it is assumed that 5% of this load can actively participate in a low-carbon demand response. On a typical day, the load variations of the electricity-consuming enterprise before and after engaging in a low-carbon demand response, along with the corresponding carbon emission factors at specific moments, are illustrated in Figure 12. Upon perceiving the disparities in carbon emissions across different time periods, users aim to reduce their overall carbon footprint. Consequently, users endeavor to minimize electricity consumption during high carbon emission factor periods and shift their energy consumption behavior to time slots characterized by lower carbon emission factors.
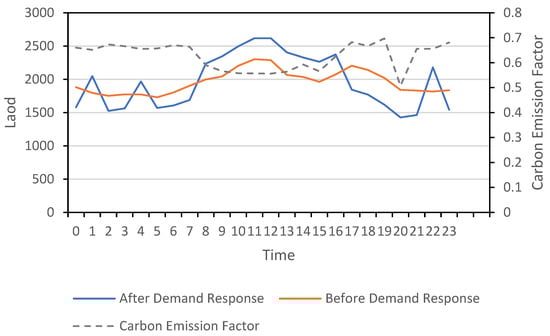
Figure 12.
Load variations before and after low-carbon demand response.
A more detailed examination is undertaken to assess the impact of low-carbon demand response on the financial performance of electricity-consuming enterprises under different electricity pricing environments, specifically the single tariff and peak-valley time-of-use tariff structures. The carbon quota price is based on the current average carbon price in China, approximately 0.051 CNY/kgCO2. The objective is to maximize the profits obtained by users simultaneously in the peak-valley time-of-use electricity pricing and carbon quota markets. Table 3 presents the variations in profitability resulting from changes in user electricity consumption behavior under different pricing environments.
Table 3.
Profitability of enterprises under different demand response modalities.
From Table 3, it can be observed that both low-carbon demand response and electricity demand response concurrently generate revenue for enterprises. In the scenario where both response modalities operate simultaneously, low-carbon demand response can contribute to an additional revenue increase of nearly 26% for the enterprise. This enhancement is conducive to fostering more proactive participation in response initiatives. It should be noted that, in comparison to regions such as Europe, the current carbon prices in China exhibit some disparity. However, with the anticipated escalation of carbon market prices in China, low-carbon demand response is poised to become an increasingly vital market regulatory mechanism. This, in turn, will facilitate simultaneous emission reduction and revenue augmentation for enterprises.
The analysis above indicates that, in comparison to traditional electricity demand response approaches [20], the method proposed in this paper offers a means of regulation and assessment with the primary objective of minimizing carbon emissions in the context of heightened government and corporate attention to the indirect carbon emissions associated with electricity usage. For governmental entities, conducting assessments of carbon reduction potential through low-carbon demand response can optimize industrial layouts and reduce the overall carbon intensity within a region. For enterprises, engaging in a low-carbon demand response becomes a strategic measure to alleviate development constraints when production is environmentally constrained or when there is a need to reduce carbon emissions for exported products to mitigate carbon tariffs.
5. Conclusions
The paper introduces a system carbon reduction mechanism, the low-carbon demand response mechanism, aimed at guiding power system users to actively respond and reduce system carbon emissions. The implementation effectiveness of the low-carbon demand response is analyzed from both the system and electricity user perspectives. Simulation analysis results indicate the following:
- From both the system and individual user perspectives, the low-carbon demand response mechanism can yield carbon reduction benefits.
- In the Fangshan area, as a typical receiving-end power grid, the carbon emission factor of its electricity is significantly influenced by the proportion of renewable energy in externally transmitted power.
- Implementing a low-carbon demand response can effectively reduce the carbon emissions of enterprises in the Fangshan area. The evaluation indicators proposed in this paper can guide electricity users in the Fangshan area to adjust their electricity consumption structure, thereby reducing the overall carbon emissions in the region.
- The potential for the low-carbon demand response varies across different industries. In urban power grids, the construction industry exhibits greater carbon reduction potential compared to agriculture and livestock industries.
Due to the current lack of effective integration between the electricity market and the carbon market, the pricing mechanisms for carbon and electricity operate independently. In the process of the low-carbon demand response, there may be a divergence between electricity price signals and carbon price signals. Therefore, in future research, it is possible to establish a mechanism for aligning prices in the electricity market with those in the carbon market. Building upon this foundation, the integration of electricity demand response and low-carbon demand response can be achieved, providing better guidance for the low-carbon development of electricity users.
Author Contributions
Conceptualization, L.L. and T.Z.; methodology, L.L. and T.Z.; validation, Z.D. and X.P.; formal analysis, Y.X.; investigation, Y.X.; resources, T.Z.; data curation, Y.X.; writing—original draft preparation, Z.D.; writing—review and editing, X.P.; visualization, L.L.; supervision, L.L.; project administration, T.Z. All authors have read and agreed to the published version of the manuscript.
Funding
This work was supported by the Scientific and technical project of State Grid Beijing Electric Power Company (52021121002D).
Informed Consent Statement
This paper does not involve any research on human subjects.
Data Availability Statement
The data presented in this study are available upon request from the corresponding authors. The data are not publicly available due to privacy.
Conflicts of Interest
Authors Zhiqiang Dai, Xun Pei, Yunuo Xu was employed by the company State Grid Beijing Fangshan Electric Power Supply Company. The remaining authors declare that the research was conducted in the absence of any commercial or financial relationships that could be construed as a potential conflict of interest.
References
- Field, C.B.; Barros, V.R. Climate Change 2014: Impacts, Adaptation, and Vulnerability: Working Group II Contribution to the Fifth Assessment Report of the Intergovernmental Panel on Climate Change; Intergovernmental Panel on Climate Change, Ed.; Cambridge University Press: New York, NY, USA, 2014; pp. 154–165. [Google Scholar]
- Huang, L.; Krigsvoll, G.; Johansen, F.; Liu, Y.; Zhang, X. Carbon Emission of Global Construction Sector. Renew. Sustain. Energy Rev. 2018, 81, 1906–1916. [Google Scholar] [CrossRef]
- Zhu, Q.; Peng, X.; Wu, K. Calculation and Decomposition of Indirect Carbon Emissions from Residential Consumption in China Based on the Input–Output Model. Energy Policy 2012, 48, 618–626. [Google Scholar] [CrossRef]
- Group, C.C.J. IEA Report: An Energy Sector Roadmap to Carbon Neutrality in China; OECD Publishing: Paris, France, 2021. [Google Scholar]
- Dones, R.; Heck, T.; Hirschberg, S. Greenhouse Gas Emissions from Energy Systems, Comparison and Overview. Encycl. Energy 2004, 77–95. [Google Scholar] [CrossRef]
- Kang, C.; Zhou, T.; Chen, Q.; Wang, J.; Sun, Y.; Xia, Q.; Yan, H. Carbon Emission Flow From Generation to Demand: A Network-Based Model. IEEE Trans. Smart Grid 2015, 6, 2386–2394. [Google Scholar] [CrossRef]
- Li, B.; Song, Y.; Hu, Z. Carbon Flow Tracing Method for Assessment of Demand Side Carbon Emissions Obligation. IEEE Trans. Sustain. Energy 2013, 4, 1100–1107. [Google Scholar] [CrossRef]
- He, H.; Guan, H.; Zhu, X.; Lee, H. Assessment on the Energy Flow and Carbon Emissions of Integrated Steelmaking Plants. Energy Rep. 2017, 3, 29–36. [Google Scholar] [CrossRef]
- Wang, F.; Shackman, J.; Liu, X. Carbon Emission Flow in the Power Industry and Provincial CO2 Emissions: Evidence from Cross-Provincial Secondary Energy Trading in China. J. Clean. Prod. 2017, 159, 397–409. [Google Scholar] [CrossRef]
- Zhou, T.; Kang, C.; Xu, Q.; Chen, Q.; Xin, J.; Wu, Y. Analysis on Distribution Characteristics and Mechanisms of Carbon Emission Flow in Electric Power Network. Autom. Electr. Power Syst. 2012, 36, 39–44. [Google Scholar]
- Yang, C.; Liu, J.; Liao, H.; Liang, G.; Zhao, J. An Improved Carbon Emission Flow Method for the Power Grid with Prosumers. Energy Rep. 2023, 9, 114–121. [Google Scholar] [CrossRef]
- Li, Y.; Zhang, N.; Du, E.; Liu, Y.; Cai, X.; He, D. Mechanism Study and Benefit Analysis on Power System Low Carbon Demand Response Based on Carbon Emission Flow. Proc. CSEE 2022, 42, 2830–2841. [Google Scholar]
- Silva, C.; Faria, P.; Vale, Z. Demand Response Implementation: Overview of Europe and United States Status. Energies 2023, 16, 4043. [Google Scholar] [CrossRef]
- Cui, Y.; Wang, Y.; Xu, Y.; Zhao, Y. Low-Carbon Economic Dispatching of Microgrid Considering Generalized Integrated Demand Response and Nonlinear Conditions. Energy Rep. 2023, 9, 1606–1620. [Google Scholar] [CrossRef]
- Melgar-Dominguez, O.D.; Pourakbari-Kasmaei, M.; Lehtonen, M.; Sanches Mantovani, J.R. An Economic-Environmental Asset Planning in Electric Distribution Networks Considering Carbon Emission Trading and Demand Response. Electr. Power Syst. Res. 2020, 181, 106202. [Google Scholar] [CrossRef]
- Akal, A.Y. Inflation and Reinforced Concrete Materials: An Investigation of Economic and Environmental Effects. Sustainability 2023, 15, 7687. [Google Scholar] [CrossRef]
- The 14th Five-Year Plan for Energy Development in Fangshan Distrist. Available online: https://www.bjfsh.gov.cn/zfxxgk/ghxx/zxgh/202204/t20220420_40044972.shtml (accessed on 10 November 2021).
- Notice from the Ecology and Environment Department of Fujian Province on Carrying Out the Verification and Quota Settlement of Carbon Emission Reports for the Year 2019. Available online: https://sthjt.fujian.gov.cn/zwgk/zfxxgkzl/zfxxgkml/mlwrfz/202005/t20200518_5266939.htm (accessed on 18 May 2020).
- State Grid Beijing Municipal Power Company’s Announcement of Agent Power Purchase Prices in January 2024. Available online: https://csc-static.sgcc.com.cn:28888/omg-static/99312282052107651813001037420121.html (accessed on 28 December 2023).
- Fan, W.; Tan, Z.; Li, F.; Zhang, A.; Ju, L.; Wang, Y.; De, G. A two-stage optimal scheduling model of integrated energy system based on CVaR theory implementing integrated demand response. Energy 2023, 263, 125783. [Google Scholar] [CrossRef]
Disclaimer/Publisher’s Note: The statements, opinions and data contained in all publications are solely those of the individual author(s) and contributor(s) and not of MDPI and/or the editor(s). MDPI and/or the editor(s) disclaim responsibility for any injury to people or property resulting from any ideas, methods, instructions or products referred to in the content. |
© 2024 by the authors. Licensee MDPI, Basel, Switzerland. This article is an open access article distributed under the terms and conditions of the Creative Commons Attribution (CC BY) license (https://creativecommons.org/licenses/by/4.0/).