
Methodology for Modernizing Local Gas-Fired District Heating Systems into a Central District Heating System Using Gas-Fired Cogeneration Engines—A Case Study


Abstract
1. Introduction
2. Materials and Methods
2.1. Methodology—Steps to Be Taken when Modernizing a Gas Heat Source to a Cogeneration System
- Gathering Data on the Existing District Heating System
- A. 1.
- Monthly and annual amount of heat produced.
- A. 2.
- Monthly and annual amount of heat sold (for heating purposes and heating domestic hot water).
- A. 3.
- Monthly and annual amount of consumed natural gas.
- A. 4.
- Average thermal efficiency of existing production sources.
- A. 5.
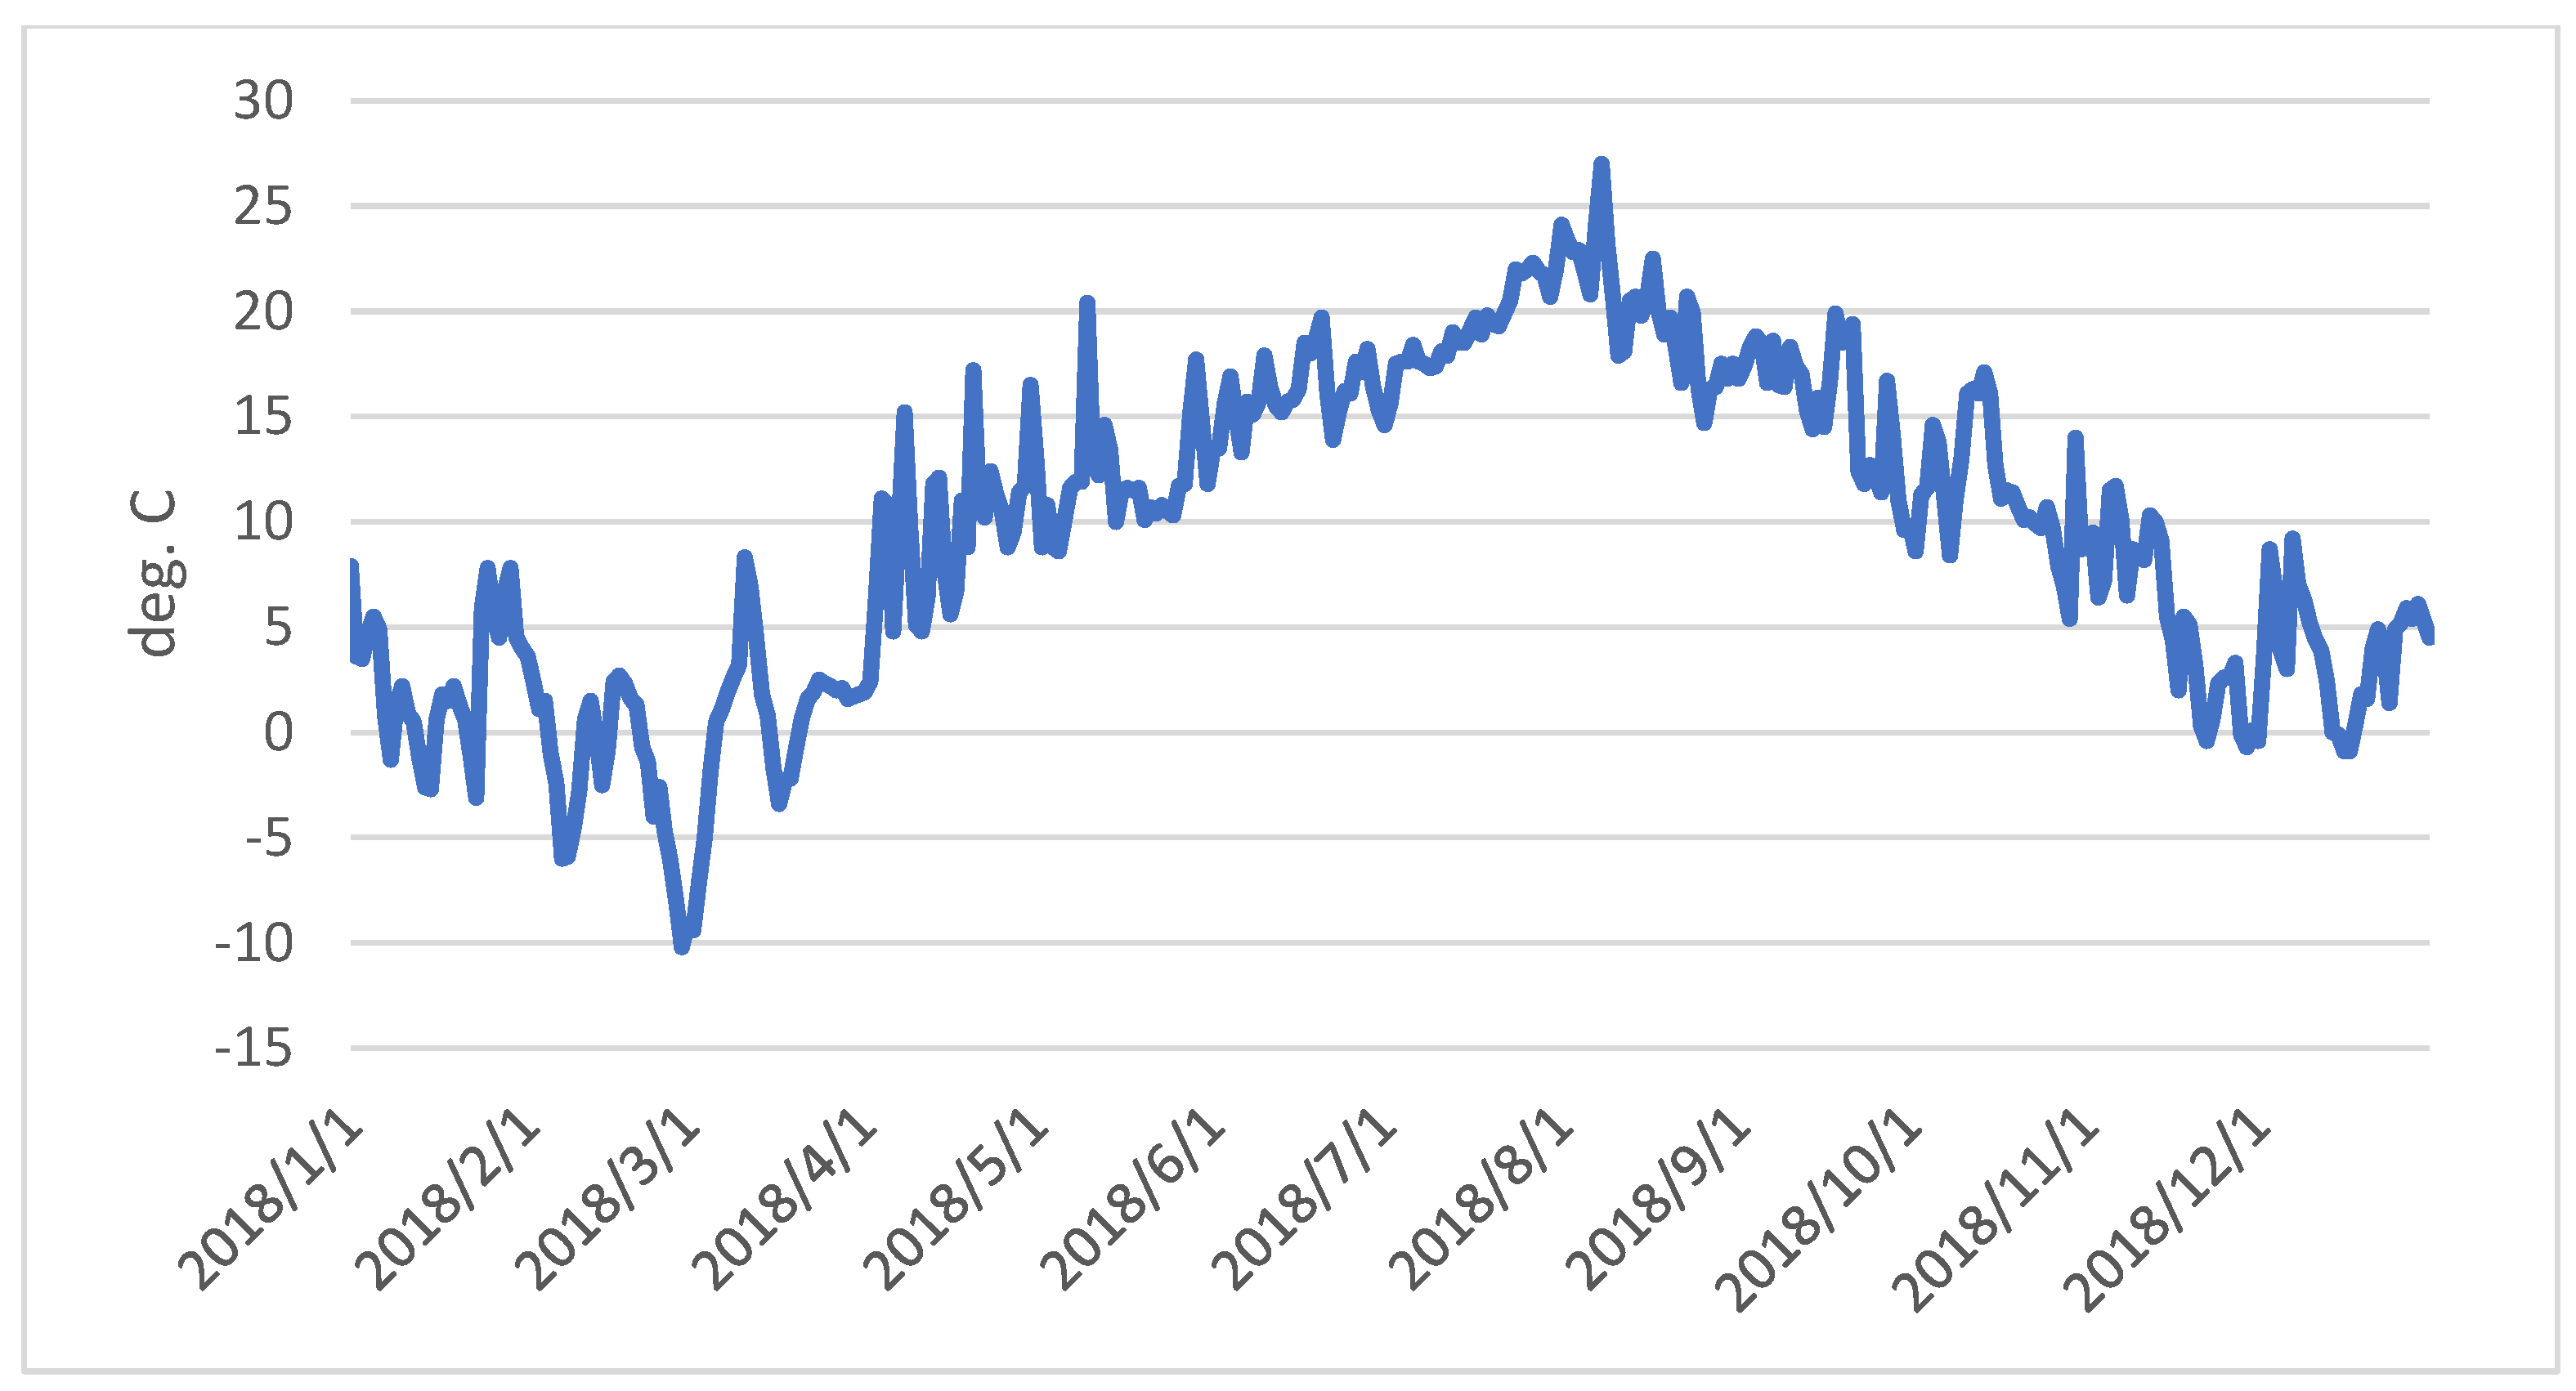
- Daily information about the outdoor temperature for a given location.
- Minimum daily average data to perform calculations;
- It is desirable to use hourly average data to obtain more accurate results;
- Using average data from outside temperature sensors connected to the substation temperature controller may lead to large calculation errors.
- Concept Development
- B. 1.
- Integration of existing heat sources into a unified district heating network.
- Depending on required supply temperature:
- ⚬
- If the system is already low temperature, then no additional modifications are needed.
- ⚬
- If the system is ultra-low temperature, then no additional modifications at the substation side are needed. We should consider recalculating the selection of a three-way valve in order to keep minimum temperature in return pipe at engine side at 70 °C (engine must be running at parameters 90/70, despite required temperatures at district heating side).
- ⚬
- If the system is medium temperature (above 100 °C), we should consider two variants:
- Maintain existing temperature level and design peak gas boilers to achieve higher supply temperature (above 90 °C, i.e., the maximum supply temperature of the gas engine). This has lower investment costs.
- Modernize all heating substations to meet new requirements at the district heating system side (maximum supply temperature 90 °C). This has higher investment costs but lower heat losses. The main scope of work necessary to be performed on the substation side is as follows:
- Increase the heat exchanger surface;
- Replace regulation valves to work at higher water flow.
- Depending on required available pressure:
- ⚬
- If the modernization covers only the replacement of existing boilers with a group substation, then the required available pressure at the building side (after the heat exchanger) is at the same level as before (it was generated by the main circulation pumps at the boilers). For the district heating system side (before the heat exchanger) it must be calculated taking into account the pressure drop at maximum heating water flow especially for:
- heat exchanger,
- control valve,
- differential pressure regulator.
- ⚬
- If the modernization covers the liquidation of boilers and installation substation in every single building, then the same calculations must be performed as mentioned above with comments below:
- For the building with modernized internal heating installation made of plastics with appropriately selected diameters recommended available pressure at the building side is 50 kPa at maximum heat demand,
- For an old installation made of steel pipes, where there was no water treatment, recommended available pressure at the building side is 100 kPa at maximum heat demand,
- B. 2.
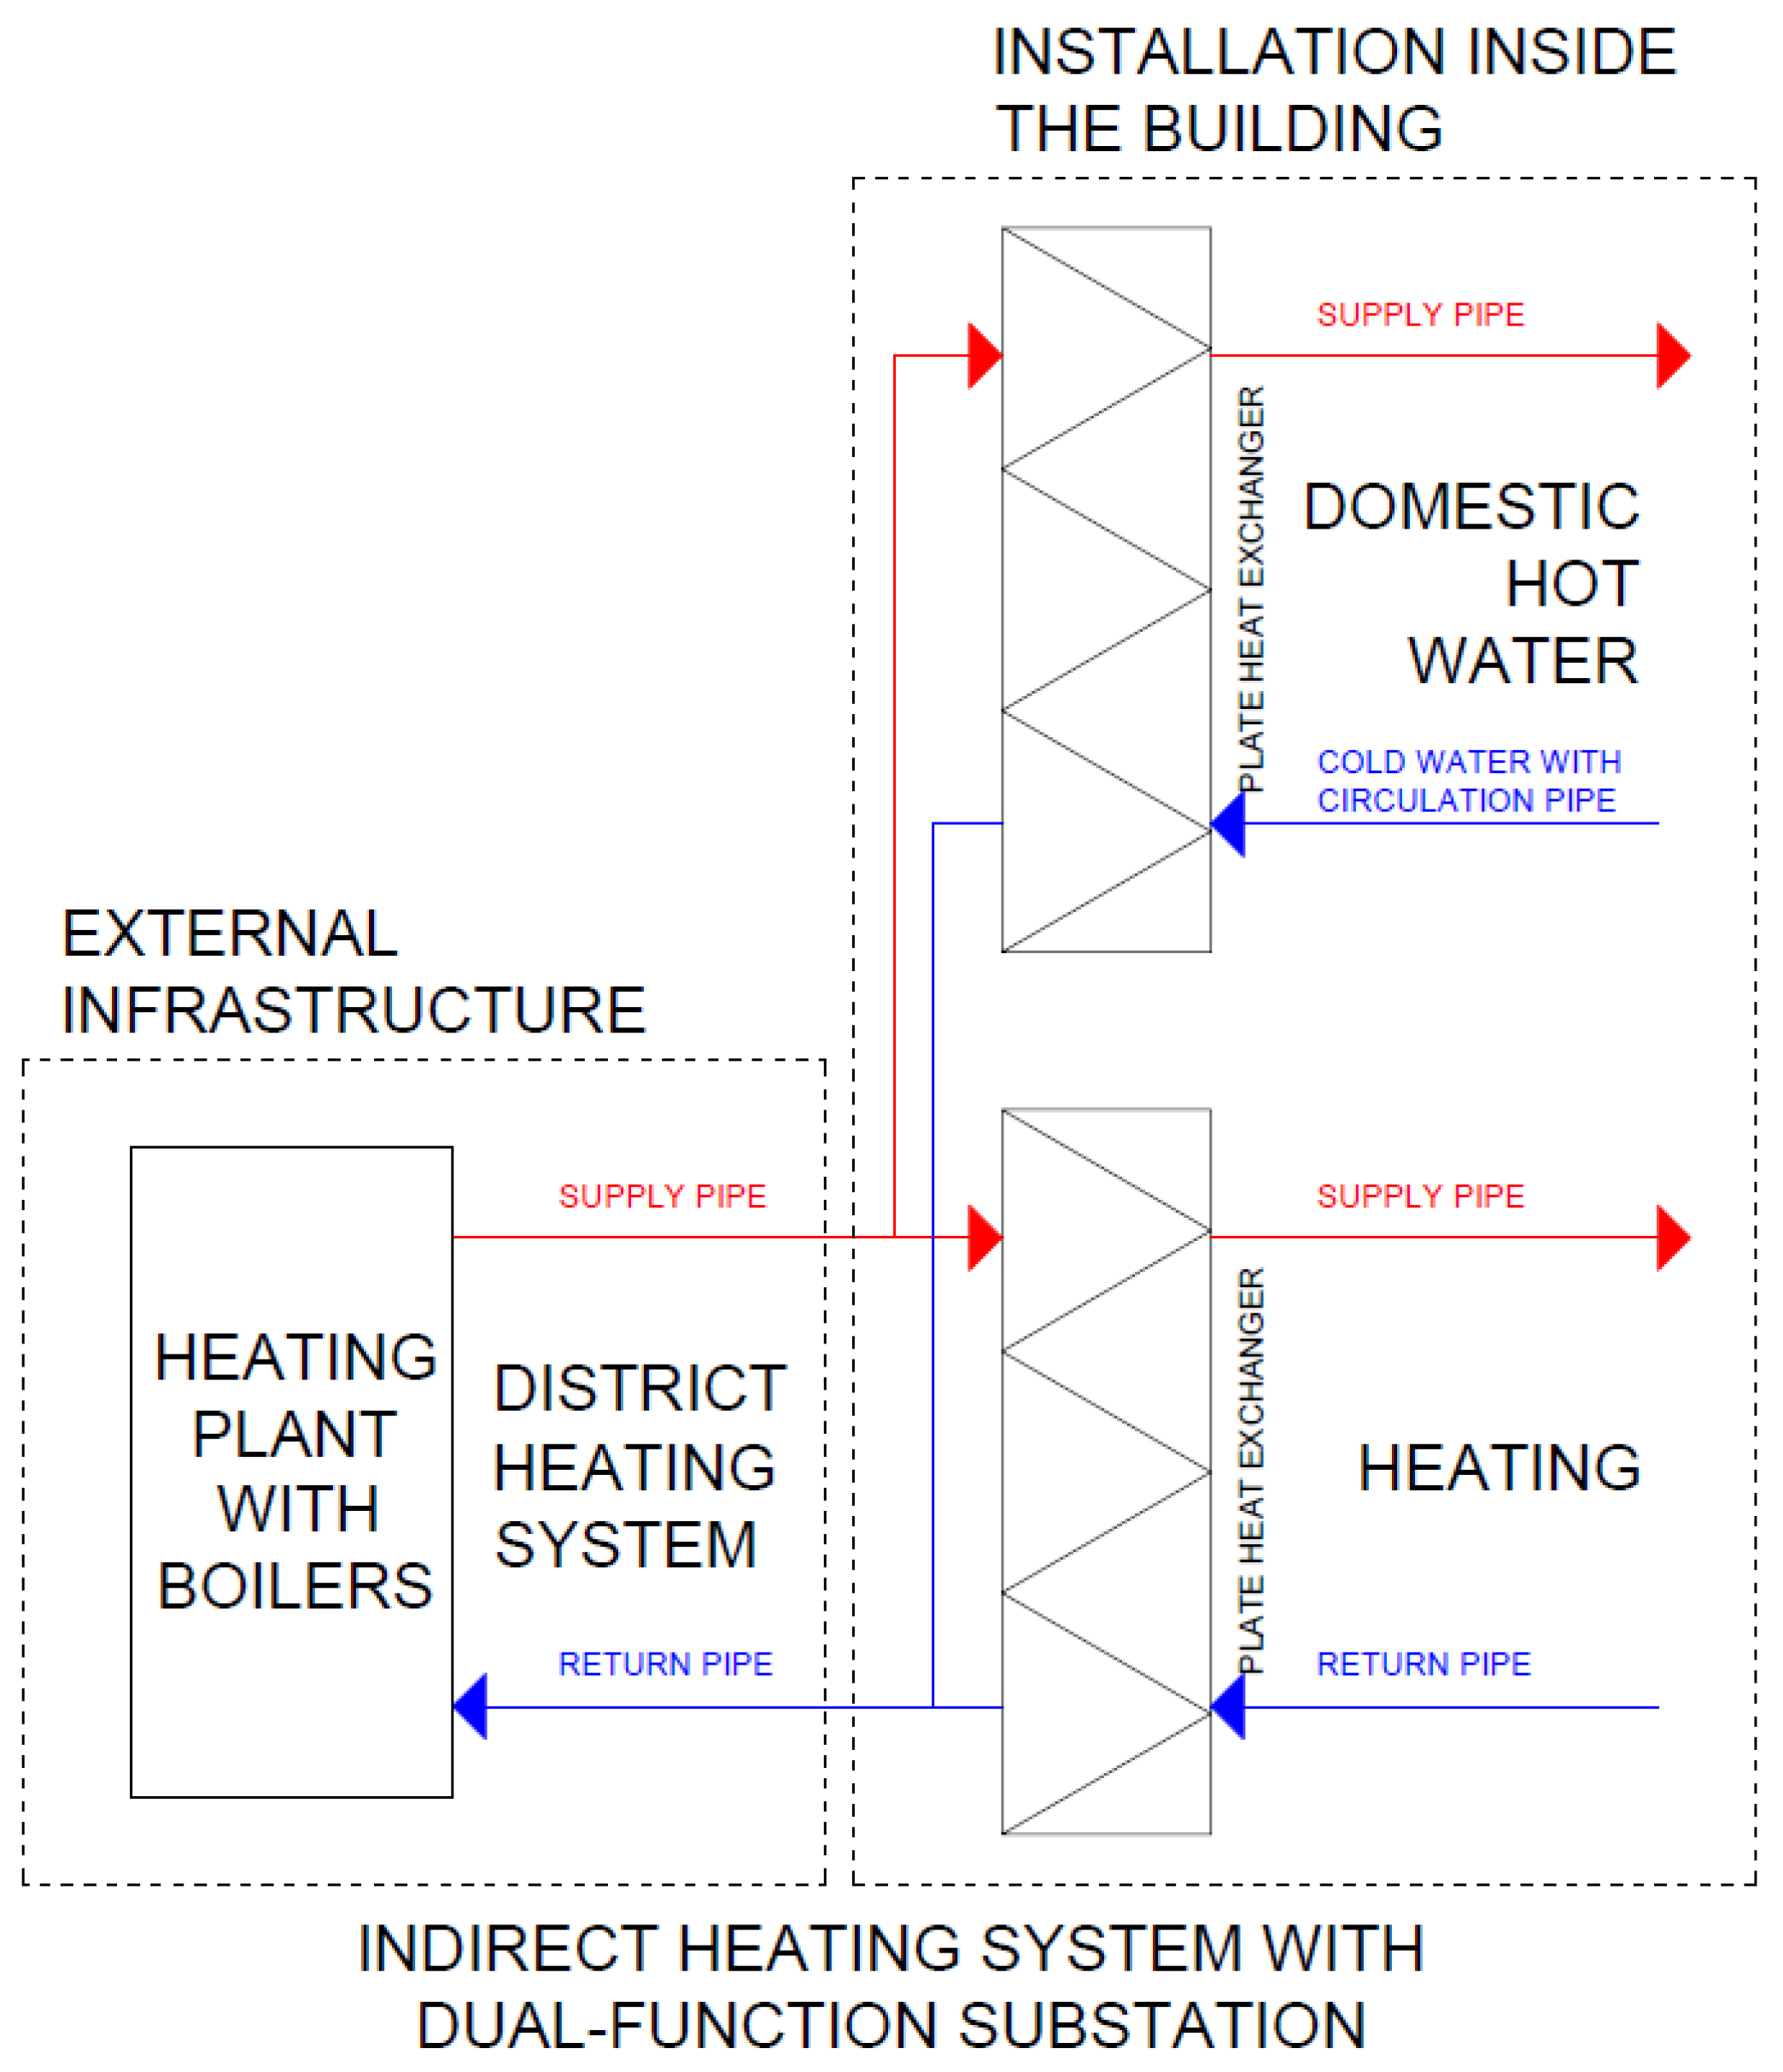
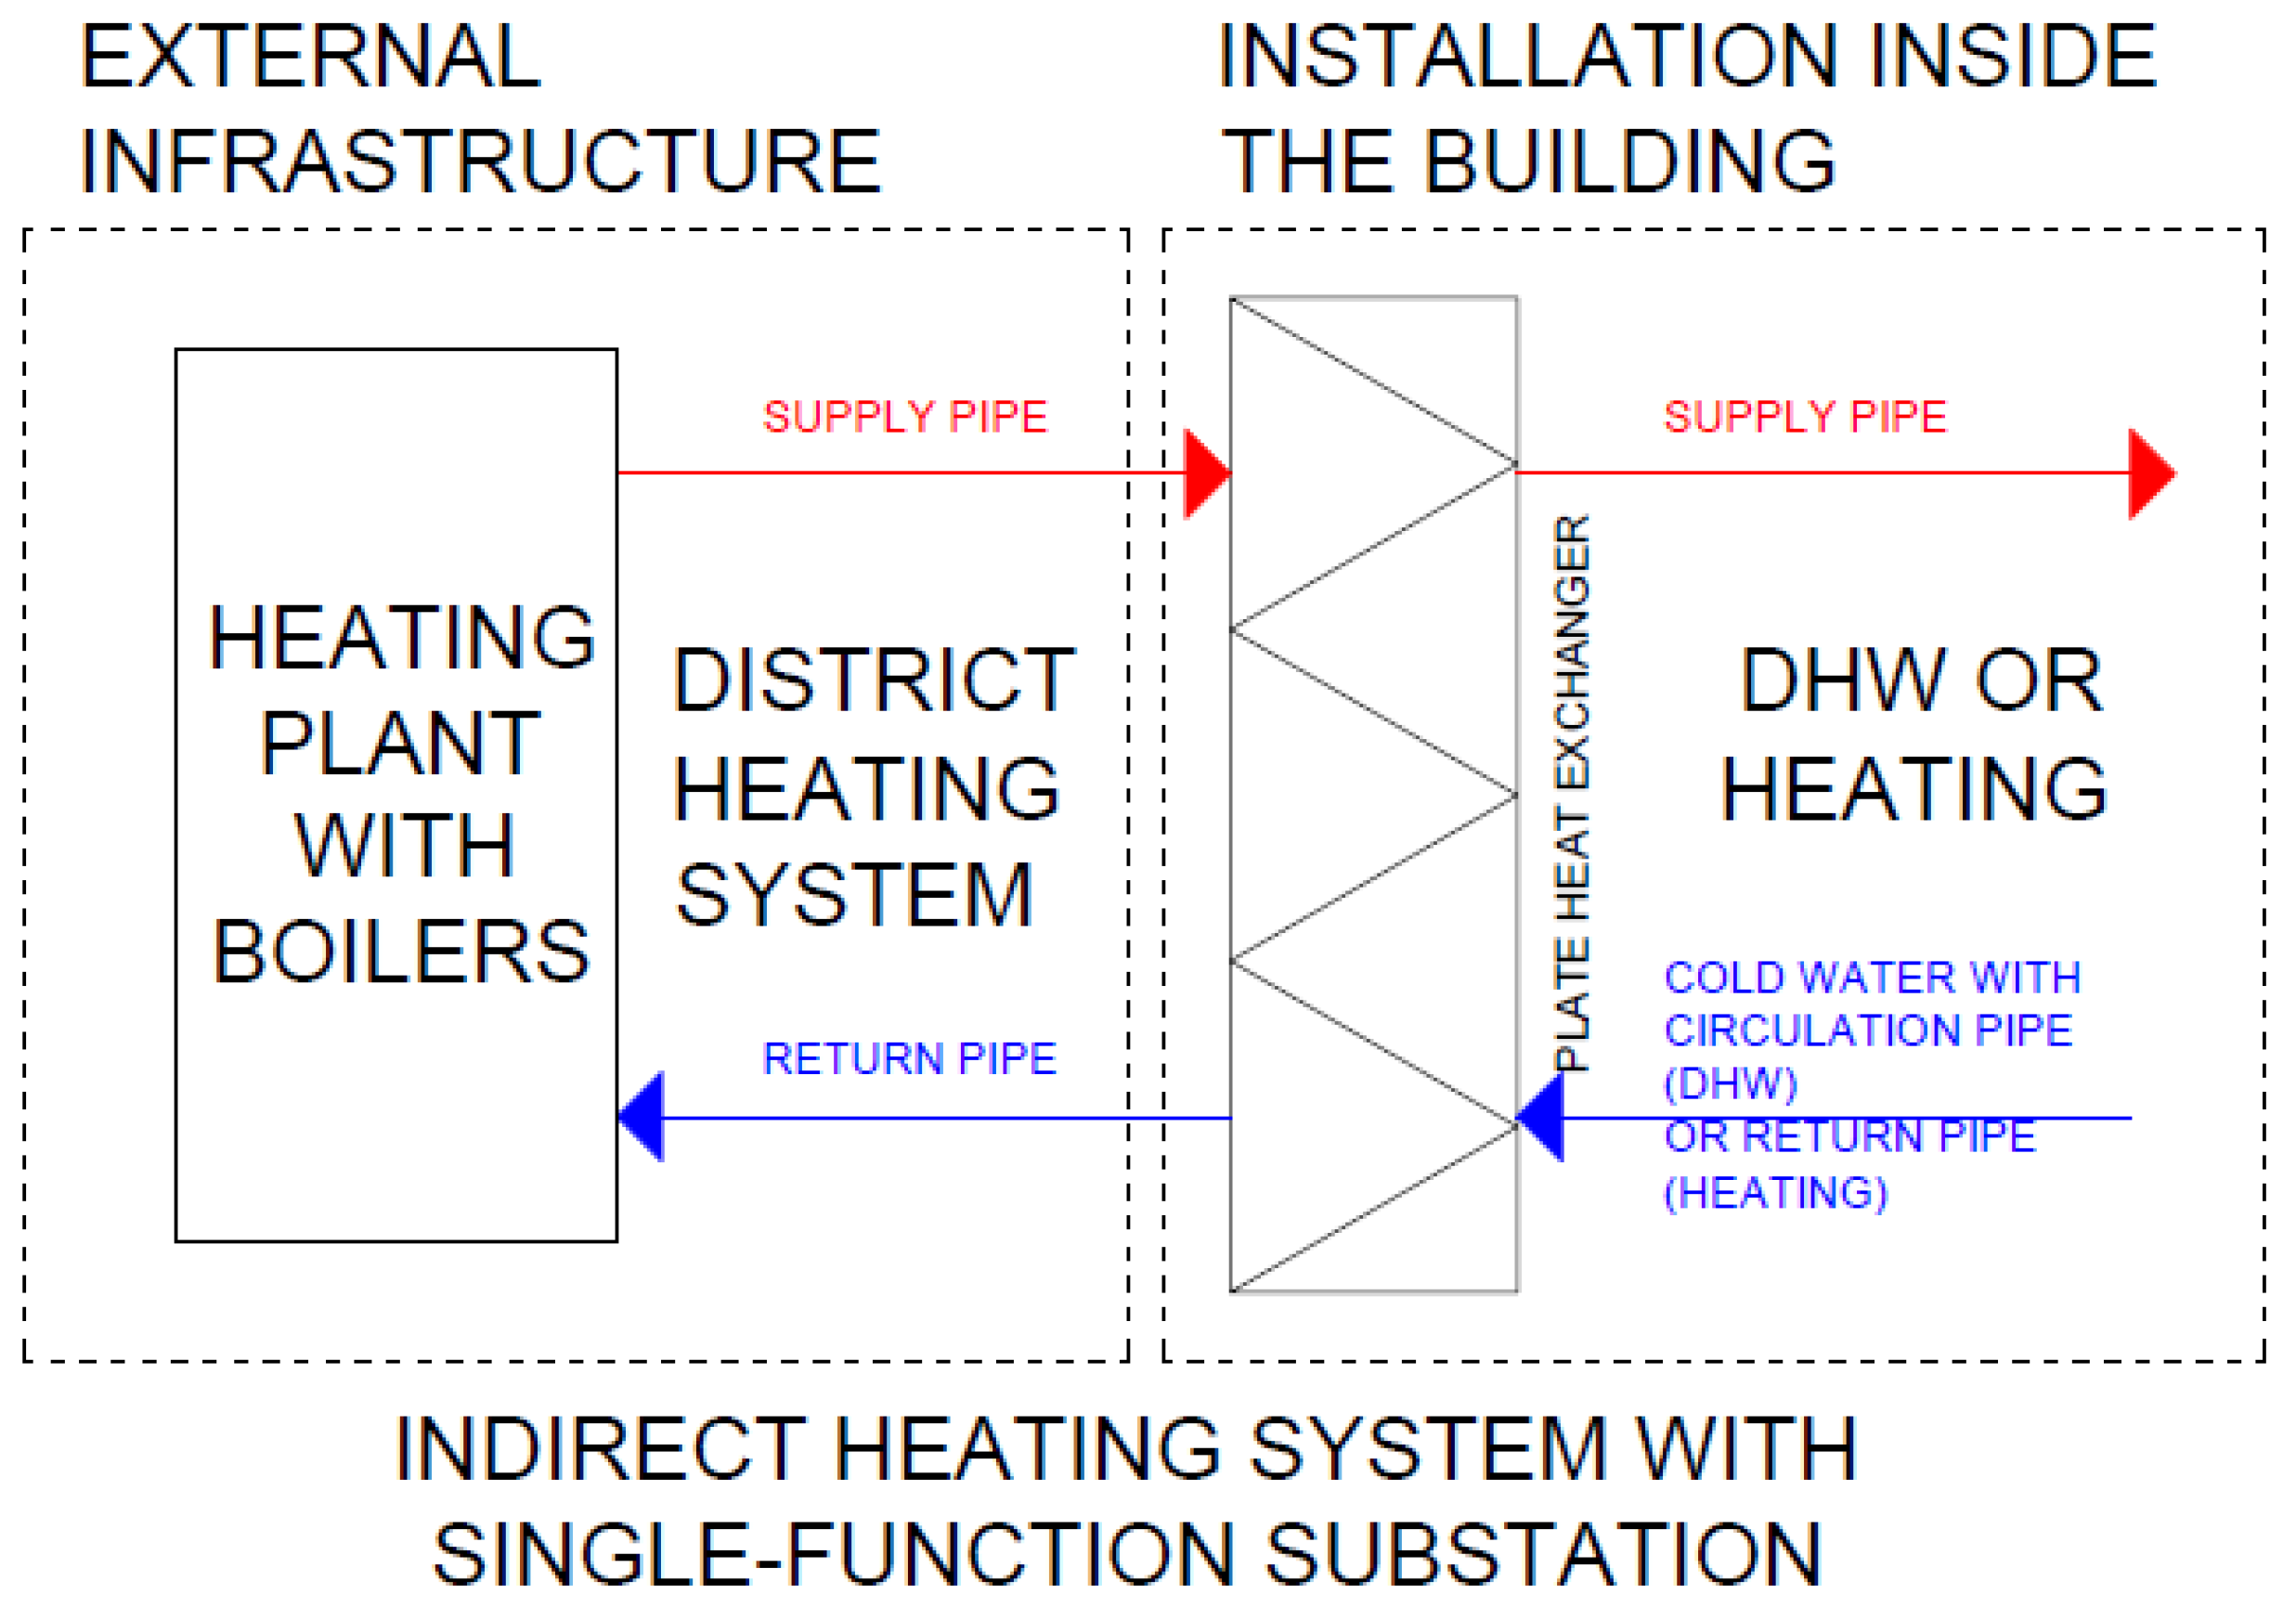
- Modernization of gas boilers into group or individual single- or dual-function substations.
- If the heating plant supplies only heat for heating purposes, then two variants can be chosen, depending on technical and financial issues.
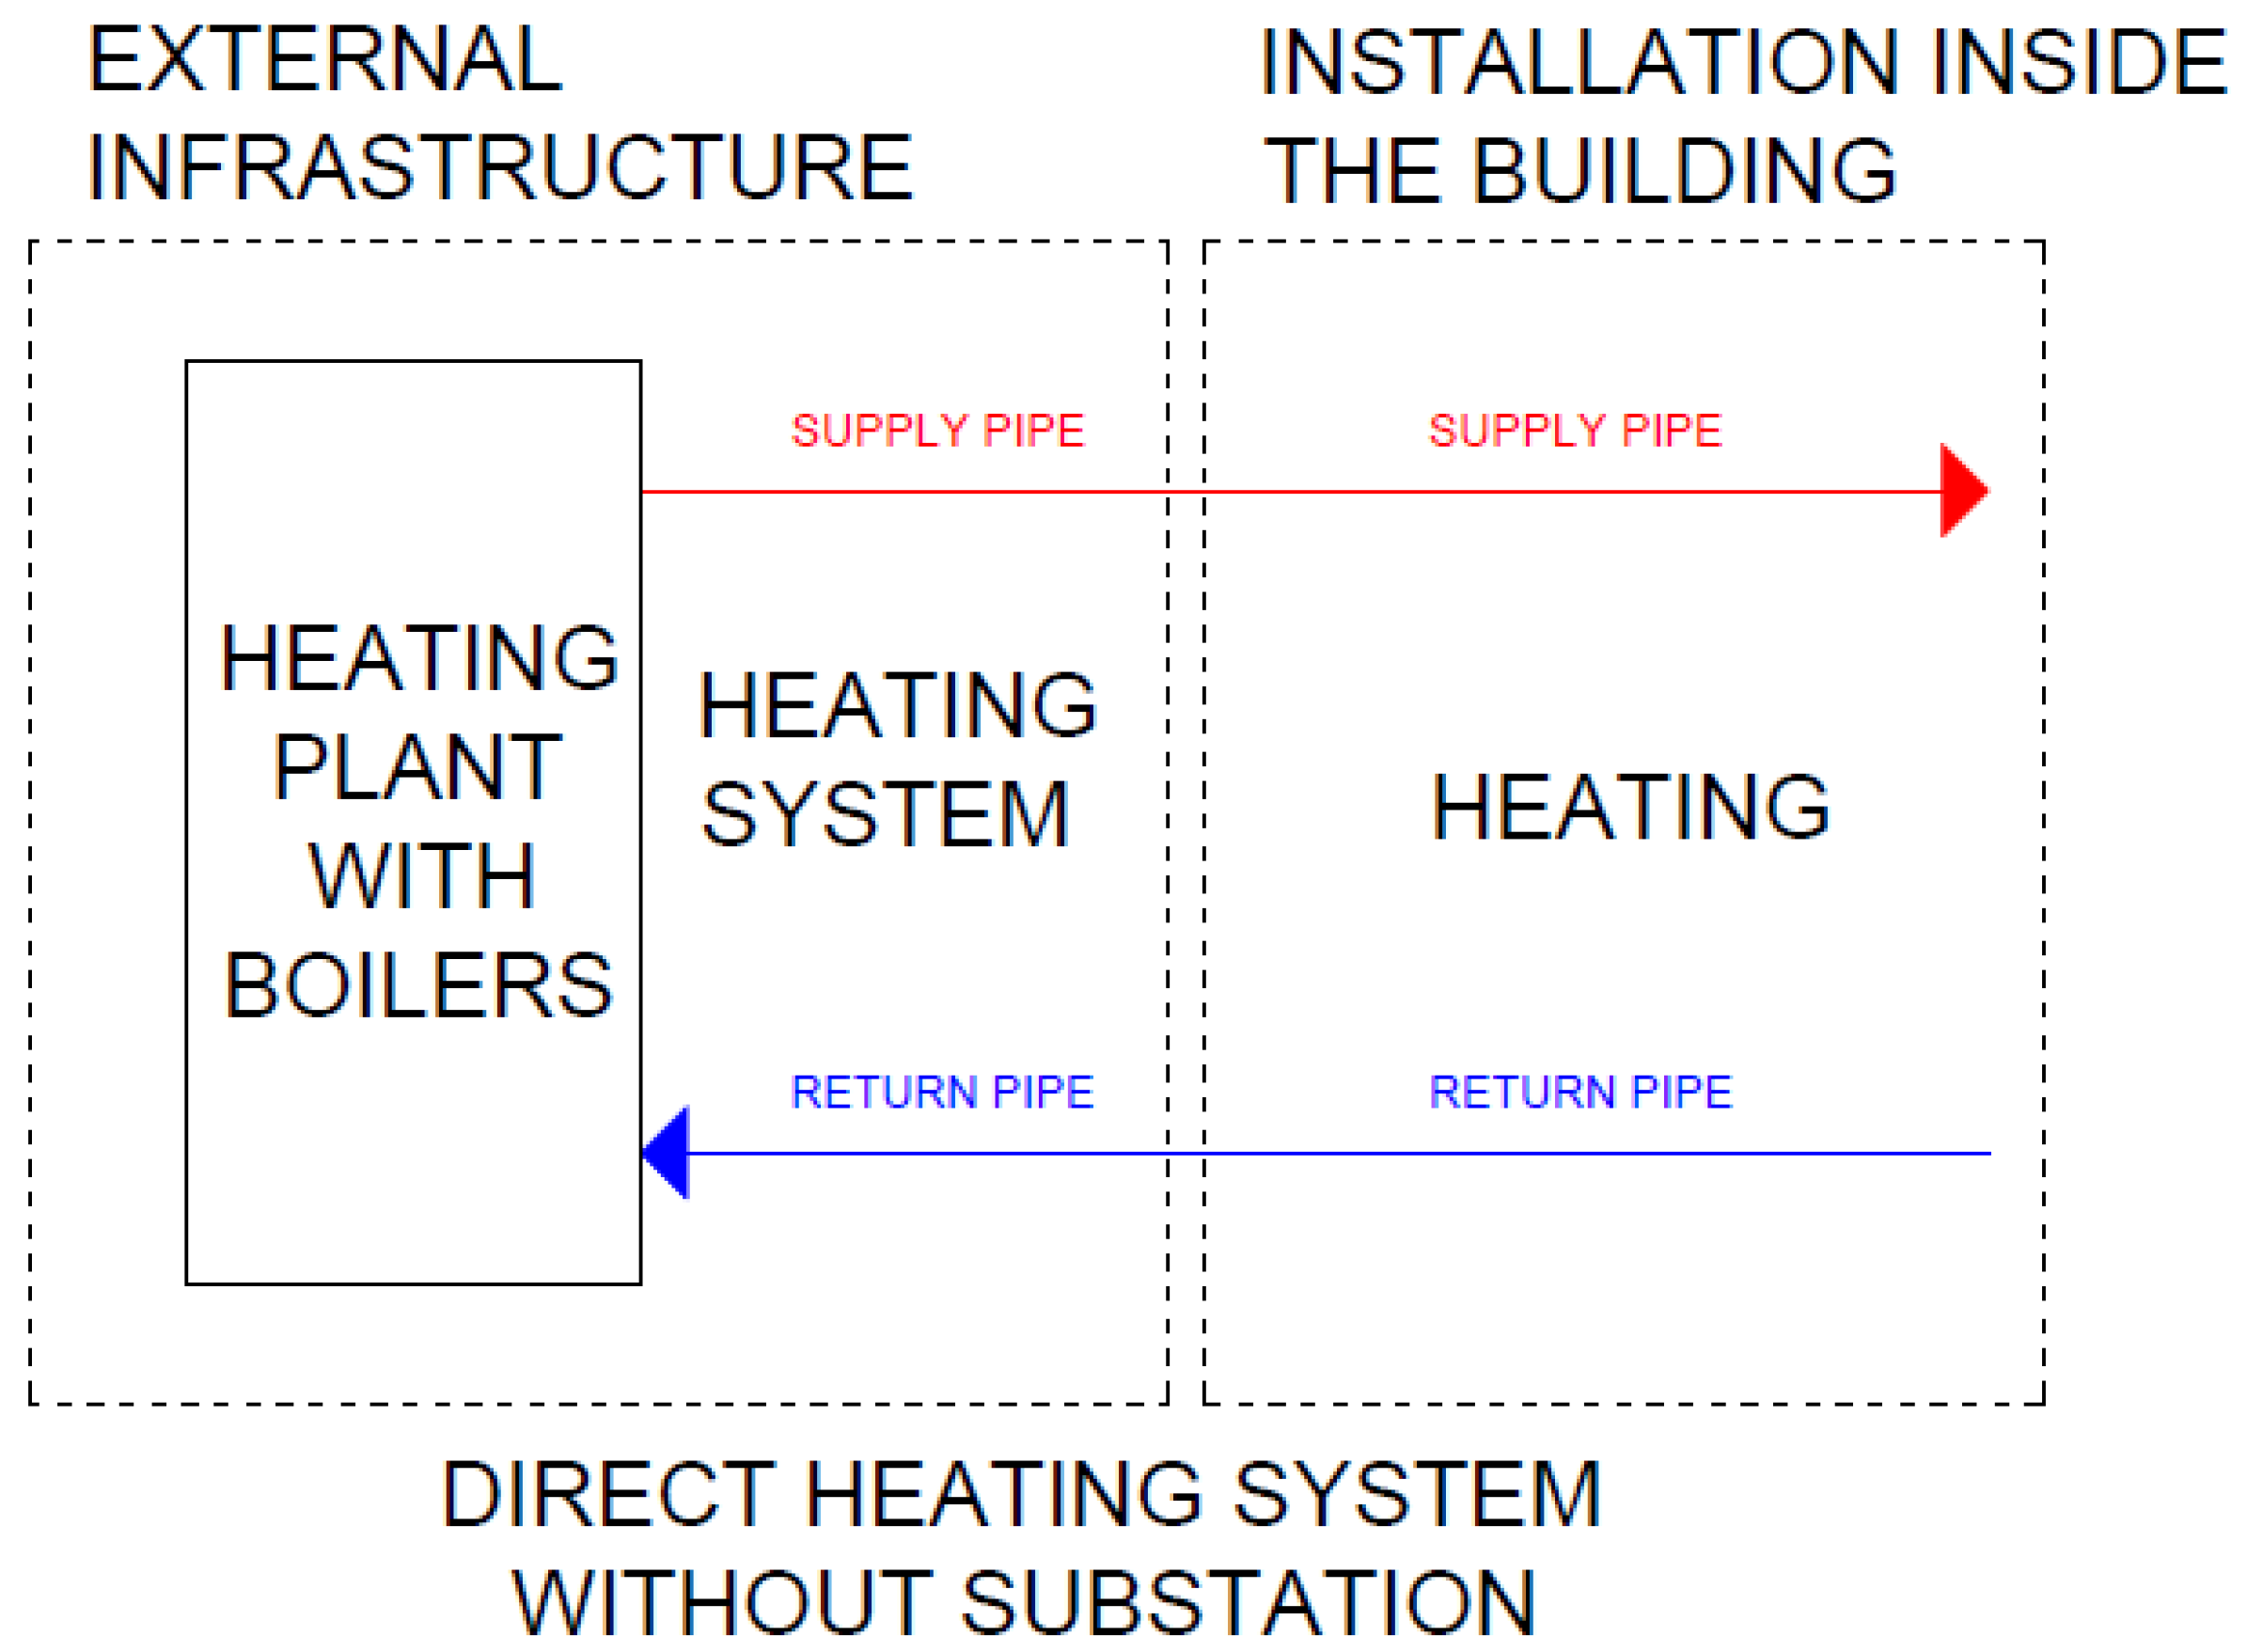
- In the first variant, each existing distribution point in the building will be modernized, and a single-function substation will be installed. In this case, it will be necessary to design equipment for the new parameters of the district heating network, both in terms of available pressure and supply temperature, as well as the desired return temperature. Additionally, the existing underground heating installation connecting buildings to the heating plant will be used as the district heating network if the technical condition of the insulation, the required pipe diameter, and the material of the pipelines allow for operation with a heating water pressure of up to 0.6 MPa. Otherwise, the existing local district heating network will also require modernization in terms of the technical parameters mentioned earlier, i.e., pipe diameter and material, along with insulation thickness.
- In the second variant, the existing heating installation in buildings along with underground pipelines will be maintained in the current state. Only the heating boiler will undergo modernization, being eliminated and replaced with a single group substation. In this case, only one substation will need to be designed, which can be adjusted to the new operating conditions on the primary side (district heating network), as well as adapted to the secondary side corresponding to the previous operational parameters (i.e., for the needs of a low-temperature or medium-temperature heating system, depending on the option selected in point B. 1.). The downside of this solution is the lack of the possibility for individual temperature control and billing for the consumed heat, due to the lack of hydraulic separation between the buildings connected to the heat node. The advantage of this solution is significantly lower investment costs.
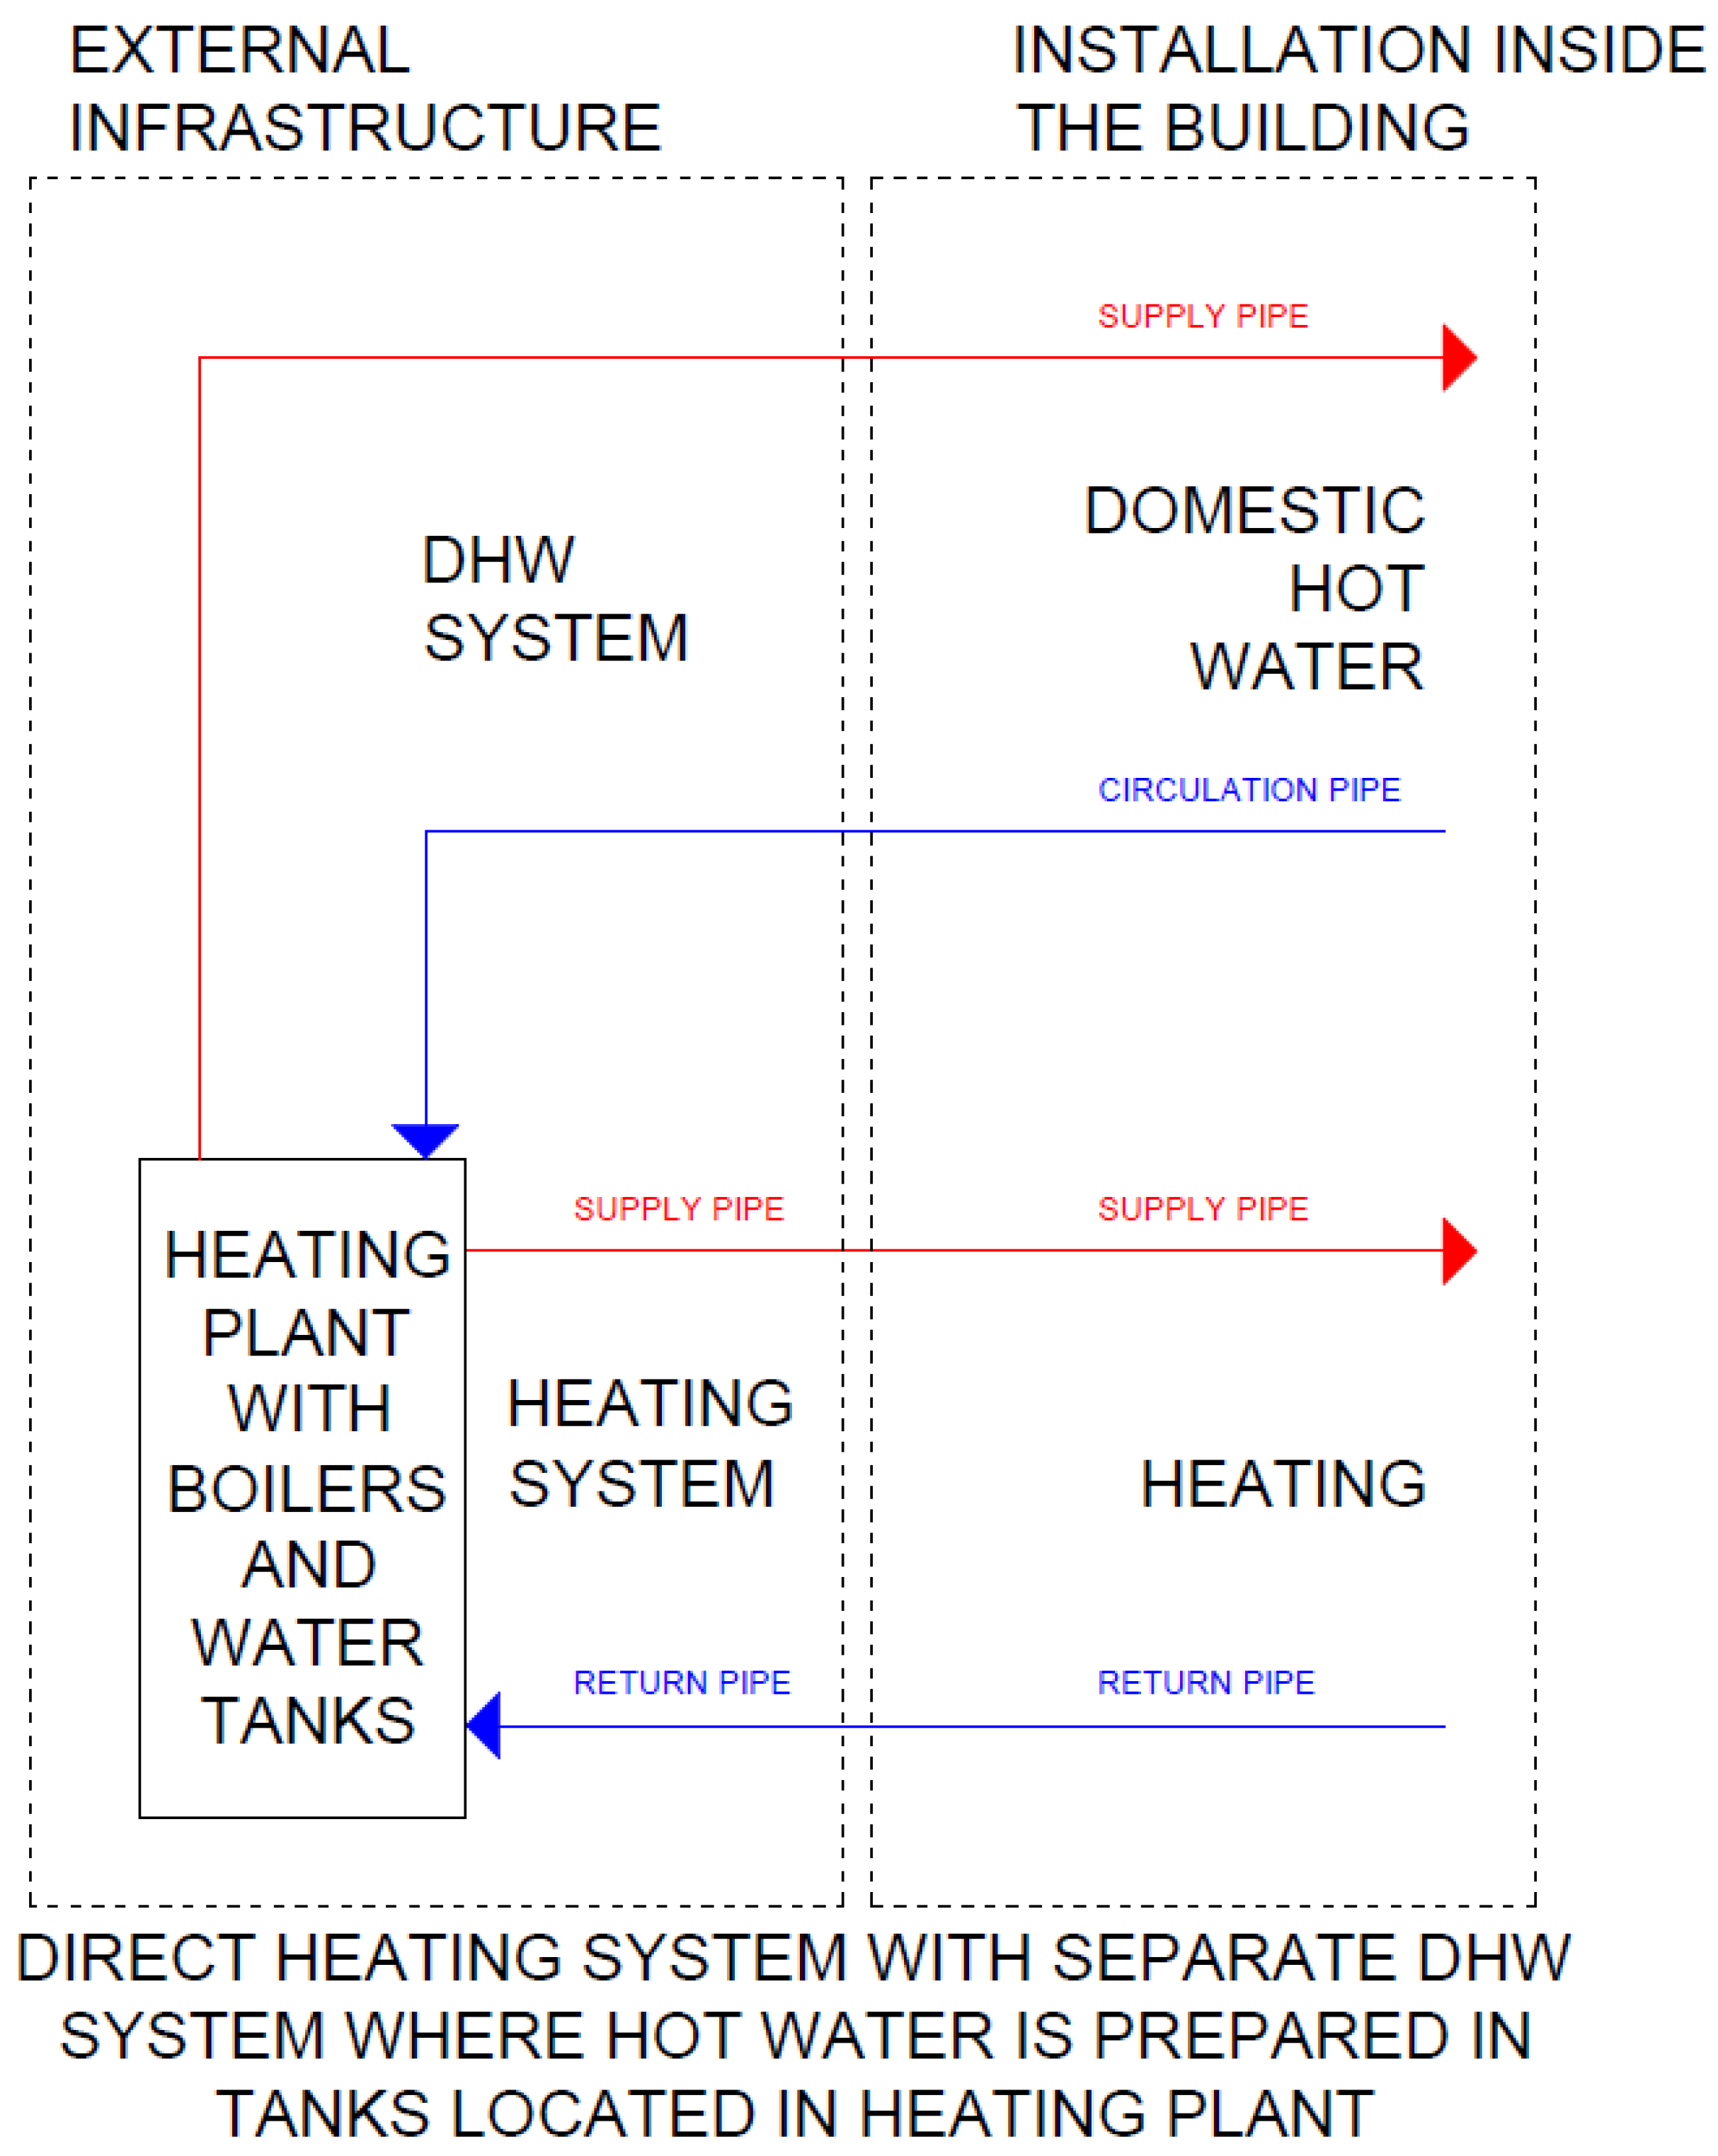
- If the heating plant supplies heat for domestic hot water purposes, then two variants can also be chosen, depending on individual (1) or group (2) solutions:
- The advantage of this variant is the possibility of individual temperature regulation and billing for the consumed energy only using a heat meter. This requires investment in each building, significantly increasing investment costs. Additionally, it is necessary to analyze the possibility of using the central heating installation that connects the heating plant with the building to meet the operating parameters of the district heating network, both for supplying thermal power for heating and DHW. An often-overlooked advantage is the operation of underground pipelines throughout the year (in contrast to the four-pipe system, where the pipes for central heating operate only seasonally), significantly extending the maintenance-free operating time of such an installation. Another advantage is the small water capacity of the installation for which thermal overheating can be implemented to protect against legionella. It is worth mentioning that it is easier to regulate the circulation of domestic hot water in one building than in a group of buildings.
- To reduce the investment costs, it is possible to install a group substation for domestic hot water preparation. In this variant, DHW is prepared in a central heat exchanger located in a group substation. The delivery of hot water to residents is carried out using circulation pumps and additional pipelines (supply and return) which transport the heated water to apartments and return a portion of it to maintain the appropriate temperature in the circulation circuits. In this case, the underground heat transmission infrastructure is in a four-pipe system (two pipelines for both central heating and DHW). Billing consumers for the water consumed involves installing water meter systems (on supply and circulation) at the entrance to each building, coupled with a single heat meter system in the group substation. Billing for the energy used for domestic hot water involves determining the total water heating coefficient for the entire housing estate, calculated as the ratio of the heat consumed to the amount of water used (as described in formula no. 5). Then, for each building, the difference between the supply and return water meters is determined, indicating the amount of water consumed by residents. This value is multiplied by the heating coefficient for the entire estate, and the resulting amount of consumed heat is the basis for issuing the settlement document. This calculation method can pose significant operational difficulties in the event of a water meter system failure in one building, with no reliable way to obtain information about its consumption. In such a situation, the amount of heat recorded by the main heat meter will be billed to the remaining consumers, who will cover the cost of water not accounted for by the damaged water meter. Another drawback is that the thermal modernization of DHW installation in one building does not translate into benefits solely for that property, but for all consumers. This is because the amount of heat used for heating is read from the heat meter located in the heating plant. Furthermore, a lack of adequate DHW circulation can lead to the development of Legionella bacteria. This is compounded by the extensive installation (including underground sections), which often makes it impossible to achieve proper DHW overheating to prevent the proliferation of harmful bacteria.
- C.
- Calculations
- C. 1.
- Heat losses in the transmission within the existing district heating system and in the designed heating pipeline.
- C. 2.
- Average daily thermal power for domestic hot water and central heating purposes.
- D.
- Selection of Cogeneration Engines along with Gas Peak Boilers (if necessary).
- D. 1.
- Total heating power for the new CHP plant.
- D. 2.
- Selection of cogeneration engines (depending on the variant selected in point B. 1.):
- Main heat source—covering 100% of heat demand for district heating system.
- Additional heat source:
- Depending on installation method:
- Working in parallel with the gas peak boilers—connecting cogeneration engines with the use of buffer vessels to maintain a constant water flowrate independent of variable flow in the district heating network. Recommended for low-temperature district heating systems.
- Working in serial—heating up water in return pipeline—to avoid increased heat losses because of higher water temperature locations. Should be close to the heating plant with boilers. Recommended for high-temperature district heating systems.
- Depending on the purpose:
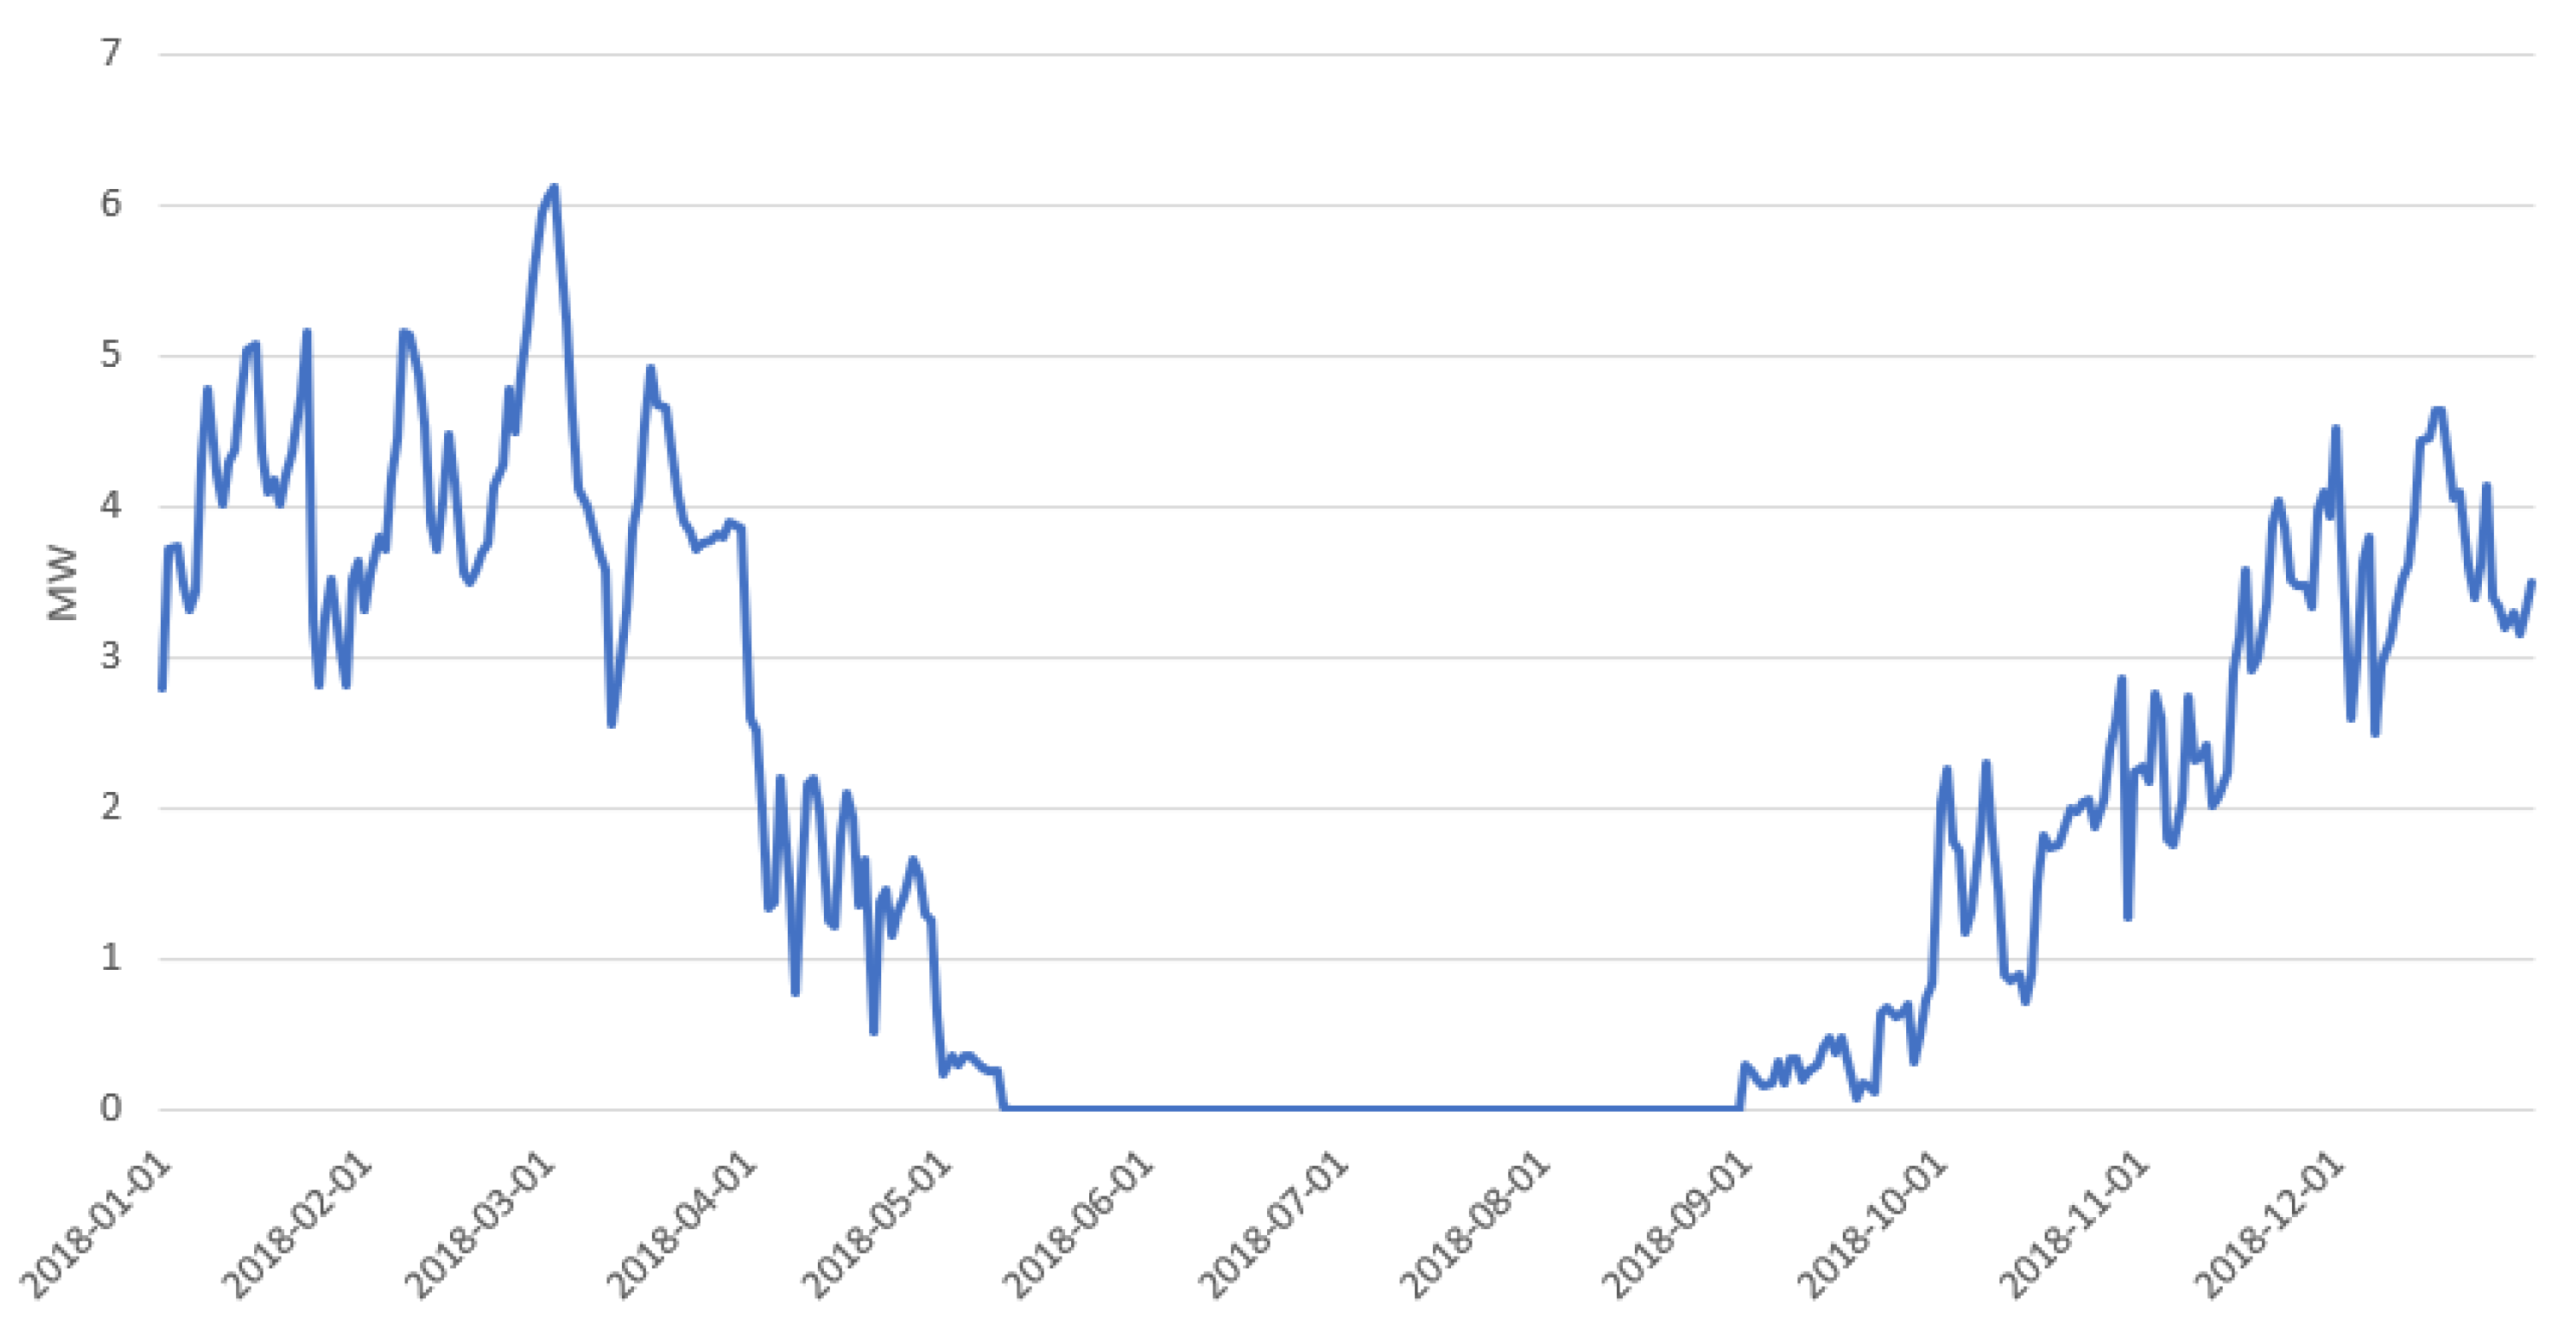
- In order to produce heating power for domestic hot water only. The engine (or two of them to increase reliability) is selected to match the heating power calculated for the summer period.
- In order to produce heating power for domestic hot water and heating purposes. Several engines (depending on budget and reliability considerations) are selected to maximize the working time of each machine.
- D. 3.
- Selection of gas boilers (if necessary):
- To provide the missing heating power between the maximum hour average heating load and the total heating power that cogeneration units can supply (cheaper solution).
- To provide the entire required thermal power by gas boilers in the event of the shutdown or failure of all cogeneration units (more expensive solution).
- E.
- Economic Analysis
- E. 1.
- Revenue from electricity sales.
- E. 2.
- Revenue from thermal energy sales.
- E. 3.
- Cost of purchasing natural gas.
- F.
- Environmental Analysis
- F. 1.
- Calculation of annual reduction in carbon dioxide emissions into the atmosphere.
2.2. Formulas Used in the Calculations
- denotes the total length of the designed heating network [m],
- denotes heat losses based on the manufacturer’s data, considering the calculated temperature in the supply and return pipes and the diameter of the pipe [W/m],
- is the operating time of the heating network [h].
- is the amount of heat produced by gas boilers [GJ],
- is the consumed amount of natural gas [m3],
- is the heating value of the fuel [].
- is the amount of heat [GJ],
- is the heat transfer coefficient ,
- is the surface area ,
- is the temperature difference [K],
- is the operating time .
- is the individual amount of consumed heat for DHW [GJ],
- is the total amount of consumed heat for DHW, measured at the group substation [GJ],
- is the amount of hot water supplied to the building ,
- is the amount of circulating water returning from the building ,
- is the amount of cold water used for heating, measured at the group substation .
3. Results
3.1. A. Gathering Data on the Existing District Heating System
- A. 1.
- Monthly and annual amount of heat produced.
- A. 2.
- Monthly and annual amount of heat sold (for heating purposes and heating domestic hot water).
- A. 3.
- Monthly and annual amount of consumed natural gas.
- A. 4.
- Average thermal efficiency of existing production sources.
- A. 5.
- Daily information about the outside temperature for a given location.
3.2. B. Concept Development
- B. 1.
- Integration of existing heat sources into a unified district heating network.
- B. 2.
- Modernization of gas boilers into group or individual single- or dual-function substations.
3.3. C. Calculations
3.3.1. Heat Losses of the Existing Local Heating Networks
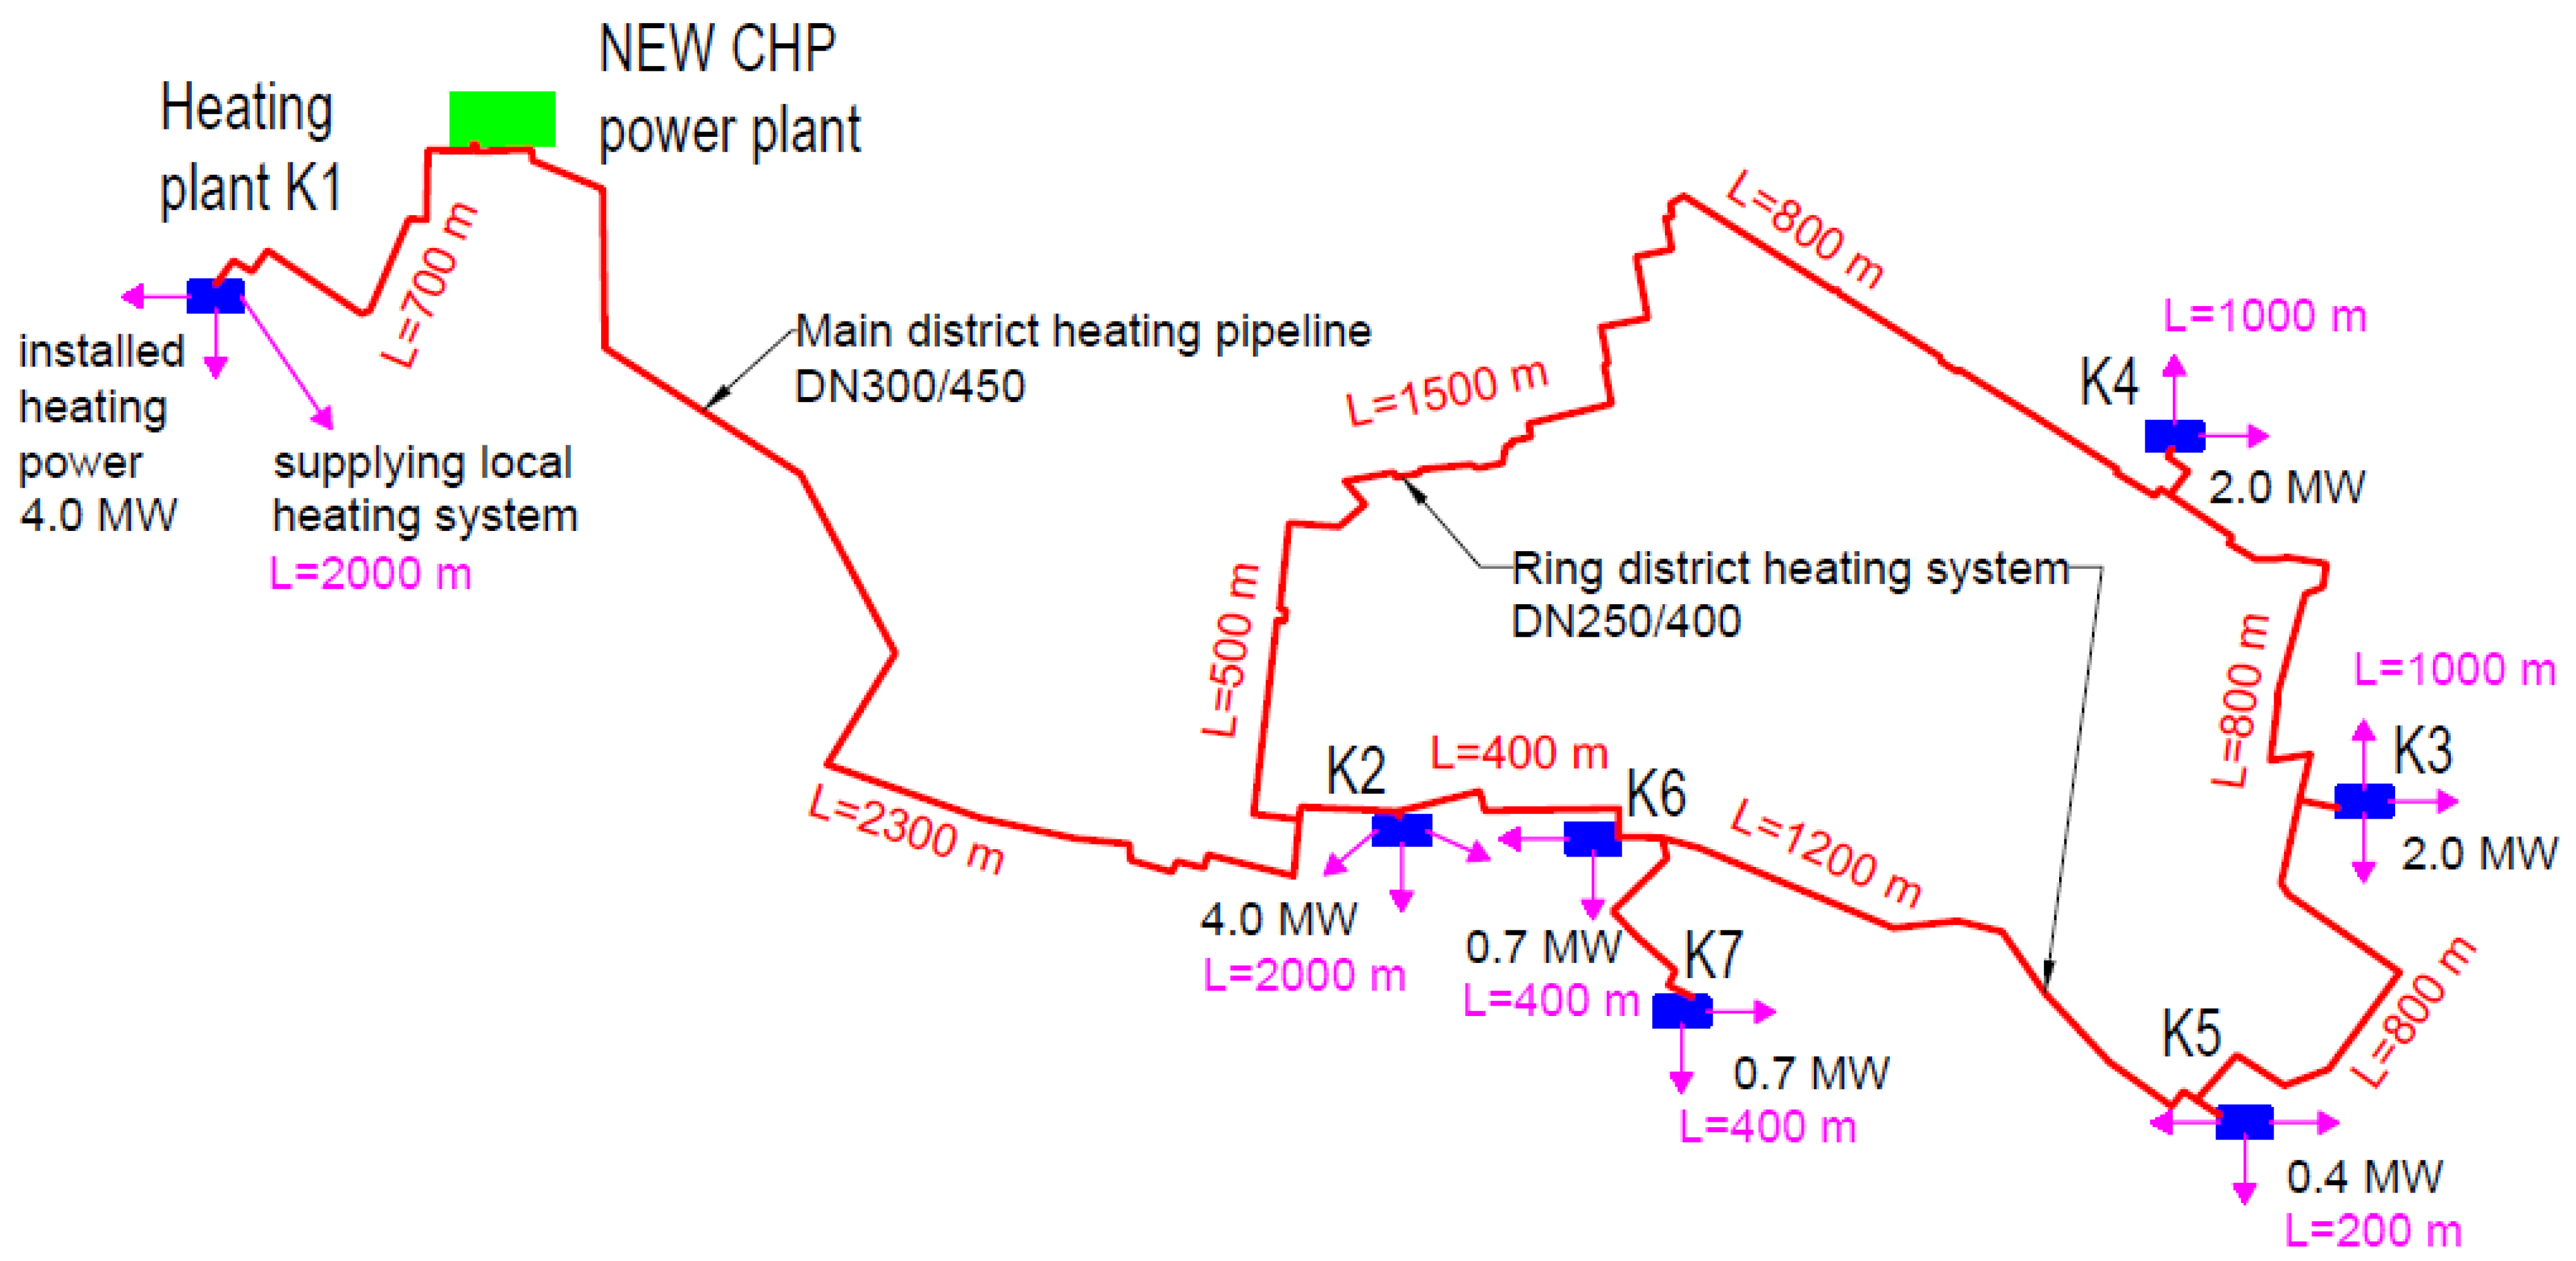
3.3.2. Heat Losses of the New District Heating Main Network
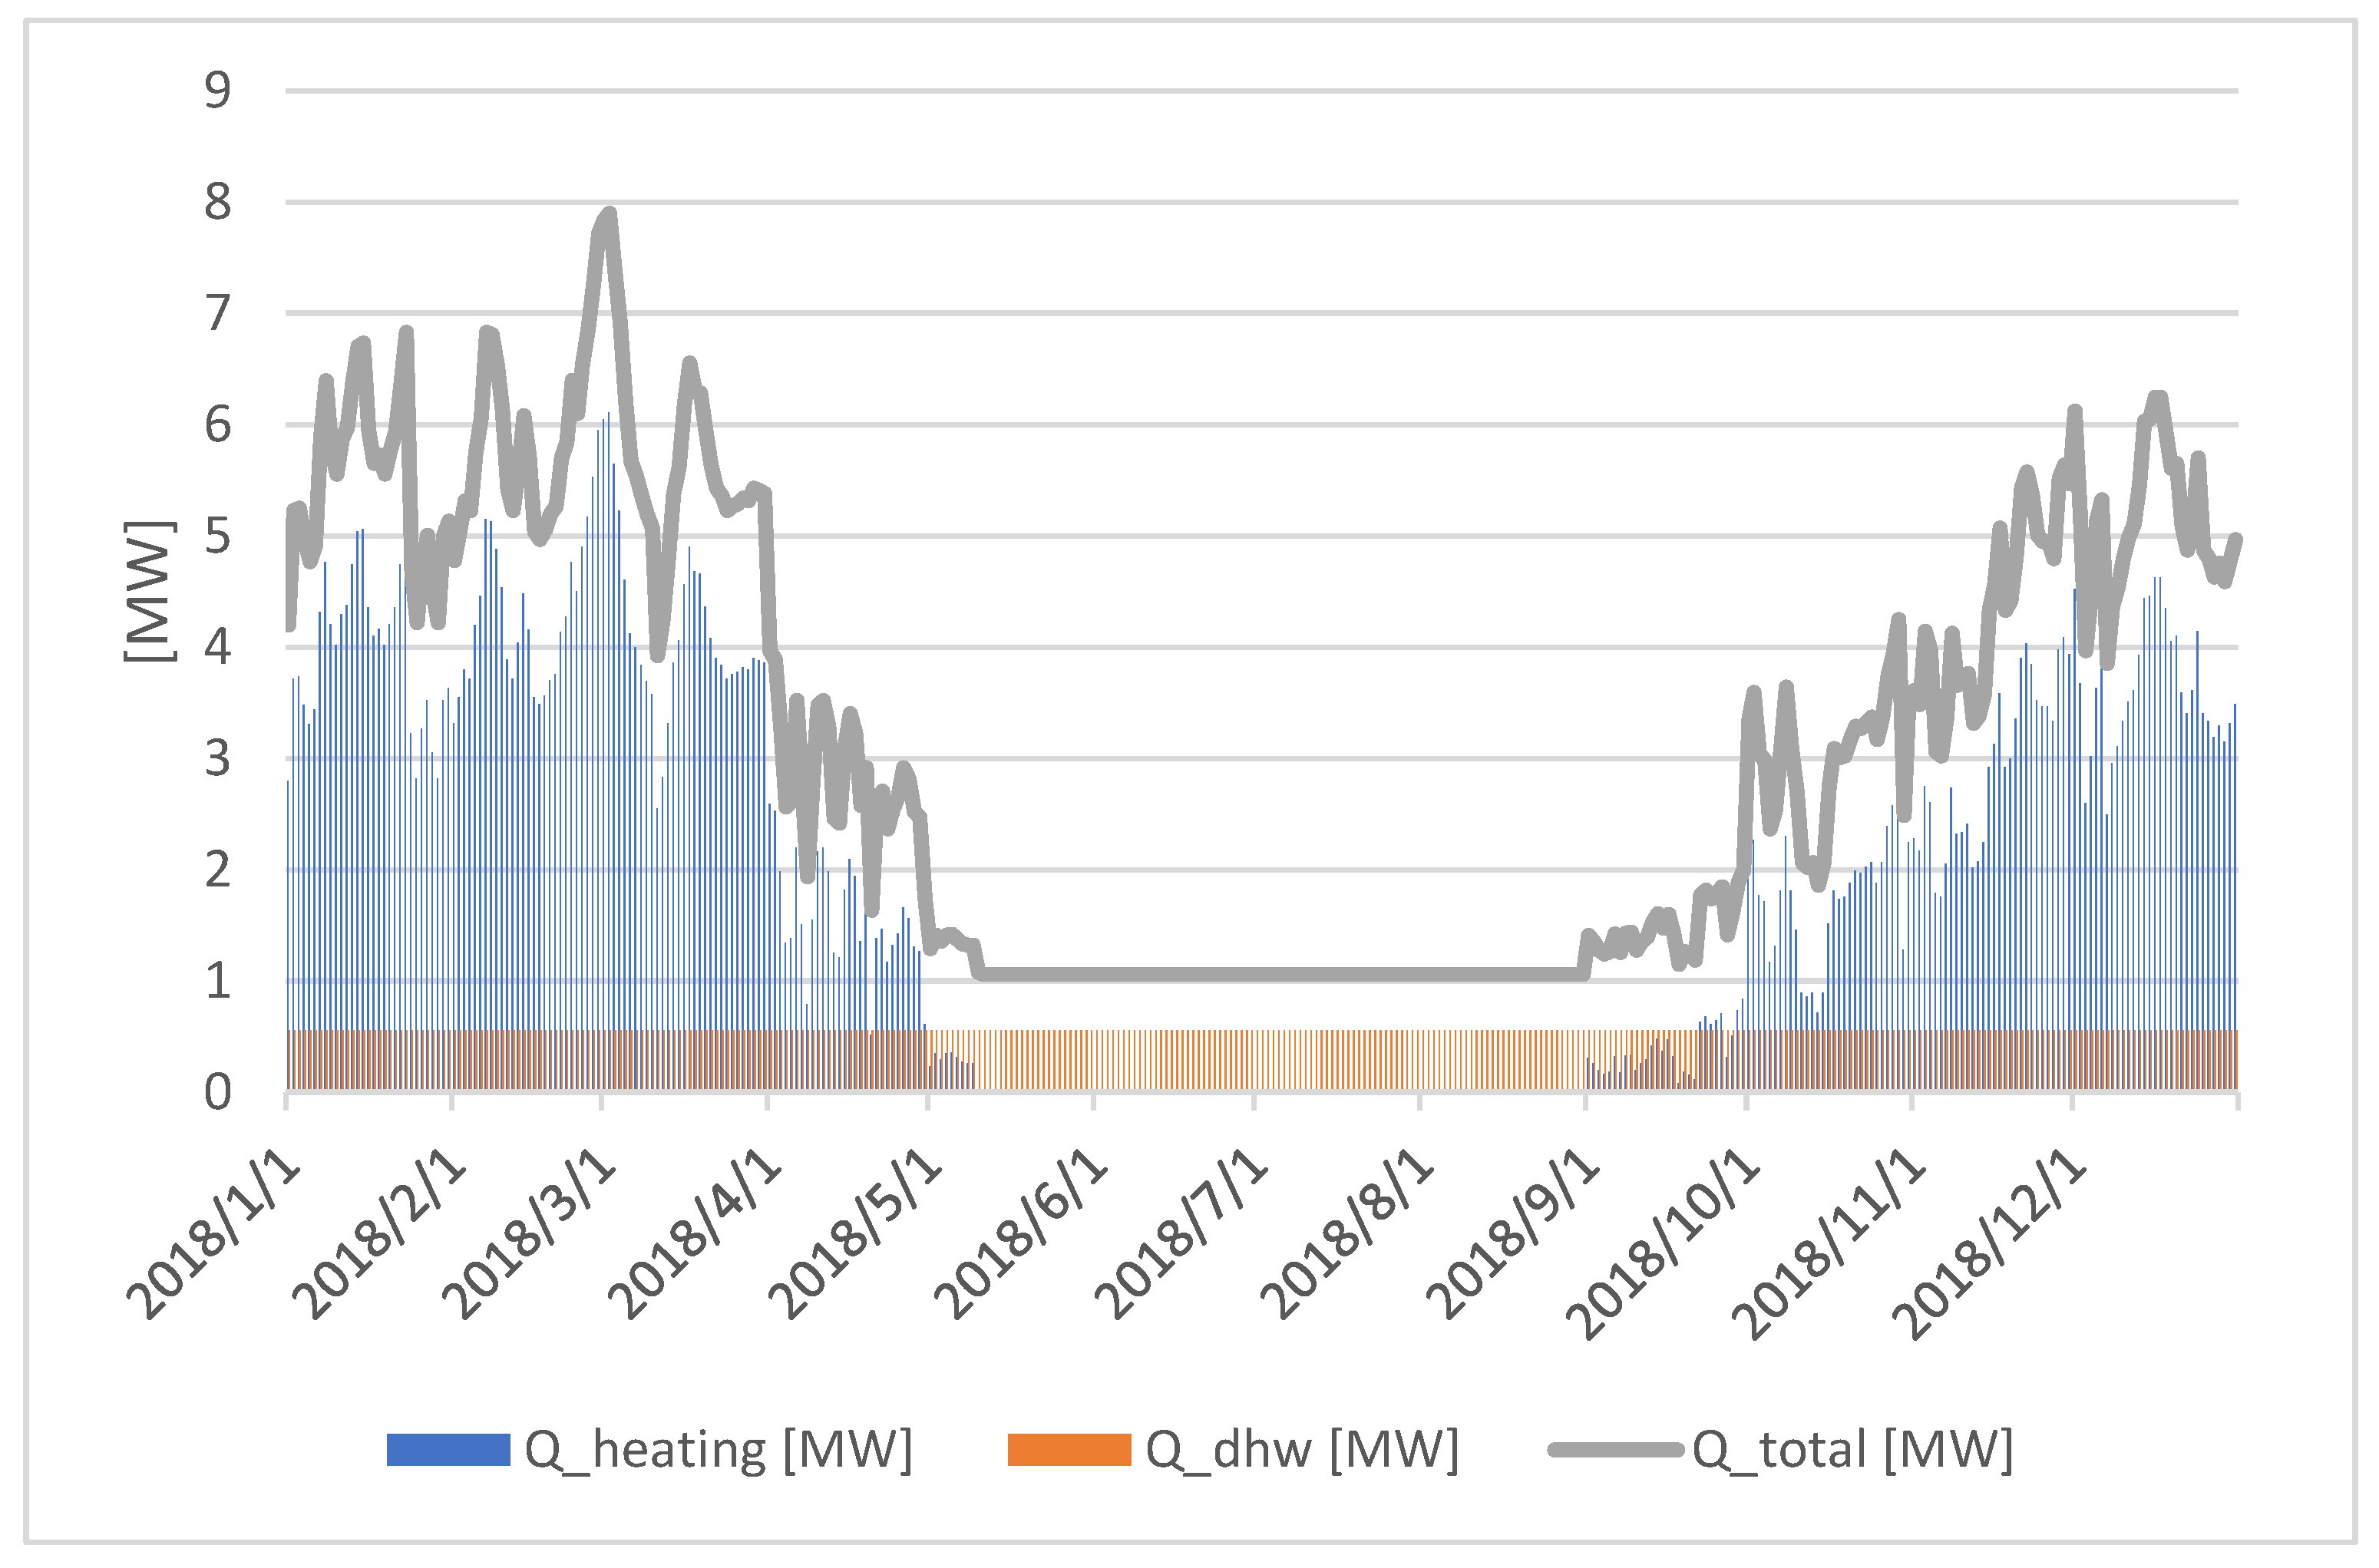
3.3.3. Domestic Hot Water Consumption
3.3.4. Central Heating Needs
3.4. D. Selection of Cogeneration Engines with Peak Gas Boilers
- D. 1.
- Total heating power for the new CHP plant.
- D. 2.
- Selection of cogeneration engines.
- D. 3.
- Selection of gas boilers.
3.4.1. Total Heating Power for the New CHP Plant
3.4.2. Selection of Cogeneration Engines
3.4.3. Selection of Peak Boilers
- According to the methodology point D.3.1, it will be necessary to use two identical boilers with a total power of 11 − 4 = 7 MW (e.g., 2 × 3.5 MW). This is a safer solution than installing a single 7 MW boiler, which, in case of breakdown or inspection, would not be able to supply any thermal power in the winter season.
- An alternative solution, as described in point D.3.2 of the methodology, involves division into a boiler that could operate stably in the summer season (with a power of about 2 MW—stable operation at 50% power) and a cascade of boilers for operation in the winter season (e.g., 2 × 4 MW).
3.5. E. Economic Analysis
- E. 1.
- Revenue from electricity sales.
- E. 2.
- Revenue from thermal energy sales.
- E. 3.
- Cost of purchasing natural gas.
- The financial results of the company in 2018, where only heat was sold. This was calculated as the difference between the revenue from the sale of heat produced exclusively in gas boilers and the cost of gas fuel.
- The theoretical results of the company considering where cogeneration units have already been installed, and assuming that electricity is supplied based on the forecasted prices for 2024. This was calculated as the difference between the revenue from the sale of heat produced from both gas boilers and the cogeneration system in relation to the cost of gas fuel used by all devices.
- Hypothetical results of the company with installed cogeneration engines based on 2018 prices. This was calculated based on the assumptions of scenario no. 2, but based on the prices that were valid in 2018.
3.6. F. Environmental Analysis
4. Discussion
5. Conclusions
- The modernization of heating plants must be analyzed individually each time;
- At least 12 months of archived data are crucial to perform the analysis;
- Increased heat consumption for domestic hot water leads to higher electricity production in summertime;
- Gas engines can be used as the main heat source for low-temperature and ultra-low temperature district heating systems;
- The installation of cogeneration engines and their partial replacement of heating boilers brings companies additional revenue, mainly from the sale of electricity, which may constitute up to 80% of the current revenue from heat sales;
- Sales of electrical energy improve the financial liquidity of companies, especially in summer periods when it is possible to double revenue;
- With a well-operated installation, revenue from heat covers the total cost of gas fuel and revenue from the sale of electricity covers other costs and generates profit;
- A ratio of the price of electricity to the price of gas fuel greater than two ensures the profitability of investing in a cogeneration unit;
- The power of the new boiler should be 35% higher than the registered maximum average daily thermal power during the heating period;
- Cogeneration engines have a positive impact on reducing carbon dioxide emissions compared to coal-based solutions, with a difference of 78%.
- In further work, the developed methodology will be expanded to take into account all costs related to running a business, and not only the cost of gas fuel.
Author Contributions
Funding
Institutional Review Board Statement
Informed Consent Statement
Data Availability Statement
Conflicts of Interest
References
- Amanowicz, Ł.; Ratajczak, K.; Dudkiewicz, E. Recent Advancements in Ventilation Systems Used to Decrease Energy Consumption in Buildings—Literature Review. Energies 2023, 16, 1853. [Google Scholar] [CrossRef]
- Dudkiewicz, E.; Szałański, P. A review of heat recovery possibility in flue gases discharge system of gas radiant heaters. In Proceedings of the International Conference on Advances in Energy Systems and Environmental Engineering (ASEE19), Wrocław, Poland, 9–12 June 2019; Sayegh, M.A., Ed.; EDP Sciences: Les Ulis, France, 2019; Volume 116, p. 00017. [Google Scholar] [CrossRef]
- Niemierka, E.; Jadwiszczak, P. Experimental investigation of a ceramic heat regenerator for heat recovery in a decentralized reversible ventilation system. Int. Commun. Heat Mass Transf. 2023, 146, 106899. [Google Scholar] [CrossRef]
- Zender-Świercz, E. Improvement of Indoor Air Quality by Way of Using Decentralised Ventilation. J. Build. Eng. 2020, 32, 101663. [Google Scholar] [CrossRef]
- Bielskus, J.; Streckienė, G.; Rimdžius, D.; Valančius, K.; Misevičiūtė, V. Investigation of the aerodynamic and thermal performance of a Decentralised Air Handling Unit (DAHU) heat recovery using balls charge. J. Build. Eng. 2023, 76, 107373. [Google Scholar] [CrossRef]
- Zender-Świercz, E.; Telejko, M.; Galiszewska, B.; Starzomska, M. Assessment of Thermal Comfort in Rooms Equipped with a Decentralised Façade Ventilation Unit. Energies 2022, 15, 7032. [Google Scholar] [CrossRef]
- Zender-Świercz, E. Assessment of Indoor Air Parameters in Building Equipped with Decentralised Façade Ventilation Device. Energies 2021, 14, 1176. [Google Scholar] [CrossRef]
- Orman, Ł.J. Enhancement of pool boiling heat transfer with pin-fin microstructures. J. Enhanc. Heat Transf. 2016, 23, 137–153. [Google Scholar] [CrossRef]
- Kordana-Obuch, S.; Starzec, M.; Wojtoń, M.; Słyś, D. Greywater as a Future Sustainable Energy and Water Source: Bibliometric Mapping of Current Knowledge and Strategies. Energies 2023, 16, 934. [Google Scholar] [CrossRef]
- Kordana-Obuch, S.; Starzec, M.; Słyś, D. Assessment of the Feasibility of Implementing Shower Heat Exchangers in Residential Buildings Based on Users’ Energy Saving Preferences. Energies 2021, 14, 5547. [Google Scholar] [CrossRef]
- Piotrowska, B.; Słyś, D.; Kordana-Obuch, S.; Pochwat, K. Critical Analysis of the Current State of Knowledge in the Field of Waste Heat Recovery in Sewage Systems. Resources 2020, 9, 72. [Google Scholar] [CrossRef]
- Wojtkowiak, J.; Amanowicz, Ł. Effect of surface corrugation on cooling capacity of ceiling panel. Therm. Sci. Eng. Prog. 2020, 19, 100572. [Google Scholar] [CrossRef]
- Sinacka, J.; Mróz, T. Novel radiant heating and cooling panel with a monolithic aluminium structure and U-groove surface—Experimental investigation and numerical model. Appl. Therm. Eng. 2023, 229, 120611. [Google Scholar] [CrossRef]
- Wojtkowiak, J.; Amanowicz, Ł.; Mróz, T. A new type of cooling ceiling panel with corrugated surface—Experimental investigation. Int. J. Energy Res. 2019, 43, 7275–7286. [Google Scholar] [CrossRef]
- Sinacka, J.; Szczechowiak, E. An Experimental Study of a Thermally Activated Ceiling Containing Phase Change Material for Different Cooling Load Profiles. Energies 2021, 14, 7363. [Google Scholar] [CrossRef]
- Amanowicz, Ł. Controlling the Thermal Power of a Wall Heating Panel with Heat Pipes by Changing the Mass Flowrate and Temperature of Supplying Water-Experimental Investigations. Energies 2020, 13, 6547. [Google Scholar] [CrossRef]
- Dudkiewicz, E.; Fidorów, N.; Jeżowiecki, J. Wpływ sprawności promienników podczerwieni na koszt zużycia energii. Rocz. Ochr. Sr. 2013, 15, 1804–1817. [Google Scholar]
- Michalak, P. Hourly Simulation of an Earth-to-Air Heat Exchanger in a Low-Energy Residential Building. Energies 2022, 15, 1898. [Google Scholar] [CrossRef]
- Amanowicz, Ł.; Wojtkowiak, J. Comparison of Single- and Multipipe Earth-to-Air Heat Exchangers in Terms of Energy Gains and Electricity Consumption: A Case Study for the Temperate Climate of Central Europe. Energies 2021, 14, 8217. [Google Scholar] [CrossRef]
- Ratajczak, K.; Szczechowiak, E. The Use of a Heat Pump in a Ventilation Unit as an Economical and Ecological Source of Heat for the Ventilation System of an Indoor Swimming Pool Facility. Energies 2020, 13, 6695. [Google Scholar] [CrossRef]
- Ratajczak, K.; Bandurski, K.; Płóciennik, A. Incorporating an atrium as a HAVC element for energy consumption reduction and thermal comfort improvement in a Polish climate. Energy Build. 2022, 277, 112592. [Google Scholar] [CrossRef]
- Michalak, P.; Szczotka, K.; Szymiczek, J. Audit-Based Energy Performance Analysis of Multifamily Buildings in South-East Poland. Energies 2023, 16, 4828. [Google Scholar] [CrossRef]
- Turski, M. Eco-development aspect in modernization of industrial system. E3S Web Conf. 2018, 44, 00181. [Google Scholar] [CrossRef]
- Ratajczak, K.; Amanowicz, Ł.; Pałaszyńska, K.; Pawlak, F.; Sinacka, J. Recent Achievements in Research on Thermal Comfort and Ventilation in the Aspect of Providing People with Appropriate Conditions in Different Types of Buildings—Semi-Systematic Review. Energies 2023, 16, 6254. [Google Scholar] [CrossRef]
- Orman, Ł.J.; Majewski, G.; Radek, N.; Pietraszek, J. Analysis of Thermal Comfort in Intelligent and Traditional Buildings. Energies 2022, 15, 6522. [Google Scholar] [CrossRef]
- Pastore, L.M.; Lo Basso, G.; de Santoli, L. How national decarbonisation scenarios can affect building refurbishment strategies. Energy 2023, 283, 128634. [Google Scholar] [CrossRef]
- Bonin, B.; Safa, H. Benefits from power and heat cogeneration. EPJ Nucl. Sci. Technol. 2023, 9, 26. [Google Scholar] [CrossRef]
- Puspitarini, H.D.; François, B.; Baratieri, M.; Brown, C.; Zaramella, M.; Borga, M. Complementarity between Combined Heat and Power Systems, Solar PV and Hydropower at a District Level: Sensitivity to Climate Characteristics along an Alpine Transect. Energies 2020, 13, 4156. [Google Scholar] [CrossRef]
- Grebski, W.; Kuzior, A. Opportunities and challenges in addressing the global energy crisis. Rynek Energii 2022, 1, 91–96. [Google Scholar]
- Allevi, E.; De Giuli, M.E.; Domínguez, R.; Oggioni, G. Evaluating the role of waste-to-energy and cogeneration units in district heatings and electricity markets. Comput. Manag. Sci. 2023, 20, 5. [Google Scholar] [CrossRef]
- Keven, A. Exergetic performance analyses of three different cogeneration plants. Open Chem. 2023, 21, 20220295. [Google Scholar] [CrossRef]
- Ciric, R.M.; Mandic, S.N. A review of challenges and benefits of integration of CHP plant into the grid: A case study in Serbia. Electr. Eng. 2021, 103, 2809–2823. [Google Scholar] [CrossRef]
- Mitterrutzner, B.; Callegher, C.Z.; Fraboni, R.; Wilczynski, E.; Pezzutto, S. Review of heating and cooling technologies for buildings: A techno-economic case study of eleven European countries. Energy 2023, 284, 129252. [Google Scholar] [CrossRef]
- Miczka, G.; Rutkowska-Ziarko, A. Wysokosprawna kogeneracja a biały certyfikat Highly efficient cogeneration and white certificate. Rynek Energii 2021, 2, 3–11. [Google Scholar]
- Taler, J.; Trojan, M.; Taler, D.; Dzierwa, P.; Kaczmarski, K.; Liszka, M. Enhancement of power unit flexibility using pressure accumulation of hot water. Rynek Energii 2017, 1, 78–86. [Google Scholar]
- Bujalski, W.; Futyma, K.; Nowicka, M. CHP plant thermal power increase options. Rynek Energii 2017, 6, 94–104. [Google Scholar]
- Zimny, J.; Struś, M.; Szymiczek, J.; Gmiterek, M.; Szczotka, K.; Michalak, P. Propozycja wykorzystania energii geotermalnej na Dolnym Śląsku—Modernizacja systemu ciepłowniczego miasta Oława. Rynek Energii 2021, 4, 39–51. [Google Scholar]
- Hnydiuk-Stefan, A.; Otawa, A.; Stefan, K.; Zmarzły, D. Technical and Economic Analysis of Low-Emissions Modernization of Existing Heating Plants in Poland. Energies 2021, 14, 7426. [Google Scholar] [CrossRef]
- Gambini, M.; Mazzoni, S.; Vellini, M. The Role of Cogeneration in the Electrification Pathways towards Decarbonization. Energies 2023, 16, 5606. [Google Scholar] [CrossRef]
- Otawa, A. Wpływ wybranych parametrów na jednostkowy koszt produkcji ciepła w elektrociepłowni w technologii gazowo-parowej dwupaliwowej/Influence of selected parameters on the unit cost of heat production in a gas-steam double-fuel technology. Rynek Energii 2022, 3, 28–32. [Google Scholar]
- De Rosa, M.; Bianco, V.; Barth, H.; Pereira da Silva, P.; Vargas Salgado, C.; Pallonetto, F. Technologies and Strategies to Support Energy Transition in Urban Building and Transportation Sectors. Energies 2023, 16, 4317. [Google Scholar] [CrossRef]
- Szczeszek, P. Ensuring the continuity of operation of critical energy infrastructure. Rynek Energii 2022, 4, 84–88. [Google Scholar]
- Ruseljuk, P.; Dedov, A.; Hlebnikov, A.; Lepiksaar, K.; Volkova, A. Comparison of District Heating Supply Options for Different CHP Configurations. Energies 2023, 16, 603. [Google Scholar] [CrossRef]
- Thomasson, T.; Kiviranta, K.; Tapani, A.; Tähtinen, M. Flexibility from Combined Heat and Power: A Techno-Economic Study for Fully Renewable Åland Islands. Energies 2021, 14, 6423. [Google Scholar] [CrossRef]
- Voultsos, I.; Katsourinis, D.; Giannopoulos, D.; Founti, M. Integrating LCA with Process Modeling for the Energetic and Environmental Assessment of a CHP Biomass Gasification Plant: A Case Study in Thessaly, Greece. Eng 2020, 1, 2–30. [Google Scholar] [CrossRef]
- Kolasiński, P. Domestic Organic Rankine Cycle-Based Cogeneration Systems as a Way to Reduce Dust Emissions in Municipal Heating. Energies 2020, 13, 3983. [Google Scholar] [CrossRef]
- Gaska, K.; Generowicz, A.; Gronba-Chyła, A.; Ciuła, J.; Wiewiórska, I.; Kwaśnicki, P.; Mala, M.; Chyła, K. Artificial Intelligence Methods for Analysis and Optimization of CHP Cogeneration Units Based on Landfill Biogas as a Progress in Improving Energy Efficiency and Limiting Climate Change. Energies 2023, 16, 5732. [Google Scholar] [CrossRef]
- Jose, J.; Parthasarathy, R.K.; Arumugam, S.K. Energy and Exergy Analysis of a Combined Cooling Heating and Power System with Regeneration. Sustainability 2023, 15, 13523. [Google Scholar] [CrossRef]
- Lepiksaar, K.; Mašatin, V.; Krupenski, I.; Volkova, A. Effects of Coupling Combined Heat and Power Production with District Cooling. Energies 2023, 16, 4552. [Google Scholar] [CrossRef]
- Roshanzadeh, B.; Asadi, A.; Mohan, G. Technical and Economic Feasibility Analysis of Solar Inlet Air Cooling Systems for Combined Cycle Power Plants. Energies 2023, 16, 5352. [Google Scholar] [CrossRef]
- Konopelko, A.; Kostecka-Tomaszewska, L.; Czerewacz-Filipowicz, K. Rethinking EU Countries’ Energy Security Policy Resulting from the Ongoing Energy Crisis: Polish and German Standpoints. Energies 2023, 16, 5132. [Google Scholar] [CrossRef]
- Battista, G.; Vollaro, E.d.L.; Vallati, A.; Vollaro, R.d.L. Technical–Financial Feasibility Study of a Micro-Cogeneration System in the Buildings in Italy. Energies 2023, 16, 5512. [Google Scholar] [CrossRef]
- Cardoso, D.; Nunes, D.; Faria, J.; Fael, P.; Gaspar, P.D. Intelligent Micro-Cogeneration Systems for Residential Grids: A Sustainable Solution for Efficient Energy Management. Energies 2023, 16, 5215. [Google Scholar] [CrossRef]
- Zhang, Q.; Banihabib, R.; Fadnes, F.S.; Sazon, T.A.S.; Ahmed, N.; Assadi, M. Techno-economic analysis of a biogas-fueled micro gas turbine cogeneration system with seasonal thermal energy storage. Energy Convers. Manag. 2023, 292, 117407. [Google Scholar] [CrossRef]
- Li, G.; Zhang, X.; Zheng, Y.; Guo, W.; Tang, Y.; Ye, C. An ultra-high efficient micro combined heat and power cogeneration system based on gas combustion powered thermoelectric generator. Appl. Therm. Eng. 2023, 222, 119941. [Google Scholar] [CrossRef]
- Sharf, M.; Romm, I.; Palman, M.; Zelazo, D.; Cukurel, B. Economic dispatch of a single micro gas turbine under CHP operation with uncertain demands. Appl. Energy 2022, 309, 118391. [Google Scholar] [CrossRef]
- Tokarczyk, A.; Badyda, K.; Woszczak, K. Artificial intelligence in energy industry-Latest trends, technological innovations and scientific discoveries. Rynek Energii 2022, 4, 72–83. [Google Scholar]
- Koch, K.; Alt, B.; Gaderer, M. Dynamic Modeling of a Decarbonized District Heating System with CHP Plants in Electricity-Based Mode of Operation. Energies 2020, 13, 4134. [Google Scholar] [CrossRef]
- Wang, X.; Duan, L. Comparative study of multiple-mode collaborative operation strategy and traditional heat and power decoupling technologies for cogeneration system based on GTCC. Case Stud. Therm. Eng. 2023, 49, 103213. [Google Scholar] [CrossRef]
- Wang, X.; Wu, Y.; Fu, L. Configuration method for combined heat and power plants with flexible electricity regulation. Energy Build. 2023, 287, 112966. [Google Scholar] [CrossRef]
- Sun, W.; Pan, Y.; Pan, Z.; Shang, L.; Zhou, L.; Lv, Z. Comparative analysis of two cogeneration systems with different connection modes. Process Saf. Environ. Prot. 2023, 177, 1440–1460. [Google Scholar] [CrossRef]
- Ang, J.C.; Foo, D.C. Optimisation of cogeneration system design with extended automated targeting model (ATM). Appl. Therm. Eng. 2022, 217, 119148. [Google Scholar] [CrossRef]
- Wytyczne Dotyczące Konwersji—Emisje Gazów Cieplarnianych. Available online: https://www.parp.gov.pl/storage/grants/documents/105/Wytyczne-dotyczce-konwersji---emisje-gazw-cieplarnianych_20200225.pdf (accessed on 10 January 2024).
- Available online: https://www.zpum.pl/images/en/2_Static__Design_Calculations_-_2015.pdf (accessed on 10 January 2024).
- Turski, M.; Sekret, R. New solutions for hybrid energy supply systems of buildings. Rynek Energii 2016, 122, 66–74. [Google Scholar]
- Turski, M.; Jachura, A. Life Cycle Assessment of Dispersed Phase Change Material Heat Accumulators for Cooperation with Buildings in the District Heating System. Energies 2022, 15, 5771. [Google Scholar] [CrossRef]
- Turski, M.; Sekret, R. A method of determining the thermal power demand of buildings connected to the district heating system with usage of heat accumulation. E3S Web Conf. 2017, 22, 00180. [Google Scholar] [CrossRef]
- Available online: https://www.ure.gov.pl/pl/energia-elektryczna/charakterystyka-rynku/9659,2020.html (accessed on 10 January 2024).


| Heating Plant | Installed Power | Ordered Power | Annual Heat Sales for Heating Purposes | Annual Heat Sales for Domestic Hot Water Purposes | Total Annual Heat Sales | Total Annual Heat Production | Annual Gas Consumption | Efficiency | ||
|---|---|---|---|---|---|---|---|---|---|---|
| 1 | 2 | 3 | 4 | 5 | 6 | 7 | 12 | 13 | 14 | |
| [-] | [MW] | [MW] | [GJ] | [GJ] | [GJ] | [GJ] | [m3 × 103] | [MWh] | [%] | |
| K1 | 4.00 | 3.50 | 17,500 | 6000 | 23,500 | 26,500 | 1435 | 9168 | 80.3% | |
| K2 | 4.00 | 3.30 | 20,000 | 2500 | 22,500 | 25,500 | 1380 | 8817 | 80.3% | |
| K3 | 2.00 | 1.20 | 6800 | − | 6800 | 7300 | 400 | 2556 | 79.3% | |
| K4 | 2.00 | 1.80 | 10,500 | 3500 | 14,000 | 15,500 | 825 | 5271 | 81.7% | |
| K5 | 0.40 | 0.25 | 1800 | − | 1800 | 1800 | 105 | 671 | 74.5% | |
| K6 | 0.70 | 0.50 | 1800 | 500 | 2300 | 2300 | 125 | 799 | 80.0% | |
| K7 | 0.70 | 0.50 | 2300 | 200 | 2500 | 2500 | 140 | 894 | 77.6% | |
| Total | 13.8 | 11.05 | 60,700 | 12,700 | 73,400 | 81,400 | 4410 | 28,176 | 80.2% | |
| Heat Losses in Transmission [GJ] | Heat Losses in Transmission [%] | ||||||||
|---|---|---|---|---|---|---|---|---|---|
| K1 | K2 | K3 | K4 | Total | K1 | K2 | K3 | K4 | Average |
| 463 | 495 | 88 | 230 | 1276 | 12.8% | 13.4% | 7.3% | 11.0% | 12.0% |
| 471 | 478 | 81 | 225 | 1255 | 12.8% | 13.3% | 7.4% | 10.8% | 12.0% |
| 498 | 522 | 92 | 230 | 1342 | 12.9% | 13.3% | 7.4% | 10.7% | 12.0% |
| 207 | 223 | 26 | 110 | 566 | 12.8% | 13.2% | 7.5% | 11.0% | 12.2% |
| 62 | 55 | 7 | 45 | 169 | 8.7% | 13.2% | 8.1% | 10.3% | 10.2% |
| 66 | 29 | 0 | 32 | 127 | 12.7% | 13.2% | 0.0% | 10.3% | 12.1% |
| 63 | 29 | 0 | 32 | 124 | 12.9% | 13.2% | 0.0% | 10.4% | 12.2% |
| 65 | 29 | 0 | 32 | 126 | 12.8% | 13.3% | 0.0% | 10.4% | 12.2% |
| 83 | 65 | 26 | 48 | 222 | 12.8% | 13.2% | 7.3% | 10.9% | 11.4% |
| 237 | 245 | 38 | 110 | 630 | 13.1% | 13.5% | 7.3% | 10.5% | 12.1% |
| 365 | 380 | 61 | 180 | 986 | 12.9% | 13.3% | 7.4% | 10.7% | 12.1% |
| 420 | 450 | 81 | 226 | 1177 | 13.0% | 13.3% | 7.3% | 10.6% | 12.0% |
| 3000 | 3000 | 500 | 1500 | 8000 | 12.8% | 13.3% | 7.4% | 10.7% | 12.0% |
| Length [m] | Working Temperature [°C] | Pipe Diameter | Unit Heat Loss Based on [64] [W/m] | Total [kW] | |
|---|---|---|---|---|---|
| Supply pipe | 9000 | 85 | DN250 | 36 | 324 |
| Return pipe | 9000 | 55 | DN250 | 20 | 180 |
| SUM: | 504 |
| Heating Plant | K1 | K2 | K3 | K4 | K5 | K6 | K7 | Total |
|---|---|---|---|---|---|---|---|---|
| Average heat consumption [GJ] | 505 | 219 | 0 | 310 | 0 | 47 | 18 | 1099 |
| Average thermal load [kW] | 256 | 111 | 0 | 157 | 0 | 24 | 9 | 556 |
| Heat Sales for Heating Purposes | K1 [GJ] | K2 [GJ] | K3 [GJ] | K4 [GJ] | K5 [GJ] | K6 [GJ] | K7 [GJ] | Total [GJ] |
|---|---|---|---|---|---|---|---|---|
| January | 3115 | 3467 | 1210 | 1790 | 302 | 297 | 382 | 10,563 |
| February | 3174 | 3369 | 1100 | 1770 | 292 | 297 | 392 | 10,394 |
| March | 3347 | 3699 | 1250 | 1840 | 303 | 297 | 407 | 11,143 |
| April | 1111 | 1465 | 347 | 690 | 122 | 143 | 201 | 4079 |
| May | 210 | 197 | 86 | 125 | 25 | 40 | 17 | 700 |
| June | 0 | 0 | 0 | 0 | 0 | 0 | 0 | 0 |
| July | 0 | 0 | 0 | 0 | 0 | 0 | 0 | 0 |
| August | 0 | 0 | 0 | 0 | 0 | 0 | 0 | 0 |
| September | 145 | 274 | 355 | 132 | 25 | 9 | 38 | 978 |
| October | 1308 | 1601 | 518 | 740 | 153 | 146 | 194 | 4660 |
| November | 2315 | 2637 | 823 | 1370 | 259 | 234 | 314 | 7952 |
| December | 2714 | 3163 | 1111 | 1824 | 319 | 273 | 340 | 9744 |
| Total | 17,439 | 19,872 | 6800 | 10,281 | 1800 | 1736 | 2285 | 60,213 |
| Month | |
|---|---|
| January | 0.2136 |
| February | 0.1907 |
| March | 0.2010 |
| April | 0.1358 |
| May | 0.0289 |
| September | 0.0735 |
| October | 0.1826 |
| November | 0.1884 |
| December | 0.2113 |
| Month | Consumption for Heating Purposes [GJ] | Consumption for DHW Purposes [GJ] | Total Consumption [GJ] | Production [GJ] | Transfer Losses [GJ] | Transfer Losses [%] |
|---|---|---|---|---|---|---|
| 1 | 10,563 | 1489 | 12,052 | 14,670 | 2618 | 17.8% |
| 2 | 10,394 | 1345 | 11,739 | 14,209 | 2470 | 17.4% |
| 3 | 11,143 | 1489 | 12,632 | 15,320 | 2688 | 17.5% |
| 4 | 4079 | 1441 | 5520 | 7316 | 1796 | 24.5% |
| 5 | 235 | 1489 | 1724 | 3074 | 1350 | 43.9% |
| 6 | 0 | 1441 | 1441 | 2748 | 1307 | 47.6% |
| 7 | 0 | 1489 | 1489 | 2839 | 1350 | 47.6% |
| 8 | 0 | 1489 | 1489 | 2839 | 1350 | 47.6% |
| 9 | 978 | 1441 | 2419 | 3842 | 1423 | 37.0% |
| 10 | 4660 | 1489 | 6149 | 8062 | 1913 | 23.7% |
| 11 | 7604 | 1441 | 9045 | 11,263 | 2218 | 19.7% |
| 12 | 9744 | 1489 | 11,233 | 13,752 | 2519 | 18.3% |
| Parameter | Real Price in 2018 r. [EUR/MWh] | Forecasted Price in 2024 r. [EUR/MWh] |
|---|---|---|
| Gas fuel | 23 | 57 |
| Heat (delivered to the customer including transmission fees) | 84 | 164 |
| Electric energy | 57 | 148 |
| Scenario | A | B | C | D | E | F | G | H | I | Financial Result [EUR] |
|---|---|---|---|---|---|---|---|---|---|---|
| 1 | 28,176 | 23 | 648,048 | 20,389 | 84 | 1,712,676 | 0 | 57 | 0 | 1,064,628 |
| 2 | 57,524 | 57 | 3,278,868 | 20,389 | 164 | 3,343,796 | 18,096 | 148 | 2,678,208 | 2,743,136 |
| 3 | 57,524 | 23 | 1,323,052 | 20,389 | 84 | 1,712,676 | 18,096 | 57 | 1,031,472 | 1,421,096 |
| Gas Cost [EUR] | Heat Income [EUR] | Financial Result [EUR] | |
|---|---|---|---|
| 1 | 2 | 3 = 2 − 1 | |
| January | EUR 103,161 | EUR 272,113 | EUR 168,952 |
| February | EUR 101,666 | EUR 268,170 | EUR 166,504 |
| March | EUR 108,292 | EUR 285,647 | EUR 177,355 |
| April | EUR 45,804 | EUR 120,820 | EUR 75,016 |
| May | EUR 15,914 | EUR 41,977 | EUR 26,063 |
| June | EUR 9837 | EUR 25,947 | EUR 16,110 |
| July | EUR 9589 | EUR 25,293 | EUR 15,704 |
| August | EUR 9730 | EUR 25,667 | EUR 15,936 |
| September | EUR 18,373 | EUR 48,463 | EUR 30,090 |
| October | EUR 50,944 | EUR 134,377 | EUR 83,433 |
| November | EUR 80,064 | EUR 211,190 | EUR 131,126 |
| December | EUR 95,916 | EUR 253,003 | EUR 157,087 |
| Total | EUR 649,290 | EUR 1,712,667 | EUR 1,063,377 |
| Gas Cost [EUR] | Heat Income [EUR] | Electricity Income [EUR] | Financial Result [EUR] | ||
|---|---|---|---|---|---|
| 1 | 2 | 3 | 4 = 3 + 2 − 1 | ||
| January | EUR 444,657 | EUR 531,269 | EUR 319,680 | EUR 406,292 | 140.5% |
| February | EUR 440,781 | EUR 523,570 | EUR 319,680 | EUR 402,469 | 141.7% |
| March | EUR 457,140 | EUR 557,691 | EUR 319,680 | EUR 420,231 | 136.9% |
| April | EUR 248,520 | EUR 235,887 | EUR 213,120 | EUR 200,487 | 167.3% |
| May | EUR 131,100 | EUR 81,954 | EUR 106,560 | EUR 57,414 | 120.3% |
| June | EUR 106,020 | EUR 50,658 | EUR 106,560 | EUR 51,198 | 217.8% |
| July | EUR 106,020 | EUR 49,382 | EUR 106,560 | EUR 49,922 | 217.9% |
| August | EUR 106,020 | EUR 50,111 | EUR 106,560 | EUR 50,651 | 217.8% |
| September | EUR 106,020 | EUR 94,619 | EUR 106,560 | EUR 95,159 | 216.2% |
| October | EUR 318,117 | EUR 262,354 | EUR 319,680 | EUR 263,917 | 216.3% |
| November | EUR 387,885 | EUR 412,323 | EUR 319,680 | EUR 344,118 | 162.4% |
| December | EUR 426,588 | EUR 493,959 | EUR 319,680 | EUR 387,051 | 146.4% |
| Total | EUR 3,278,868 | EUR 3,343,778 | EUR 2,664,000 | EUR 2,728,910 | 156.6% |
Disclaimer/Publisher’s Note: The statements, opinions and data contained in all publications are solely those of the individual author(s) and contributor(s) and not of MDPI and/or the editor(s). MDPI and/or the editor(s) disclaim responsibility for any injury to people or property resulting from any ideas, methods, instructions or products referred to in the content. |
© 2024 by the authors. Licensee MDPI, Basel, Switzerland. This article is an open access article distributed under the terms and conditions of the Creative Commons Attribution (CC BY) license (https://creativecommons.org/licenses/by/4.0/).
Share and Cite
Czajor, D.; Amanowicz, Ł. Methodology for Modernizing Local Gas-Fired District Heating Systems into a Central District Heating System Using Gas-Fired Cogeneration Engines—A Case Study. Sustainability 2024, 16, 1401. https://doi.org/10.3390/su16041401
Czajor D, Amanowicz Ł. Methodology for Modernizing Local Gas-Fired District Heating Systems into a Central District Heating System Using Gas-Fired Cogeneration Engines—A Case Study. Sustainability. 2024; 16(4):1401. https://doi.org/10.3390/su16041401
Chicago/Turabian StyleCzajor, Dawid, and Łukasz Amanowicz. 2024. "Methodology for Modernizing Local Gas-Fired District Heating Systems into a Central District Heating System Using Gas-Fired Cogeneration Engines—A Case Study" Sustainability 16, no. 4: 1401. https://doi.org/10.3390/su16041401
APA StyleCzajor, D., & Amanowicz, Ł. (2024). Methodology for Modernizing Local Gas-Fired District Heating Systems into a Central District Heating System Using Gas-Fired Cogeneration Engines—A Case Study. Sustainability, 16(4), 1401. https://doi.org/10.3390/su16041401