1. Introduction
Scientific and technological innovation (STI) has laid an important foundation for the sustainable development of economy and society. STI capability is a key factor in determining regional economic development and competitiveness. The evaluation of STI capability can help government departments correctly understand regional scientific and technological innovation (RSTI) development, help formulate policies and measures to promote innovation, and enhance regional competitiveness. Existing research examines mainly the evaluation of RSTI capability in terms of the aspects of relevant concepts, evaluation indicators, and evaluation methods [
1,
2,
3].
The development of big data and artificial intelligence provides new opportunities for the evaluation of RSTI capability [
4]. Big data can help evaluators dynamically recognize RSTI capabilities from multiple dimensions. Most studies use structured data and indicators published by statistical departments to evaluate regional S&T innovation capacity [
1]. However, statistical indicators usually have a lag, that is, statistics on technological innovation in a specific region for the current year are not released until the following year. Therefore, the evaluation results of regional S&T innovation capacity based solely on government statistical indicators may lag behind the actual situation of regional S&T innovation capacity development. In the big data environment, massive unstructured data such as social media news reports provide a new perspective for the evaluation of RSTI capability. News reports based on social media can reflect major RSTI events in real time. For example, on 12 August 2023, the China Enterprise Development Research Center of Xinhua Research Institute released the Artificial Intelligence Large Model Experience Report 2.0. Iffc Spark from Hefei, Anhui Province ranked first in the domestic mainstream large model evaluation, with a total score of 1013 points. This science and technology news quickly affected the flow of science and technology resources and innovation output in the field of artificial intelligence in China. However, it takes a year for the data on scientific and technological achievements to be reflected in government statistics. Therefore, the evaluation of RSTI capability integrated with news reports has better timeliness, which is conducive to discovering problems in advance and seizing the opportunity to formulate relevant policies to promote innovation.
Although from the perspective of big data, RSTI capability can be evaluated more comprehensively and in real time, some problems remain. On the one hand, in the big data environment, RSTI capability data are distributed in different network spaces and belong to multiple entities, such as government departments, universities, research institutes, and science and technology enterprises. It is difficult to fully grasp the real situation of RSTI capacity based only on the data of a single entity. Determining how to promote multiple entities to share their own data and carry out collaborative evaluation of RSTI capability is a problem that warrants an investigation. On the other hand, in the big data environment, a single indicator has a low contribution to the evaluation of RSTI capability and has value sparsity, but massive data have value emergence. Determining how to design a reasonable evaluation indicator system and build an evaluation model for RSTI capability by using expert knowledge and machine learning is worthy of further exploration.
Therefore, the research problem of this paper is determining how to use multi-source heterogeneous big data, and combine the advantages of expert evaluation and machine learning to build an integrated model to scientifically evaluate RSTI capability. First, this paper proposes a multi-entity collaborative evaluation scheme that designs relevant incentive measures on the basis of fully considering the interest demands of different evaluation entities to encourage these multi-entities to jointly participate in the evaluation of RSTI capability. Second, considering science and technology news data, this paper proposes an RSTI capability evaluation indicator system that integrates science and technology news data, with the aim of improving the lag of structured statistics indicators in the evaluation of RSTI. Last, this paper fully considers the respective advantages of human experts and machine learning in the evaluation and decision-making field and proposes an RSTI capability evaluation model that is based on AHP-SMO human-machine fusion. We combine the data of Anhui Province to verify the effectiveness of the proposed evaluation indicator system and evaluation model.
This paper is arranged as follows:
Section 2 introduces related research;
Section 3 describes the collaborative evaluation scheme;
Section 4 and
Section 5 introduce the evaluation indicator system and evaluation model, respectively;
Section 6 carries out the empirical research using Anhui Province data; and
Section 7 concludes the paper and describes the theoretical and practical contributions of this research.
2. Related Studies
Constructing a reasonable evaluation system and a scientific evaluation model is essential to ensure the effectiveness of the evaluation results of RSTI capability. Many scholars have carried out research in terms of these two aspects.
In terms of evaluation indicators, the evaluation of regional innovation capacity originated from economics and can be traced to the research of Nelson [
5], Trevor [
6], and Oakey et al. [
7]. Among them, representative achievement is the evaluation method based on regional infrastructure, innovation environment, and the correlation strength between them proposed by Porter [
8]. Subsequently, Furman et al. [
9] further added evaluation indicators such as the industrial cluster environment and the collaborative quality of innovation subjects on the basis of them. In recent years, scholars have made comprehensive use of statistical indicators in innovation environments, financial support, science and technology, and policies and regulations to build an evaluation system for RSTI capacity. Based on statistical yearbook data, Xu et al. (2018) constructed an evaluation system of RSTI capacity containing 15 indicators and conducted an empirical study on the RSTI capacity of 11 provinces and regions in the Yangtze River Economic Belt to provide enlightenment for regional coordinated development. The results show that investment funds are an important factor of the regional difference in STI capability [
1]. Through several expert discussions, Dai et al. (2022) constructed an evaluation system containing 20 indicators in terms of three aspects—government support, technological capacity, and basic conditions—which were utilized to analyze the RSTI capacity of six cities in Taiwan and to provide a basis for relevant departments to allocate resources, formulate regional innovation policies, and promote regional development [
2]. A study by Yang and Li et al. (2022) shows that accelerating the intelligent transformation of the manufacturing industry is an important strategic choice to achieve green innovation transformation [
10]. Based on the perspectives of static efficiency and dynamic productivity, they used a dynamic spatial lag model (DSAR), mediating effect model, and moderating effect model to analyze the impact of manufacturing intelligence on green innovation performance and its internal mechanism at theoretical and empirical levels.
In terms of evaluation methods, many studies have developed various multicriteria decision-making (MCDM) models related to expert judgment [
11,
12,
13]. For example, Paredes-Frigolett et al. (2014) used MCDM to rank the performance of national innovation systems in Argentina, Brazil, Chile, Mexico, Portugal, and Spain [
14]. Different researchers built their own theoretical frameworks based on the analytic hierarchy process (AHP) to evaluate the innovation performance of NUTS2 or NUTS3 regions in the Czech Republic [
15,
16]. Hwangbo and Park (2021) also applied the AHP to study policy tools related to the development of innovation systems in the Mekong Delta region [
17]. Yang and Wu et al. (2022) constructed a data-driven DEA-Malmquist evaluation model to evaluate and optimize the technological innovation efficiency of regional industrial enterprises [
3]. Ture et al. (2019) used TOPSIS to assess the performance of the 27 EU Member States with respect to each EU 2020 strategy [
18]. Stankovidic et al. (2021) employed VIKOR to rank European cities based on urban development indicators. However, the findings show that when there are many criteria, most methods become complex, and it is challenging to maintain consistency within and between evaluators [
19]. In recent years, scholars have employed machine learning-related methods to build an RSTI capability evaluation model to overcome the inconsistency of human experts when there are too many standards. Li and Zhang et al. (2020) applied BP neural networks to establish a performance evaluation model for enterprise breakthrough innovation [
20]. Through the model training and simulation verification of the sample enterprises’ breakthrough innovation performance evaluation, the results show that the method has high reliability and that the model has good generalization ability. In addition, considering the systematic characteristics of RSTI capability, it is difficult to describe the overall picture of the influencing factors, evaluation results, and changing trends of RSTI capability by using a single evaluation method. In recent years, scholars have tried to combine machine-learning-related methods with traditional mathematical statistical analysis to build an evaluation model of RSTI capability. Li and Chen (2015) used principal component analysis and cluster analysis to empirically analyze and compare the RSTI capabilities of 30 provinces in mainland China [
21].
In summary, existing research has achieved certain results in the evaluation of RSTI capability, which provides the basis for this study. However, there are still some problems that warrant further investigation. First, the RSTI capability data are derived from government departments, scientific research institutions, science and technology enterprises, universities, and other entities. Determining how to construct a multi-entity collaborative evaluation scheme so that different entities can participate in the evaluation process of RSTI capability is worthy of further analysis. Second, in the context of big data, the data of RSTI capability include structured and unstructured data. Determining how to extract unstructured indicators from science and technology news texts through text analysis and other methods, and combine them with structured statistical indicators to build an evaluation indicator system that integrates science and technology news data, warrants further investigation. Third, determining how to integrate the respective advantages of human experts and machine learning to build a human-machine combination evaluation model of RSTI capability is worthy of further analysis.
3. Collaborative Evaluation Scheme
The big data of RSTI capability are distributed in different areas of cyberspace and belong to multiple entities. The establishment of a collaborative evaluation model of RSTI capacity can promote multiple entities to share their own data and participate in evaluation activities, making the evaluation results more accurate and comprehensive.
However, some problems remain in the process of collaborative evaluation of RSTI capability. First, different entities have different positions and functions in collaborative evaluation, so it is necessary to propose a reasonable multi-entity functional design scheme. Second, multiple entities have different interest considerations and concerns in data sharing and collaborative analysis, such as whether they can obtain the innovative resources of other entities through collaborative analysis, and they may also be concerned with the leakage of trade secrets in data sharing. Therefore, it is necessary to design scientific incentives and protection measures for the collaborative evaluation of RSTI capability. Third, the big data possessed by different entities are heterogeneous, including structured data and unstructured data. Therefore, it is necessary to design a scientific heterogeneous data fusion scheme to lay the foundation for collaborative evaluation. Fourth, to avoid multiple entities providing false information due to speculation, a collaborative credit evaluation mechanism is needed, and the innovation capability data provided by any entity need to be verified by multiple parties and included in the integrity file of the corresponding entity, which provides a basis for the implementation of relevant reward and punishment measures.
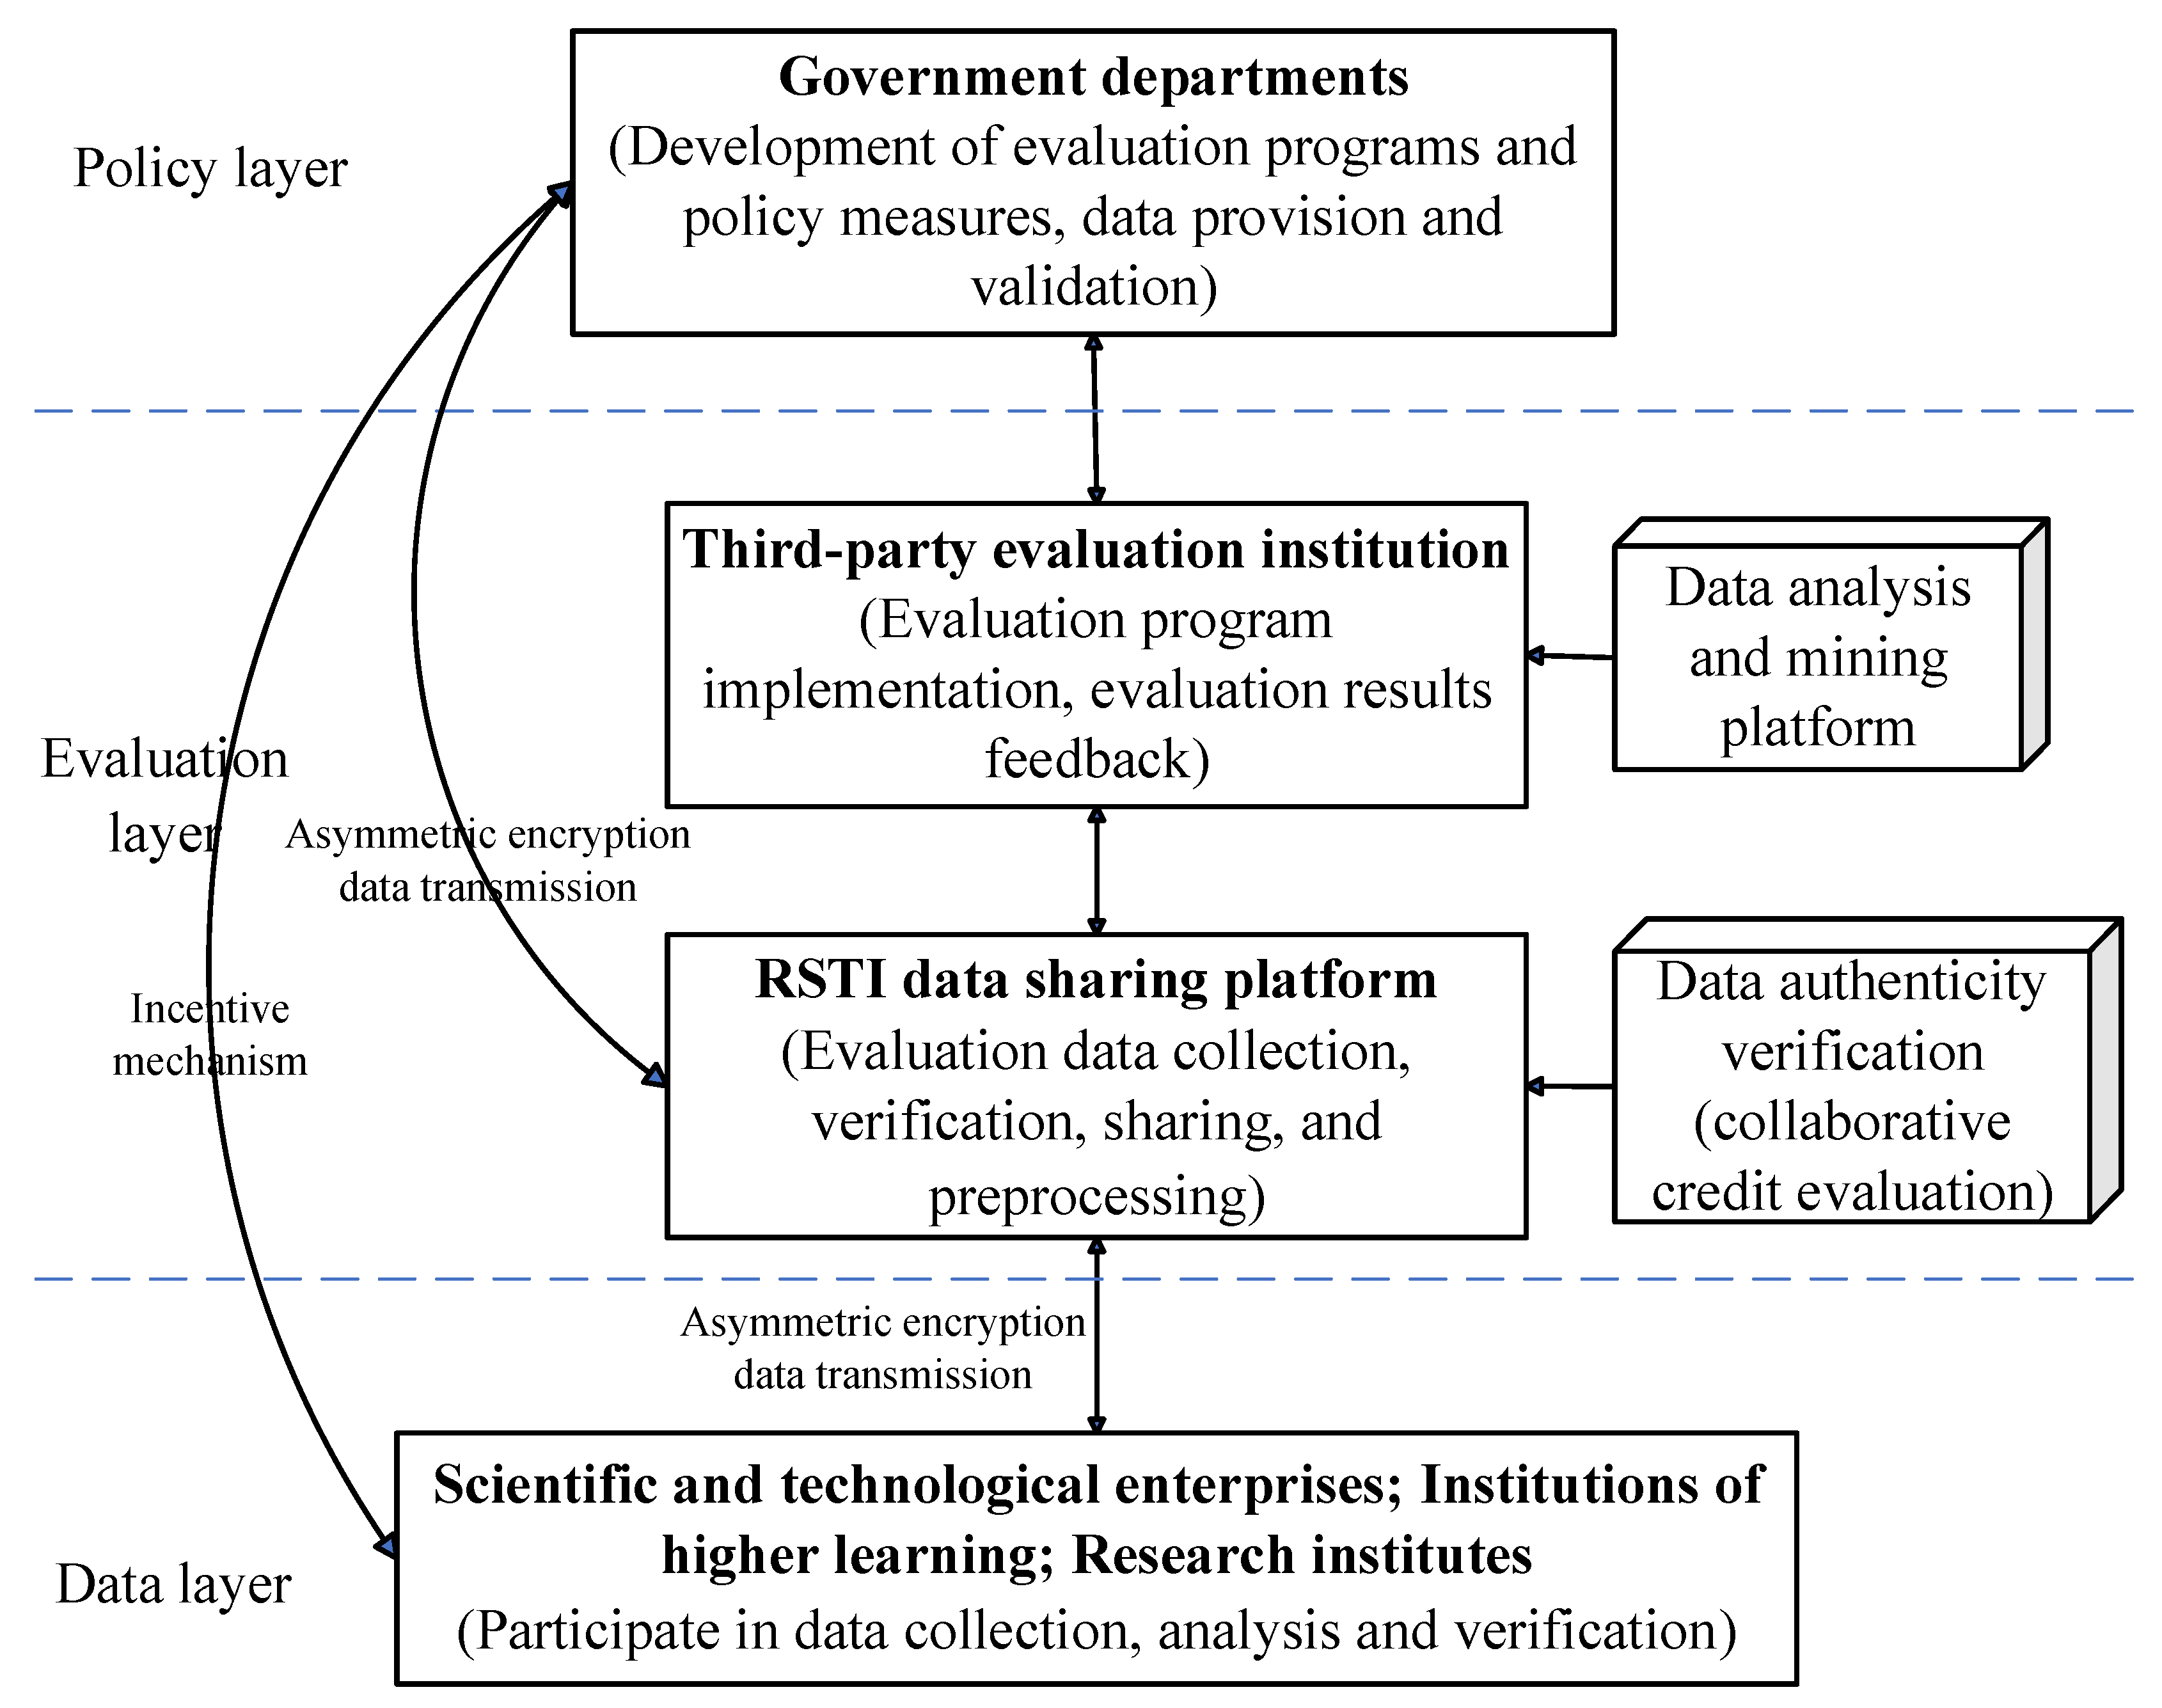
To solve the above problems, this paper proposes a collaborative evaluation scheme of RSTI capability, including a data layer, evaluation layer, and policy layer, as shown in
Figure 1.
The big data of RSTI capability belong to many entities, such as government departments, universities, research institutes, and science and technology enterprises. Multi-entity collaborative analysis can effectively improve the comprehensiveness and accuracy of evaluation results. However, multi-entities have different statuses, abilities, and functions in collaborative evaluation, so it is necessary to evaluate the multi-entity functional design scheme for collaborative evaluation of RSTI capability according to the differences among entities.
The credibility of government departments renders them authoritative in the evaluation of RSTI capability. However, there are also disadvantages of being both an “athlete” and a “referee” in the identity, so in the process of carrying out an evaluation, certain problems are inevitable, such as improper profit distribution, evaluations that are not objective enough, and processes that are not transparent enough. Therefore, we propose an evaluation model with the participation of a government-led third-party evaluation agency, that is, government departments entrust third-party institutions with evaluating RSTI capabilities. Compared with the internal evaluation of the government, third-party evaluation institutions have the characteristics of independence, objectivity, and impartiality, which can more truly reflect the development level of RSTI capability. Government departments should perform well in the collaborative evaluation process, formulate evaluation programs, and provide policy and financial support. Scientific and technological enterprises, institutions of higher learning, and research institutes are the core entities of RSTI. Among them, institutions of higher learning and research institutes are important production places for STI achievements, and scientific and technological enterprises are the main promoters of the application and landing of STI achievements.
Government departments need to formulate relevant policies and measures according to the interests and needs of different core entities and to encourage all entities to participate in STI data sharing. For example, by formulating relevant policies, the research projects and research funds of government departments are appropriately inclined to universities and research institutes that participate in data sharing. For science and technology enterprises, participating in the data sharing of STI can increase the enterprise’s innovation points and obtain customized science and technology policy services. In addition, this participation can further improve the tax incentives for R&D expenses of STI enterprises and provide financing guarantees for the innovation activities of scientific and technological enterprises. Through measures such as government procurement, supporting funds, market-based salaries, and senior talent rewards, we will provide a good innovation environment for technology enterprises that participate in data sharing. Through comprehensive policies, the enthusiasm of core entities to participate in the sharing of STI data will be increased. Government departments also need to provide financial support for the construction of STI data-sharing platforms and third-party evaluation institutions to implement evaluation programs.
The RSTI data-sharing platform is mainly responsible for the collection, verification, processing, and sharing of evaluation data. First, due to the wide range of sources of big data for STI and the fast update speed, we recommend the use of cloud collection tools to determine the fields and content to be collected, set collection rules, and distribute data to multiple entities such as universities, enterprises, and research institutes to implement automated data collection. Second, it is necessary to establish a collaborative credit evaluation mechanism based on blockchain and to use the consensus mechanism of blockchain to test the consistency of the innovation capability data provided by multiple entities in different periods at different calibers to verify the authenticity of the innovation capability data. Third, the original collected data of STI often contain missing values and outliers, so data need to be preprocessed, including filling of missing values and outlier detection and correction. Finally, the sharing platform needs to integrate the multi-source heterogeneous STI data through data fusion and set sharing permissions. We propose using the knowledge graph method based on domain ontology to fuse multi-source heterogeneous data through metadata to lay a foundation for the evaluation of RSTI capability.
The third-party evaluation institution is the main body of the evaluation of STI capability. The third-party institution should fully communicate with the entrusting party (government department) and formulate the evaluation implementation plan. The evaluation implementation plan should conform to the principles of feasibility, comprehensiveness, and simplicity. The evaluation content, method, step, and time node arrangement are scientific and reasonable, with operability. In addition, according to the characteristics and evaluation requirements of STI data, a reasonable evaluation indicator system is determined. For example, considering the heterogeneity of data, it is necessary to comprehensively consider structured data and unstructured data in the process of building an evaluation indicator system. Since STI data have the characteristics of massive, heterogeneous, and dynamic big data, it is suggested to construct data analysis and mining models and combine the opinions of experts in the field to implement the evaluation scheme of RSTI capability. Visualization tools are used to present the evaluation results of RSTI capability for government departments to make decisions.
Scientific and technological enterprises, institutions of higher learning, and research institutes are the core entities of RSTI. Among them, institutions of higher learning and research institutes are important production places for STI achievements, and scientific and technological enterprises are the main promoters of the application and landing of STI achievements. Therefore, these core entities are the main sources of RSTI data, and need to be sorted, provided, and verified for the evaluation of RSTI capability according to the requirements of the data-sharing platform. In addition, some government departments (such as the Patent Office and the Bureau of Statistics) can also provide RSTI data and conduct collaborative verification with the data of core entities. In consideration of information security, it is recommended to use asymmetric encryption for data transmission among core entities, relevant government departments, and sharing platforms.
In summary, different entities bear different responsibilities in the collaborative evaluation of RSTI capabilities and enjoy certain rights according to relevant incentive policies.
Table 1 summarizes the responsibilities and rights of each entity in collaborative evaluation.
4. Construction of Evaluation Indicator System
To more scientifically reflect the level of RSTI capability, this paper integrates science and technology news indicators on the basis of traditional evaluation indicators and builds an evaluation indicator system that integrates science and technology news data. Compared with traditional innovation ability evaluation indicators, science and technology news can reflect the development of RSTI capability in real time and is an important supplement to traditional structured data indicators.
Taking into account the unstructured data characteristics of science and technology news, this paper comprehensively uses topic analysis and sentiment analysis to extract the topic and sentiment features of science and technology news texts. Then, the evaluation indicator of RSTI capability based on science and technology news data is extracted in terms of the aspects of science and technology news topic, sentiment, and influence.
We use the LDA topic model to analyze the types of topics reflected in science and technology news. Common topics in science and technology news include financial support for innovation, economic output of innovation, science and technology resources, scientific research, and social and ecological benefits. In-depth analysis of these topics is helpful to scientifically evaluate RSTI capability. This paper uses the LDA topic model to analyze the topic types contained in science and technology news.
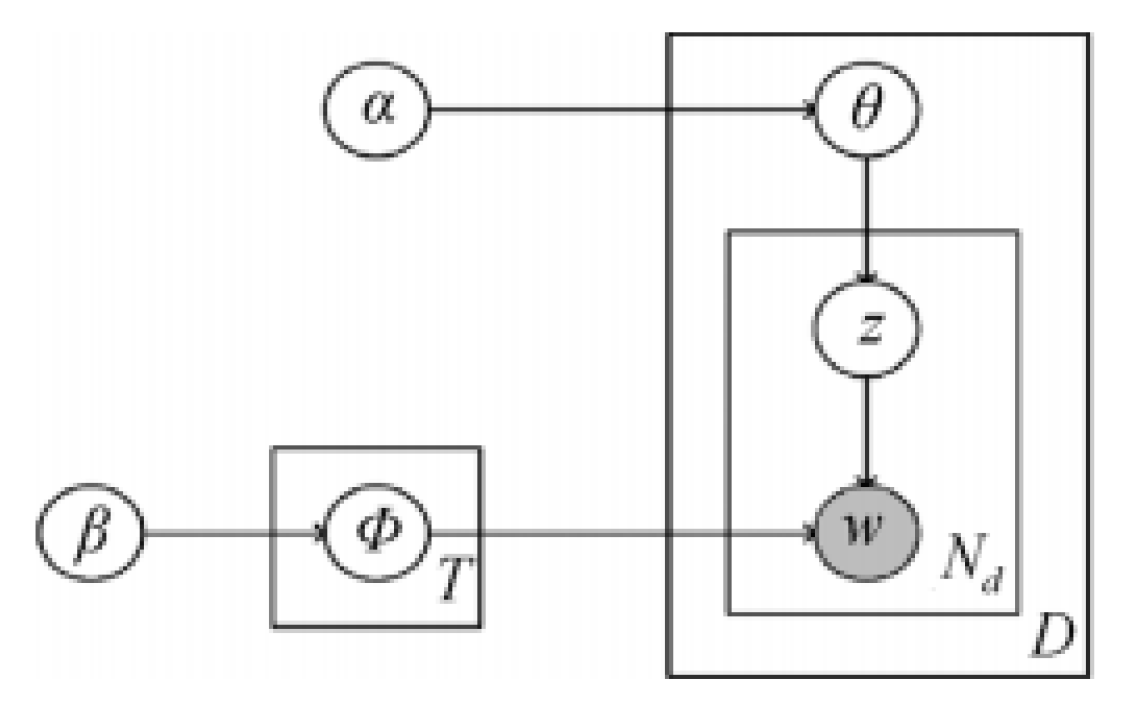
The LDA topic model is a three-layer Bayesian document topic generation model. The basic idea is to assume that there are several independent hidden topics in the corpus and to generate all the words in the corpus documents according to the probability distribution of these topics so that the documents can be understood as the distribution of specific hidden topics. The LDA model overcomes the defects of traditional Vector Space Model (VSM)-based modeling, such as excessive text bits, extremely sparse text, and inability to consider text semantic information. The basic process is shown in
Figure 2, where φ represents the word distribution, θ represents the topic distribution, α is the prior distribution parameter of the topic distribution θ (i.e., Dirichlet distribution), β is the prior distribution parameter of the word distribution φ, z represents the topic generated by the model, w represents the word eventually generated by the model, and Nd represents the total number of words in the corpus. D represents the total number of texts in the corpus. The output of the topic model is shown in
Table 2 and
Table 3.
In
Table 2, each row represents the topic probability distribution of the text, and all
p values in each row sum to 1. In
Table 3, each row represents the word probability distribution of the topic, and all
p values in each row sum to 1.
In addition, we also use the sentiment analysis method to extract the emotional tendency of science and technology news. Sentiment analysis is also referred to as opinion mining and tendency analysis. Sentiment analysis is the process of analyzing, processing, summarizing, and reasoning about subjective texts with emotional colors. The internet has produced many valuable comments about people, events, and products. These comments express people’s various emotional colors and emotional tendencies, such as joy, anger, sorrow, joy, criticism, and praise. Users can read these subjective comments to understand the public opinion of a certain event or product. Therefore, the use of sentiment analysis technology can help us quickly understand the scientific, economic, and social impacts of STI events described in news reports. This paper uses the emotional tendency analysis function of the Baidu Brain AI open platform to analyze the sentiment of science and technology news. Baidu AI emotion analysis is based on deep learning training, automatically learns deep semantic and syntactic features, has good generalization ability, and can still maintain a good sentiment analysis effect on relatively long sentences. For text with subjective descriptions in specific scenes, Baidu AI emotion analysis technology can automatically identify the core entity words in the text and judge the corresponding sentiment and corresponding confidence of each entity word, and the accuracy rate of sentiment orientation analysis in multiple fields of text can exceed 95%.
Based on the relevant literature and the topic, sentiment, and influence indicators of science and technology news, the evaluation indicator system of RSTI capability is constructed, as shown in
Table 4. The system selects 33 indicators to evaluate the RSTI capability in terms of four aspects: the ability to initiate STI, the ability to realize STI, the ability to transform STI, and the ability to support the innovation environment. The ability to initiate STI is the core driving force for the development of RSTI and provides talent, funds, and platforms for STI activities in the region. Therefore, this paper mainly evaluates the ability to initiate STI through scientific and technological human resources, financial resources, and innovation platforms. The ability to realize STI is a key indicator for measuring the output of urban STI activities, and includes the output of innovative knowledge with patents and scientific papers as the core and the output of an innovative economy with a high-tech industry as the core. The transformation ability of STI is a concentrated reflection of the impact of RSTI activities on industrial structure upgrading, the ecological environment improvement, and people’s living standards. This paper mainly measures the economic benefit, ecological benefit, and social benefit in terms of three aspects. In recent years, RSTI has increasingly emphasized green innovation and the protection of the ecological environment. Therefore, we particularly consider ecological effects. The ability to support the innovation environment is an important guarantee for the development of RSTI, and includes the support of the regional economic environment, financial support, the educational environment, and STI publicity. According to the scientific, systematic and comprehensive principles of indicator selection and taking into account the availability of data, an RSTI capability evaluation system consisting of 4 first-level indicator layers, 12 second-level indicator layers and 33 third-level indicator layers was finally constructed, as shown in
Table 4.
5. AHP-SMO Evaluation Method
To give fully utilize the respective advantages of human experts and machine learning in the field of complex problem evaluation and to provide complementary advantages, this paper proposes an AHP-SMO-based RSTI capability evaluation method.
First, this method uses the AHP model and combines the opinions of human experts to conduct an overall evaluation of the RSTI capability of typical cities at the macro level. Second, the Sequential Minimal Optimization (SMO) algorithm and fine-grained evaluation indicator are used to establish the evaluation model of RSTI capability at the micro level. The AHP-SMO evaluation method proposed in this paper can effectively integrate the advantages of human experts and machine learning. On the one hand, human experts can fully grasp the macro situation of the problem and are capable of performing an overall evaluation of the RSTI capability of typical cities at the level of evaluation criteria. On the other hand, machine learning can accurately grasp the fine-grained impact of the underlying indicators on RSTI capability and overcome the differences in the opinions of human experts in the case of numerous indicators, difficulties in determining weights, and inconsistent judgment matrices.
The analytic hierarchy process (AHP) is a systematic method that takes a complex decision problem as a system, decomposes the decision target into multiple criteria and indicators, and provides multi-scheme optimization decisions through the qualitative indicator fuzzy quantification method [
41]. Presently, the analytic hierarchy process (AHP) has been widely employed in decision making and evaluation in the field of economic management. Different from the traditional AHP, which considers the total ranking of the criterion layer and the single ranking of the indicator layer, this paper only uses the AHP to consider the total ranking of the criterion layer because human experts can easily grasp high-level abstract information and give accurate evaluations. For the weight calculation of the indicator layer, we use the SMO method to fully utilize the advantages of machine learning. Next, this paper describes the basic flow of the proposed AHP-SMO method.
- (1)
Construction of the hierarchical structure model
Based on the characteristics of RSTI capability, the evaluation criteria of RSTI capability are established in terms of four aspects, namely, the ability to initiate STI, the ability to realize STI, the ability to transform STI, and the ability to support the innovation environment, as shown in
Table 4. We regard the evaluation criteria in
Table 4 as the criterion layer in the analytic hierarchy process.
- (2)
Weight calculation of the criterion layer
Through pairwise comparison of each factor of the criterion layer, the judgment matrix is formed. The maximum eigenvalue and eigenvector are calculated according to the constructed judgment matrix. Then, the consistency test of the judgment matrix is carried out according to CI = (λmax − n)/(n − 1), where λmax is the maximum eigenvalue of the matrix and n is the order of the matrix.
It is generally believed in engineering that if CR = CI/RI ≤ 0.1, then the matrix satisfies the consistency test. RI is a random consistency index. In this case, the eigenvector of the matrix is normalized as the weight vector W.
- (3)
RSTI capability level identification of typical cities
We asked several experts to rate the selected typical cities in terms of four aspects of the criteria layer. The rating range is [0, 100]. The higher the score in a particular category, the stronger the city’s ability in this area. We remove the highest and lowest scores for all experts and average the remaining expert scores. Considering the weight of each criterion and expert opinions, the level of RSTI capability of each typical city is determined.
- (4)
SMO evaluation model
Taking typical cities as the benchmark, a complete evaluation model of RSTI capability is established using the SMO method according to their indicator values and identified levels of RSTI. According to the established SMO evaluation model, the level of RSTI capability of other cities is determined.
The SMO algorithm is mainly utilized to solve the optimization problem of the objective function of the support vector machine [
42]. SVM minimizes generalization error by minimizing structural risk. Consider the binary classification problem of dataset (
x1,
y1),..., (
xn,
yn), where
xi is the input vector and
yi{−1, 1} is the class label of the vector and only two values are allowed. Optimization of the objective function of a soft edge support vector machine is equivalent to solving the maximum value of the following quadratic programming problem:
satisfying:
where
C is a parameter of the SVM, referred to as the penalty factor, which defines the penalty for misclassification, and
K(
xi,
xj) is the kernel function.
SMO decomposes the whole quadratic programming problem into many small problems that are easy to solve; that is, the optimization problem of Lagrange multipliers corresponding to two samples is separately solved.
The termination condition of the SMO algorithm can be that the KKT condition is satisfied for all vectors, or the growth rate of the objective function
W(
a) is less than a certain threshold, that is,
This paper divides the RSTI capability of different cities into several different levels, which is essentially a multiclassification problem. We adopt a 1 vs. 1 strategy to transform SMO binary classification into a multiclassification model. For the n-classification problem, the 1 vs. 1 strategy needs to train N × (N − 1)/2 classifiers, and classifier (i, j) can judge whether a point belongs to i or j. When an unknown sample is classified, each classifier makes a judgment on its category and “casts a vote” for the corresponding category. The category with the most votes is the category of the unknown sample.
6. Empirical Research
This paper takes Anhui Province of China as the object to study the evaluation of the RSTI capability of each city under the jurisdiction of Anhui Province. Anhui Province is an important part of the Yangtze River Delta in the national economic development of the strategic thrust and several domestic economic plate docking zones. In 2022, the GDP of Anhui Province reached CNY 4504.5 billion, with year-on-year growth of 3.5% at constant prices. The per capita GDP reached CNY 73,603. Anhui Province has jurisdiction over sixteen cities, namely, Hefei, Wuhu, Chuzhou, Fuyang, Anqing, Ma‘anshan, Suzhou, Bozhou, Bengbu, Lu‘an, Xuancheng, Huainan, Huaibei, Tongling, Chizhou, and Huangshan.
Due to the integration of Anhui Province into the Yangtze River Delta, it has made great progress in the field of scientific and technological innovation. For example, Hefei, the provincial capital of Anhui Province, is known as a city of science and technology, with the most intensive layout of national major scientific projects besides the capital Beijing, and has made outstanding achievements in fields such as chips and artificial intelligence. Hefei’s scientific and technological innovation has also led to the common progress of other cities in Anhui Province. Therefore, many provinces and regions in China pay great attention to the innovative development path of Anhui Province, and send delegations to learn about the advanced experience of innovative development in Anhui Province. This paper chooses Anhui Province as a good representative example. The research results of this paper also play a positive role in the improvement of scientific and technological innovation ability in other regions.
To verify the validity of the evaluation system and evaluation method proposed in this paper, we collected the main indicators (F1–F29) used in existing studies to evaluate RSTI capability from the Anhui Provincial Bureau of Statistics (
http://tjj.ah.gov.cn/oldfiles/tjj/tjjweb/tjnj/2022/index.htm, accessed on 26 August 2023). We also collected science and technology news data from the Science and Technology Information section of the Anhui Provincial Science and Technology Department (
http://kjt.ah.gov.cn/kjzx/index.html, accessed on 26 August 2023) and obtained the evaluation indicator of science and technology news (F30–F33) through statistical analysis, topic analysis, and sentiment analysis. Due to the different units of measurement among different indicators, there are enormous differences in values. To prevent evaluation indicators with high absolute values from concealing the impact of other indicators on RSTI capability, we carry out maximum and minimum normalization processing for all indicators as follows:
where
represents the value of city
on indicator
;
and
represent the maximum value and minimum value of all cities on indicator
, respectively; and
represents the normalization of the value of city
on indicator
. After normalization, the value range of all indicators is reduced to the range [0, 1].
Table 5 shows the normalized values of cities in Anhui Province on different indicators.
Next, we use the AHP-SMO method proposed in
Section 5 to evaluate the RSTI capability of these 16 cities. First, we invited 10 experts from Anhui University who study RSTI capability and experts from the Anhui Provincial Bureau of Statistics who are responsible for the data statistics of RSTI capability to evaluate the RSTI capability of some typical cities using the AHP method. We selected four typical cities based on expert opinions, namely, Hefei, Ma‘anshan, Chuzhou, and Huaibei. The selection is based on the notion that it is easy for experts to reach a consensus, the selected cities are representative to a certain extent, and the technological innovation capability of different cities is significantly different. Through the analytic hierarchy process, this paper provides the level of RSTI capability of these four typical cities. Here, we make two innovations in the use of the analytic hierarchy process. First, considering that there are too many decision-making schemes involving 16 cities, which may lead to expert decision-making difficulties and inconsistency in the judgment matrix of the analytic hierarchy process (AHP), we only use the analytic hierarchy process (AHP) to determine the level of RSTI capability of four typical cities. Then, these four typical cities serve as benchmarks, and the SMO method is further utilized to analyze the level of technological innovation capability of other cities. Second, considering the advantages of expert opinions in grasping the macro environment, we only construct a judgment matrix for the criterion layer and calculate its weight. For the indicator layer, we use the level of RSTI capability of typical cities assigned by experts as class labels and the value of each indicator as the input data of the SMO model to determine the impact of each indicator on RSTI capability. The above two innovations fully combine the advantages of human experts and machine learning in processing macro and micro information and comprise the ideas for the construction of human-machine combined models that can be widely applied to complex decision-making problems in the field of economic management.
Table 6 shows the importance evaluation of the expert group on the four aspects of the guideline layer, which are the ability to initiate STI, the ability to realize STI, the ability to transform STI, and the ability to support the innovation environment. We invited 10 experts to score the importance of each criterion, calculate the average importance of each criterion, make pairwise comparisons, construct a single-level comparison judgment matrix, and calculate the weight of the criterion layer.
As shown in
Table 6, the maximum eigenvalue of the judgment matrix λmax = 4.0127 and the consistency index CI = 0.0004. When
n = 4, RI = 0.90. Therefore, if the consistency ratio CR = CI/RI = 0.0047 < 0.01, the consistency test passes. The eigenvector corresponding to the maximum eigenvalue is the weight vector w, which is calculated as w = (0.0639, 0.1643, 0.2762, 0.4956).
We invited ten experts to score the four typical cities of Hefei, Ma‘anshan, Chuzhou, and Huaibei in terms of the four aspects of the standard layer. The scoring range is [0, 100]. The higher the score in a particular category, the stronger the city’s ability in this area. We remove the highest score and lowest score from all the experts’ scores and average the scores of the remaining experts to obtain a score table, as shown in
Table 7.
According to the score table and weight vector, the expert group’s comprehensive scores for the four typical cities of Hefei, Ma‘anshan, Chuzhou, and Huaibei are presented as follows:
(Hefei, Ma‘anshan, Chuzhou, and Huaibei)
According to the expert opinion and AHP analysis method, the RSTI capability levels of Hefei, Ma‘anshan, Chuzhou, and Huaibei are levels 1, 2, 3, and 4, respectively. Among them, Hefei has the strongest RSTI capability.
To further analyze the impact of various indicators on the RSTI capability of all cities and to establish a comprehensive evaluation model for RSTI capability, we construct the SMO model by taking the indicator value and level of a typical city’s RSTI capability as feature variables and target variables, respectively. Then, we use the constructed SMO model to evaluate the level of RSTI capability of the other 12 cities. The results are shown in
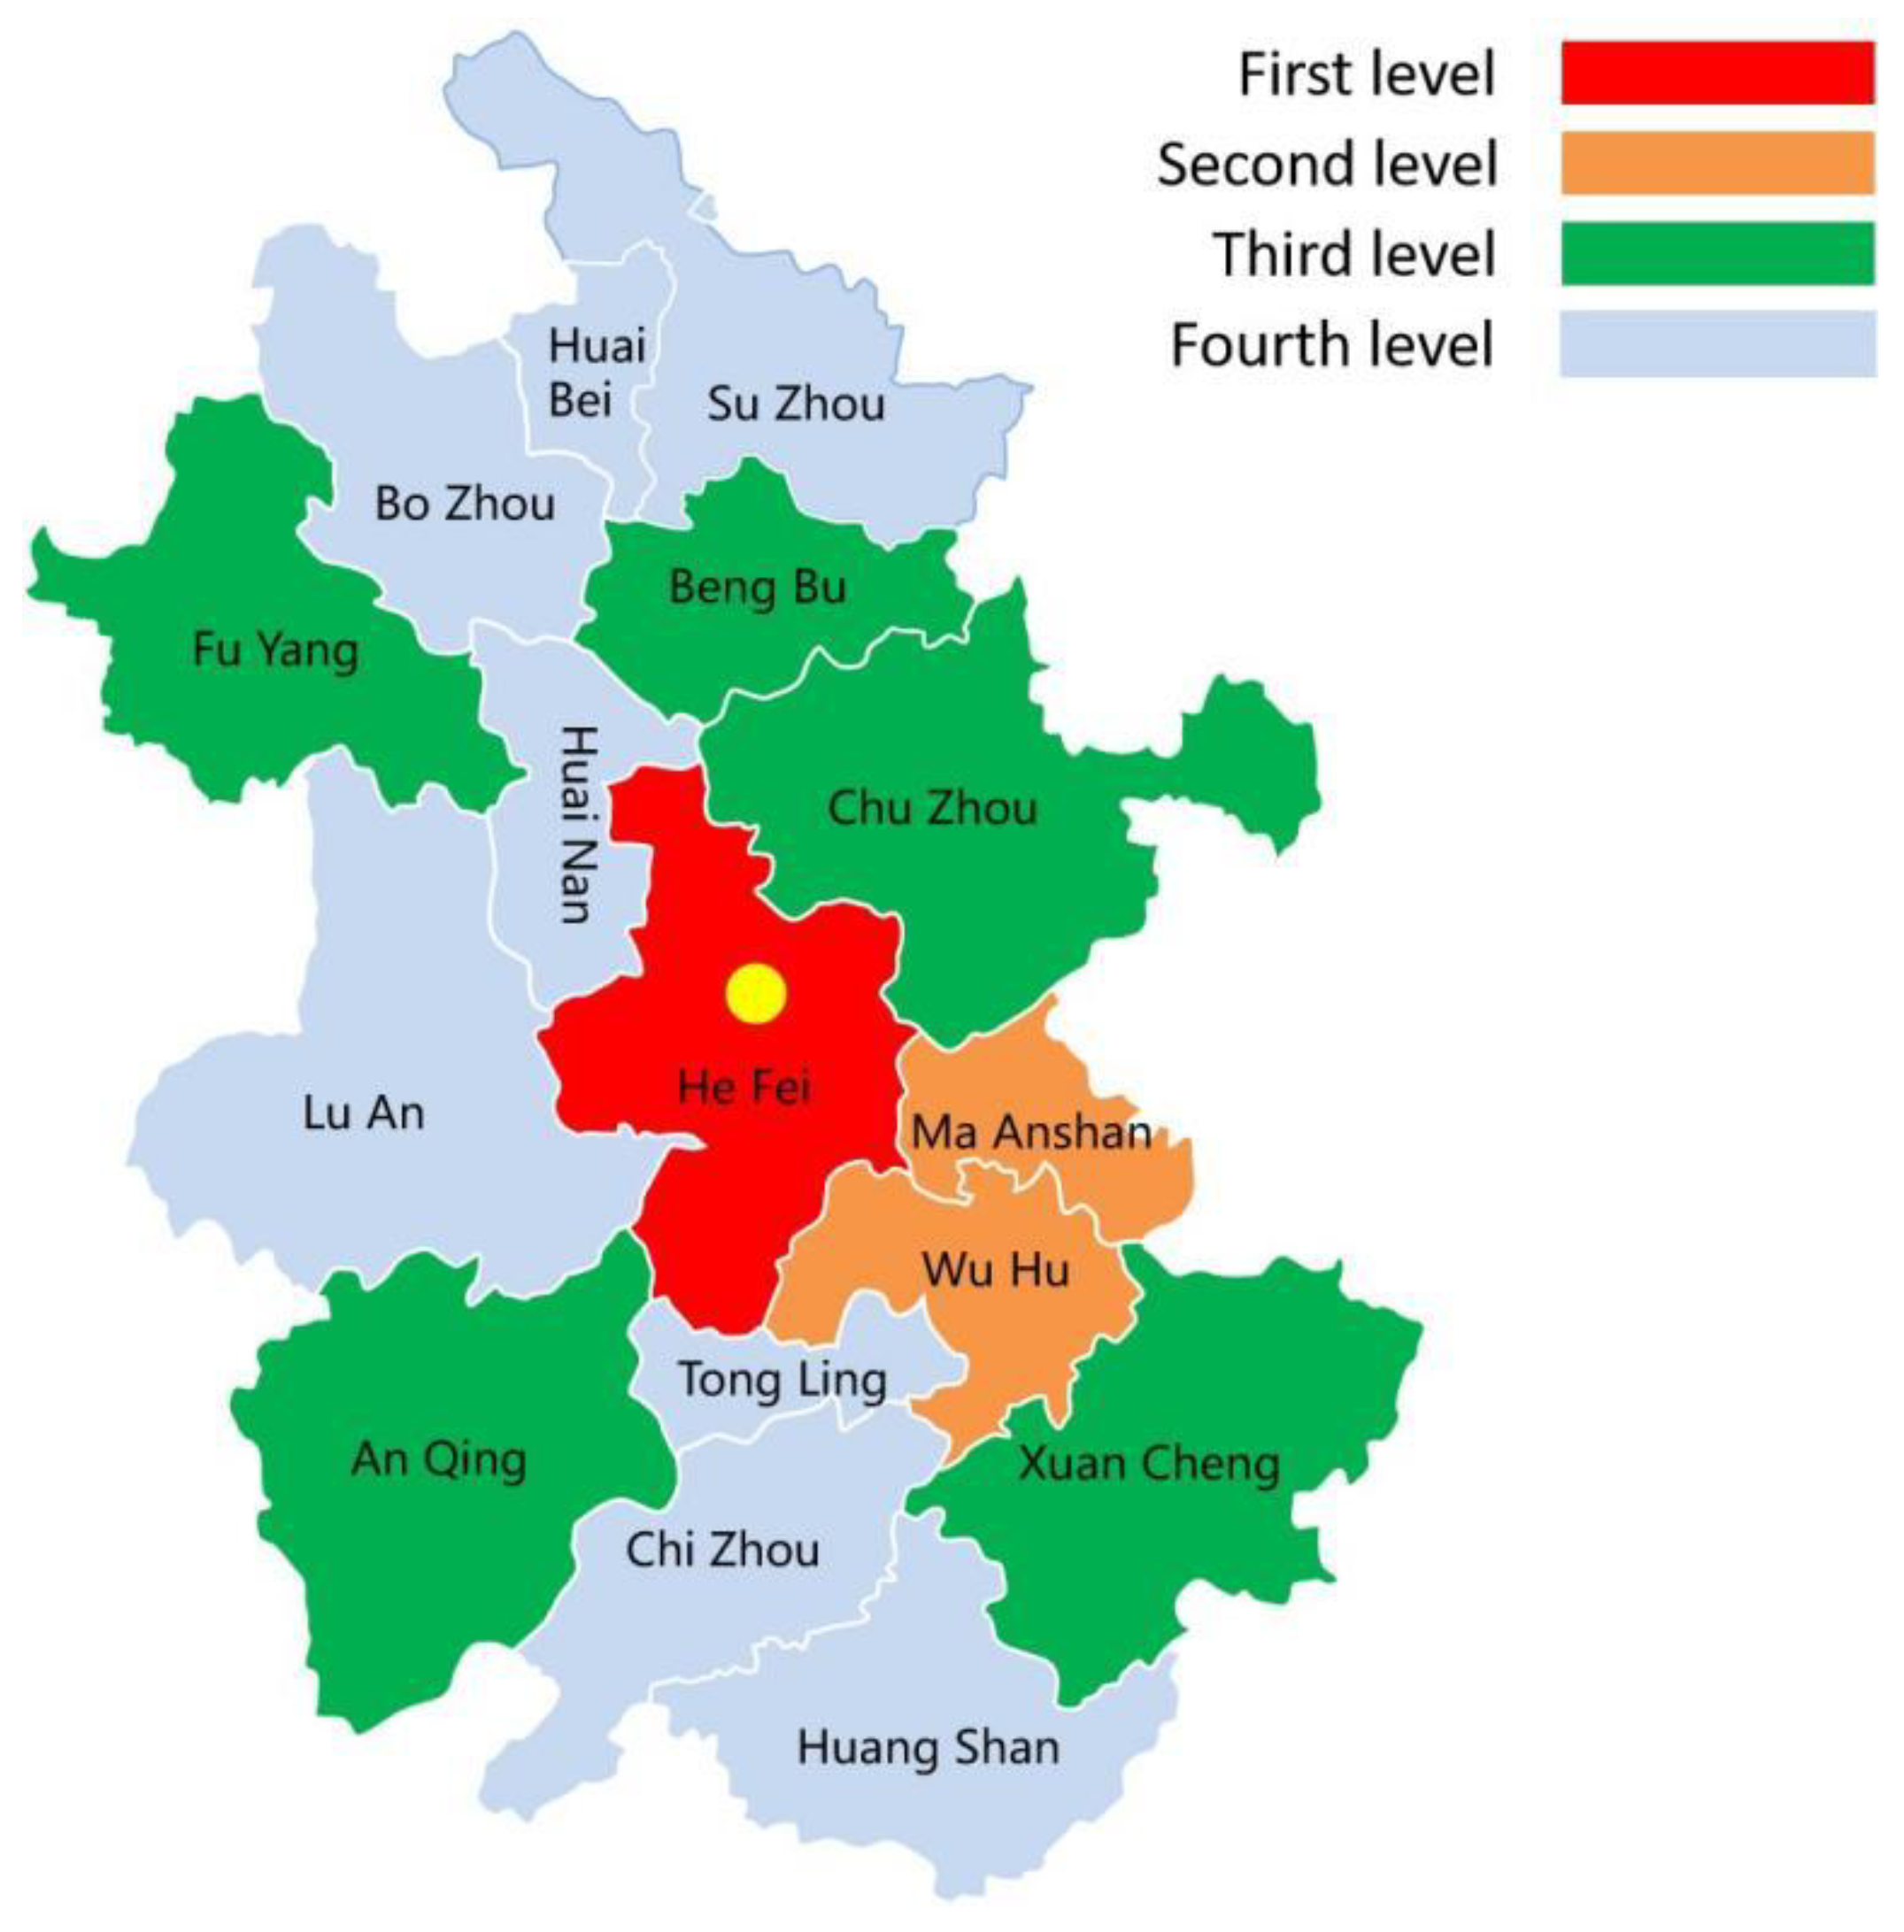
Table 8. To visually display the RSTI capability and geographical location of each city, this paper draws a map of Anhui Province and marks the grade of each city with different colors, as shown in
Figure 3.
As shown in
Table 8 and
Figure 3, among the 16 cities, Hefei is the only city with a first-level technological innovation capability. Hefei is the provincial capital city of Anhui Province and the subcentral city of the Yangtze River Delta urban agglomeration. With the approval of the comprehensive national science center in Hefei, the construction and layout of a series of scientific research infrastructures, such as universities, innovation platforms, and scientific installations, have made Hefei a truly innovative city. In the 2021 Global Innovation Index Report released by the World Intellectual Property Organization, Hefei ranks 73rd and is one of the top 100 regional innovation clusters in the world. Cities with a second level of RSTI capability include Ma’anshan and Wuhu. From a geographical perspective, these two cities are located in the area surrounding Hefei. Hefei also plays a driving role in the development of technological innovation capabilities in these two cities. In recent years, the robotics industry in Wuhu city has also made significant progress, establishing the first national-level robotics industry development agglomeration zone in China. The robotics industry has formed a full industry chain aggregation trend, where core components are independently controllable, robot bodies are near the international first-class level, and robot system integration is becoming increasingly mature. Ma’anshan city is also accelerating the construction of a “1 + 3 + N” industrial cluster, with “1” being a national-level industrial cluster of advanced structural materials led by the steel industry. Cities with a third level of RSTI capability include Chuzhou, Anqing, Fuyang, Bengbu, and Xuancheng. The overall performance of these cities’ technological innovation capabilities is average, but they also have certain advantages in specific fields. For example, in 2022, two projects in Bengbu City were approved by the National Key R&D Plan and were approved to jointly build a sensor industry common technology research center with Anhui University. The cities with the RSTI capability of level four include Huaibei, Bozhou, Suzhou, Huainan, Lu’an, Tongling, Chizhou, and Huangshan. Due to various factors, such as historical development, geographical location, and industrial structure, the technological innovation capabilities of these eight cities still need to be further improved.
To further explore the effect of the science and technology news indicators (F
30–F
33) on the RSTI capability, we only use the common indicators (F
1–F
29) in the literature to rebuild the evaluation indicator system and use the AHP-SMO method to evaluate the RSTI capability of 16 cities. We then compared the experimental results with the evaluation results in
Table 8 (evaluation results produced using the technology news indicators).
The experiment shows that, compared with
Table 8, the overall difference in the evaluation results generated by not using technology news indicators is not significant and that the main difference lies in the judgment of Bengbu’s RSTI capability. When using technology news indicators, Bengbu is rated as level 3; when technology news indicators are not utilized, Bengbu is rated as level 4. We believe that the reason for this difference lies in the notion that science and technology news indicators are preemptive in the evaluation of urban innovation capability, while statistical indicators lag behind. Generally, statistical data from the previous year are not released until the following year. The statistical indicator values for 2021 used in this paper (F
1–F
29) were published in 2022. Therefore, when we use these statistical indicators to evaluate the technological innovation ability of cities, the evaluation results reflect the past situation. If a city is in a period of rapid development of RSTI capability, the evaluation result of this lag often cannot reflect the new situation of RSTI capability. The science and technology news indicators are preconceived, and the science and technology news in 2021 will often affect the innovation promotion policies and the allocation of science and technology resources in 2022 and beyond, and then affect the rating of RSTI capabilities. Therefore, the evaluation results using only the statistical indicators (F
1–F
29) reflect that Bengbu’s RSTI capability in 2021 is level 4, while the evaluation results including science and technology news indicators (F
1–F
33) reflect that Bengbu’s RSTI capability in 2022 is level 3. There is no significant difference in the evaluation results of the RSTI capability of other cities with or without the inclusion of science and technology news indicators because these cities are in a relatively stable period and their RSTI capability has no grade breakthrough in the short term.
To verify the rationality of the above theoretical analysis, we carry out a detailed analysis of the science and technology news data of Bengbu.
Table 9 shows the topics and keywords of science and technology news in Bengbu in 2021 based on LDA model analysis. For further analysis, we selected the top three most widely discussed topics: financial support for innovation, economic output from innovation, and resources for science and technology.
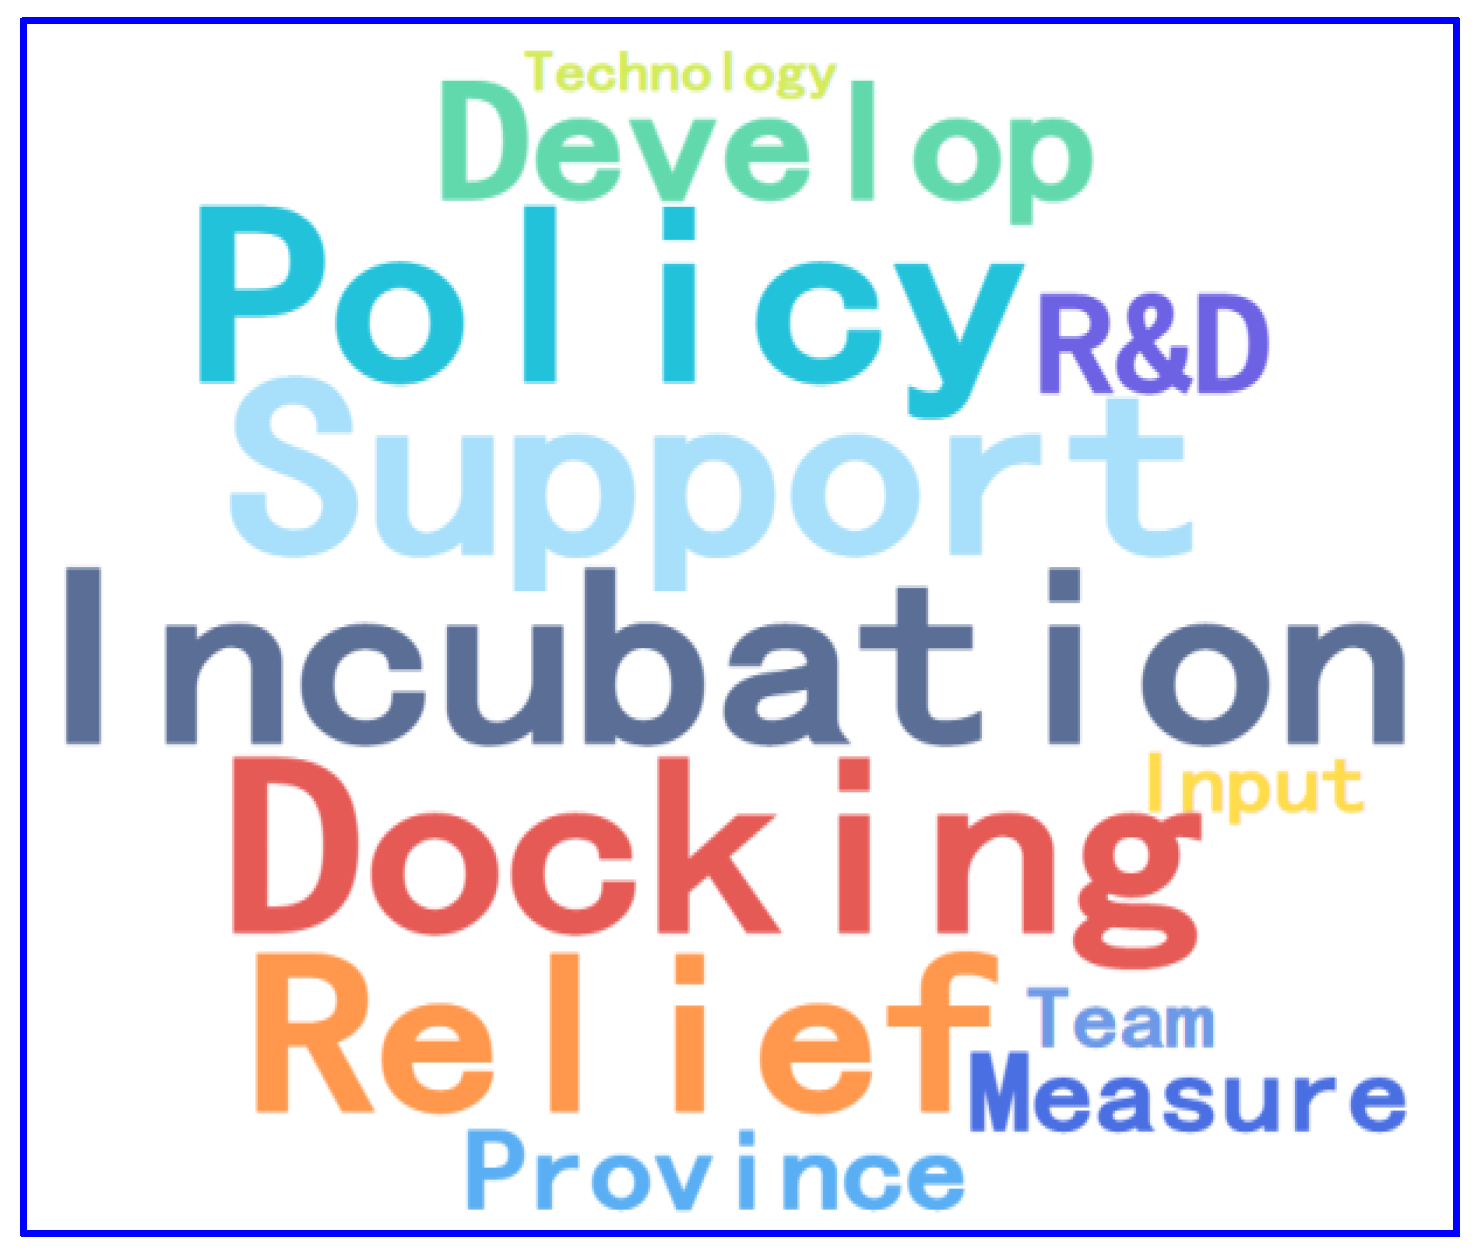
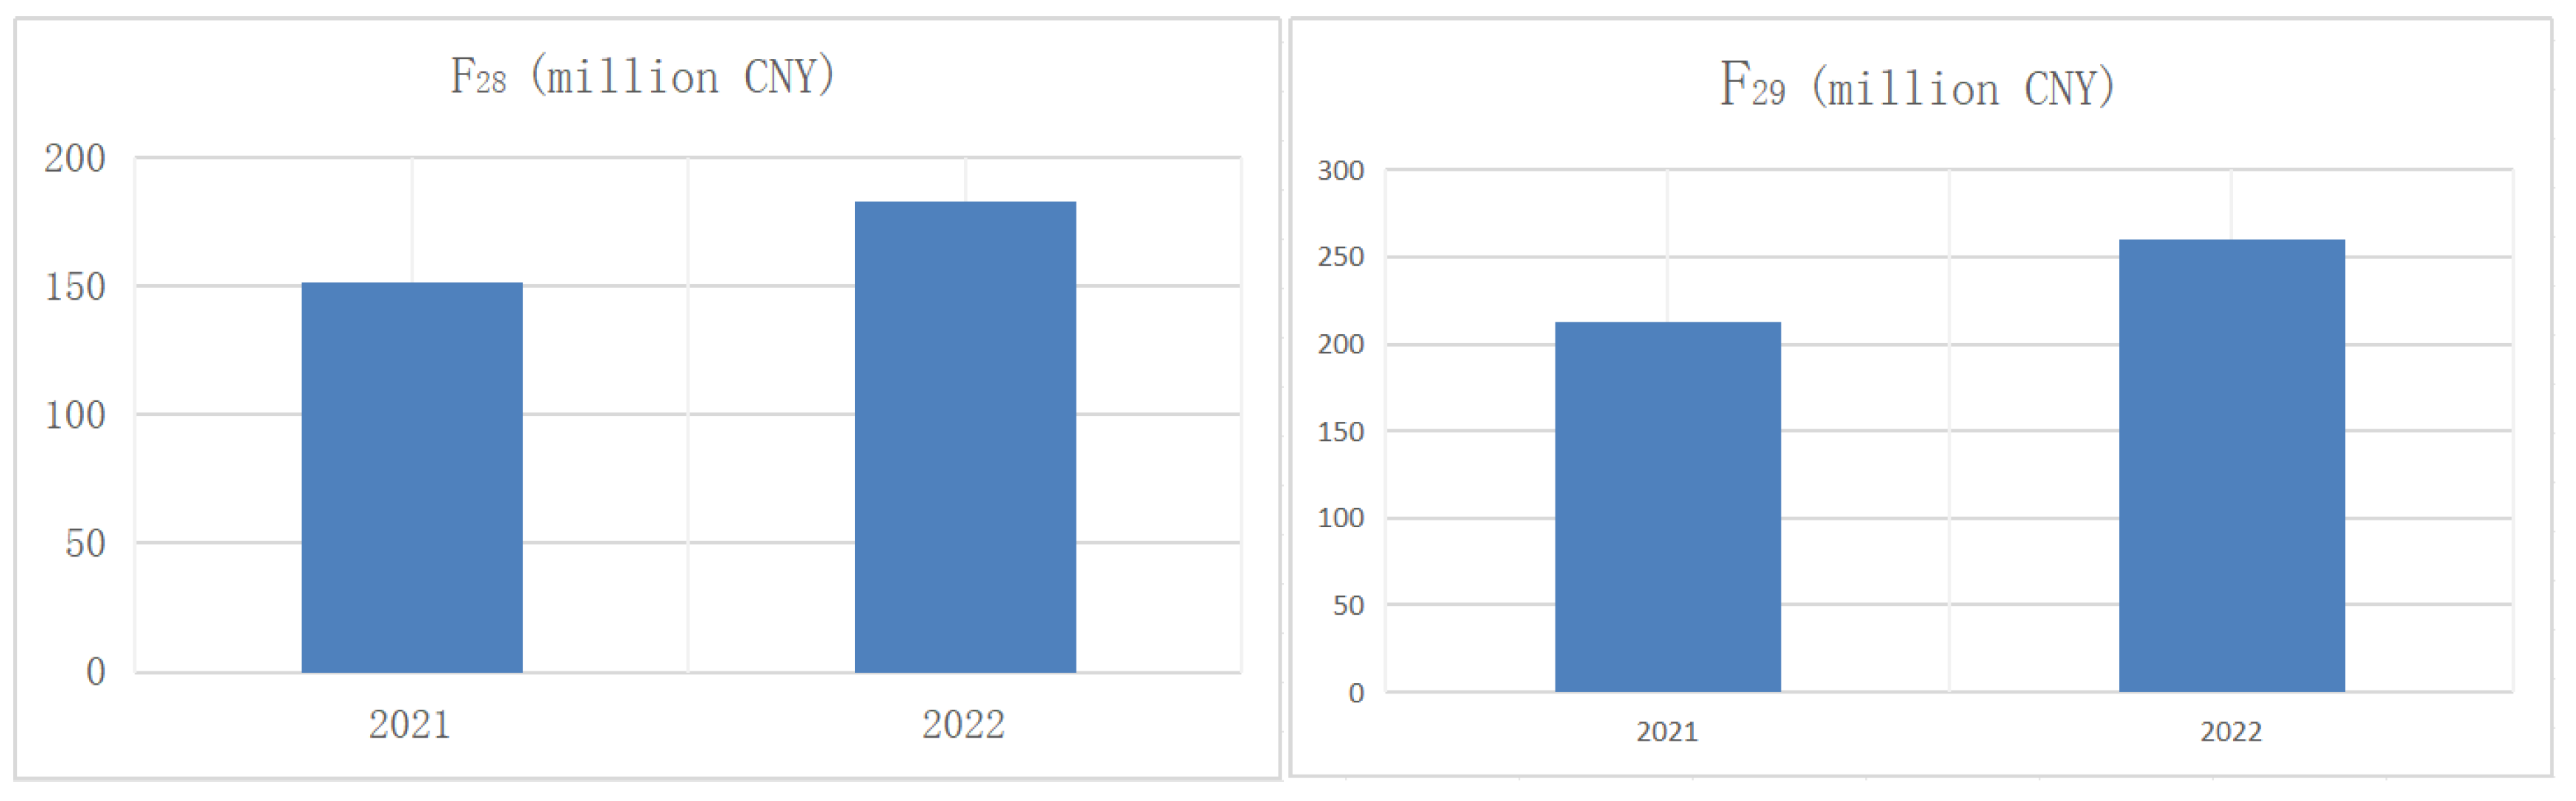
Topic 1 discusses financial support for innovation.
Figure 4 shows the word cloud map for Topic 1, where the larger the font size, the more frequent and important the keyword in Topic 1. Through analysis, it is determined that Topic 1 focuses on how to promote the improvement in RSTI capacity through supporting measures such as tax relief policies and project incubation. We also found that through the news report on Topic 1, the values of indicators such as tax reduction and exemption for high-tech enterprises (F
28, F
29) in Bengbu City in 2022 have significantly improved, as shown in
Figure 5.
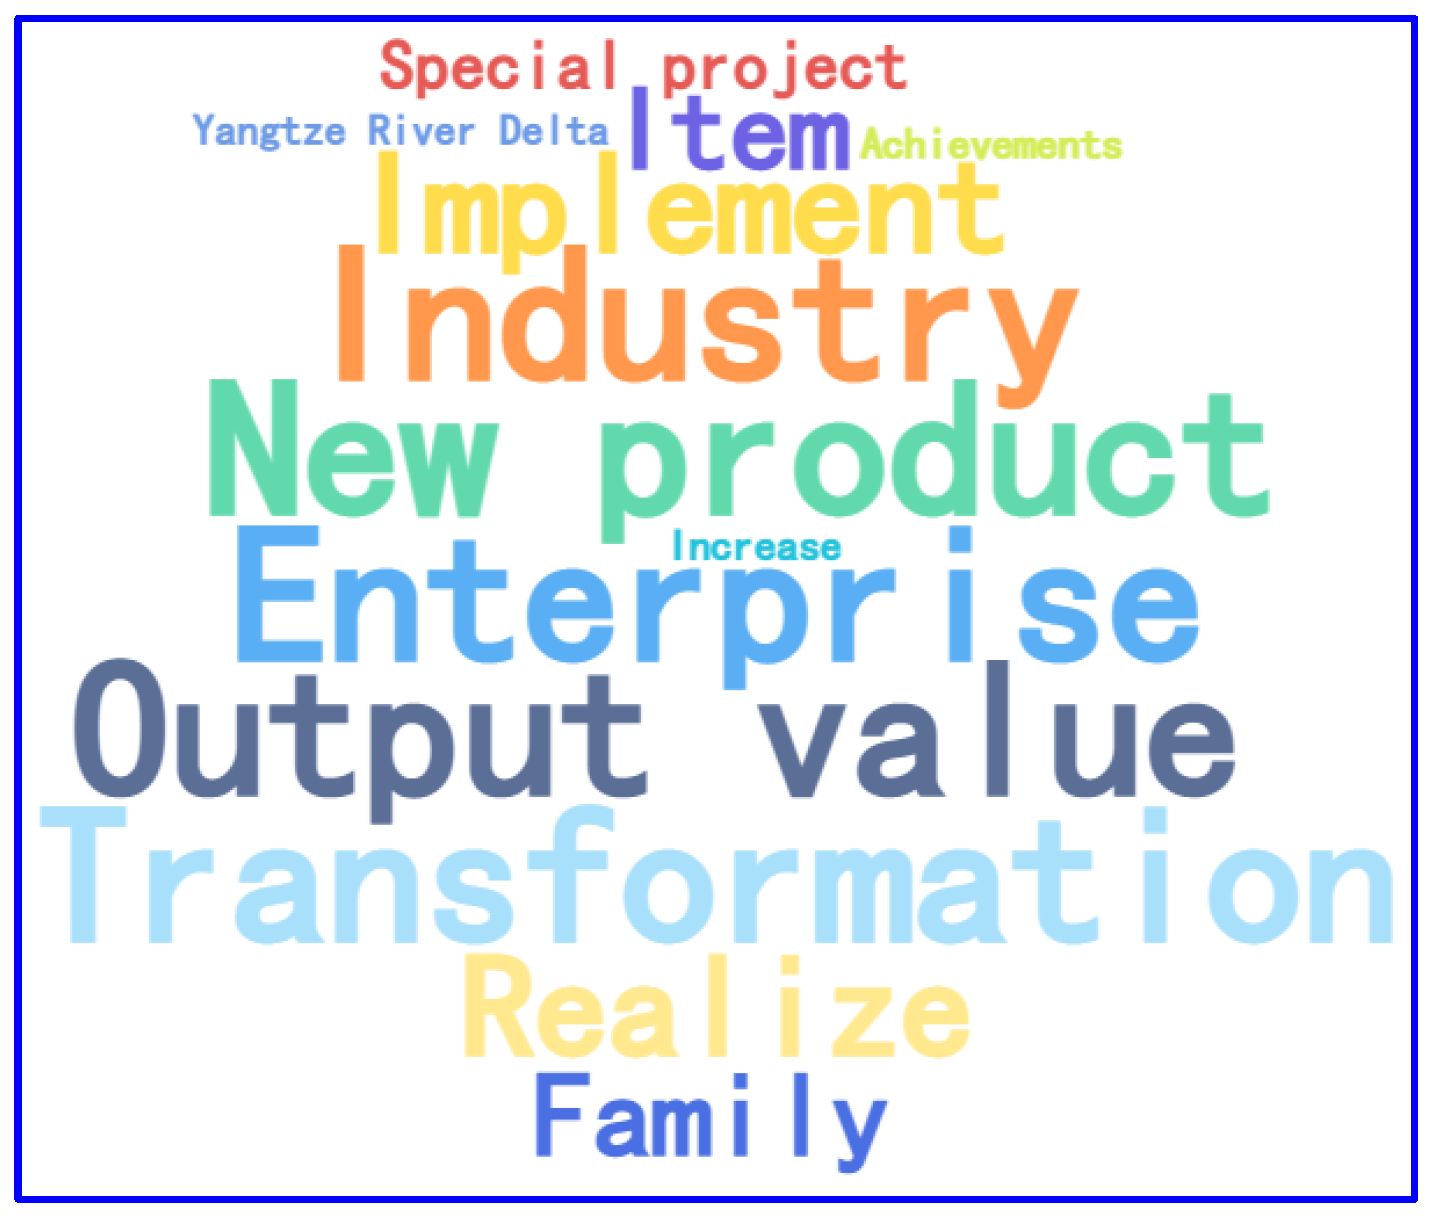
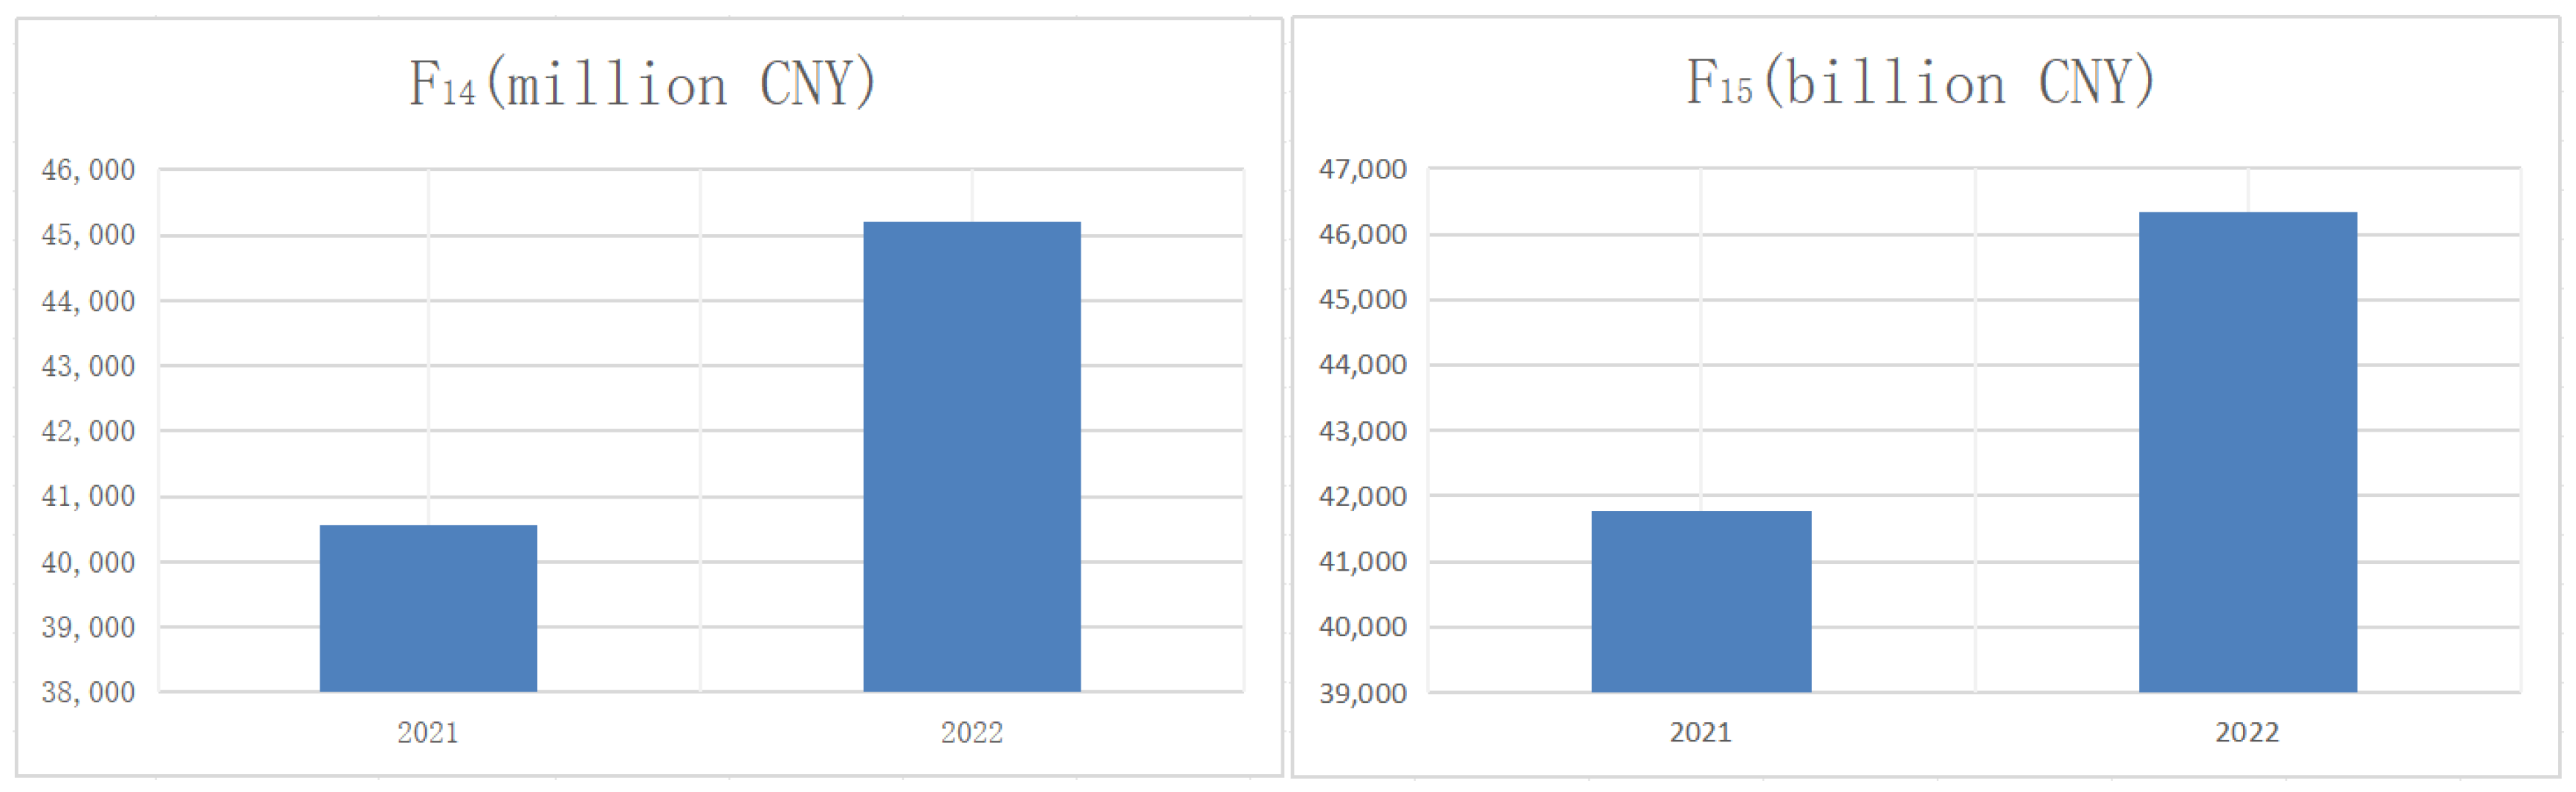
Topic 2 discusses innovation economic output.
Figure 6 shows the word cloud map for Topic 2, where the larger the font size, the higher the frequency and importance of the keyword in Topic 2. An analysis reveals that Topic 2 focuses on the impact of RSTI news on the transformation of scientific and technological achievements, new product research and development, and increased output value of related enterprises. Simultaneously, we find that through the news reports of Topic 2, the values of indicators such as new product sales (F
14) and high-tech industry output value (F
15) of Bengbu City in 2022 have significantly increased, as shown in
Figure 7.
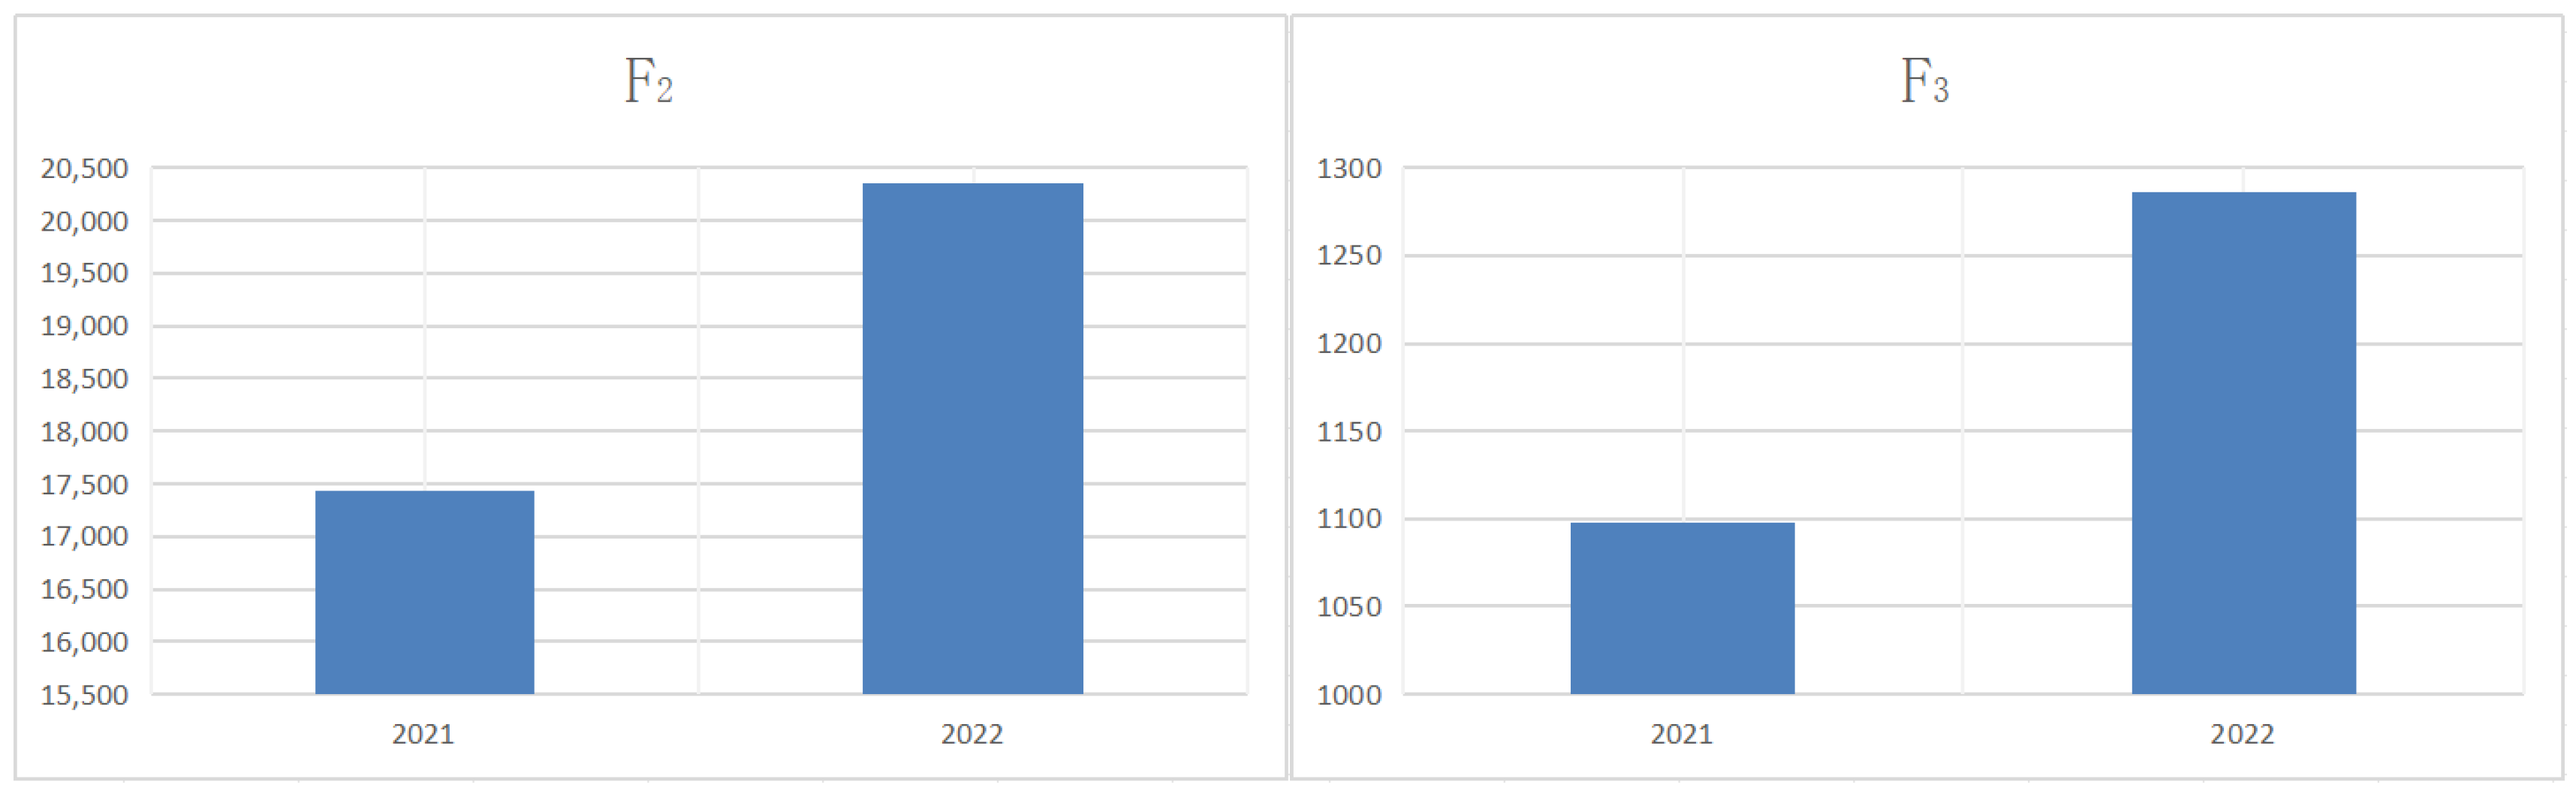
Topic 3 discusses the situation of scientific and technological resources.
Figure 8 shows the word cloud map for Topic 3, where the larger the font size, the higher the frequency and importance of the keyword in Topic 3. An analysis reveals that Topic 3 focuses on the development of highly educated talent, scientific research institutions, and the number of colleges and universities in the region. We also find that through the news report of Topic 3, the number of R&D personnel (F
2) and the number of doctoral graduates (F
3) in Bengbu City in 2022 have significantly improved, as shown in
Figure 9.
In summary, the relevant RSTI indicators have significantly improved because of the impact of science and technology news publicity on policy measures and innovation resource allocation.
Table 10 further analyzes the improvement in Bengbu’s RSTI capability level caused by changes in relevant RSTI indicators. We measured the European-style distance (F
1–F
29) between Bengbu and Chuzhou (benchmark city with a level-3 RSTI capability) and Huaibei (benchmark city with a level-4 RSTI capability) in all statistical indicators. The results showed that Bengbu was closer to a level-4 benchmark city in 2021 and closer to a level-3 benchmark city in 2022. The above analysis shows that the effective analysis of science and technology news data is preemptive to judge the RSTI capability of a city. The science and technology news indicators proposed in this paper are an effective supplement to the evaluation system of RSTI capability based on traditional statistical indicators.
7. Conclusions
This paper systematically reviews the factors and evaluation models that affect the development of RSTI capability in the environment of big data. Considering the multi-source heterogeneity of big data, this paper proposes a multi-entity collaborative evaluation scheme for RSTI capability. An evaluation indicator system of RSTI capability that integrates structured statistical data and unstructured news data is established. We construct an evaluation method of technological innovation capability based on AHP-SMO. This method can fully utilize the respective advantages of human experts and machine learning in the evaluation of RSTI capability and ensure scientific and effective evaluation results.
The theoretical and practical significance of this paper’s research is highly significant. At present, there are few studies on the evaluation of regional scientific and technological innovation ability using big data. Some studies only focus on how to use big data to analyze the innovation ability of industries and enterprises [
20,
43,
44,
45]. There are few studies that focus on the impact of government data provision on urban innovation capacity [
46], but these lack in-depth analysis of urban innovation capacity based on big data. Therefore, this study enriches relevant theories and methods. In terms of its theoretical contribution, this paper primarily focuses on three key aspects.
First, a multi-entity collaborative evaluation scheme is proposed. By integrating data from multiple data sources of universities, scientific research institutions, and government departments to evaluate the level of RSTI capability, it helps to discover new correlations, trends, and patterns, realize the value addition of data, and reflect the value emergence of big data.
Second, this paper extracts knowledge from news texts by topic analysis and sentiment analysis, constructs relevant indicators, and combines them with traditional statistical indicators to establish a new evaluation indicator system. This paper further enriches the application range of big data analysis theory and methods, embodies the value of big data in the evaluation of RSTI capability, and reveals that news indicators play a leading role in the evaluation of RSTI capability.
Third, the AHP-SMO method proposed in this paper organically integrates the knowledge and experience of experts in the field and the scientific laws contained in big data in the process of evaluating RSTI capability, which is a theoretical innovation of subjective and objective evaluation theories and methods and has extensive reference significance for the evaluation of economic management.
The practical significance of this paper is reflected mainly in terms of the following three aspects.
First, scientific evaluation of RSTI capability is the basis for government departments to formulate policies to promote RSTI. The research results of this paper are helpful for government departments to understand the advantages and disadvantages of RSTI and to provide a basis for policy formulation and allocation of science and technology resources.
Second, the research results of this paper can be used to improve the evaluation system of scientific and technological achievements, drive the flow and allocation of innovation factors, better utilize the role of scientific and technological achievement evaluation, promote the closer integration of science and technology with economic and social development, accelerate the transformation of scientific and technological achievements into real productivity, and improve the quality of urban development.
Third, the research in this paper contributes to the sustainable development of cities. By constantly improving the city’s ability of scientific and technological innovation, the city will develop from industrialization to informatization and intelligence. Finally, the harmonious development of human, nature, economy, and society will be realized.
This study has some shortcomings. On the one hand, we verify the effectiveness of the proposed evaluation scheme, indicator system, and evaluation method using only the data of Anhui Province. In the future, we will try to verify the generality of the conclusions of this study using more extensive regional data. On the other hand, the RSTI capacity is constantly developing, and we mainly employed 2021 slice data, which has certain limitations. In the future, we will try to use data from multiple years to carry out a dynamic evaluation of RSTI capabilities.


