Article

Techno-Economic Sustainability Potential of Large-Scale Systems: Forecasting Intermodal Freight Transportation Volumes

1
Institute of Foreign Economic Security and Customs Affairs, Peoples’ Friendship University of Russia (RUDN University), 6 Miklukho-Maklaya Street, 117198 Moscow, Russia
2
Institute for the Study of International Economic Relations, Financial University under the Government of the Russian Federation, 125993 Moscow, Russia
3
Graduate School of Intelligent Systems and Supercomputing Technologies, Peter the Great St. Petersburg Polytechnic University (SPbPU), 29 Polytechnicheskaya Street, 195251 St. Petersburg, Russia
4
Industrial Streaming Data Processing Systems Lab, Peter the Great St. Petersburg Polytechnic University (SPbPU), 29 Polytechnicheskaya Street, 195251 St. Petersburg, Russia
*
Author to whom correspondence should be addressed.
Sustainability 2024, 16(3), 1265; https://doi.org/10.3390/su16031265
Submission received: 12 December 2023 / Revised: 22 January 2024 / Accepted: 29 January 2024 / Published: 2 February 2024

Abstract

:
The sustainability of large economies is one of the most important challenges in today’s world. As the world strives to create a greener and more efficient future, it becomes necessary to accurately analyze and forecast freight volumes. By developing a reliable freight transportation forecasting model, the authors will be able to gain valuable insights into the trends and patterns that determine the development of economic systems. This will enable informed decisions on resource allocation, infrastructure development, and environmental impact mitigation. Such a model takes into account various factors such as market demand, logistical capabilities, fuel consumption, and emissions. Understanding these dynamics allows us to optimize supply chains, reduce waste, minimize our carbon footprint, and, ultimately, create more sustainable economic systems. The ability to accurately forecast freight volumes not only benefits businesses by enabling better planning and cost optimization but also contributes to the overall sustainable development goals of society. It can identify opportunities to shift to more sustainable modes of transportation, such as rail or water, and reduce dependence on carbon-intensive modes, such as road or air. In conclusion, the development and implementation of a robust freight forecasting model is critical to the sustainability of large-scale economic systems. Thus, by utilizing data and making informed decisions based on these forecasts, it is possible to work toward a more sustainable future for future generations.

1. Introduction

Container transportation is the main component of intermodal transportation in international trade [1]. Intermodal transportation is carried out with the involvement of two or more modes of transport [2]. Their specificity also lies in the fact that the cargo on the whole route is in the same transport unit, such as a container, and transportation is carried out under a single transport document and the control of a single operator. Under such conditions, the shipper does not have to conclude separate contracts with transport companies and personally control all links of transportation, for example, complex processes of container reloading, coordination of schedules, etc. This convenience is an important factor that provides this type of transportation with a constant influx of new customers, especially considering that operators also control customs operations when crossing interstate borders.
In modern conditions, very often consignors or consignees have a need to reduce the time of cargo delivery, not necessarily with minimal costs—it is associated with accelerating the realization of goods and increasing their profits [3]. Therefore, there is a need to choose the route of intermodal transportation not only by the criterion of delivery cost but also by time [4].
Unfortunately, today there is no single technology that would perform intermodal transportation planning in an automated mode, taking into account all the requirements and criteria of the shipper, so the topic of research is relevant.
International container transportation is an important component of modern international trade. In this regard, it ensures the safety and efficiency of cargo transportation around the world, saving time and reducing costs.
However, despite all the advantages, choosing the optimal route and planning intermodal transportation can be a complex and time-consuming task for shippers and consignees [5]. The need to accommodate delivery time and cost requirements, as well as coordinate the schedule and ensure control of the entire process, poses numerous challenges [6].
Currently, research and development in the field of automation and optimization of intermodal transportation is actively carried out. This includes the development of special software systems and algorithms that can take into account all requirements and constraints to offer the optimal solution for each specific task.
It is also worth noting that the use of modern information technologies, such as smart cargo monitoring systems, the development of specialized platforms for combining different modes of transport, and the automation of transport operations, can significantly simplify and speed up the process of planning and execution of intermodal transport [7].
In general, automation and optimization of intermodal transportation are important areas of development in logistics and international trade. This will improve transportation efficiency, shorten delivery times, and reduce costs for companies engaged in international cargo transportation.
Undoubtedly, the growth of container turnover of seaports is a positive signal for the development of intermodal transportation. The increasing volume of cargo moving by sea confirms the growing need for efficient and optimized logistics solutions. One of the key advantages of intermodal transportation is the ability to use different modes of transportation—sea, rail, road, and air—to deliver cargo from sender to receiver. This allows choosing the most optimal route and reducing delivery time, especially in the case of long-distance and intercontinental transportation [8]. In addition, automation and optimization of intermodal transportation processes can reduce costs for companies engaged in international trade. Automated cargo tracking and management systems allow for more accurate planning and coordination of shipments, minimizing the risks of cargo loss or damage [9,10]. In addition, route optimization and the use of modern technologies can reduce fuel costs and improve overall transportation efficiency. Thus, the development of intermodal transportation and its automation play an important role in logistics and international trade. They contribute to increased efficiency, shorter delivery times, and lower costs for companies, which ultimately lead to improved service quality and customer satisfaction.
This study is organized as follows. Section 1 is the introduction. Section 2 presents the literature review. The empirical analysis and research methods are presented in Section 3. Section 4 discusses the results of this study. The results of this study are presented in Section 5.

2. Literature Review

Freight transportation structure models are mainly based on mode choice process such as mode comparison, decision criteria, and freight demand types.
Xiuyu Shen et al. [11] determine an accurate understanding of the spatio-temporal information of future truck traffic speed in the megalopolis. The study focuses on developing a decentralized spatio-temporal truck traffic speed prediction model using federated learning. The authors propose a specialized spatio-temporal transformation network for local training based on the identity of each participant, in contrast to the existing graph-based convolutional network. They also develop a decentralized federated learning model to combine local personalization models for predicting truck speeds, with theoretically illustrated convergence properties. The experiment based on real data from freight traffic in cities within the Nanjing metropolitan area demonstrates that the proposed approach accurately predicts freight traffic speed and outperforms existing methods. The visualization results show that the approach effectively captures internal spatio-temporal dependencies between urban areas from different neighboring cities, enabling the joint development of freight management strategies. In conclusion, the study offers a novel approach to predicting truck traffic speed and has practical implications for freight management strategies. It also sets the stage for future research in this area.
Elias Khajeh et al. [12] described three innovative methods for forecasting container freight rates. Overall, the study provides a comprehensive analysis of container freight rate forecasting and offers practical implications for policymakers and practitioners in the supply chain industry. The innovative methods used in the study, including the extraction and classification of disruptive events, as well as the application of the Prophet forecast, demonstrate the potential for improving the accuracy of freight rate forecasting. The study also highlights the importance of considering external factors, such as overcapacity, and the impact of events, like the coronavirus, on freight rates. This research sets the stage for future studies to further refine and improve container freight rate forecasting methodologies.
Díaz-Ramírez, J. et al. [13] presented a new approach to forecasting freight rates in container transportation using “soft facts” in the form of indicators derived from surveys of practitioners who were asked about their sentiments, beliefs, or perceptions of present and future market developments. An integrated moving average with an autoregressive (ARIMA) model was used as the base model, and the results obtained were compared with multivariate models that allow the integration of exogenous variables, i.e., ARIMAX and Vector Autoregressive (VAR). Having studied only the Far East–Northern Europe trade route, the authors consider that the proposed practical application can improve forecasting performance for other trade routes and shipping markets and is likely to detect market and environmental-nomic changes much earlier than the actual evidence available at the time. The study also highlights the impact of the COVID-19 pandemic on freight transportation, particularly the shift in demand for trucking and the subsequent increase in energy consumption and pollution [14]. The proposed evolutionary model based on Markov theory aims to optimize the freight transportation structure post-COVID-19, taking into account the growth of the freight industry and the need for a reasonable freight volume increase each year. The application of economic cybernetics in developing this model provides a systematic approach to solving the problem of achieving a balanced freight structure. The results of the study suggest that China’s freight transportation structure is in an adjustment period and is projected to enter a stable period by 2035. The findings also emphasize the importance of increasing the growth rate of rail and water freight transport to optimize the freight transport structure. The proposed freight trajectory optimization method offers a proactive approach to rationalizing the freight transport structure, especially in the face of disruptive events, such as the COVID-19 pandemic. Overall, this research provides valuable insights into the optimization of freight transportation structures post-COVID-19 and offers a systematic model for decision makers in the shipping industry to consider when planning for future changes in freight demand and supply.
The characteristics of the supply chain (SCC) play a crucial role in urban logistics, which drives the economic activity and transformation in a city. However, the dynamics of freight trip activity and SCC in urban logistics are not well understood by urban planners, leading to difficulties in predicting urban freight trip generation (FTG) models. To address this, a study proposes a concept for estimating freight trip activity by incorporating both observed and unobserved (subjective) SCC information for sustainable urban transportation [15]. Conventionally, FTG models only consider objective variables and exclude unobserved FTG information.
This study suggests that incorporating both observed and unobserved variables related to the characteristics of the supply chain (SCC) in urban logistics can improve the accuracy of freight trip generation (FTG) models. Currently, urban planners face challenges in predicting FTG due to the lack of understanding of the dynamics of freight trip activity and SCC.
Conventionally, FTG models only take into account objective variables such as population, employment, and land use. However, this approach overlooks the subjective information related to the SCC, which is crucial in understanding and predicting FTG accurately.
By including both observed and unobserved SCC information, planners can gain a more comprehensive understanding of urban logistics and make informed decisions for sustainable urban transportation. This concept will allow for a deeper analysis of the factors influencing freight trip activity and enable better predictions of FTG models.
Overall, the characteristics of the supply chain in urban logistics are essential for driving economic activity and transforming a city. By incorporating both observed and unobserved SCC information, urban planners can develop more accurate FTG models and make better decisions for sustainable urban transportation.
Bock, Cottrell, and Hotchkiss [15] say: «To overcome this limitation, subjective variables are included to provide measures of both observed and unobserved FTG information. The study developed a unique framework using exploratory factor analysis (EFA) and structural equation modeling (SEM) to estimate freight trip activity. The framework was validated using the Enterprise-Based Freight Survey (EBFS) data collected in an Indian smart city, which included various SCCs. EFA was applied to identify subjective variables employing latent structures to explain observed and unobserved information in the SCCs. SEM was then conducted with a hypothetical path structure to estimate freight trip activity. The FTG model revealed the direct, indirect, and total effects of the SSC on freight trip activity, highlighting the additional benefits of the causal relationship between urban freight trip activity and the SCC. The developed FTG models, incorporating both observed and unobserved SCC information, were able to predict freight trip activity with 57% accuracy for the intermediate and 63% accuracy for the net receiver» [15]. Understanding the impact of FTGs on freight travel activity is essential for developing a sustainable urban freight transportation system that can meet the demands of the global market. This system should be flexible, responsive, and adaptive to ensure efficient and effective urban logistics.
Lisa Bjork et al. [16] have shown that for some decades the modal shift in the freight sector has been supported by policymakers as an important basis for accomplishing transportation emission reduction targets. The findings suggest that while modal shift policies have been effective in increasing the share of rail and maritime transport in Sweden, the actual contribution of this shift to reducing emissions is limited. This is due to several factors, including the already high level of decarbonization in road freight transport and the relatively low emissions intensity of Swedish road freight compared to other countries. The study also highlights the challenges associated with modal shifts, such as infrastructure constraints and increased costs for certain industries. It argues that focusing solely on modal shift as a mitigation strategy may not be the most efficient approach and that a more holistic approach including other measures, such as vehicle electrification and fuel efficiency improvements, should be considered. The results of this study emphasize the need for a careful evaluation of the potential benefits and limitations of modal shift policies in different contexts. While a modal shift can play a role in reducing emissions in certain cases, it is important to consider other factors, such as decarbonization potential and cost effectiveness. Further research is needed to better understand the optimal combination of strategies for achieving sustainable and low-emission freight transport.

3. Materials and Methods

3.1. Empirical Analysis

According to «Alphaliner», in the 1st half of 2022, container traffic at 250 of the world’s seaports grew by about 6.7% year-on-year. At the same time, in the 2nd quarter of 2023, the volume acceleration accelerated to 7.4% compared to the 1st quarter, 5.9%, and by the end of the year, the volume of container traffic may grow by more than 6%, reaching a six-year high [17].
These numbers indicate a strong recovery and growth in the global container shipping industry. The increase in container turnover and transportation volumes suggests a rebound in global trade and economic activity. The growth rates in the second quarter of 2023 are particularly noteworthy, as they indicate an acceleration in the recovery.
Alphaliner’s findings correlate very closely with the forecasts of analysts of Drewry, who estimated that the growth rate for the 1st half of the year was 6.6% and also forecasted record growth for 2023 as a whole [18].
According to “Container Trade Statistics”, the volume of container transportation on the routes from Asian ports to Europe for 7 months of 2022 increased by 5.3% to 9.4 million TEU [19]. In the reverse direction to Asia, the volumes increased by 3.7% to 1.6 million TEU. On the other hand, on the trans-Pacific services in the direction of the USA, the volume growth amounted to 7.3%, and in the reverse direction, the traffic increased by 8% to 2.7 million TEU [19,20].
The data also highlight the importance of Asian ports in global container transportation. The increase in container volumes on routes from Asian ports to Europe and the US demonstrates the region’s role as a major manufacturing and exporting hub. Additionally, the growth in trans-Pacific services indicates the strength of trade between Asia and the US.
In August 2022, the Container Port Capacity Index, estimated by Drewry based on data from 220 ports around the world that generate approximately 75% of the world’s container traffic, reached 126.8 points, the highest value of the index since its calculation began in January 2022; compared to July, the index increased by 0.6 points, or 0.5%, and by 6.8 points, or 5.7%, on an annualized basis [21].
The Container Port Throughput Indices provide further evidence of the recovery in the shipping industry. The fact that the index reached its maximum value since the beginning of the year suggests a strong performance by container ports globally. The annual increase in the index further confirms the positive trend in container throughput.
Overall, these findings from Alphaliner, Drewry, and Container Trade Statistics point to a robust recovery and growth in the global container shipping industry. The data suggest that container traffic is returning to pre-pandemic levels, indicating a positive outlook for global trade and economic activity.
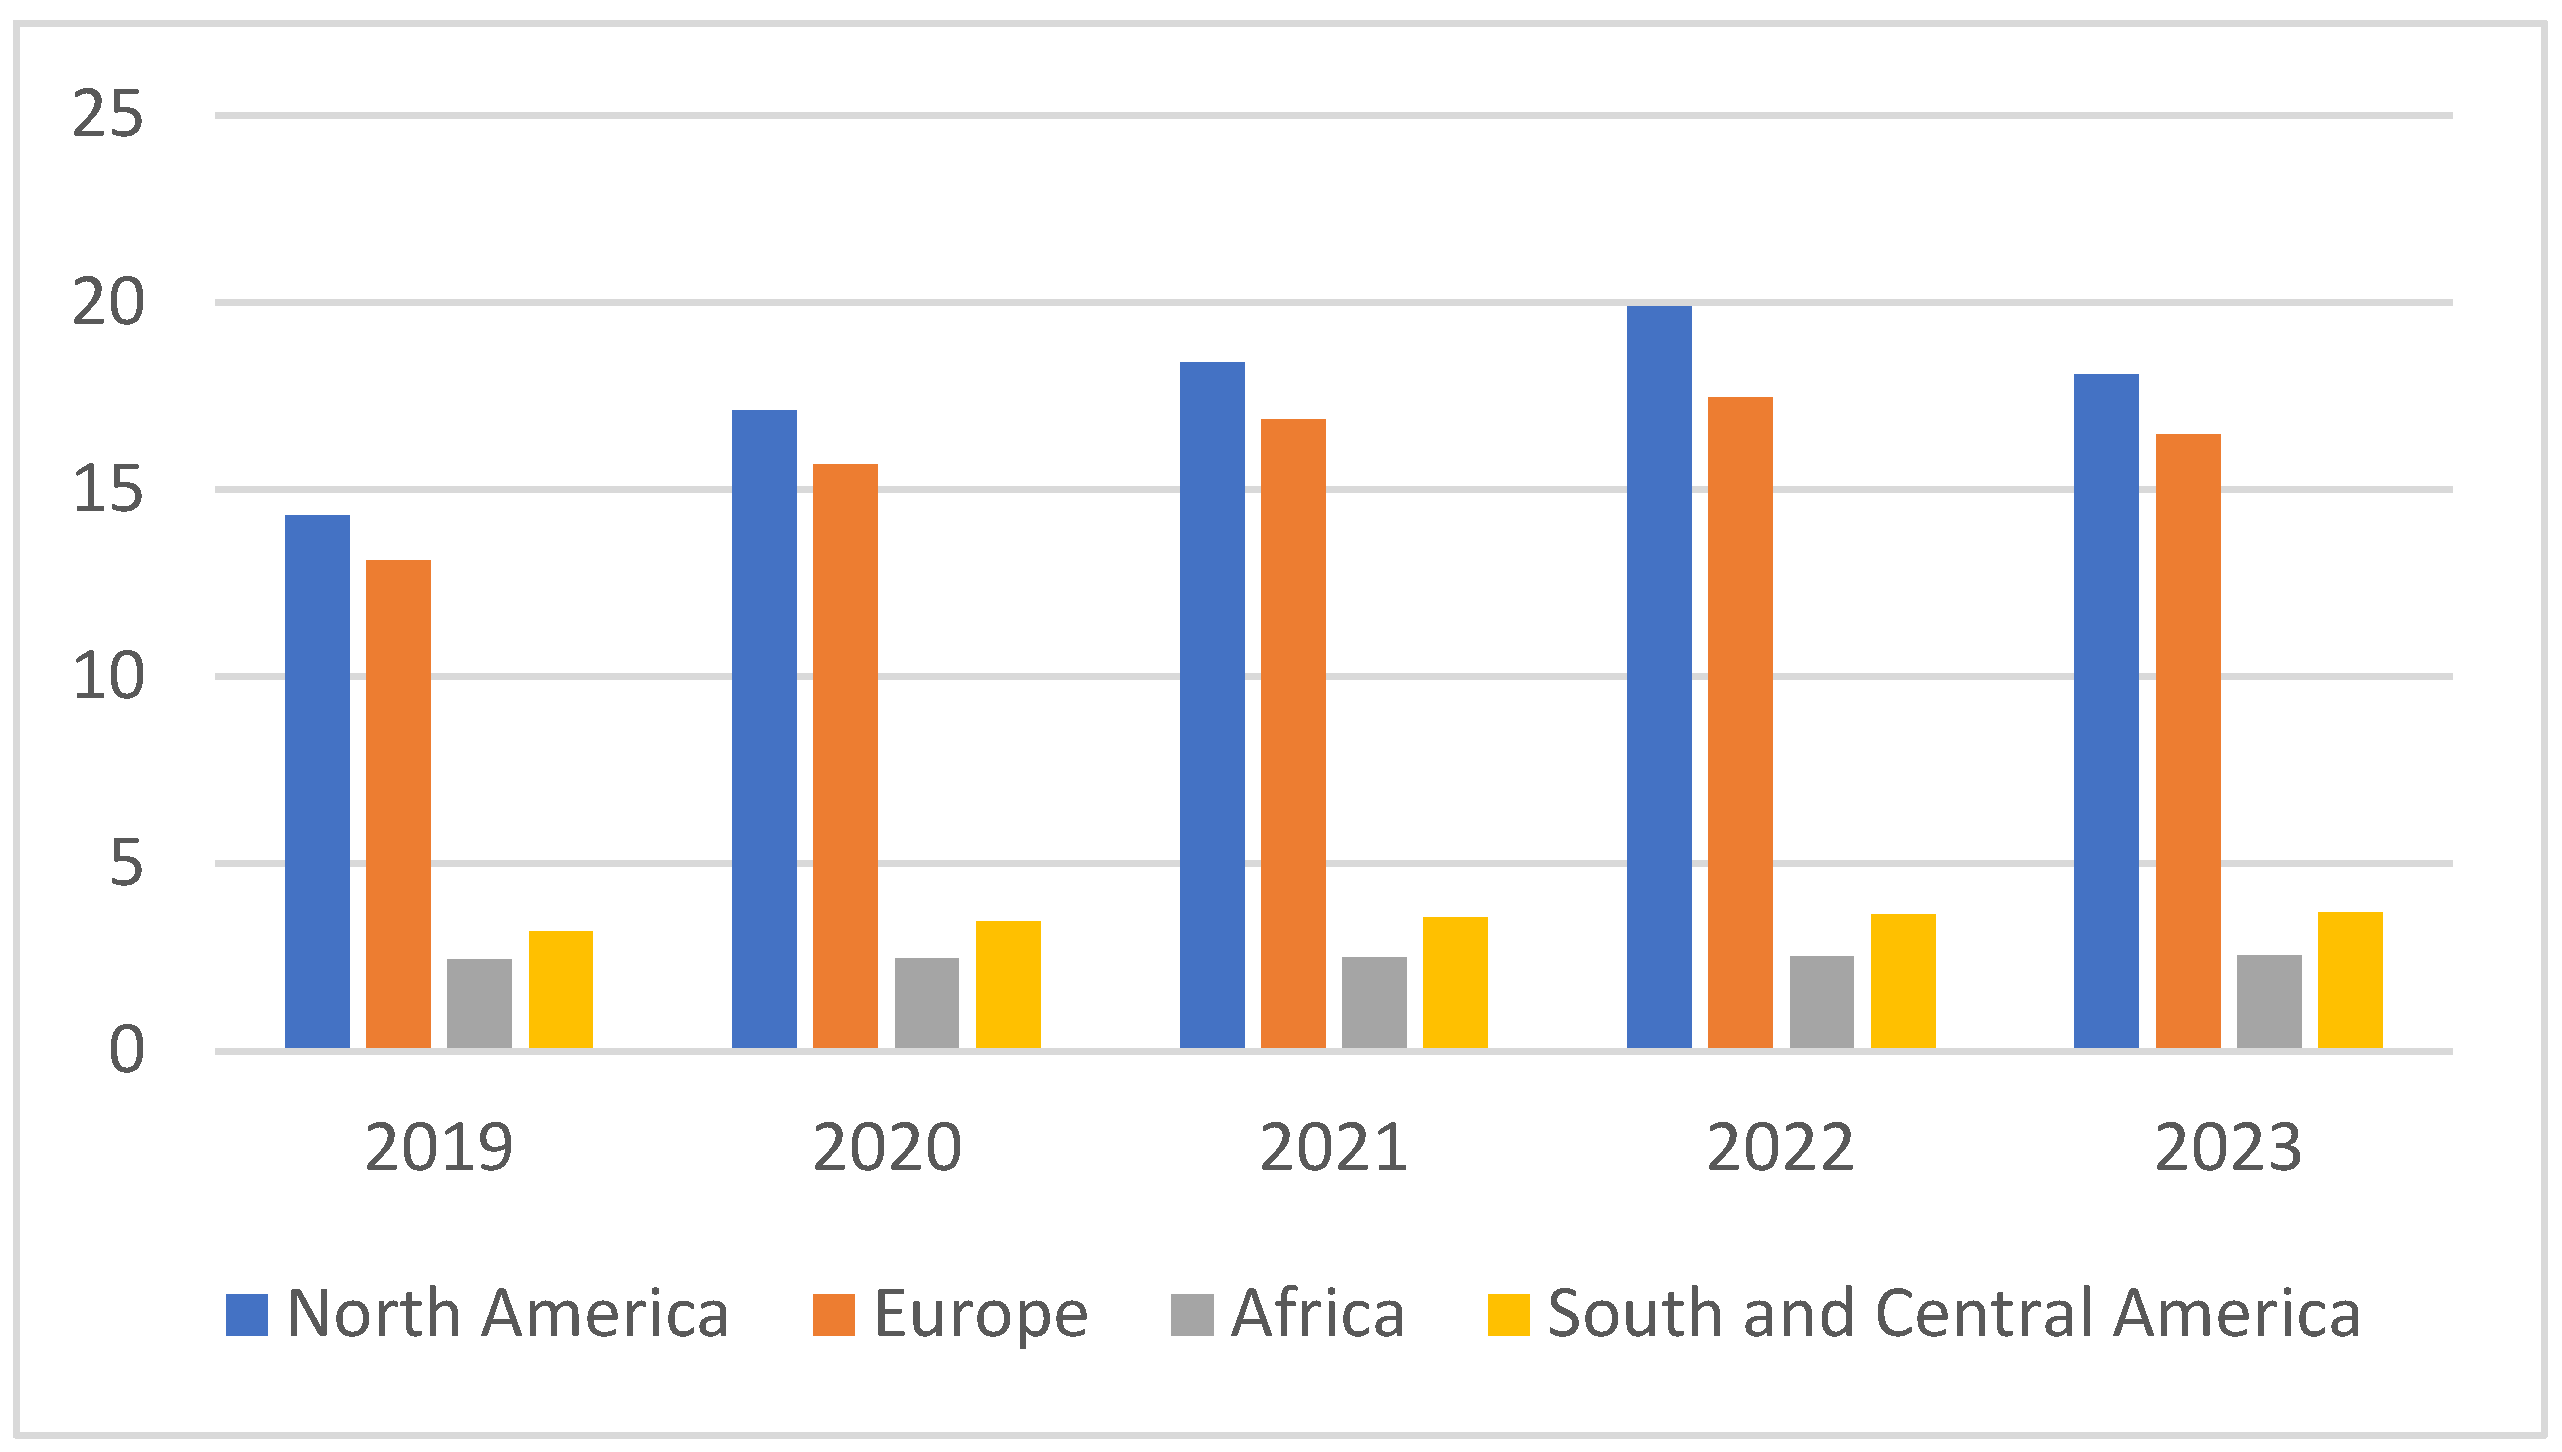
At the same time, African countries showed the greatest growth (+14.3%), but North America was more significant (+7.0%). China and Europe showed the same growth of 5.1% [21,22].
According to the results in 2022 [23], «the cargo turnover of seaports in the Far East basin increased by 4.5% compared to 2021 and amounted to 200.5 million tons. According to the results of 2022 in the Far East basin cargo handling increased by 4.5% to 200.5 million tons, and compared to 2004 by 2.9 times» [23]. Almost half of the cargo turnover is coal. There are other cargo categories with high growth potential, including exports to Asia–Pacific countries (APR)—the nomenclature of available niches for investment is significantly higher; for example, grain, containers, and petrochemicals.
The volume of dry cargo transshipment accounted for 125.5 million tons (+6.8%), while the volume of liquid cargo transportation amounted to 75 million tons (+1%) [24,25].
The increase in the volume of dry cargo transshipment was influenced by the growth of bulk cargo transshipments by 5.9%, general cargo by 9.2%, and containerized cargo by 12.4% [26]. The increase in the volume of liquid cargo transshipment was due to a 3.7% increase in the volume of oil product transshipments and a 0.6% increase in the volume of crude oil transshipments, while the volume of liquefied gas transshipments decreased by 1% [27]. The share of export cargo in the cargo turnover of the Far East basin remains significant at 86.2%, while the shares of import, transit, and cabotage are 3.6%, 0.5%, and 9.7%, respectively [28].
«According to the results of 2022, the cargo handling of the Arctic basin seaports increased 1.3 times compared to 2021 and amounted to 92.7 million tons: the volume of liquid cargo handling amounted to 62.3 million tons (+41%), dry cargo handling—30.4 million tons (+4.3%)» [29].
The volume of dry cargo transshipments increased mainly due to a 4.4% increase in the volume of bulk cargo transshipments (coal (+12.2%), mineral fertilizers (+6.7%). At the same time, general cargo transshipment volumes decreased by 14.6%, while liquid cargo transshipments increased 1.4 times, mainly due to a 23.9% increase in crude oil transshipments and the continued growth of liquefied gas shipments through the port of Sabetta. The share of export cargo transshipments in the Arctic basin is 60%, import cargo is 0.5%, and short sea cargo is 39.5%. Transit cargo transshipments in the seaports of the Arctic basin were not carried out [30].
Container turnover of the world’s ports for the first quarter of 2022 increased by 5.8% compared to the same period last year. In the first three months, the container turnover of Chinese ports increased by 7.3%. Traffic through the 18 largest ports of the USA and Canada, which account for more than 85% of the total turnover of the two countries, increased by 7.4% [31].
The reorientation of cargo traffic from Asia to the ports of the east coast of North America continues. In the period from January to April, the share of west coast ports in the total container turnover of the ports of the two countries decreased from 65.32% to 66.8% a year earlier, the share of the east coast increased last year from 30.44% to 31.1%, and the Gulf Coast increased from 2.43% to 3.28% [30,31].
Figure 1 is a diagram showing container turnover between ports in the Far East and other regions.
Chinese ports in 2022 increased cargo turnover by 8.8% to 13.95 billion tons compared to 2021. This is evidenced by the data of the Ministry of Transport of the People’s Republic of China.
According to the Ministry, transshipments of foreign trade cargoes increased by 4.8% to 4.32 billion tons. Container turnover increased by 4.4% to 261.1 million TEU.
The growth in transshipment volumes was recorded against the background of a 6.3% increase in inland waterway traffic to 7.47 billion tons [31].
China’s largest ports are:
-
Shanghai;
-
Ningbo-Zhoushan;
-
Shenzhen;
-
Hong Kong;
-
Guangzhou;
-
Qingdao;
-
Tianjin;
-
Dalian;
-
Qinhuangdao;
-
Xiamen.
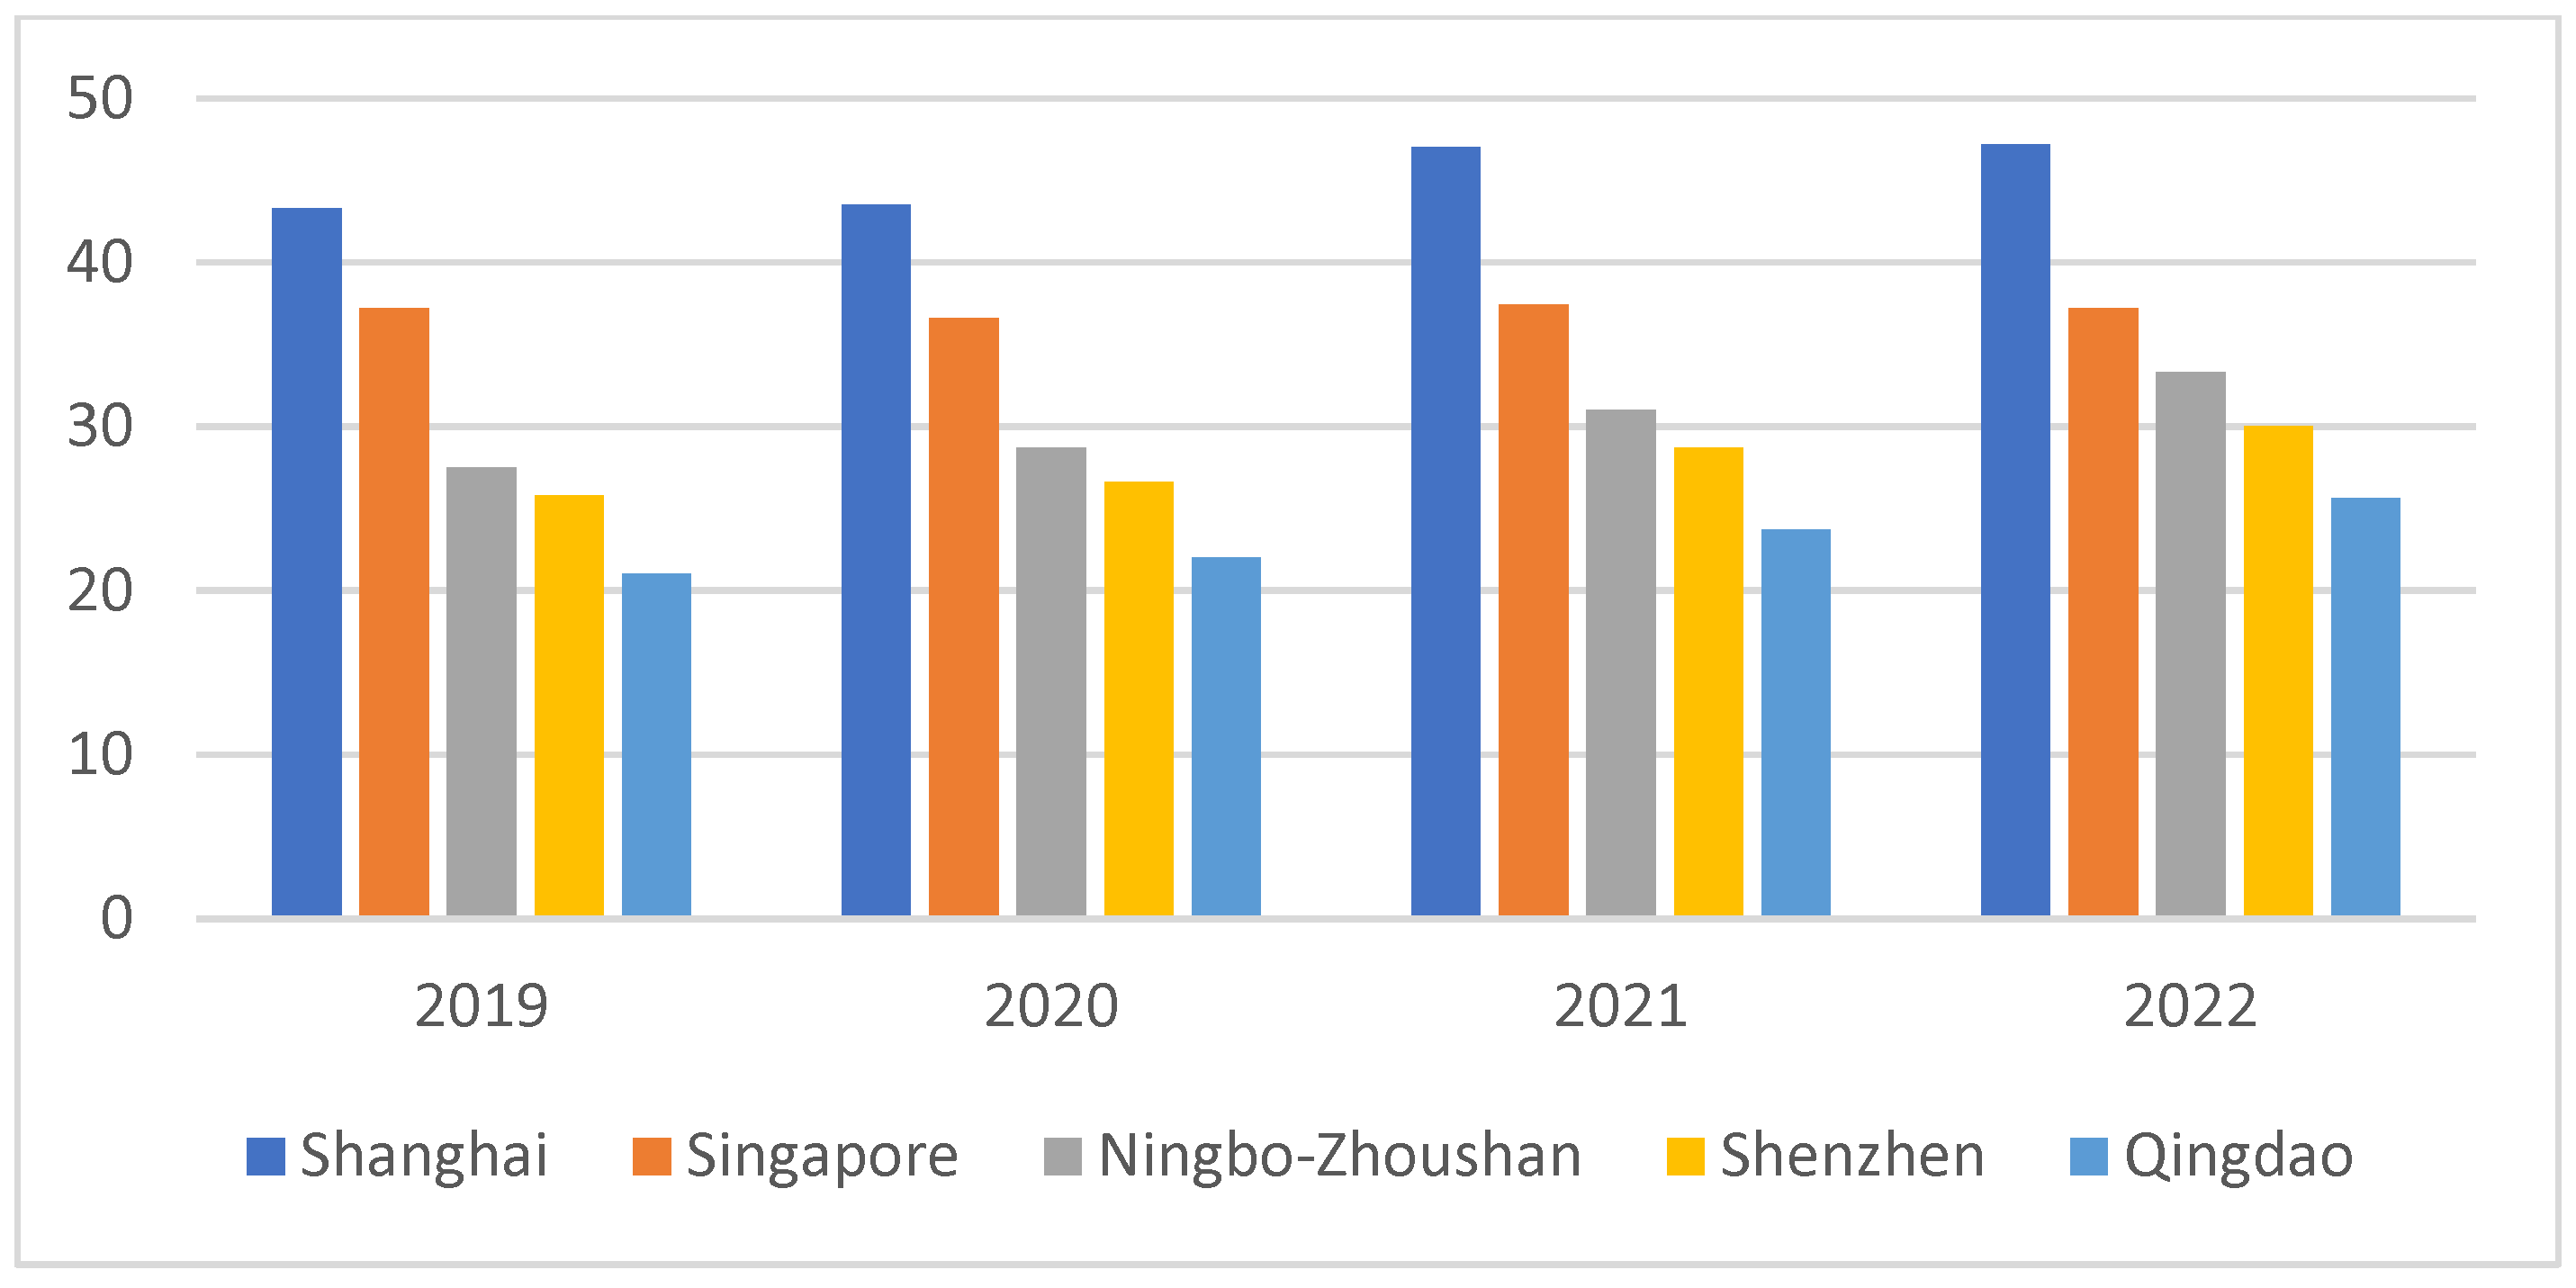
The world’s ten largest container ports handled 244 million TEU in 2022; up 4.3% from 2021. Seven of the world’s ten largest container ports are located in China.
Shanghai has topped the ranking since 2010, but second-place Singapore managed to narrow the gap to 5.4 million TEU in 2018. Guangzhou was the second-fastest-growing port and moved up two places to 5th place, while Hong Kong, which was the world’s largest container port until 2004, dropped two places to 7th place. Hong Kong’s turnover decreased by 5.7% in 2018 to 19.6 million TEU [25,31].
Shanghai retained its leadership as the busiest container port in the world—by the end of 2022, its container turnover amounted to 43.3 million TEU. Compared to the final figures of 2022, the container turnover increased by 3.1%. Shanghai’s closest competitor is Singapore, which handled 37.2 million TEU in the first 12 months of 2022 (+1.6% compared to 2021) [31].
In December of the reporting year, Shanghai’s container turnover decreased by the same 8.5% both relative to the previous month and to December 2021, to 3.25 million TEU.
Singapore’s berths handled 3.2 million TEU in December (−2.1% vs. November 2021 and +2.2% vs. December 2021).
Among European ports, which focus mainly on handling import and export container flows, Rotterdam and Antwerp showed the highest growth.
Transshipment volumes through Northern European ports grew by 6.6%. The highest growth rates were recorded in the largest container port in Europe, Rotterdam (+8%), and traffic through the ports of Hamburg and Bremerhaven decreased by 0.7% and 1%, respectively.
The second largest container port in Europe, Antwerp, increased container turnover by 6.4% in the first nine months of 2022, while total transshipment volumes increased by 1.1% [31].
Figure 2 is a chart showing the container turnover of the world’s five largest ports.
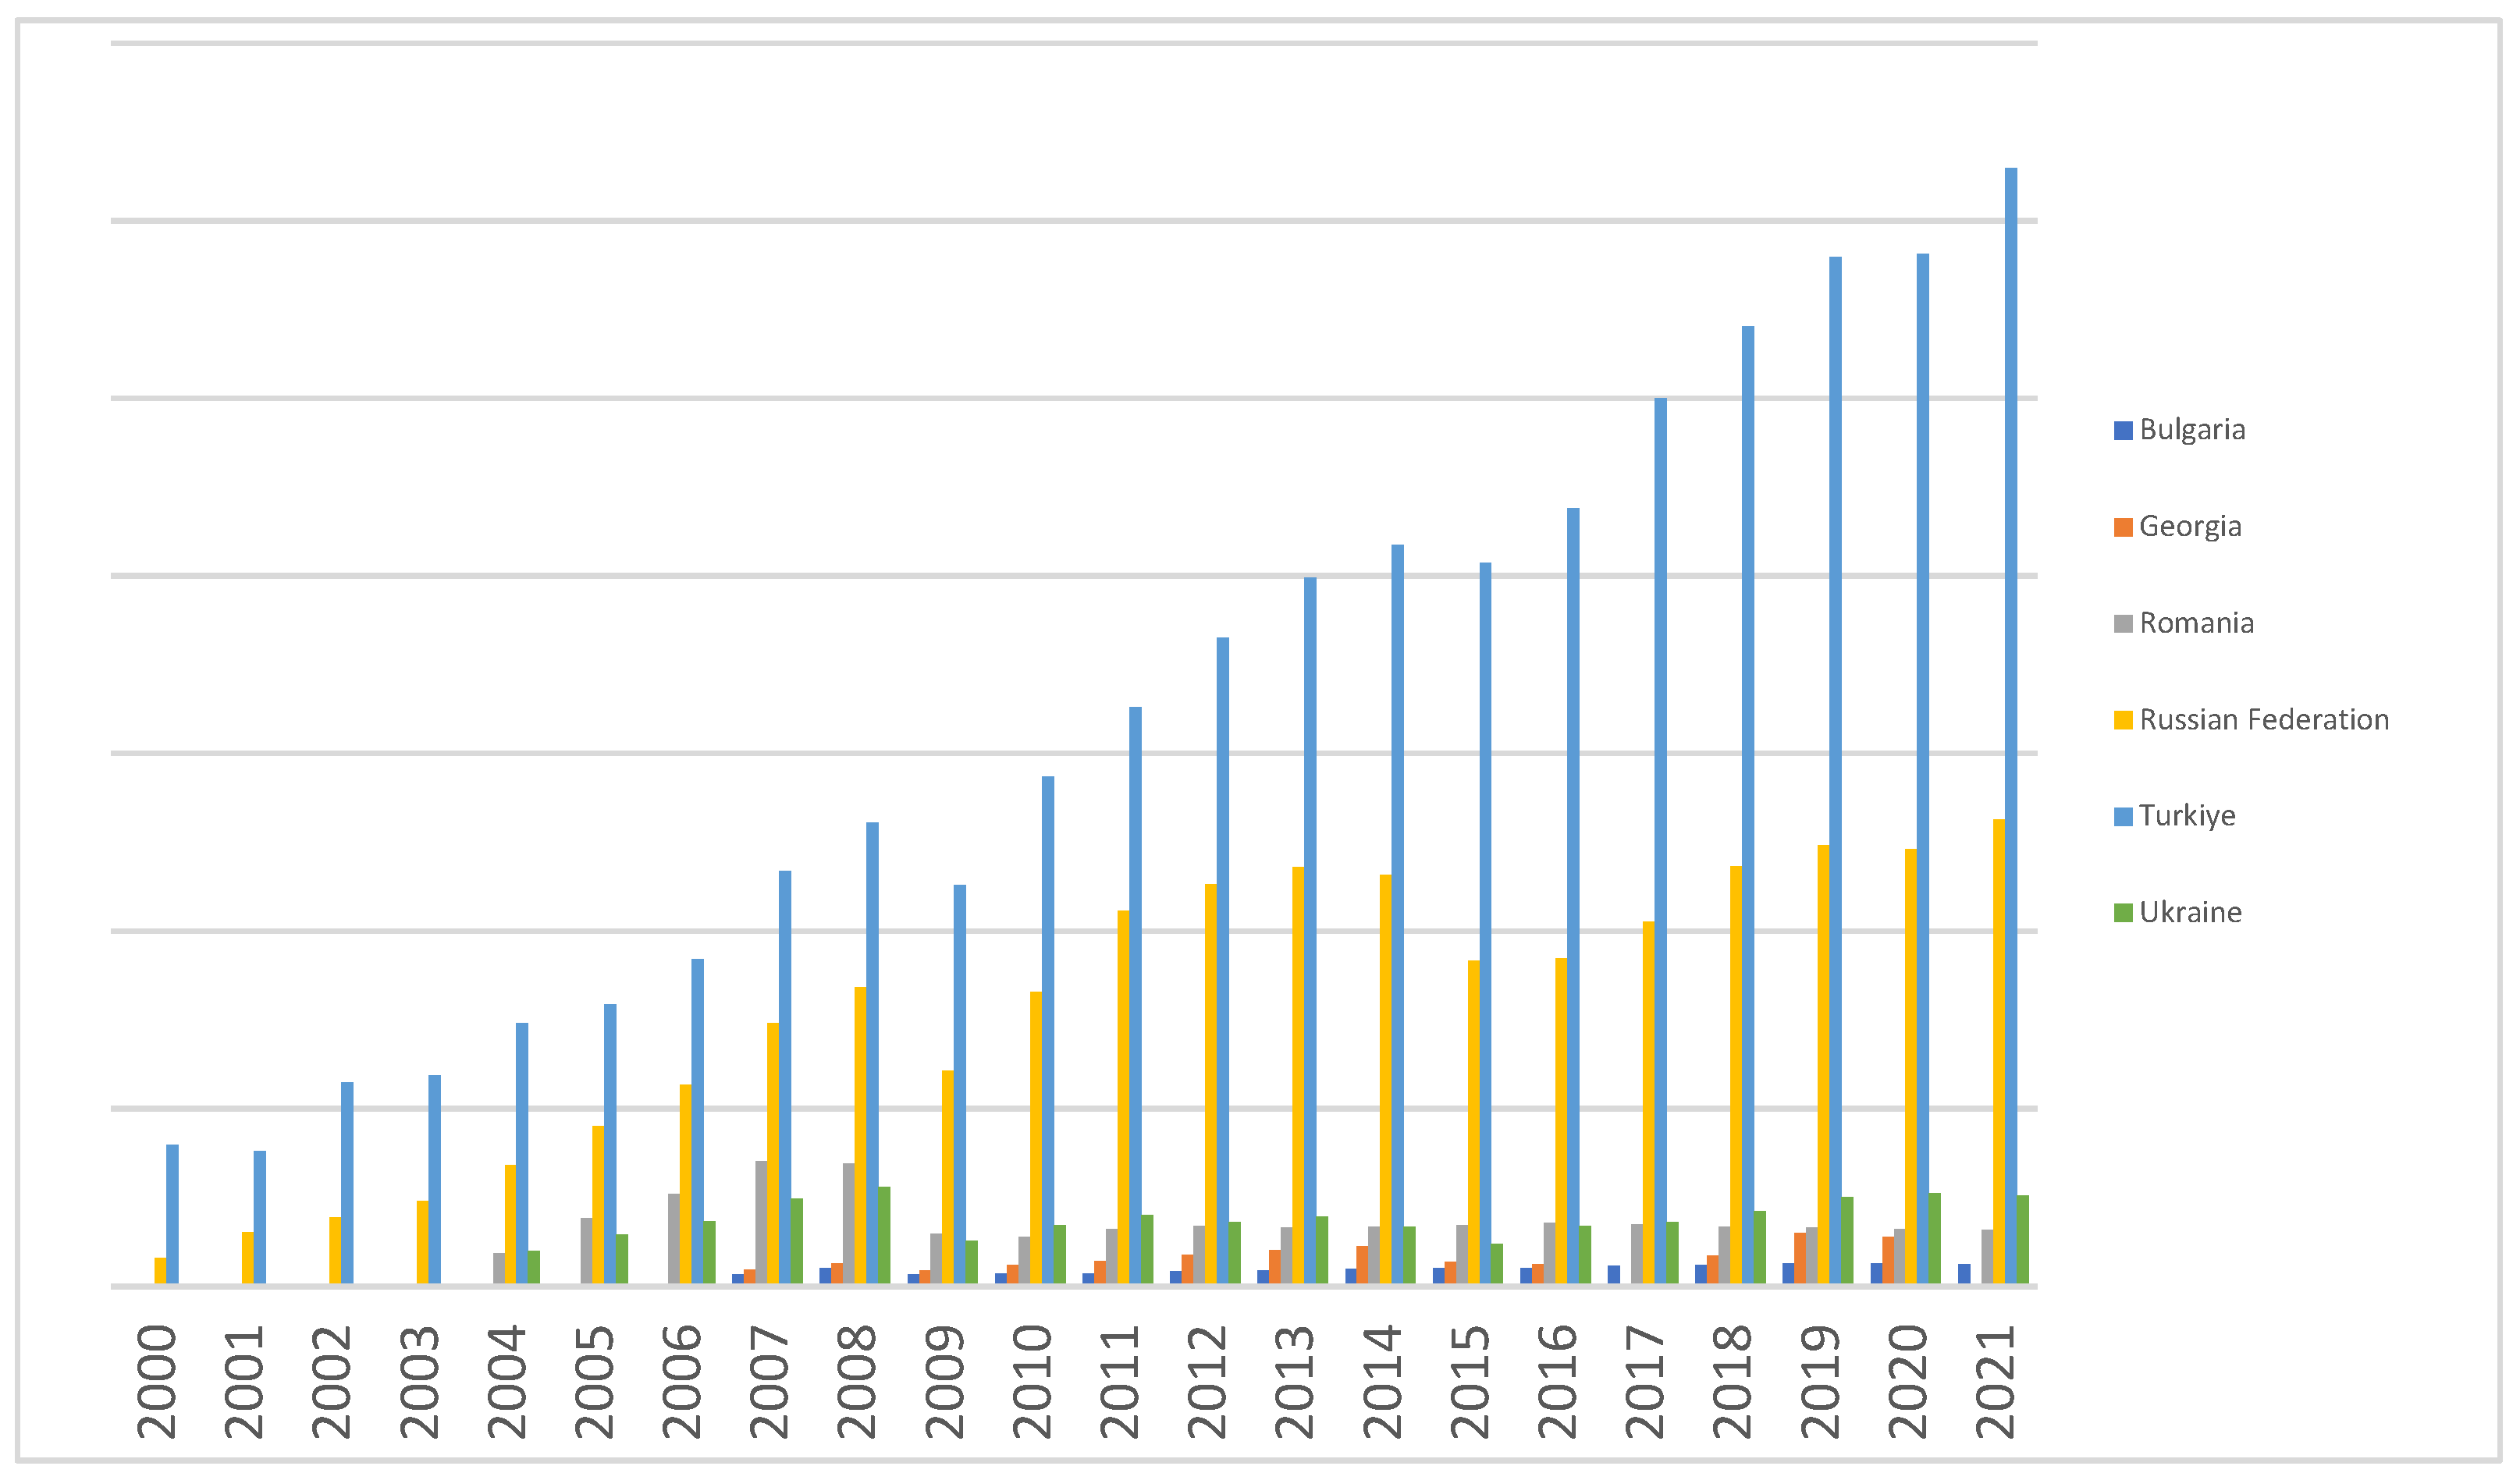
Figure 3 is a diagram presenting the container turnover in the seaports of the Black Sea countries.
As we can see in the above diagrams, container turnover has a stable character. Despite the decline in container turnover in 2009, in 2010, the container turnover reached the level of 2008; also, a decline was noticed in 2015, and in 2016, the container turnover reached the level of 2014.
Thus, the container turnover of all Black Sea countries tends to grow.
In the countries of Western Europe, USA, and Japan, container transportation is very common. The most successful country for the transportation of cargo in containers by rail in Western Europe was Germany. In this country, the transportation of trailers on railroad platforms developed to a greater extent. In the USA, these transportation services were called “Piggyback”, in Germany, they were called “HUCKEPACK”, and in France, they were called “KANGAROO”. Such transportation became the foundation of close integration between sea, rail, and road transport [32].
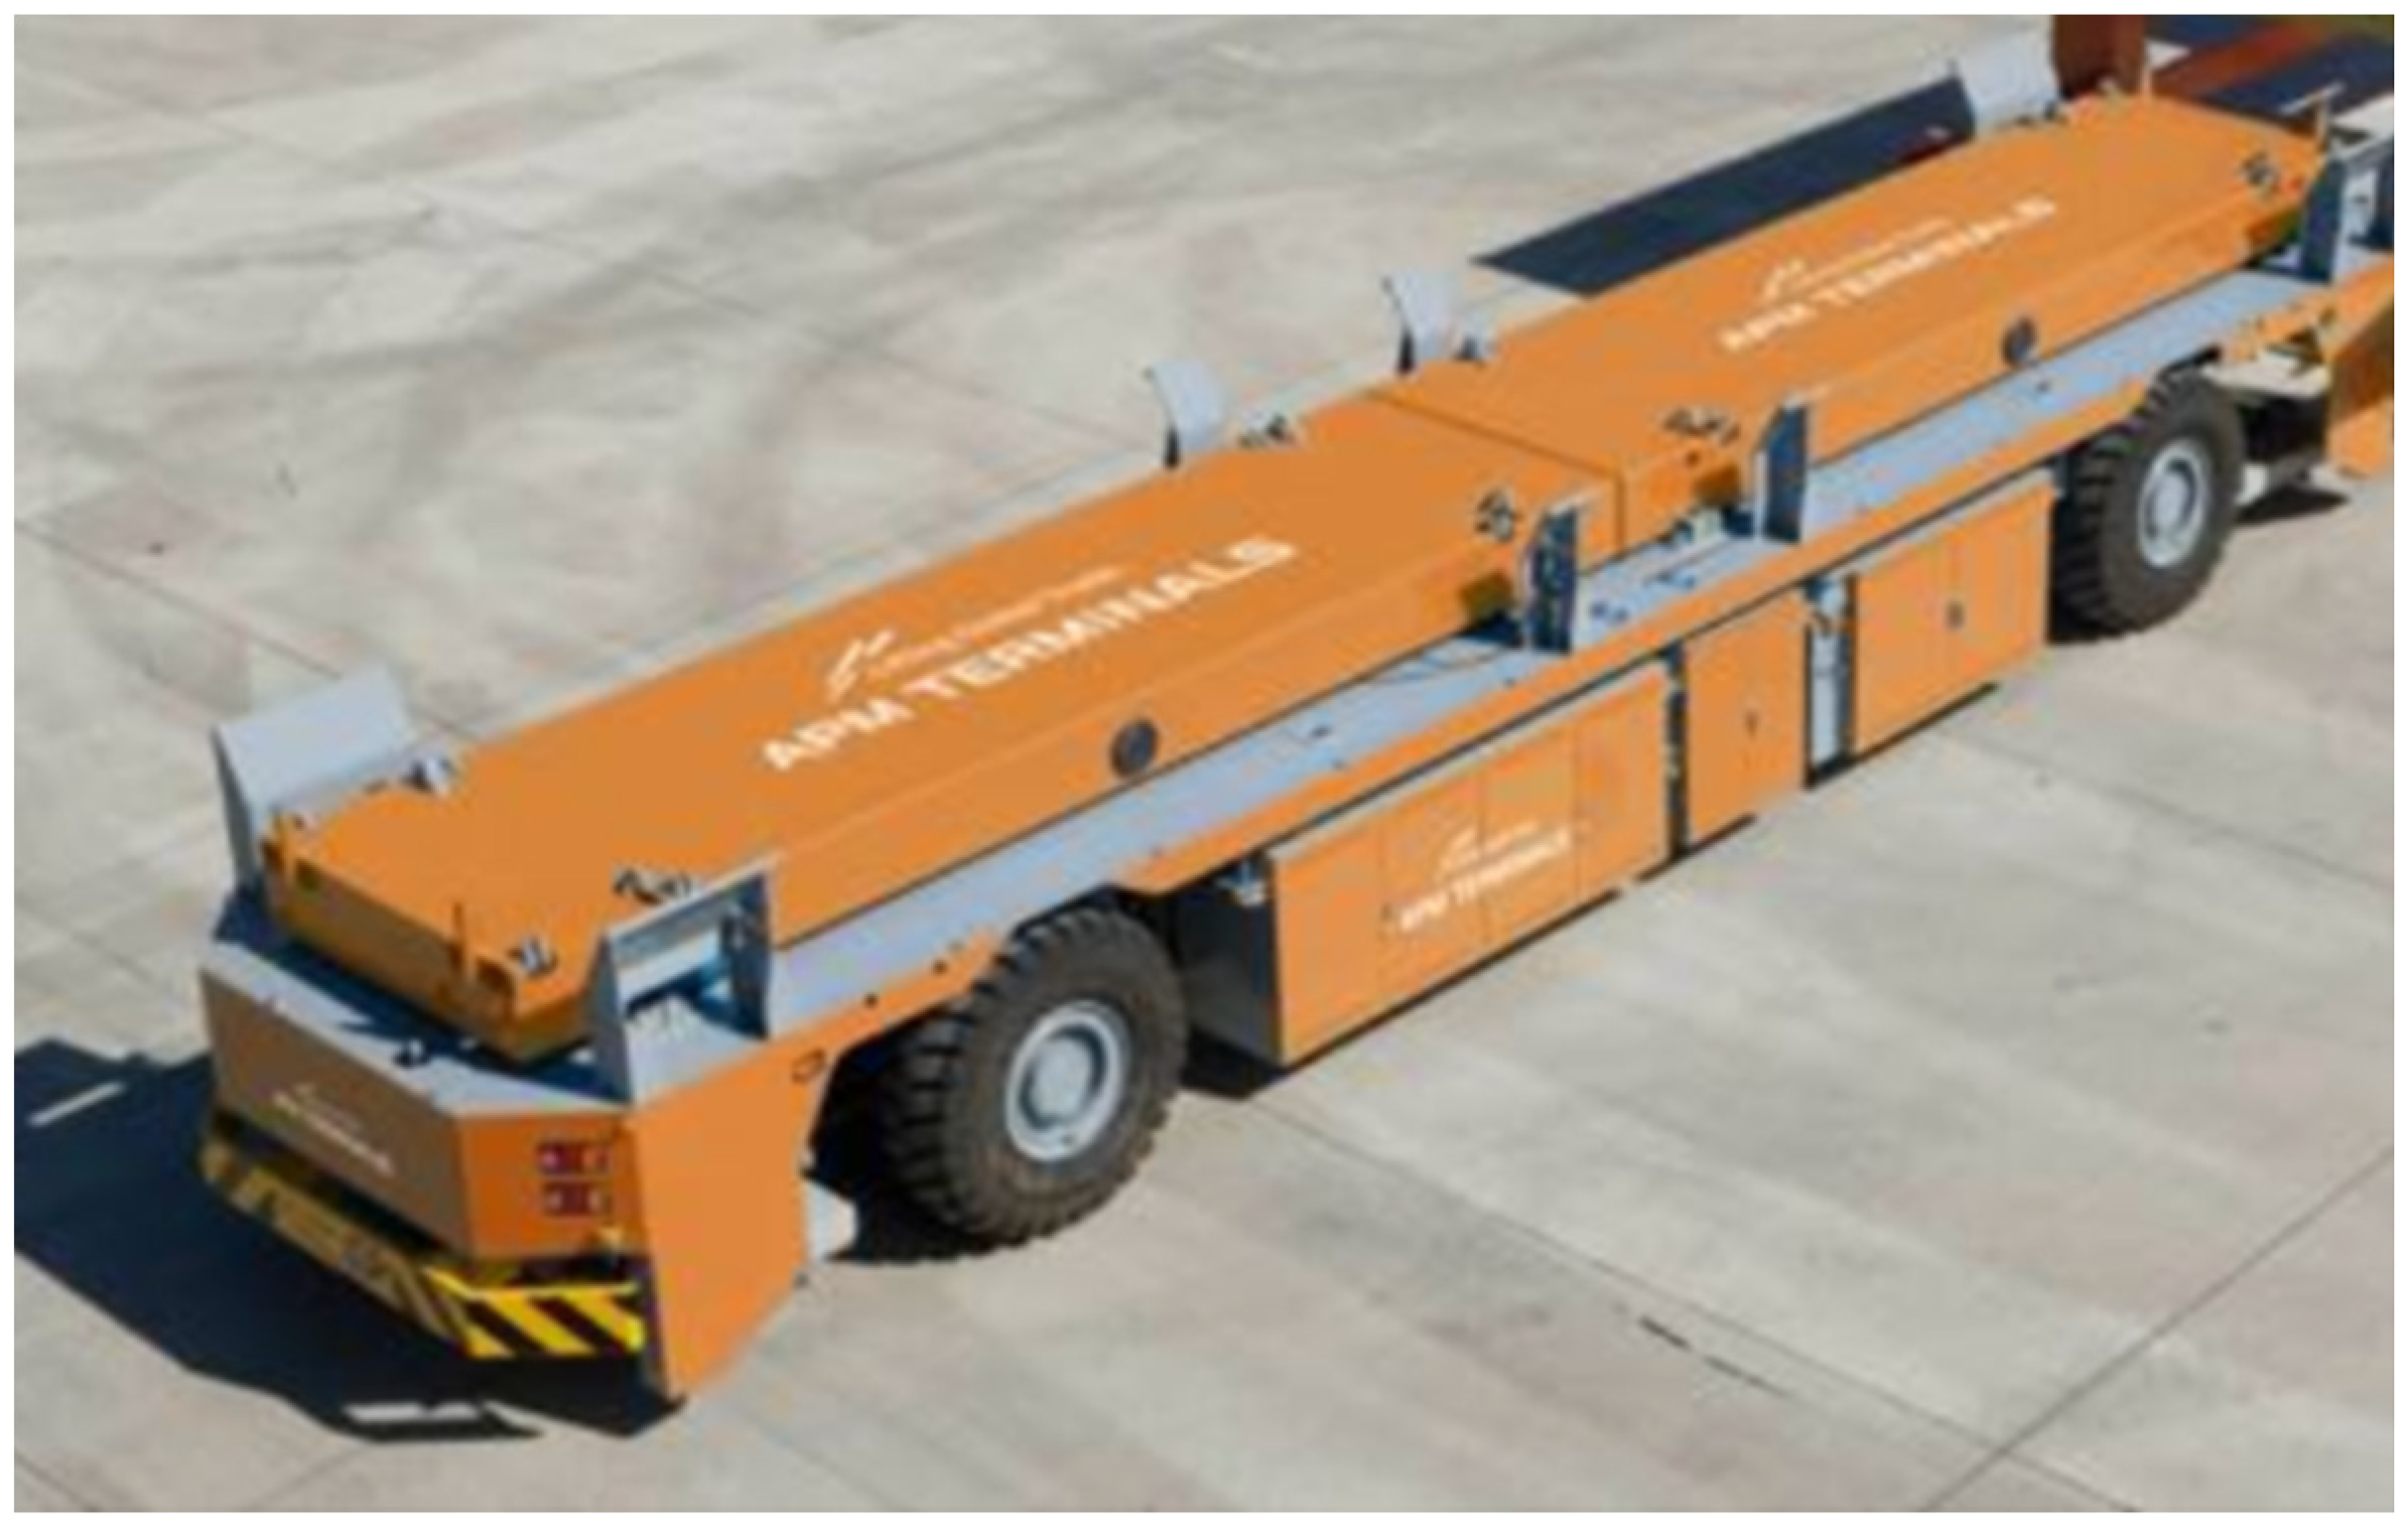
The key to successful operation is the automation of container transportation, which ensures a high level of productivity and safety. So, the Dutch Rotterdam container terminal is developed on the principle of cargo handling “container ship-shore” with the use of cranes for unloading containers and AGV (Automated Guided Vehicle) container trucks, which literally means “automatically guided vehicle” [33]. Gottwald Port Technology, a division of Demag Cranes and a leading company in the automation of container handling, developed the automated guided vehicle (AGV) shown in Figure 4.
The Maasvlakte II container terminal is the first port in the world to be equipped with such vehicles. Thanks to these vehicles, the port’s productivity has increased.
In the first phase, 36 lift AGV container trucks and 128 special racks have been delivered to the container terminal.
So, the total number of AGVs in the container terminal can be insignificant if the frequency of handling each container is reduced.
In the Russian Federation, there is an automated control system of container transportation DISCON, which gives the following information data: the number of containers reloaded at each station or port for any specified period of time, the total number of transit containers on the roads of Russia, the terms of their progress on the roads, the number of containers detained in transportation, the time of their stay in the process of transportation, and the forecast of transit containers to reloading points [33].
No container should go out of the system’s field of vision when it is on the railroads. Such approaches are accepted now in the world and implemented on many leading railroads in Europe and America. Thus, with the creation of a new automated control system, container transportation is on par with the advanced railroads of the world.

3.2. Research Questions and Methods

Prediction of unstable and fuzzy processes is very unreliable and inefficient. Therefore, the identification of process stability is the main stage of analysis. For this purpose, in this paper, we will apply fractal analysis.
The application of the provisions of mass service systems to the tasks of determining the characteristics of various transportation technologies has quite severe limitations and difficulties. Thus, the process of data collection regarding the time of vehicle stay in different states is characterized by high labor intensity and cost, which makes it difficult to obtain the necessary volume of observation results. In addition, the decline in transportation volumes and wear and tear of the fleet of cars and locomotives causes the need for a significant increase in the duration of tests to obtain results with the necessary level of reliability.
It is especially difficult to organize tests when determining vehicle efficiency parameters when 1–2 vehicles are in trial operation. The classical approach based on the theory of large numbers already at confidence probability q = 0.95 establishes the duration of tests to be 36–48 months. The insufficiency of experimental samples creates fundamental difficulties in the statistical processing of such results and the interpretation of calculated indicators. Additionally, classical statistical methods are calculated and can be clearly interpreted only under the assumption that the results of observations follow a known law of distribution, and the insufficiency of primary material makes it difficult or impossible to give an unambiguous answer to the question of what law the data obtained in the experiment follow. Classical computational methods allow the loss of part of the statistically significant information contained in the experiment, and, along with this, introduce new information into the values of the statistics obtained, which is not present in the experiment and perhaps alien to it. Therefore, there is a need to apply methods different from the classical ones. One such method is the bootstrap method, which allows us to construct a confidence interval for the sample mean.
In the conditions of incomplete information and the complexity of obtaining reliable data in the work, we proposed to carry out calculations using “Bootstrap”, a method in the “Statistica” system in a Windows environment, which allowed us to model the types of distribution laws of the system states.
The determination of necessary parameters of statistical distributions of arrival times was carried out in a QBAS environment by a specially developed program.
In various transportation systems, one of the most important tasks is to ensure the necessary quality of transportation service. One of the effective methods of transportation quality management is the distribution of channel capacity using priorities for different flows.
Thus, the considered flow of request is Poisson, but such an assumption should have certain limitations in use, especially when priorities are provided in the system and non-uniformity of cargo arrivals is preserved.
Given the inertia of rail transportation and the multivariate nature of freight delivery in intermodal transportation, this may cause congestion in the transportation network.
When considering a mass service system with priorities, one assumes that the input flow is Poisson, which is not suitable for a fractal flow. Consequently, when developing a model of a prioritized mass service system, it is necessary to take into account the fractality of the input flow of requests.
For mass service systems whose input is a Poisson demand stream (M/G/1), the waiting time for a priority stream p ( T c r p ) can be defined by the following expression:
T c r p = T z a m ¯ 1 σ p 1 ( 1 σ p )
where:
T z a m ¯ —the average delay of a claim due to the presence of another claim in service;
σ p = i = p p p i —load factor of the i-th priority class of requirements.
The value of this delay is determined by the following formula:
T z a m ¯ = i = p p T z a m i ¯ = i = p p p i σ b i 2 2 T o l c i ¯ = i = p p λ i σ b i 2 2
where:
T z a m i ¯ —average demand delay associated with the presence of messages of the i-th priority;
T o l c i ¯ —average service time;
λ i —intensity of incoming claims of the i-th priority class λ i = T o l c i p i ;
p i —load factor of the i-th priority class of requirements;
σ b i 2 —the second moment of service time (variance) of the i-th priority class of requirements.
The analysis of this expression shows that the average delay of requirements due to the presence of another requirement on service depends on the intensity of arrivals ( λ i ) and from the variance of service time ( σ b i 2 ). Expression (2) is derived assuming that the input demand flow is Poisson and the service flow is arbitrary. To remove the constraints, consider a mass service system (G/G/1).
The waiting time for service T o τ i can be represented in the following form:
T o τ i = T z a m 1 p
On the other hand, the upper limit of waiting time T o τ i for the system (G/G/1) can be represented as the following expression:
T o τ i σ a i 2 + σ b i 2 2 T p o s t i ¯ 1 p i = T i m a x 1
where:
σ a i 2 ,   σ b i 2 —dispersion of the input stream and the service stream, respectively;
T p o s t i ¯ —average value of the time interval between incoming requests of the i-th priority;
p i —load factor for the system (G/G/1), p i = T o b s ¯ T p o s t i ¯ .
The upper bound estimate (4) turns out to be more accurate the larger the value of the utilization factor is p i . In Relation (3), we can also see that the average waiting time is determined by fluctuations in the processes of incoming demands and services.
It is possible to use a stricter formula for the upper limit:
T o τ i 1 + C b i 2 1 p i 2 + C b i 2 σ a i 2 + σ b i 2 2 T p o s t i ¯ 1 p i = T i m a x 2
where:
C b —the coefficient of variation of service time, C b = σ b i T o l c i ¯ .
The obtained upper bound is essentially independent of the distribution law of incoming and outgoing flows. It is determined only by the first two moments of the distributions of intervals between demands and service time.
The following expression can be used to find the lower delay limit:
T o τ i p i 2 C b i 2 + p i p i 2 2 λ i 1 p i = T i m i n
Then, by substituting the waiting time value (Expressions (4) through (6)) into Expression (2), the following average delay expressions can be obtained.
T z a m i m a x 1 = σ a i 2 + σ b i 2 2 T p o s t i ¯ ,
T z a m i m a x 1 = 1 + C b i 2 1 p i 2 + C b i 2 σ a i 2 + σ b i 2 2 T p o s t i ¯ ,
T z a m i m i n = p i 2 C b i 2 + p i p i 2 2 λ i .
To analyze the delay time in a (G/G/1) prioritized system, it is necessary to investigate the different distribution laws that are used to describe fractal traffic.
Pareto, Weibull, lognormal, and hyperexponential distributions are used to model fractal traffic. Table 1 summarizes the main characteristics of the above-proposed distributions.
Quite often, a Pareto distribution is used to model fractal traffic. The advantage of this distribution is the ability to determine the fractality of traffic by the parameters of the distribution. The disadvantage of this distribution is that it has infinite variance, which means high variability of incoming traffic.
Consequently, it is impossible to use this distribution in this case. The Weibull distribution is most often used in modeling fractal traffic. The probability distribution law for the Weibull distribution is as follows:
F ( x ) = 1 e x b a ,
where:
a b —the scale parameter and shape parameter, respectively.
For the mathematical expectation and mean square deviation of a quantity, the formulas are valid, and are tabulated as follows:
t c p = a K b , ( σ ) t = a C b ,   K b = G 1 + 1 b ,   C b 2 = 1 + 2 b K b 2 .
Hence, for the coefficient of variation, we have:
ν ( t ) = ( σ ) t t c p = C b K b
Thus, it is shown that traffic models with long-term dependence lead to an asymptotic probability distribution of tails of the Weibull type, i.e.:
P ( x > B ) ~ e ( γ B ) 2 2 H   at   B
where:
γ —the constant;
P ( x > B ) —the probability that parameter x (e.g., queue length) is greater than parameter B;
H—the Hurst parameter (self-similarity parameter).
The parameter H represents a sustainability measure of a structural phenomenon or a measure of the duration of long-term dependence. The value of H = 0.5 indicates the absence of long-term dependence. The closer the value of H is to 1, the higher the degree of sustainability of long-term dependence.
The Hurst parameter for most applications is in the interval 0.5 < H < 1. In Expressions (10) and (13), we can determine that the parameter α of the Weibull distribution can be represented by the Hurst parameter as follows: a = 2 2 H .

4. Results and Discussion

So, in the study of a mass service system (G/G/1) with priorities and fractal input traffic, the parameter α of the Weibull distribution will be in the interval 0 < a < 1. Other distribution laws coincide with the Weibull distribution in a certain range.
Accordingly, for mass service systems whose input is a Poisson flow of demands (M/G/1), the waiting time for a flow with a priority of T o τ p is calculated by the following formula:
T o τ p = T z a m ¯ ( 1 σ p 1 ) ( 1 σ p ) = i = 1 p 1 p i σ b i 2 2 T o l c i ¯ ( 1 p i ) ( 1 p i )
The definition of the ratio T o τ T o l c at different p i is given as follows:
T o τ 1 T o l c 1 = p i 0.8 4 + 0.25 3.15 + 1.15 3.85 + 0.61 3.25 2 ( 1 p i ) 1 0.13 + 0.16 + 0.21 + 0.1 + 0.129 3.6 = 0.392 p i 1 p i
At P 2 = 2 :
T o τ 2 T o l c 2 = p i 1.44 3.6 + 0.25 3.15 + 1.15 3.85 + 0.61 3.25 2 ( 1 p i ) 1 0.13 + 0.16 + 0.21 + 0.1 + 0.129 4 = 0.446 p i 1 p i
At P 3 = 3 :
T o τ 3 T o l c 3 = p i 1.44 3.6 + 0.8 4 + 1.15 3.85 + 0.61 3.25 2 1 p i 1 0.13 + 0.16 + 0.21 + 0.1 + 0.129 3.15 = 0.637 p i 1 p i
At P 4 = 4 :
T o τ 4 T o l c 4 = p i 1.44 3.6 + 0.8 4 + 0.25 3.15 + 0.61 3.25 2 ( 1 p i ) 1 0.13 + 0.16 + 0.21 + 0.1 + 0.129 3.85 = 0.415 p i 1 p i
At P 5 = 5 :
T o τ 5 T o l c 5 = p i 1.44 3.6 + 0.8 4 + 0.25 3.15 + 1.15 3.85 2 ( 1 p i ) 1 0.13 + 0.16 + 0.21 + 0.1 + 0.129 3.25 = 0.469 p i 1 p i
To remove the constraints, consider a mass service system (G/G/1), i.e., with input flow fractality.
The waiting time T o τ i can be represented as follows:
T o τ i = σ a i 2 + σ b i 2 2 T p o s t i ¯ 1 p i
After, the algebraic transformations are performed:
At P 1 = 1 :
T o τ 1 T o l c 1 = 156.25 + 1.44 2 27.5 1 p i 3.6 = 0.796 1 p i
At P 2 = 2 :
T o τ 2 T o l c 2 = 67.25 + 0.8 2 24.5 1 p i 4 = 0.347 1 p i
At P 3 = 3 :
T o τ 3 T o l c 3 = 12.29 + 0.25 2 15.1 1 p i 3.15 = 0.133 1 p i
At P 4 = 4 :
T o τ 4 T o l c 4 = 90.25 + 1.15 2 38.5 1 p i 3.85 = 0.308 1 p i
At P 5 = 5 :
T o τ 5 T o l c 5 = 137.25 + 0.61 2 25.5 1 p i 3.25 = 0.832 1 p i
A Weibull distribution was used to model the fractal flow. The coefficients for the Weibull distribution are found at a = 1 ,   K b = 1.00 ,   C b = 1.00 ; at a = 0.5 ,   K b = 2.00 ,   C b = 4.47 .
According to these parameters of the Weibull distribution, the following were determined, σ a i and σ b i , which were used to determine T o τ i T o l c i . In Expressions (1) and (2), we can determine that the parameter α of the Weibull distribution can be expressed through the Hurst parameter as follows: a = 2 2 H .
Therefore, for H = 0.5, а = 1, and at different p i = 1 , significance T o τ i T o l c i is thus defined as follows:
At P 1 = 1 :
T o τ 1 T o l c 1 = 26.2 1 2 + 1.44 2 27.5 1 p i 3.6 1 = 3.474 1 p i
At P 2 = 1 :
T o τ 2 T o l c 2 = 26.2 1 2 + 0.8 2 24.5 1 p i 4 1 = 3.506 1 p i
At P 3 = 1 :
T o τ 3 T o l c 3 = 26.2 1 2 + 0.25 2 15.1 1 p i 3.15 1 = 7.218 1 p i
At P 4 = 1 :
T o τ 4 T o l c 4 = 26.2 1 2 + 0.61 2 25.5 1 p i 3.25 1 = 4.145 1 p i
At H = 0.75 ,   a = 0.5 .
At P 1 = 1 :
T o τ 1 T o l c 1 = 26.2 4.47 2 + 1.44 2 27.5 1 p i 3.6 2 = 34.639 1 p i
At P 2 = 1 :
T o τ 2 T o l c 2 = 26.2 4.47 2 + 0.8 2 24.5 1 p i 4 2 = 34.990 1 p i
At P 3 = 1 :
T o τ 3 T o l c 3 = 26.2 4.47 2 + 0.25 2 15.1 1 p i 3.15 2 = 72.090 1 p i
At P 4 = 1 :
T o τ 4 T o l c 4 = 26.2 4.47 2 + 1.15 2 38.5 1 p i 3.85 2 = 23.140 1 p i
At P 5 = 1 :
T o τ 5 T o l c 5 = 26.2 4.47 2 + 0.61 2 25.5 1 p i 3.25 2 = 41.380 1 p i
Thus, as the fractality of the input stream of requests increases, the waiting time of the system with priorities increases significantly compared to the M/G/1 system with priorities. From the obtained results, we can draw the following conclusion: at small values of the Hurst parameter (0.5 < H < 0.65) as a first approximation of the G/G/1 system with priorities, we can use the model of the M/G/1 system. Moreover, the accuracy of the results will fall slightly with increasing p_i. At small values of loading H < 0.5, the obtained results will practically coincide. As the traffic fractality increases, the results obtained using the G/G/1 model will be significantly different from the results obtained using the M/G/1 system model. Consequently, the M/G/1 system model cannot be used to estimate the parameters of the G/G/1 system with priorities in the case of high fractality of incoming traffic. In this case, it is more appropriate to use the proposed system model with priorities.
Based on the results of graphical dependencies f p i = T o τ T o l c , it is established that in the range of the Hurst parameter 0.5 < H < 0.65, it is approximately possible to calculate the system parameters for the M/G/1 system with a Poisson flow of requirements; whereas, with the growth of fractality of the input flow, it becomes necessary to consider the service system with priorities in the form of G/G/1.
The resulting prediction error obtained using fractal analysis amounted to more than 7% and did not satisfy the problem conditions. Therefore, after a detailed analysis of forecasting methods, it was decided that the forecasting of traffic volumes on the transport network should be performed using neuro-fuzzy modeling.
The use of an adaptive combined system of neuro-fuzzy control makes it possible to ensure the sustainability of the controlled indicator of cargo transportation, regardless of the values of the parameters of the statistical distribution law and changes in time of the systematic component of error.

5. Conclusions

Due to the conditions of incomplete information and the complexity of obtaining reliable data in the work, we carried out calculations using the “Bootstrap” method in the “Statistica” system in a Windows environment, which allowed us to model the types of distribution laws of the system states. The determination of the necessary parameters of statistical distributions of arrival times was carried out in a QBAS environment using a specially developed program. Due to the fact that the forecasting of unstable and fuzzy processes is very unreliable and inefficient, fractal analysis was applied in the work. Fractal analysis is a method of studying complex systems based on the study and analysis of their fractal structure. This method allows us to describe the characteristics of the system such as self-similarity, scalability, and fractal dimensionality. The application of fractal analysis in this work was appropriate for the prediction of unstable and fuzzy processes. Fractal models can help to estimate and predict the behavior of a system based on its fractal structure.
QBAS (Query By Example Statistical Analysis System) is software that allows statistical analysis of data. It has been used to determine the parameters of statistical distributions of arrival times. The bootstrap method is a method that is used to evaluate the accuracy of statistical estimates by conducting multiple resamples from the available data. This method allows for incomplete information and calculations to be made with uncertainty. In general, all these tools and methods have been used in this paper to analyze and model system states, predict processes, and obtain more reliable results under conditions of incomplete information.
For the planning of intermodal container transportation, it is necessary to formalize the technological process of the advancement of containers in intermodal transportation, taking into account the maximum satisfaction of the basic requirements of consignors in the form of an optimum two-criteria mathematical model of planning intermodal container transportation by simultaneously taking into account not only the cost of transportation but also the factor of time.
Thus, to build an optimal plan of intermodal transportation, it is necessary to develop a method for selecting a single solution on the Pareto set, which will allow us to take into account the priorities of the shipper using the method of weighted stress functions.

Author Contributions

Conceptualization, A.C. and D.M.; methodology, M.B. and A.B.; formal analysis, A.C., D.M., M.B., A.B. and A.L.; investigation, M.B.; resources, A.C., D.M. and A.L.; data curation, A.C., D.M., M.B., A.B. and A.L.; writing—original draft preparation, A.C., D.M., M.B., A.B. and A.L.; writing—review and editing, A.C., D.M., M.B., A.B. and A.L.; project administration, A.C. and A.L.; funding acquisition, M.B., A.B. and A.L. All authors have read and agreed to the published version of the manuscript.

Funding

Section 1 and Section 2 are at the expense of the Ministry of Science and Higher Education of the Russian Federation as part of the World-class Research Center program: Advanced Digital Technologies (contract No. 075-15-2022-311; dated 20 April 2022); Section 3, Section 4 and Section 5 are at the expense of grant of the Russian Science Foundation No. 23-41-10001 “Mathematical models and computer technologies of scheduling production and power generation in conditions economic uncertainty”, https://rscf.ru/project/23-41-10001, accessed on 11 December 2023.

Institutional Review Board Statement

Not applicable.

Informed Consent Statement

Not applicable.

Data Availability Statement

The data presented in this study are available upon request from the corresponding author.

Acknowledgments

Section 1 and Section 2 are at the expense of the Ministry of Science and Higher Education of the Russian Federation as part of the World-class Research Center program: Advanced Digital Technologies (contract No. 075-15-2022-311; dated 20 April 2022); Section 3, Section 4 and Section 5 are at the expense of grant of the Russian Science Foundation No. 23-41-10001 “Mathematical models and computer technologies of scheduling production and power generation in conditions economic uncertainty”, https://rscf.ru/project/23-41-10001, accessed on 11 December 2023.

Conflicts of Interest

The authors declare no conflicts of interest. The funders had no role in the design of the study; in the collection, analyses, or interpretation of data; in the writing of the manuscript; or in the decision to publish the results.

References

  1. Wang, J.; Shao, Y.; He, J.; An, Y. A multi-variable hybrid system for port container throughput deterministic and uncertain forecasting. Expert Syst. Appl. 2024, 237, 121546. [Google Scholar] [CrossRef]
  2. Weikl, M.C.; Peschel, A. Industrial view on hydrogen carriers for intercontinental transport. Curr. Opin. Green Sustain. Chem. 2023, 44, 100843. [Google Scholar] [CrossRef]
  3. Venkadavarahan, M.; Marisamynathan, S. Development of freight trip generation model using observed and unobserved information of supply chain characteristics for a sustainable urban transformation. J. Clean. Prod. 2023, 421, 138500. [Google Scholar] [CrossRef]
  4. Baştuğ, S.; Haralambides, H.; Akan, E.; Kiraci, K. Risk mitigation in service industries: A research agenda on container shipping. Transp. Policy 2023, 141, 232–244. [Google Scholar] [CrossRef]
  5. de Almeida Rodrigues, T.; de Miranda Mota, C.M.; Ojiako, U.; Chipulu, M.; Marshall, A.; Dweiri, F. A flexible cost model for seaport-hinterland decisions in container shipping. Res. Transp. Bus. Manag. 2023, 49, 101016. [Google Scholar] [CrossRef]
  6. Luhayb, A. The bootstrap method for Monte Carlo integration inference. J. King Saud Univ.-Sci. 2023, 35, 102768. [Google Scholar] [CrossRef]
  7. Soltani, H.; Al-E-Hashem, S.M.J.M. Robust maritime disruption management with a combination of speedup, skip, and port swap strategies. Transp. Res. Part C Emerg. Technol. 2023, 153, 104146. [Google Scholar] [CrossRef]
  8. Dominioni, G. Towards an equitable transition in the decarbonization of international maritime transport: Exemptions or carbon revenues? Mar. Policy 2023, 154, 105669. [Google Scholar] [CrossRef]
  9. Sciomachen, A.; Stecca, G. Forwarding containers to dry ports in congested logistic networks. Transp. Res. Interdiscip. Perspect. 2023, 20, 100846. [Google Scholar] [CrossRef]
  10. Yang, D.; Liao, S.; Lun, V.; Bai, X. Towards sustainable port management: Data-driven global container ports turnover rate assessment. Transp. Res. Part E Logist. Transp. Rev. 2023, 175, 103169. [Google Scholar] [CrossRef]
  11. Shen, X.; Chen, J.; Zhu, S.; Yan, R. A decentralized federated learning-based spatial–temporal model for freight traffic speed forecasting. Expert Syst. Appl. 2024, 238, 122302. [Google Scholar] [CrossRef]
  12. Khajeh, E.; Ramouz, A.; Aminizadeh, E.; Sabetkish, N.; Golriz, M.; Mehrabi, A.; Fonouni, H. Comparison of the modified piggyback with standard piggyback and conventional orthotopic liver transplantation techniques: A network meta-analysis. HPB 2023, 25, 732–746. [Google Scholar] [CrossRef]
  13. Díaz-Ramírez, J.; Sebastián Zazueta-Nassif Galarza-Tamez, R.; Prato-Sánchez, D.; Huertas, J.I. Characterization of urban distribution networks with light electric freight vehicles. Transp. Res. Part D Transp. Environ. 2023, 119, 103719. [Google Scholar] [CrossRef]
  14. Xu, B.; Liu, W.-T.; Li, J.; Yang, Y.; Wen, F.; Song, H. Resilience measurement and dynamic optimization of container logistics supply chain under adverse events. Comput. Ind. Eng. 2023, 180, 109202. [Google Scholar] [CrossRef]
  15. Bock, C.H.; Cottrell, T.E.; Hotchkiss, M.W. Spray coverage profiles from pecan air-blast sprayers, with a radial air-flow and a volute-generated focused air-flow, as affected by forward speed and application volume. Crop Prot. 2023, 168, 106234. [Google Scholar] [CrossRef]
  16. Saeed, N.; Nguyen, S.; Cullinane, K.; Gekara, V.; Chhetri, P. Forecasting container freight rates using the Prophet forecasting method. Transp. Policy 2023, 133, 86–107. [Google Scholar] [CrossRef]
  17. Feng, X.; Song, R.; Yin, W.; Yin, X.; Zhang, R. Multimodal transportation network with cargo containerization technology: Advantages and challenges. Transp. Policy 2023, 132, 128–143. [Google Scholar] [CrossRef]
  18. Lu, C.; Ye, Y.; Fang, Y.; Fang, J. An optimal control theory approach for freight structure path evolution post-COVID-19 pandemic. Socio-Econ. Plan. Sci. 2022, 85, 101430. [Google Scholar] [CrossRef] [PubMed]
  19. Bozhdaraj, D.; Lucke, D.; Jooste, J.L. Smart Maintenance Architecture for Automated Guided Vehicles. Procedia CIRP 2023, 118, 110–115. [Google Scholar] [CrossRef]
  20. Gandhi, N.; Kant, R. Evaluation of sustainability performance of the rail freight transportation: An index-based analysis. Mater. Today Proc. 2023. [Google Scholar] [CrossRef]
  21. Guo, X.; Ji, M.; Zhang, W. Research on a new two-level scheduling approach for unmanned surface vehicles transportation containers in automated terminals. Comput. Ind. Eng. 2023, 175, 108901. [Google Scholar] [CrossRef]
  22. Li, L.; Wang, J.; Wang, H.; Jin, X.; Du, L. Intermodal transportation hub location optimization with governments subsidies under the Belt and Road Initiative. Ocean Coast. Manag. 2023, 231, 106414. [Google Scholar] [CrossRef]
  23. Steinbach, S. Port congestion, container shortages, and U.S. foreign trade. Econ. Lett. 2022, 213, 110392. [Google Scholar] [CrossRef]
  24. Baygin, M.; Yaman, O.; Baygin, N.; Karakose, M. A blockchain-based approach to smart cargo transportation using UHF RFID. Expert Syst. Appl. 2022, 188, 116030. [Google Scholar] [CrossRef]
  25. Ulitskaya, N.; Ivanova, N.; Telushkina, E.; Dreitsen, M.; Sokolova, N. Transport Support for the Development of the Far Eastern Region of Russia. Transp. Res. Procedia 2023, 68, 40–49. [Google Scholar] [CrossRef]
  26. Vukić, L.; del Mar Cerbán, M. Economic and environmental competitiveness of container shipping on alternative maritime routes in the Asia-Europe trade flow. Marit. Transp. Res. 2022, 3, 100070. [Google Scholar] [CrossRef]
  27. Mingaleva, Z.; Postnikov, V.; Kamenskikh, M. Research of cargo seaports development in the Russian federation in the context of port basins. Transp. Res. Procedia 2022, 63, 303–315. [Google Scholar] [CrossRef]
  28. Schramm, H.-J.; Munim, Z.H. Container freight rate forecasting with improved accuracy by integrating soft facts from practitioners. Res. Transp. Bus. Manag. 2021, 41, 100662. [Google Scholar] [CrossRef]
  29. Liu, C.-Y.; Fan, H.-M.; Dang, X.; Zhang, X. The Arctic policy and port development along the Northern Sea Route: Evidence from Russia’s Arctic strategy. Ocean Coast. Manag. 2021, 201, 105422. [Google Scholar] [CrossRef]
  30. Konoplev, V.; Melnikov, Z.; Sarbaev, V.; Khlopkov, S. Improvement of the layout and design of cargo vehicles of serial production aimed at implementing the Transport Strategy of the Russian Federation up to 2030. Transp. Res. Procedia 2021, 57, 317–324. [Google Scholar] [CrossRef]
  31. Kuzmicz, K.A.; Pesch, E. Approaches to empty container repositioning problems in the context of Eurasian intermodal transportation. Omega 2019, 85, 194–213. [Google Scholar] [CrossRef]
  32. García, J.; Florez, J.E.; Torralba, Á.; Borrajo, D.; López, C.L.; García-Olaya, Á.; Sáenz, J. Combining linear programming and automated planning to solve intermodal transportation problems. Eur. J. Oper. Res. 2013, 227, 216–226. [Google Scholar] [CrossRef]
  33. Kraiem, Z.M.; Dagli, D.P.; Diekmann, J.E. DISCON: An expert system for the analysis of differing site conditions claims. Knowl.-Based Syst. 1989, 2, 158–164. [Google Scholar] [CrossRef]
Figure 1. Container turnover between ports of the Far East and other regions, billion tons.
Sustainability 16 01265 g001
Figure 2. Container turnover of the world’s largest ports, billion tons.
Sustainability 16 01265 g002
Figure 3. Container traffic in the seaports of the Black Sea countries, mln tons.
Sustainability 16 01265 g003
Figure 4. Unmanned, automatically guided vehicle.
Sustainability 16 01265 g004
Table 1. Basic characteristics of the distributions.
Name of DistributionsDistribution FunctionMathematical ExpectationDispersion
Pareto F x = 1 x m x k μ = a × b a 1 , at a < 1 mathematical expectation does not exist σ 2 = a × b 2 ( a 1 ) ( a 2 )
a < 2 variance does not exist
Weibull F x = 1 e x b a μ = b a G 1 a σ 2 = b 2 a 2 G 2 a 1 a G 1 a 2
Lognormal F x = 1 2 + 1 2 E r f ln x μ σ 2 μ = e μ + σ 2 2 σ 2 = e σ 2 + 2 μ ( e σ 2 1 )
Gamma distribution F ( x ) = ( γ ( k , x ) / θ G ( k ) ) μ = a b σ 2 = a b 2
Sources: authors’ calculations.
Disclaimer/Publisher’s Note: The statements, opinions and data contained in all publications are solely those of the individual author(s) and contributor(s) and not of MDPI and/or the editor(s). MDPI and/or the editor(s) disclaim responsibility for any injury to people or property resulting from any ideas, methods, instructions or products referred to in the content.

