
Predicting Station-Level Peak Hour Ridership of Metro Considering the Peak Deviation Coefficient

Abstract
1. Introduction
- The subway station-level PHR estimation approach is fine-tuned with PDC values using a spatial regression-based methodology framework. The case study results reveal that the proposed framework boosts the stability and accuracy of the station-level PHR forecasting results.
- The underlying causes of the peak deviation phenomenon and the temporal distribution patterns of asymmetric ridership are interpreted from a reliable and comprehensive perspective, with both direct and indirect effects of individual variables across different peak periods. This offers crucial insights for planners aiming to balance travel demand between peak and off-peak hours by more efficiently allocating land-use resources and thereby enhancing subway line performance.
2. Methodology
2.1. Theoretical Background
2.1.1. Basic Concepts
- (1)
- SPR
- (2)
- PHF
- (3)
- PDC
2.1.2. Main Variables
2.2. Proposed Method
2.2.1. Data Preprocessing
- (1)
- Land use
- (2)
- Station characteristics
- (3)
- Accessibility
2.2.2. Spatial Regression Model Establishment
2.2.3. Station SPR Estimation
- (1)
- PHF and PDC estimation
- (2)
- SPR estimation
3. Case Study
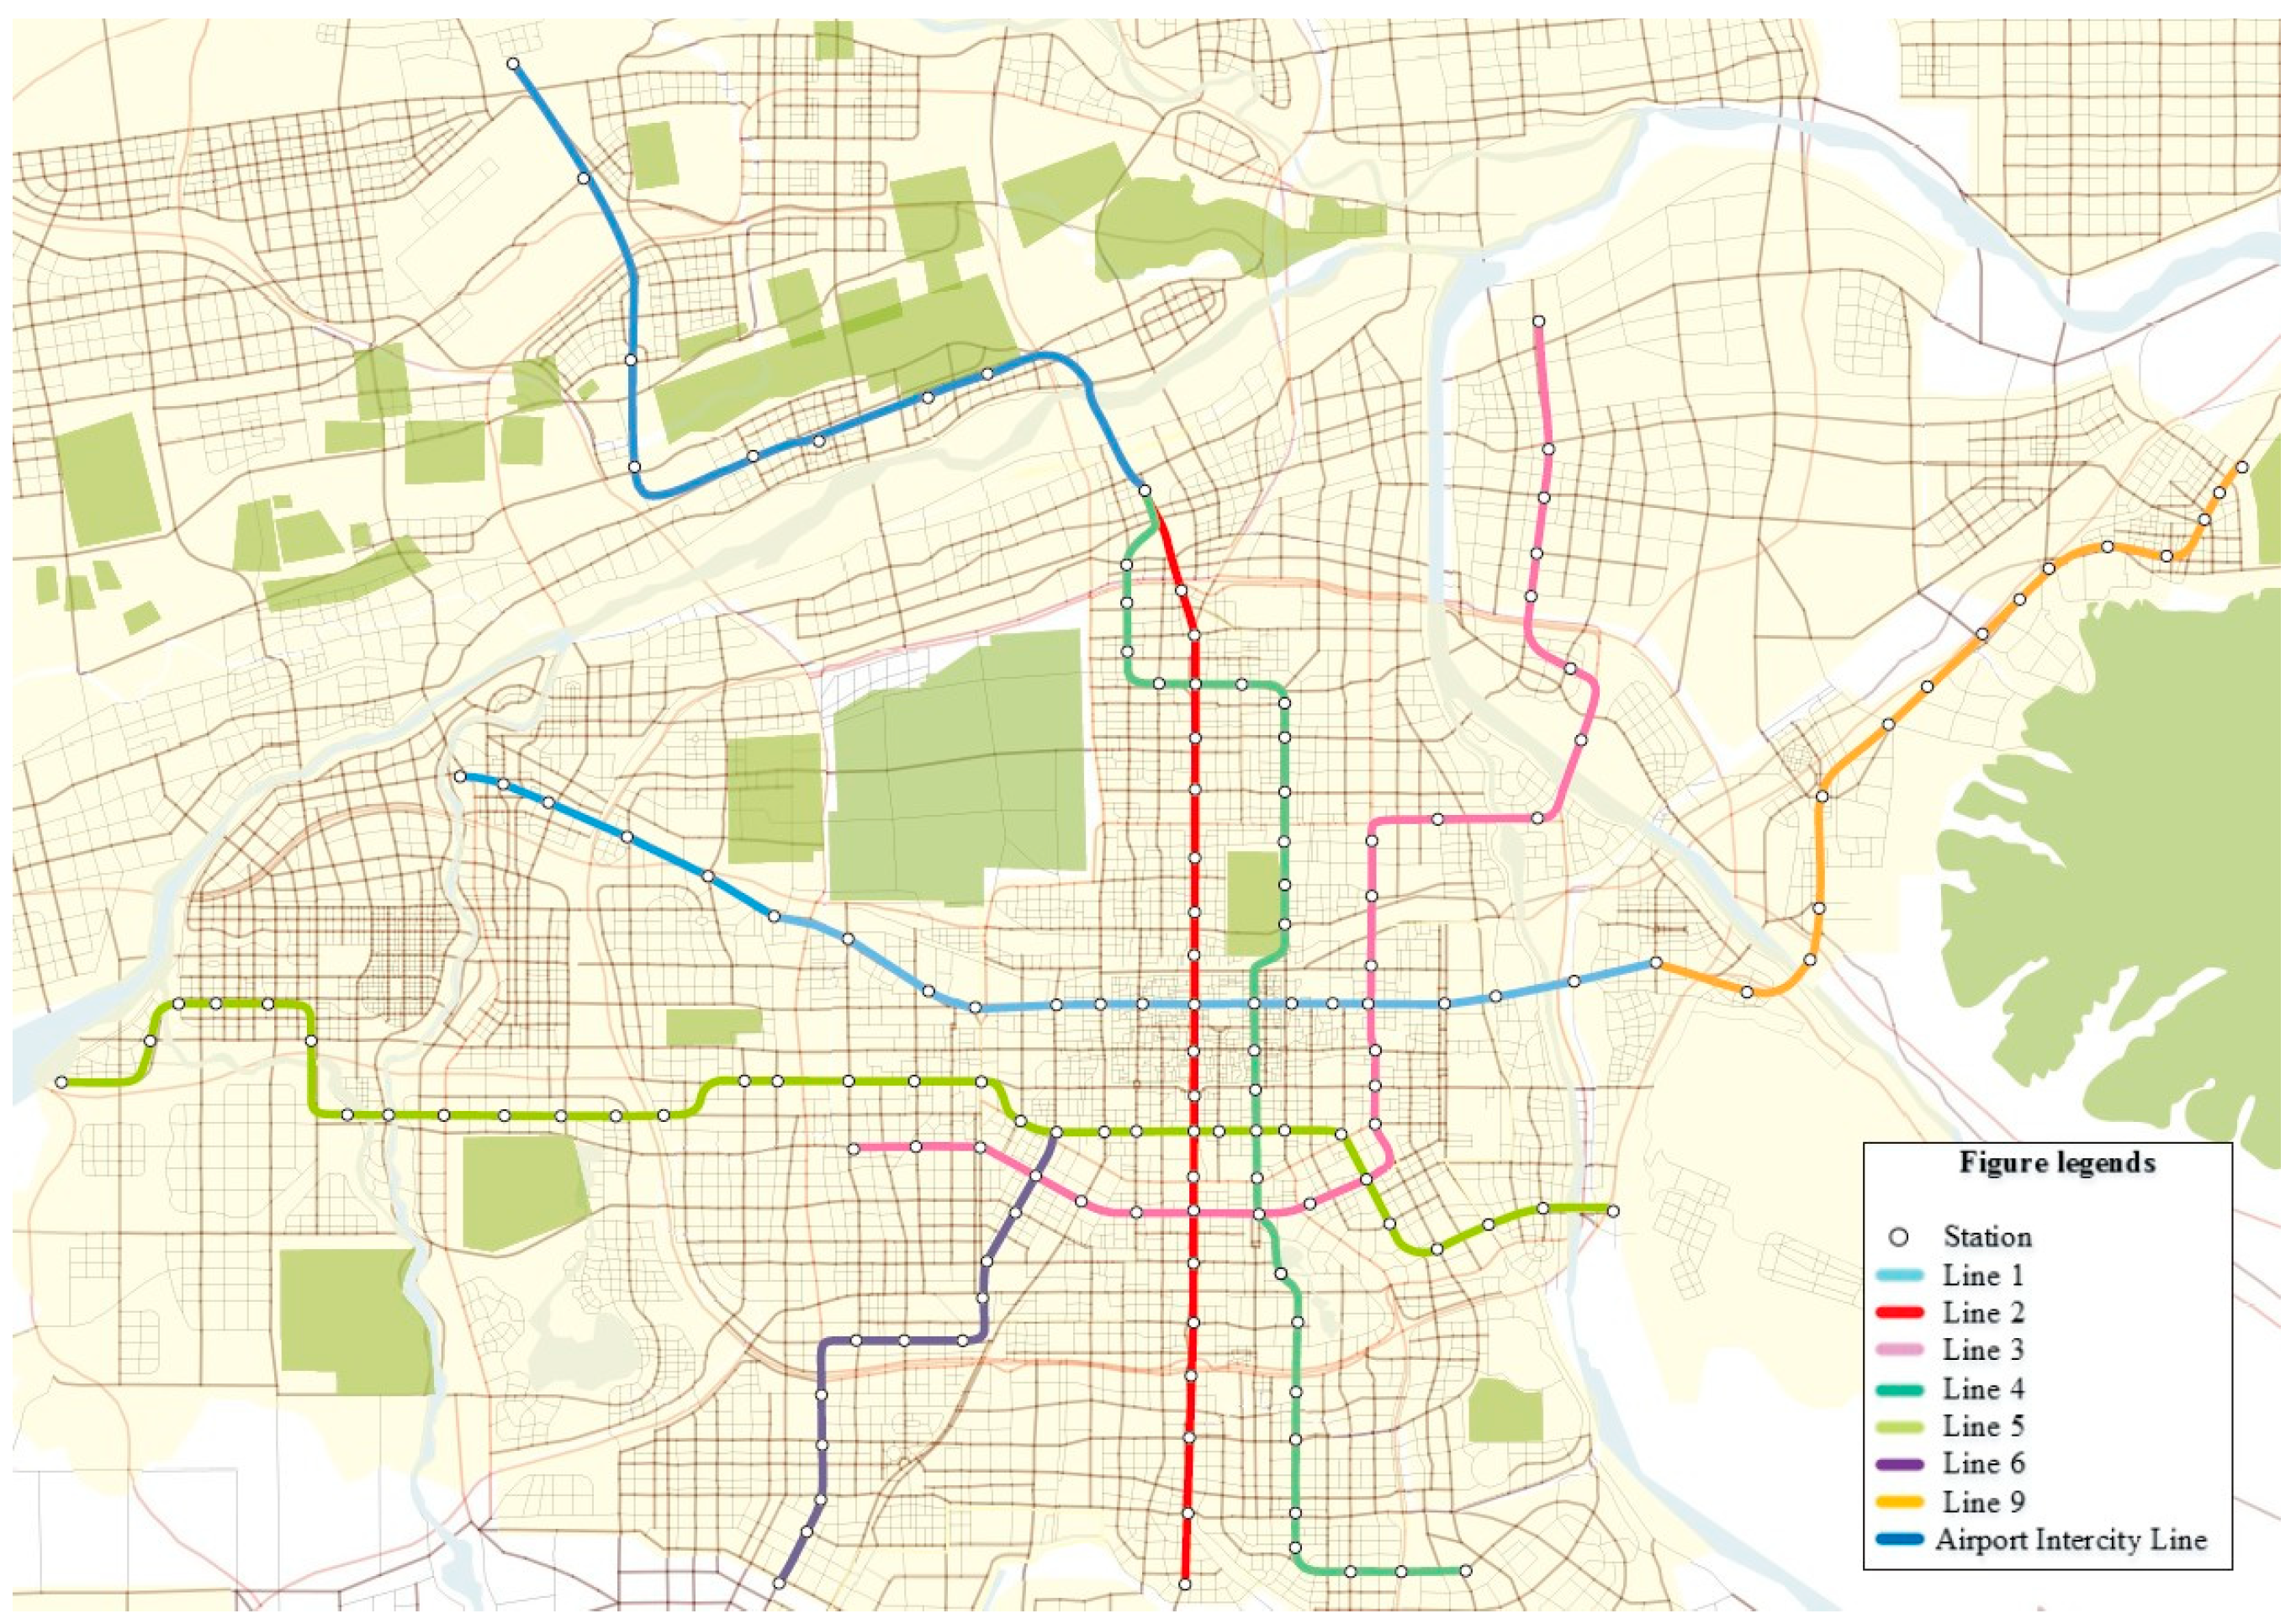
3.1. Study Area and Data Preprocessing
3.1.1. Study Area and Data Collection
3.1.2. Data Preprocessing Results
3.2. PHF and PDC Estimation Result Analysis
3.2.1. Model Comparisons
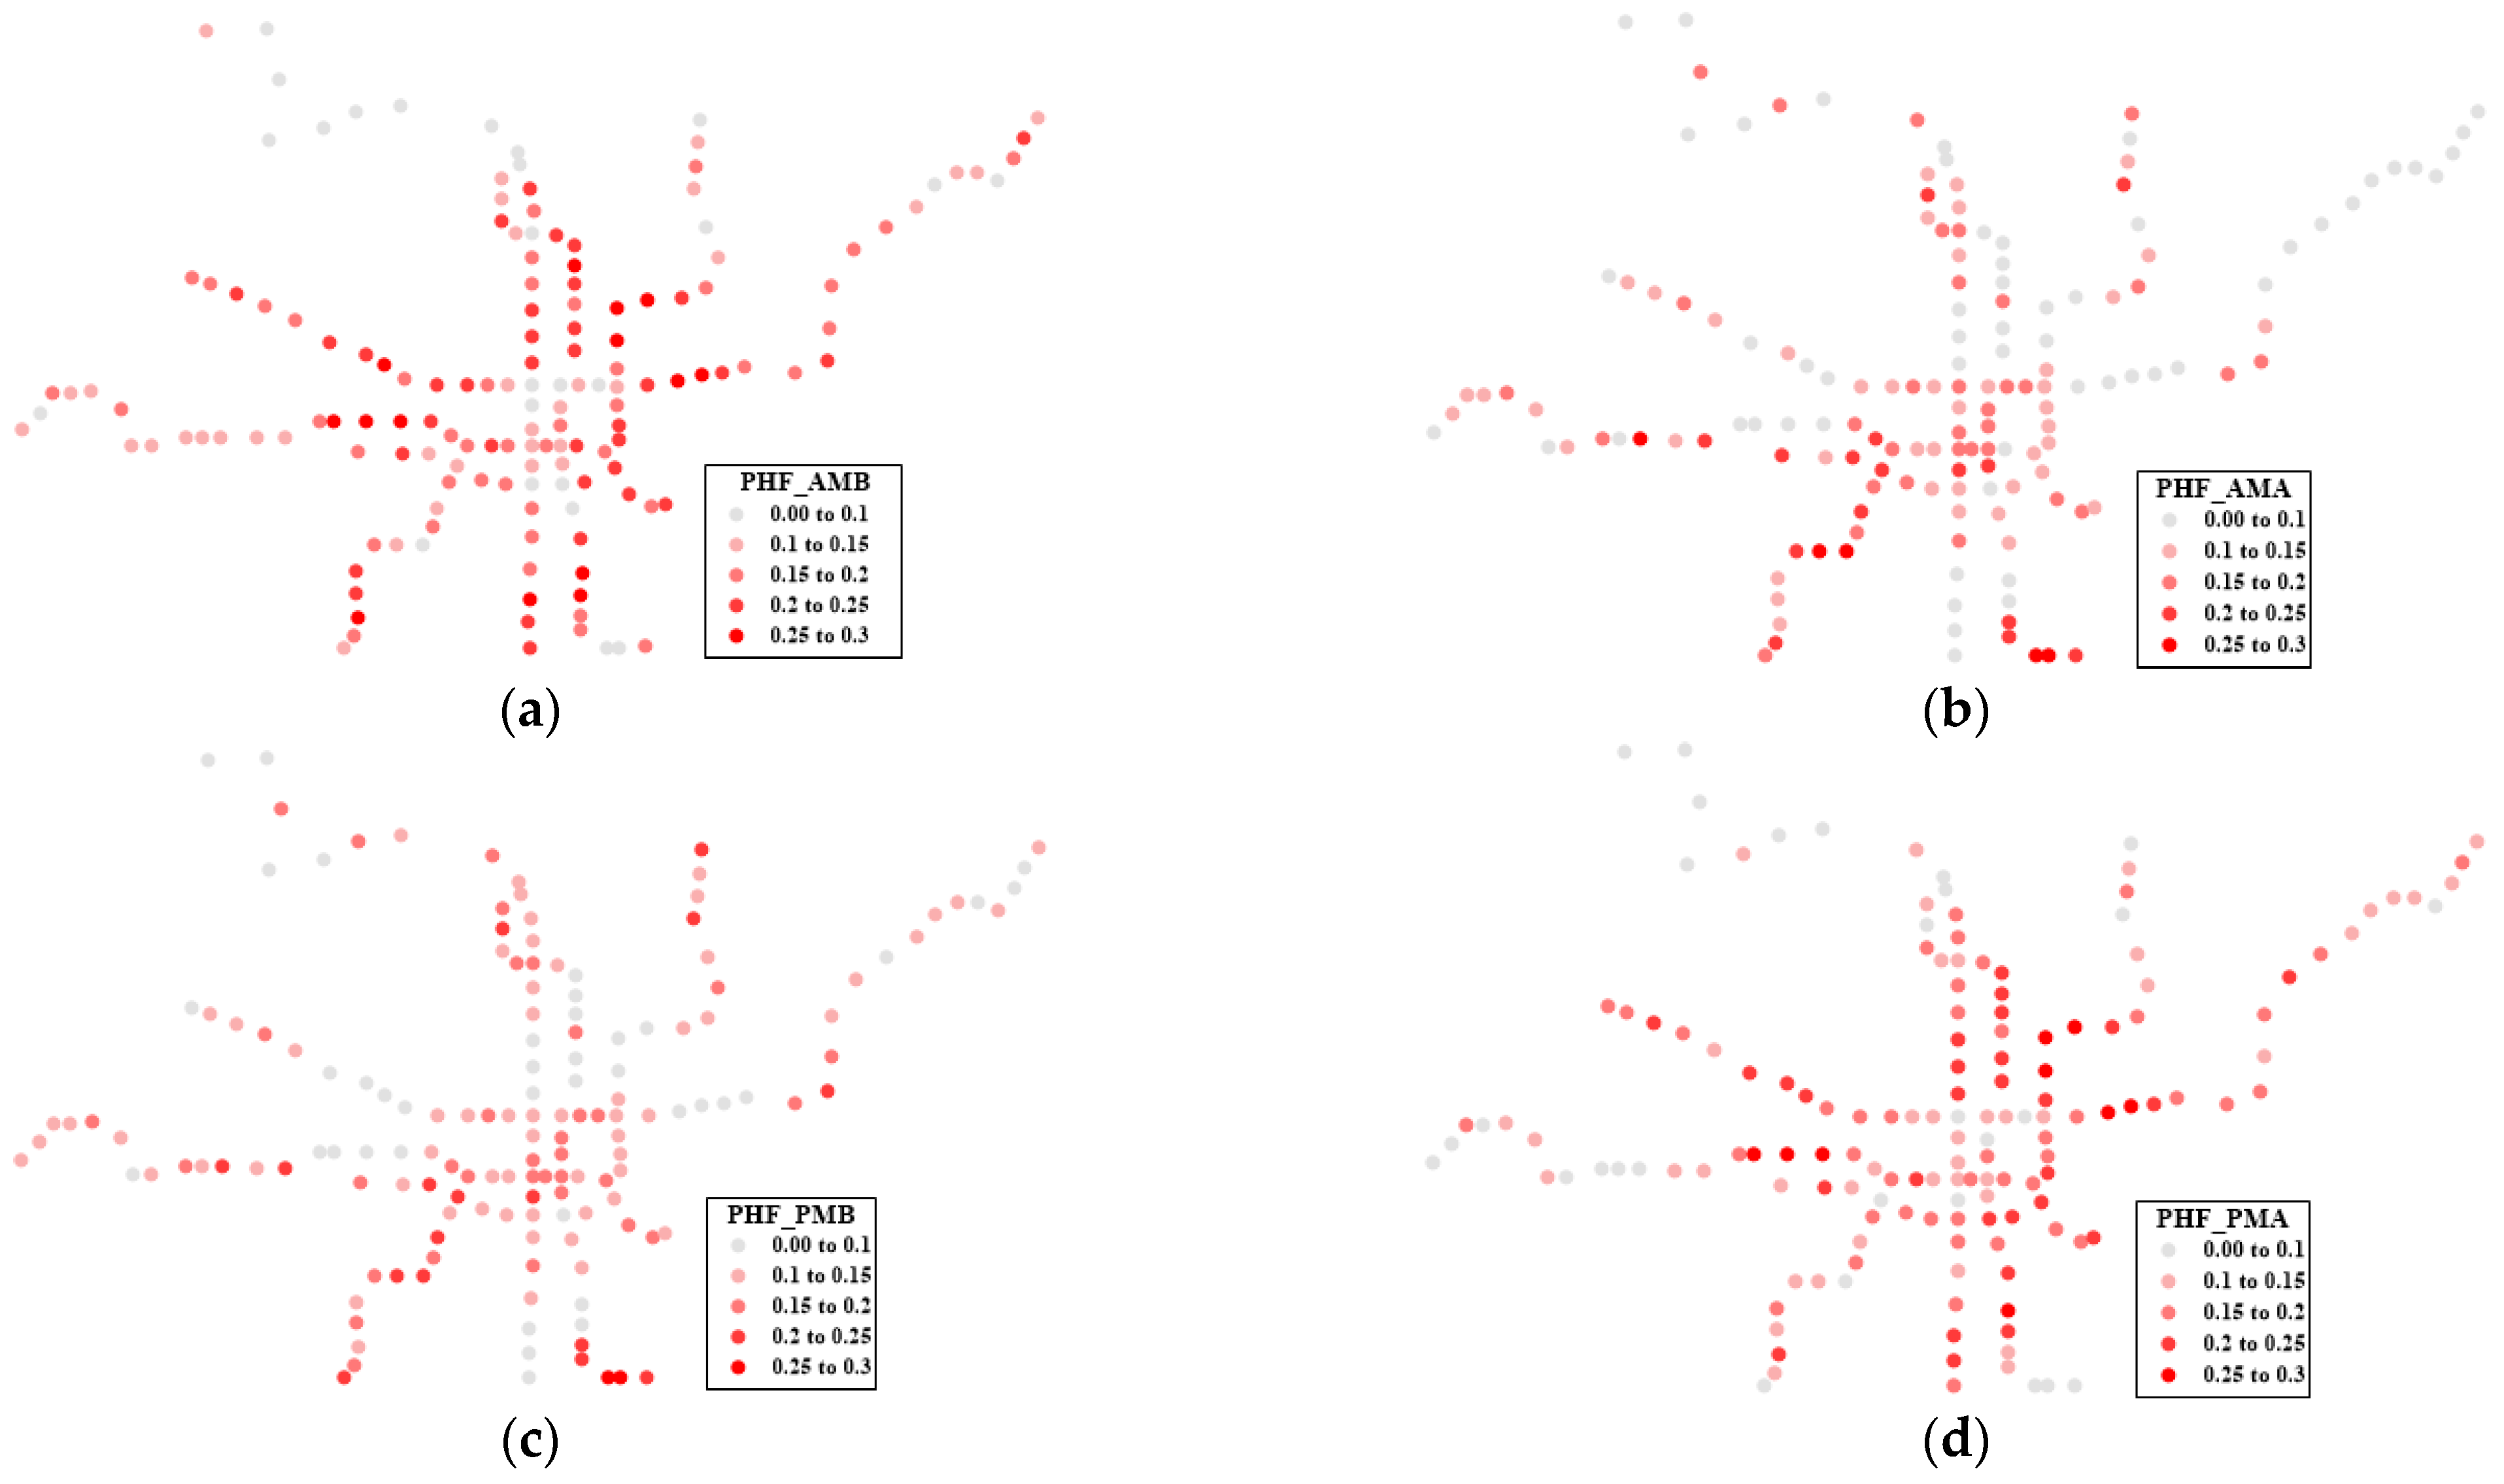
3.2.2. PHF Estimation Results and Interpretation
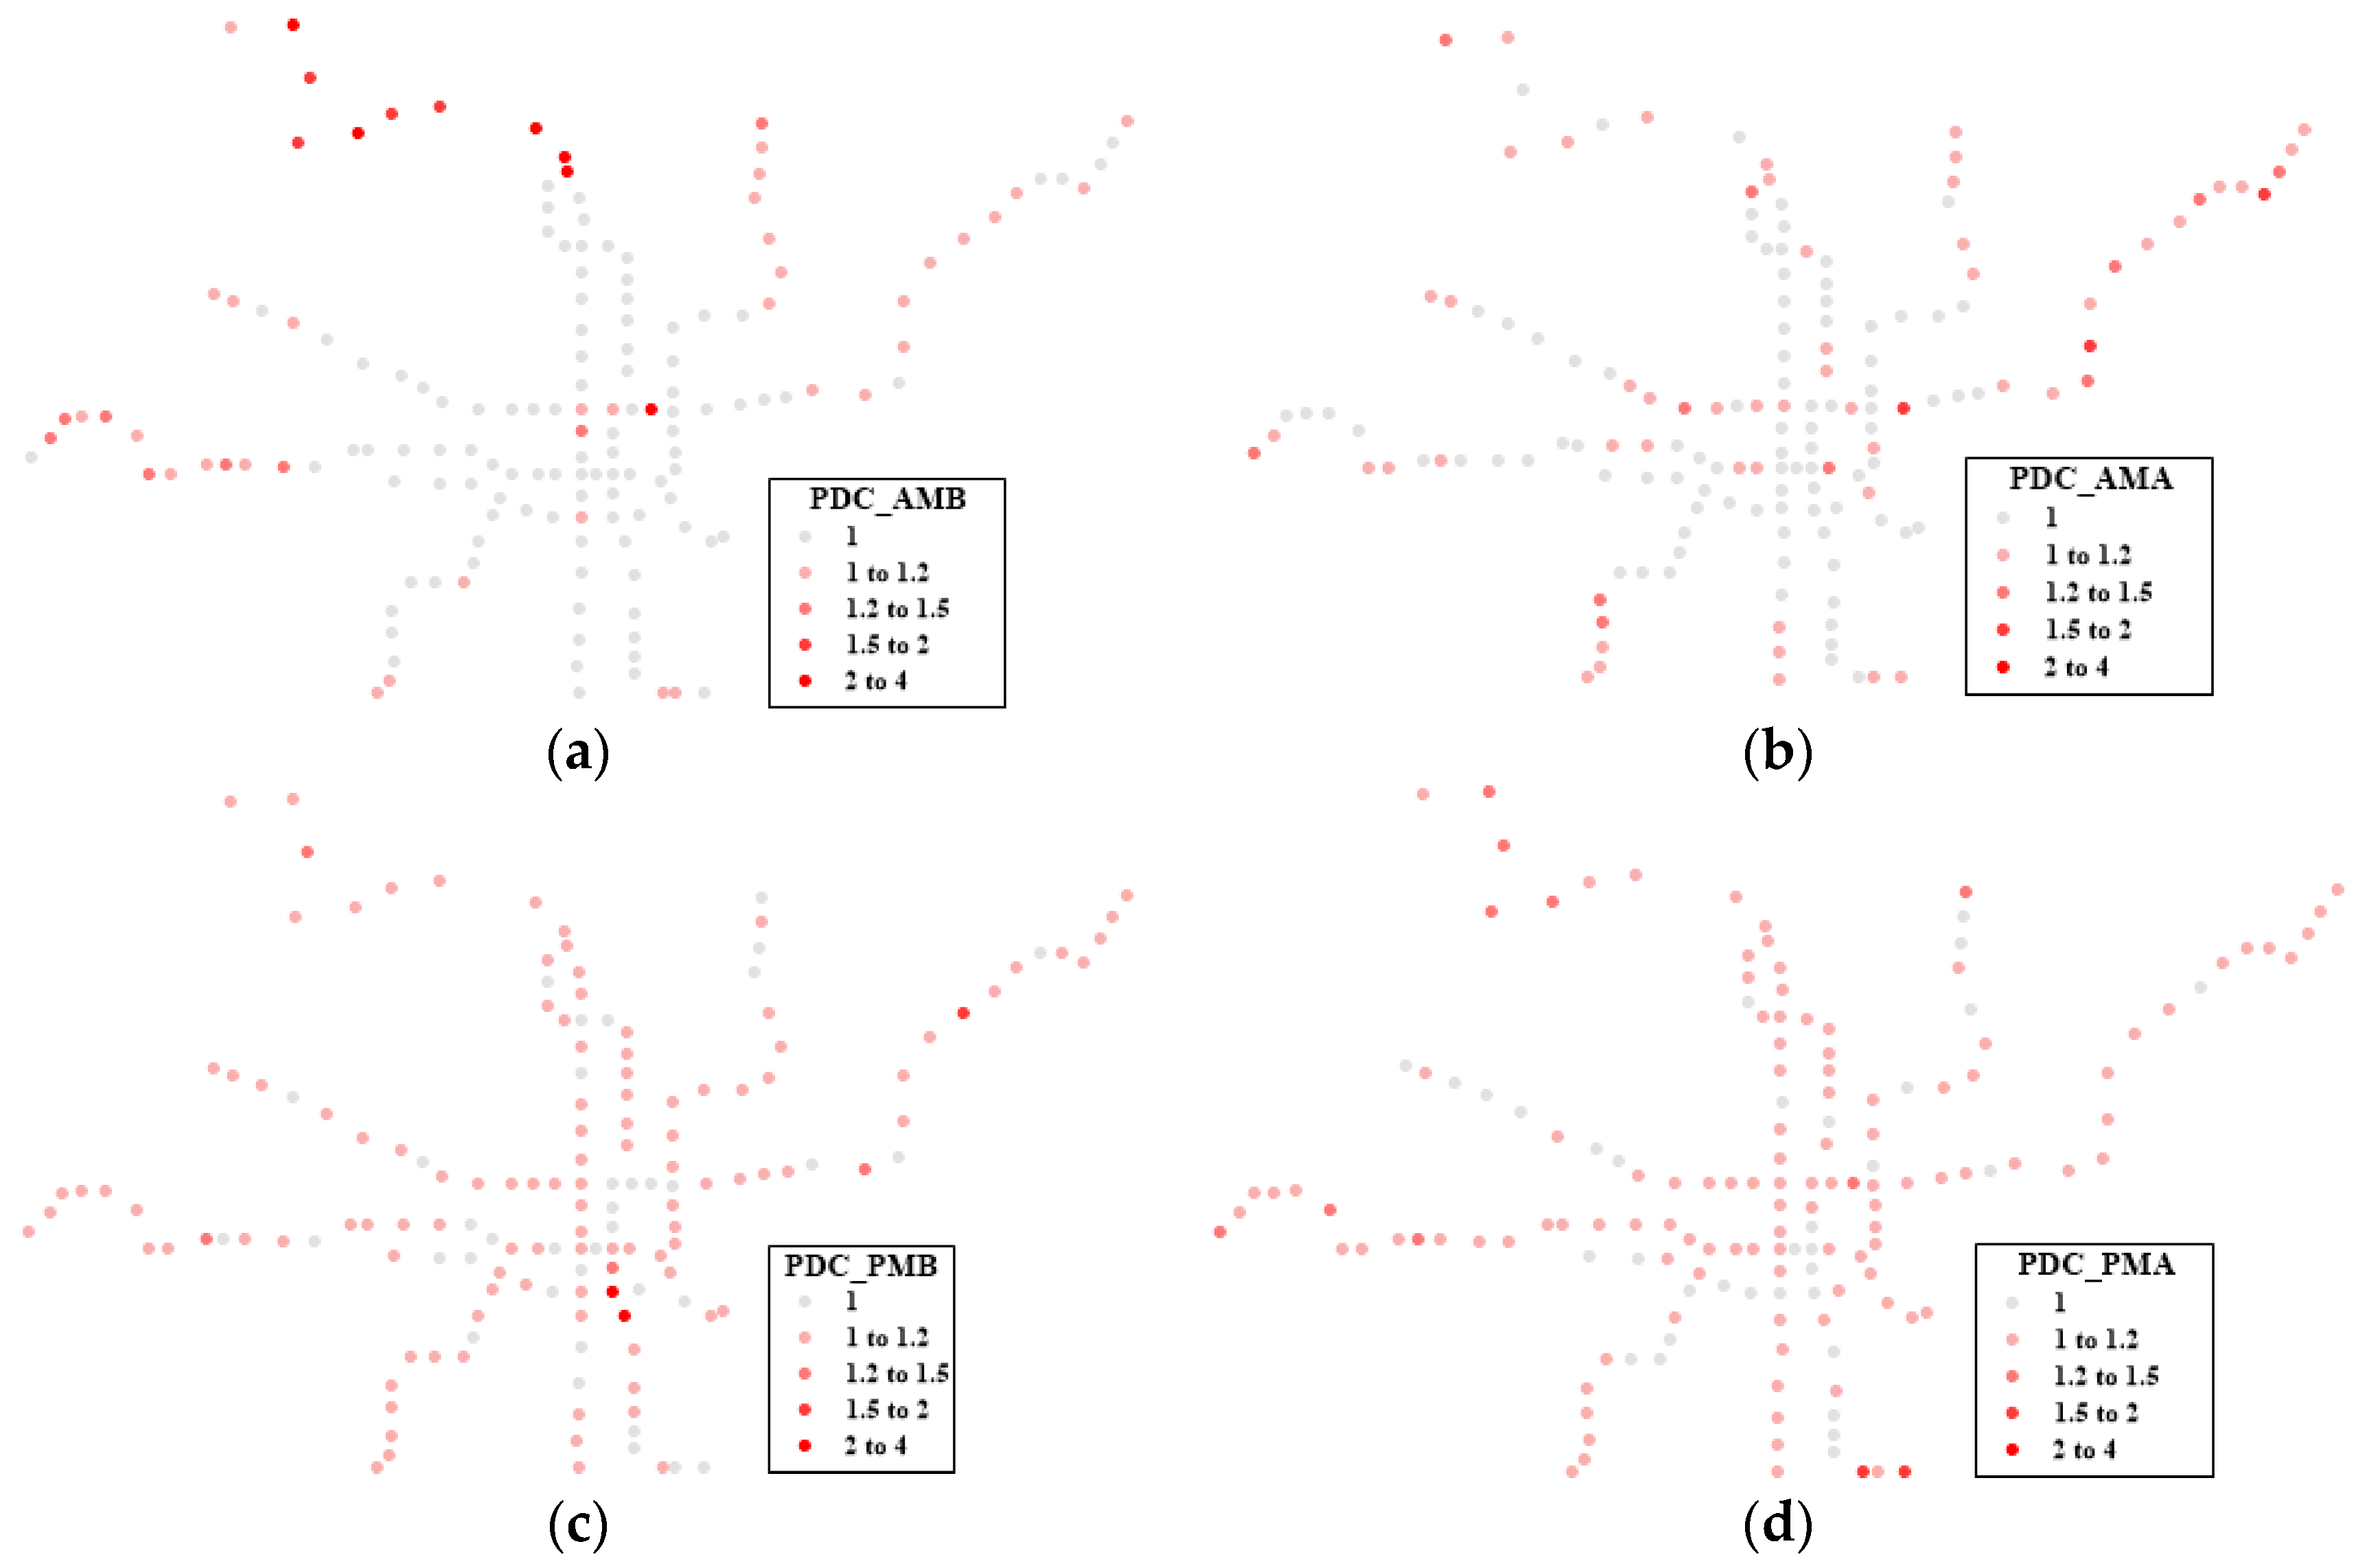
3.2.3. PDC Estimation Results and Interpretation
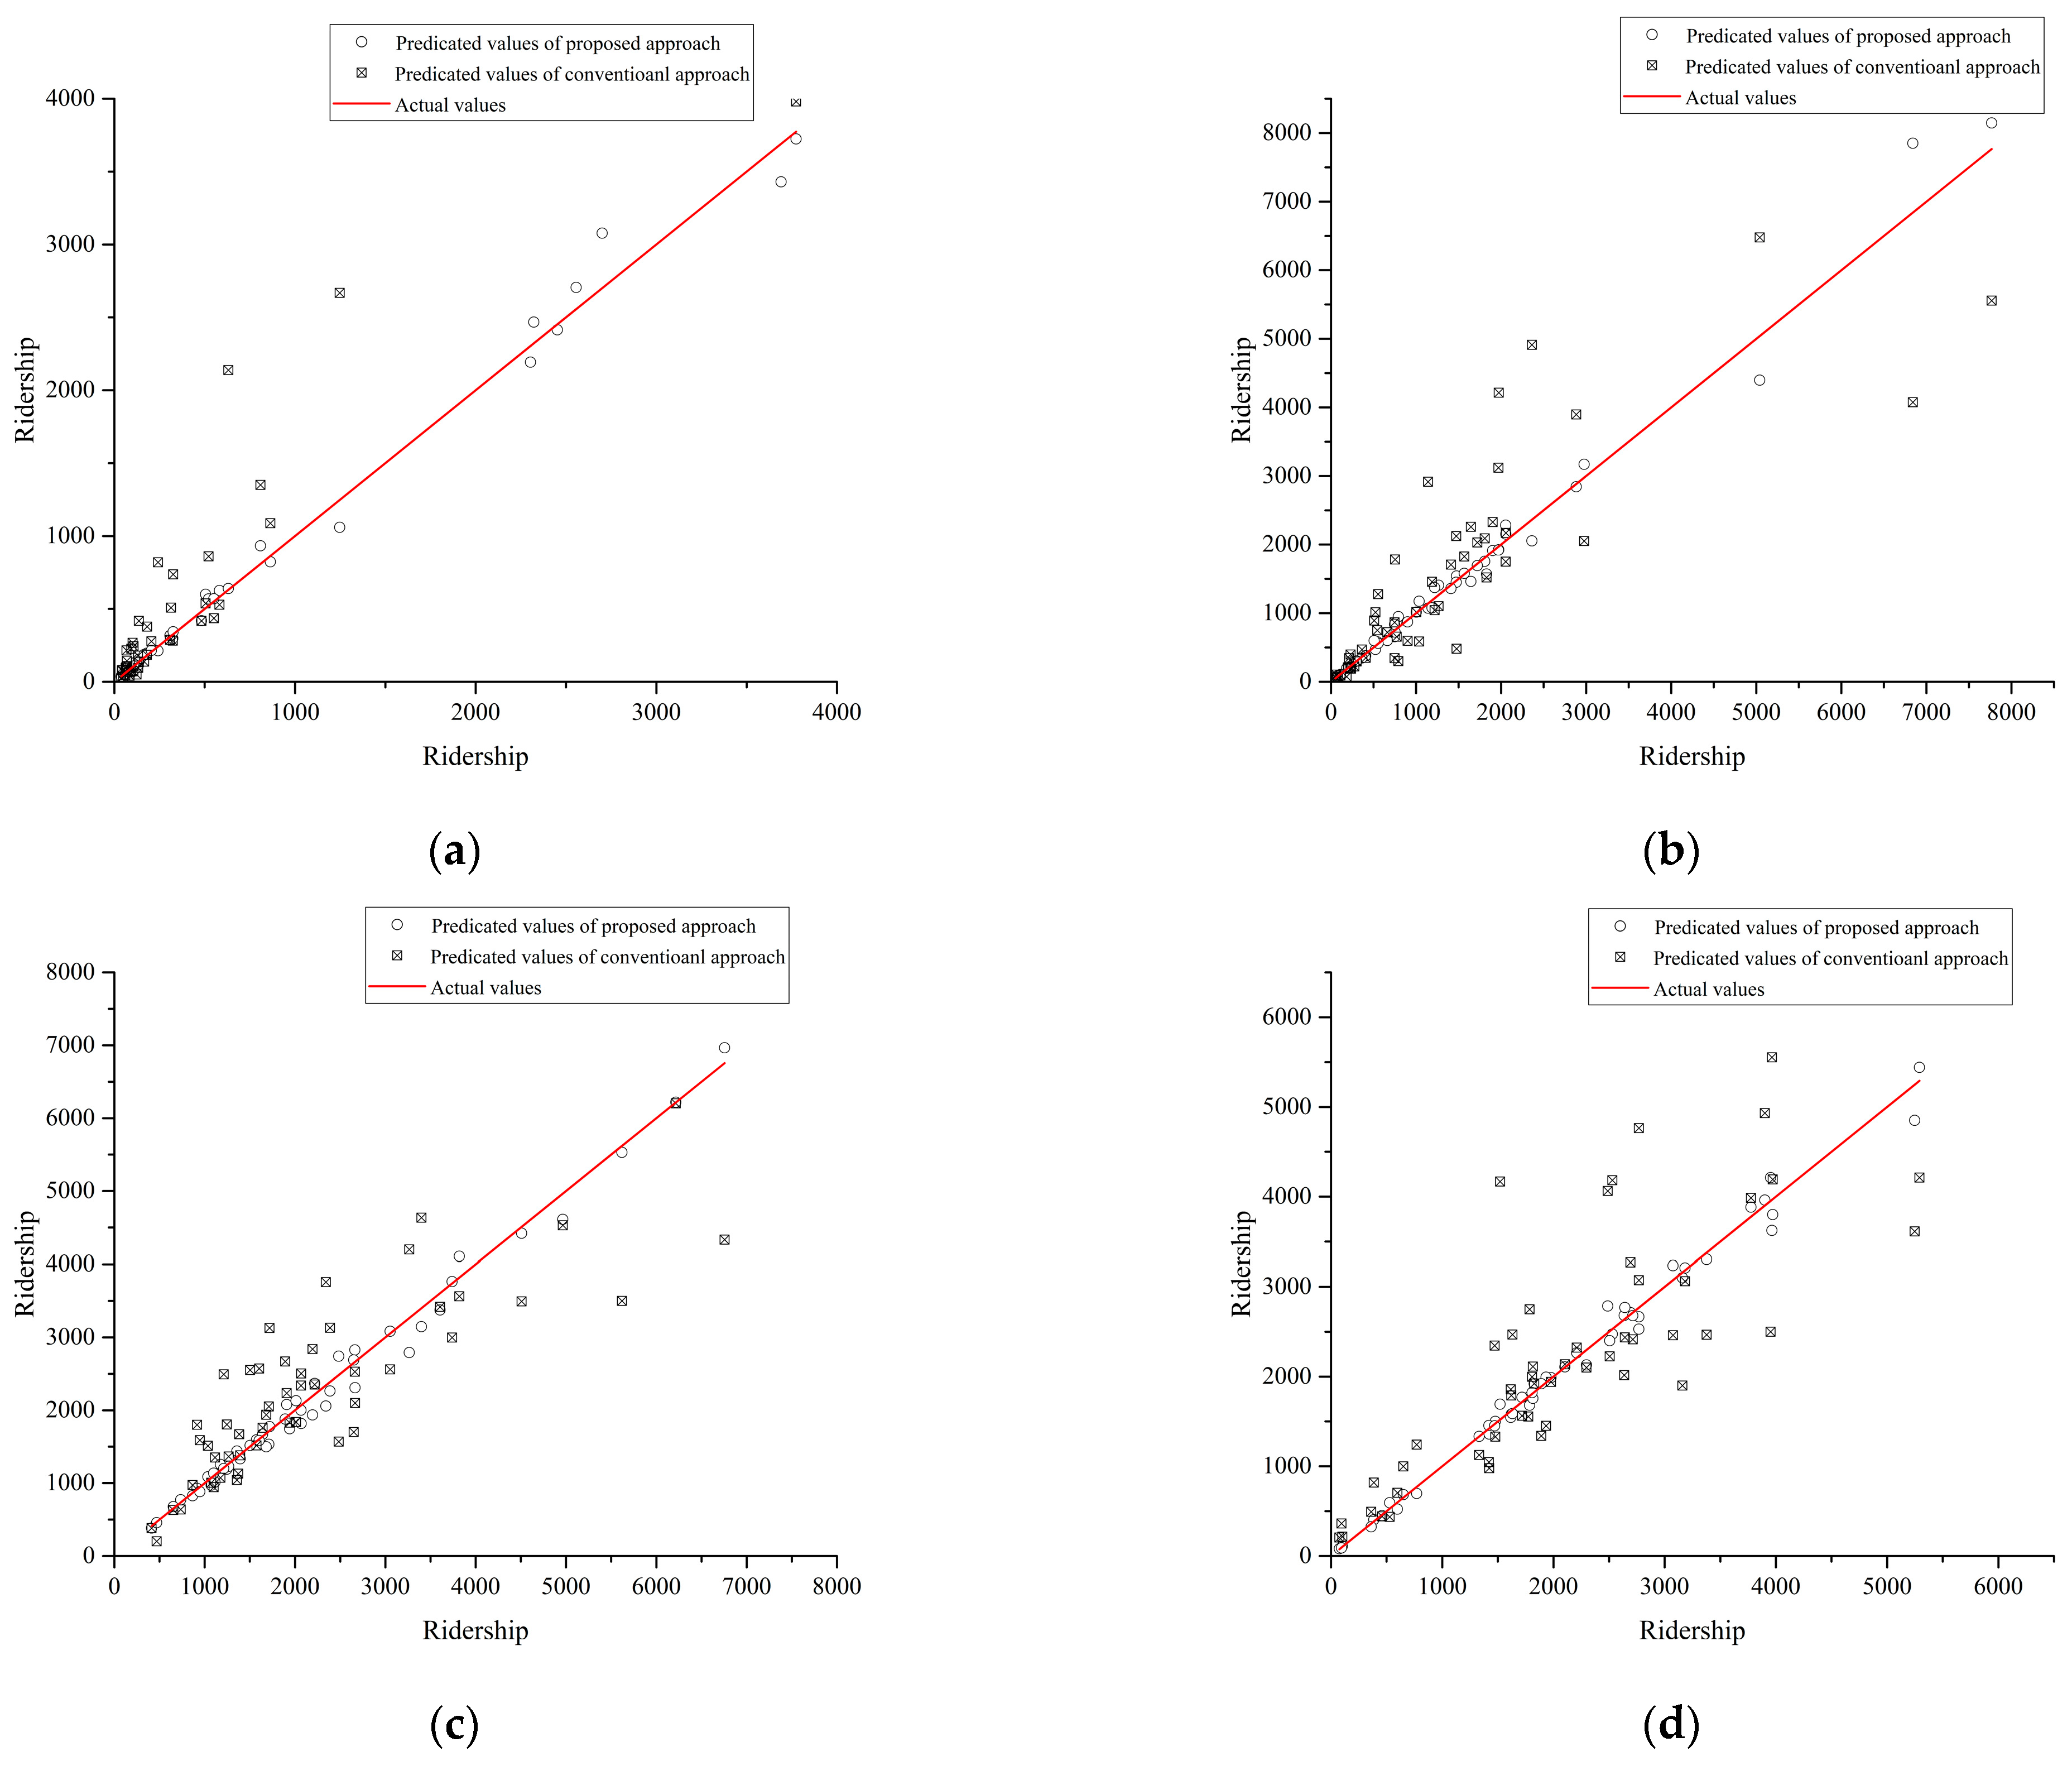
3.2.4. SPR Estimation Results Analysis
4. Discussion and Conclusions
Author Contributions
Funding
Data Availability Statement
Conflicts of Interest
References
- Wang, J.; Li, Y.; Jiao, J.; Jin, H.; Du, F. Bus ridership and its determinants in Beijing: A spatial econometric perspective. Transportation 2022, 50, 383–406. [Google Scholar] [CrossRef]
- Wu, P.; Chen, T.; Wong, Y.D.; Meng, X.; Wang, X.; Liu, W. Exploring key spatio-temporal features of crash risk hot spots on urban road network: A machine learning approach. Transp. Res. Part A Policy Pract. 2023, 173, 103717. [Google Scholar] [CrossRef]
- Li, G.; Wu, J.; He, Y.; Li, D. CQDFormer: Cyclic quasi-dynamic transformers for hourly origin-destination estimation. Appl. Sci. 2023, 13, 11257. [Google Scholar] [CrossRef]
- Ahad, A.P.; Yang, Q.; Zhang, S.; Pishro, M.A.; Zhang, Z.; Zhao, Y.; Postel, V.; Huang, D.; Li, W. Node, place, ridership, and time model for rail-transit stations: A case study. Sci. Rep. 2022, 12, 16120. [Google Scholar] [CrossRef]
- Pan, P.; Wang, H.; Li, L.; Wang, Y.; Jin, Y. Peak-hour subway passenger flow forecasting: A tensor based approach. In Proceedings of the 21st International Conference on Intelligent Transportation Systems (ITSC), Maui, HI, USA, 4–7 November 2018. [Google Scholar] [CrossRef]
- Liu, J.; Ma, X.; Liu, C.; Wang, Y.; Wang, J. Temporal distribution analysis of Beijing’s subway ridership. In Proceedings of the 16th COTA International Conference of Transportation Professionals, Shanghai, China, 6–9 July 2016. [Google Scholar] [CrossRef]
- Wei, J.; Cheng, Y.; Chen, K.; Wang, M.; Ma, C.; Hu, X. Nonlinear model-based subway station-level peak-hour ridership estimation approach in the context of peak deviation. Transp. Res. Rec. 2022, 2676, 549–564. [Google Scholar] [CrossRef]
- Chen, K.; Yu, L.; Ma, C. Differentiated peak hours at urban rail transit stations in Xi’an. Urban Transp. China 2018, 16, 51–58. [Google Scholar] [CrossRef]
- Gu, L.; Ye, X. Research on peak time of passenger flow entering and leaving stations in Osaka rail transit stations. Compr. Transp. China 2014, 2, 57–61. [Google Scholar]
- Yu, L.; Chen, Q.; Chen, K. Deviation of peak hours for urban rail transit stations: A case study in Xi’an, China. Sustainability 2019, 11, 2733. [Google Scholar] [CrossRef]
- Park, Y.; Choi, Y.; Kim, K.; Yoo, J.K. Machine learning approach for study on subway passenger flow. Sci. Rep. 2022, 12, 2754. [Google Scholar] [CrossRef]
- Zhong, C.; Batty, M.; Manley, E.; Wang, J.; Wang, Z.; Chen, F.; Schmitt, G. Variability in regularity: Mining temporal mobility patterns in London, Singapore and Beijing using smart-card data. PLoS ONE 2016, 11, e0149222. [Google Scholar] [CrossRef] [PubMed]
- Lee, J.; Boarnet, M.; Houston, D.; Nixon, H.; Spears, S. Changes in service and associated ridership impacts near a new light Rail transit line. Sustainability 2017, 9, 1827. [Google Scholar] [CrossRef]
- Shantz, A.; Casello, J.; Woudsma, C.; Guerra, E. Understanding factors associated with commuter rail ridership: A demand elasticity study of the GO transit rail network. Transp. Res. Rec. 2022, 2676, 131–143. [Google Scholar] [CrossRef]
- Yu, L.; Cong, Y.; Chen, K. Determination of the peak hour ridership of metro stations in Xi’an, China using geographically- weighted regression. Sustainability 2020, 12, 2255. [Google Scholar] [CrossRef]
- Wei, J.; Cheng, Y.; Yu, L.; Zhang, S.; Chen, K. Improved approach for forecasting extra-peak hourly subway ridership at station-level based on LASSO. J. Transp. Eng. Part A Syst. 2021, 147, 4021079. [Google Scholar] [CrossRef]
- Liu, S.; Yao, E.; Li, B. Exploring urban rail transit station-level ridership growth with network expansion. Transp. Res. Part D Transp. Environ. 2018, 73, 391–402. [Google Scholar] [CrossRef]
- Zhao, X.; Wu, Y.; Ren, G.; Ji, K.; Qian, W. Clustering analysis of ridership patterns at subway stations: A case in Nanjing, China. J. Urban Plan. Dev. 2019, 145, 04019005. [Google Scholar] [CrossRef]
- Feng, X.; Sun, Q.; Liu, J.; Yang, Y.; Liang, X. Time characteristic of input passenger in urban rail transit stations among high density residential areas. In Proceedings of the 29th Chinese Control Conference, Beijing, China, 29–31 July 2010. [Google Scholar]
- Yu, J. Characteristics of peak hour passenger flow at rail transit stations in Shanghai. Urban Transp. China 2019, 17, 50–57. [Google Scholar] [CrossRef]
- Wang, J.; Yamamoto, T.; Liu, K. Spatial dependence and spillover effects in customized bus demand: Empirical evidence using spatial dynamic panel models. Transp. Policy 2021, 105, 166–180. [Google Scholar] [CrossRef]
- Zhu, P.; Huang, J.; Wang, J.; Liu, Y.; Li, J.; Wang, M.; Qiang, W. Understanding taxi ridership with spatial spillover effects and temporal dynamics. Cities 2022, 125, 103637. [Google Scholar] [CrossRef]
- Kong, X.; Yang, J. A new method for forecasting station-level transit ridership from land-use perspective: The case of Shenzhen city. Sci. Geogr. Sin. 2018, 38, 2074–2083. [Google Scholar] [CrossRef]
- Jiao, J.; Wang, J.; Zhang, F.; Jin, F.; Liu, W. Roles of accessibility, connectivity and spatial interdependence in realizing the economic impact of high-speed rail: Evidence from China. Transp. Policy 2020, 91, 1–15. [Google Scholar] [CrossRef]
- Wang, H.; Cui, H.; Zhao, Q. Effect of green technology innovation on green total factor productivity in China: Evidence from spatial durbin model analysis. J. Clean. Prod. 2020, 288, 125624. [Google Scholar] [CrossRef]
- Anselin, L. Spatial Econometrics: Methods and Models; Springer: Dordrecht, The Netherlands, 1998. [Google Scholar]
- Sung, H.; Oh, J. Transit-oriented development in a high-density city: Identifying its association with transit ridership in Seoul, Korea. Cities 2011, 28, 70–82. [Google Scholar] [CrossRef]
- Cardozo, O.D.; García-Palomares, J.C.; Javier, G. Application of geographically weighted regression to the direct forecasting of transit ridership at station-level. Appl. Geogr. 2012, 34, 548–558. [Google Scholar] [CrossRef]
- Zhao, J.; Deng, W.; Yan, S.; Zhu, Y. What influences metro station ridership in China? insights from Nanjing. Cities 2013, 35, 114–124. [Google Scholar] [CrossRef]
- Li, S.; Lyu, D.; Huang, G.; Zhang, X.; Gao, F.; Chen, Y.; Liu, X. Spatially varying impacts of built environment factors on rail transit ridership at station level: A case study in Guangzhou, China. J. Transp. Geogr. 2020, 82, 102631. [Google Scholar] [CrossRef]
- Wang, J.; Liu, J.; Ma, Y.; Sun, F.; Chen, F. Temporal and spatial passenger flow distribution characteristics at rail transit stations in Beijing. Urban Transp. China 2013, 11, 18–27. [Google Scholar] [CrossRef]
- Yu, L.; Cui, M. How subway network affects transit accessibility and equity: A case study of Xi’an metropolitan area. J. Transp. Geogr. 2023, 108, 103556. [Google Scholar] [CrossRef]
- Lu, J.; Zhang, L. Modeling and prediction of tree height diameter relationships using spatial autoregressive models. For. Sci. 2011, 57, 252–264. [Google Scholar] [CrossRef]


| Categories | Independent Variables | Notation | Mean | Min. | Max. |
|---|---|---|---|---|---|
| Land use | Number of residences | 46 | 0 | 177 | |
| Number of offices | 128 | 1 | 1084 | ||
| Number of government organizations | 42 | 0 | 210 | ||
| Number of restaurants | 324 | 0 | 1344 | ||
| Number of retailers | 451 | 0 | 2762 | ||
| Number of schools | 82 | 0 | 326 | ||
| Number of healthcare | 61 | 0 | 193 | ||
| Number of transport facilities | 72 | 2 | 222 | ||
| Number of tourist spots | 8 | 0 | 123 | ||
| Number of finance spots | 23 | 0 | 101 | ||
| Number of living services | 329 | 0 | 1577 | ||
| Number of hotels | 78 | 0 | 820 | ||
| Land-use entropy | 0.78 | 0.41 | 0.89 | ||
| Station characteristics | Distance to city center (km) | 10.65 | 0.24 | 30.6 | |
| Betweenness centrality | 0.1 | 0 | 0.48 | ||
| Operating time (year) | 3.5 | 0.38 | 9.67 | ||
| Accessibility | Number of bus lines | 55 | 1 | 169 | |
| Road density (km/km2) | 3.43 | 0.93 | 9.07 |
| Peak Types | Evaluation Indexes | PHF | PDC | ||||||
|---|---|---|---|---|---|---|---|---|---|
| OLS | SLM | SEM | SDM | OLS | SLM | SEM | SDM | ||
| AMB | AIC | −418.56 | −457.59 | −471.74 | −489.32 | 157.16 | 145.77 | 132.43 | 89.214 |
| LRT | 0.11 | 14.26 | 23.34 | 1.58 | 12.91 | 14.43 | |||
| AMA | AIC | −411.37 | −423.98 | −418.06 | −448.44 | −221.34 | −224.39 | −222.56 | −227.61 |
| LRT | 15.34 | 17.42 | 19.22 | 0.01 | 3.18 | 4.64 | |||
| PMB | AIC | −524.39 | −541.43 | −537.61 | −583.67 | −177.36 | −181 | −180.52 | −188.5 |
| LRT | 8.89 | 10.07 | 13.72 | 0.53 | 0.06 | 3.1 | |||
| PMA | AIC | −613.59 | −642.75 | −657.69 | −678.4 | −234.97 | −253.29 | −258.61 | −347.09 |
| LRT | 2.23 | 17.17 | 20.49 | 0.36 | 5.68 | 7.51 | |||
| Variables | AMB | AMA | PMB | PMA | ||||
|---|---|---|---|---|---|---|---|---|
| X | WX | X | WX | X | WX | X | WX | |
| 0.0205 * | −0.0026 | −0.0022 * | −0.0056 | — | — | — | — | |
| 0.0020 * | −0.0047 | 0.0332 *** | 0.0184 | 0.0203 *** | 0.0134 | — | — | |
| — | — | 0.0004 * | 0.0010 | — | — | −0.0022 * | −0.0037 | |
| −0.0189 *** | 0.0024 | 0.0236 *** | −0.0041 | — | — | — | — | |
| −0.0056 * | −0.0082 | −0.0148 *** | −0.0071 | — | — | −0.0061 * | −0.0020 | |
| −0.0110 * | 0.0076 | — | — | — | — | — | — | |
| 0.0198 *** | 0.0071 | −0.0110 * | 0.0167 | −0.0026 * | 0.0088 | 0.0049 * | 0.0005 | |
| −0.0216 *** | −0.0081 | 0.0107 * | 0.0035 | — | — | −0.0079 * | −0.0075 | |
| — | — | — | — | — | — | 0.0007 * | 0.0010 | |
| −0.0137 *** | −0.0081 | 0.0130 *** | 0.0032 | — | — | −0.0041 * | −0.0026 | |
| 0.0498 *** | 0.0213 | −0.0502 *** | −0.0262 | −0.0242 *** | −0.0239 | 0.0226 *** | 0.0139 | |
| 0.0007 * | −0.0103 | −0.0091 * | 0.0059 | −0.0020 * | 0.0052 | — | — | |
| — | — | — | — | 0.0009 * | −0.0142 | — | — | |
| — | — | 0.0177 * | 0.0138 | 0.0130 * | 0.0150 | 0.0010 * | −0.0074 | |
| — | — | — | — | — | — | −0.0036 * | −0.0023 | |
| −0.0054 * | 0.0031 | 0.0098 * | −0.0053 | 0.0007 * | −0.0009 | −0.0030 * | 0.0014 | |
| −0.0277 * | 0.0026 | 0.0115 * | −0.0088 | 0.0108 * | −0.0008 | — | — | |
| 0.0008 * | 0.0042 | −0.0063 * | −0.0008 | — | — | — | — | |
| — | −0.0144 | — | 0.0377 | — | −0.0044 | — | 0.0038 | |
| 0.1504 | — | 0.0874 | — | 0.0936 | — | 0.0511 | — | |
| Variables | AMB | AMA | PMB | PMA | ||||
|---|---|---|---|---|---|---|---|---|
| X | WX | X | WX | X | WX | X | WX | |
| −0.1243 *** | −0.0291 | — | — | −0.0457 *** | 0.0159 | — | — | |
| −0.0591 *** | −0.0824 | −0.0302 *** | −0.0123 | — | — | — | — | |
| — | — | 0.0187 * | 0.0093 | — | — | 0.0221 *** | 0.0048 | |
| — | — | — | — | — | — | −0.0291 *** | −0.0327 | |
| −0.0194 * | −0.0001 | 0.0050 * | 0.0124 | 0.0403 *** | 0.0139 | −0.0362 *** | −0.0196 | |
| — | — | −0.0080 * | −0.0060 | −0.0109 * | 0.0126 | 0.0339 *** | −0.0118 | |
| −0.0171 * | −0.0718 | 0.0277 * | 0.0117 | −0.0297 * | −0.0220 | 0.0116 * | 0.0147 | |
| 0.1138 *** | 0.2327 | — | — | — | — | — | — | |
| −0.0234 * | −0.0289 | 0.0014 * | −0.0062 | — | — | 0.0005 * | 0.0019 | |
| −0.0351 | 0.0384 | −0.0215 * | −0.0030 | — | — | 0.0154 * | 0.0062 | |
| — | — | — | — | — | — | −0.0207 * | 0.0237 | |
| — | — | — | — | −0.0026 | −0.0032 | 0.0143 ** | 0.0053 | |
| — | — | — | — | 0.3102 *** | 0.1253 | −0.3938 *** | −0.1643 | |
| −0.0182 * | −0.0648 | 0.0157 * | 0.0198 | — | — | −0.0281 * | 0.0083 | |
| — | — | — | — | 0.0073 * | −0.0246 | −0.0452 *** | 0.0212 | |
| 0.0303 * | −0.0002 | −0.0169 * | 0.0016 | −0.0063 * | 0.0053 | 0.0116 * | −0.0076 | |
| — | — | 0.0743 * | 0.0006 | — | — | — | — | |
| — | — | 0.0093 * | −0.0031 | 0.0055 * | −0.0014 | 0.0086 * | −0.0057 | |
| — | −0.2560 | — | −0.1042 | — | 0.0263 | — | −0.0575 | |
| 1.8264 | — | 1.0102 | — | 1.0299 | — | 1.3434 | — | |
| MAPE | AMB | AMA | PMB | PMA |
|---|---|---|---|---|
| Traditional approach | 0.590 | 0.377 | 0.255 | 0.324 |
| Proposed approach | 0.194 | 0.118 | 0.097 | 0.096 |
| Decreased value | 0.396 | 0.259 | 0.158 | 0.228 |
Disclaimer/Publisher’s Note: The statements, opinions and data contained in all publications are solely those of the individual author(s) and contributor(s) and not of MDPI and/or the editor(s). MDPI and/or the editor(s) disclaim responsibility for any injury to people or property resulting from any ideas, methods, instructions or products referred to in the content. |
© 2024 by the authors. Licensee MDPI, Basel, Switzerland. This article is an open access article distributed under the terms and conditions of the Creative Commons Attribution (CC BY) license (https://creativecommons.org/licenses/by/4.0/).
Share and Cite
Zhao, Y.; Wei, J.; Li, H.; Huang, Y. Predicting Station-Level Peak Hour Ridership of Metro Considering the Peak Deviation Coefficient. Sustainability 2024, 16, 1225. https://doi.org/10.3390/su16031225
Zhao Y, Wei J, Li H, Huang Y. Predicting Station-Level Peak Hour Ridership of Metro Considering the Peak Deviation Coefficient. Sustainability. 2024; 16(3):1225. https://doi.org/10.3390/su16031225
Chicago/Turabian StyleZhao, Ying, Jie Wei, Haijun Li, and Yan Huang. 2024. "Predicting Station-Level Peak Hour Ridership of Metro Considering the Peak Deviation Coefficient" Sustainability 16, no. 3: 1225. https://doi.org/10.3390/su16031225
APA StyleZhao, Y., Wei, J., Li, H., & Huang, Y. (2024). Predicting Station-Level Peak Hour Ridership of Metro Considering the Peak Deviation Coefficient. Sustainability, 16(3), 1225. https://doi.org/10.3390/su16031225