
Alternatives for the Optimization and Reduction in the Carbon Footprint in Island Electricity Systems (IESs)

 and
and
Abstract
1. Introduction
2. Energy Situation in the Canary Islands in 2019
2.1. Energy and Environmental Values
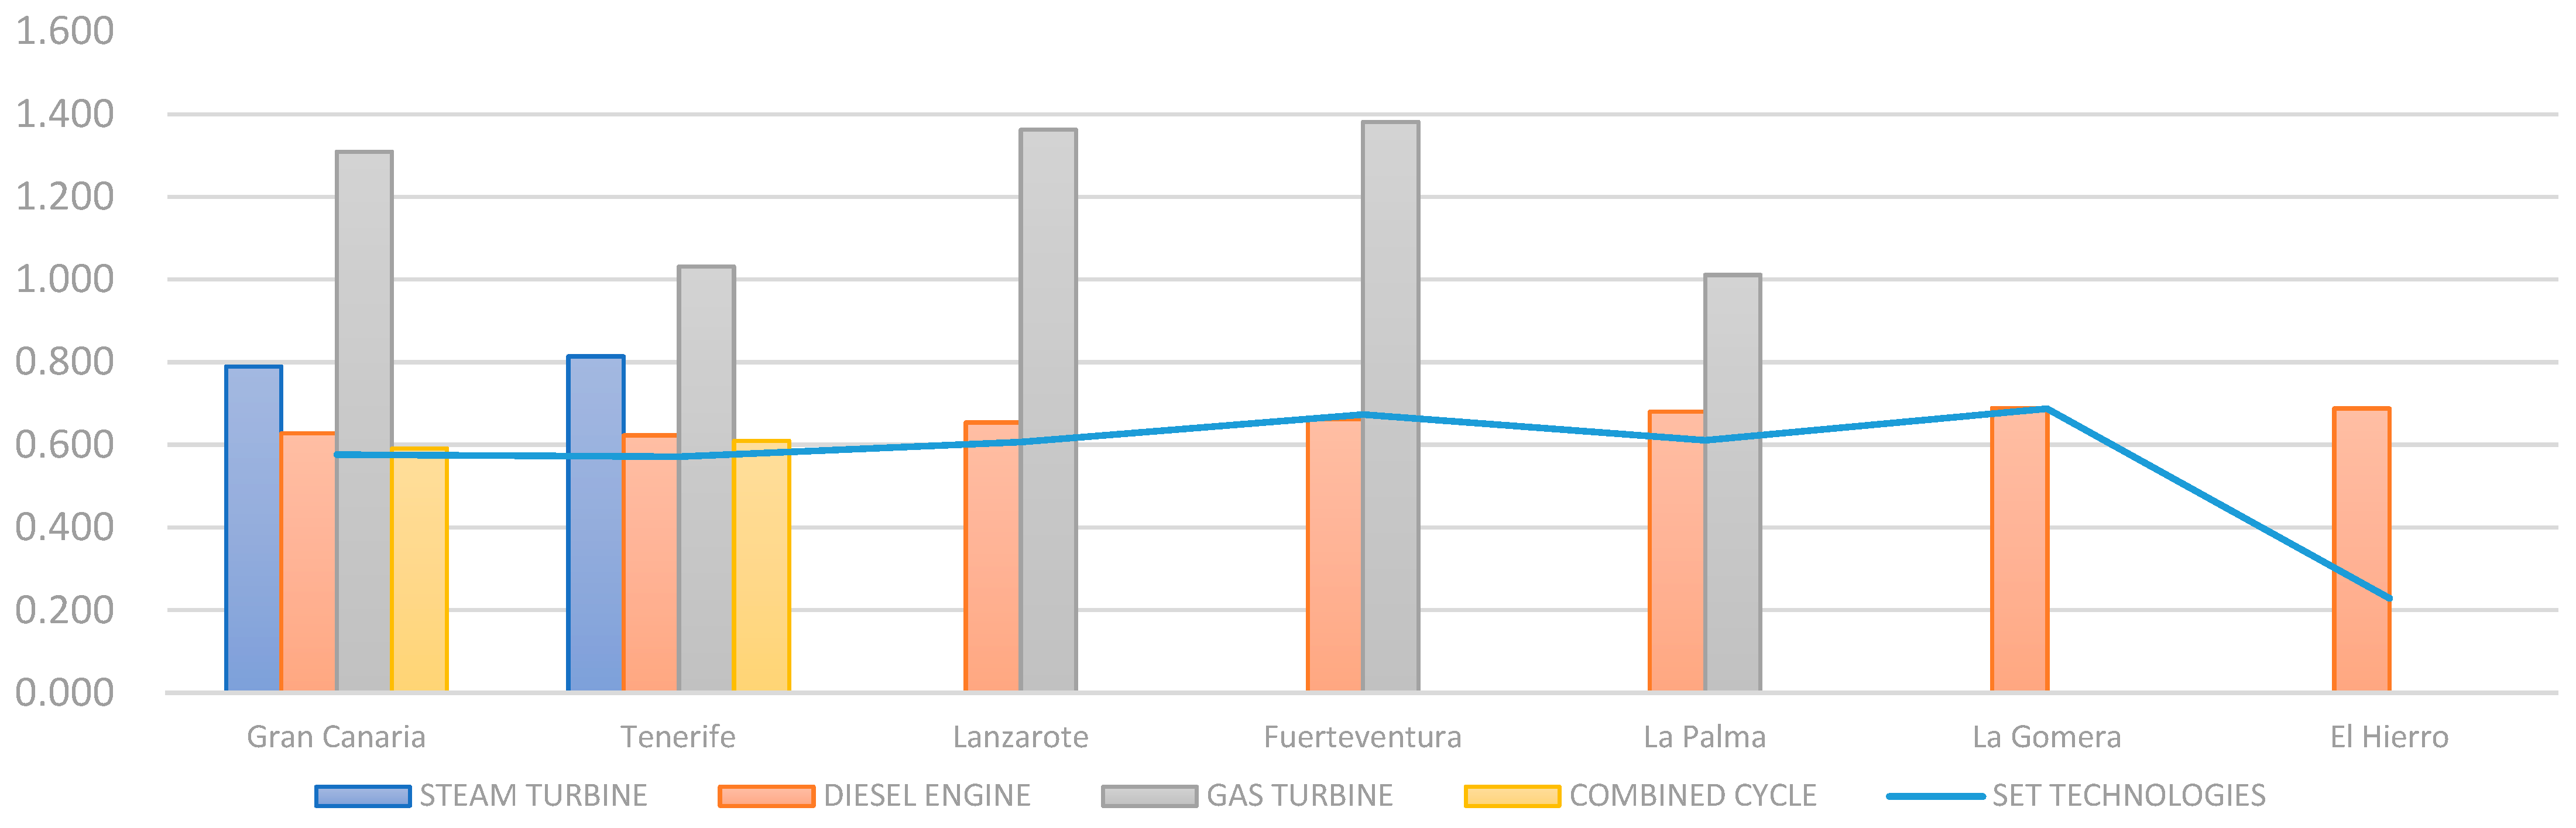
2.2. Penetration Values of Renewable Energies in the Canary Islands
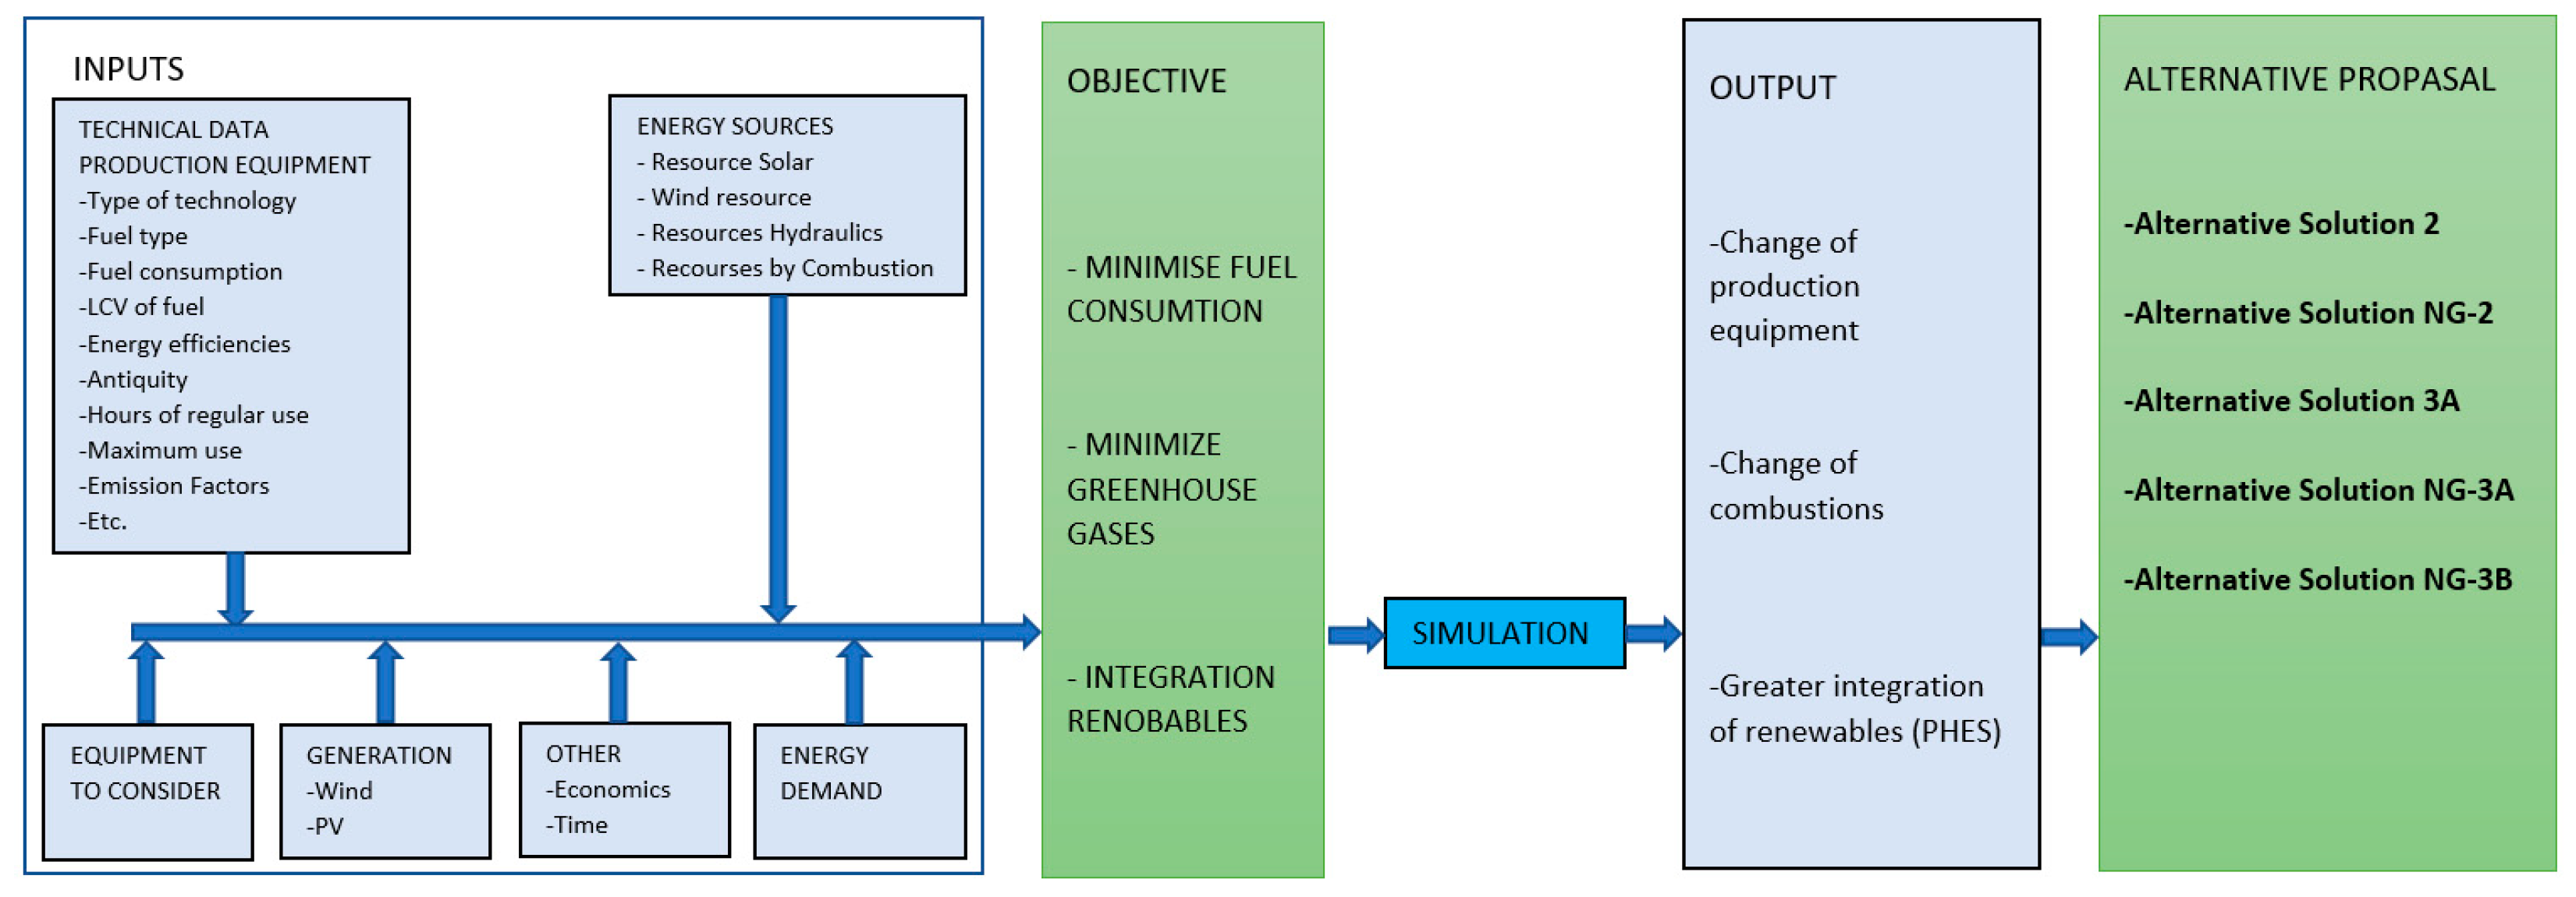
3. Methodology
- The study of the situation and behavior of energy production on the island and its demand.
- The study of the fossil fuel-based energy generation equipment on the islands, considering the type of technology employed, the level of consumption, the fuel type and its lower calorific value (LCV), the energy efficiency of each piece of equipment, the influence of its age, the hours of regular use, the maximum hours of use estimated by the manufacturer for its age, the emission factors, etc.
- The study of renewable-based energy generation equipment on the islands, considering the type of technology and the normal hours of use. The estimation of historical mean use and generation, considering the intermittent nature of renewable energies and the verification of their complete integration in the energy system.
- The study of the fuel type and the suitability for use.
- (a)
- LCV of the fuel used.
- (b)
- GHG production.
- (c)
- Impact on the efficiency of the equipment according to manufacturers.
- (d)
- Price.
- (e)
- Feasibility of incorporation into the system.
- (f)
- Feasibility of adaptability of the equipment.
- The study of the PHES project in Gran Canaria, its integration options, and repercussions for the energy system.
- The selection of suitable combinations for our objective, ranging from the least to most ambitious, and seeking in all cases the most realistic combinations of generation equipment.
- The calculation of the strategic data: GHG emissions, fuel consumption, and the optimized combination of equipment.
- The presentation of results.
4. Nonrenewable Production System Alternatives Depending on the Expansion of Renewable Penetration and Optimization of Existing Equipment
- (a)
- Changes to the fuel type—switching to the use of natural gas in the equipment that allows it. The convenience of using natural gas is twofold: less fuel needs to be used to generate the same amount of electricity, because its LCV is higher than other fuels, and less CO2 is generated per MWh.
- (b)
- Using combinations with the least polluting generation equipment.
- (c)
- Optimizing the integration of the Chira-Soria PHES plant.
4.1. Starting Values in 2019
4.2. Planning of Alternatives for Equipment Operation while Retaining the Current Type of Fuel
4.2.1. Alternative 1 (Table 5): Rearrangement of Power Plants Based on Historical Maximum Annual Production Values—Renewable Penetration of 15.9%

| Technology | Energy Produced (MWh) | GHG Emissions (tCO2eq) | Emission Factor (tCO2eq/MWh) | Fuel Consumption Estimation (t) |
|---|---|---|---|---|
| Steam turbine | 2,045,977.0 | 1,641,421.5 | 0.802 | 512,582.8 |
| Diesel engine | 2,390,736.2 | 1,562,556.1 | 0.654 | 488,206.3 |
| Combined cycle | 3,418,748.0 | 2,052,294.4 | 0.600 | 639,433.0 |
| Renewable (15.9%) | 1,480,634.0 | - | - | - |
| Total | 9,336,095.2 | 5,256,271.9 | 0.563 | 1,640,222.1 |
4.2.2. Alternative 2 (Table 6): Rearrangement of Power Plants Working Exclusively with the Least Polluting Equipment—Renewable Penetration of 15.9%
| Technology | Energy Produced (MWh) | GHG Emissions (tCO2eq) | Emission Factor (tCO2eq/MWh) | Fuel Consumption Estimation (t) |
|---|---|---|---|---|
| Diesel engine | 2,426,720.8 | 1,585,013.5 | 0.653 | 495,218.0 |
| Combined cycle | 5,428,740.4 | 3,259,874.3 | 0.600 | 1,015,678.5 |
| Renewable (15.9%) | 1,480,634.0 | - | - | - |
| Total | 9,336,095.2 | 4,844,887.8 | 0.519 | 1,510,896.4 |
4.2.3. Alternative 3A (Table 7): Rearrangement of Power Plants Working Exclusively with the Least Polluting Equipment and Incorporation of the PHES Chira-Soria Project—Renewable Penetration of 29.1%
| Technology | Energy Produced (MWh) | GHG Emissions (tCO2eq) | Emission Factor (tCO2eq/MWh) | Fuel Consumption Estimation (t) |
|---|---|---|---|---|
| Diesel engine | 2,310,552.6 | 1,512,050.4 | 0.654 | 472,435.9 |
| Combined cycle | 4,307,822.1 | 2,596,890.5 | 0.603 | 809,112.7 |
| Renewable (29.1%) | 2,717,720.5 | - | - | - |
| Total | 9,336,095.2 | 4,108,940.9 | 0.440 | 1,281,548.5 |
4.2.4. Alternative 3B (Table 8): Rearrangement of Power Plants Working Exclusively with the Least Polluting Equipment and Incorporation of the PHES Chira-Soria Project—Renewable penetration of 36.8%
| Technology | Energy Produced (MWh) | GHG Emissions (tCO2eq) | Emission Factor (tCO2eq/MWh) | Fuel Consumption Estimation (t) |
|---|---|---|---|---|
| Diesel engine | 2,243,280.5 | 1,469,798.2 | 0.655 | 459,242.9 |
| Combined cycle | 3,658,707.6 | 2,212,962.0 | 0.605 | 689,492.2 |
| Renewable (36.8%) | 3,434,107.1 | - | - | - |
| Total | 9,336,095.2 | 3,682,760.2 | 0.394 | 1,148,735.1 |
4.3. Consideration of Hypothetical Operation of Equipment by Changing the Current Type of Fuel
4.3.1. Alternative NG-1 (Table 13): Change in Fuel Type, Where Possible, to Natural Gas—Rearrangement of Power Plants Based on Historical Maximum Annual Production Values—Renewable Penetration of 15.9%
| Technology | Energy Produced (MWh) | GHG Emissions (tCO2eq) | Emission Factor (tCO2eq/MWh) | Fuel Consumption Estimation (t) |
|---|---|---|---|---|
| Steam turbine | 2,045,977.0 | 1,205,228.3 | 0.589 | 448,391.4 |
| Diesel engine | 2,390,736.2 | 1,562,554.0 | 0.654 | 488,206.3 |
| Combined cycle | 3,418,748.0 | 1,700,472.5 | 0.497 | 494,837.9 |
| Renewable (15.9%) | 1,480,634.0 | - | - | - |
| Total | 9,336,095.2 | 4,468,254.7 | 0.479 | 1,431,435.6 |
4.3.2. Alternative NG-2 (Table 14): Change in Fuel Type, Where Possible, to Natural Gas—Rearrangement of Power Plants Working Exclusively with the Least Polluting Equipment—Renewable Penetration of 15.9%
| Technology | Energy Produced (MWh) | GHG Emissions (tCO2eq) | Emission Factor (tCO2eq/MWh) | Fuel Consumption Estimation (t) |
|---|---|---|---|---|
| Diesel engine | 2,426,720.8 | 1,585,011.2 | 0.653 | 495,218.0 |
| Combined cycle | 5,428,740.4 | 2,701,038.7 | 0.498 | 786,002.9 |
| Renewable (15.9%) | 1,480,634.0 | - | - | - |
| Total | 9,336,095.2 | 4,286,049.9 | 0.459 | 1,281,220.9 |
4.3.3. Alternative NG-3A (Table 15): Change in Fuel Type, Where Possible, to Natural Gas—Rearrangement of Power Plants Working Exclusively with the Least Polluting Equipment and Incorporation of the PHES Chira-Soria Project—Renewable Penetration of 29.1%
| Technology | Energy Produced (MWh) | GHG Emissions (tCO2eq) | Emission Factor (tCO2eq/MWh) | Fuel Consumption Estimation (t) |
|---|---|---|---|---|
| Diesel engine | 2,310,552.6 | 1,512,048.9 | 0.654 | 472,435.9 |
| Combined cycle | 4,307,822.1 | 2,151,709.3 | 0.499 | 626,147.9 |
| Renewable (29.1%) | 1,480,634.0 | - | - | - |
| Total | 9,336,095.2 | 3,663,758.3 | 0.392 | 1,098,583.8 |
4.3.4. Alternative NG-3B (Table 16): Change in Fuel Type, Where Possible, to Natural Gas—Rearrangement of Power Plants Working Exclusively with the Least Polluting Equipment and Incorporation of the PHES Chira-Soria Project—Renewable Penetration of 36.8%
| Technology | Energy Produced (MWh) | GHG Emissions (tCO2eq) | Emission Factor (tCO2eq/MWh) | Fuel Consumption Estimation (t) |
|---|---|---|---|---|
| Diesel engine | 2,243,280.5 | 1,469,797.0 | 0.655 | 459,242.9 |
| Combined cycle | 3,658,707.6 | 1,833,597.1 | 0.501 | 533,577.2 |
| Renewable (36.78%) | 3,434,107.1 | - | - | - |
| Total | 9,336,095.2 | 3,303,394.1 | 0.354 | 992,820.1 |
5. Discussion
5.1. Summary of Alternatives: Production with Equipment Operating with Normal Fuel
5.2. Summary of Alternatives: Production with Equipment Working with Natural Gas
5.3. Comparison of Alternatives
6. Conclusions
Author Contributions
Funding
Institutional Review Board Statement
Informed Consent Statement
Data Availability Statement
Conflicts of Interest
References
- Berna-Escriche, C.; Vargas-Salgado, C.; Alfonso-Solar, D.; Escrivá-Castells, A. Can a Fully Renewable System with Storage Cost-Effectively Cover the Total Demand of a Big Scale Standalone Grid? Analysis of Three Scenarios Applied to the Grand Canary Island, Spain by 2040. J. Energy Storage 2022, 52, 104774. [Google Scholar] [CrossRef]
- Papadopoulos, A.M. Renewable Energies and Storage in Small Insular Systems: Potential, Perspectives and a Case Study. Renew. Energy 2020, 149, 103–114. [Google Scholar] [CrossRef]
- Uche-Soria, M.; Rodríguez-Monroy, C. Energy Planning and Its Relationship to Energy Poverty in Decision Making. A First Approach for the Canary Islands. Energy Policy 2020, 140, 111423. [Google Scholar] [CrossRef]
- Qiblawey, Y.; Alassi, A.; Zain ul Abideen, M.; Bañales, S. Techno-Economic Assessment of Increasing the Renewable Energy Supply in the Canary Islands: The Case of Tenerife and Gran Canaria. Energy Policy 2022, 162, 112791. [Google Scholar] [CrossRef]
- Schreiber, A.; Stenzel, P.; Marx, J.; Koj, J.; Wulf, C.; Zapp, P. Renewable Energies for Graciosa Island, Azores–Life Cycle Assessment of Electricity Generation 2016. Energy Procedia 2017, 135, 62–74. [Google Scholar]
- Psarros, G.N.; Papathanassiou, S.A. Generation Scheduling in Island Systems with Variable Renewable Energy Sources: A Literature Review. Renew. Energy 2023, 205, 1105–1124. [Google Scholar] [CrossRef]
- Paspatis, A.G.; Fiorentzis, K.; Katsigiannis, I.; Tsikalakis, A.; Karapidakis, E.S.; Thalassinakis, E.J.; Gigantidou, A. Assessment of the Required Running Capacity in Weakly Interconnected Insular Power Systems. Electr. Power Syst. Res. 2023, 221, 109436. [Google Scholar] [CrossRef]
- Vargas-Salgado, C.; Berna-Escriche, C.; Escrivá-Castells, A.; Alfonso-Solar, D. Optimization of the Electricity Generation Mix Using Economic Criteria with Zero-Emissions for Stand-Alone Systems: Case Applied to Grand Canary Island in Spain. Prog. Nucl. Energy 2022, 151, 104329. [Google Scholar] [CrossRef]
- Sigrist, L.; Lobato, E.; Rouco, L.; Gazzino, M.; Cantu, M. Economic Assessment of Smart Grid Initiatives for Island Power Systems. Appl. Energy 2017, 189, 403–415. [Google Scholar] [CrossRef]
- Guerrero-Lemus, R.; González-Díaz, B.; Ríos, G.; Dib, R.N. Study of the New Spanish Legislation Applied to an Insular System That Has Achieved Grid Parity on PV and Wind Energy. Renew. Sustain. Energy Rev. 2015, 49, 426–436. [Google Scholar] [CrossRef]
- Matsumoto, K.; Matsumura, Y. Challenges and Economic Effects of Introducing Renewable Energy in a Remote Island: A Case Study of Tsushima Island, Japan. Renew. Sustain. Energy Rev. 2022, 162, 112456. [Google Scholar] [CrossRef]
- Killol, A.; Reddy, N.; Paruvada, S.; Murugan, S. Experimental Studies of a Diesel Engine Run on Biodiesel N-Butanol Blends. Renew. Energy 2019, 135, 687–700. [Google Scholar] [CrossRef]
- Vargas-Salgado, C.; Águila-León, J.; Alfonso-Solar, D.; Malmquist, A. Simulations and Experimental Study to Compare the Behavior of a Genset Running on Gasoline or Syngas for Small Scale Power Generation. Energy 2022, 244, 122633. [Google Scholar] [CrossRef]
- Katsaprakakis, D.A. Hybrid Power Plants in Non-Interconnected Insular Systems. Appl. Energy 2016, 164, 268–283. [Google Scholar] [CrossRef]
- Katsaprakakis, D.; Dakanali, I. Comparing Electricity Storage Technologies for Small Insular Grids. Energy Procedia 2019, 159, 84–89. [Google Scholar] [CrossRef]
- Colmenar-Santos, A.; Linares-Mena, A.-R.; Borge-Diez, D.; Quinto-Alemany, C.-D. Impact Assessment of Electric Vehicles on Islands Grids: A Case Study for Tenerife (Spain). Energy 2017, 120, 385–396. [Google Scholar] [CrossRef]
- Mostafaeipour, A.; Bidokhti, A.; Fakhrzad, M.-B.; Sadegheih, A.; Zare Mehrjerdi, Y. A New Model for the Use of Renewable Electricity to Reduce Carbon Dioxide Emissions. Energy 2022, 238, 121602. [Google Scholar] [CrossRef]
- Hamilton, J.; Negnevitsky, M.; Wang, X. The Role of Modified Diesel Generation within Isolated Power Systems. Energy 2022, 240, 122829. [Google Scholar] [CrossRef]
- Hamilton, J.; Negnevitsky, M.; Wang, X. The Potential of Variable Speed Diesel Application in Increasing Renewable Energy Source Penetration. Energy Procedia 2019, 160, 558–565. [Google Scholar] [CrossRef]
- Mustayen, A.G.M.B.; Rasul, M.G.; Wang, X.; Negnevitsky, M.; Hamilton, J.M. Remote Areas and Islands Power Generation: A Review on Diesel Engine Performance and Emission Improvement Techniques. Energy Convers. Manag. 2022, 260, 115614. [Google Scholar] [CrossRef]
- Arévalo, P.; Cano, A.; Jurado, F. Mitigation of Carbon Footprint with 100% Renewable Energy System by 2050: The Case of Galapagos Islands. Energy 2022, 245, 123247. [Google Scholar] [CrossRef]
- Arévalo, P.; Eras-Almeida, A.A.; Cano, A.; Jurado, F.; Egido-Aguilera, M.A. Planning of Electrical Energy for the Galapagos Islands Using Different Renewable Energy Technologies. Electr. Power Syst. Res. 2022, 203, 107660. [Google Scholar] [CrossRef]
- Gobierno de Canarias. Anuario Energético de Canarias 2019; Consejería de Transición Ecológica Lucha contra el cambio climático y Planificación Territorial; Gobierno de Canarias: Las Palmas, Spain, 2020. [Google Scholar]
- Gkonis, N.; Arsenopoulos, A.; Stamatiou, A.; Doukas, H. Multi-Perspective Design of Energy Efficiency Policies under the Framework of National Energy and Climate Action Plans. Energy Policy 2020, 140, 111401. [Google Scholar] [CrossRef]
- Goudarzi, A.; Swanson, A.G.; Van Coller, J.; Siano, P. Smart Real-Time Scheduling of Generating Units in an Electricity Market Considering Environmental Aspects and Physical Constraints of Generators. Appl. Energy 2017, 189, 667–696. [Google Scholar] [CrossRef]
- Gómez-Calvet, R.; Martínez-Duart, J.M.; Serrano-Calle, S. Current State and Optimal Development of the Renewable Electricity Generation Mix in Spain. Renew. Energy 2019, 135, 1108–1120. [Google Scholar] [CrossRef]
- Pombo, D.V.; Martinez-Rico, J.; Spataru, S.V.; Bindner, H.W.; Sørensen, P.E. Decarbonizing Energy Islands with Flexibility-Enabling Planning: The Case of Santiago, Cape Verde. Renew. Sustain. Energy Rev. 2023, 176, 113151. [Google Scholar] [CrossRef]
- Lobato, E.; Sigrist, L.; Rouco, L. Value of Electric Interconnection Links in Remote Island Power Systems: The Spanish Canary and Balearic Archipelago Cases. Int. J. Electr. Power Energy Syst. 2017, 91, 192–200. [Google Scholar] [CrossRef]
- Red Eléctrica España Emisiones de CO2 Asociadas a La Generación de Electricidad En España 2021; Red Electrica de España: Alcobendas, Spain, 2021.
- IPCC. IPCC, 2014: Climate Change 2014: Synthesis Report. Contribution of Working Groups I, II and III to the Fifth Assessment Report of the Intergovernmental Panel on Climate Change; Intergovernmental Panel on Climate Change: Geneva, Switzerland, 2015.
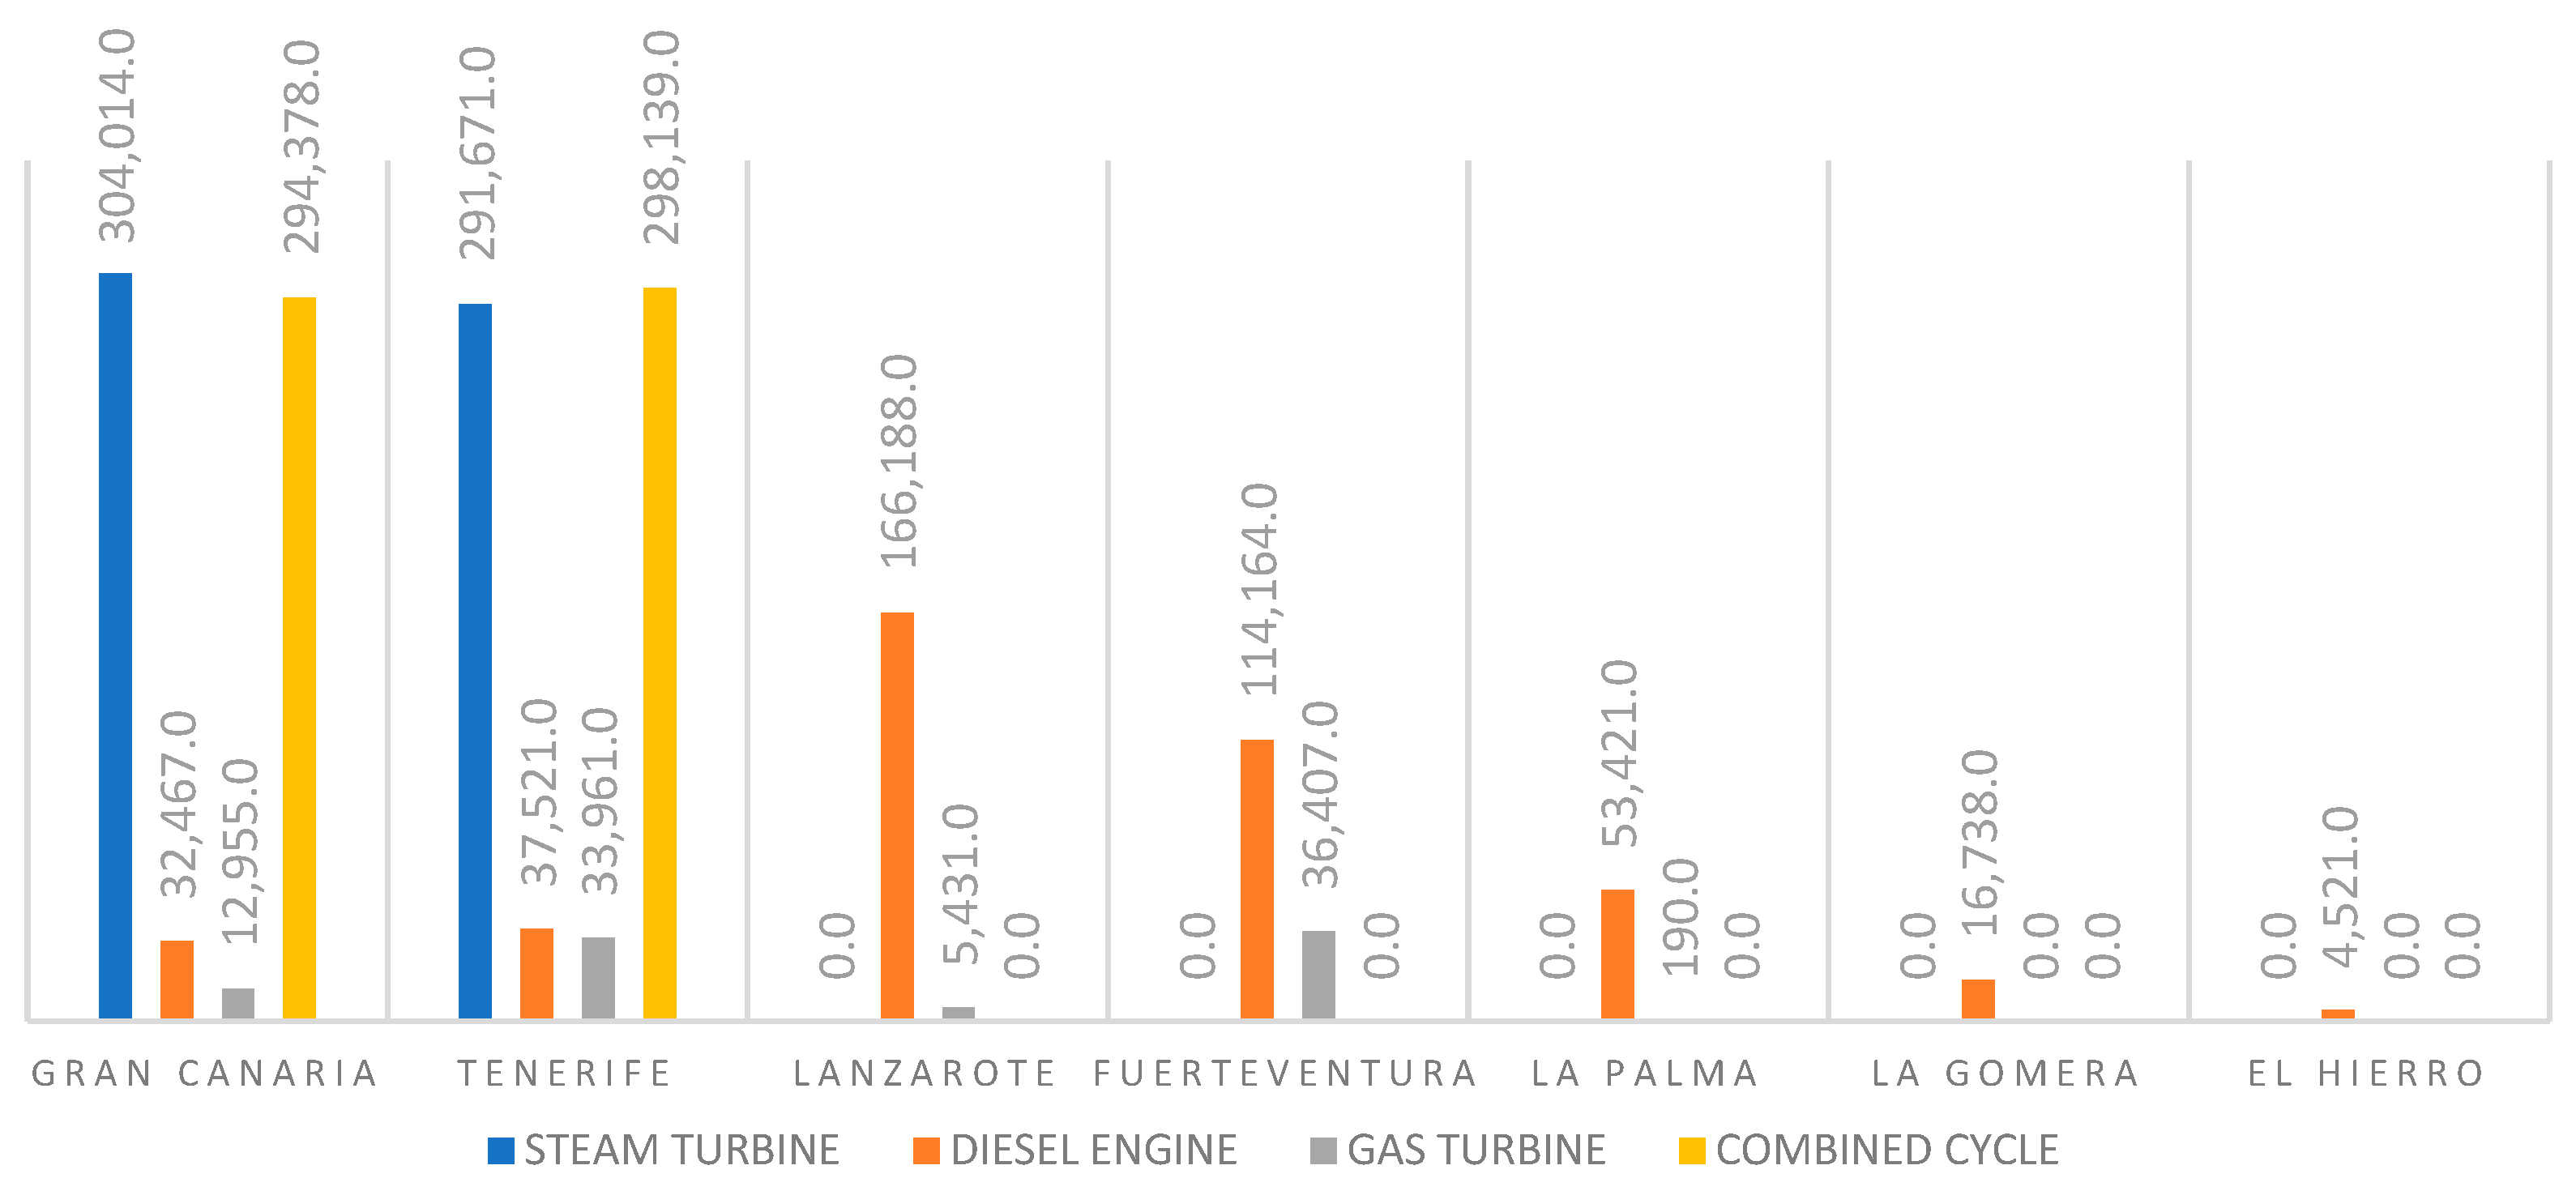
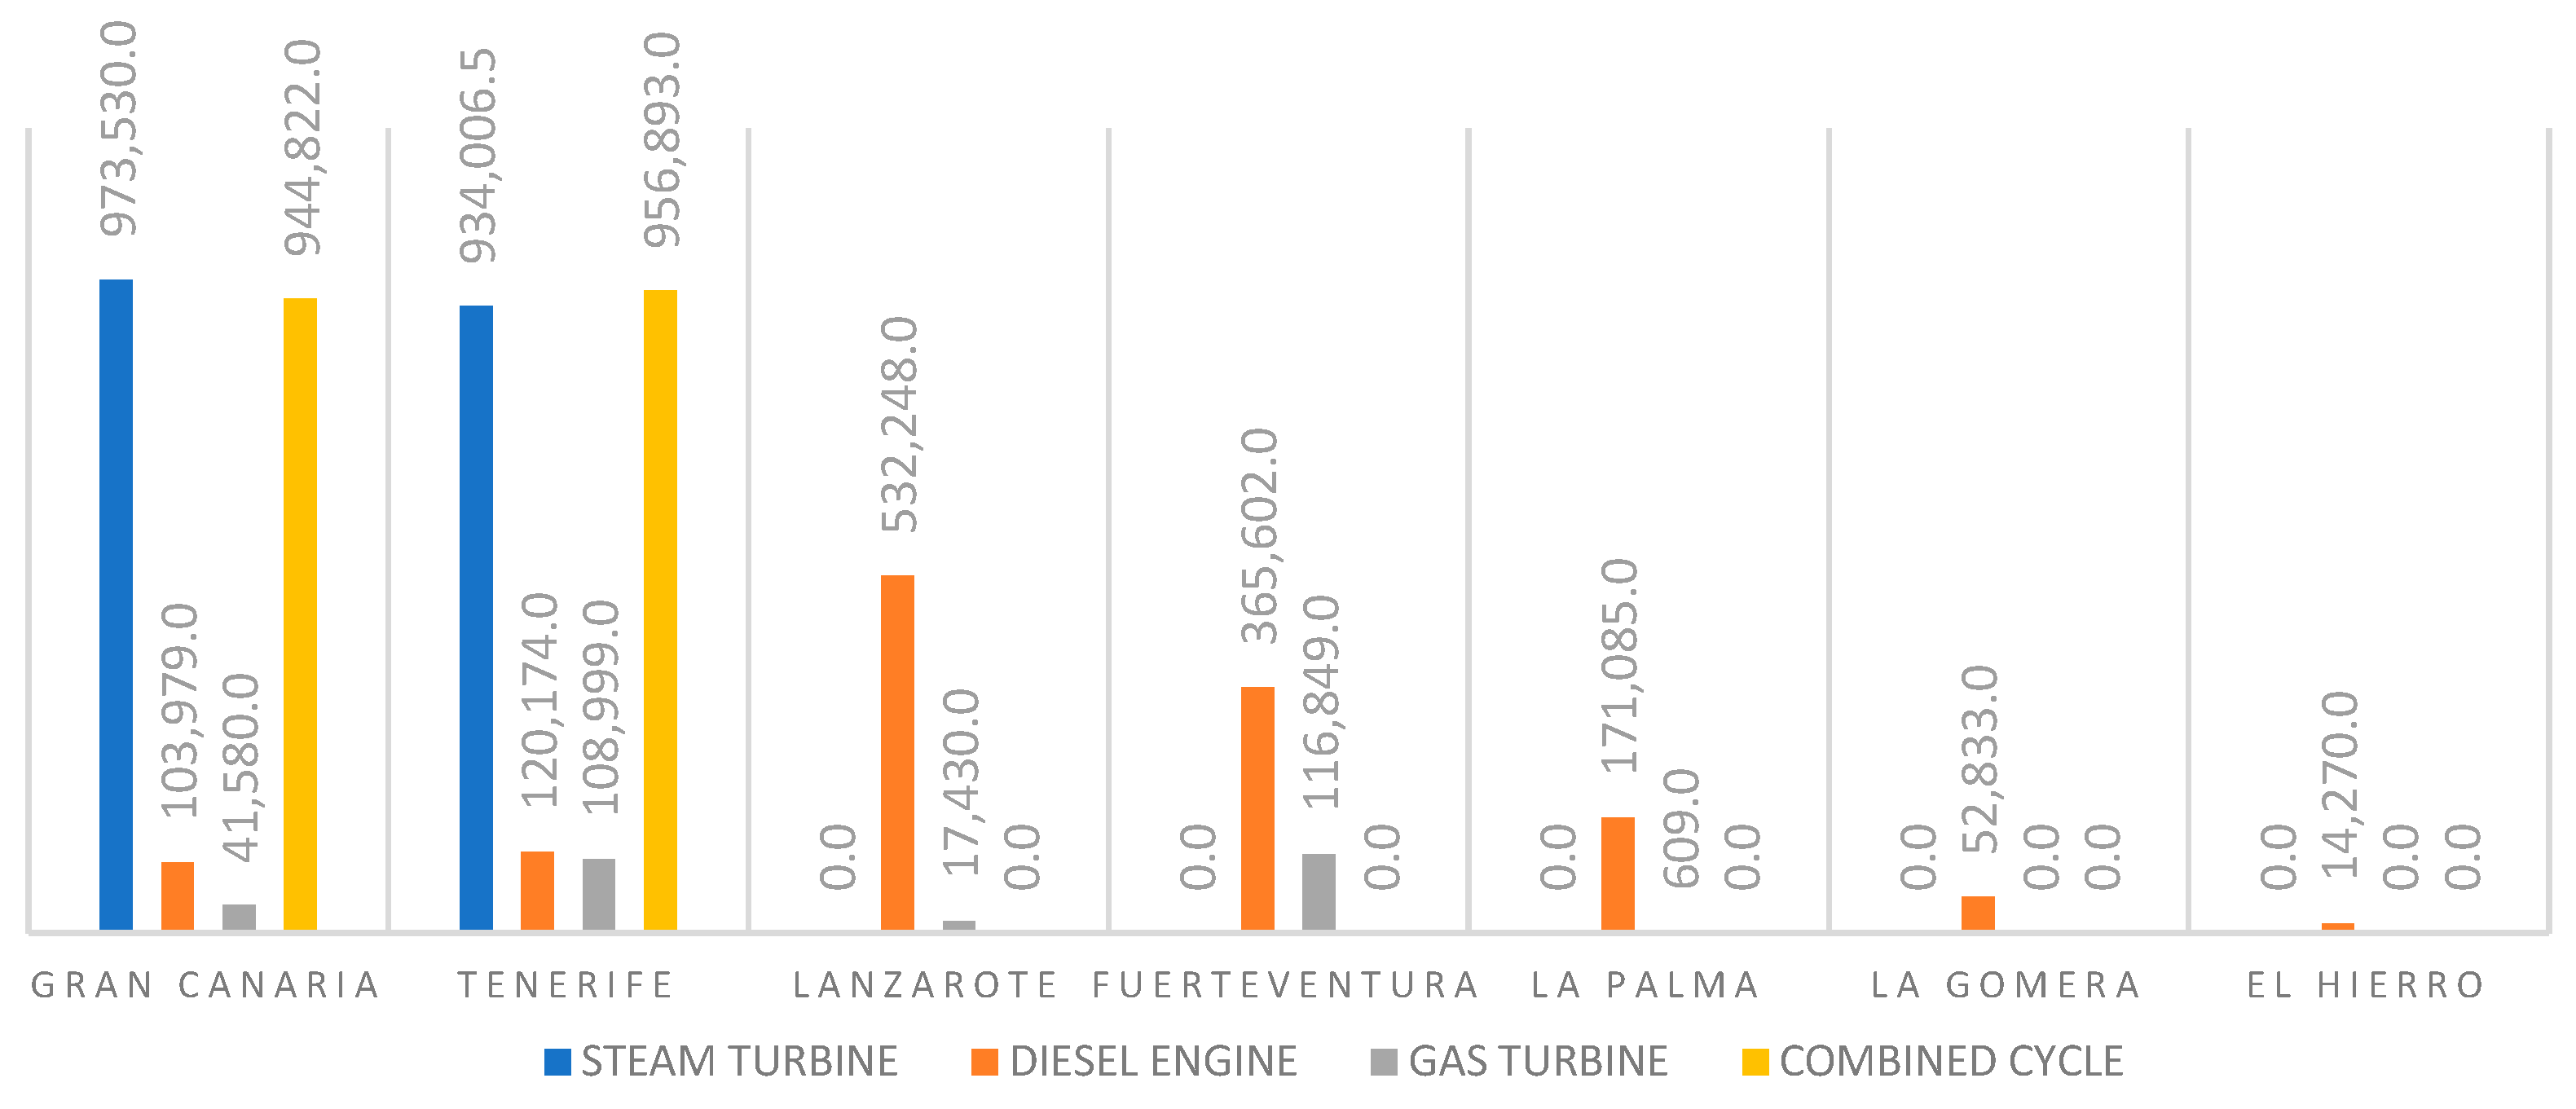


| Technology | Gran Canaria | Tenerife | Lanzarote | Fuerteventura | La Palma | La Gomera | El Hierro | Total |
|---|---|---|---|---|---|---|---|---|
| Steam turbine | 1,233,316 | 1,146,979 | 2,380,295 | |||||
| Diesel engine | 1,657,552 | 192,784 | 813,663 | 552,146 | 251,332 | 76,696 | 20,738 | 2,072,911 |
| Gas turbine | 31,758 | 105,645 | 12,791 | 841,585 | 603 | 235,382 | ||
| Combined cycle | 1,597,427 | 1,569,446 | 3,166,873 | |||||
| Renewable | 553,880 | 696,096 | 79,623 | 80,108 | 29,081 | 154 | 41,692 | 1,480,634 |
| Total | 3,581,933 | 3,710,950 | 906,077 | 716,839 | 281,016 | 76,850 | 62,430 | 9,336,095 |
| Technology | Gran Canaria | Tenerife | Lanzarote | Fuerteventura | La Palma | La Gomera | El Hierro | Total |
|---|---|---|---|---|---|---|---|---|
| Steam turbine | 280.00 | 240.00 | 520.00 | |||||
| Diesel engine | 84.00 | 84.00 | 166.76 | 107.92 | 82.84 | 21.17 | 14.91 | 564.60 |
| Gas turbine | 173.45 | 265.70 | 62.50 | 79.10 | 22.50 | 603.25 | ||
| Combined cycle | 461.73 | 456.80 | 918.53 | |||||
| Refinery-Cogen. | 24.88 | 65.10 | 89.98 | |||||
| Renewable | 199.92 | 314.54 | 32.41 | 41.42 | 12.18 | 0.37 | 623.67 | |
| Total | 1223.98 | 1426.14 | 264.67 | 228.44 | 117.52 | 21.54 | 22.83 | 3320.03 |
| Technology | Fuel Consumption (t) | Greenhouse Gas Emissions (tCO2eq) | ||||||
|---|---|---|---|---|---|---|---|---|
| Fuel Oil | Gas Oil | Diesel Oil | Total | Fuel Oil | Gas Oil | Diesel Oil | Total | |
| Steam turbine | 595,170 | 515 | - | 595,685 | 1,905,884 | 1652 | 1,907,536 | |
| Diesel engine | 384,935 | 18,826 | 21,259 | 425,020 | 1,232,665 | 60,423 | 67,103 | 1,360,191 |
| Gas turbine | - | 88,944 | - | 88,944 | - | 285,467 | 285,467 | |
| Combined cycle | - | 592,517 | - | 592,517 | - | 1,901,715 | 1,901,715 | |
| Total | 980,105 | 700,802 | 21,759 | 1,702,166 | 3,138,549 | 2,249,257 | 67,103 | 5,454,909 |
| Island | Date | Hour | MW |
|---|---|---|---|
| Gran Canaria | 2 October | 20:58 | 537.00 |
| Tenerife | 2 October | 20:21 | 576.00 |
| Lanzarote | 31 December | 19:06 | 139.00 |
| Fuerteventura | 17 August | 20:53 | 113.00 |
| La Palma | 19 August | 21:36 | 43.00 |
| La Gomera | 17 August | 21:59 | 12.10 |
| El Hierro | 20 August | 21:27 | 8.10 |
| Fuel Type | Higher Calorific Value (HCV) (kcal/kg) | Lower Calorific Value (LCV) (kcal/kg) |
|---|---|---|
| Fuel | 10,430.00 | 9850.00 |
| Diesel | 9265.00 | 8713.00 |
| Diesel oil | 10,790.00 | 10,140.00 |
| Natural gas | 12,474.00 | 11,259.00 |
| Technology | Fuel Consumption (t) | ||||
|---|---|---|---|---|---|
| Natural Gas | Fuel | Oil | Diesel Oil | Total | |
| Steam turbine | 521,086.4 | - | - | - | 521,086.4 |
| Diesel engine | - | 384,935.0 | 18,826.0 | 21,259.0 | 425,020.0 |
| Gas turbine | 68,831.1 | - | - | - | 68,831.1 |
| Combined cycle | 458,531.0 | - | - | - | 458,531.0 |
| Total | 1,048,448.5 | 384,935.0 | 18,826.0 | 21,759.0 | 1,473,468.5 |
| Technology | GHG Emissions (tCO2eq) | ||||
|---|---|---|---|---|---|
| Natural Gas | Fuel | Oil | Diesel Oil | Total | |
| Steam turbine | 1,400,625.8 | - | - | - | 1,400,625.8 |
| Diesel engine | - | 1,232,665.0 | 60,423.0 | 67,103.0 | 1,360,191.0 |
| Gas turbine | 236,529.8 | - | - | - | 236,529.8 |
| Combined cycle | 1,575,706.7 | - | - | - | 1,575,706.7 |
| Total | 3,212,862.3 | 1,232,665.0 | 60,423.0 | 67,103.0 | 4,573,053.3 |
| GHG Emissions (tCO2eq) | Emission Factor (tCO2eq/MWh) | Fuel Consumption Estimation (t) |
|---|---|---|
| 4,573,053.30 | 0.490 | 1,473,468.48 |
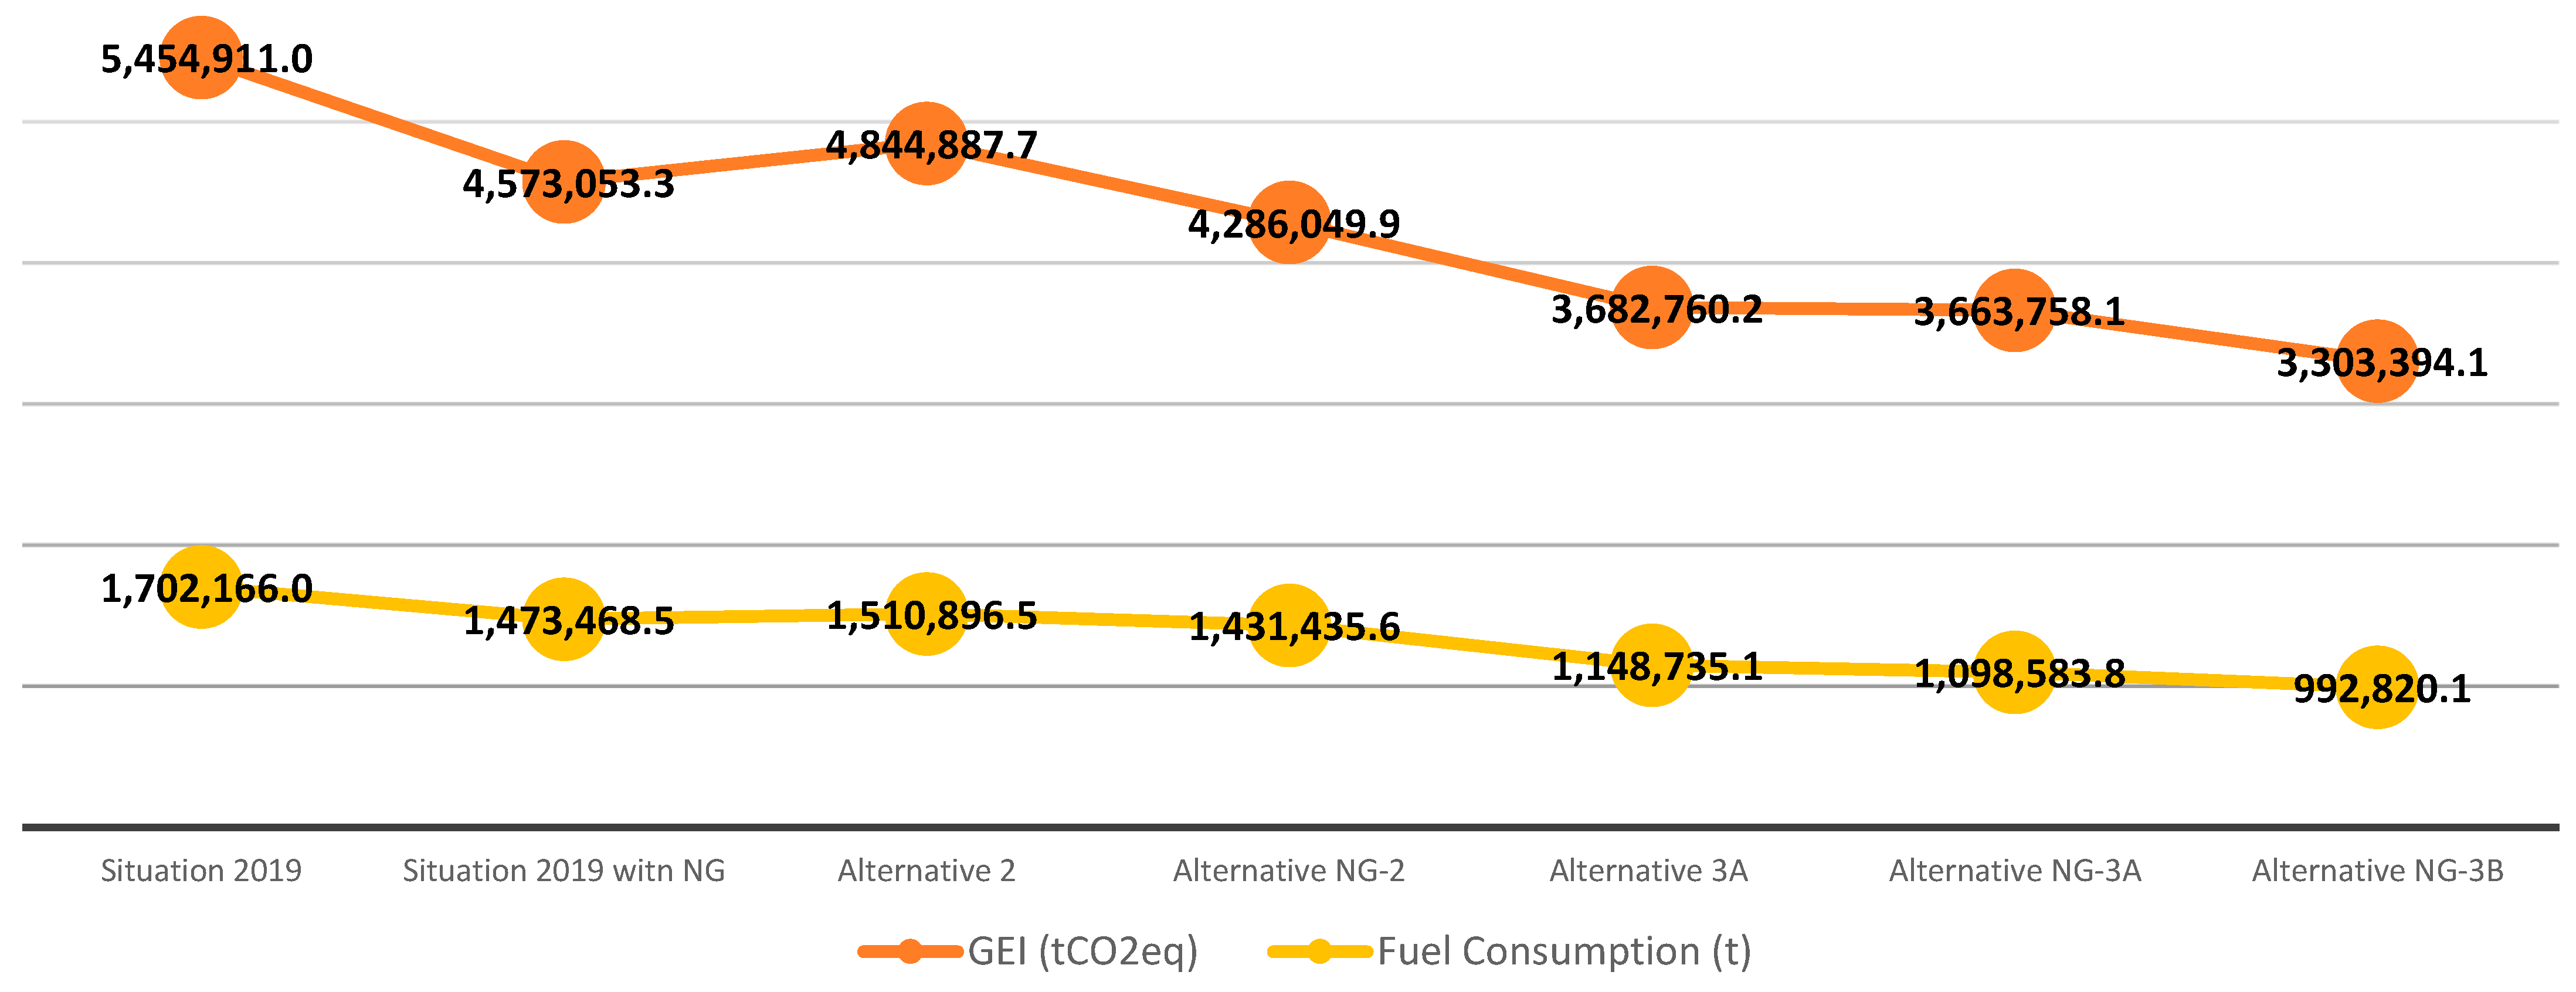
| 2019 Starting Point and Alternatives | % Renewable Penetration | Greenhouse Gas Emissions (tCO2eq) | Emission Factor (tCO2eq/MWh) | Fuel Consumption Estimation (t) | % Improvement |
|---|---|---|---|---|---|
| 2019 | 15.86% | 5,454.,11 | 0.58 | 1,702,166 | - |
| 1 | 15.86% | 5,256,271 | 0.56 | 1,640,222 | −3.8% |
| 2 | 15.86% | 4,844,887 | 0.52 | 1,510,896 | −12.6% |
| 3A | 29.11% | 4,108,940 | 0.44 | 1,281,548 | −32.8% |
| 3B | 36.78% | 3,682,760 | 0.39 | 1,148,735 | −48.1% |
| 2019 Starting Point and Alternatives | % Renewable Penetration | Greenhouse Gas Emissions (tCO2eq) | Emission Factor (tCO2eq/MWh) | Fuel Consumption Estimation (t) | % Improvement |
|---|---|---|---|---|---|
| 2019 | 15.86% | 5,454,911 | 0.58 | 1,702,166.00 | - |
| NG 2019 | 15.86% | 4,573,053 | 0.49 | 1,473,468.48 | - |
| NG-1 | 15.86% | 4,468,254 | 0.48 | 1,431,435.58 | −2.3% |
| NG-2 | 15.86% | 4,286,049 | 0.46 | 1,281,220.92 | −6.7% |
| NG-3A | 29.11% | 3,663,758 | 0.39 | 1,098,583.77 | −24.8% |
| NG-3B | 36.78% | 3,303,394 | 0.35 | 992,820.10 | −38.4% |
| Factor | Alternative 2 | Alternative NG-2 | Alternative 3A | Alternative NG-3A | Alternative NG-3B |
|---|---|---|---|---|---|
| Execution time | Immediate | Medium | Medium/High | Medium/High | Medium/High |
| Economic cost | Minimal | Medium | Medium/High | Medium/High | Medium/High |
| Reduction in total GHG emissions (tCO2eq) | 12.59% | 22.08% | 32.76% | 48.89% | 65.13% |
| Reduction in fuel consumption (t) | 12.66% | 18.91% | 32.82% | 54.94% | 71.45% |
| Renewable penetration | 15.86% | 15.86% | 29.11% | 29.11% | 36.78% |
Disclaimer/Publisher’s Note: The statements, opinions and data contained in all publications are solely those of the individual author(s) and contributor(s) and not of MDPI and/or the editor(s). MDPI and/or the editor(s) disclaim responsibility for any injury to people or property resulting from any ideas, methods, instructions or products referred to in the content. |
© 2024 by the authors. Licensee MDPI, Basel, Switzerland. This article is an open access article distributed under the terms and conditions of the Creative Commons Attribution (CC BY) license (https://creativecommons.org/licenses/by/4.0/).
Share and Cite
Lozano Medina, J.C.; Perez-Baez, S.; Leon-Zerpa, F.; Mendieta-Pino, C.A. Alternatives for the Optimization and Reduction in the Carbon Footprint in Island Electricity Systems (IESs). Sustainability 2024, 16, 1214. https://doi.org/10.3390/su16031214
Lozano Medina JC, Perez-Baez S, Leon-Zerpa F, Mendieta-Pino CA. Alternatives for the Optimization and Reduction in the Carbon Footprint in Island Electricity Systems (IESs). Sustainability. 2024; 16(3):1214. https://doi.org/10.3390/su16031214
Chicago/Turabian StyleLozano Medina, Juan Carlos, Sebastian Perez-Baez, Federico Leon-Zerpa, and Carlos A. Mendieta-Pino. 2024. "Alternatives for the Optimization and Reduction in the Carbon Footprint in Island Electricity Systems (IESs)" Sustainability 16, no. 3: 1214. https://doi.org/10.3390/su16031214
APA StyleLozano Medina, J. C., Perez-Baez, S., Leon-Zerpa, F., & Mendieta-Pino, C. A. (2024). Alternatives for the Optimization and Reduction in the Carbon Footprint in Island Electricity Systems (IESs). Sustainability, 16(3), 1214. https://doi.org/10.3390/su16031214