Article

Operational Optimization of Regional Integrated Energy Systems with Heat Pumps and Hydrogen Renewable Energy under Integrated Demand Response

College of Civil Engineering, Taiyuan University of Technology, Taiyuan 030024, China
*
Author to whom correspondence should be addressed.
Sustainability 2024, 16(3), 1217; https://doi.org/10.3390/su16031217
Submission received: 24 December 2023 / Revised: 15 January 2024 / Accepted: 29 January 2024 / Published: 31 January 2024

Abstract

:
A regional integrated energy system (RIES), synergizing multiple energy forms, is pivotal for enhancing renewable energy use and mitigating the greenhouse effect. Considering that the equipment of the current regional comprehensive energy system is relatively simple, there is a coupling relationship linking power generation, refrigeration, and heating in the cogeneration system, which is complex and cannot directly meet various load demands. This article proposes a RIES optimization model for bottom-source heat pumps and hydrogen storage systems in the context of comprehensive demand response. First, P2G electric hydrogen production technology was introduced into RIES to give full play to the high efficiency advantages of hydrogen energy storage system, and the adjustable thermoelectric ratio of the HFC was considered. The HFC could adjust its own thermoelectric ratio according to the system load and unit output. Second, through the ground-source heat pump’s cleaning efficiency function, further separation and cooling could be achieved. The heat and electrical output of RIES improved the operating efficiency of the system. Thirdly, a comprehensive demand response model for heating, cooling, and electricity was established to enable users to reasonably adjust their own energy use strategies to promote the rational distribution of energy in the system. The model integrates power-to-gas (P2G) technology, leveraging the tunable thermoelectric ratio of a hydrogen fuel cell (HFC) to optimize the generation of electricity and heat while maximizing the efficiency of the hydrogen storage system. Empirical analysis substantiated the proposed RIES model’s effectiveness and economic benefits when integrating ground-source HP and electric hydrogen production with IDR. Compared with the original model, the daily operating cost of the proposed model was reduced by RMB 1884.16.

1. Introduction

In the context of dwindling traditional energy reserves and escalating environmental challenges, the pursuit of clean energy and enhanced energy efficiency has become paramount for the future direction of the global energy industry, a priority underscored by the scholarly discourse [1]. Integrated energy systems (IES) are increasingly playing a role in promoting local sustainable development and integrating renewable energy use, a strength supported by policies for sustainable development and the promotion of renewable energy use [2,3]. The RIES, emblematic of user-side multi-energy coupling systems, incorporates an array of energy conversion technologies, including combined cooling, heating, and power (CCHP); power-to-gas (P2G); and energy storage systems (ESSs). These technologies are designed to enable a cohesive operation across electricity, heating (cooling), and gas modalities [4], thereby enhancing the efficiency of renewable energy consumption and reducing the environmental impact.
Hydrogen, as a versatile and clean secondary energy carrier, emerges as a key facilitator in bridging the gap between renewable energy and traditional fossil fuel systems [5]. Its ease of conversion into electricity and heat, coupled with its high conversion efficiency and various production pathways, positions hydrogen as a formidable candidate in the renewable energy landscape. Combining natural gas with P2G technology, the application of P2G technology to compensate for intermittency of the power grid on islands was studied, and the diversity of P2G technology applications was expanded [6]. Nazari-Heris [7] indicated that combination of P2G technology and demand response (DR) improved the high permeability of wind turbines. Thus, the operating cost of the system was lowest, social welfare was maximized, and carbon dioxide emissions were reduced. Analyses integrating P2G with carbon trading mechanisms into heating networks suggested economic and environmental benefits, transforming surplus electrical energy into hydrogen and then into natural gas [8]. Additionally, a new decision-making framework for electricity markets that incorporates photovoltaic (PV)-integrated hydrogen storage within RIESs has been proposed [9]. However, these studies generally limit their focus to the role of hydrogen storage without exploring its broader applications. Zhang et al. [10] presented an IES model that considered both carbon capture technology and P2G, where P2G captured surplus electricity from renewable sources, and carbon capture technology sequestered system-generated carbon dioxide (CO2), and the application of the P2G system to carbon dioxide was pointed out. Alessandra [11] combined P2G technology with the ESS of solid oxide coelectrolytic cells (EC) and high-temperature methanators and conducted a comprehensive technical and economic evaluation. Xin et al. [12] integrated P2G with carbon capture and storage (CCS) in interconnected energy systems and observed a 2.72% reduction in CO2 emissions, enhancing the utilization of wind power. Alessandra and Xin collectively suggested substantial economic and environmental benefits from P2G implementation in RIESs, primarily focusing on conversion from electricity to natural gas. Nevertheless, there has been limited exploration of the electric hydrogen production phase, particularly the benefits of the tunable thermoelectric ratio of a hydrogen fuel cell (HFC) in the RIES.
Furthermore, as systems’ operators and end users pay more and more attention to energy conservation, there have been more studies devoted to increasing the resilience of independent IES [13], which lays the foundation for the following RIES DR, and demand response (DR) technology is becoming increasingly relevant. DR contributes to peak shaving and load shifting, smoothing the load curve, and reducing both the system’s costs and the retailer’s risks, as widely documented in power system applications [14]. The DR mechanism is typically bifurcated into price-based and incentive-based responses [15,16], each playing a strategic role in energy management and the system’s efficiency.
Simulations across various scenarios in Ali et al. [17] examined the impact of differing DR levels, the integration of renewable energy, and capacity payments, confirming that DR can enhance renewable energy uptake and reduce CO2 emissions. Rezaee et al. [18] built the heating network model and a mathematical model of P2G, and introduced the carbon trading mechanism into it, taking the minimum operating cost as the objective function to verify the economy of P2G. Jeseok and Jinho [19] outlined a DR participation strategy that offered high profit potential, albeit with considerable uncertainty, and presented a non-cooperative game model to mitigate this uncertainty through trading surplus power from ESS. However, these investigations largely focused on the traditional electrical DR and did not account for the subjective nature of human perceptions of temperature changes. Adjusting temperatures within a certain threshold generally does not significantly impact human comfort. Zhang et al. [20] utilized Monte Carlo simulation to evaluate the reliability of an electric heat pump (HP) heating system, illustrating its significant impact on the power grid’s safety and the system’s overall reliability. Linfei and Min [21] considered an IES with a distributed ground-source HP for heat storage and carbon recapture devices, showing that such a system could reduce carbon emissions by at least 82.02% from conventional levels. Linfei et al. [22] developed an optimal scheduling model for a distributed ground-source HP heat storage system, indicating reductions in waste and economic costs over traditional systems. However, they did not explore the potential advantages of combining HP with P2G in a RIES to enhance cold thermoelectric production in the system, leaving the energy-saving potential of HP with P2G in this configuration largely untested. A comparative analysis of appellate literature and this paper is shown in Table 1. Abbreviations of all devices and parameters used in this paper are shown in Table 2.
This study sought to address this gap by examining the inclusion of ground-source HP and hydrogen ESS, coupled with a cold, heat, and electricity IDR optimization model that accounted for dynamic electricity pricing and the human body’s variable temperature perception. The research pivoted from a single-user perspective to a multi-agent system at the source side, with the aim of meeting the users’ energy needs while reducing costs within the RIES. An example is provided to demonstrate the model’s effectiveness. The study’s main contributions are as follows:
(1)
Introducing an IDR into RIES that considers the human body’s delayed and subjective temperature perception, proposing an optimization method for the operation of the RIES that includes IDR.
(2)
Incorporating a refined P2G electric hydrogen production model with an adjustable thermoelectric ratio to support the RIES’s transition from traditional fossil fuels to RESs.
(3)
Including the ground-source HP as conversion equipment in the traditional RIES and conducting a comparative analysis to confirm the model’s economic and energy-saving benefits.

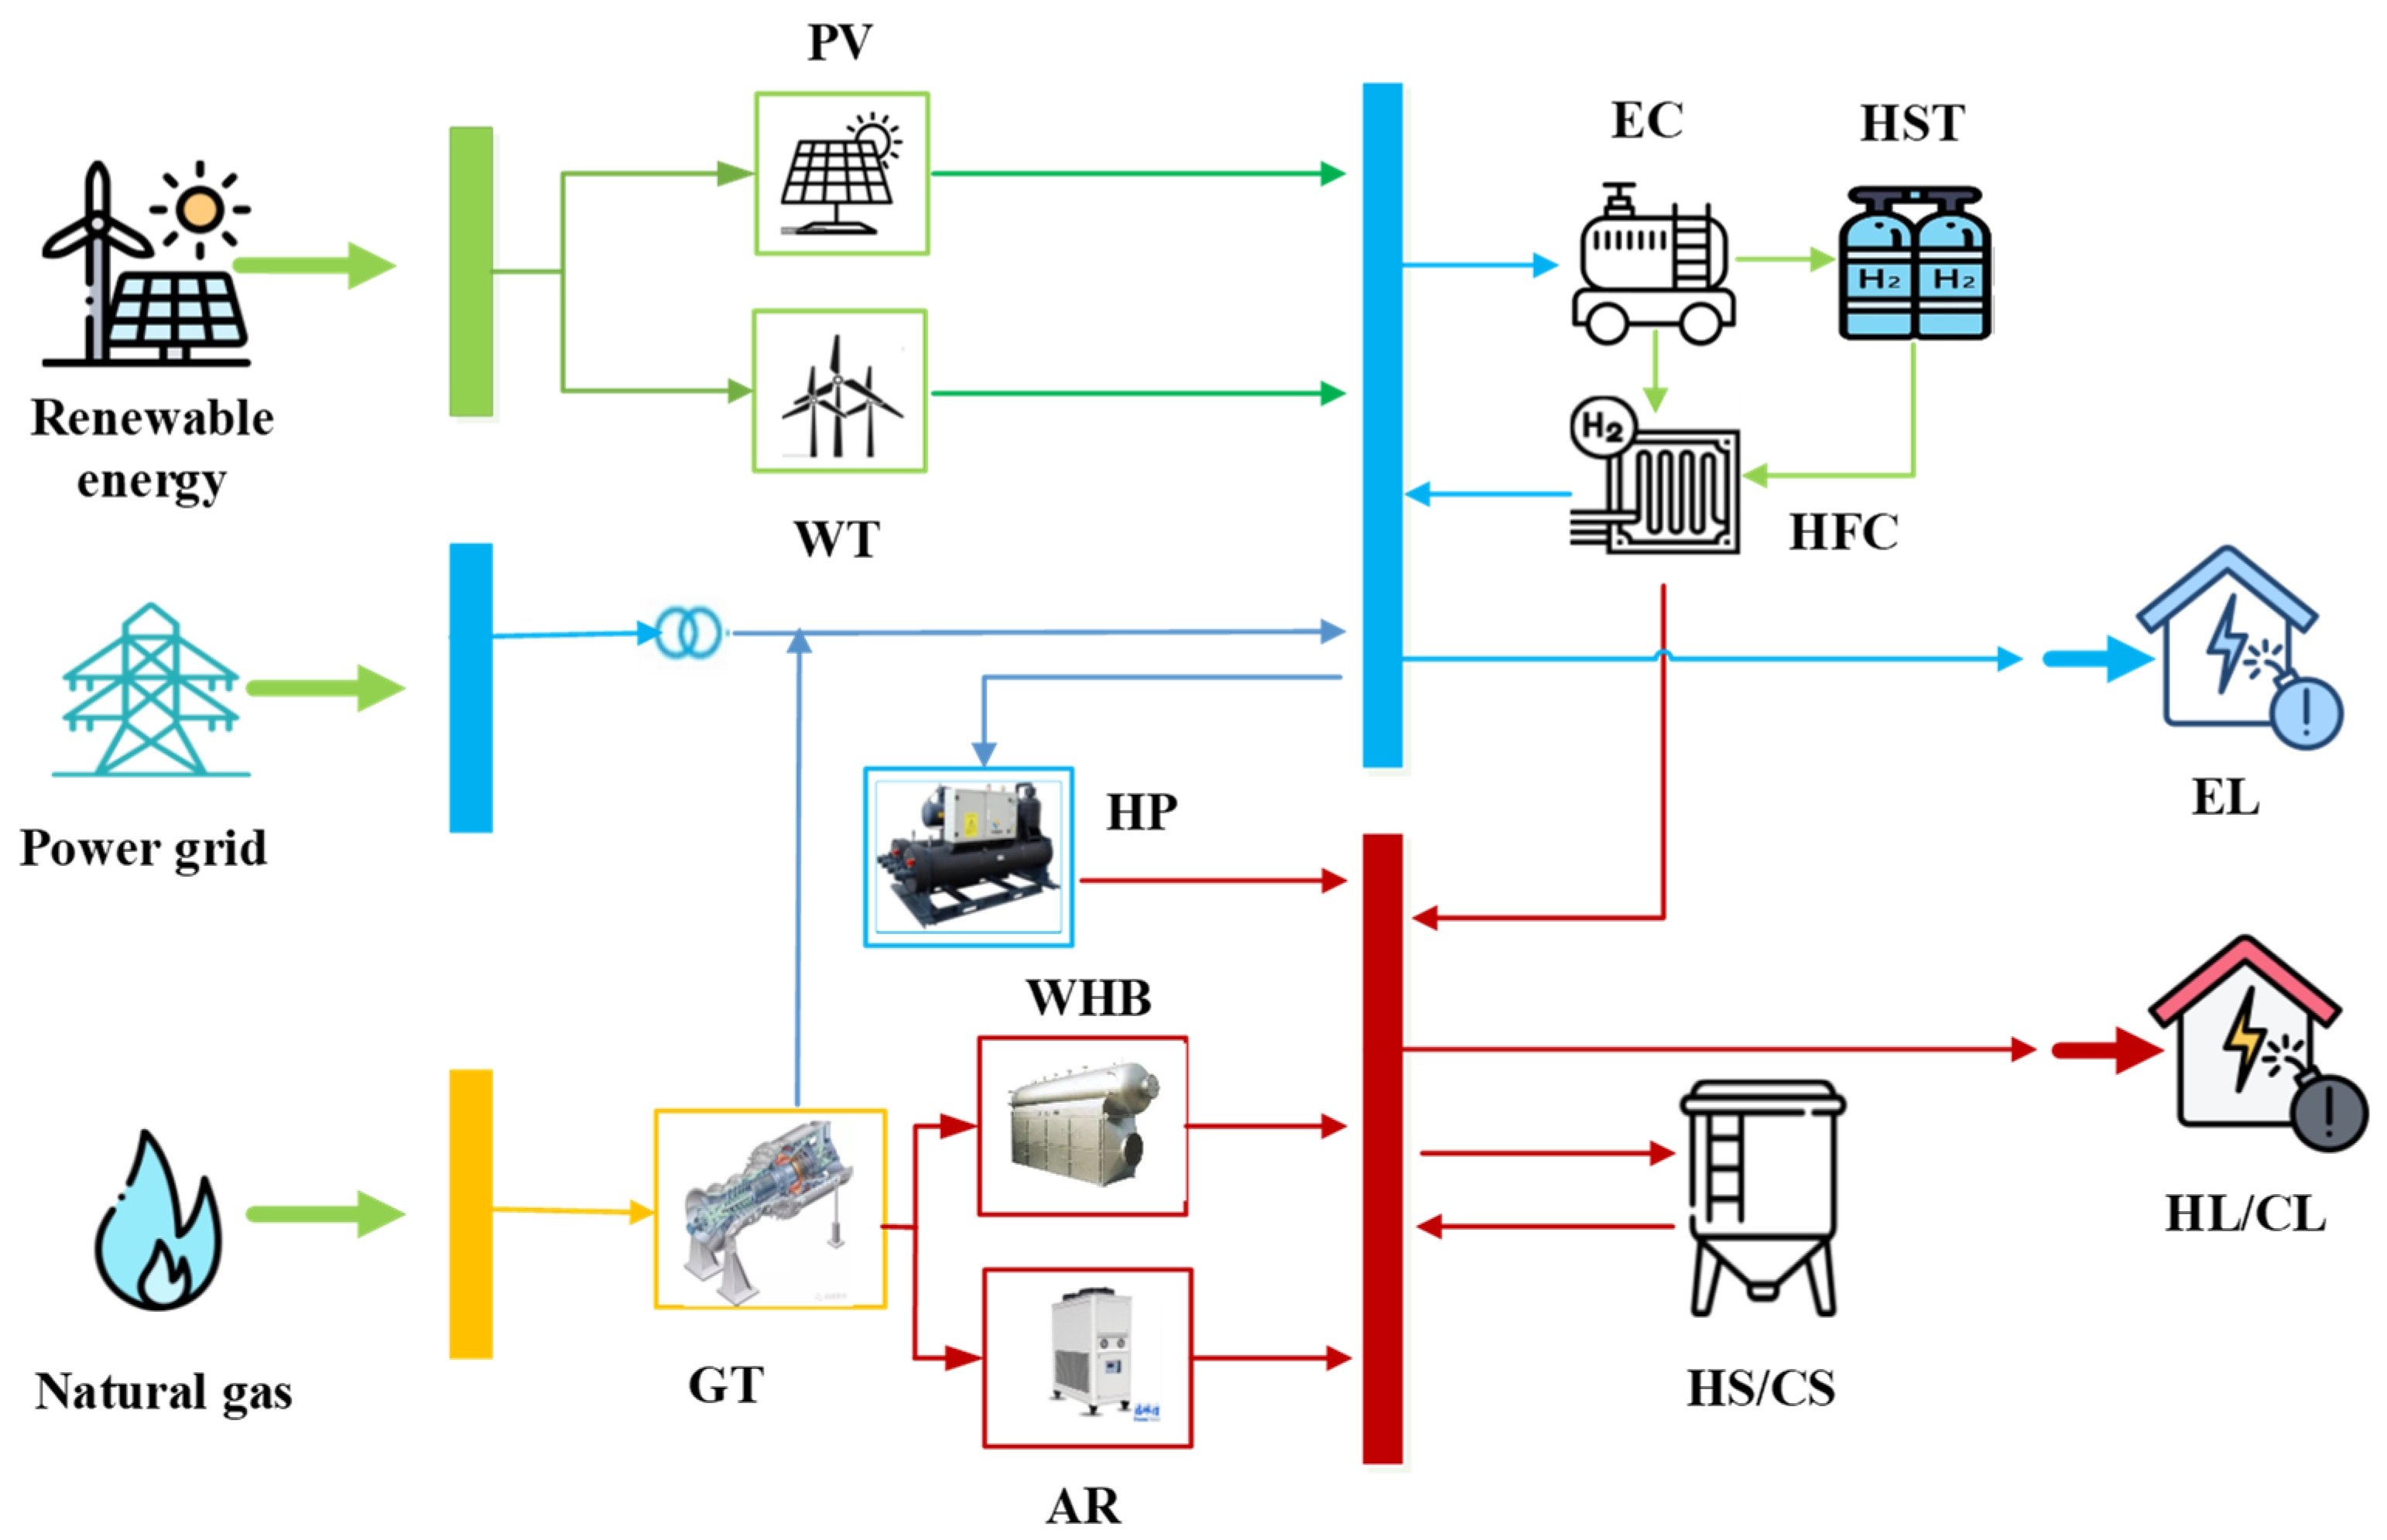
2. The RIES’ Structure and IDR Model

2.1. The RIES Framework

The architecture of the cogeneration microgrid, as proposed in this study, integrates HP and electric hydrogen production technologies. This model, depicted in Figure 1, delineates four principal energy streams: electricity, heat, cold, and gas [23]. The framework comprises the following:
(1)
Renewable energy units: these include wind turbines (WT) and PV panels, which harness wind and solar energy for generating power.
(2)
Energy conversion devices: this category encompasses a suite of technologies such as gas turbines (GT), ground-source HP units, waste heat boilers (WHB), absorption refrigerators (AR), EC, and HFC, each contributing to the system’s ability to convert energy from one form to another.
(3)
Energy storage devices: the system incorporates a hydrogen storage tank (HST) for hydrogen retention and a combined heat and cold storage tank (HS/CS) to maintain thermal energy reserves.
(4)
Load side components: the demand side includes the electrical load (EL), the heat load (HL), and the cold load (CL), all of which are integral to the IDR strategy.
Priority should be given to the use of renewable WT PV in regional cooperation and supply. The gas turbine (GT) can purchase natural gas from the natural gas network for combustion and work, and the high-grade energy released is used for power generation. The high-temperature smoke discharged is reused by the waste heat, cooled by absorption chillers, and utilized by the thermal production capacity of the waste heat boilers. Ground-source heat pumps convert electrical and surface geothermal energy into cold and heat energy. The source side energy in this study is mainly composed of renewable energy, electric energy interactions, and natural gas. It uses the energy source side through a coupling device to meet the load demand of energy conversion; at the same time, the remaining energy is stored in the storage unit of the HST and HS/CS. The energy structure of the entire system is shown in Figure 1.

2.2. IDR Model

This study expanded upon traditional DR techniques by developing an integrated electric–hot–cold IDR model for the coordinated management of multiple loads within an energy hub. The users’ perceptions of temperature are somewhat imprecise and delayed, allowing for a greater range of adjustment in the load’s flexibility. Consequently, implementing IDR in a RIES can effectively smooth out fluctuations in the load, facilitate the integration and complementarity of multiple forms of energy, and enhance the utilization of clean energy sources.

2.2.1. Power Load IDR

This study introduced a price-based electricity DR, which uses time-of-use pricing to guide users in adjusting their energy consumption. Users can strategically shift their usage to times when electricity costs are lower [24].
n = p p q q
The elasticity matrix N, representing the responsiveness of the demand side to changes in electricity prices, is defined as
N = ε 11 ε 12 ε 21 ε 22 ε 1 m ε 2 m ε n 1 ε n 2 ε n m
ε i i = p i p i q i q i
ε i j = p i p i q j q j
where ε i i and ε i j are the self-elastic coefficients and cross-elastic coefficients, respectively. In this context, customer loads are categorized into fixed electrical loads (FELs) and transferable electrical load (TELs), with the latter being adjustable [25].
L e t = L f e l , e t + L s e l , e t = p i + p i N q i q i
The two types of loads are subject to the following constraint condition
0 < L s e l , e t L s e l , e , t m a x t = 1 T L s e l t t = M s e l , e
where M s e l , e is the total amount of power load that can be transferred. The cumulative EL remains constant pre- and post-DR, with the TEL designated as 10% of the total load in this study.

2.2.2. HL Demand Response

Users have a degree of tolerance for temperature fluctuations within a comfortable range, as their perception of changes in temperature is not immediate or precise [26]. This study focused on the hot water load for DR, which can vary within an acceptable range without significantly affecting the users’ comfort.
L h , m i n t L h t L h , m a x t L h , m i n t = γ ρ w V t T h , m i n T h , i n t L h , m a x t = γ ρ w V t T h , m a x T h , m i n t
where γ and ρ w refer to the specific heat capacity and density of water, respectively, which can be set to a fixed value of 1.1667 × 10⁻³ kwh/(kg °C) and 1000 kg/m3 [27], regardless of changes in temperature; T h , i n is the initial water temperature, say 15 °C.
The user’s heat demand is divided into two components: a fixed heat load (FHL) and a transferable heat load (THL), defined as follows:
L h t = L f e l , h t + L s e l , h t 0 < L s e l , h t L s e l , h , t m a x t = 1 T L s e l , h t t = M s e l , h

2.2.3. CL Demand Response

L c , m i n t L c t L c , m a x t L c , m i n t = T o u t t T c , m i n t / R d L c , m a x t = T o u t t T c , m a x t / R d
L c t = L f e l , c t + L s e l , c t 0 < L s e l , c t L s e l , c , t m a x t = 1 T L s e l , c t t = M s e l , c
where L c t is the cooling load power at time t; M s e l , c is the total amount of transferable heat load; T o u t t is the outdoor temperature at time t; and R d is the thermal resistance at 18 °C/kW.
The flexible cooling load considered in this study was the transferable load, and the user’s cooling load consisted of the fixed cooling load (FCL) and the transferable cooling load (TCL). The total amount of cooling load transmitted before and after the demand response was equal.

3. Output and Constraint Modeling of Equipment in the RIES

3.1. Scenery Output Model

The generation of wind power is directly related to wind speed, and the formula for calculating wind power is widely accepted and utilized both nationally and internationally.
v w t t = 0 , v m t v c t , v m t > v f t P r , m v m t v c t v r t v c t , v c t < v m t < P r , m , v r t v m t v f t v r t
P p v t = L p t M p θ p
θ p = θ t e s t 1 φ T p t T t e s t
where, θ p is the photovoltaic power generation efficiency and φ is the power temperature coefficient. Equation (11) quantifies the wind power plant’s output as a function of wind speed. Equation (12) denotes the theoretical output of a solar power plant at time t, while Equation (13) specifies the efficiency of solar power generation at that same time.

3.2. Mathematical Model of CCHP

Q g t t = P e , g t t 1 η e η l η e V g t , t = P e , g t t   η e × L p P e , g t m i n P e , g t t   P e , g t m a x
Q c , a r t = η a r Q a r , i n t Q c , a r m i n Q c , a r t Q c , a r m a x
Q h , w h b t = η w h b Q w h b , i n t Q h , w h b m i n Q h , w h b t Q h , w h b m a x
where η e and η l are the power generation efficiency and heat loss coefficient of the GT respectively; η a r is the conversion efficiency of the AR; and η w h b is the conversion efficiency of the WHB. Formulas (14)–(16) are mathematical models for the power generation efficiency of gas turbines, absorption coolers, and waste heat boilers, respectively, including the cooling power of the absorption cooler and the heating power of the waste heat boiler.

3.3. Mathematical Model of Ground-Source HPs

Ground-source HP systems utilize soil, groundwater, surface water, and low-temperature geothermal tail water as sources of geothermal energy [28]. Their advantages are that they can be widely used, including summer cooling and winter heating for users, and they can also be used for low-temperature heat source refrigeration, heating, and refrigeration. Water coolers and boilers are effective ways to improve the urban atmospheric environment and save energy, and are a new development direction for local energy use. The mathematical model for this system is as follows
Q h p , c t = C c o p , c P h p , c t Q h p , h t = C c o p , h Q h p , h t Q h p Q h p , m a x
where Q h p , m a x is the maximum installed capacity of the HP. The coefficient of performance (COP) is an important indicator of a heat pump’s energy efficiency, with an HP energy efficiency coefficient of 4.

3.4. Mathematical Model of Electric Hydrogen Production Equipment

In this study, part of the hydrogen produced by EC electrolysis was supplied to a hydrogen fuel cell (HFC) for energy use, and part is stored in a hydrogen storage tank for backup. The HFC converts the hydrogen energy obtained from the electrolytic cells and hydrogen storage tanks into electricity and heat for the users to use [29].
The mathematical model of EC is as follows:
P h 2 , e c t = η e l   P e , e c t P e , e c m i n P e , e c t P e , e c m a x P e , e c m i n P e , e c t + 1 P e , e c t P e , e c m a x
In the formula, P e , e c m a x and P e , e c m i n are the upper and lower limits of EC, and P e , e c m a x and P e , e c m i n are the upper and lower limits of EC power.
The mathematical model of HFC is as follows:
P e , h f c t = η h f c e P h 2 , h f c t P h , h f c t = η h f c h P h 2 , h f c t P h 2 , h f c m i n P h 2 , h f c t P h 2 , h f c m a x P h 2 , h f c m i n P h 2 , h f c t + 1 P h 2 , h f c t P h 2 , h f c m a x χ h f c m i n P h , h f c t / P e , h f c t χ h f c m a x
In the formula, P h 2 , h f c m a x and P h 2 , h f c m i n are the upper and lower limits of the HFC’s climb, χ h f c m a x and χ h f c m i n are the upper and lower limits of the HFC’s thermoelectric ratio, and P h 2 , h f c m a x and P h 2 , h f c m i n are the upper and lower limits of the HFC’s power, respectively. Equations (18) and (19) are the mathematical models of the electrolyzer’s EC and the HFC, respectively, which contain the climbing constraints of the EC and HFC equipment and the range constraints of the HFC’s adjustable thermoelectric ratio. P h 2 , e c t is th e hydrogen energy output of the EC at time t, and is the electricity and heat energy output of the HFC at time t, respectively.

3.5. Mathematical Model of the Energy Storage Device

The system incorporates energy storage devices such as hydrogen storage tanks (HST) and combined HS/CS, with their operations governed by the following mathematical models.
0 P x , t c h a C x , t c h a P m a x c h a 0 P x , t d i s C x , t d i s P m a x d i s W x t = W x t 1 1 η x s + η x c h a P x , t c h a P x , t d i s η x d i s W x m i n W x t W x m a x W x t = 1 = W x t = T C x , t c h a + C x , t d i s = 1
where, respectively, P x , t c h a and P x , t d i s are the charging and discharging power of energy storage device x during the period t; C x , t c h a and C x , t d i s are binary variables; η x c h a and η x d i s are the of charge and discharge, respectively; W x m a x and W x m i n are the upper and lower efficiency limits of energy storage devices of type x, respectively; and P m a x c h a and P m a x d i s are the maximum charge and discharge capacity of energy storage devices of type x, respectively. The constraints of the energy storage equipment are shown in Equation (20).

3.6. Constraints on the Equipment’s Start-Up and Shutdown

Frequent activation and deactivation of the system’s equipment can have detrimental effects; it not only diminishes the equipment’s lifespan but also escalates the likelihood of operational failures [30]. Consequently, it is imperative to enforce constraints on the starting and stopping of the equipment.
I p i t = 1 , t = 1,2 , , U i n = t t + T p i o n 1 I p i n T p i o n I p i t I p i t 1 , t = U i + 1 , U i + 2 , , N t T p i o n + 1 n = t N t I p i n I p i t I p i t 1 0 , t = N t T p i o n + 2 , N t T p i o n + 3 , , N t U i = m i n N t , T p i o n K p i o n I p i 0
I p i t = 0 , t = 1,2 , , V i n = t t + T p i o f f 1 1 I p i n T p i o f f I p i t 1 I p i t , t = V i + 1 , V i + 2 , , N t T p i o f f + 1 n = t N t 1 I p i n I p i t 1 I p i t 0 , t = N t T p i o f f + 2 , N t T p i o f f + 3 , , N t V i = m i n N t , T p i o f f K p i o f f 1 I p i 0
where I p i t is the state of unit i at time period t; I p i 0 is the state of unit i at the initial time of scheduling; T p i o n , T p i o f f are the minimum opening and downtime of unit i, respectively; U i , V i are, respectively, the time that unit i needs to be in the starting and stopping state after the start of scheduling; and K p i o n , K p i o f f refer to the continuous on and off times of unit I at the initial moment, respectively.

4. The RIES Optimization Model under IDR

4.1. Objective Function

This study introduced the energy conversion device of a ground-source heat pump (HP) and thermocouple, adjustable hydrogen P2G technology under the traditional cogeneration mode. Taking comprehensive demand response into account, the optimal output model of variable cogeneration of cold, heat, and electricity is formulated from both the supply and demand sides by considering various energy storage methods, energy conversion models, and complementary characteristics of multi-energy [31]. To demonstrate the model’s effectiveness, the study examined five different operational scenarios, each designed to minimize the daily operating costs.
For a grid-connected RIES, the economic scheduling model’s objective function is outlined as follows
C = min ( C g r i d + C g a s + C i m + C o m )
(1)
Cost of gas of the unit:
C g a s = t = 1 T c g a s t P e , g t t η e L p
(2)
Operation and maintenance cost of the unit:
C i m = t = 1 T K i P i t + t = 1 T K j Q i t + t = 1 T K x P x t
(3)
Equipment start-up and shutdown costs:
C o m = t = 1 T m a x 0 , I p i t I p i t 1 C s t , i
(4)
Electric energy interaction cost:
C g r i d = t = 1 T P b u y t C b t P s e l l C s t

4.2. Constraints of the Balance of the RIES

(1)
Electrical power balance constraints:
P b u y t + P w t t + P p v t + P e , g t t + P e , h f c t = L e t + P e , e l t + P s e l l t + P h p t
(2)
Thermal power balance constraints:
Q h , w h b t + P h , h f c t + P h s , t d i s = L h t + P h s , t c h a
(3)
Cold power balance constraints:
Q c , a r t + Q h p , c t + P c s , t d i s = L c t + P c s , t c h a
(4)
Hydrogen power balance constraints:
P h 2 , e l t + P h s t , t d i s = P h 2 , h f c t + P h s t , t c h a

4.3. Solution Method

This model is an MILP problem. The Yalmip toolbox on was is used for modeling the RIES due to its effectiveness, and the commercial solver CPLEX was used for quick solutions via this platform.

5. Results and Discussion
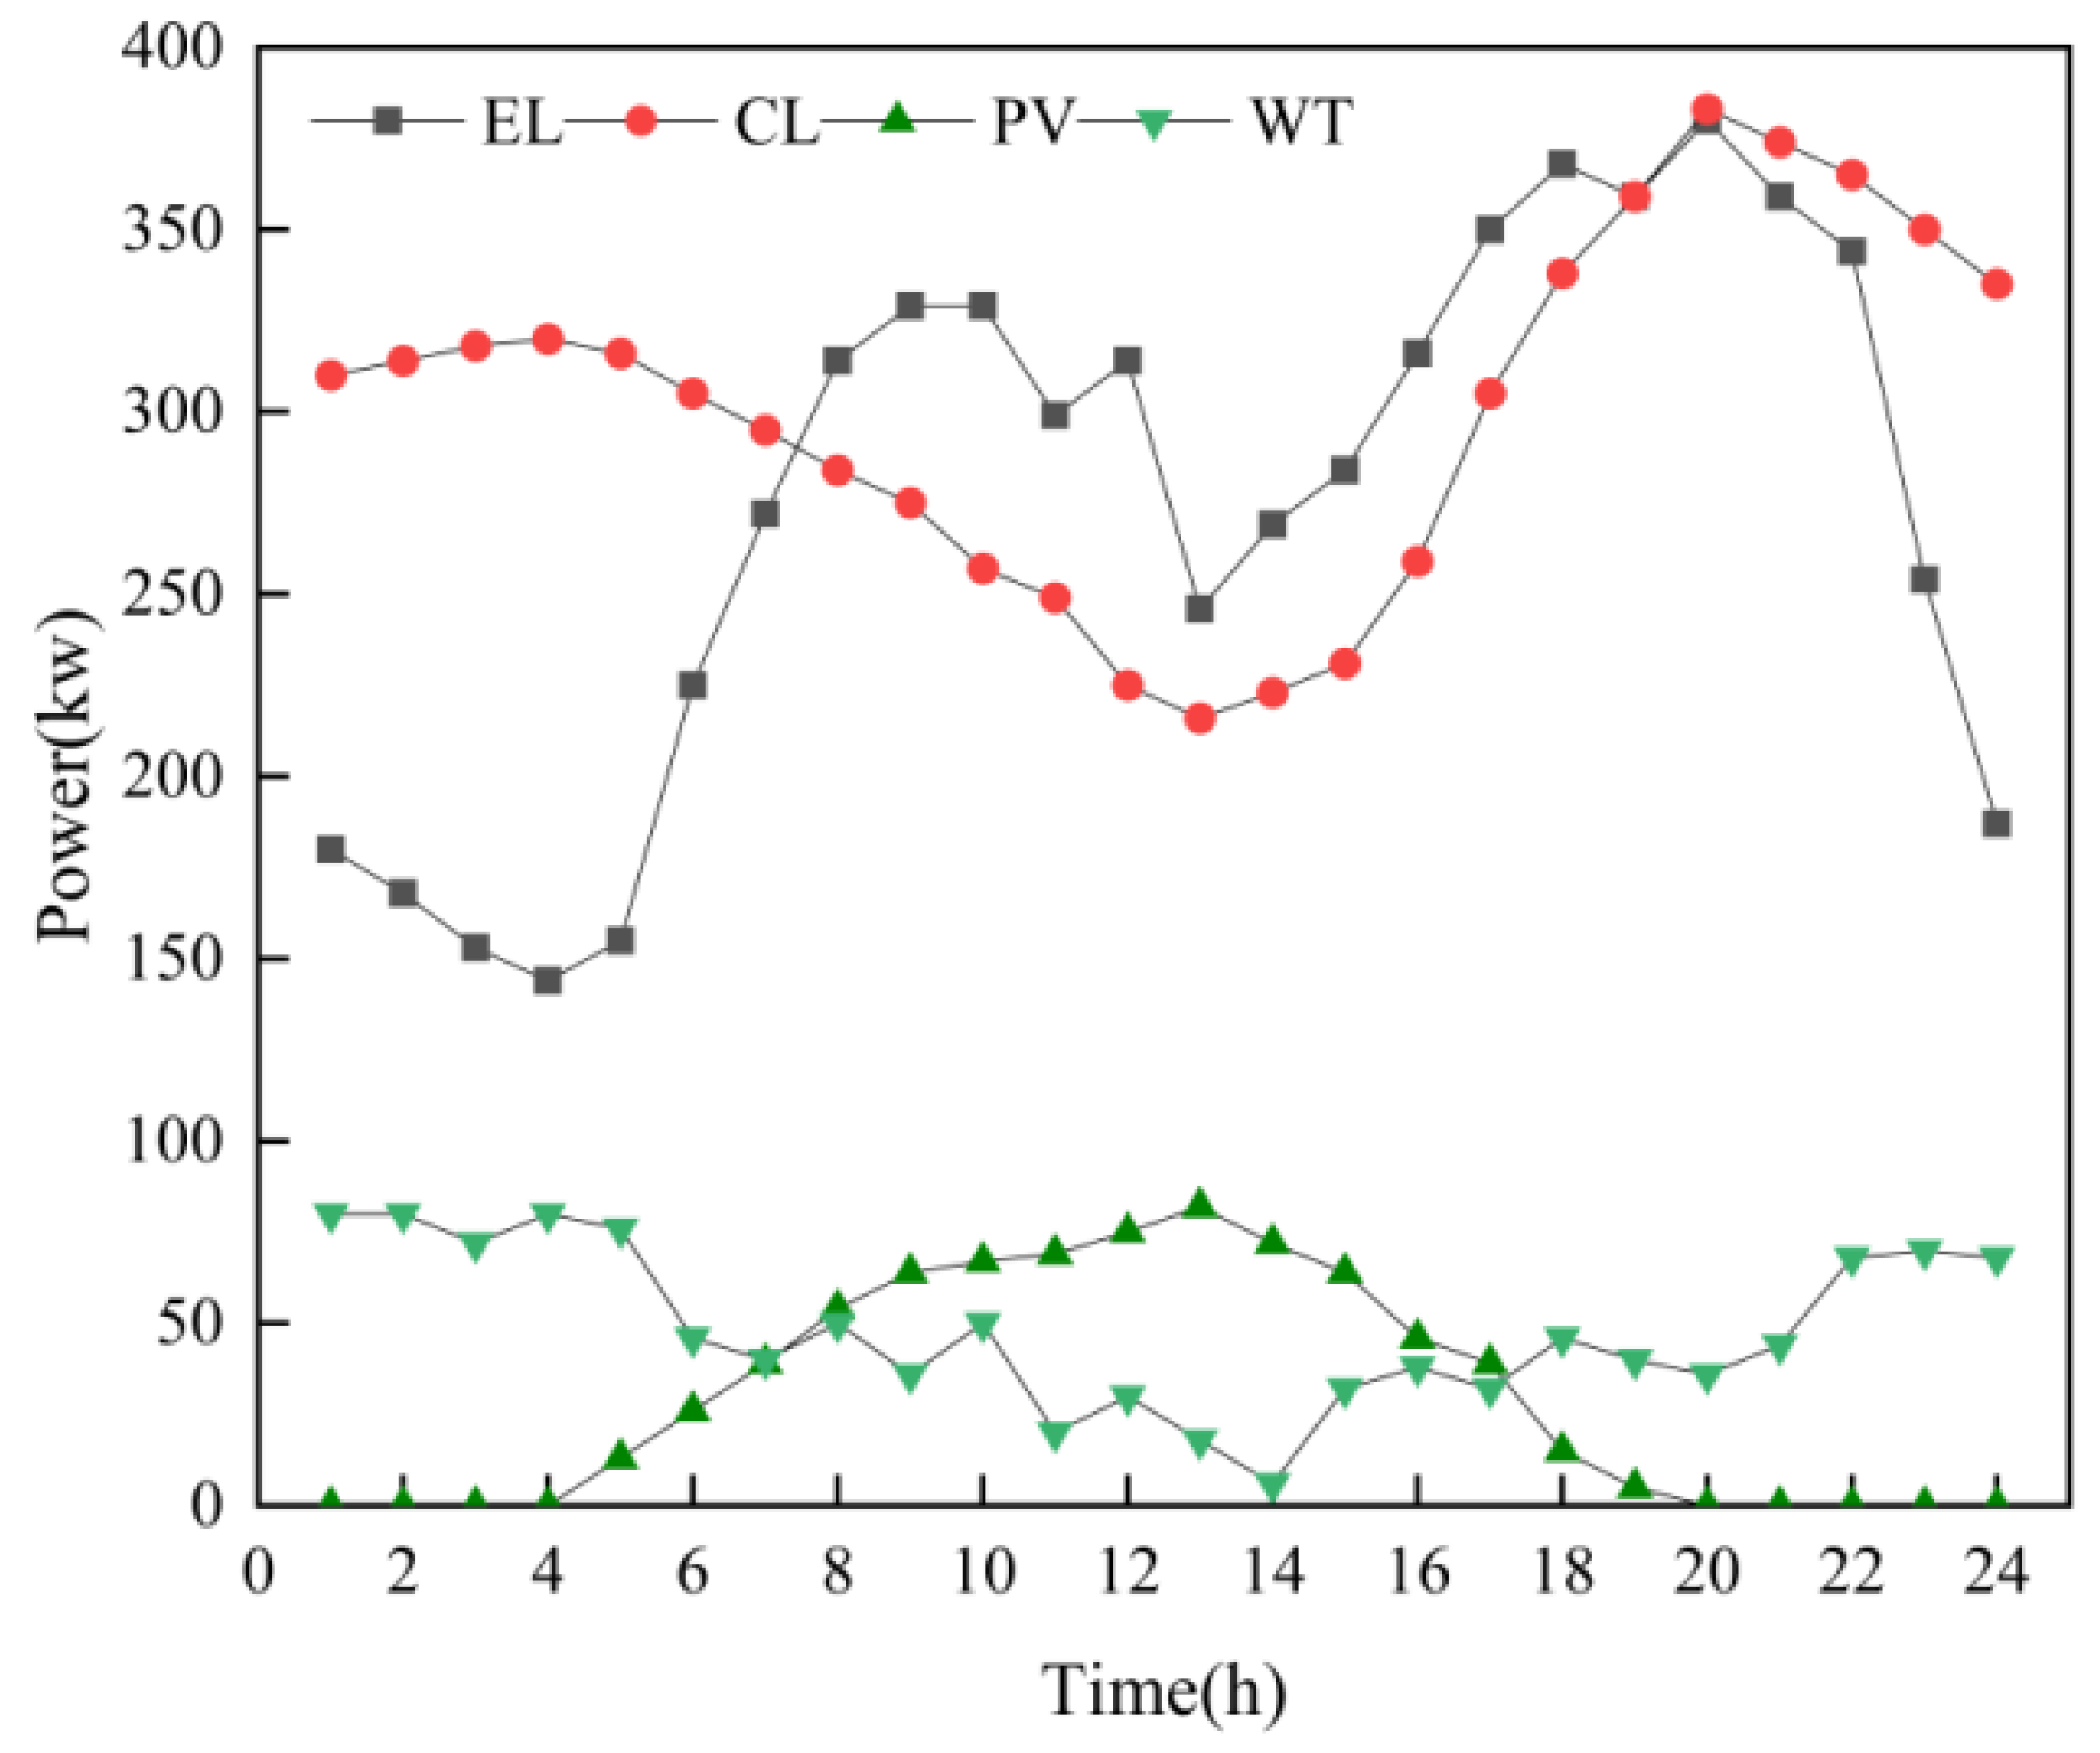
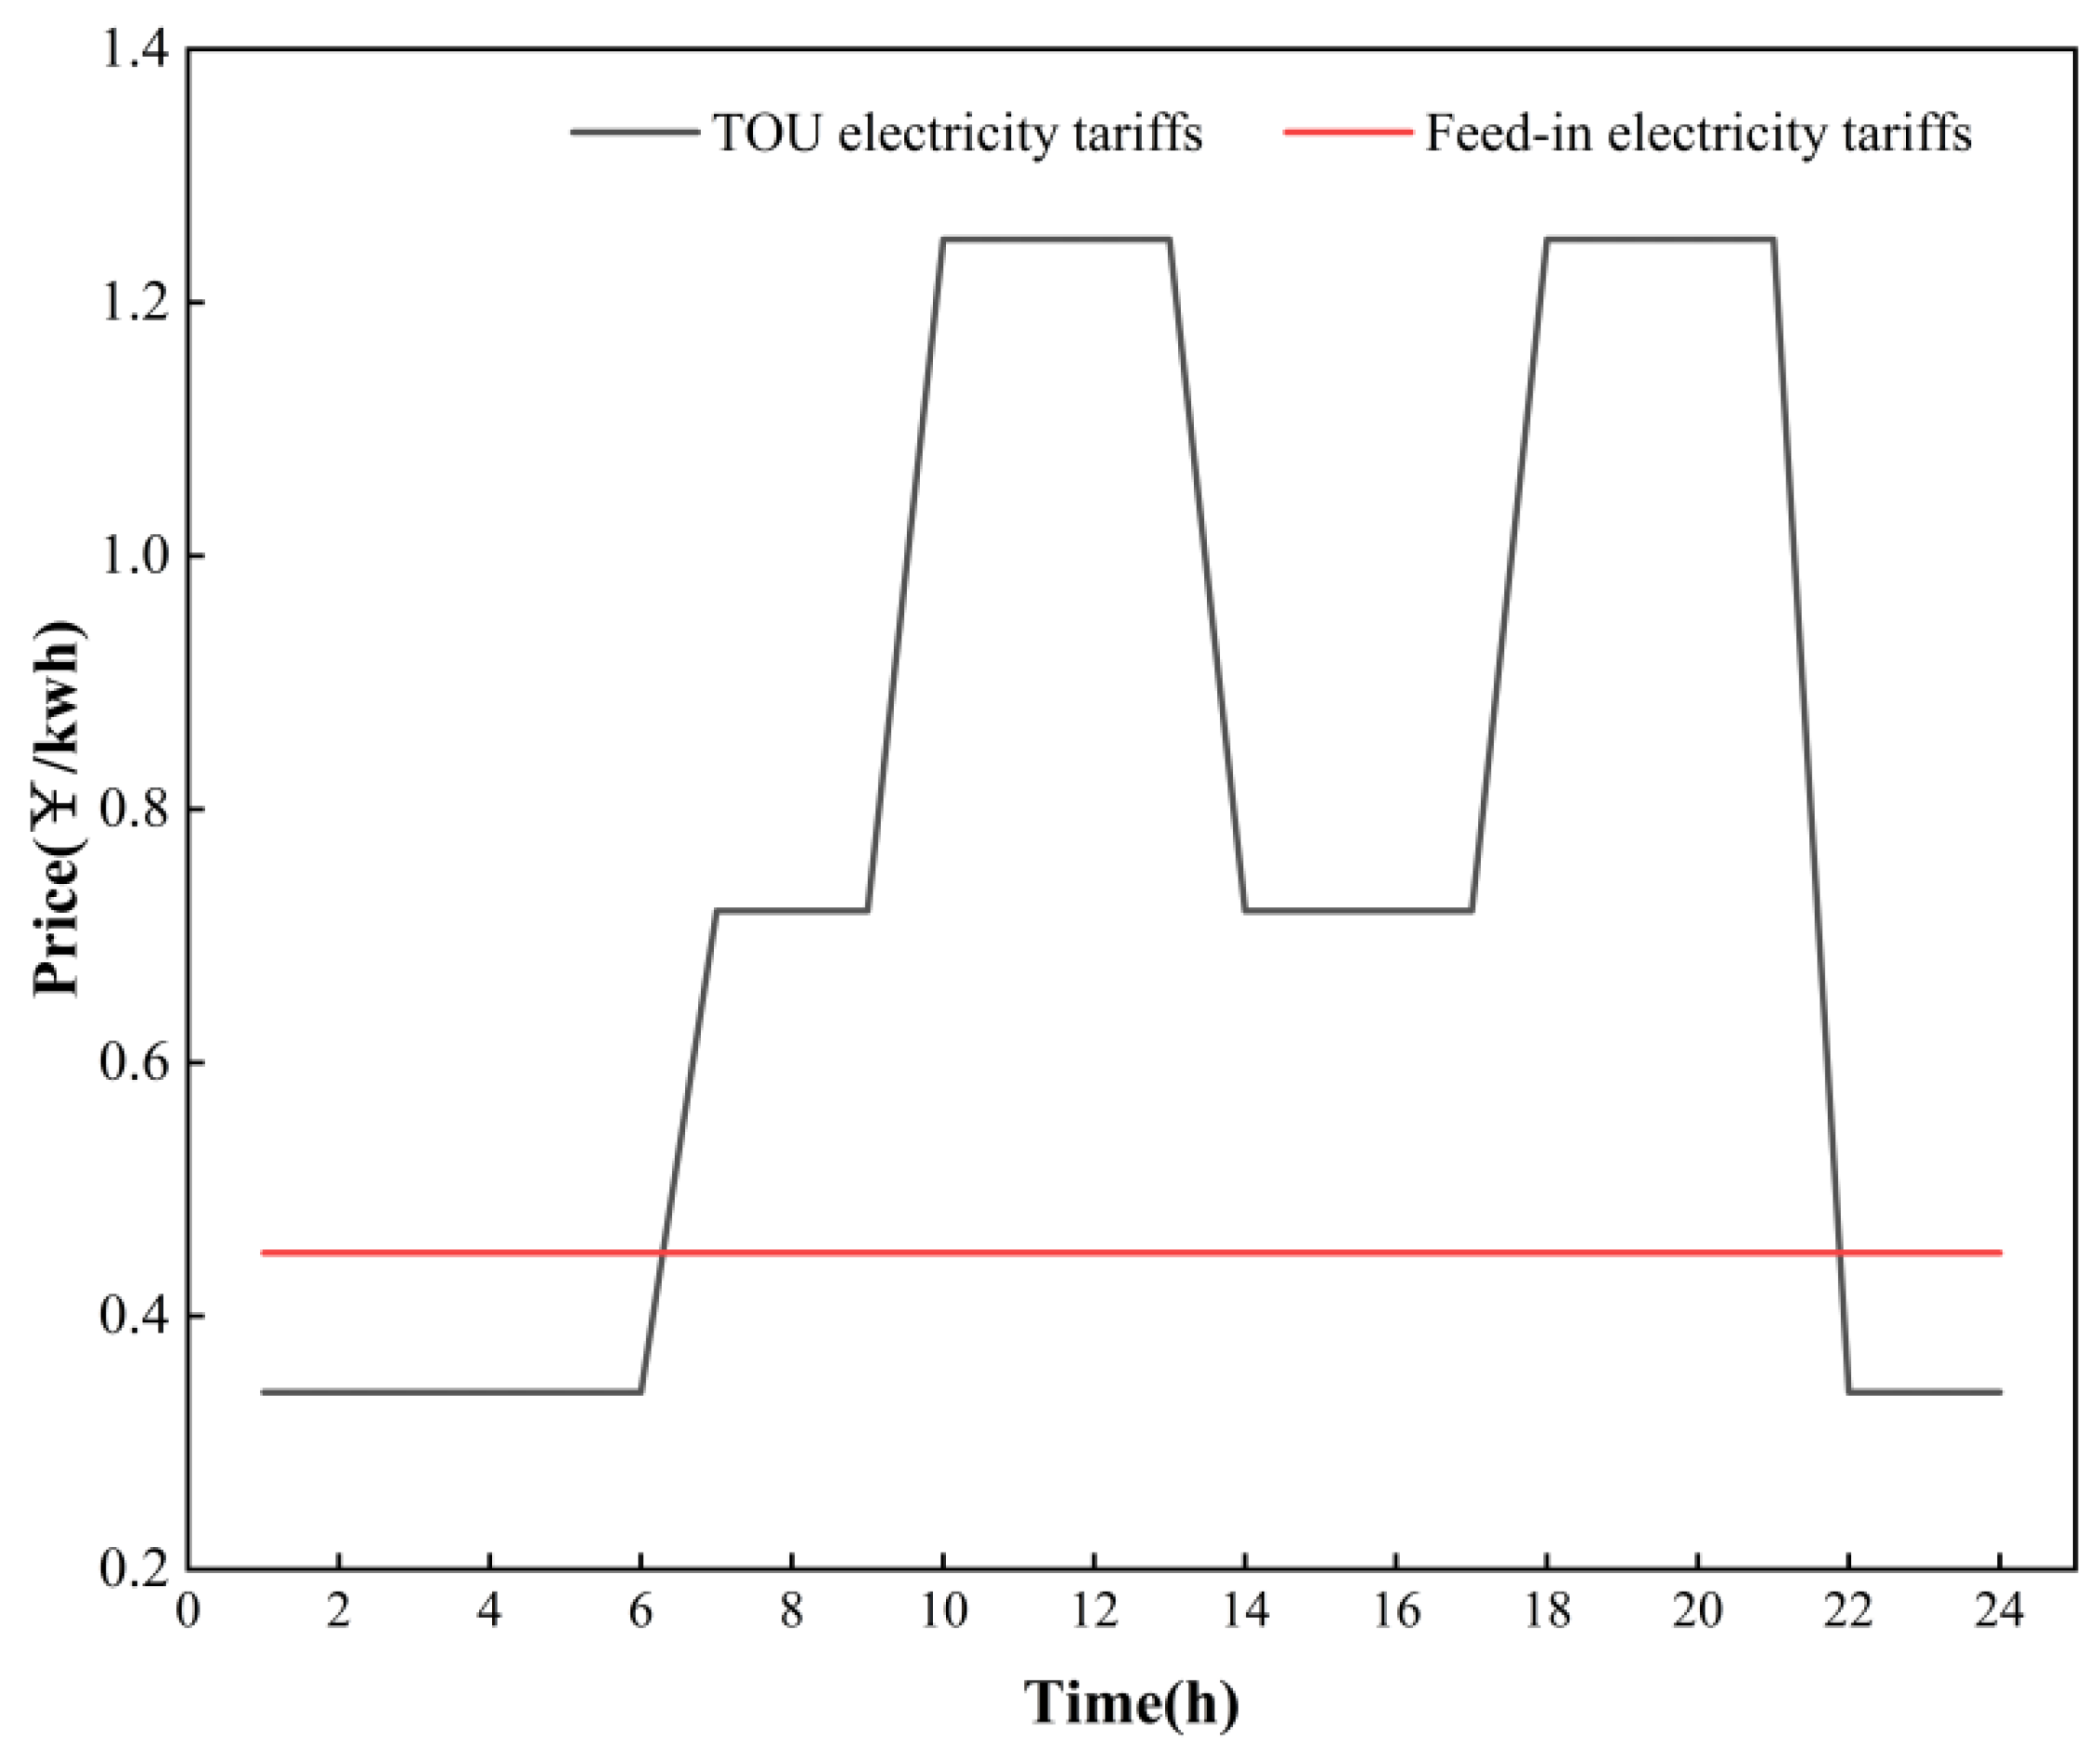
5.1. Baseline Data

Due to the unpredictable nature of the weather and load data, the analysis focuses on typical winter and summer days to reflect the cyclical energy consumption patterns of a building’s energy systems. The forecasted wind and cooling/heating load profiles are illustrated in Figure 2 and Figure 3, while the ToU electricity pricing for the peak and off-peak periods is shown in Figure 4. The model operates with a time interval Δt of 1 h over a scheduling period T of 24 h.

5.2. Analysis of the Influence of Different Scheduling Models on the Simulation’s Results

To test the effectiveness of the integrated multi-energy system model that includes a ground-source HP, hydrogen energy storage, and comprehensive DR, five optimization scenarios were created for simulation and comparison, as shown in Table 3. The specific operational parameters for each piece of equipment are listed in Table 4, and to reduce the wear and costs associated with frequent turning on and off of the devices, minimum operation times were set, as shown in Table 4. Additionally, Table 5 details the capacity and parameters of the energy storage tanks and hydrogen storage systems. The operation and maintenance costs of each equipment are shown in Table 6.

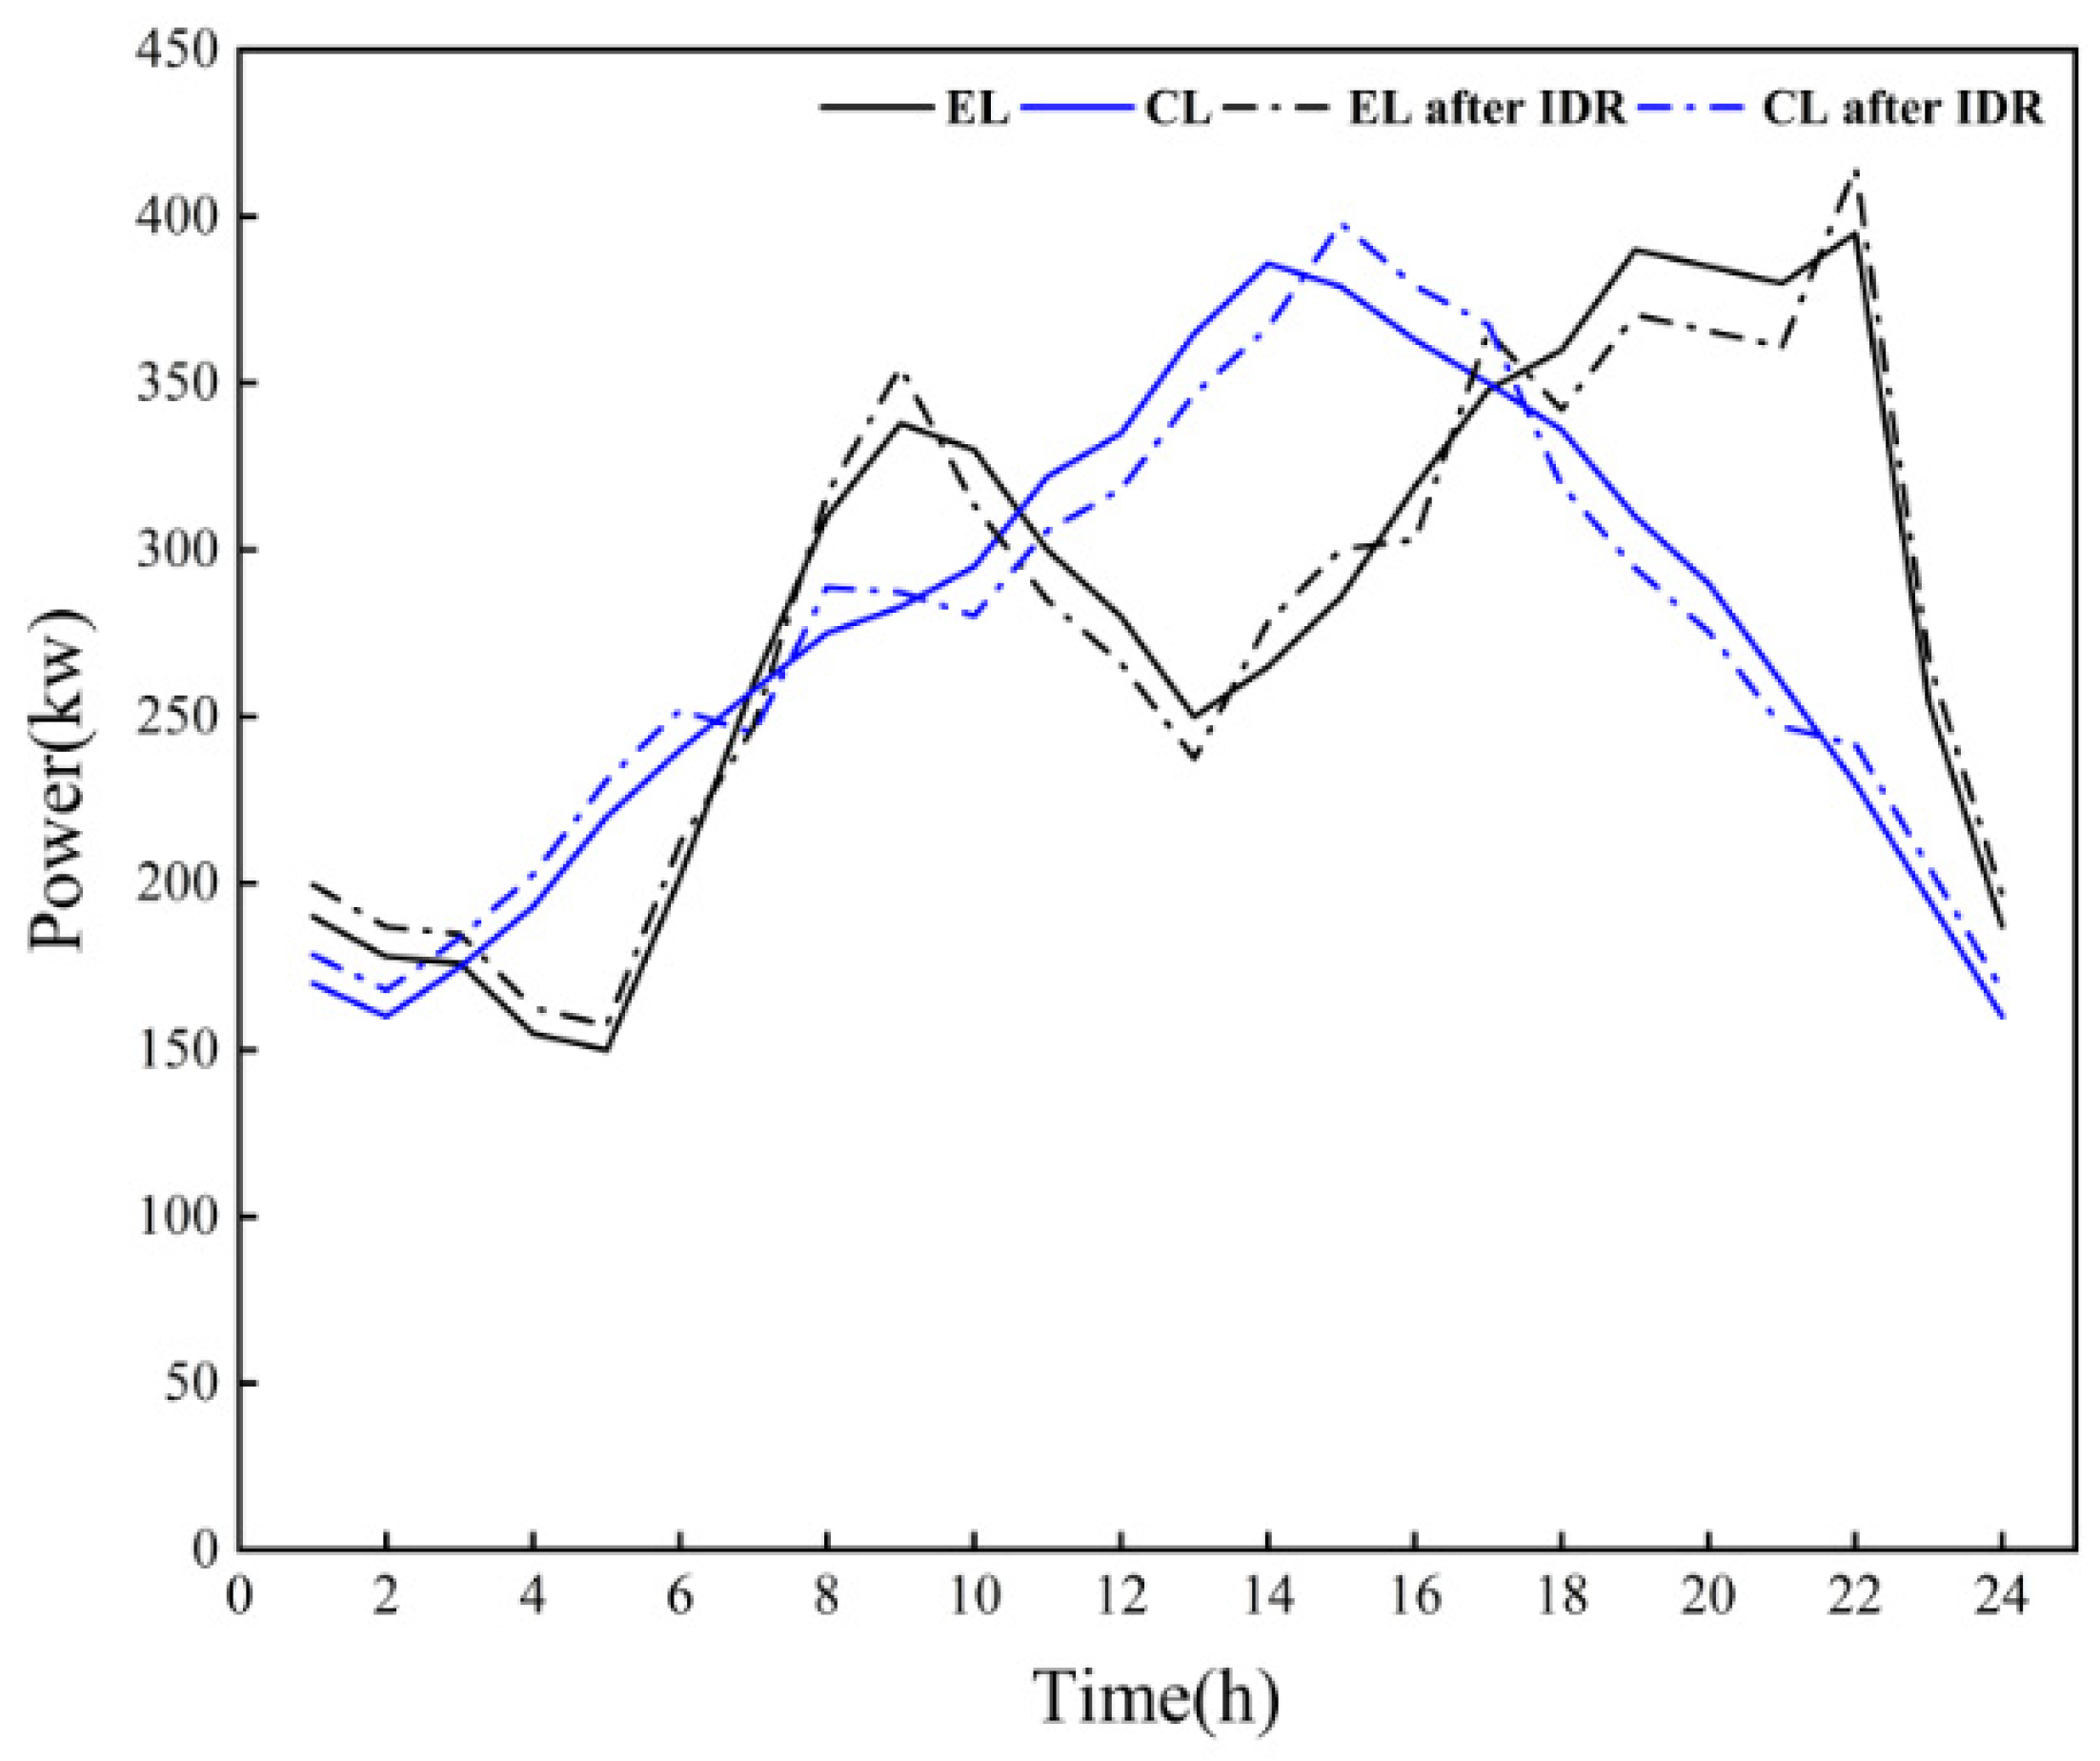
5.2.1. Influence of IDR on the RIES’s Operation

Figure 5 incorporates IDR into the system without changing the total equipment. It encourages users to actively engage in shifting their energy use, moving demand from peak to off-peak hours based on personal preferences and making sensible adjustments during normal periods, as illustrated in Figure 5. For instance, during winter, the electricity load is highest between 10:00–13:00 and 18:00–21:00 when prices are also at their peak. Users can reduce their consumption during these times, which helps to dampen fluctuations in the load and shave peaks, especially during the off-peak hours of 22:00 to 6:00 when electricity is cheaper. Figure 6 shows the changes after IDR in summer. This results in a 5.01% and 5.2% reduction in the peak-to-valley difference in winter, while in summer, the reduction is 5.6% and 4.4%, respectively.

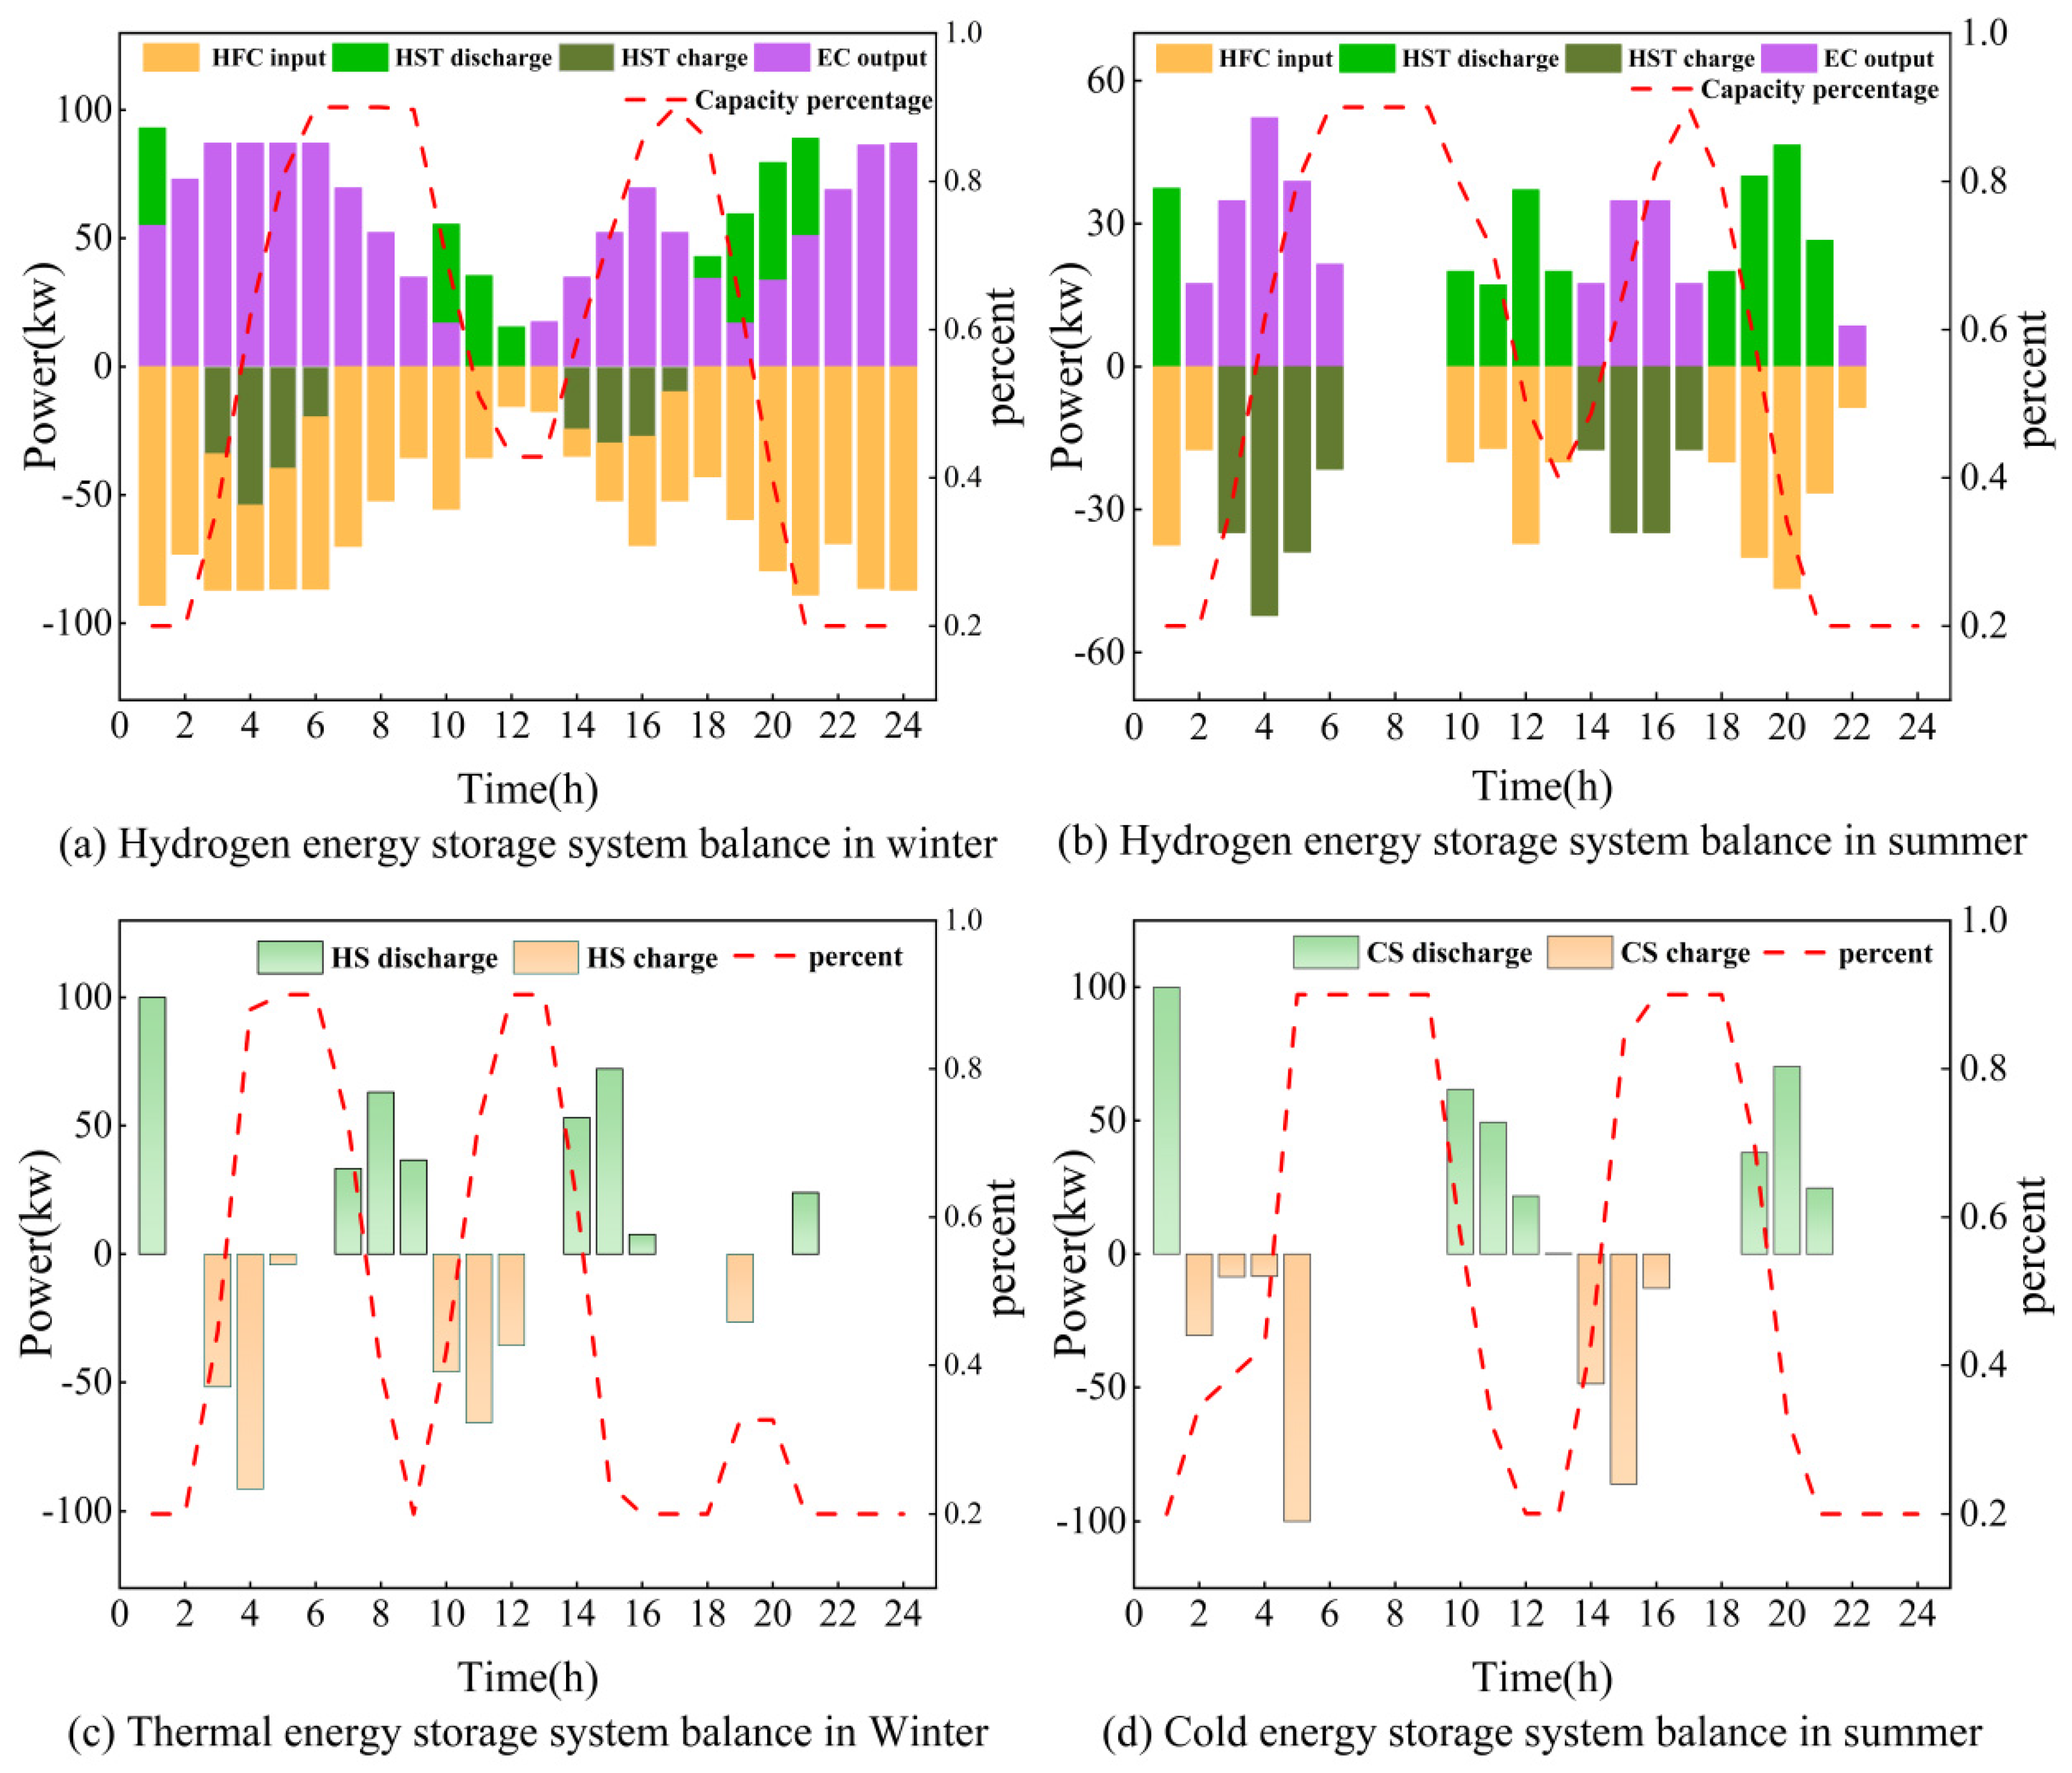
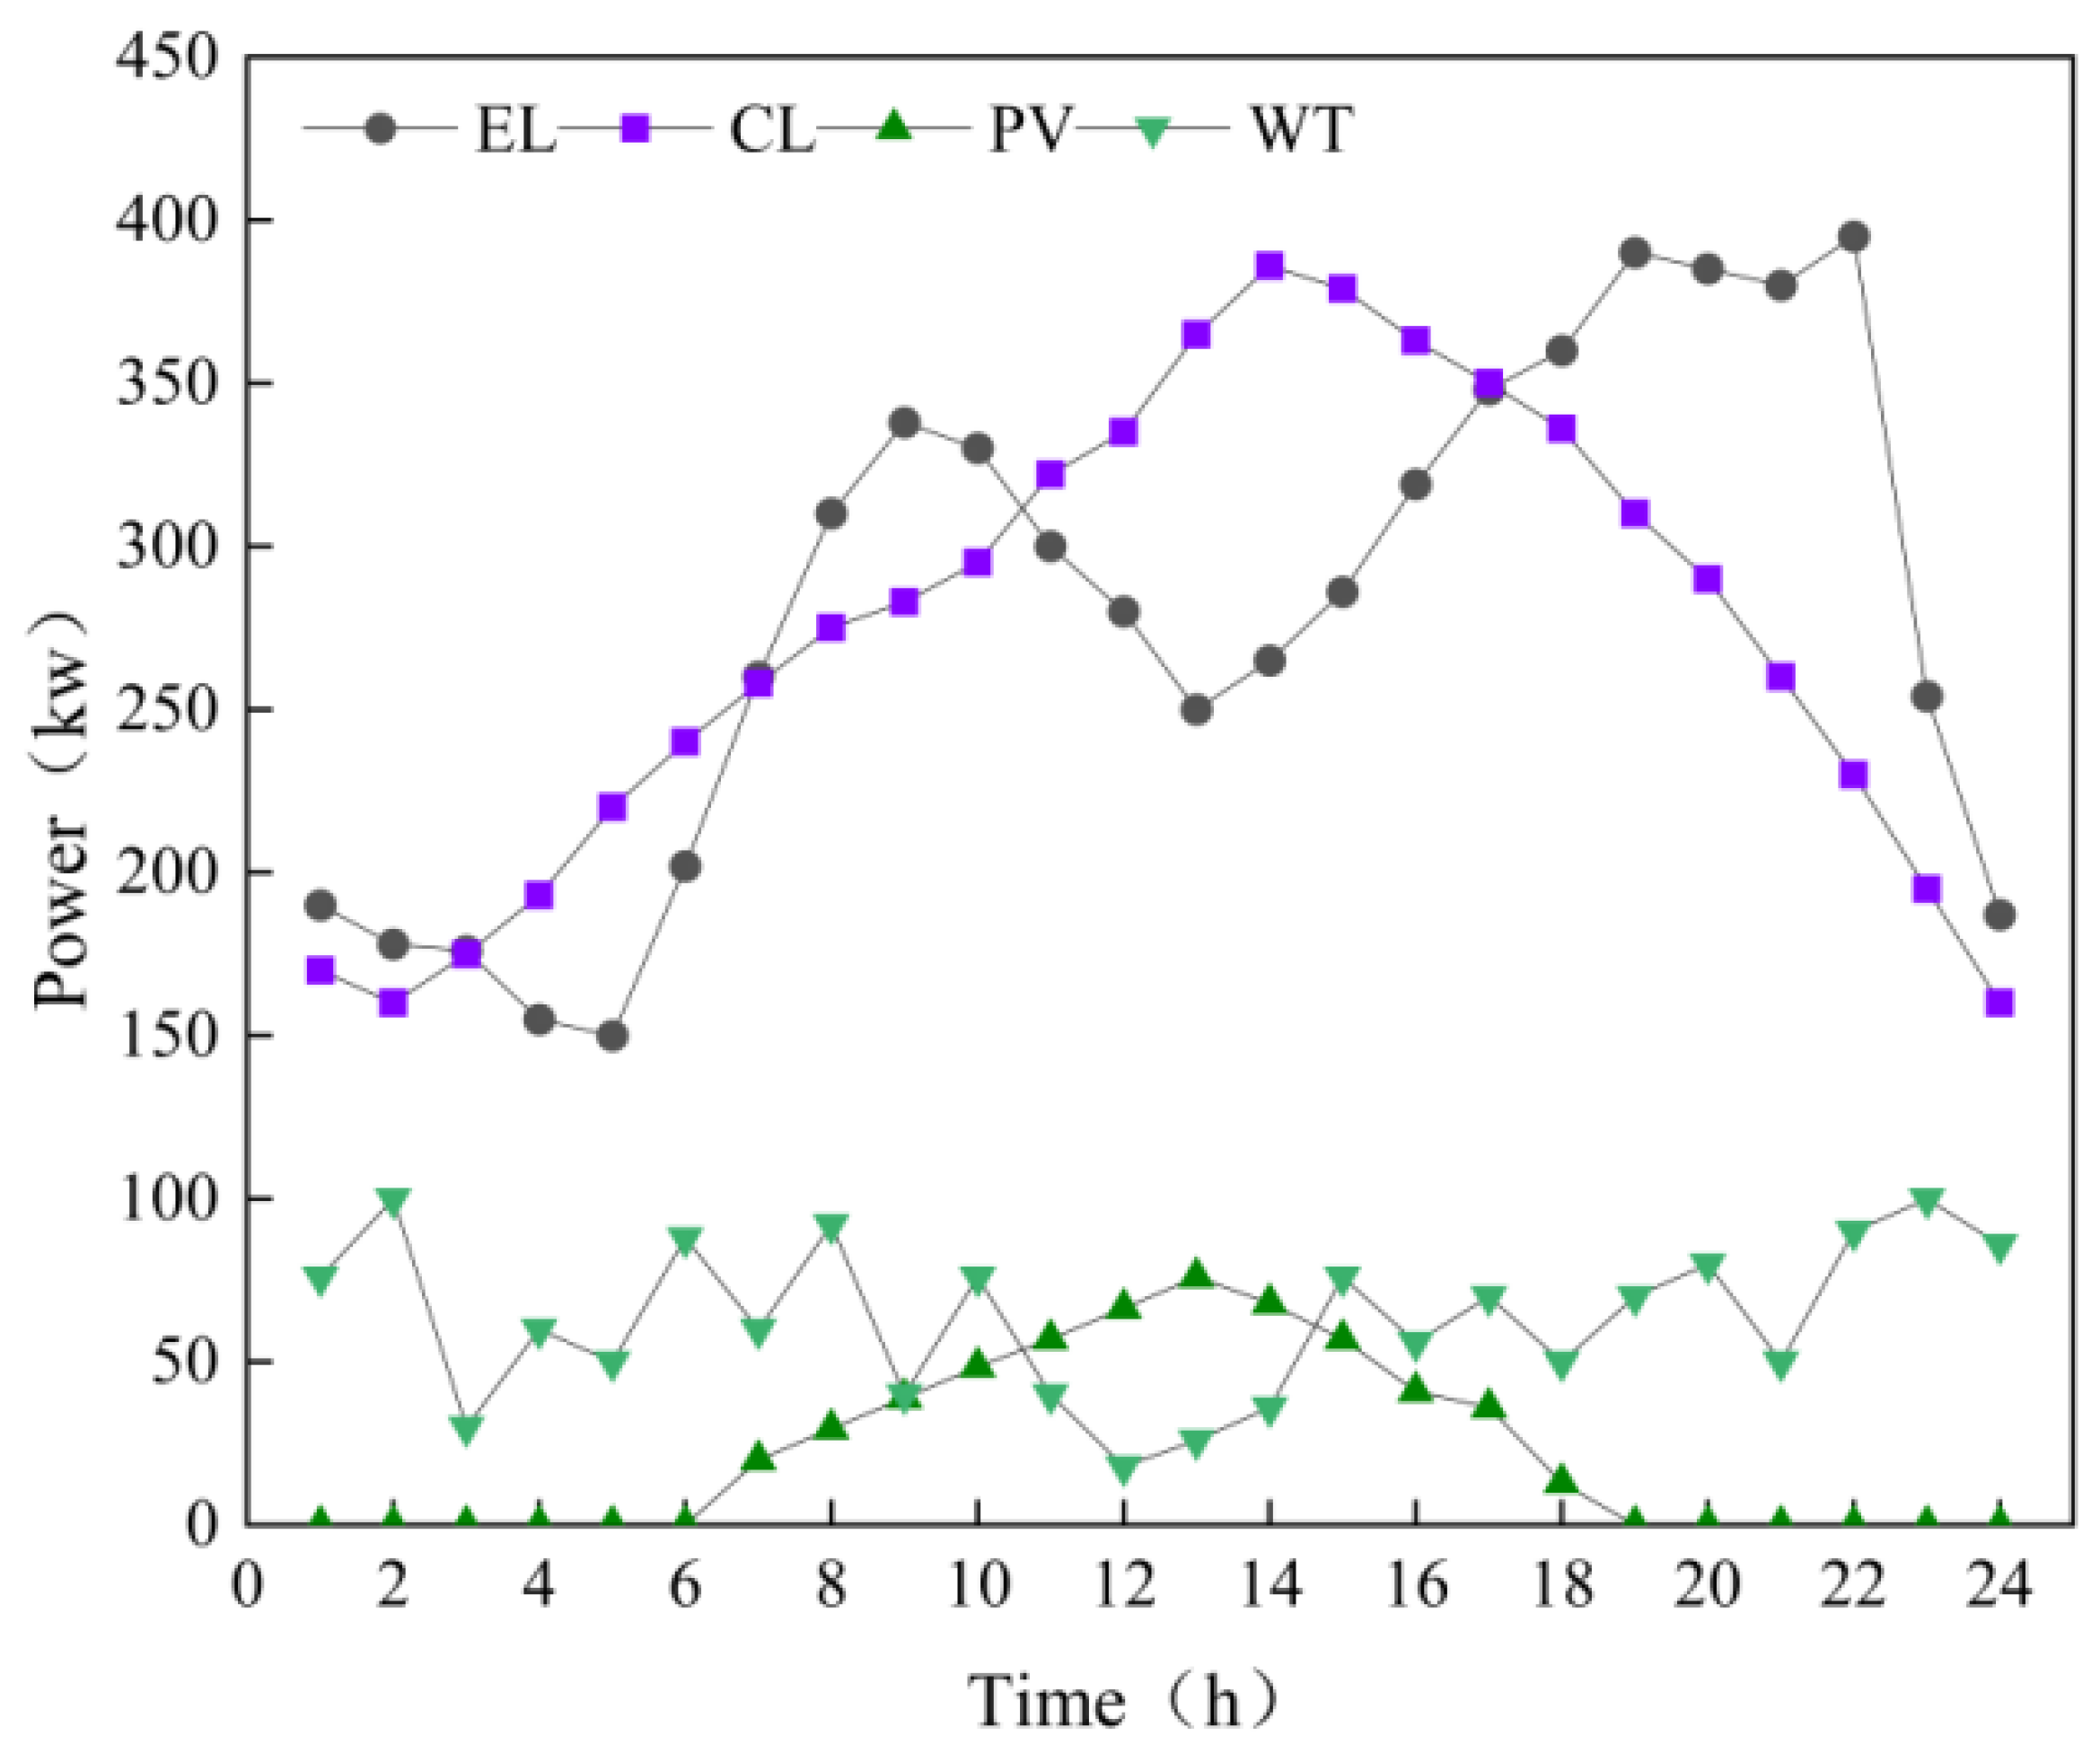
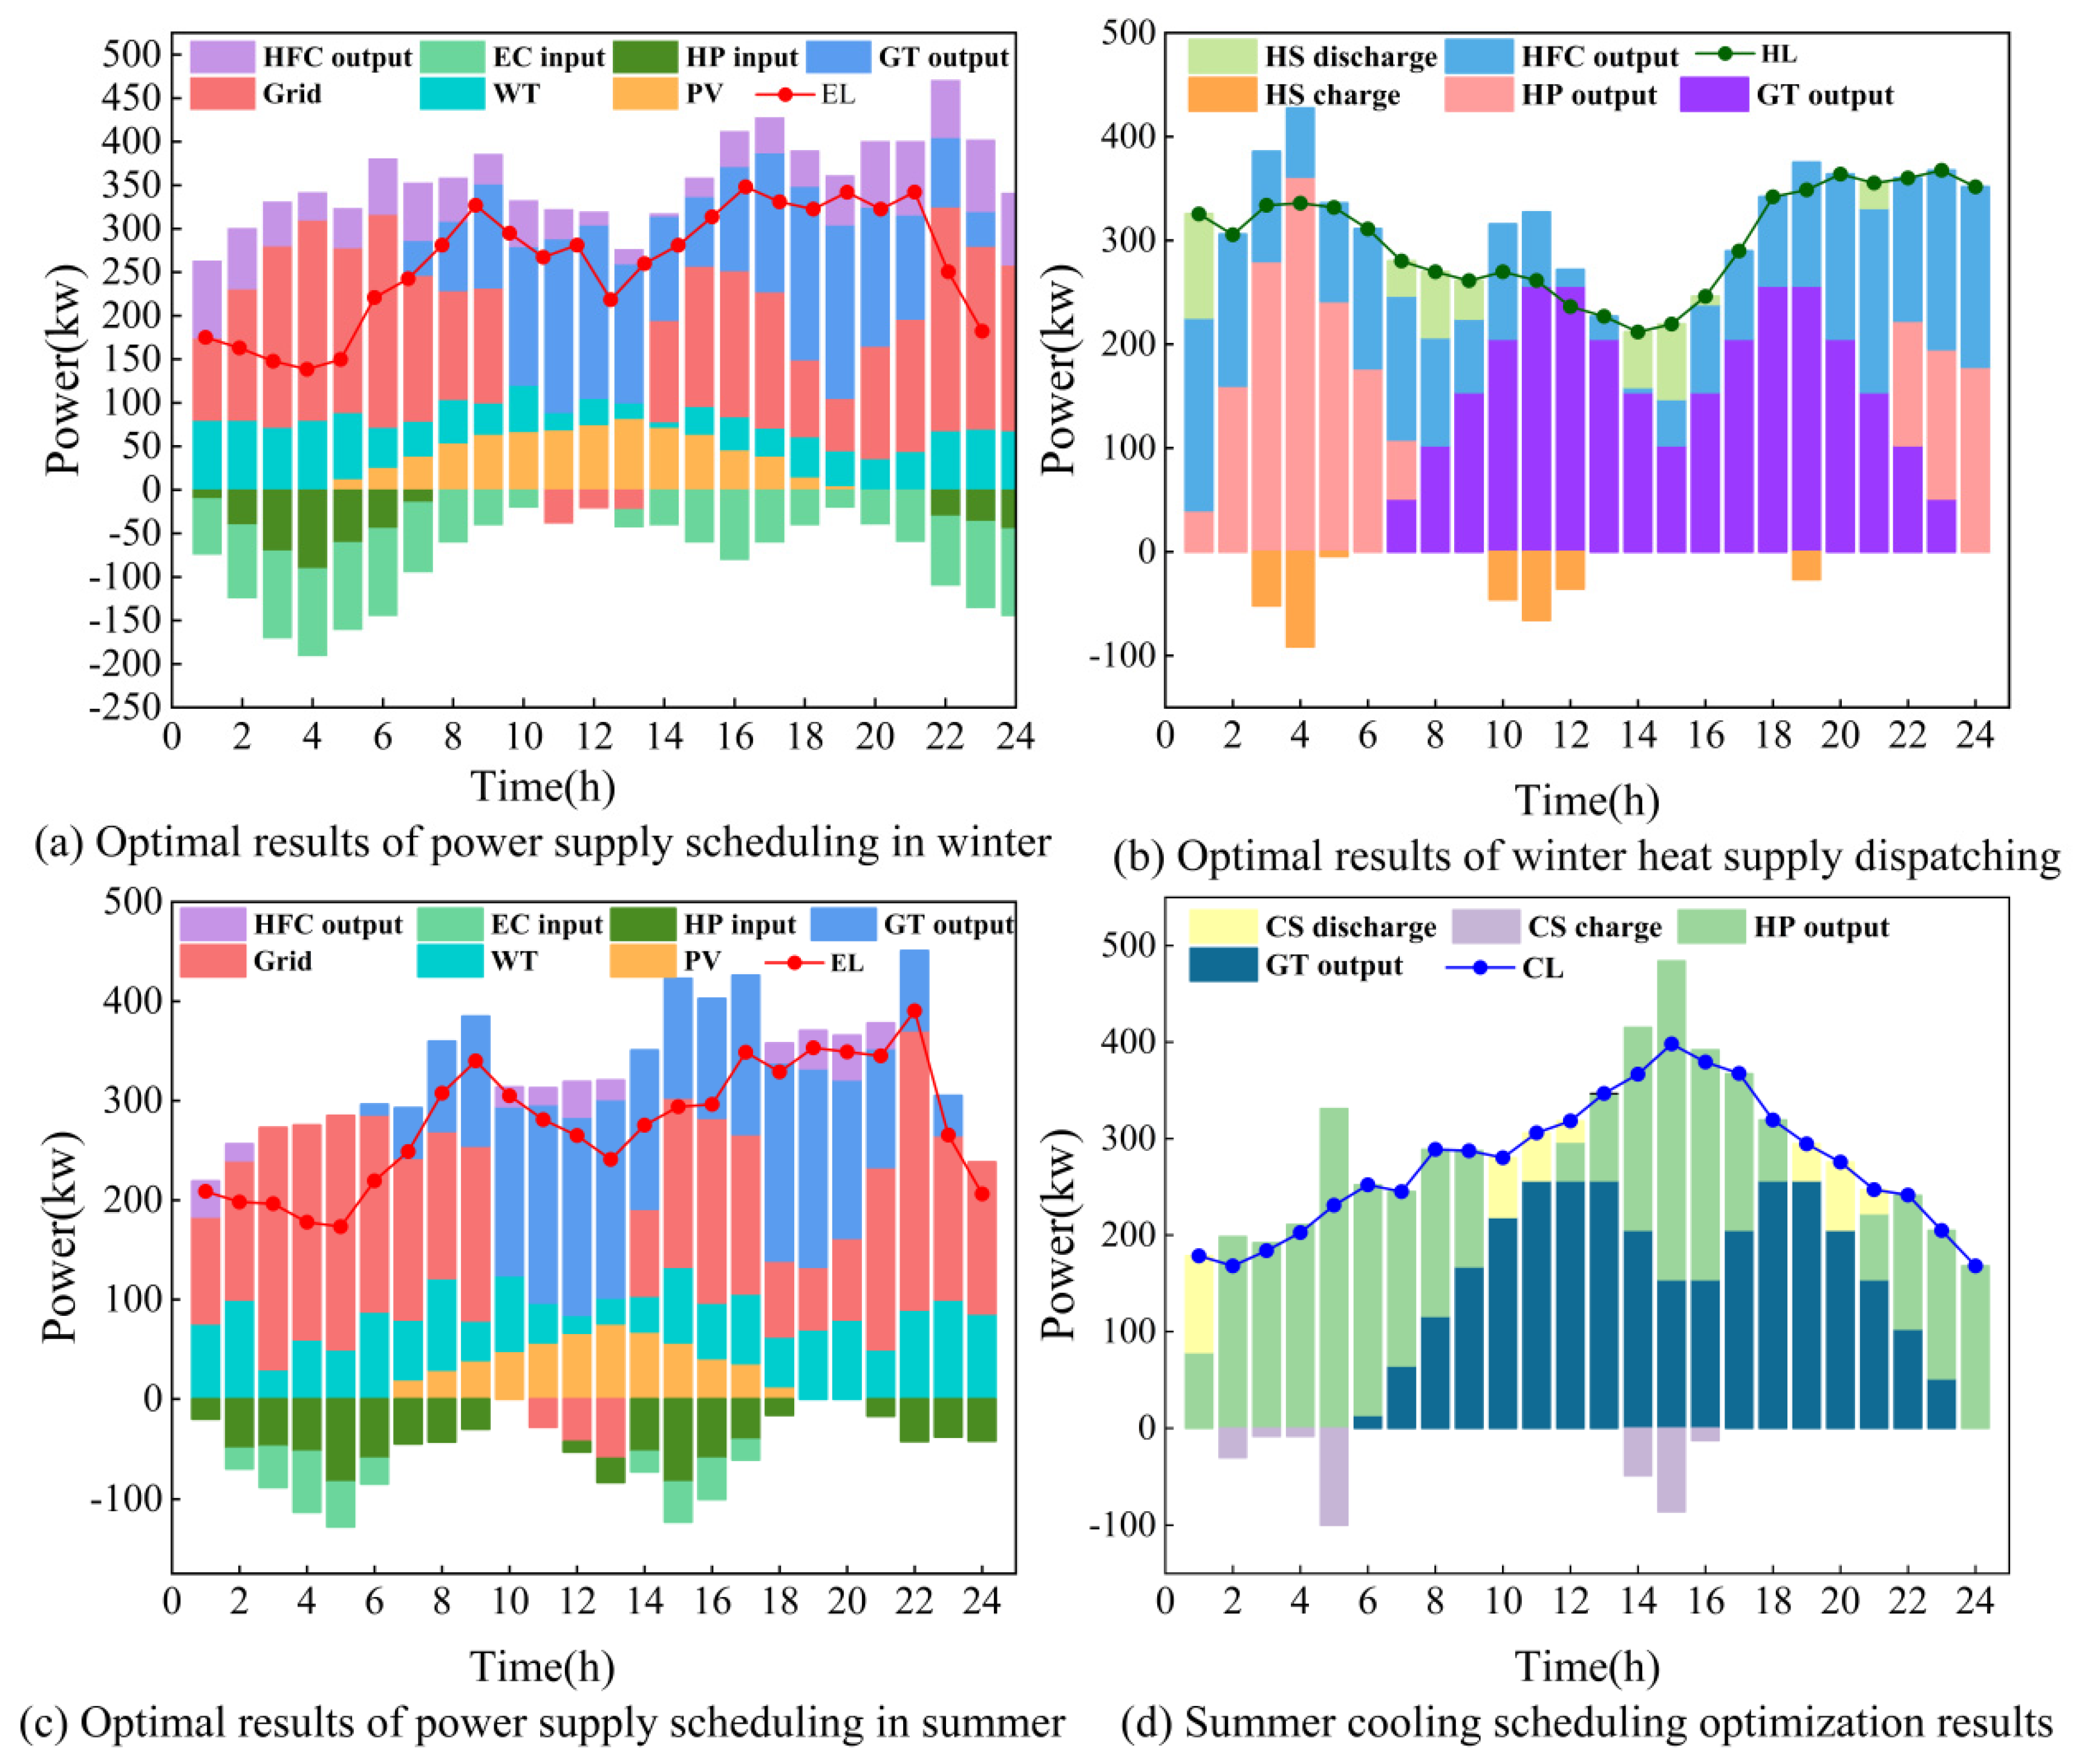
5.2.2. Analysis of Supply–Demand Balance

Results of Optimization of Typical Winter Days

In Option 5, the heating needs of the RIES are predominantly met by geothermal HP, HFC, cogeneration systems, and HS. The use of power for geothermal HP, EC, and HFC is managed in conjunction with the grid, the cogeneration systems, and renewable sources such as solar power and WT.
As shown in Figure 7a, the internal power demand of the RIES is lower during the early morning hours (1:00–6:00) and late at night (22:00–24:00), while there is a high demand for heat during winter nights. After evaluating the costs of natural gas and grid electricity, we determined that grid electricity is more cost-effective. According to Figure 8a,b, the ground-source HP and HFC are mainly responsible for meeting the heating demand, while the HST continues to store energy.
During the hours of 7:00–9:00 and 14:00–17:00, when electricity prices are normal, a cost comparison was made between producing electricity using the GT and drawing electricity from the grid. The GT, being the more cost-effective option, was chosen for power generation. The waste heat from the GT is utilized by a WHB to contribute to HL, with the remaining demand for heating being met by the ground-source HP and HFC. During this period, the HST is in a standby mode and does did not actively store energy, as depicted in Figure 7a,b.
During peak hours, from 10:00 to 13:00 and after 18:00, there is a high demand for electricity. A cost comparison indicated that it cheaper to generate electricity using the GT rather than buying from the grid. Thus, GTs are primarily used to supply electricity during these times, with any excess electricity potentially being sold back to the grid. The heat demand is covered by the cogeneration system. At the same time, hydrogen is released from storage to be used, and the HS reduces its absorption of excess heat, as illustrated in Figure 8a,b.

Results of Optimization of Typical Summer Days

To address the cooling needs in summer, the cogeneration system’s operational mode is switched to produce both electricity and cooling, and the functioning of the ground-source HP compressor is adjusted accordingly. Figure 7 displays typical results for summer operation and energy scheduling of the HP.
Unlike in winter, the summer cooling is mostly provided by the cogeneration system and the ground-source HP. During times with lower electricity prices, the ground-source HP primarily handles the cooling load. When electricity prices are high, the GT takes over most of the cooling production, with the ground-source HP covering any additional requirements. In periods of low electricity costs, any excess power is directed to the electrolyzer for further use, while in times of high electricity prices, it is sold to the grid. The configuration of the hydrogen storage system related to this process is also depicted in Figure 8.

5.2.3. Simulation and Comparative Analysis of the Optimization Schemes

As shown in Table 7, Option 2 reduced the fuel costs and thus the overall operating expenses. Scheme 3 added a ground-source HP to Scheme 1, enhancing the system’s ability to convert low-grade to high-grade energy and providing flexibility in energy supply. Scheme 5, which included both a ground-source HP and an ESS, showed even lower operating costs than Schemes 2 and 3, as depicted in Table 7, confirming the benefits of integrating these technologies. Comparing Schemes 4 and 5, Scheme 5 achieved savings of RMB 123.4 in summer and RMB 202.4 in winter. Additionally, it reduced the equipment maintenance costs, costs associated with electrical interactions, and fuel costs compared with scenarios without DR, highlighting the economic benefits of incorporating IDR into the system.

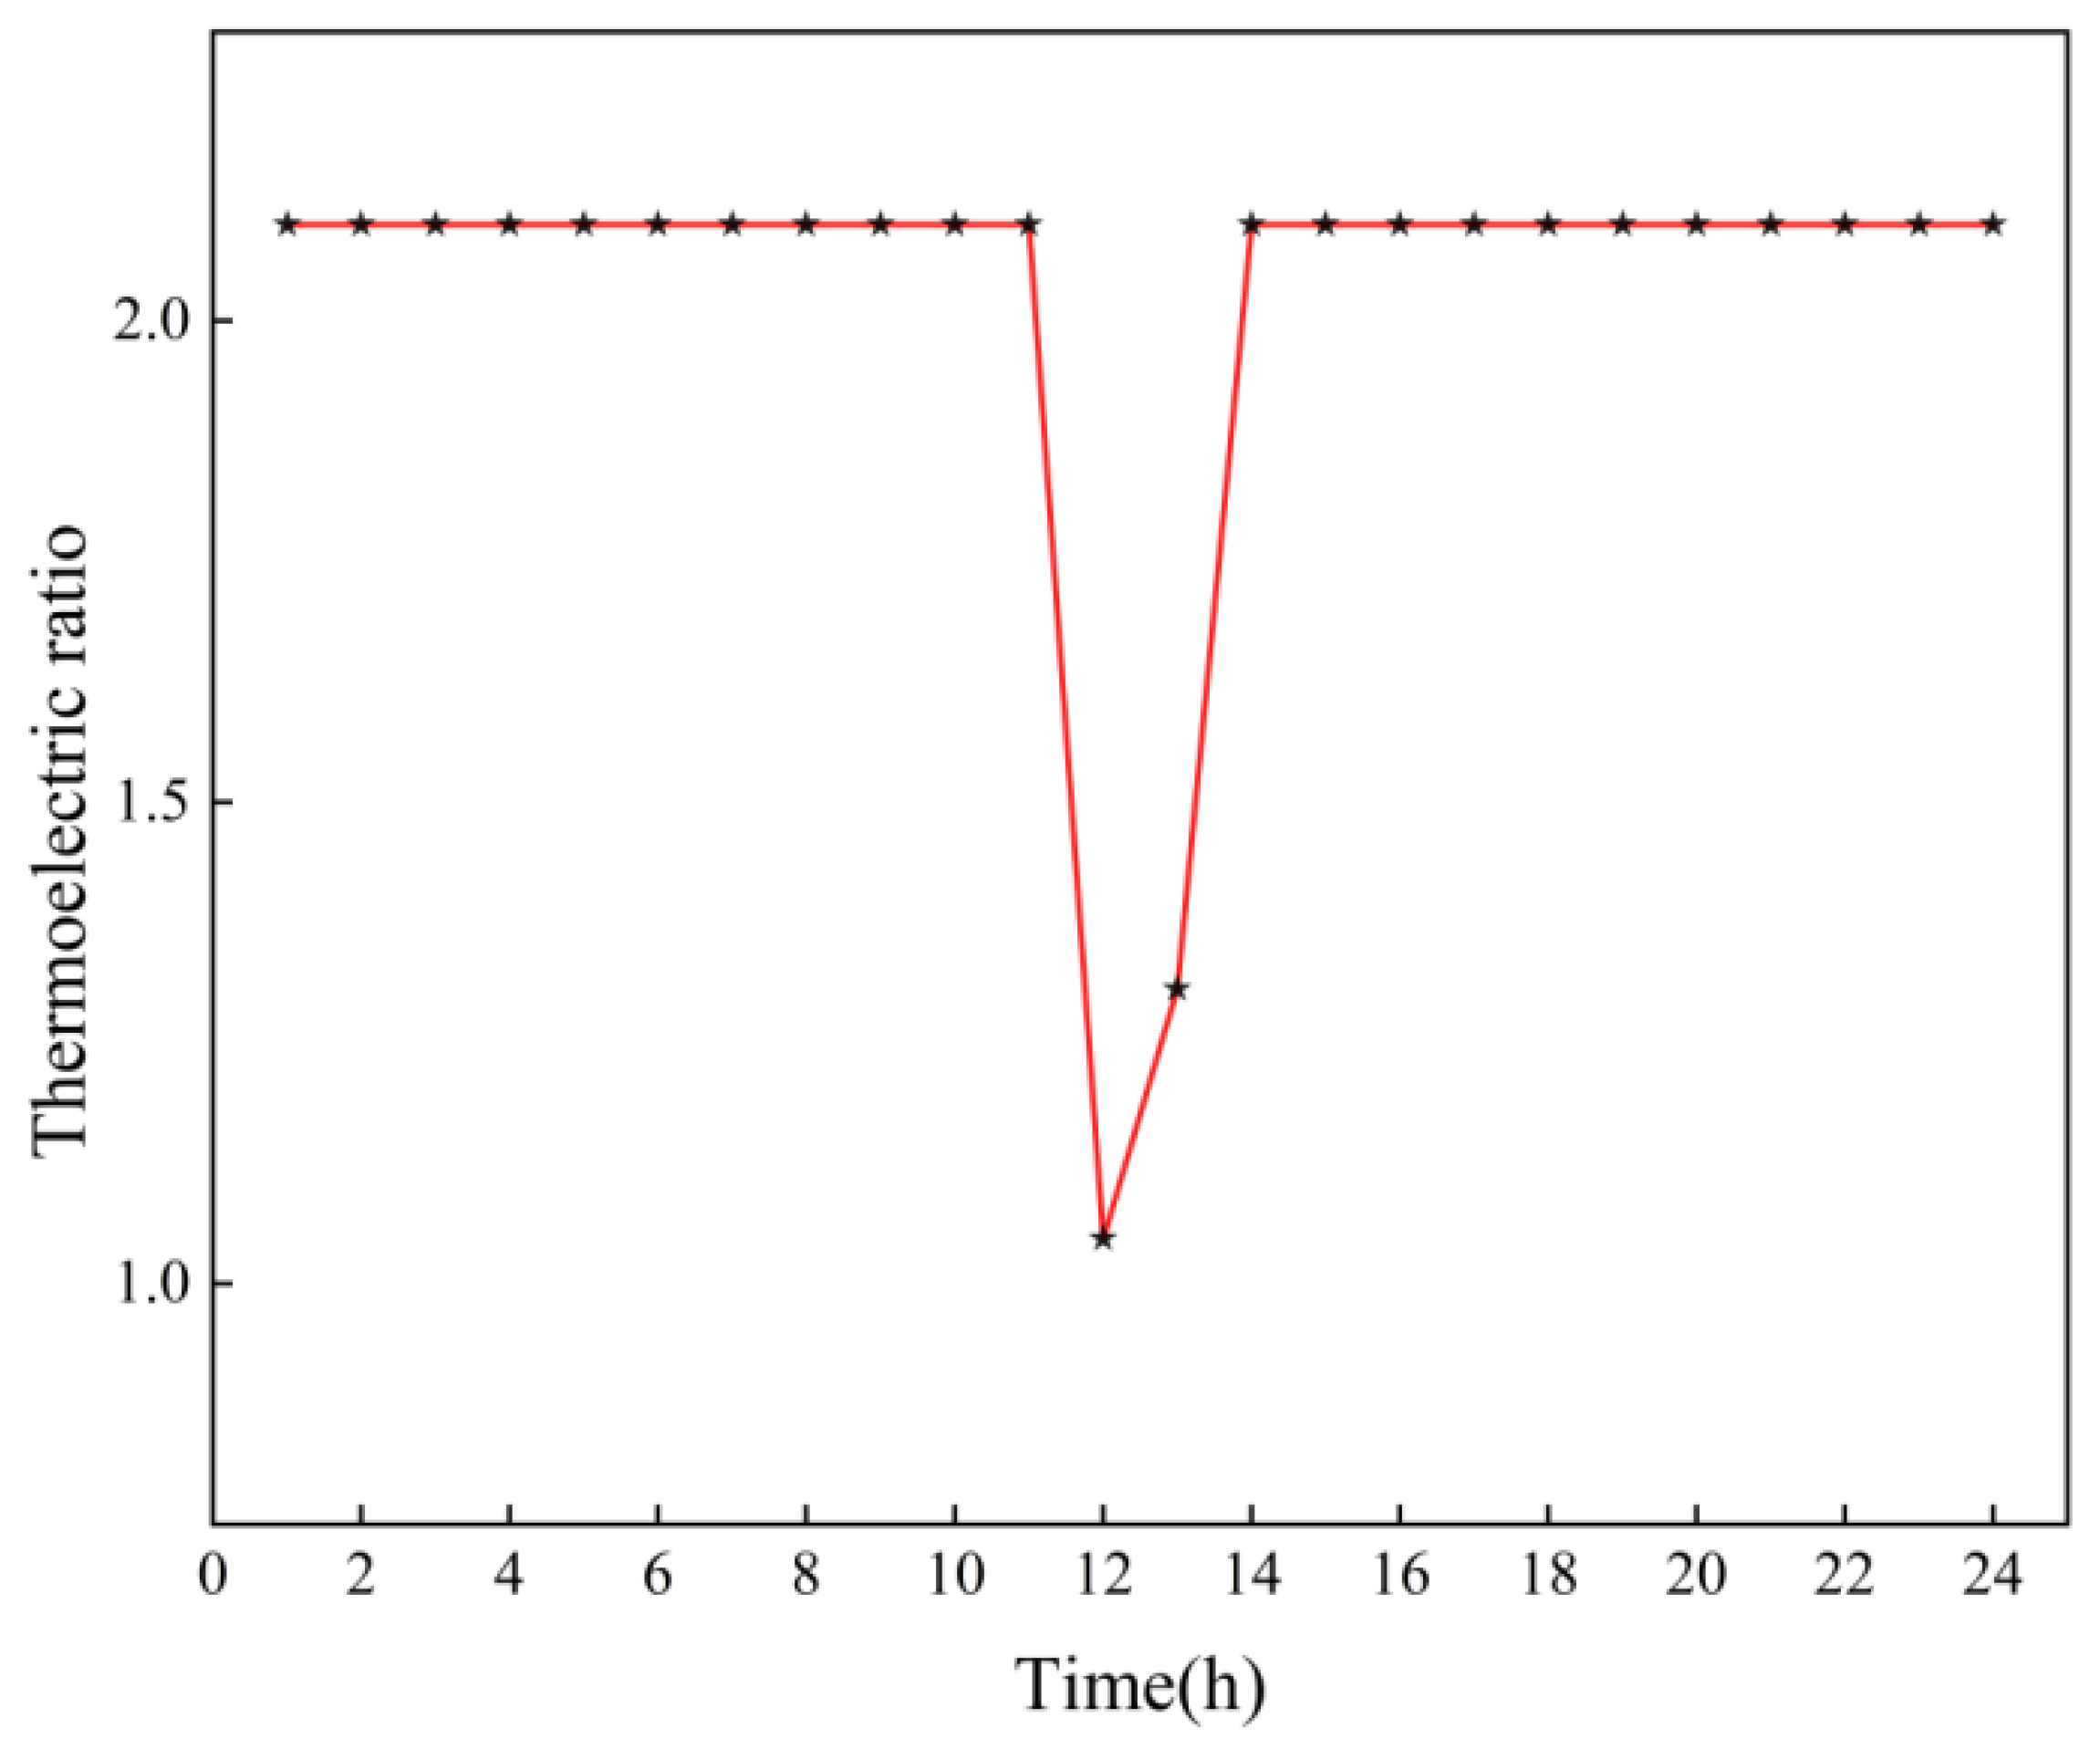
5.2.4. Influence of the HFC’s Adjustable Thermoelectric Ratio System

During midday, the demand for heat drops but the demand for electricity rises, resulting in a decreased thermoelectric ratio. In the afternoon, even though EC reaches its highest and the GT is active, its heat output alone cannot satisfy the heating requirements; hence, the HFC continues to operate at an efficient thermoelectric ratio. The adjustable thermoelectric ratio of the HFC allows it to adapt to varying loads, enhancing the system’s energy efficiency and reducing the operating costs of the RIES. The HFC thermoelectric ratio is shown in Figure 9.

6. Conclusions

An optimal scheduling model for an RIES based on IDR was developed, incorporating a ground-source HP and a hydrogen storage system. After we had compared five scenarios, the following conclusions were drawn.
(1) Introducing P2G technology into the RIES not only enhanced the usage of wind power but also took full advantage of the efficiency of hydrogen energy. The HFC can adjust its thermoelectric ratio to match the system’s energy needs, ToU electricity prices, and the output from each unit. In winter, the HFC can provide heating, reducing the demand on the GT and HP, thus lowering the RIES’s operating costs. It can be seen from the operation results that the operation cost reduced by RMB 685.96.
(2) The ground-source HP’s ability to upgrade low-grade to high-grade energy improved the primary energy use efficiency. According to the results of the system’s operation, the RIES containing a HP can reduce the operating cost by RMB 1198.2. The integration of the HP and the hydrogen storage system decreased the dependence of cooling, heating, and electricity, allowing for better energy management and cost-effectiveness.
(3) Implementing IDR in RIES significantly narrowed the peak-to-valley difference in energy use, leading to a reduction in the daily operating costs of RMB 329.47. Users can adjust their energy use within a comfortable range. This smoothed out the energy demand, created complementarity between different energy types, and reduced the microgrid’s costs while improving energy efficiency.
This study validated the advantages of introducing HP and hydrogen energy storage systems in a RIES under integrated demand response (IDR). Especially in the current environment, industry manufacturers urgently need to find a renewable energy source that can replace traditional fossil energy sources. This study presents an electric hydrogen production technology with an adjustable thermoelectric ratio for energy policy makers and industry practitioners. However, this study was a simulation under ideal conditions. In order to facilitate calculation, the mathematical models of some devices have been simplified, and the accuracy needs to be improved. Moreover, this research did not study the impact of this model on the environment, and did not consider the problems existing in practical applications of the model. In the future, it is recommended that researchers take into account the problems that arise during the implementation of the model and constantly optimize it.

Author Contributions

Methodology, P.D.; Formal analysis, B.Z.; Investigation, K.L.; Resources, Q.X.; Writing—original draft, M.F.; Visualization, J.C. All authors have read and agreed to the published version of the manuscript.

Funding

This research received no external funding.

Data Availability Statement

Data are contained within the article.

Conflicts of Interest

The authors declare no conflict of interest.

References

  1. Wang, Y.; Huang, F.; Tao, S.; Ma, Y.; Ma, Y.; Liu, L.; Dong, F. Multi-objective planning of regional integrated energy system aiming at exergy efficiency and economy. Appl. Energy 2022, 306, 118120. [Google Scholar] [CrossRef]
  2. Yan, R.; Wang, J.; Lu, S.; Ma, Z.; Zhou, Y.; Zhang, L.; Cheng, Y. Multi-objective two-stage adaptive robust planning method for an integrated energy system considering load uncertainty. Energy Build. 2021, prepublish. [Google Scholar] [CrossRef]
  3. Duan, P.; Zhao, B.; Zhang, X.; Fen, M. A day-ahead optimal operation strategy for integrated energy systems in multi-public buildings based on cooperative game. Energy 2023, 275, 127395. [Google Scholar] [CrossRef]
  4. Xu, J.; Wang, X.; Gu, Y.; Ma, S. A data-based day-ahead scheduling optimization approach for regional integrated energy systems with varying operating conditions. Energy 2023, 283, 128534. [Google Scholar] [CrossRef]
  5. González-Delgado, Á.D.; Vargas-Mira, A.; Zuluaga-García, C. Economic Evaluation and Technoeconomic Resilience Analysis of Two Routes for Hydrogen Production via Indirect Gasification in North Colombia. Sustainability 2023, 15, 16371. [Google Scholar] [CrossRef]
  6. Ahern, E.P.; Deane, P.; Persson, T.; Gallachóir, B.; Murphy, J.D. A perspective on the potential role of renewable gas in a smart energy island system. Renew. Energy 2015, 78, 648–656. [Google Scholar] [CrossRef]
  7. Nazari-Heris, M.; Mirzaei, M.A.; Mohammadi-Ivatloo, B.; Marzband, M.; Asadi, S. Economic-environmental effect of power to gas technology in coupled electricity and gas systems with price-responsive shiftable loads. J. Clean. Prod. 2019, 244, 118769. [Google Scholar] [CrossRef]
  8. Luo, Z.; Wang, J.; Xiao, N.; Yang, L.; Zhao, W.; Geng, J.; Lu, T.; Luo, M.; Dong, C. Low Carbon Economic Dispatch Optimization of Regional Integrated Energy Systems Considering Heating Network and P2G. Energies 2022, 15, 5494. [Google Scholar] [CrossRef]
  9. Khalili, R.; Khaledi, A.; Marzband, M.; Nematollahi, A.F.; Vahidi, B.; Siano, P. Robust multi-objective optimization for the Iranian electricity market considering green hydrogen and analyzing the performance of different demand response programs. Appl. Energy 2023, 334, 120737. [Google Scholar] [CrossRef]
  10. Zhang, X.; Zhang, Y. Environment-friendly and economical scheduling optimization for integrated energy system considering power-to-gas technology and carbon capture power plant. J. Clean. Prod. 2020, 276, 123348. [Google Scholar] [CrossRef]
  11. Ancona, M.A.; Antonucci, V.; Branchini, L.; Catena, F.; De Pascale, A.; Di Blasi, A.; Ferraro, M.; Italiano, C.; Melino, F.; Vita, A. Parametric Thermo-Economic Analysis of a Power-to-Gas Energy System with Renewable Input, High Temperature Co-Electrolysis and Methanation. Energies 2022, 15, 1791. [Google Scholar] [CrossRef]
  12. Li, X.; Li, T.; Liu, L.; Wang, Z.; Li, X.; Huang, J.; Huang, J.; Guo, P.; Xiong, W. Operation optimization for integrated energy system based on hybrid CSP-CHP considering power-to-gas technology and carbon capture system. J. Clean. Prod. 2023, 391, 136119. [Google Scholar] [CrossRef]
  13. Xu, L.; Wang, S.; Wang, Z.; Qi, X. Dual-layer self-healing strategy for standalone building energy systems: A case study of a tropical island. Energy Build. 2023, 283, 112827. [Google Scholar] [CrossRef]
  14. Yun, Y.; Zhang, D.; Yang, S.; Li, Y.; Yan, J. Low-carbon optimal dispatch of integrated energy system considering the operation of oxy-fuel combustion coupled with power-to-gas and hydrogen-doped gas equipment. Energy 2023, 283, 129127. [Google Scholar] [CrossRef]
  15. Mansour-Saatloo, A.; Pezhmani, Y.; Mirzaei, M.A.; Mohammadi-Ivatloo, B.; Zare, K.; Marzband, M.; Anvari-Moghaddam, A. Robust decentralized optimization of Multi-Microgrids integrated with Power-to-X technologies. Appl. Energy 2021, 304, 117635. [Google Scholar] [CrossRef]
  16. Nojavan, S.; Nourollahi, R.; Pashaei-Didani, H.; Zare, K. Uncertainty-based electricity procurement by retailer using robust optimization approach in the presence of demand response exchange. Int. J. Electr. Power Energy Syst. 2019, 105, 237–248. [Google Scholar] [CrossRef]
  17. Ali, P.; Mahdi, S. A system dynamics investigation on the long-term impacts of demand response in generation investment planning incorporating renewables. Renew. Sustain. Energy Rev. 2023, 171, 113003. [Google Scholar]
  18. Jordehi, A.R.; Mansouri, S.A.; Tostado-Véliz, M.; Hossain, M.J.; Nasir, M.; Jurado, F. Optimal placement of hydrogen fuel stations in power systems with high photovoltaic penetration and responsive electric demands in presence of local hydrogen markets. Int. J. Hydrogen Energy 2023, 360, 62–76. [Google Scholar]
  19. Jeseok, R.; Jinho, K. A prospect-theoretic game approach to demand response market participation through energy sharing in energy storage systems under uncertainty. Energy Rep. 2023, 9, 1093–1103. [Google Scholar]
  20. Zhang, S.; Wen, M.; Cheng, H.; Hu, X.; Xu, G. Reliability evaluation of electricity-heat integrated energy system with heat pump. CSEE J. Power Energy Syst. 2018, 4, 425–433. [Google Scholar] [CrossRef]
  21. Yin, L.; Tao, M. Balanced broad learning prediction model for carbon emissions of integrated energy systems considering distributed ground source heat pump heat storage systems and carbon capture & storage. Appl. Energy 2023, 329, 120269. [Google Scholar]
  22. Yin, L.; Tao, M. Correlational broad learning for optimal scheduling of integrated energy systems considering distributed ground source heat pump heat storage systems. Energy 2022, 239, 122531. [Google Scholar] [CrossRef]
  23. Chen, L.; Tang, H.; Wu, J.; Li, C.; Wang, Y. A robust optimization framework for energy management of CCHP users with integrated demand response in electricity market. Int. J. Electr. Power Energy Syst. 2022, 141, 108181. [Google Scholar] [CrossRef]
  24. Lu, Q.; Guo, Q.; Zeng, W. Optimal dispatch of community integrated energy system based on Stackelberg game and integrated demand response under carbon trading mechanism. Appl. Therm. Eng. 2023, 219, 119508. [Google Scholar] [CrossRef]
  25. Zeng, L.; Xu, J.; Wang, Y.; Liu, Y.; Tang, J.; Jiang, Z.; Wen, M. Day-ahead interval optimization of combined cooling and power microgrid based on interval measurement. Energy Build. 2022, 273, 112383. [Google Scholar] [CrossRef]
  26. Zhu, X.; Sun, Y.; Yang, J.; Dou, Z.; Li, G.; Xu, C.; Wen, Y. Day-ahead energy pricing and management method for regional integrated energy systems considering multi-energy demand responses. Energy 2022, 251, 123914. [Google Scholar] [CrossRef]
  27. Bin, Q.; Shaoxin, S.; Kai, W.; Zhen, Y. Optimal operation of regional integrated energy systems, including demand response and tiered carbon trading mechanisms. J. Power Syst. Autom. 2022, 34, 88–101. [Google Scholar]
  28. Smith, M.; Bevacqua, A.; Tembe, S.; Lal, P. Life cycle analysis (LCA) of residential ground source heat pump systems: A comparative analysis of energy efficiency in New Jersey. Sustain. Energy Technol. Assess. 2021, 47, 101364. [Google Scholar] [CrossRef]
  29. Alessandro, F.; Caterina, G. Recent and Future Advances in Water Electrolysis for Green Hydrogen Generation: Critical Analysis and Perspectives. Sustainability 2023, 15, 16917. [Google Scholar]
  30. Zhao, J.; Chen, J.; Liu, P. Simulation Study on Heating Stability of PV/T-GSHP Automatic Control Heating System Based on TRNSYS. Energies 2023, 16, 4341. [Google Scholar] [CrossRef]
  31. Xiao, H.; Long, F.; Zeng, L.; Zhao, W.; Wang, J.; Li, Y. Optimal scheduling of regional integrated energy system considering multiple uncertainties and integrated demand response. Electr. Power Syst. Res. 2023, 217, 109169. [Google Scholar] [CrossRef]
Figure 1. Framework of the RIES.
Sustainability 16 01217 g001
Figure 2. Forecast curve of WT, PV, and loads in winter.
Sustainability 16 01217 g002
Figure 3. Forecast curve of WT, PV, and loads in summer.
Sustainability 16 01217 g003
Figure 4. Electricity tariffs.
Sustainability 16 01217 g004
Figure 5. IDR load curve in winter.
Sustainability 16 01217 g005
Figure 6. IDR load curve in summer.
Sustainability 16 01217 g006
Figure 7. Optimal intraday dispatch results of Scheme 5.
Sustainability 16 01217 g007
Figure 8. Balance of the energy storage system.
Sustainability 16 01217 g008
Figure 9. Diagram of the thermoelectric ratio.
Sustainability 16 01217 g009
Table 1. Summary of the literature review.
Ref.SystemObjective FunctionP2GHPDR
Electric Natural GasElectric Hydrogen ProductionThermoelectric Ratio Adjustability CDR and HDREDR
[6]P2G systemMinimal operating cost
[7]Electric power systemMinimal operating costs and minimal environmental costs
[8]P2G system, heating systemMinimal operating costs and minimal carbon trading costs
[9]RIESMinimal operating costs
[10]IESMinimal operating costs and minimal environmental costs
[11]P2G systemMinimal operating costs and reductions in CO2
[12]P2G system, CHPMinimal operating costs and CO2 reduction
[18]P2G system, electric power systemMinimal operating costs
[20]CHPMinimal operating costs
[21]IESMinimal operating costs
[22]IESMinimal operating cost and stability
Proposed
method
RIESMinimal operating costs
Table 2. Abbreviations and variable parameters.
Abbreviation P p v t Photovoltaic Output Value
AR Absorption refrigerator P p v t Photovoltaic output value
CS Cooling storage L p t Solar irradiance
DR Demand response Q g t t GT’s remaining heat at time t
EC Electrolytic cell Q c , a r t Cooling capacity of the AR at time t
E/H/CL Electrical/heating/cooling load Q a r , i n t Input power of the AR at time t
GT Gas turbine Q h , w h b t Heat production of the WHB at time t
HFC Hydrogen fuel cell P e , g t t GT output power at time t
HP Geothermal heat pump Q w h b , i n t Input power of the WHB at time t
HSTHydrogen storage tank L f e l , e , h , c t Fixed load at time t
HSHeating storage L s e l , e , h , c t The load can be transferred at time t
IDRIntegrated demand response P h 2 , e l Hydrogen energy output by the EC
PVPhotovoltaic P e , h f c ,   P h , h f c HFC’s output of electricity and heat
RIESRegional integrated energy system Q h p , c t , Q h p , h t HP’s cooling, heat production at
WHBWaste heat boiler time t
WTGas turbine P h p , c t ,   P h p , h t HP’s cooling and heat consumption at
Variables time t
P w t Wind field’s output valueIndices
v m t Field speed T Index for a typical day
P r , m Rated power of the wind farm t Index for time periods in a typical day
v c t Wind field’s cut wind speed i , j Index of scenarios
v r t Wind field’s cutting wind speed
Table 3. Study cases.
CaseMulti-Energy
Coupling
Heat Pump SystemEnergy Storage SystemIDR
1××
2×
3×
4×
5
Table 4. System parameters of the RIES’s operation.
Microsource TypeLower Power Limit (kW)Upper Power Limit (kW)Lower Limit of Climbing Speed (kW/h)Upper Limit of Climbing Speed (kW/h)Minimum Boot Time (h)Minimum Shutdown Time (h)
GT2022071432
AR3028061232
WHB3028061232
HP10150103022
EC1010082022
HFC1010082022
Power grid−300300----
Table 5. Parameters of the energy storage devices.
Type of Energy StorageCharge and Discharge RateConsumption RateMinimum StateMaximum StateCapacity (kW·h)
Hydrogen energy storage0.920.0090.20.9200
Thermal energy storage0.900.010.20.9200
Cold energy storage0.900.010.20.9200
Table 6. Unit’s maintenance costs.
Microsource TypeUnit Price (RMB/kW)Microsource TypeUnit Price (RMB/kW)
WT0.029HP0.023
PV0.025WHB0.021
GT0.025EC0.012
AR0.021HFC0.028
HST0.0018HS/CS0.0014
Table 7. Operating costs of different RIES cases.
CaseRIES’s Running Cost (RMB)Interaction Cost (RMB)Start–Stop Cost (RMB)Fuel Cost (RMB)RIES’s Total Cost (RMB)
1377.18−422.385.6810,242.1510,202.63
2401.47183.9923.748907.479516.67
3275.263868.007.74701.188852.15
4330.233650.2931.544635.878647.94
5321.753526.3328.014442.38318.47
Disclaimer/Publisher’s Note: The statements, opinions and data contained in all publications are solely those of the individual author(s) and contributor(s) and not of MDPI and/or the editor(s). MDPI and/or the editor(s) disclaim responsibility for any injury to people or property resulting from any ideas, methods, instructions or products referred to in the content.

