Article

Optimization of Rebar Usage and Sustainability Based on Special-Length Priority: A Case Study of Mechanical Couplers in Diaphragm Walls

Department of Architectural Engineering, Kyung Hee University, Yongin-si 17104, Republic of Korea
*
Author to whom correspondence should be addressed.
Sustainability 2024, 16(3), 1213; https://doi.org/10.3390/su16031213
Submission received: 11 December 2023 / Revised: 22 January 2024 / Accepted: 26 January 2024 / Published: 31 January 2024
(This article belongs to the Special Issue Modelling Material Performance in Sustainable Construction)

Abstract

:
The construction industry generates significant CO2 emissions and reinforcing bars (rebar), which are a major contributor to this environmental impact. Extensive research has been conducted to address this particular issue. Recent research advances have introduced algorithms to reduce rebar waste and consumption, demonstrating the feasibility of achieving near-zero rebar cutting waste (N0RCW) through the consideration of special-length rebars. However, conventional lap splices, the most common rebar joint method, continue to consistently consume excessive quantities of rebar, despite extending beyond their mandated zones. Conversely, couplers can eliminate rebar lengths required for lapping splices, reducing the usage of rebar. Applying special-length rebars and couplers in heavily loaded structures like diaphragm walls can also significantly reduce rebar usage and cutting waste, consequently reducing CO2 emissions and the environmental and economic impacts. This research aims to optimize rebar consumption and sustainability in diaphragm wall structures by integrating mechanical couplers with a special-length rebar approach. A case study confirmed a substantial reduction in purchased rebar usage (17.95% and 5.38%), carbon emissions (15.24% and 2.25%), water footprint (17.95% and 5.38%), and environmental impact (95.18% and 30.27%) compared to the original design and recent diaphragm wall study, respectively. The broad implementation of the proposed method across various buildings and infrastructure projects could further multiply these benefits, enabling the achievement of the sustainable development goals (SDGs) adopted by the United Nations to foster sustainable construction.

1. Introduction

Steel reinforcement bars have a high embodied carbon footprint about 9.2 times that of concrete [1], making them one of the major contributors to greenhouse gas (GHG) emissions. The US Environmental Protection Agency [2] denotes that GHGs comprise 79.4% CO2, 11.5% CH4 (methane), 6.2% N2O (nitrous oxide), and 3% fluorinated gases. In 2020, it was reported that the global consumption of concrete reached 14 billion m3 [3]. This amount corresponds to 1.078 billion tons of rebar, a cutting waste of 53.9 million tons, and a waste of 188.92 million tons of CO2. Improperly managed cutting waste can end up in landfill, occupying the valuable limited space of landfill and contributing to the production of landfill gas (LFG). LFGs are mainly constituted of 40–50% CO2 and 50–60% CH4 [4], with trace amounts of H2S (hydrogen sulfide) [5]. Methane is a powerful GHG and is estimated to have a global warming potential (GWP) of 27–30 over 100 years [2]. It has been discovered that rebar and concrete can also significantly contribute to acid rain formation [6]. Acid rain forms when harmful gases, such as sulfur dioxide (SO2) and nitrogen dioxide (NO2), react with water vapor in the atmosphere [7]. Acid rain causes significant harm to the environment, particularly to the soil. In addition, steel and rebar production may contribute to mercury emissions besides carbon emissions, leading to ecotoxicity [8]. Mercury emissions can adversely impact the environment by polluting water bodies, harming wildlife, and posing a risk to human health. Furthermore, rebar production exhibits high resource demands, necessitating 304–525 kWh of electricity and 54–96 m3 of fresh water per metric ton [9]. Additionally, reliance on inefficient, non-renewable thermal power plants for electricity generation potentially exacerbates carbon emissions.
Conventional lap splicing, the prevailing method for connecting rebars, is also a major contributor to rebar waste and CO2 emissions in the construction industry; in particular, this applies to large-scale projects like diaphragm walls due to the long, overlapping lengths of rebar required. The extent of lap-splice-based rebar waste depends on the rebar diameter, required lap length, and cutting pattern.
One challenge in reducing rebar waste is meeting the requirements of adherence to lap splice regulations mandated by building codes. Lap splice length is typically derived from the bonding strength between concrete and steel rebar, taking into consideration the safety factor. Thus, the structural design must provide a safe, sufficient lap splice length. However, the lap splice position or lapping regional regulations mandated by the different building codes and stock-length rebar usage restrict the reduction in rebar usage and cutting waste, as evidenced in various studies [10,11,12,13], in a range from 7.2% to 10.6%, exceeding the common range of 3–5% [14]. Nonetheless, it is difficult to adhere to these regulations on site; thus, lap splice positions are often not followed in practice [15]. Therefore, this approach continually consumes a greater quantity of rebars, even when not adhering to mandated regulations. Researchers have proposed special-length rebars as one of the solutions to the issues of high rebar consumption and waste. Investigations have confirmed that a special-length rebar enables a further reduction in cutting waste to below 3% [16,17].
Massive substructures, such as diaphragm walls, can illustrate the issue. A recent case study found that purchasing stock-length rebars for reinforcement in a total of 293 diaphragm wall panels resulted in 2173 tons (9.62%) of cutting waste [16], as large-diameter rebars (32 mm and 40 mm) were required to resist the massive lateral forces, such as an earthquake, in addition to the pressure of soil. The study additionally revealed that the utilization of special-length rebars in diaphragm walls resulted in the consumption of 19,582 tons of rebar and the generation of 0.77% of cutting waste. Consequently, the adverse environmental impact due to high rebar usage remains evident. Furthermore, the ACI building code [18] prohibits lap splices for rebar sizes with a diameter of 36 mm and larger due to long overlapping lengths. Mechanical couplers can be used instead of lap splices to effectively transfer the tensile strength of the rebar while maintaining structural integrity and stability. Couplers eliminate the need for lap splices, which further reduces the quantity of the required rebar, the associated cutting waste, and the environmental impact.
Prior studies in this area have primarily focused on columns [11,19], beams [17,20], and shear walls [11] for rebar cutting waste optimization, thus neglecting an essential structural component: diaphragm walls. Diaphragm walls play a pivotal role as the foundational backbone of building structures [21], serving to connect various structural elements. Comprising multiple wall panels with similar reinforcement, the unique characteristic of the diaphragm wall rebar lies in its prefabrication into rebar cages. A significant reduction in rebar usage and carbon emissions can be expected upon performing detailed reinforcement design and optimization for the special lengths required.

1.1. Rebar Usage and Cutting Waste Issues

The global concrete volume reached 14 billion m3 in 2020 [3]. Converting this amount with a rebar-to-concrete consumption ratio of 0.077 tons/m3 [1] indicates that 1.078 billion tons of rebar were used. Assuming a 5% cutting waste rate, this resulted in 53.9 million tons of rebar cutting waste and 188.92 million tons of carbon emissions. Cutting steel reinforcement bars (rebar) are unavoidable in reinforced concrete (RC) structure construction and generate cutting waste and considerable carbon emissions [22]. Considering a rebar price of USD 900/ton [23], a unit of rebar carbon emissions of 3.505 ton-CO2/ton [24], and a carbon price of USD 75/ton-CO2 [25], implies a loss of USD 62.68 billion for the industry. This condition urges stronger efforts to reduce rebar usage and cutting waste, thus contributing to environmental sustainability.
Rebar usage and cutting waste issues are covered in the Sustainable Development Goals (SDGs) [26] created by the United Nations in 2015, including, in particular, SDGs 9, 12, 13, and 15. SDG 9 aims to build resilient infrastructure, promote inclusive and sustainable industrialization, and foster innovation. SDG 12 aims to ensure sustainable consumption and production patterns; SDG 13 aims to take serious action to combat climate change and its impacts; and, finally, SDG 15 aims to protect and restore the land and halt land degradation. Reducing rebar usage and its impact will accelerate the achievement of the SDGs in the civil engineering and construction sectors.
Previous studies exploring rebar waste minimization have predominantly considered stock-length rebars [9,11,12,13,27,28,29], with recent efforts employing diverse approaches, like optimizing cutting patterns using multiple stock lengths [9], integrating BIM with metaheuristics [28], and minimizing rebar cost through column generation [29]. Some investigations [10,11] have explored lap splice position optimization with stock-length rebar to reduce rebar cutting waste. However, these approaches have still produced a high cutting waste rate. Special-length rebar concepts have been introduced for cutting pattern combinations and have been confirmed as significantly reducing cutting waste [14,19,30]. Special lengths can be customized in 0.1 m intervals and have certain order requirements, such as maximum and minimum special lengths, minimum ordered quantity, and preorder time. Rachmawati et al. [16] proposed a three-step algorithm to minimize rebar cutting waste in diaphragm walls by considering special-length rebars and lap splice position adjustments. The algorithm generated 0.77% rebar cutting waste from 293 panels of diaphragm wall, saving 10,399 tons of CO2 emissions and USD 3,480,108 in costs.

1.2. Mechanical Couplers

The use of mechanical couplers has increased in construction due to their advantages, which solve the limitations of conventional lap splices. Table 1 summarizes the limitations of conventional lap splices identified by various studies. Furthermore, several investigations [31,32,33] have emphasized that the application of lap splices may over-reinforce the structural section, reduce ductility, and alter the deformation capacity.
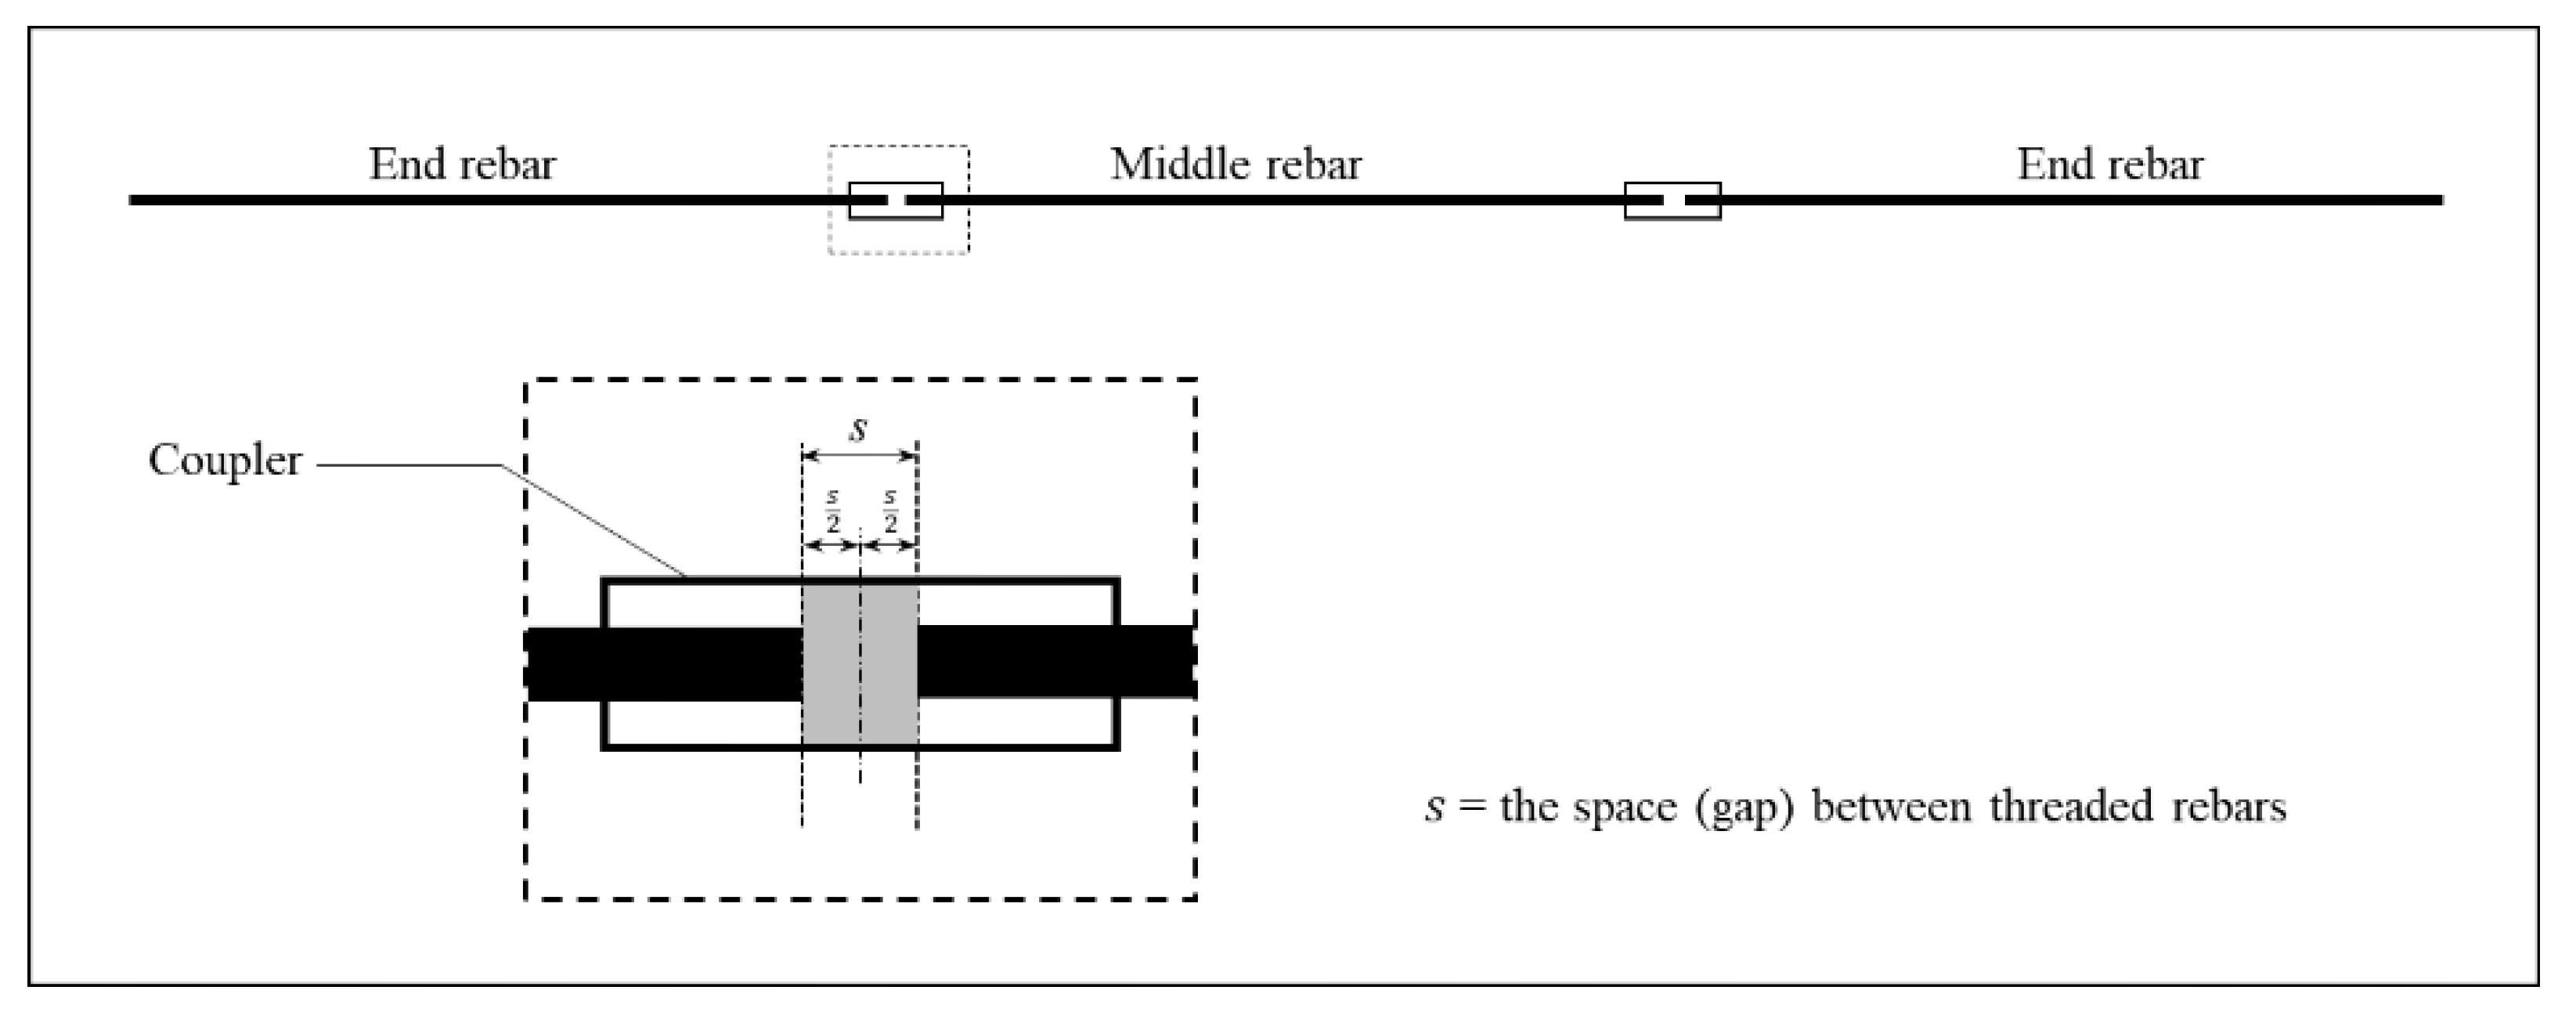
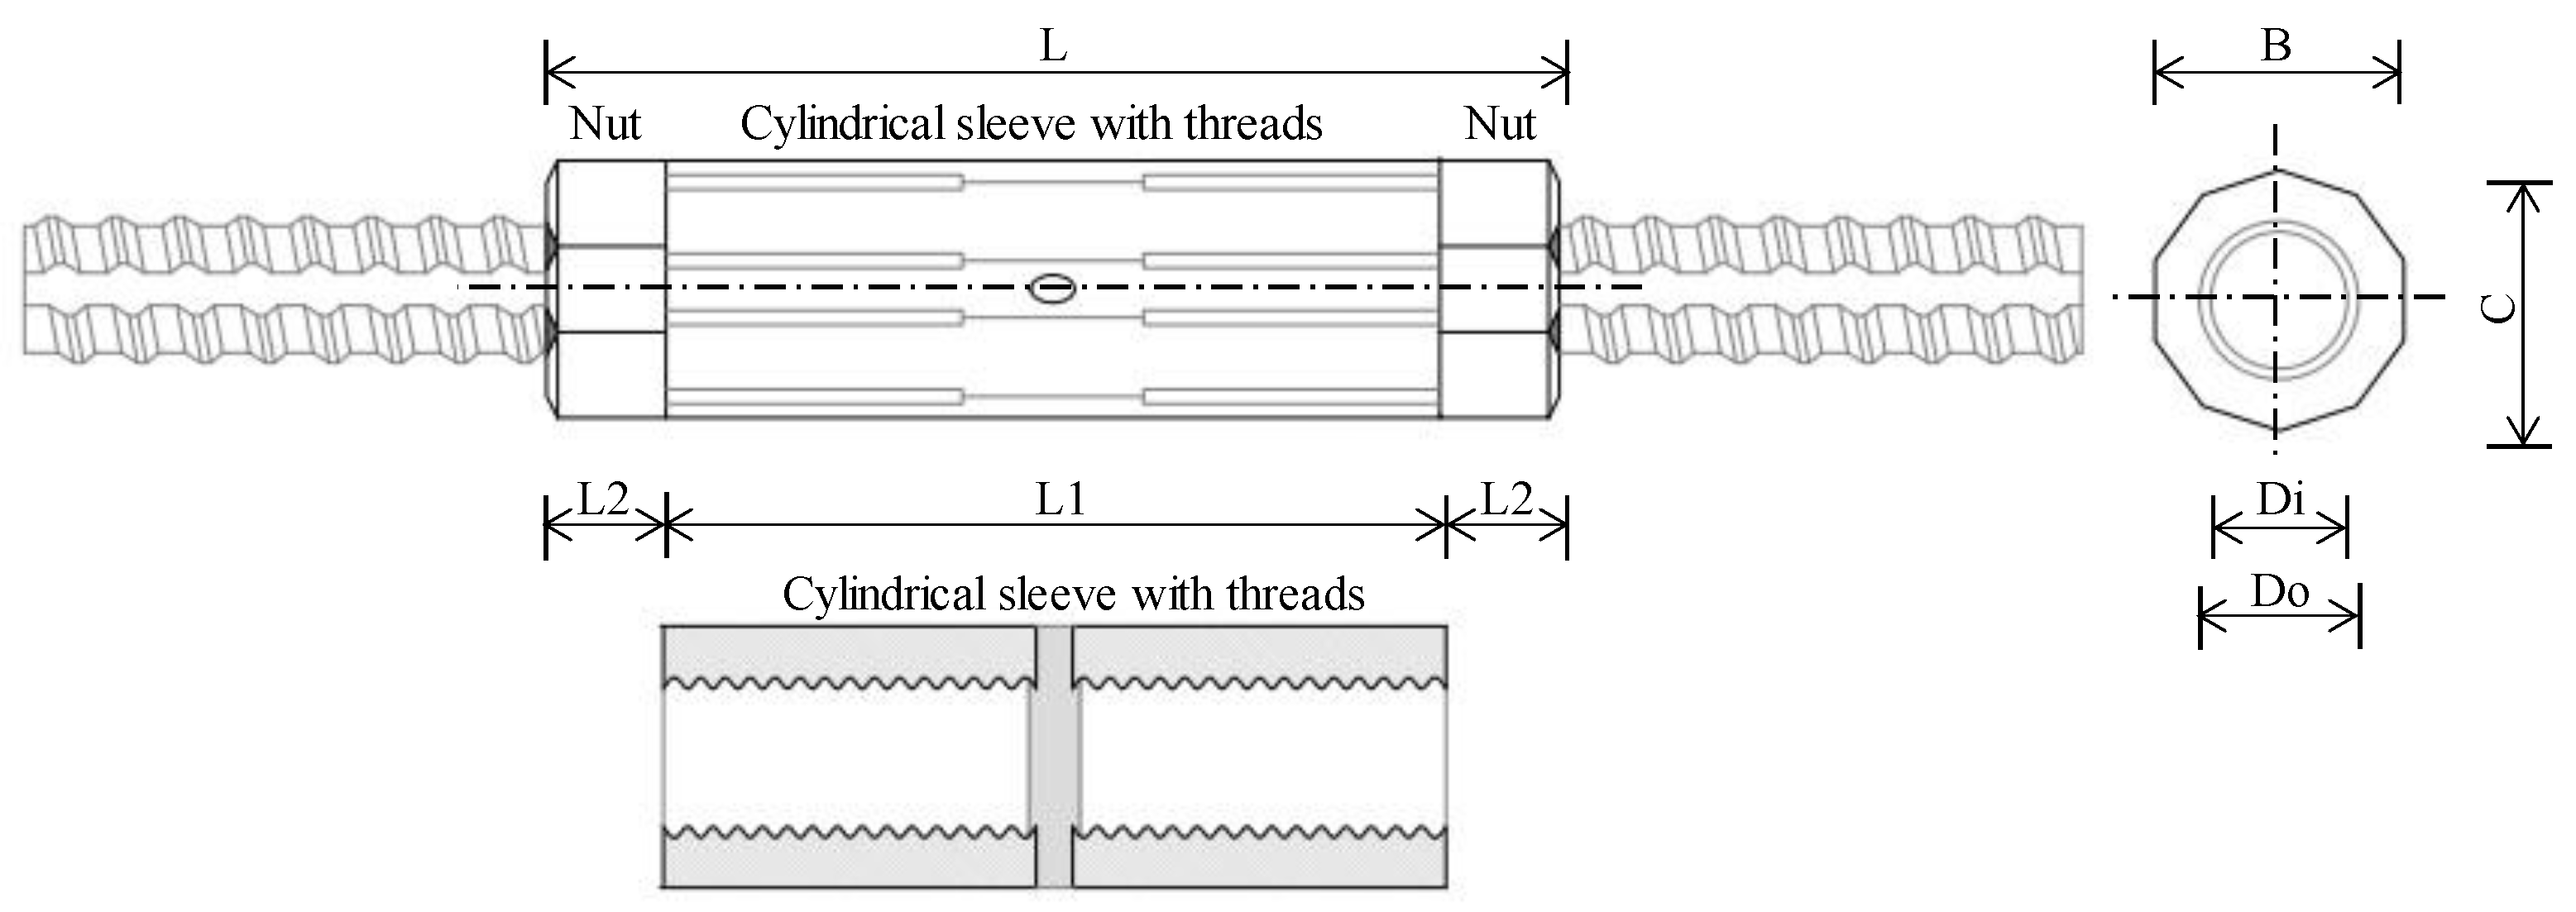
A mechanical coupler, also known as a mechanical splice or rebar coupler, is a device used for connecting two rebars, eliminating the lapping length, and ensuring the structural stability and strength of RC structures. In seismic applications, the coupler length should be less than 15 times the rebar diameter [37]. Rebars with different diameters can be connected laterally or vertically by using couplers. Mechanical coupler utilization can significantly reduce rebar congestion and offer prefabrication of reinforcement on site for precast concrete structures [38]. Mechanical couplers have been shown to offer several benefits [34]: (1) reduced rebar congestion, (2) significant reduction in rebar waste and consumption, (3) effective control of concrete crack propagation, (4) improved structural continuity between bars, ensuring better integrity, (5) reduced labor required and construction costs, and (6) feasibility of connecting rebars of different lengths and diameters.
In the current construction industry, various types of couplers are employed. The five types of couplers that are readily available are (1) shear screw couplers, (2) headed bar couplers, (3) grouted sleeve couplers, (4) threaded couplers, and (5) swaged couplers [37]. The most prevalent type is the threaded coupler, characterized by its short length and ease of installation [39,40]. Four types of threaded couplers are commonly used: parallel threaded couplers (PTC), taper threaded couplers (TTC), upset-headed couplers (UHC), and rib thread couplers (RTC) [41].

1.3. Research Objective

Rapid urbanization and the construction of high-rise buildings are reducing the availability of urban land [42]. This has led to an increase in the construction of underground and buried structures in metropolitan cities [43], including diaphragm walls. Population growth and urbanization are driving the demand for construction, which in turn is depleting the natural resources used in construction materials and harming the environment [44]. The environmental impact of rebar usage in construction is heightened by the combination of demanding construction conditions and the reliance on conventional lap splices, which require excessive rebar consumption. Interestingly, despite the established potential of couplers and special-length rebar to reduce rebar usage, their application as rebar usage and waste minimization strategies remains understudied in the literature. This paucity of research necessitates further investigation into their effective integration to optimize rebar usage and promote sustainable construction.
Given the considerable demand for steel rebars in diaphragm wall construction, it represents an exemplary case study for optimizing rebar usage and environmental sustainability. The primary objective of this research is to assess the effectiveness of mechanical couplers in optimizing rebar usage, cutting waste in the construction of diaphragm walls, and improving sustainability by integrating mechanical couplers with a special-length priority approach. In this research, a comprehensive analysis of rebar usage and cutting waste, considering the environmental and economic implications, is presented. To identify the effectiveness and novelty of the proposed method, a comparative analysis is undertaken between the conventional lap splice method of the original design and the recent study outlined above [16]. This comparison will encompass rebar usage, cutting waste, CO2 emissions, the related environmental impact associated with rebar, and the economic impact of such optimization. Furthermore, this research will analyze the cost comparison between using couplers and the conventional method of overlapping rebar. This research provides the construction industry with new insights into optimizing rebar usage and waste while maintaining structural integrity and addressing the environmental impact of rebar. Moreover, it also accelerates sustainable and green construction practices and the achievement of the Sustainable Development Goals (SDGs).

2. Characteristics of Diaphragm Wall

Diaphragm walls are underground, reinforced concrete structures that extend vertically or at a slight angle, and they are commonly used in underground construction, foundation systems, and retaining walls to provide lateral support. Diaphragm walls resist lateral forces from soil and water pressure and transfer lateral loads induced by seismic events or other dynamic forces to the foundations of a building [21,
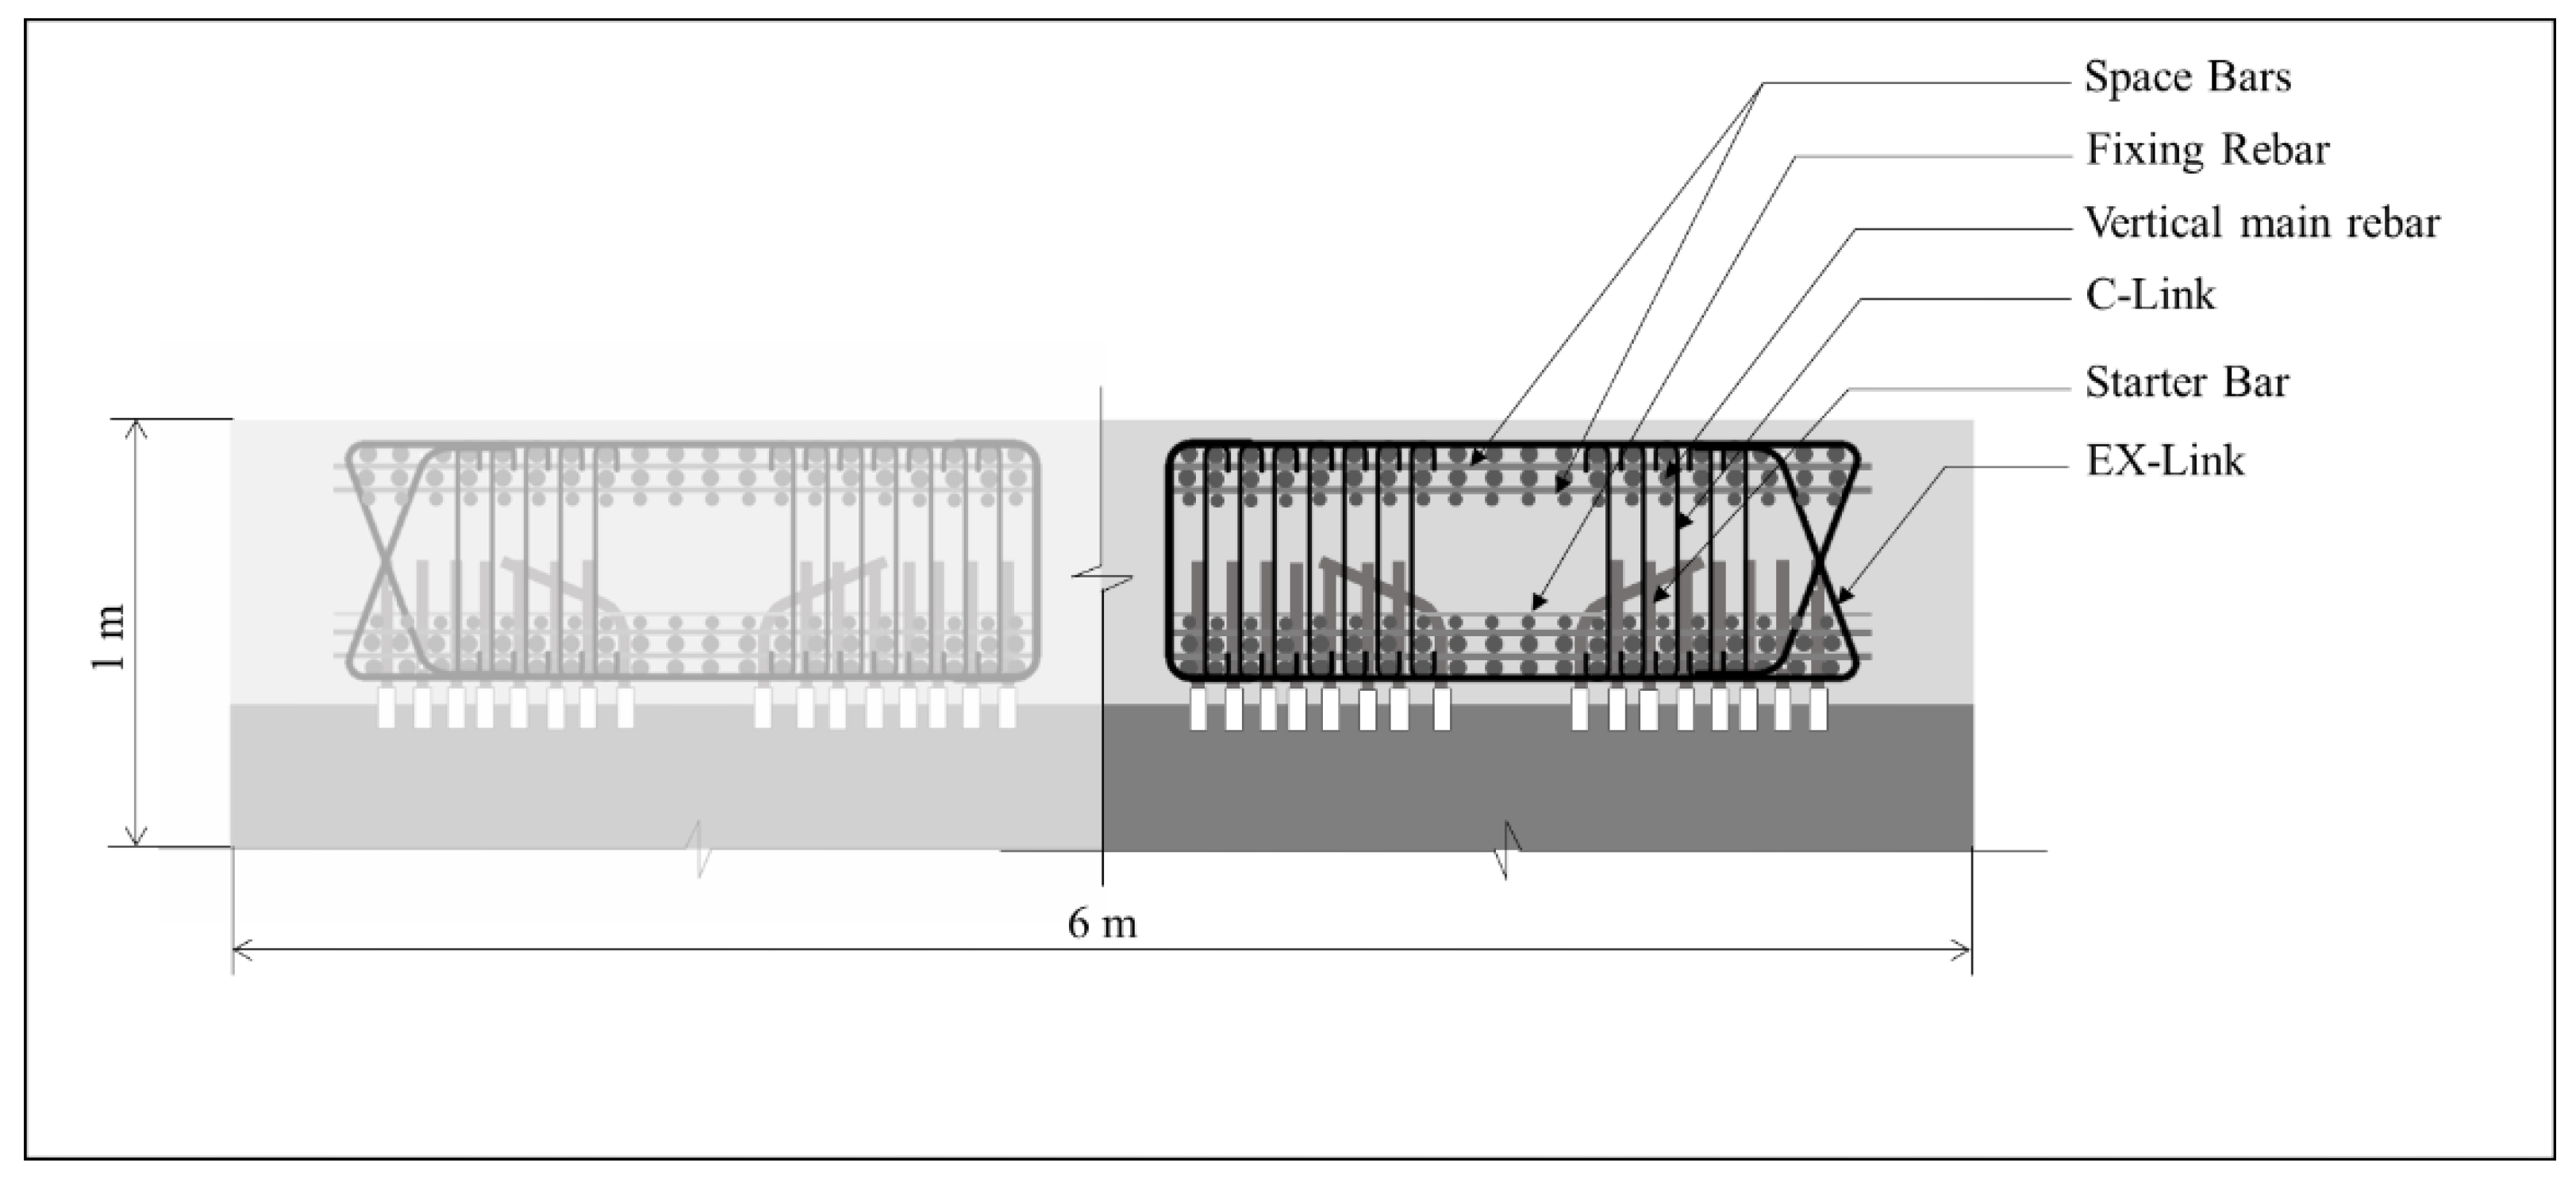
43]. A diaphragm wall system is generally composed of multiple wall panels. A typical diaphragm wall panel can vary from 3 m to 7 m in length and from 0.6 m to 1.8 m in thickness, depending on the structural requirement. Main vertical rebars provide resistance to vertical and bending loads generated by lateral loads from soil and water pressure and seismic activity. Horizontal (space) rebars distribute loads evenly along the length of the wall. Transverse shear, shear link, or tie reinforcements resist the shear forces caused by lateral loads.
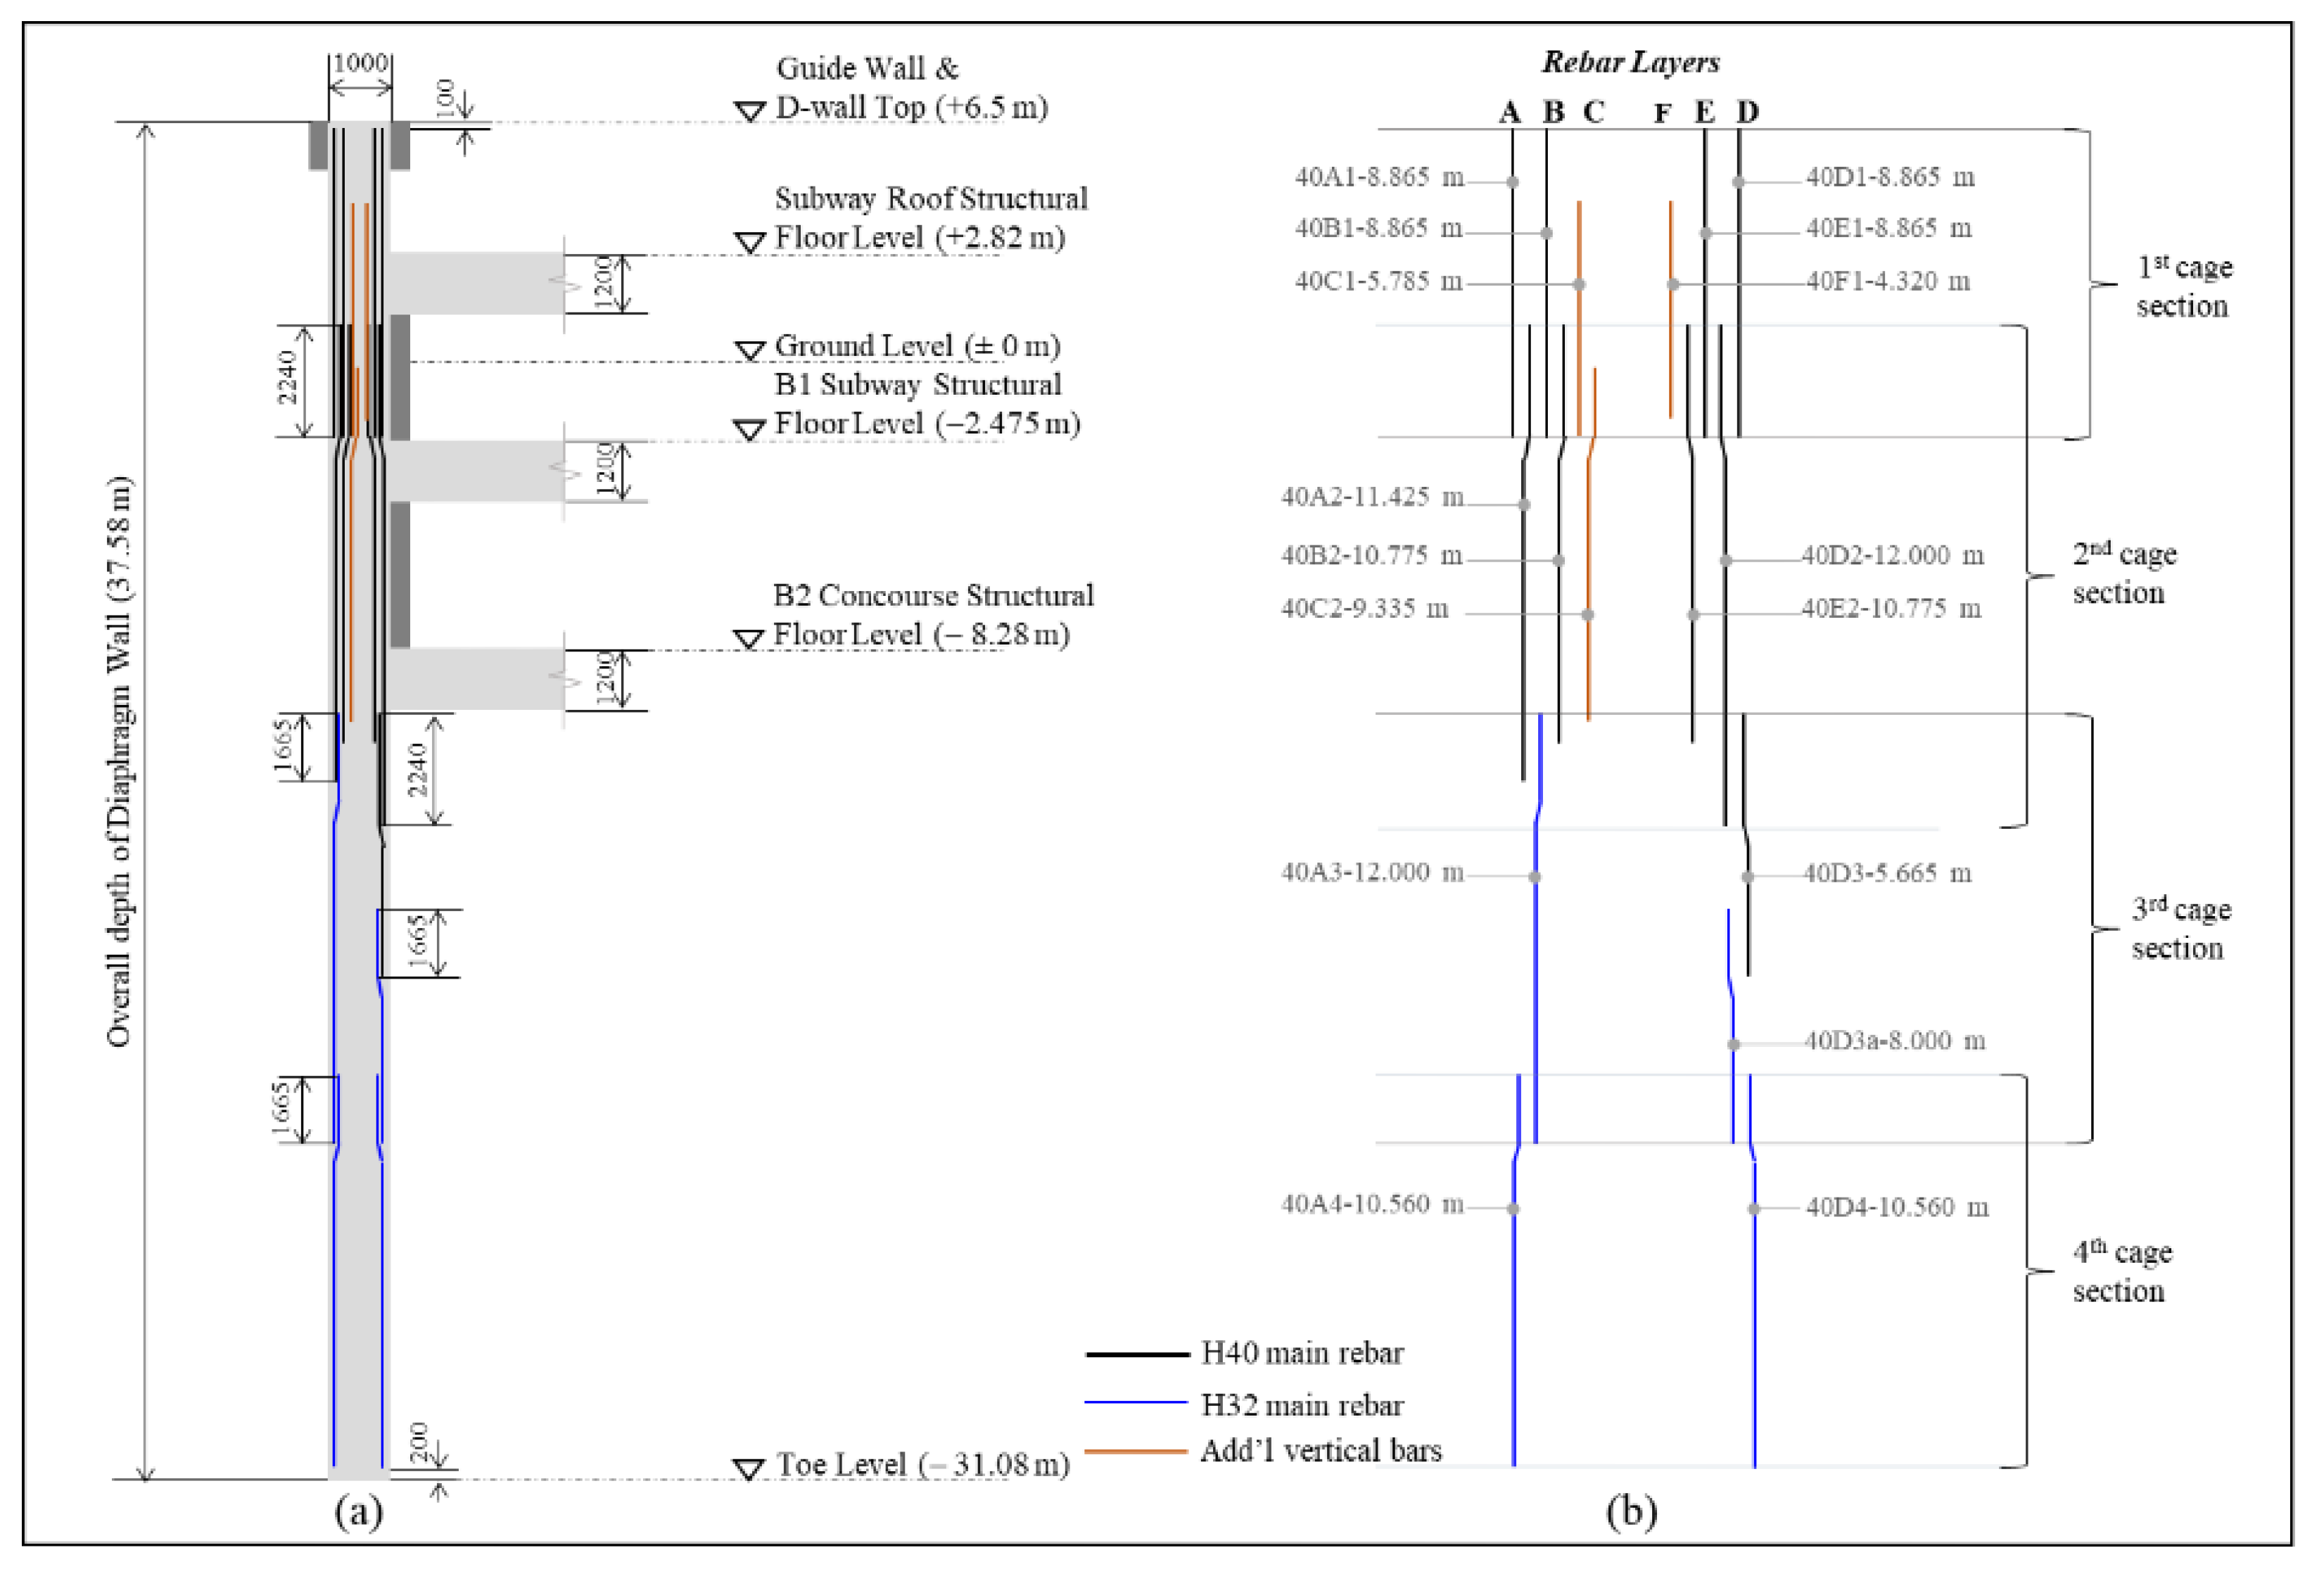
Diaphragm walls require a substantial number of steel reinforcement bars to withstand the lateral soil forces. This reinforcement is prefabricated into rebar cages and divided into three or more sections, depending on the wall’s depth. Fabricated cages are inserted section by section into the excavated ground. Starter bars anchor the diaphragm wall reinforcement at every floor slab to ensure structural integrity. A typical diaphragm wall panel consists of two rebar cages. Each rebar cage can be divided into three groups of reinforcement: main vertical rebars, space bars, and horizontal ties or links. Additional rebars for various purposes, such as spacers, fixing rebars, stiffeners, hanging bars, suspension hooks, and lifting rebars, are also incorporated to strengthen the cage and aid in the installation process. The main vertical rebars in the cage are held in position by horizontal links, such as EX-links and C-links, which serve a similar function to hoops in column reinforcement. Figure 1 illustrates the rebar arrangement of the rebar cage.
Diaphragm wall construction typically follows four steps: (1) constructing a guide wall, (2) excavating the soil and filling the space with slurry, (3) installing rebar cages, and (4) pouring concrete using a tremie pipe. The guide wall is temporarily constructed to ensure the alignment of wall continuity and to assist in the installation of rebar cages. The dimensions of a wall panel depend on the particular site’s geological conditions and the structural designs for the building [43]. Diaphragm wall construction begins with the construction of primary wall panels, followed by secondary panels. Special joints with a water stop connect the wall panels, with the specific type of joint varying depending on the contractor’s preference or the excavating equipment used.

3. Methodology

Figure 2 illustrates the flowchart of the proposed research. This outlines the process and validation procedure of our proposed approach, analyzing the impact of mechanical couplers on diaphragm wall rebar consumption. A case study, in the proper size and pose for continuous reinforcements arrangement, was utilized to demonstrate and validate the proposed approach.
  • Stage 1: Collect structural analysis results to obtain information about the location of structural members and rebar properties, including bar length, diameter, shape, quantity, and location.
  • Stage 2: Analyze the rebar arrangement within a diaphragm wall panel.
  • Stage 3: Create a Building Information Modeling (BIM) structural model and apply BS shape codes to retrieve the rebar list.
  • Stage 4: Implement a mechanical coupler-based special-length rebar minimization algorithm on vertical main rebars.
  • Stage 5: Combine all of the remaining rebars into a cutting pattern optimization algorithm using special-length rebars.
  • Stage 6: Analyze rebar usage, rebar cutting waste, carbon emissions, environmental impact, and economic impact to verify the proposed algorithm. Then, compare the results of the proposed algorithm to those of the original design, which used the conventional lap splice method with stock length rebars, and to the findings of the previous study [16], which also employed the lap splice method and incorporated special-length rebars. Consequently, the impact of couplers is investigated through analysis of rebar usage and cutting waste, environmental impact, and economic impact.

3.1. Mechanical Coupler-Based Special-Length-Priority Optimization Algorithm

The objectives and constraints for this research have been established for the optimization of special-length rebars considering mechanical couplers. The objective is to minimize rebar cutting waste to less than 1% by incorporating special-length rebars and couplers for the main vertical rebars. The constraints for the special-length order include a minimum length of 6 m, a maximum length of 12 m, a minimum ordered quantity of 50 tons for each special length, and a preorder lead time of two months [14].
The rebar cage of the diaphragm wall is arranged with rebars of different diameters, and the deeper the wall panel, the smaller the rebar. The optimization is conducted on the continuous rebar arrangement; therefore, the total length is calculated by combining all of the rebars with the same diameter that are arranged in the same layer, as shown in Equation (1), which is adopted from the study by Rachmawati et al. [16]:
L t o t a l = i = 1 r L r e b a r _ i
in which L t o t a l is the total length of wall rebar in the same diameter; L r e b a r _ i is the length of rebar i; and r is the upper limit of the summation, which is the total number of rebar considered in the total length calculation.
To obtain the new number of required rebar, the continuous total rebar length is divided by the optimal reference length, as shown in Equation (2), adopted from the study by Rachmawati et al. [16]. The optimal reference length is assumed to be 12 m in this research. The generated number is rounded up for a whole number.
n r e b a r = L t o t a l L r e f
in which n r e b a r is the new number of required rebars and L r e f is the optimal reference length (maximum rebar length available in the market).
Then, to determine the special length of the rebar, Equation (3) is used to consider the total length, the number of rebars required, and the gap between the threaded rebars. A threaded coupler typically includes a gap between the rebars to facilitate installation in case of misaligned threads and for grouting purposes [45]. To obtain the exact length, this gap must be deducted from the rebars. As illustrated in Figure 3, half of the gap is subtracted from the end rebar, while the entire gap is subtracted from the middle rebar. Because the special-length rebars are ordered in 0.1 m increments, the generated value is rounded up to one decimal place.
L s p e c i a l = L t o t a l n r e b a r s 2   for   end   rebar ,   L t o t a l n r e b a r s   for   middle   rebar
in which L s p e c i a l is the special length of the rebar and s is the space between the threaded rebars.

3.2. Cutting Pattern Optimization Algorithm

After optimizing the main rebars considering the couplers, special-length rebars are generated. The remaining rebars are then combined into special-length cutting patterns to minimize cutting waste. Equation (4), taken from a study by Lee et al. [14], is used to minimize rebar cutting waste.
The function X i in Equation (4) serves as the objective function for cutting pattern optimization in special-length priority and aims to minimize the discrepancy between the special-length rebar and the cutting patterns. Equations (5)–(9) represent constraints that must be adhered to for special-length order requirements. These include minimum and maximum length and minimum rebar quantity. In Equation (5), l i is the sum of various rebar lengths of the same diameter ( r 1 + r 2 + r 3 + + r n ), and it must not exceed the special length. Equation (6) indicates the number of the same rebar combination, which must be an integer and greater than zero. Equation (7) states that the special length must not be less than the minimum length ( L m i n ) and not greater than the maximum length ( L m a x ). Equation (8) requires that the total purchased quantity must be greater than the minimum rebar quantity of the special length order requirement. In South Korea, the minimum quantity for a special length order is 50 tons [14]. Finally, as shown in Equation (9), the generated loss rate must not exceed the target loss rate, which is less than 1%.
M i n i m i z e   f X i = i = 1 N L s p i n i l i n i L s p i n i
l i L s p i , l i = r 1 + r 2 + r 3 + + r n
0   <   n i ,   i   =   1 ,   2 ,   3 ,   ,   N
L m i n L s p i L m a x
Q s p Q t o t a l
ε ε t
in which L s p i is the special-length cutting pattern; l i is the length of cutting pattern i obtained by combining various rebar lengths; n i represents the number of rebar combinations with the same cutting pattern i; L m i n is the minimum length for the special length order requirement; L m a x is the maximum length for the special length order requirement; Q s p is the minimum rebar quantity for the special length order; Q t o t a l represents the total purchased rebar quantity; ε is the rebar loss rate of the special length cutting pattern; and ε t is the target loss rate, which is less than 1%.

4. Case Study and Verification

4.1. Case Study Application

The proposed research was verified using the diaphragm wall of an interchange station, provided by the shop drawing set of a primary wall panel. This particular diaphragm wall was chosen due to its dimensions, rebar arrangement, and specification, presenting a good example of the algorithm’s application. The case study’s diaphragm wall comprised multiple panels, including 293 primary wall panels, each measuring 6 m in length and 1 m in thickness. The overall depth of the panel was 37.58 m, with 31.08 m underground and 6.5 m above the ground level. All of the wall panels were connected to the three floors of the interchange station: the B2 concourse structural floor level, the B1 subway structural floor level, and the subway roof structural floor level. The depth of each floor slab was 1200 mm. In this case study, a high tensile bar grade of 500 MPa was employed for all of the reinforcements. In addition, the diameter of the high tensile rebar symbolized as ‘H’ in the shop drawings was also adopted in this research. The attributes of the case study’s diaphragm wall panel are summarized in Table 2.
The case study’s wall panel was reinforced with two similar rebar cages, each comprising four rebar cage sections, as demonstrated in Figure 4. The reinforcement comprised vertical main rebars, horizontal EX-links, C-links, and additional rebars for lifting and aligning purposes. In each cage section, the vertical main rebars were held in place by two EX-links. The C-links anchored the main rebars by sandwiching the EX-links. The first cage section employed six layers of main rebars, which were separated by space bars, as shown in Figure 1. Stiffeners were used to strengthen the cage section and prevent the cage from deformation. Starter bars were used to anchor the floor reinforcement to the rebar cages, and they were separated by fixing rebars to maintain the positions. For the lifting process, hanging bars and lifting bars were used for the lower cages from the second to the fourth cage section, and suspension hooks were additionally employed for the first cage section.
The rebar marks from the original shop drawings were used. The letter in the rebar mark indicates the rebar layer and the number indicates the location of the rebar. As shown in Figure 4b, the rebar mark “A1” indicates the vertical rebar in layer A of the 1st rebar cage section. The number ‘40’ in front of the rebar mark indicates the amount of rebar used in one diaphragm wall panel. The rebar layers A and D extended along the rebar cage from the 1st to the 4th section, while layers B and E were located only in the 1st and 2nd sections. The mechanical coupler-based special-length-priority optimization algorithm was applied to the vertical main rebars of the diaphragm wall panel, and all the remaining rebars were optimized in cutting patterns. The rebar layers C and F, located in the upper two sections, were much smaller than the main rebars in both length and diameter, so they were included in the remaining rebars.
Regarding the coupler usage, this research considered using rib thread couplers, which generally consist of a cylindrical sleeve with threads onto which rebar ends are securely threaded and fastened with nuts (see Figure A1 in the Appendix A). Table A1 in the Appendix A provides the dimensions of the threaded rebar couplers provided by Tokyo Tekko Co., Ltd. (Tokyo, Japan) [46]. As shown in Figure A1, the coupler and threaded rebar have a gap between the threads, enabling construction even if the threads are misaligned. The gap is typically 20 mm for rebar sizes H16 to H29 and 30 mm for rebar sizes above H32 [45]. The coupler also provides a permissible tolerance for the rebar length inserted in the center, ensuring rebar connection even if the threaded rebars have a cutting length error.

4.1.1. Mechanical Coupler-Based Special-Length Rebar Minimization on Main Vertical Rebars

The case study application was conducted according to the stages described in the flowchart of the methodology (see Figure 2). First and foremost, fundamental information about the diaphragm wall panel and its reinforcing bars was gathered from the case study project’s shop drawings. The original rebar list for the diaphragm wall is displayed in Appendix A, Table A2. Subsequently, a structural BIM model was created after analyzing the arrangement of the rebars within the diaphragm wall and eliminating the lap lengths because the proposed research considered mechanical couplers. In addition, all rebars in the model were assigned BS shape codes. The revised rebar list obtained from this model is presented in Appendix A, Table A3, and it serves as the primary data source for this research.
The main vertical rebars of layers A, B, D, and E, as shown in Figure 4b, were optimized in special-length rebars considering mechanical couplers instead of lap splices. Equations (1)–(3) were used to calculate the special length for the main rebars. The optimization was conducted individually on the same-diameter rebars in a continuous rebar arrangement. The calculation process of special length optimization was illustrated on rebar layer D, which included H40 rebars D1, D2, and D3, and H32 rebars D3a and D4. Using Equation (1), the total length was calculated for H40 rebars as follows.
L t o t a l = i = 1 r L r e b a r _ i = D 1 + D 2 + D 3 = 8.865 + 9.76 + 3.425 = 22.05   m
Then, the total length was divided by the 12 m reference length for a new number of required rebar considering the use of couplers.
n r e b a r = L t o t a l L r e f = 22.05 12 = 1.838 = 2
Here, it was observed that the initial three H40 rebars in layer D were reduced to two. Additionally, the reduction of the gap depends on the rebar arrangement. As demonstrated in Figure 5a, rebar D1 is the end rebar and D2 is the middle rebar. Therefore, Equation (3) was used to calculate the special length for each rebar.
  • For D1, the end rebar, L s p e c i a l = L t o t a l n r e b a r s 2 = 22.05 2 0.03 2 = 11.01 = 11.1   m
  • For D2, the middle rebar, L s p e c i a l = L t o t a l n r e b a r s = 22.05 2 0.03 = 10.995 = 11   m
The same calculation process was executed for all main vertical rebar layers for special lengths. Table 3 summarizes the results of the mechanical coupler-based special-length rebar optimization on main vertical rebars.

4.1.2. Cutting Pattern Optimization for the Remaining Rebars

Consequently, the remaining rebars in the diaphragm wall panel’s rebar cage were combined in cutting pattern optimization using special-length rebars to generate minimal rebar cutting waste. The length and amount of all of the remaining rebars are provided in Appendix A Table A3. To optimize the cutting pattern and minimize rebar cutting waste, Equation (4) was used in accordance with the constraints outlined in Equations (5)–(9). For the combination of various rebar lengths in a cutting pattern using Equation (5), an external optimization application (Cutting Optimization Pro) [49] was used to automatically generate cutting patterns, eliminating the need for manual combinations. Equation (6) ensures the combined rebar length is an integer. The application was provided with key data: rebar diameters, lengths, amounts, and the special length range from Equation (7). Consequently, the cutting pattern in special length was generated with minimal cutting waste, while adhering to constraints in Equations (8) and (9).
Cutting pattern optimization was performed on all of the remaining rebars, and the results are summarized in Table 4. From the table, it can be seen that the available market lengths of 12 m and 11 m were discovered to be the most efficient lengths for H32 and H13 rebars, respectively, in terms of minimizing cutting waste. However, because special-length rebars are purchased in 0.1 m intervals, these lengths were considered to be special lengths for the purposes of this research.

4.1.3. Analysis of the Results via the Algorithm

Figure 5a demonstrates the original arrangement of the main rebars; the first and second cage sections were arranged with H40 rebars. The third cage section included both H40 and H32, in which the D3 rebar was H40, and the rest were H32. The fourth cage section was arranged with H32 rebars. After special-length rebar minimization based on mechanical couplers, the rebar cage was arranged with new special-length rebars in each layer, as demonstrated in Figure 5b. In rebar layer D, the number of rebars was reduced from three to two.
Table 5 summarizes the required rebar quantities, ordered rebar quantities, and cutting waste after applying the proposed algorithm. The unit weights of rebars (H20, H16, and H13) used in this research are slightly different from previous cases. In the original case and the previous study [16], the unit weight of each rebar size was obtained from the information provided in the case study project. However, in this coupler case, both the rebars and couplers were considered to be purchased from the same company. Therefore, the unit weights were obtained from the company’s specifications [47,48]. It was confirmed that the proposed algorithm considering mechanical couplers only generated 0.358 tons of rebar cutting waste with a 0.57% loss rate (less than 1%) in one diaphragm wall panel.

4.2. Verification of the Algorithm

4.2.1. Rebar Usage and Rebar Cutting Waste

Then, the calculation was expanded to 293 panels of the diaphragm wall. To verify the effectiveness of the algorithm, rebar quantities of the proposed algorithm were compared to the original case and the previous study by Rachmawati et al. [16] in terms of rebar quantities, carbon and environmental impact, and associated costs. Because all of the rebar length necessary for overlapping was eliminated, rebar usage for one panel was reduced by 17.95% from the original case, which employed conventional lap splices and stock-length rebars. The rebar quantities of the original case and the previous study [16] are shown in Appendix A, Table A4, and Table A5, respectively.
Table 6 shows the rebar quantities of the original case, the previous case, and the coupler case. The RCW rate of the original case was 9.62%, while the previous study and the coupler case achieved N0RCW by 0.77% and 0.57%, respectively. Table 7 summarizes the rebar quantities, cutting waste, and the reduction rate of each case. It has been observed that the proposed algorithm reduced 4052.96 tons (17.95%) of the purchased rebar quantity from the original case, which used only stock-length rebars by eliminating lap splices and using couplers instead. Because the lap splices were substituted by couplers, rebar usage was saved by 1052.67 tons compared to the previous study (5.38%). The coupler case demonstrated a significant reduction in cutting waste compared to both the original case and the previous study. Notably, it achieved a 95.18% decrease in waste when compared to the original case and a 30.27% reduction compared to the previous study.

4.2.2. Environmental Impact

In this subsection, an in-depth comparison is made regarding the environmental impacts of utilizing steel rebar in all cases. First, the rebar quantities were converted into carbon emissions to analyze the differences between each case. The carbon emission factors of the rebars and couplers were referenced and interpolated based on the data from the study by Ghayeb et al. [24]. The factor of 3.505 ton-CO2-eq per rebar ton was used to calculate the carbon quantity of rebars. The carbon emissions of the H32 coupler were 19.490 kg-CO2-eq/pcs, and that of the H40 coupler was recalculated based on H32 data through the regression method, resulting in 23.978 kg-CO2-e/pcs. A total of 70,320 H40 couplers were required for 293 diaphragm wall panels, emitting 1686 tons of carbon emission. Additionally, a total of 23,440 H32 couplers produced 457 tons of carbon emissions. As both the original and previous cases employed conventional lap splices, the analysis solely focused on the carbon embodied in the rebars. Table 8 details the carbon quantities generated in each case, along with the corresponding CO2 reduction rates. Notably, the proposed algorithm achieved a significant 15.24% reduction in CO2 emissions compared to the original case and a further 2.25% reduction compared to the previous study.
Moreover, as previously stated, the production of 1 ton of rebar necessitated a considerable amount of freshwater. This utilized water, classified as grey water due to its lack of hazardous materials and sanitary waste, is subsequently discharged into the natural water system. Notably, Gu et al. [50] documented a grey water footprint for a Chinese steelwork nearly 27 times its blue water footprint, equating to 145.74 m3 per ton of rebar. Blue water footprint refers to the consumption of freshwater surface or groundwater for human activities, including steel and rebar production. This disparity arises from the high concentration of specific pollutants in the discharged wastewater. The steel production processes generate numerous pollutants, including chemical oxygen demand (COD), petroleum, phenol, ammonia (NH3-N), cyanide (CN), chlorine (Cl), manganese (Mn), nickel (Ni), zinc (Zn), nitrate (NO3-N), hexavalent chromium (Cr6+), cadmium (Cd), arsenic (As), lead (Pb), and polycyclic aromatic hydrocarbon (PAHs) [51,52]. The high concentration of pollutants requires dilution before discharge as grey water, highlighting the substantial environmental risk associated with the steel industry. These contaminants can pose health risks to humans and wildlife. Reducing rebar usage directly reduces both blue water and grey water footprints, promoting more sustainable production practices.
Furthermore, the environmental impact of rebar cutting waste can be comprehensively assessed through six life cycle assessment (LCA) indicators: global warming potential (GWP), abiotic depletion potential (ADP), acidification potential (AP), eutrophication potential (EP), ozone depletion potential (ODP), and photochemical ozone creation potential (POCP) [53]. Global warming potential quantifies a greenhouse gas’s capacity to contribute to global warming through heat retention compared to CO2. Abiotic depletion potential gauges the potential depletion of resources. Acidification potential measures the heightened acidity of water and soil due to atmospheric pollutants. Eutrophication potential assesses the excessive nutrient enrichment of water bodies, typically caused by nitrogen or phosphorus substances. Ozone depletion potential denotes the reduction in stratospheric ozone layer density. Photochemical ozone creation potential involves the formation of reactive chemical compounds between air pollutants and sunlight, generating compounds with adverse effects on ecosystems. Park et al. [53] demonstrated the significant environmental impact of rebar waste in apartment projects, with their study estimating 7.9 × 10⁴ kg CO2-eq GWP, 6.3 × 10² kg Sb ADP, 5.2 × 10² kg SO2-eq AP, 7.8 × 101 kg PO43−-eq EP, 2.4 × 10⁻³ kg CFC-11-eq ODP, and 7.7 × 101 kg C2H4-eq POCP for a project with 225.54 tons of rebar waste. Recent independent studies on apartments and educational building projects accentuate the significant environmental burden linked to rebar waste, establishing it as a key contributor to environmental impact within the construction industry, trailing behind only ready-mix concrete [54,55]. Nevertheless, Table 9 provides an analysis of the water and environmental impact associated with the original, previous, and coupler cases and their reduction, utilizing the information presented earlier. The reduction implies the ability of the proposed algorithm to be one of the solutions to achieve sustainable practice in the civil and construction engineering sector. A more detailed reduction can be seen in Appendix A, Table A6.

4.2.3. Economic Impact

This section delves into a comprehensive analysis of the economic impact associated with the reduction of rebar usage and cutting waste by comparing across all cases. The carbon emissions associated with rebar usage were quantified based on the conversion factors presented previously. Subsequently, the total carbon emissions were converted to carbon prices using a figure of USD 75 per ton of CO2 [25]. The rebar cost was computed based on the inflation rate [56], resulting in a figure of USD 908 per ton of rebar. The material costs and processing costs of rebars and couplers are shown in Appendix A, Table A7. The processing costs are the expenses incurred for the installation process of each lap splice or coupler. The processing costs were considered to be the same for lap splices and couplers. It was calculated to reflect the current inflation rate [56], using the data from the study by Kwon et al. [1]. In addition, a transition coupler is required to connect rebars with different diameters. In this research, the price of the transition coupler required to join H40 and H32 rebars was assumed to be the same as the H40 coupler’s price. An amount of USD 868,452 was required to purchase the H40 and transition couplers, and USD 197,834 was required for the H32 couplers.
The cost of rebar connections encompasses both processing and material costs. While coupler cases factor in both components, the original and previous cases only considered processing costs, as material costs were already incorporated into the rebar cost. Furthermore, the generation of rebar cutting waste necessitates the consideration of construction waste disposal charges (CWDC). Chen et al. [57] highlight that Hong Kong’s construction waste disposal fees depend on the designated destination outlined in the waste management plan. The rebar waste could be directed to sorting facilities for rebar recycling, fetching USD 22.29/ton. Alternatively, the waste can be disposed of at public fill reception facilities for USD 9.05/ton. This research assumed that the rebar waste was sent to sorting facilities. The total cost for each case was determined based on four key components: rebar cost, rebar connection cost, carbon price, and construction waste disposal charges. The original, previous, and coupler cases exhibited total costs of USD 26,890,685, USD 23,138,899, and USD 23,110,238, respectively. Figure 6 depicts the comparison of the cost incurred in each case. Due to its small value compared to other cost components, the yellow bar is visually insignificant in Figure 6. For more details, please refer to Figure 7. A more detailed cost can be found in Appendix A, Table A6. A total cost reduction of USD 3,780,446 (14.06%) was achieved compared to the original cases. The overall cost was reduced further by USD 28,661 (0.12%) from the previous study [16]. These findings show that mechanical couplers are significantly effective for rebar minimization in the case study diaphragm wall, maintaining sustainability in construction.
Minimizing rebar usage and cutting waste is anticipated to contribute to achieving green construction requirements. To further accelerate the adoption of sustainable practices, governments worldwide provide the construction industry, including owners, developers, contractors, and engineers, with various financial incentives. These incentives encompass tax benefits (credits or deductions), loans, grants, and rebates [58,59,60,61,62]. Examples include property tax incentives offered in countries like the United States, Spain, Canada, Malaysia, and India [63,64,65] and subsidies provided in Mainland China and Singapore [62]. While not directly impacting the presented total cost calculations, these incentives can significantly influence stakeholders’ decision-making toward adopting green construction practices.
Figure 6. Comparison of construction costs incurred by each case (method). The costs except the carbon price were converted from KRW to USD using the current exchange rate [66]. The waste disposal cost was converted from HKD to USD, reflecting the current exchange rate [67].
Sustainability 16 01213 g006
Figure 7. Comparison of waste disposal cost incurred by each case (methods). The waste disposal cost was converted from HKD to USD, reflecting the current exchange rate [67].
Sustainability 16 01213 g007

5. Discussion

Conventional lap splicing, which is common for rebar connection due to its simplicity and cost-effectiveness, requires strict adherence to lapping zone codes [18] and is prone to errors, such as improper lap lengths or incorrect installation, which can compromise its performance. Longer rebars are needed for larger diameters, with ACI [18] prohibiting connections over 36 mm. Furthermore, lap splices are challenging to inspect and repair. An alternative is the welded joint, which uses less rebar but involves higher costs and skilled labor. However, welded joints emit potentially harmful flames and smoke, and the welding gas raises environmental concerns. Improper installation can make welded joints vulnerable to cracking.
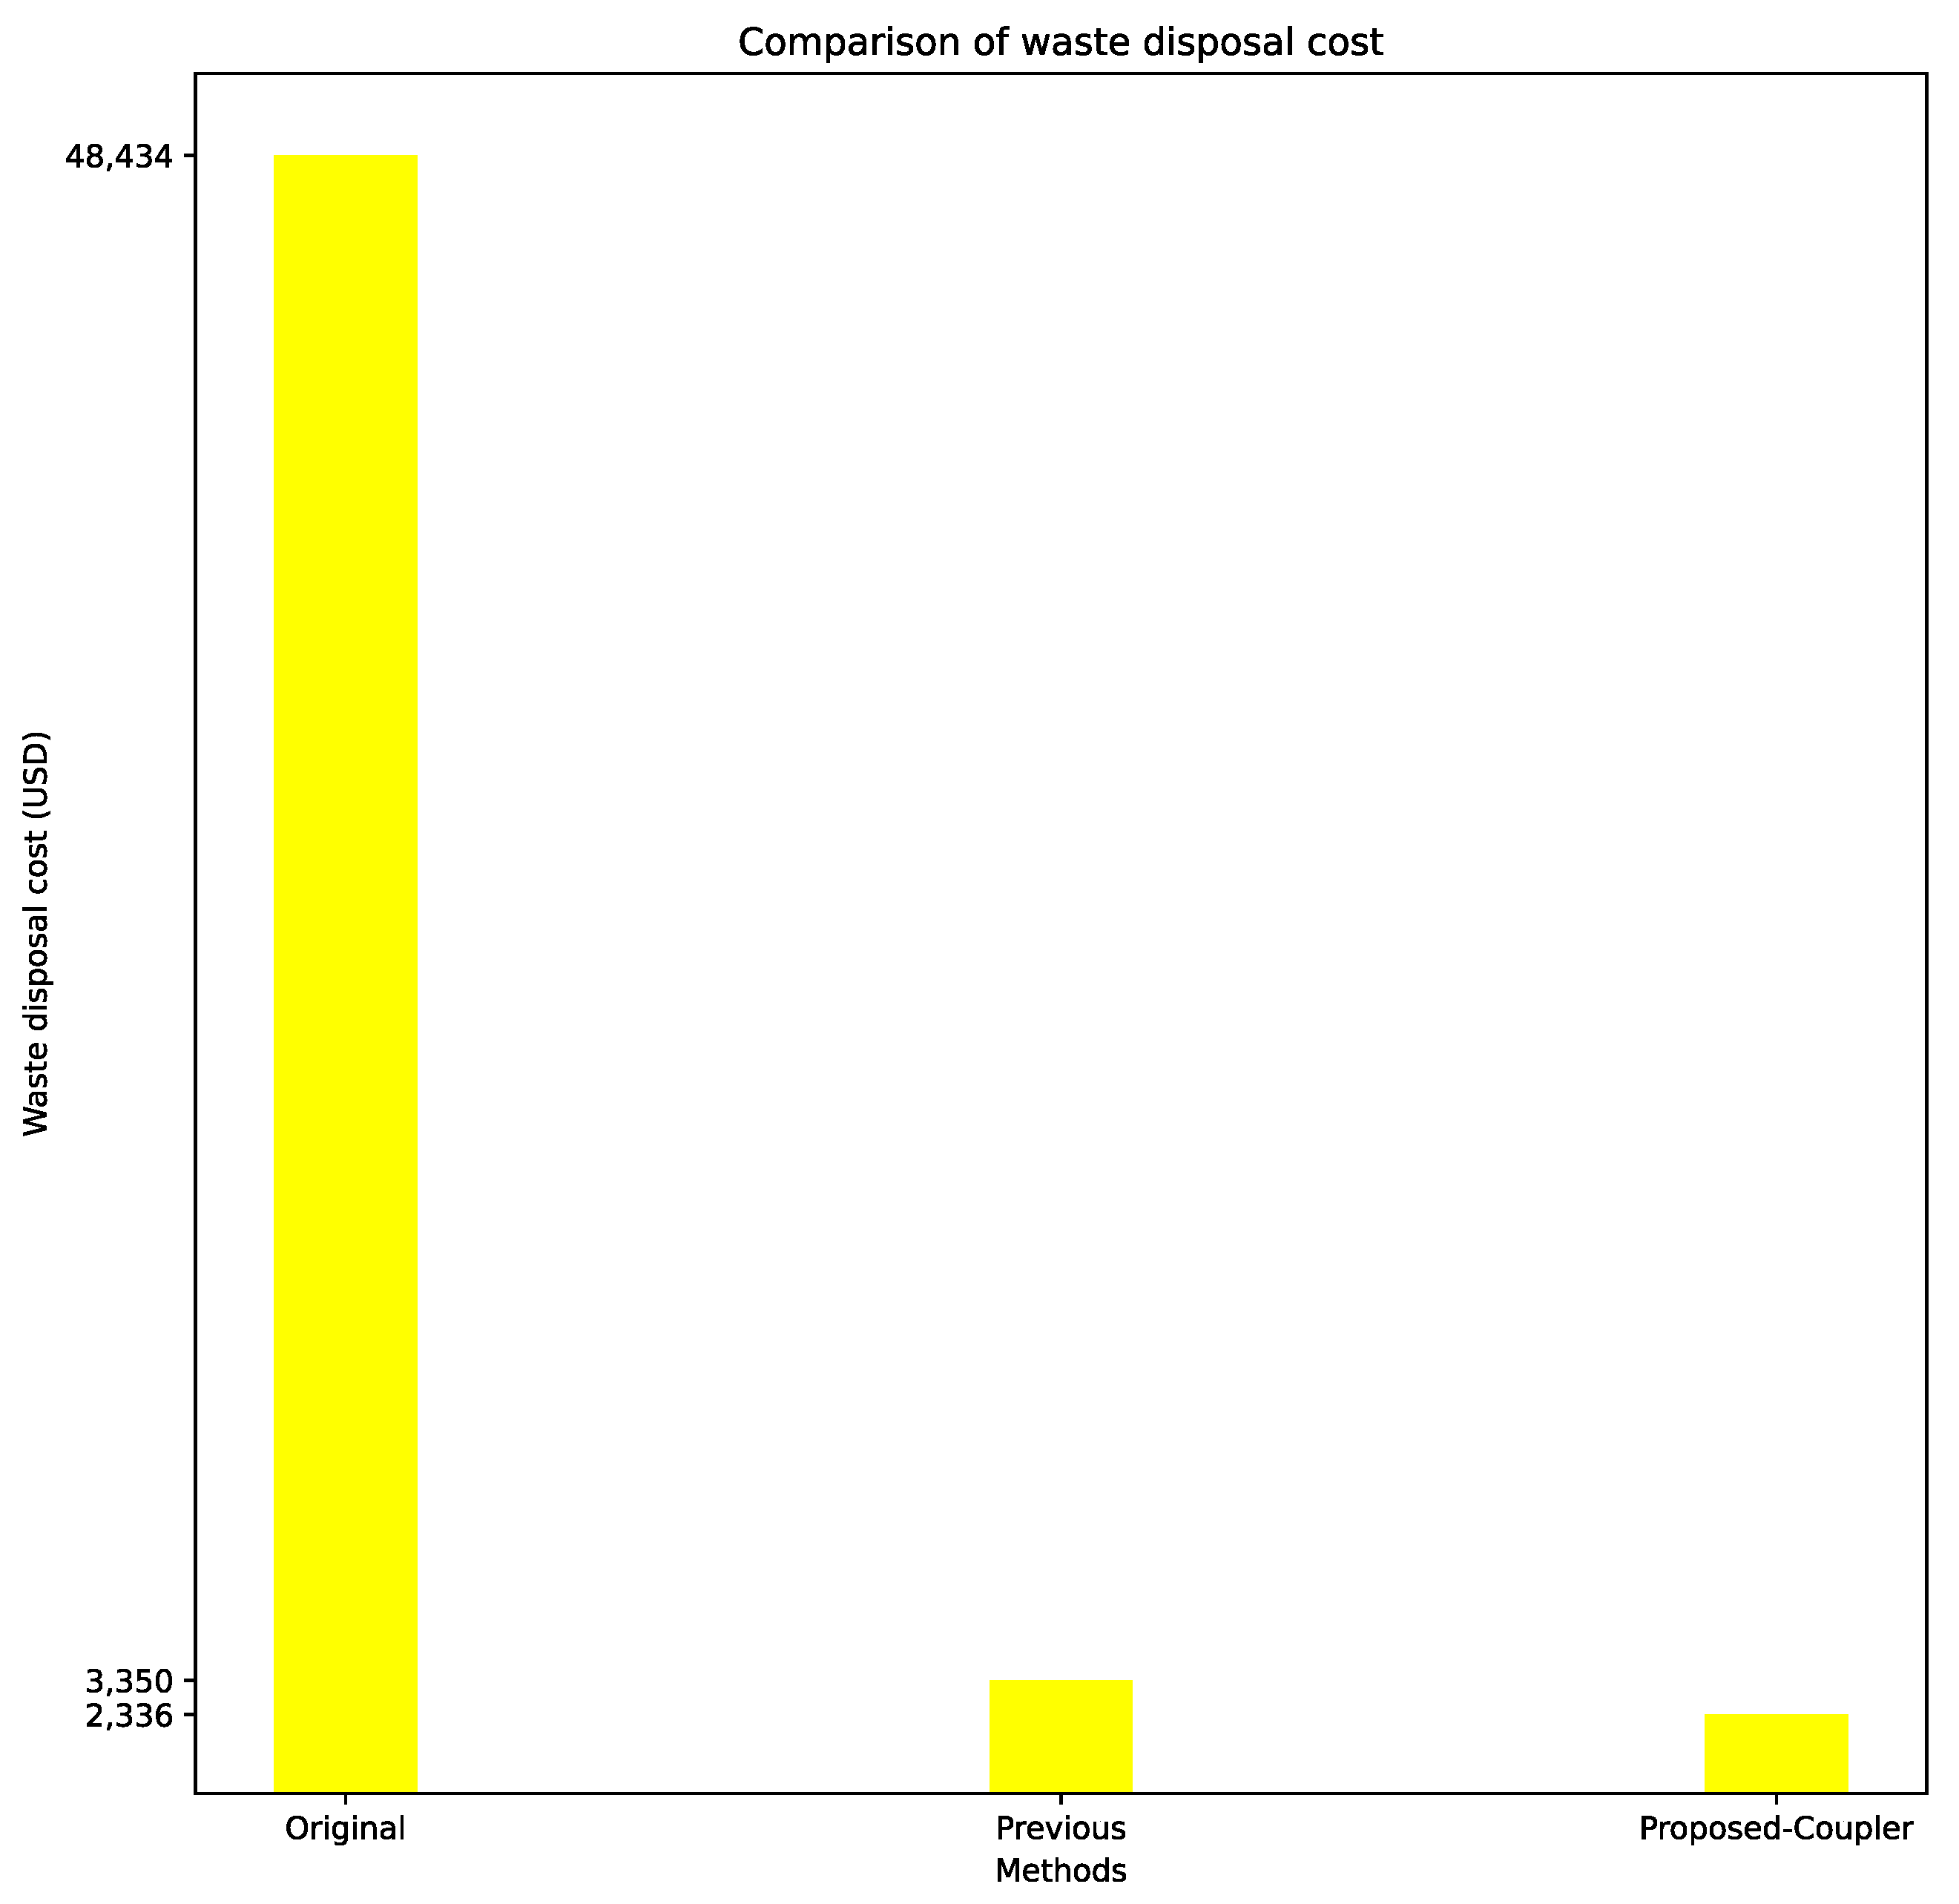
Mechanical couplers expedite installation, saving time and costs. They eliminate lap splices, minimizing the rebar required and cutting waste. Rebar price hikes and labor shortages further push coupler adoption. Additionally, a sharp rise in rebar prices and a shortage of labor on construction sites have resulted in the increasing use of couplers. Furthermore, the cost of couplers is gradually decreasing over time as their usage becomes more prevalent. Through this study, a 17.95% reduction in rebar usage and a 95.41% reduction in cutting waste were achieved for diaphragm wall structures, demonstrating near-zero cutting waste results. In comparison to the findings of the previous study [
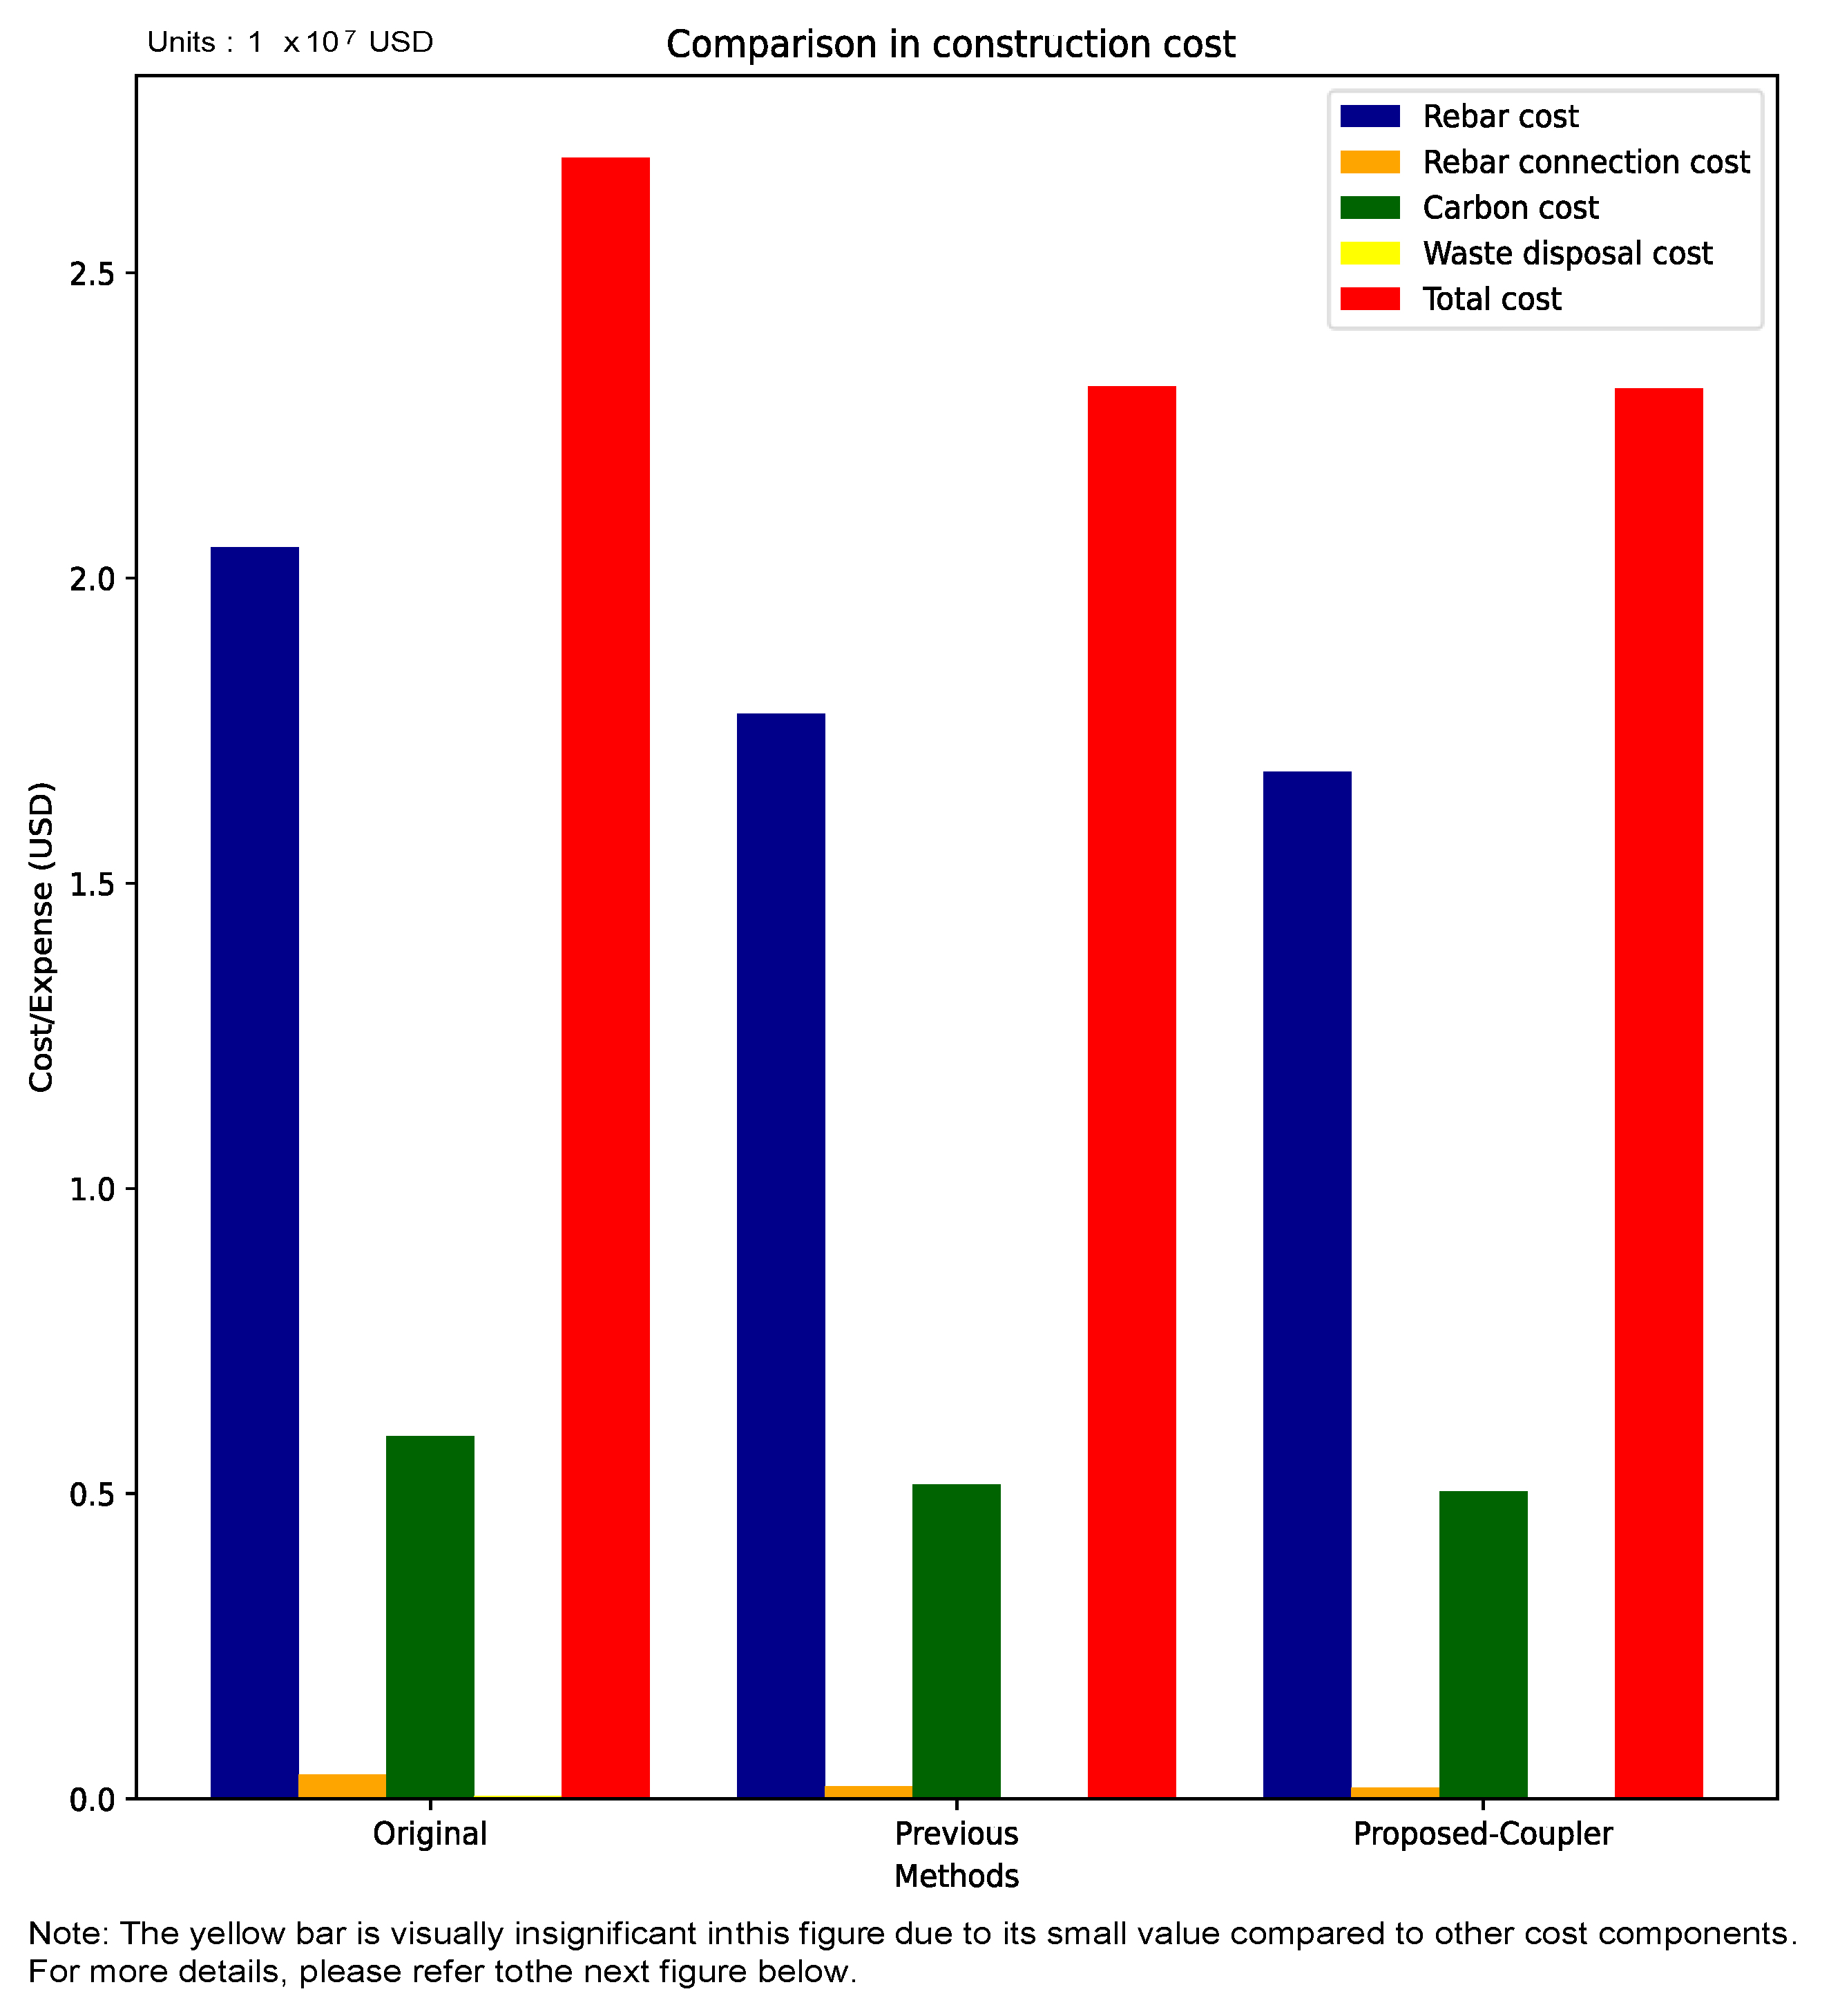
16], a further reduction in rebar usage of 5.38% was observed, demonstrating the potential of couplers as a sustainable substitution for conventional lap splices. In terms of environmental impact, the proposed algorithm significantly reduced carbon emissions by 15.24%, along with a 17.95% reduction in both blue water and grey water footprints, and a substantial 95.18% reduction in GWP, ADP, AP, EP, ODP, and POCP compared to the original case. Compared to a prior study, the algorithm exhibited a 2.25% reduction in carbon emissions, a 5.38% decrease in both blue water and grey water footprints, and a substantial 30.27% decrease in GWP, ADP, AP, EP, ODP, and POCP. These findings highlight the algorithm’s effectiveness in reducing rebar usage and mitigating the associated environmental impact. Economically, the algorithm resulted in a 14.06% and 0.12% reduction in total costs compared to the original case and the previous study, respectively. Despite the seemingly modest economic impact reduction relative to the previous study, its application is noteworthy considering environmental implications and lap splices’ drawbacks. The observed reduction in rebar usage suggests that the combined coupler and special-length rebar approach effectively minimized the required and purchased rebar. This approach has the potential to eventually decrease rebar demand and production, thereby lowering the environmental impact associated with its production.
Despite these benefits, mechanical couplers face adoption hurdles, including higher initial cost compared to traditional lap splices, lack of standardized design guidelines, and limited awareness among professionals regarding their advantages and proper application. While a wide variety of couplers exist, each catering to specific needs, like seismic resistance, choosing the right type is crucial for maximizing waste reduction and ensuring structural integrity. This selection is influenced by the couplers’ inner gap, which directly impacts rebar usage and waste generation, with some types potentially offering minimal environmental benefits compared to others. Furthermore, the availability of specific coupler types might not be readily accessible in all countries, potentially hindering widespread adoption of the method. Additionally, couplers are generally only used in new construction, with limited applications in retrofitting buildings where existing reinforcement is already in place. These issues should be addressed in future investigations.
Couplers, being easily installable, enhance construction site productivity, necessitating systematic planning and supply chain management (SCM) for sustained efficiency in construction sites. Future studies could further explore the planning and development of an SCM strategy that emphasizes the use of couplers, in addition to coupler selection, including the prefabricated rebar cage practices and devices that could be used to aid the prefabricated process. The broad application of couplers and special-length rebars to various construction projects, including buildings, bridges, tunnels, and subways, can significantly reduce rebar usage, saving construction costs, accelerating the construction phase, and reducing the environmental impacts associated with rebars, thus aligning with the United Nations’ Sustainable Development Goals (SDGs), specifically SDGs 9, 12, 13, and 15. This reduction in rebar usage contributes to a more sustainable construction industry by alleviating environmental burdens associated with rebar production and disposal.

Recommendations for Related Policies

The above findings and discussions yield recommendations for industry and authorities regarding policy. The effective use of special-length rebar hinges on the minimum requirements set by steel mills. This research, employing a 50-ton minimum and a 6–12 m length rebar range, proved sufficient for the chosen and specific diaphragm wall case study. However, concerns arise for smaller projects (e.g., smaller diaphragm and retaining walls), where meeting the minimum quantity might hinder special-length rebar utilization and waste reduction benefits. Greater policy flexibility from steel mills could enhance the adoption of this sustainable construction practice across a broader range of project sizes.
Diaphragm wall construction practices, especially regarding rebar connection methods, necessitate stringent control through building regulations. Given the established limitations of conventional lap splices, particularly for larger-diameter rebars, this research advocates for stringent regulations set by relevant authorities to mandate the use of couplers in all new projects. The continued use of lap splices, as documented in [16], highlights the need for such a shift. This transition aligns with the present research’s aim of reducing rebar usage and minimizing its environmental impact while concurrently maintaining the structural integrity of diaphragm walls, particularly in seismically active regions.
Additionally, considering the current high cost of couplers due to global economic conditions, authorities should explore strategies to incentivize production or develop cost-effective coupler alternatives to facilitate broader adoption and ensure project feasibility. Furthermore, the current building regulation prohibits the use of lap splices for rebars larger than 36 mm in diameter. Reducing this limit to below 36 mm would encompass a wider range of diaphragm and retaining wall types and specifications and facilitate the adoption of couplers for smaller-diameter rebars as well.

6. Conclusions

This research aims to assess the use of mechanical couplers in optimizing rebar usage in large structural components that require the use of large rebar sizes and for improving sustainability with integrated mechanical couplers and a special-length rebar approach. The proposed method was implemented in a case study involving a diaphragm wall reinforced with H32 and H40 diameter rebars. The impact of the proposed method was assessed by comparing its results to those of the conventional lap splices approach. Through this study, several notable findings can be found, as follows:
(1)
The proposed method required 18,530 tons of rebar to be purchased, reducing rebar usage significantly by 4053 tons (17.95%) compared to the original case, which used the conventional lap splice approach.
(2)
The proposed method resulted in a rebar cutting waste rate of 0.57%, presenting the achievement of near-zero cutting waste. This method also reduced the related waste rate by 95.41%.
(3)
The combined use of couplers and special-length rebar offers significant environmental advantages. This approach reduces carbon emissions by 12,063 tons of CO2-eq (15.24%), blue and grey water footprints by 17.95%, and a remarkable 95.18% of the multifaceted environmental impact represented by GWP, ADP, AP, EP, ODP, and POCP.
(4)
Regarding the economic impact, a decrease in the total cost by USD 3,780,446 (14.06%) over the original design was achieved.
(5)
In contrast to a previous study [16], a further reduction of 1053 tons (5.38%) in rebar usage was achieved, resulting in a decrease of 1547 tons of CO2-eq (2.25%), along with a 5.38% reduction in both blue water and grey water footprints, and a significant 30.27% reduction in the environmental impact.
(6)
These findings highlight the noteworthy capabilities of the combination of couplers and special-length rebars for achieving exceptional reductions in rebar usage and rebar cutting waste, contributing to the acceleration of sustainable construction operations as well as the achievement of the SDGs. The findings also demonstrate a method for substantially decreasing construction materials, costs, and environmental impact without jeopardizing the structural integrity of diaphragm walls. However, mechanical couplers have not been widely adopted in the construction industry for several reasons, including the high initial costs and lack of awareness amongst engineers and practitioners.
Future investigations should focus on developing systematic planning and supply chain management (SCM) strategies specifically tailored to the integration of couplers and special-length rebars, including prefabricated rebars, and the associated auxiliary devices, as they are essential for improving construction site efficiency. This study showcases the potential of the proposed method to significantly reduce the environmental and economic impact associated with rebar usage within a large-scale construction project. Implementing the proposed method across various buildings and infrastructure projects could further multiply these benefits, fostering the rapid adoption of more sustainable and green construction operations.

Author Contributions

Conceptualization, S.K. and K.Y.K.; methodology, S.K. and K.Y.K.; validation, S.K., D.D.W., L.P.K. and K.Y.K.; formal analysis, D.D.W. and L.P.K.; investigation, D.D.W. and L.P.K.; resources, S.K.; data curation, L.P.K.; writing—original draft preparation, D.D.W. and L.P.K.; writing—review and editing, S.K., D.D.W. and L.P.K.; supervision, S.K.; project administration, K.Y.K.; funding acquisition, S.K. All authors have read and agreed to the published version of the manuscript.

Funding

This study was supported by the National Research Foundation of Korea (NRF) grants funded by the government of the Republic of Korea (MOE) (No. 2022R1A2C2005276).

Institutional Review Board Statement

Not applicable.

Informed Consent Statement

Not applicable.

Data Availability Statement

The data that support the findings of this study are available from the corresponding authors upon reasonable request.

Conflicts of Interest

The authors declare no conflicts of interest.

Nomenclature

L t o t a l Total length of wall rebar in the same diameter (m)
L r e b a r _ i Length of rebar i (m)
r Upper limit of the summation
n r e b a r New number of required rebar
L r e f Optimal reference length available in the market (m)
L s p e c i a l Special length of the rebar (m)
s Space between the threaded rebars (mm)
L s p i Special length cutting pattern (m)
l i Length of cutting pattern i by combining various rebars (m)
n i Number of rebar combination with the same cutting pattern
L m i n Minimum length for special length order (m)
L m a x Maximum length for special length order (m)
Q s p Minimum rebar quantity for special length order (tons)
Q t o t a l Total purchased rebar quantity (tons)
ε Rebar loss rate of special length cutting pattern (%)
ε t Target loss rate (%)

Appendix A

Figure A1. Rib thread coupler details (Tokyo Tekko) [46].
Sustainability 16 01213 g0a1
Table A1. Specifications for the rib thread coupler in mm unit (Tokyo Tekko) [46].
Bar SizeOutside Diameter of the CouplerLengthDimensions of Thread
CouplerNutTotalPitchInside DiameterRoot Diameter
BCL1L2LPDiDo
203132.611020150819.623.1
254042.1140201801024.829.0
325052.6190302501331.436.6
406467.3220302801639.045.4
Table A2. Original rebar list of the diaphragm wall.
Serial No.DescriptionBar MarkSizeNo. of RebarsLength of Rebar (m)Unit Weight kg/mTotal (kg)Total (ton)
1Main BarsD2H404012.0009.8644734.7204.735
2A24011.4254507.8484.508
3B24010.7754251.3844.251
4E24010.7754251.3844.251
5A1408.8653497.7743.498
6B1408.8653497.7743.498
7D1408.8653497.7743.498
8E1408.8653497.7743.498
9D3405.6652235.1822.235
10A3H324012.0006.3133030.2403.030
11A44010.5602666.6112.667
12D44010.5602666.6112.667
13D3a408.0002020.1602.020
14Suspension HookU1H40162.7509.864434.0160.434
15SpacerS1582.4501401.6741.402
16Hanging BarH1122.450290.0020.290
17Add’l Lifting BarH3122.450290.0020.290
18Starter BarsP1c282.160596.5750.597
19P2c42.16085.2250.085
20P1d282.160596.5750.597
21P2d42.16085.2250.085
22P1e242.160511.3500.511
23P2e42.16085.2250.085
24Lifting RebarH2161.800284.0830.284
25Starter BarsG1c81.520119.9460.120
26G2c21.52029.9870.030
27G1f281.520419.8120.420
28G2f41.52059.9730.060
29P3cH32281.5706.313277.5190.278
30P4c41.57039.6460.040
31Add’l Vertical BarsC2H25409.3353.8541439.0841.439
32C1405.785891.8160.892
33StiffenerL3441.820308.6280.309
34Starter BarsP5c281.225132.1920.132
35P6c41.22518.8850.019
36EX-LinkL1H209724.7662.47011,442.40311.442
37Fixing RebarFR1162.45096.8240.097
38Starter BarsG7b480.70082.9920.083
39G8b60.70010.3740.010
40Add’l Vertical BarsF1404.320426.8160.427
41Dowel BarsSW1H161521.3951.580335.0230.335
42SW2761.395167.5120.168
43C-LinkL2H1334401.2141.0404343.2064.343
Table A3. A new rebar list extracted from the BIM model after applying BS shape codes.
Main Rebars
Serial No.DescriptionBar MarkSizeNo. of RebarsLength of Rebar Weight (ton)BS Shape Code
1Main BarsD2H40409.7603.85126
2B2408.5353.36826
3E2408.5353.36826
4A2409.1853.62426
5A1408.8653.49800
6B1408.8653.49800
7D1408.8653.49800
8E1408.8653.49800
9D3403.4251.35126
10A3H324010.3352.61026
11A4408.8952.24626
12D4408.8952.24626
13D3a406.3351.60026
Remaining Rebars
Serial No.DescriptionBar MarkSizeNo. of RebarsLength of RebarWeight (ton)BS Shape Code
1Suspension HookU1H40162.5180.39713
2SpacerS1582.4501.40200
3Hanging BarH1122.4500.29000
4Add’l Lifting BarH3122.4500.29000
5Coupler BarsP2c42.1600.08599-03
6P2d42.1600.08599-03
7P2e42.1600.08599-03
8P1c282.0520.56712
9P1d282.0520.56712
10P1e242.0520.48612
11Lifting RebarH2161.8000.28400
12Coupler BarsG2c21.5200.03099-03
13G2f41.5200.06099-03
14G1c81.4120.11112
15G1f281.4120.39012
16Coupler BarsP4cH3241.5700.04099-03
17P3c281.4830.26212
18Add’l Vertical BarsC2H25408.7411.34826
19C1405.1910.80000
20StiffenerL3441.8200.30926
21Coupler BarsP6c41.2250.01999-03
22P5c281.1580.12512
23EX-LinkL1H209724.76611.44299-01
24Add’l Vertical BarsF1404.3200.42700
25Fixing RebarFR1162.4500.09700
26Coupler BarsG7b480.7000.08399-04
27G8b60.7000.01099-03
28Dowel BarsSW1H161521.3620.32712
29SW2761.3620.16412
30C-LinkL2H1334401.2144.34399-02
Table A4. Rebar quantities of the original lap splice case (293 panels).
Bar Diameter (mm)Stock Length (m)No. of RebarsActual Rebar Quantity (ton)Ordered Rebar Quantity (ton)Cutting Waste (ton)Loss Rate (%)
H4012103,13611,503.5612,208.00704.455.77%
H321246,8803135.333551.44416.1111.72%
H251218,752817.65867.2449.605.72%
H2012148,2583533.414394.37860.9619.59%
H16128497147.24161.1013.868.60%
H1312112,2191272.561400.49127.939.13%
20,409.7422,582.652172.919.62%
Table A5. Rebar quantities of the previous lap splice case (293 panels) [16].
DescriptionH40H32H25H20H16H13Total
Required quantity (ton)12,208.003551.44867.244394.37161.101400.4922,582.65
Ordered quantity (ton)10,882.292929.94778.033564.13144.251283.7919,582.43
Cutting waste (ton)1325.71621.5089.21830.2416.85116.713000.22
Loss rate (%)10.9%17.5%10.3%18.9%10.5%8.3%13.3%
Table A6. A more detailed comparison between each case, with their reduction rates.
DescriptionOriginal (O)Previous (P)Coupler (C)Reduction (O-C)Reduction Rate (O-C)/O (%)Reduction (P-C)Reduction Rate (P-C)/P (%)
Required rebar quantity (ton)20,409.7419,432.0518,424.881984.869.731007.175.18
Ordered rebar quantity (ton)22,582.6519,582.3618,529.694052.9617.951052.675.38
Cutting waste (ton)2172.91150.31104.812068.1095.1845.5030.27
Carbon quantity (ton CO2-eq)79,15268,63667,09012,062.6415.241546.632.25
Economic impact
Rebar cost (USD)20,505,04517,780,78516,824,9593,680,08617.95955,8265.38
Rebar connection cost (USD)400,791207,0501,251,227−850,436−212.19−1,044,177−504.31
Carbon cost (USD)5,936,4145,147,7135,031,716904,69815.24115,9982.25
Waste disposal charging (USD)48,4343350233646,09895.18101430.27
Total cost (USD)26,890,68523,138,89923,110,2383,780,44614.0628,6610.12
Environmental impact
Blue water footprint (m3)1.24 × 1051.07 × 1051.01 × 1054052.9617.955.76 × 1035.38
Grey water footprint (m3)3.29 × 1062.85 × 1062.70 × 1062068.1017.951.53 × 1055.38
GWP (kg CO2-eq)7.61 × 1055.26 × 1043.67 × 1042.22 × 10495.181.59 × 10430.27
ADP (kg Sb)6.07 × 1034.20 × 1022.93 × 1025.91 × 10595.181.27 × 10230.27
AP (kg SO2-eq)5.01 × 1033.47 × 1022.42 × 1027.24 × 10595.181.05 × 10230.27
EP (kg PO43−-eq)7.51 × 1025.20 × 1013.62 × 1015.78 × 10395.181.57 × 10130.27
ODP (kg CFC-11-eq)2.31 × 10−21.60 × 10−31.12 × 10−34.77 × 10395.184.84 × 10−430.27
The costs except the carbon price were converted from KRW to USD using the current exchange rate [66]. The waste disposal cost was converted from HKD to USD, reflecting the current exchange rate [67].
Table A7. Material cost and processing cost of rebars and couplers.
DescriptionMaterial CostProcessing Cost
Rebar (USD/ton) Coupler (USD/pcs) Lap splice (USD/m)Coupler (USD/m)
H4090812.352.092.09
H3590811.501.751.75
H329088.441.621.62
H299086.901.321.32
H259086.141.051.05
H229085.370.800.80
H199084.220.590.59
The data of H40 were interpolated based on H32 using the regression method.

References

  1. Kwon, K.; Kim, D.; Kim, S. Cutting waste minimization of rebar for sustainable structural work: A systematic literature review. Sustainability 2021, 13, 5929. [Google Scholar] [CrossRef]
  2. United States Environmental Protection Agency. Overview of Greenhouse Gases. 2023. Available online: https://www.epa.gov/ghgemissions/overview-greenhouse-gases (accessed on 23 November 2023).
  3. Global Cement and Concrete Association. Cement and Concrete around the World. 2023. Available online: https://gccassociation.org/concretefuture/cement-concrete-around-the-world/ (accessed on 23 November 2023).
  4. Hanson, J.L.; Manheim, D.C.; Yeşiller, N. Geoenvironmental Assessment of Climate Impacts from Landfill Gas Emissions. Soils Found. 2023, 63, 101279. [Google Scholar] [CrossRef]
  5. Malmir, T.; Lagos, D.; Eicker, U. Optimization of Landfill Gas Generation based on A Modified First-Order Decay Model: A Case Study in the Province of Quebec, Canada. Environ. Syst. Res. 2023, 12, 6. [Google Scholar] [CrossRef]
  6. Assadolahfardi, G.; Panahandeh, A.; Khalvati, A.A.; Sekhavati, A. Life cycle assessment of construction phase of monorail project in Qom, Iran. Pollution 2017, 3, 81–99. [Google Scholar]
  7. Hu, C.; Zhou, Z.; Luo, Y.; Yan, X. Effect of Acid Rain on Mechanical Properties and Aging Mechanism of Asphalt. J. Mater. Civ. Eng. 2023, 35, 04023137. [Google Scholar] [CrossRef]
  8. Gomes, F.; Brière, R.; Feraille, A.; Habert, G.; Lasvaux, S.; Tessier, C. Adaptation of environmental data to national and sectorial context: Application for reinforcing steel sold on the French market. Int. J. Life Cycle Assess. 2013, 18, 926–938. [Google Scholar] [CrossRef]
  9. Melhem, N.N.; Maher, R.A.; Sundermeier, M. Waste management strategies prioritizing source reduction and prevention offer the greatest efficacy, minimizing resource consumption and adverse environmental impacts. J. Constr. Manag. 2021, 147, 04021056. [Google Scholar] [CrossRef]
  10. Chen, Y.; Yang, T. Lapping Pattern, Stock Length, and Shop Drawing of Beam Reinforcements of an RC Building. J. Comput. Civ. Eng. 2015, 29, 04014028. [Google Scholar] [CrossRef]
  11. Nadoushani, Z.S.M.; Hannad, A.W.; Xiao, J.; Akbarnezhad, A. Minimizing cutting wastes of reinforcing steel bars through optimizing lap splicing within reinforced concrete elements. Constr. Build. Mater. 2018, 185, 600–608. [Google Scholar] [CrossRef]
  12. Zheng, C.; Yi, C.; Lu, M. Integrated optimization of rebar detailing design and installation planning for waste reduction and productivity improvement. Autom. Constr. 2019, 101, 32–47. [Google Scholar] [CrossRef]
  13. Khondoker, M.T.H. Automated reinforcement trim waste optimization in RC frame structures using building information modeling and mixed integer linear programming. Autom. Constr. 2021, 124, 103599. [Google Scholar] [CrossRef]
  14. Lee, D.; Son, S.; Kim, D.; Kim, S. Special-Length-Priority Algorithm to Minimize Reinforcing Bar-Cutting Waste for Sustainable Construction. Sustainability 2020, 12, 5950. [Google Scholar] [CrossRef]
  15. Widjaja, D.D.; Rachmawati, T.S.N.; Kwon, K.; Kim, S. Investigating Structural Stability and Constructability of Buildings Relative to the Lap Splice Position of Reinforcing Bars. J. Korea Inst. Build. Constr. 2023, 23, 315–326. [Google Scholar] [CrossRef]
  16. Rachmawati, T.S.N.; Lwun, P.K.; Lim, J.; Lee, J.; Kim, S. Optimization of lap splice positions for near-zero rebar cutting waste in diaphragm walls using special-length-priority algorithms. J. Asian Archit. Build. Eng. 2023. [Google Scholar] [CrossRef]
  17. Widjaja, D.D.; Kim, S. Reducing rebar cutting waste and rebar usage of beams: A two-stage optimization algorithm. Buildings 2023, 13, 2279. [Google Scholar] [CrossRef]
  18. ACI Committee 318. Building Code Requirements for Structural Concrete (ACI 318-19) and Commentary (ACI 318R-19); American Concrete Institute: Farmington Hills, MI, USA, 2019. [Google Scholar]
  19. Nadoushani, Z.S.; Hammad, A.W.A.; Akbarnezhad, A.A. Framework for Optimizing Lap Splice Positions within Concrete Elements to Minimize Cutting Waste of Steel Bars. In Proceedings of the 33rd International Symposium on Automation and Robotics in Construction (ISARC), Auburn, AL, USA, 18–21 July 2016. [Google Scholar]
  20. Porwal, A.; Hewage, K.N. Building information modeling based analysis to minimize the waste rate of structural reinforcement. J. Constr. Eng. Manag. 2012, 138, 943–954. [Google Scholar] [CrossRef]
  21. Ugli Makhmudov, J.I.; Ugli Sobirov, O.K. Seismic resilience through diaphragm wall construction. Gold. Brain 2023, 1, 11–21. [Google Scholar]
  22. Datta, S.D.; Rana, M.J.; Assafi, M.N.; Mim, N.J.; Ahmed, S. Investigation on the generation of construction wastes in Bangladesh. Int. J. Constr. Manag. 2023, 23, 2260–2269. [Google Scholar] [CrossRef]
  23. Construction Association of Korea. Construction on Hold as Material Prices Go through the Roof. Available online: https://koreajoongangdaily.joins.com/2022/04/22/business/industry/Inflation/20220422165447730.html (accessed on 11 October 2023).
  24. Ghayeb, H.H.; Razak, H.A.; Sulong, N.H.R. Evaluation of the CO2 emissions of an innovative composite precast concrete structure building frame. J. Clean. Prod. 2020, 242, 118567. [Google Scholar] [CrossRef]
  25. IMF. Why Countries Must Cooperate on Carbon Prices. Available online: https://www.imf.org/en/Blogs/Articles/2022/05/19/blog-why-countries-must-cooperate-on-carbon-prices (accessed on 11 October 2023).
  26. United Nations Development Programme. The SDGs in Action. 2023. Available online: https://www.undp.org/sustainable-development-goals (accessed on 23 November 2023).
  27. Zubaidy, D.S.; Dawood, S.Q.; Khalaf, I.D. Optimal utilization of rebar stock for cutting processes in housing project. IARJSET 2016, 3, 189–193. [Google Scholar] [CrossRef]
  28. Rahimi, Z.; Maghrebi, M. Minimizing rebar cost using design and construction integration. Autom. Constr. 2023, 147, 104701. [Google Scholar] [CrossRef]
  29. Ren, K.; Jia, L.; Huang, J.; Wu, M. Research on cutting stock optimization of rebar engineering based on building information modeling and an improved particle swarm optimization algorithm. Dev. Built Environ. 2023, 13, 100121. [Google Scholar] [CrossRef]
  30. Kim, D.; Lim, C.; Liu, Y.; Kim, S. Automatic Estimation System of Building Frames with Integrated Structural Design Information (AutoES). Iran. J. Sci. Technol. Trans. Civ. Eng. 2020, 44, 1145–1157. [Google Scholar] [CrossRef]
  31. Shokrzadeh, M.R.; Nateghi, A.F.; Mansoori, M.R.; Pasha, P. Failure area evaluation of the coupler with threaded bar: Experimental and Numerical study. Int. J. Adv. Struct. Eng. 2022, 12, 531–543. [Google Scholar]
  32. Bompa, D.V.; Elghazouli, A.Y. Monotonic and cyclic performance of threaded reinforcement splices. Structures 2018, 16, 358–372. [Google Scholar] [CrossRef]
  33. Nateghi-Alahi, F.; Shokrzadeh, M.R. Behavior Considerations for Mechanical Rebar Couplers. In Proceedings of the University of Tokyo International Congress on Science and Engineering, Tokyo, Japan, 14–15 October 2019; pp. 30–41. [Google Scholar]
  34. Singh, R.; Himanshu, S.K.; Bhalla, N. Reinforcement Couplers as an Alternative to Lap Splices: A Case Study. Int. J. Eng. Res. Technol. 2013, 2, 1–6. [Google Scholar]
  35. Chiari, V.G.; Moreno, J.A.L. Experimental evaluation of coupler behavior for mechanical rebar splices in reinforced concrete structures. IBRACON Struct. Mater. J. 2018, 11, 1326–1353. [Google Scholar] [CrossRef]
  36. Damsara, K.D.P.; Kulathunga, D.D.T.K. Analysis on Effectiveness of Rebar Couplers in Splicing of Reinforcement Bars. In Proceedings of the International Symposium on Advances in Civil and Environmental Engineering Practices for Sustainable Development (ACEPS-2018), Galle, Sri Lanka, 15 March 2018. [Google Scholar]
  37. Tazarv, M.; Saiidi, M.S. Seismic design of bridge columns incorporating mechanical bar splices in plastic hinge regions. Eng. Struct. 2016, 124, 507–520. [Google Scholar] [CrossRef]
  38. Bompa, D.V.; Elghazouli, A.Y. Ductility considerations for mechanical reinforcement couplers. Structures 2017, 12, 115–119. [Google Scholar] [CrossRef]
  39. Moka, V.T.K.; Rajendran, S.C. Role of coupler in structural behavior of RC elements. Mater. Today Proc. 2022, 64, 1035–1042. [Google Scholar] [CrossRef]
  40. Chidambaram, R.S.; Agarwal, P. Performance evaluation of innovative hybrid rebar coupler in reinforced concrete beams subjected to monotonic loading. Struct. Concr. 2018, 19, 892–903. [Google Scholar] [CrossRef]
  41. Qing, Y.; Wang, C.L.; Meng, S.; Zeng, B. Experimental study on the seismic performance of precast concrete columns with thread-bolt combination couplers. Eng. Struct. 2022, 251, 113461. [Google Scholar] [CrossRef]
  42. Yousheng, D.; Keqin, Z.; Wenjie, L.; Qian, S.; Erli, M. Optimization of beam parameters for coupling beam pile structure foundations under vertical loading. Struct. Des. Tall Spec. Build. 2023, 32, e2007. [Google Scholar] [CrossRef]
  43. Mironov, D.A.; Osokin, A.I.; Loseva, E.S.; Kuzhelev, A.I. Specific features of diaphragm wall construction. IOP Conf. Ser. Mater. Sci. Eng. 2020, 775, 012051. [Google Scholar] [CrossRef]
  44. Alsakka, F.; Haddad, A.; Ezzedine, F.; Salami, G.; Dabaghi, M.; Hamzeh, F. Generative design for more economical and environmentally sustainable reinforced concrete structures. J. Clean. Prod. 2023, 387, 135829. [Google Scholar] [CrossRef]
  45. Tokyo Tekko (Korea Branch) Company, Ltd.; Hyewonkaci Architects. Proposal for Prefabricated Reinforced Concrete Casting Method Using Threaded Rebar and Couplers. In Proceedings of the Proposal Meeting and Discussion between Tokyo Tekko (Korea Branch) and Hyewonkaci Architects, Seoul, Republic of Korea, January 2014. [Google Scholar]
  46. Tokyo Tekko Company Ltd. Threaded Rebar Joint, ACE-Joint. Available online: https://www.tokyotekko.co.jp/en/prd/tekko/nsts/nsts04/main/04/teaserItems1/0/linkList/0/link/31.Catalogue_Ace-Joint.pdf (accessed on 23 November 2023).
  47. Tokyo Tekko Company Ltd. Neji-Tetsu-Con (Hot Rolled Threaded Rebar). Available online: https://www.tokyotekko.co.jp/en/prd/tekko/tc/tc01.html (accessed on 10 December 2023).
  48. Tokyo Tekko Company Ltd. Neji-Tetsu-Con (Hot Rolled Threaded Rebar). Available online: https://www.tokyotekko.co.jp/ko/prd/tekko/tc/tc01.html (accessed on 10 December 2023).
  49. Cutting Optimization Pro Home Page. Available online: https://optimalprograms.com/cutting-optimization/ (accessed on 10 December 2023).
  50. Gu, Y.; Xu, J.; Keller, A.A.; Yuan, D.; Li, Y.; Zhang, B.; Weng, Q.; Zhang, X.; Deng, P.; Wang, H.; et al. Calculation of water footprint of the iron and steel industry: A case study in Eastern China. J. Clean. Prod. 2015, 92, 274–281. [Google Scholar] [CrossRef]
  51. Rawat, A.; Srivastava, A.; Bhatnagar, A.; Gupta, A.K. Technological advancements for the treatment of steel industry wastewater: Effluent management and sustainable treatment strategies. J. Clean. Prod. 2023, 383, 135382. [Google Scholar] [CrossRef]
  52. Niu, S.; Xia, Y.; Yang, C.; Liu, C. Impacts of the steel industry on sediment pollution by heavy metals in urban water system. Environ. Pollut. 2023, 335, 122364. [Google Scholar] [CrossRef] [PubMed]
  53. Park, W.J.; Kim, R.; Roh, S.; Ban, H. Identifying the major construction wastes in the building construction phase based on life cycle assessments. Sustainability 2020, 12, 8096. [Google Scholar] [CrossRef]
  54. Kim, R.; Lim, M.K.; Roh, S.; Park, W.J. Analysis of the characteristics of environmental impacts according to the cut-off criteria applicable to the streamlined life cycle assessment (S-LCA) of apartment buildings in South Korea. Sustainability 2021, 13, 2898. [Google Scholar] [CrossRef]
  55. Lim, H.; Tae, S.; Roh, S. Major Building Materials in Terms of Environmental Impact Evaluation of School Buildings in South Korea. Buildings 2022, 12, 498. [Google Scholar] [CrossRef]
  56. World Economic Outlook, Navigating Global Divergences, October 2023. Available online: https://www.imf.org/en/Publications/WEO/Issues/2023/10/10/world-economic-outlook-october-2023 (accessed on 23 November 2023).
  57. Chen, X.; Yi, W.; Yuan, H.; Wu, W. Construction and demolition waste disposal charging scheme design. Comput. Aided Civ. Infrastruct. Eng. 2024, 39, 222–241. [Google Scholar] [CrossRef]
  58. Olubunmi, O.A.; Xia, P.B.; Skitmore, M. Green building incentives: A review. Renew. Sustain. Energy Rev. 2016, 59, 1611–1621. [Google Scholar] [CrossRef]
  59. Gou, Z.; Lau, S.S.Y.; Prasad, D. Market readiness and policy implications for green buildings: Case study from Hong Kong. J. Green Build. 2013, 8, 162–173. [Google Scholar] [CrossRef]
  60. Diyana, N.; Abidin, Z. Motivation and expectation of developers on green construction: A conceptual view. Int. J. Humanit. Soc. Sci. 2013, 7, 914–918. [Google Scholar] [CrossRef]
  61. Cotten, M.N. The wisdom of LEED’s role in green building mandates. Cornell Real Estate Rev. 2012, 10, 6. Available online: https://ecommons.cornell.edu/bitstream/handle/1813/70698/2012_22_37__Cotten.pdf?sequence=1 (accessed on 10 December 2023).
  62. Fan, K.; Chan, E.H.; Chau, C.K. Costs and benefits of implementing green building economic incentives: Case study of a gross floor area concession scheme in Hong Kong. Sustainability 2018, 10, 2814. [Google Scholar] [CrossRef]
  63. Shazmin, S.A.A.; Sipan, I.; Sapri, M. Property tax assessment incentives for green building: A review. Renew. Sustain. Energy Rev. 2016, 60, 536–548. [Google Scholar] [CrossRef]
  64. Azis, S.S.A.; Sipan, I.; Sapri, M. The potential of implementing property tax incentives on green building in Malaysia. Am. J. Econ. 2013, 3, 63–67. Available online: https://www.researchgate.net/profile/Saa-Shazmin/publication/307339089_The_Potential_of_Implementing_Property_Tax_Incentives_on_Green_Building_in_Malaysia/links/57c5083008aeb049143583af/The-Potential-of-Implementing-Property-Tax-Incentives-on-Green-Building-in-Malaysia.pdf (accessed on 10 December 2023).
  65. Rana, A.; Sadiq, R.; Alam, M.S.; Karunathilake, H.; Hewage, K. Evaluation of financial incentives for green buildings in Canadian landscape. Renew. Sustain. Energy Rev. 2021, 135, 110199. [Google Scholar] [CrossRef]
  66. Woori Bank. Daily Exchange Rates. Available online: https://spib.wooribank.com/pib/Dream?withyou=ENENG0358 (accessed on 17 November 2023).
  67. The Hong Kong and Shanghai Banking Corporation Limited (HSBC). Foreign Currency Exchange Rates. Available online: https://www.hsbc.com.hk/investments/products/foreign-exchange/currency-rate/ (accessed on 10 December 2023).
Figure 1. Rebar arrangement of a rebar cage.
Sustainability 16 01213 g001
Figure 2. Flowchart of the methodology.
Sustainability 16 01213 g002
Figure 3. Illustration of end rebar and middle rebar.
Sustainability 16 01213 g003
Figure 4. Vertical rebar arrangement of a diaphragm wall panel: (a) cross−section, (b) rebar cage sections. (Adapted from Rachmawati et al. [16]).
Sustainability 16 01213 g004
Figure 5. Diaphragm wall vertical rebar arrangement: (a) before special−length optimization, (b) after special-length optimization.
Sustainability 16 01213 g005
Table 1. Conventional lap splice limitations.
Author(s)Description
Singh et al. [34]Time-consuming in design and installation.
Increased rebar congestion probability.
Increased amount of rebar used.
Chiari and Junior [35]Limited use in structural restoration.
Limited allowable rebar diameters for splicing.
Shokrzadeh et al. [31] Increased rebar consumption and cost, especially for bars with a diameter greater than 30 mm.
Rebar congestion issue due to lap splicing.
Damsara and Kulathunga [36]Rebar congestion issue due to lap splicing.
Significant rebar waste due to the longer lap lengths required for larger-diameter rebars.
Table 2. Attributes of the diaphragm wall panel.
DescriptionContents
Length of D-wall6 m
Thickness of D-wall1 m
Overall depth of D-wall37.58 m
Depth of floor slab 1200 mm
Top concrete cover 100 mm
Bottom concrete cover200 mm
Strength of rebarsSHD500
Concrete strength24 MPa
Length   of   ordered   rebar ,   l o r d e r (m) 6     l o r d e r ≤ 12
Table 3. Mechanical coupler-based special-length rebar minimization on vertical main rebars.
Bar MarkBar Size (mm)Unit Weight (kg/m) [47,48]No. of RebarsRequired Length (m)Special Length (m)Required Rebar Quantity (ton)Ordered Rebar Quantity (ton)Loss Rate (%)
A1H409.864409.0109.13.5553.5900.99%
A2H409.864408.9959.03.5493.5510.06%
B1H409.864408.6858.73.4273.4330.17%
B2H409.864408.6858.73.4273.4330.17%
E1H409.864408.6858.73.4273.4330.17%
E2H409.864408.6858.73.4273.4330.17%
D1H409.8644011.01011.14.3444.3800.81%
D2H409.8644010.99511.04.3384.3400.05%
A3H326.313409.5859.62.4202.4240.16%
A4H326.313409.6009.62.4242.4240.00%
D3aH326.313407.5857.61.9151.9190.20%
D4H326.313407.6007.61.9191.9190.00%
38.17238.2790.28%
Table 4. Cutting pattern optimization for the remaining rebars.
Bar Size (m)Unit Weight (kg/m) [47,48]Special Length (m)No. of RebarsRequired Rebar Quantity (ton)Ordered Rebar Quantity (ton)Loss Rate (%)
H409.86410.3515.1295.1821.01%
H326.3131240.3020.3030.41%
H253.85410.6652.6002.6552.08%
H202.4669.651312.04012.1450.86%
H161.5608.2380.4840.4860.34%
H130.995113834.1554.1920.87%
24.71124.9631.01%
Table 5. Rebar quantities and cutting waste after applying the proposed algorithm (one panel).
DescriptionH40H32H25H20H16H13Total
Required quantity (ton)34.6238.9812.60012.0400.4844.15562.884
Ordered quantity (ton)34.7748.9902.65512.1450.4864.19263.241
Cutting waste (ton)0.1510.0090.0550.1050.0020.0370.358
Loss rate (%)0.43%0.10%2.08%0.86%0.34%0.87%0.57%
Table 6. Rebar quantities of the original case, the previous case, and the coupler case (293 panels).
DescriptionRequired Quantity (ton)Ordered Quantity (ton)Cutting Waste (ton)Loss Rate (%)
Original case20,409.7422,582.652172.919.62%
Previous case [15]19,432.0519,582.36150.310.77%
Coupler case18,424.8818,529.69104.810.57%
Table 7. The rebar reduction rate of the original case, the previous case, and the coupler case (293 panels).
DescriptionOriginal (O)Previous (P)Coupler (C)Reduction (O-C)Reduction Rate (O-C)/O (%)Reduction (P-C)Reduction Rate (P-C)/P (%)
Required rebar quantity (ton)20,409.7419,432.0518,424.881984.869.731007.175.18
Ordered rebar quantity (ton)22,582.6519,582.3618,529.694052.9617.951052.675.38
Cutting waste (ton)2172.91150.31104.812068.1095.1845.5030.27
Table 8. The carbon reduction rate of the original case, the previous case, and the coupler case (293 panels).
DescriptionOriginal (O)Previous (P)Coupler (C)Reduction (O-C)Reduction Rate (O-C)/O (%)Reduction (P-C)Reduction Rate (P-C)/P (%)
Carbon quantity (ton-CO2-eq)79,15268,63667,09012,06315.2415472.25
Table 9. The water and environmental impact associated with the original case, the previous case, and the coupler case (293 panels).
DescriptionOriginal (O)Previous (P)Coupler (C)Reduction (O-C)Reduction (P-C)
Rebar quantity (tons)22,582.6519,582.3618,529.694052.961052.67
Cutting waste (tons)2172.91150.31104.812068.1045.50
Blue water footprint (m3)1.24 × 1051.07 × 1051.01 × 1052.22 × 1045.76 × 103
Grey water footprint (m3)3.29 × 1062.85 × 1062.70 × 1065.91 × 1051.53 × 105
GWP (kg CO2-eq)7.61 × 1055.26 × 1043.67 × 1047.24 × 1051.59 × 104
ADP (kg Sb)6.07 × 1034.20 × 1022.93 × 1025.78 × 1031.27 × 102
AP (kg SO2-eq)5.01 × 1033.47 × 1022.42 × 1024.77 × 1031.05 × 102
EP (kg PO43−-eq)7.51 × 1025.20 × 1013.62 × 1017.15 × 1021.57 × 101
ODP (kg CFC-11-eq)2.31 × 10−21.60 × 10−31.12 × 10−32.20 × 10−34.84 × 10⁻⁴
POCP (kg C2H4-eq)7.42 × 1025.13 × 1013.58 × 1017.06 × 1021.55 × 101
Disclaimer/Publisher’s Note: The statements, opinions and data contained in all publications are solely those of the individual author(s) and contributor(s) and not of MDPI and/or the editor(s). MDPI and/or the editor(s) disclaim responsibility for any injury to people or property resulting from any ideas, methods, instructions or products referred to in the content.

