Article

Evaluation of Technological Properties of Mortars with the Addition of Plaster Byproduct

by
Carolina Gomes Dias Ribeiro
1,
Gustavo de Castro Xavier
2,
Laimara da Silva Barroso
1,
Carlos Mauricio Fontes Vieira
1,
Sergio Neves Monteiro
3 and
Afonso Rangel Garcez de Azevedo
2,*
1
LAMAV—Advanced Materials Laboratory, UENF—University of the Northern Rio de Janeiro, Av. Alberto Lamego, 2000, Campos dos Goytacazes 28013-602, Brazil
2
LECIV—Civil Engineering Laboratory, UENF—State University of the Northern Rio de Janeiro, Av. Alberto Lamego, 2000, Campos dos Goytacazes 28013-602, Brazil
3
Department of Materials Sciences, Military Engineering Institute, Rio de Janeiro 22290-270, Brazil
*
Author to whom correspondence should be addressed.
Sustainability 2024, 16(3), 1193; https://doi.org/10.3390/su16031193
Submission received: 18 December 2023 / Revised: 20 January 2024 / Accepted: 27 January 2024 / Published: 31 January 2024
(This article belongs to the Special Issue Sustainable Approaches for Developing Concrete and Mortar)

Abstract

:
The incorporation of waste into construction materials is a potential topic for study and is seen as a solution for many industries that face the following impasse: the risk to the environment due to the accumulation of waste in yards. In view of this, during the production of lactic acid, which is widely used in industries, gypsum is produced as a byproduct, yielding one ton for each ton of lactic acid. Aiming at a functional destination for this byproduct, this study proposes its addition in mortars for covering walls and ceilings. The research proposal was a mortar in a 1:6 ratio (cement:sand) with the addition of 0, 3, 6 and 10% of industrial plaster byproduct. The cement used to prepare the mortar was CPII-E32. To characterize the raw materials, scanning electron microscopy, X-ray fluorescence and X-ray diffraction analysis were carried out. To evaluate the properties in the fresh state, a consistency index and mass density and entrained air tests were carried out. In the hardened state, mass density, axial compression strength, flexural tensile strength and water absorption via capillarity were evaluated after 28 days of age. Microstructural characterization techniques were also carried out on the reference mixtures and with 3% addition of the byproduct gypsum, such as scanning electron microscopy and X-ray diffraction. The results showed that the byproduct is hemihydrate and its addition improved the workability of the mortar. Mortars with the addition of byproduct gypsum showed a reduction in mechanical resistance. The most satisfactory results were for the mixes with a 3% addition, indicating greater resistance to axial compression and flexural traction, with 3.90 MPa and 1.14 MPa, respectively.

1. Introduction

Mortar can be defined as a mass made from a mixture of relatively fine aggregates with a binder and water. However, other materials can be included in its formulation, for optimization in relation to the type of application in question. However, with the development of the civil construction sector, there is an increase in research evaluating the incorporation of waste into mortars and these have brought good prospects from an economic point of view, since the use of waste generates cost reductions and favors adequate disposal of a material previously considered insignificant [1].
The production of lactic acid gives rise to the byproduct gypsum used in this study. Lactic acid has wide application as a raw material for various industries, such as the food industry, pharmaceutical industry and leather and textile industries [2]. Its production is based on a fermentation process, where bacteria are fermented and Ca(OH)2 is added to control the pH, thus producing calcium lactate. The use of sulfuric acid to liberate lactic acid from calcium lactate subsequently generates calcium sulfate as a solid byproduct gypsum that is discarded [3]. In this fermentation process, it is estimated that approximately one ton of gypsum (CaSO4) is generated per ton of lactic acid produced, highlighting the importance of enabling the application of this byproduct gypsum in some production process [4].
To characterize the byproduct gypsum, as well as other solid aggregates used in the preparation of the mortar, tests were carried out to determine the chemical composition, mineralogical analysis, specific mass and granulometry. To determine the properties of the mortar in the fresh state, the consistency index, mass density in the fresh state and incorporated air test content were evaluated. In the hardened state, tests were carried out to evaluate compressive strength, flexural tensile strength and water absorption by capillarity after 28 days of curing.

2. Materials and Methods

The flowchart that summarizes the methodological path of this research is given in Figure 1.

2.1. Raw Material

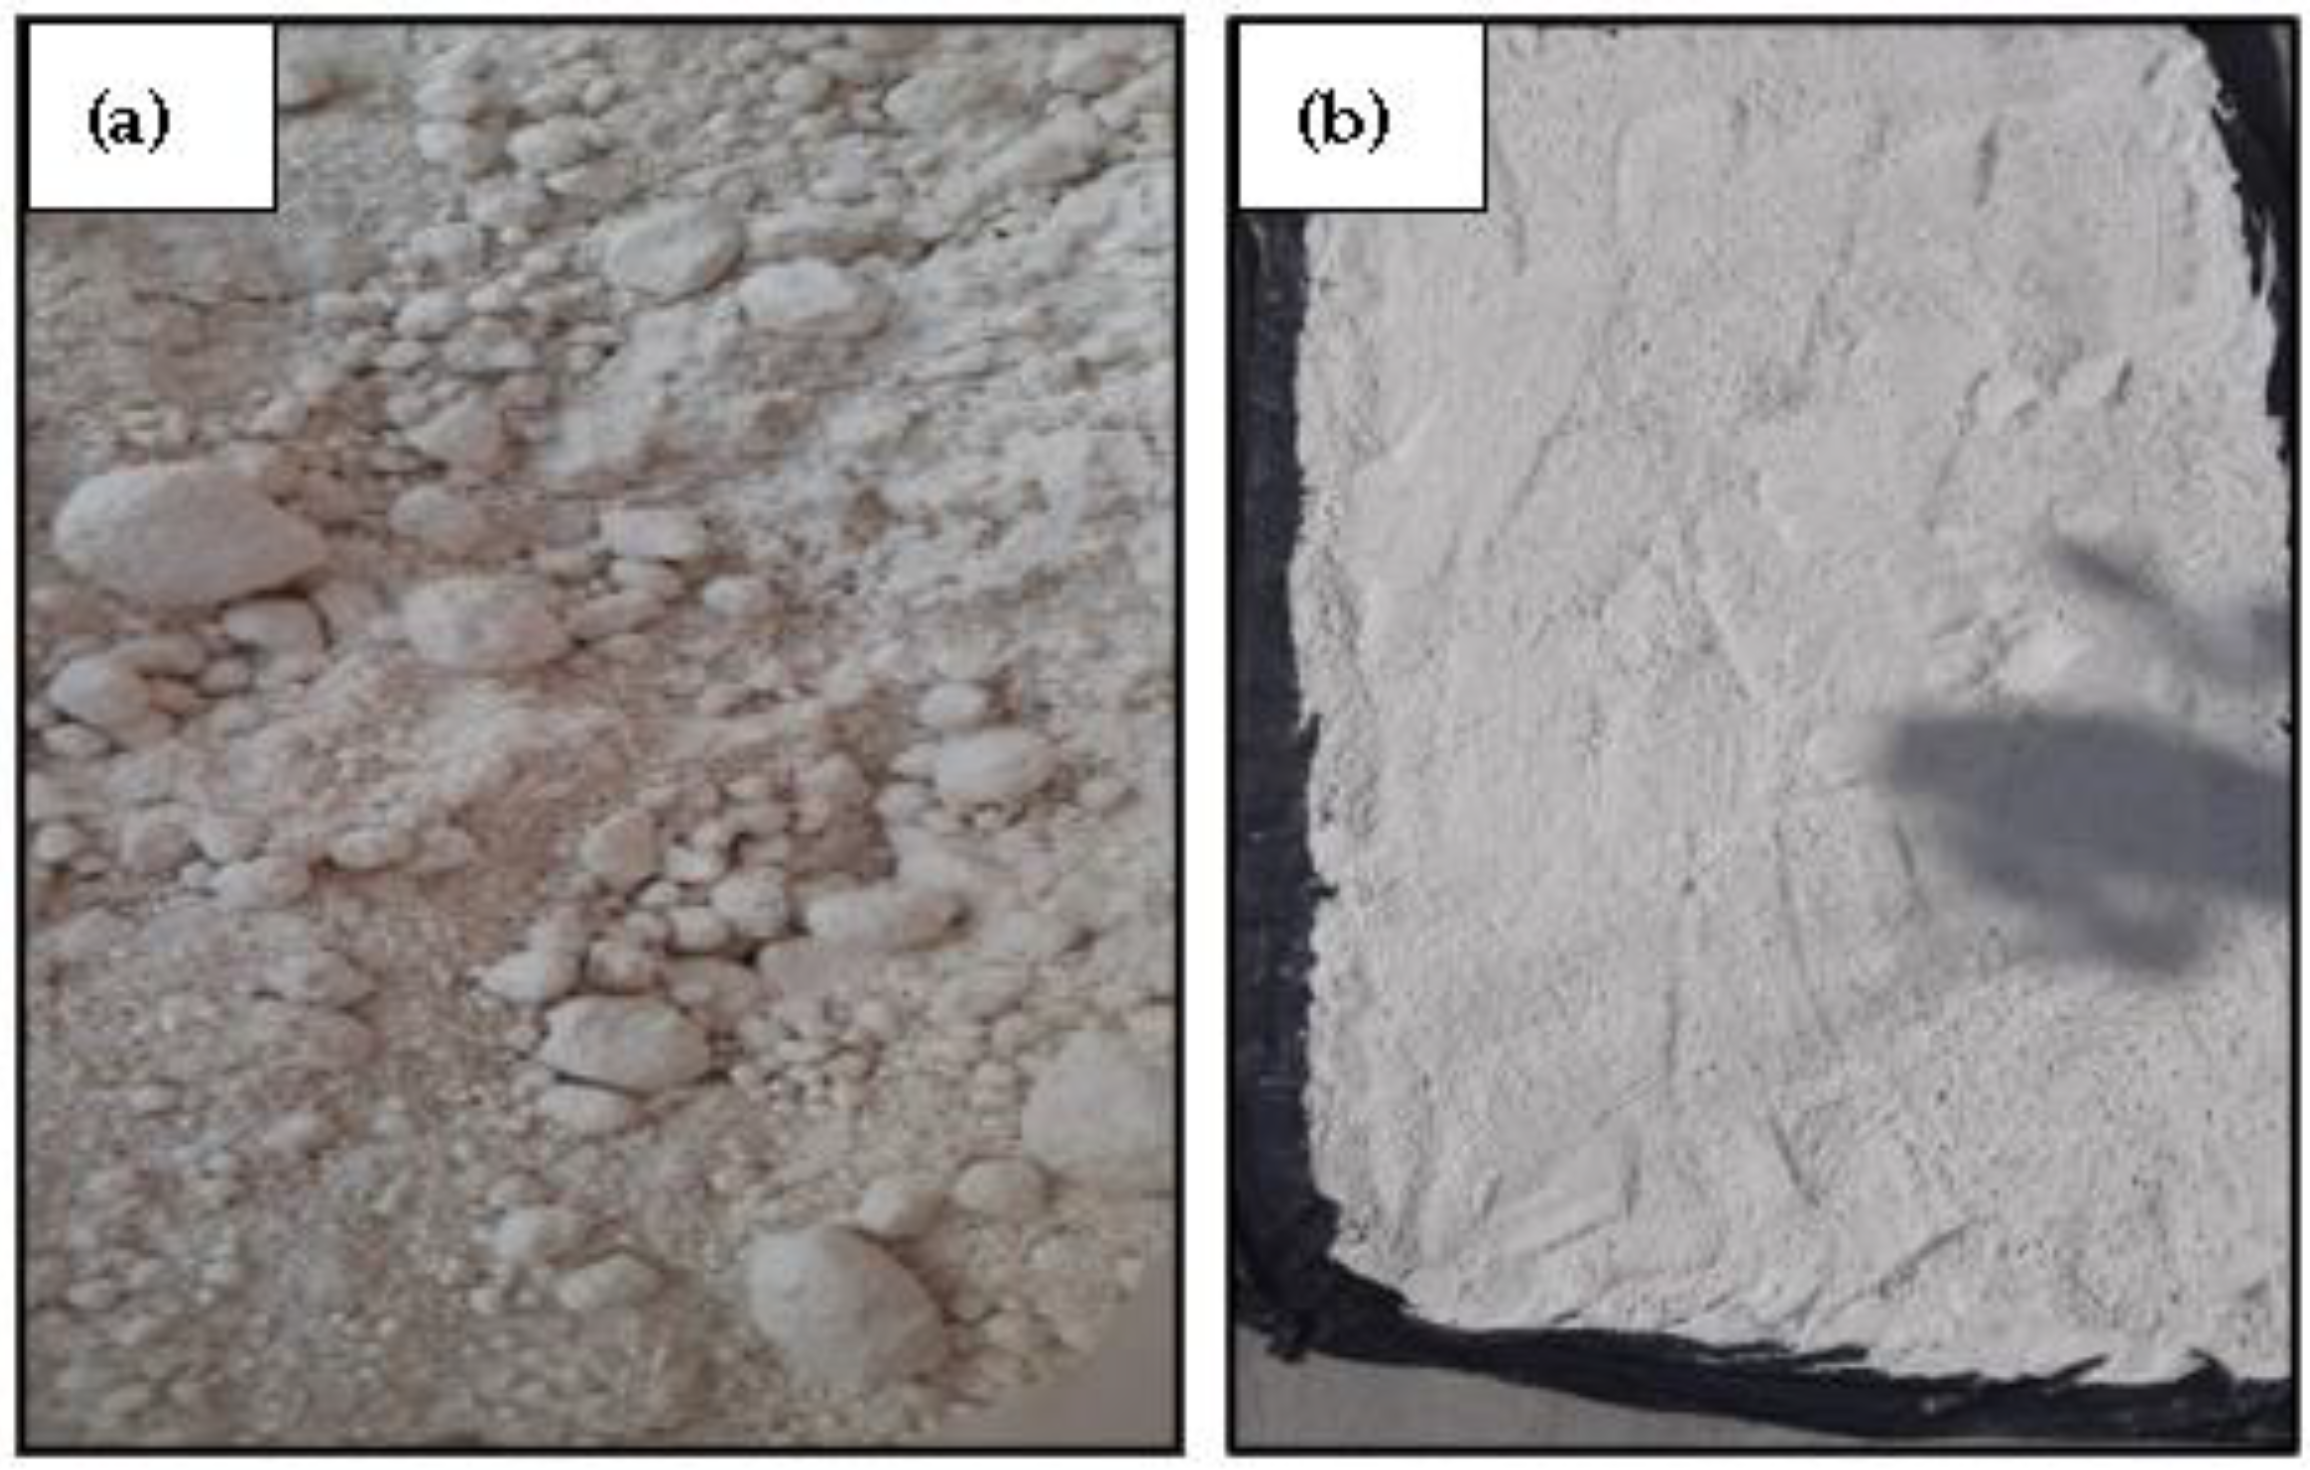
The raw materials used in the preparation of the mortar were natural sand, Portland cement, byproduct gypsum and water. The sand used in this experiment was of natural origin, extracted from the Paraiba do Sul River, in the municipality of Campos dos Goytacazes-RJ. The availability and wide use of CPII-E cement in the Campos dos Goytacazes-RJ region were the main justifications for choosing this binder. The industrial byproduct gypsum, coming from the production of lactic acid, was supplied by a company located in Campos dos Goytacazes-RJ. The byproduct gypsum was subjected to natural drying for 48 h and in an oven at 100 ± 10 °C for 48 h. Soon after, to reduce particle size, the byproduct was crushed using a mortar and porcelain piston. After this process, the byproduct gypsum was passed through an 8 × 2 stainless steel granulometric sieve, with 0.075 mm openings and a 200 mesh, for better refinement. Figure 2 shows the physical appearance of the byproduct gypsum as received and after 48 h of natural drying.

2.2. Characterization of Raw Materials

The chemical characterization of the gypsum and CPII-E32 byproduct was carried out using the X-ray fluorescence technique, which allows for the detection of the elements present and their respective compositions. The equipment used to perform the XRF analysis was a Rigaku Primini with a palladium X-ray generating source. To carry out the analysis, the sample was analyzed in powder form.
The mineralogical analysis of the samples was carried out using the X-ray diffraction technique at the University of São Paulo (USP). Byproduct gypsum samples, as well as CPII-E samples, were previously sieved with a 200 mesh. The parameters adopted in this analysis were an angular step of 0.02 with an interval of 1 s and a scanning angle of 2θ, ranging from 0 to 70°. The identification of the minerals present in the samples was possible with the help of the PDF-2 database from the International Center for Diffraction Data (ICDD).
The granulometric analysis of the sand, the byproduct gypsum and the CPII-E cement was carried out using the laser granulometry test, which measures the diffraction angles of the laser beam and correlates them with the diameters of the particles. The equipment used was the MICROTRAC S3500 Particle Size Analyzer and was carried out at the Federal University of Santa Catarina (UFSC). The determination of the specific mass of the sand was carried out according to the procedures of [5]. The specific mass tests for the Portland CP II-E cement and the byproduct gypsum were carried out according to procedures determined by [6]. These tests were carried out at the University of the Northern Rio de Janeiro (UENF).

2.3. Preparation of the Experimental Mortar

The fresh mortars were prepared according to the guidelines of [7]. A bench mortar was used to help homogenize the mortar. For this purpose, 2.5 kg of dry material were used for each mixture with water. The required mass of water was determined using the limits established with the consistency index test, according to [8]. The nomenclature adopted in this study, for each mortar mixture, as well as their respective additions of plaster byproducts, is presented in Table 1.
According to Mohammed and Safiullah [9], the optimum gypsum content is 5.5, which is why the gypsum addition percentages were 3, 6 and 10%.

2.4. Tests in the Fresh State

The consistency index test was carried out in accordance with the guidance of [8], with the aid of a frustoconical mold, metal fitting and metal ruler.
The fresh mass density test was carried out following the guidelines of [10].

2.5. Tests in the Hardened State

To carry out the tests in the hardened state, 6 prismatic specimens measuring 4 cm × 4 cm × 16 cm were molded and prepared in metallic molds, which consist of open frames with removable walls.
The hard state tests were carried out in the LAMAV/LECIV laboratories located at the UENF, after drying and curing for 28 days.
The flexural tensile strength test was carried out in accordance with [11]. Three samples were subjected to the flexural tensile test in an INSTRON 5582 model press with a maximum capacity of 10 tons. The load applied to the specimens was 50 ± 10 N/s, at a speed of 1 mm/s until rupture.
When carrying out the axial compression resistance test, halves of three samples broken in the previous test were used. The specimens were positioned in the support device of the INSTRON 5582 press, with a maximum capacity of 10 tons, applying a load of 500 ± 50 N/s, at a speed of 10 mm/min until the specimens ruptured. This test was carried out in accordance with [11].
For the capillary absorption test, three specimens were molded for each incorporation in accordance with [12]. The surface of each specimen was sanded with coarse sandpaper and cleaned with a brush, to better standardize the specimens.

3. Results and Discussions

3.1. Characterization of Materials

  • X-ray fluorescence
To carry out this test, the byproduct gypsum and Portland cement were crushed and passed through a 75 µm sieve (n° 200).
The elements and their respective compositions present in the byproduct gypsum and CPII-E32, obtained via chemical analysis using X-ray fluorescence, are presented in Table 2.
According to the specifications of [13], construction plaster has a minimum content of 38% CaO and a minimum content of 53% SO3. According to the results presented in Table 2, the byproduct gypsum used in this study has specifications that are compatible with those indicated by the standard, since it is predominantly composed of SO3 (53.29%) and CaO (44.56%), totaling 97.85%. The content of 2.08% suggests the presence of impurities in the mass of the byproduct gypsum, composed of alumina, silica, chloride and potassium oxide. These results corroborate those found by other authors [14,15,16,17,18].
The results obtained by the chemical analysis of CPII-E cement indicated the predominance of silica and calcium oxide, a characteristic composition of Portland cement. Other authors also found mainly silica and calcium oxide in CPII-E, being 29.54% and 49.01%, respectively [19].
  • X-ray diffraction
To carry out this test, the byproduct gypsum was crushed and passed through a 75 µm sieve (n° 200).
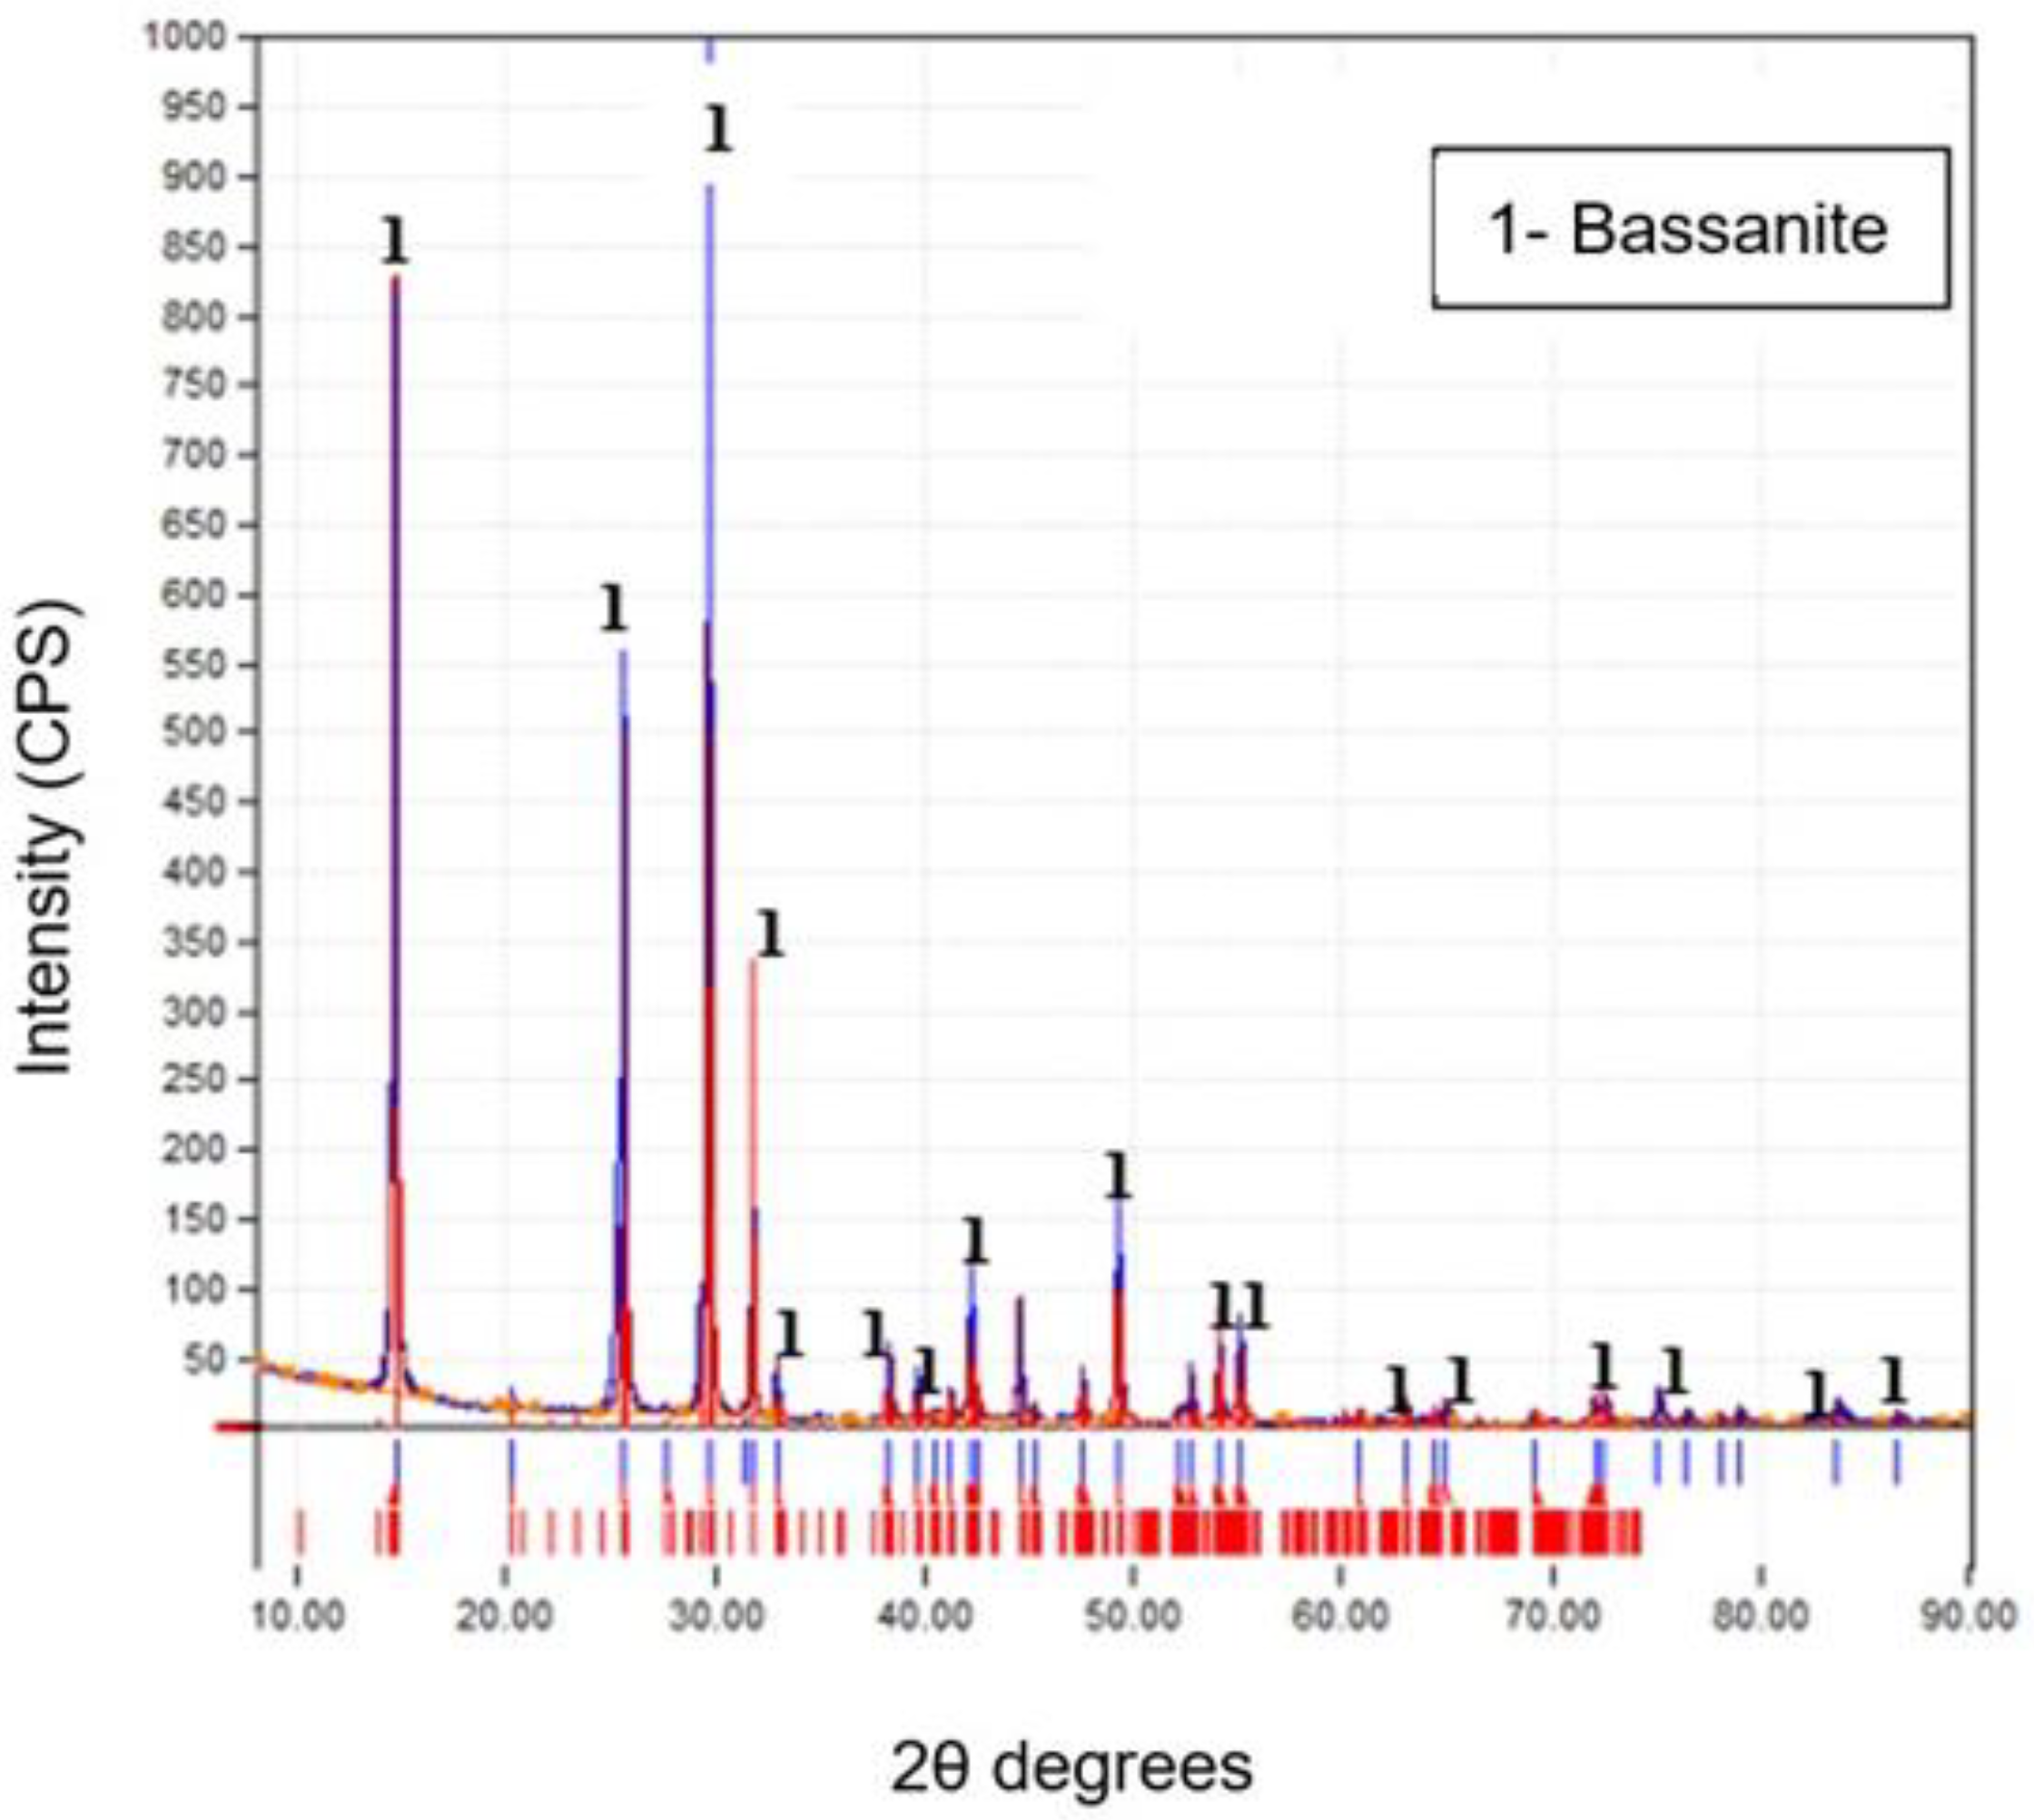
Figure 3 shows the diffractogram obtained for the byproduct gypsum. The peaks identified in the sample correspond to a single mineral, bassanite, characterizing the byproduct gypsum as a hemihydrate (CaSO4·0.5H2O). The absence of detection of peaks in the X-ray diffraction results that would correspond to the oxides that were found in the chemical analysis with X-ray fluorescence indicates that the components are present in the sample as amorphous materials.
Other authors also characterized the byproduct gypsum obtained by the production of lactic acid to evaluate the photooxidation of these PLA/calcium sulfate composites, classifying it as calcium sulfate hemihydrate (CaSO4·0.5H2O)—bassanite. In another study, the authors evaluated hardened (PLA)-CaSO4 composites with low molecular weight plasticizers similar to polymeric esters and related weight and performance. In the study, the byproduct of the lactic acid manufacturing process was also characterized as calcium sulfate hemihydrate (CaSO4·0.5H2O), agreeing with the results obtained in this study. The byproduct was used in their studies [20,21].
  • Granulometric distribution
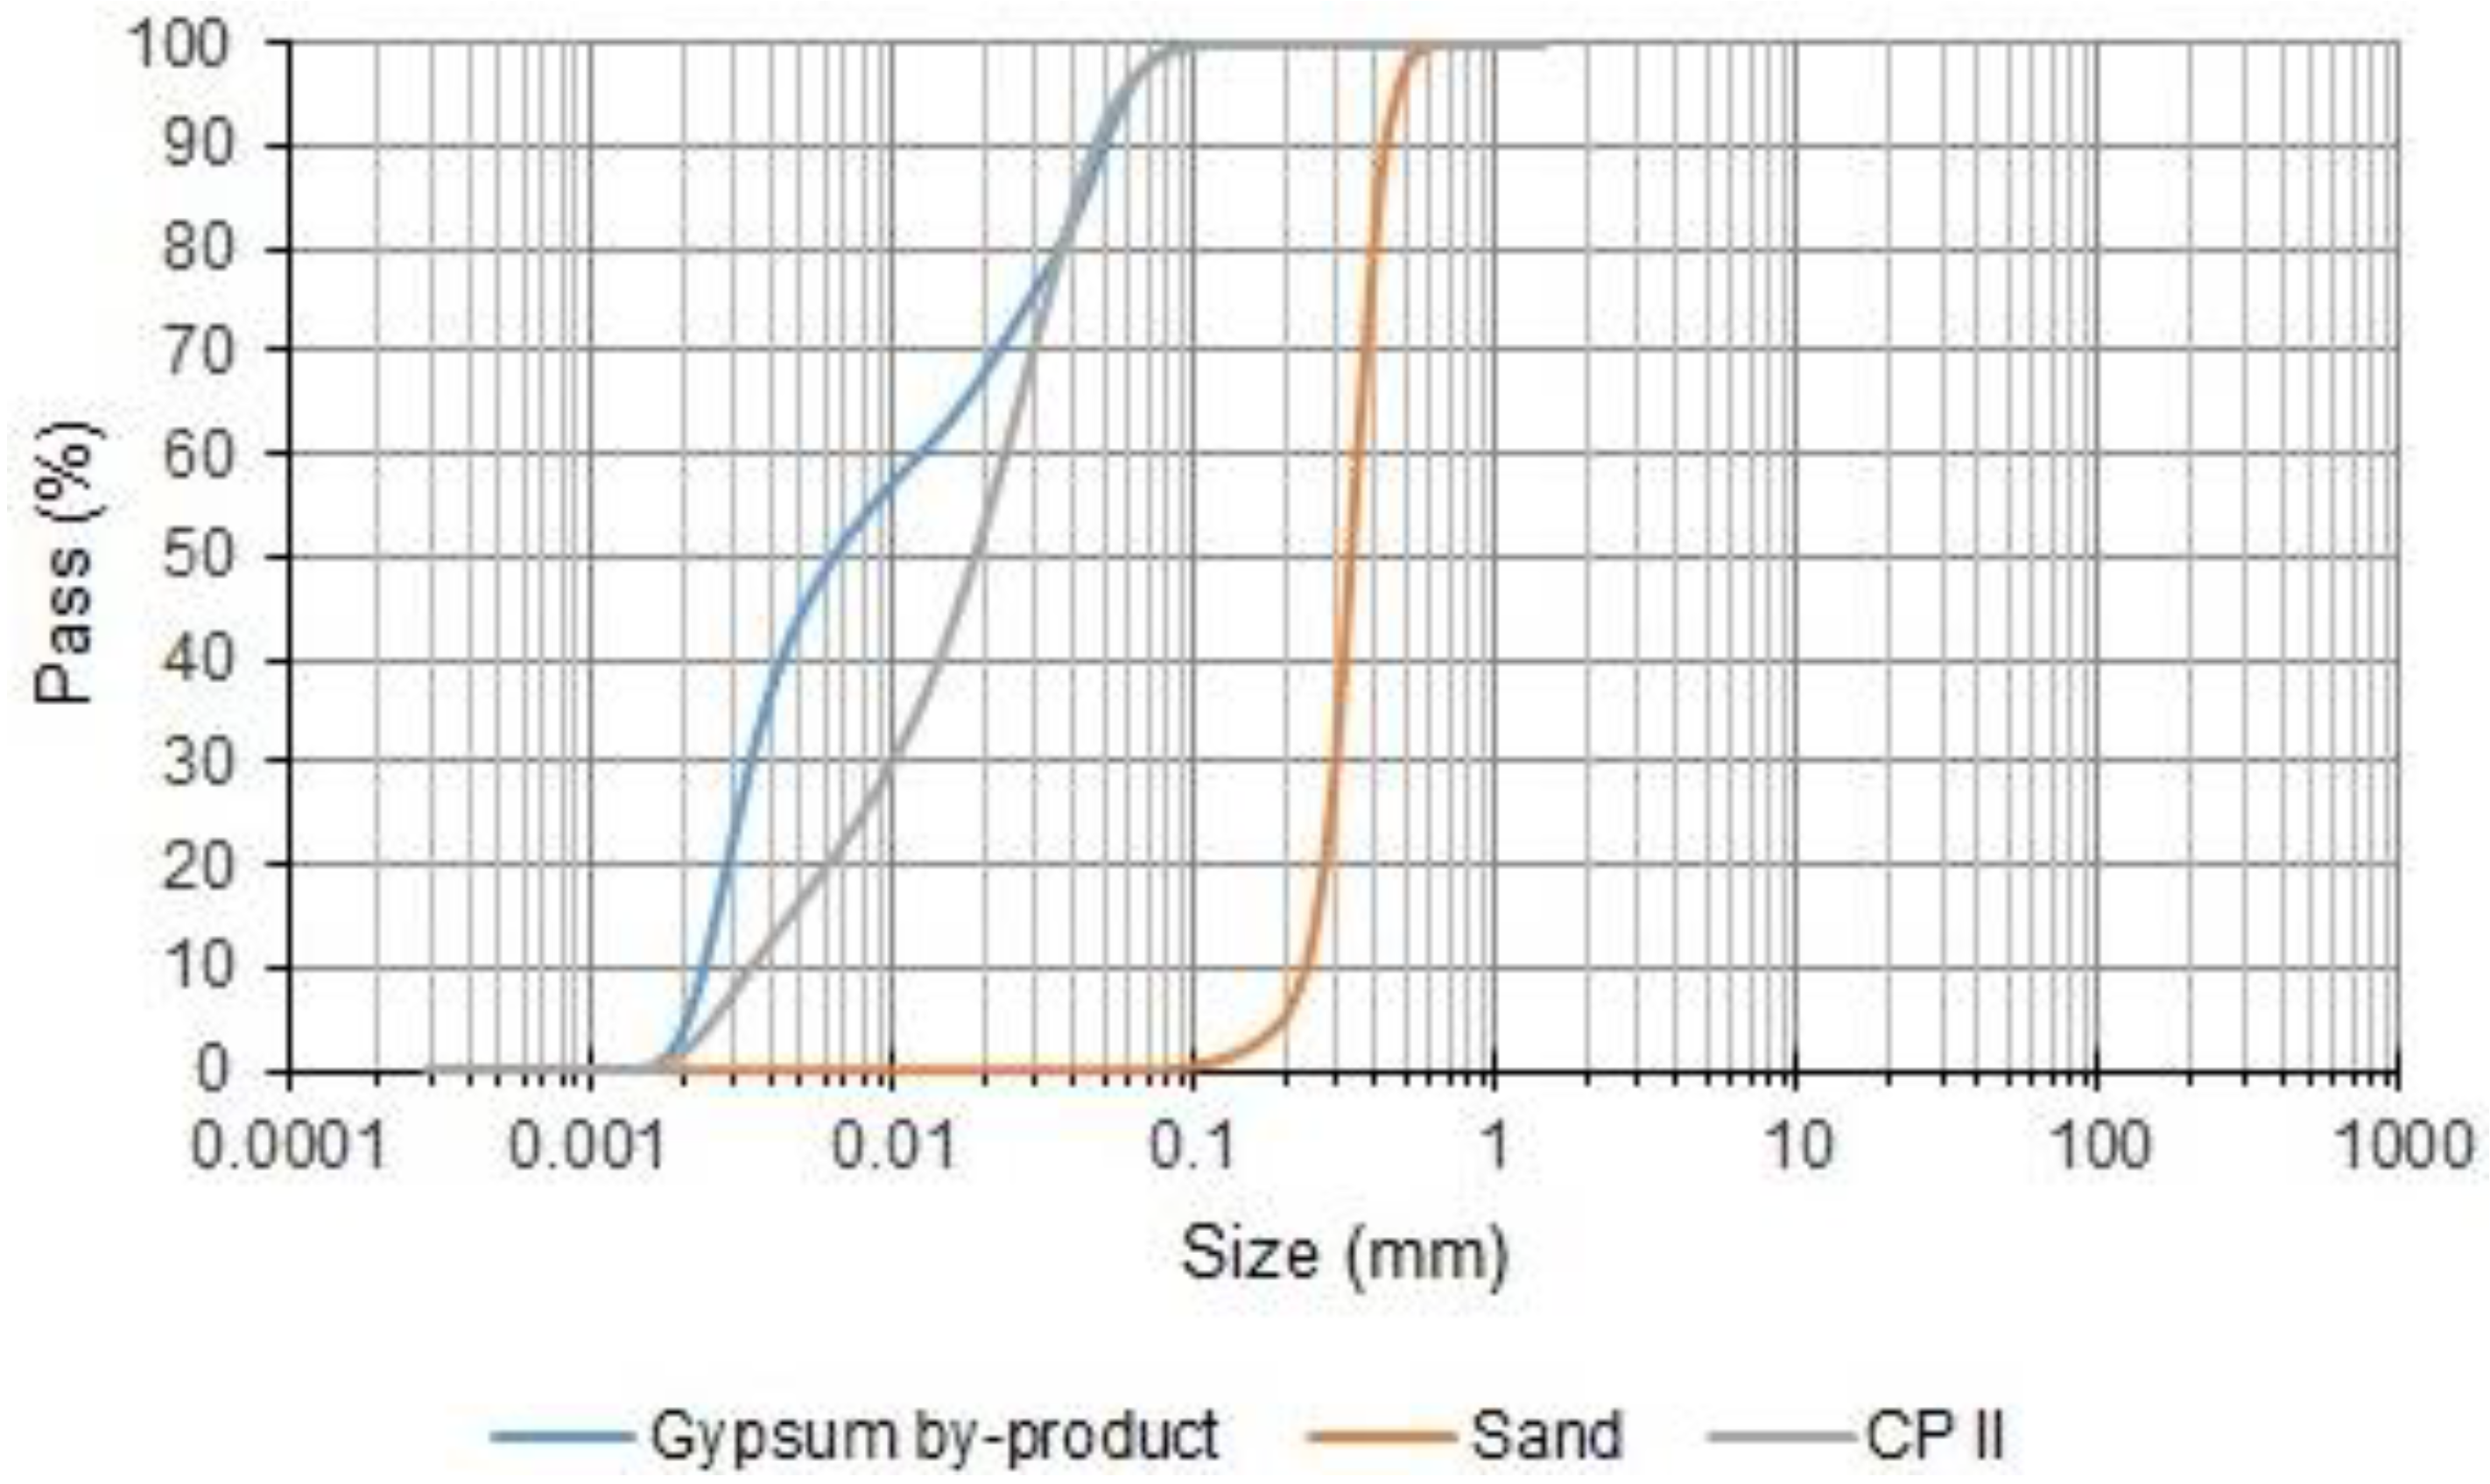
Figure 4 shows the particle size distribution of the byproduct gypsum, sand and CPII E-32 obtained via laser granulometry. The particle size distribution curve of the byproduct gypsum shows the particle size as being 2.36 µm in d10, 6.38 µm in d50 and 50.08 µm in d90. The CPII E-32 cement presented particles measure 3.39 µm in d10, 18.74 µm in d50 and 46.77 µm in d90. The sand particle sizes were 0.1786 mm at d10, 0.3356 mm at d50 and 0.6428 mm at d90. For the sand, there was a predominance of around 67% medium sand, 18% coarse sand and 15% fine sand, without the presence of clay and silt fractions.
Contrasting the results of the granulometry of the sand and the byproduct gypsum, it is notable that the sand consists of larger particles than the byproduct gypsum, which is characterized by very fine particles. This is proven by the D90 of the sand being 0.6428 mm and D90 of the byproduct gypsum being 0.05008 mm.
Particle size has an influence on several plaster properties, such as unit mass, compressive strength and normal consistency. Regarding the influence that particle size exerts on the hydration process of the binder, particles with larger dimensions have a lower hydration speed due to the fact that the hydration process occurs from the external surface of the grain to its interior [22,23,24].
  • Specific mass
The results obtained in the specific mass tests are presented in Table 3.
The byproduct gypsum had a specific mass of 2.73 g/cm3, the CPII-E cement 2.94 g/cm3 and the sand 2.67 g/cm3.
These results are in agreement with those found by other authors, as [16] obtained a specific mass of 2.61 g/cm3 for natural hemi hydrated gypsum obtained via calcination of natural gypsum. Ref. [25] found specific mass values for sand of 2.65 g/cm3 and for CPII E-32 of 2.95 g/cm3, in accordance with the results of this study and [26], in which the specific mass of natural quartz sand was 2.64 g/cm3.
  • Scanning electron microscopy (SEM) of byproduct gypsum
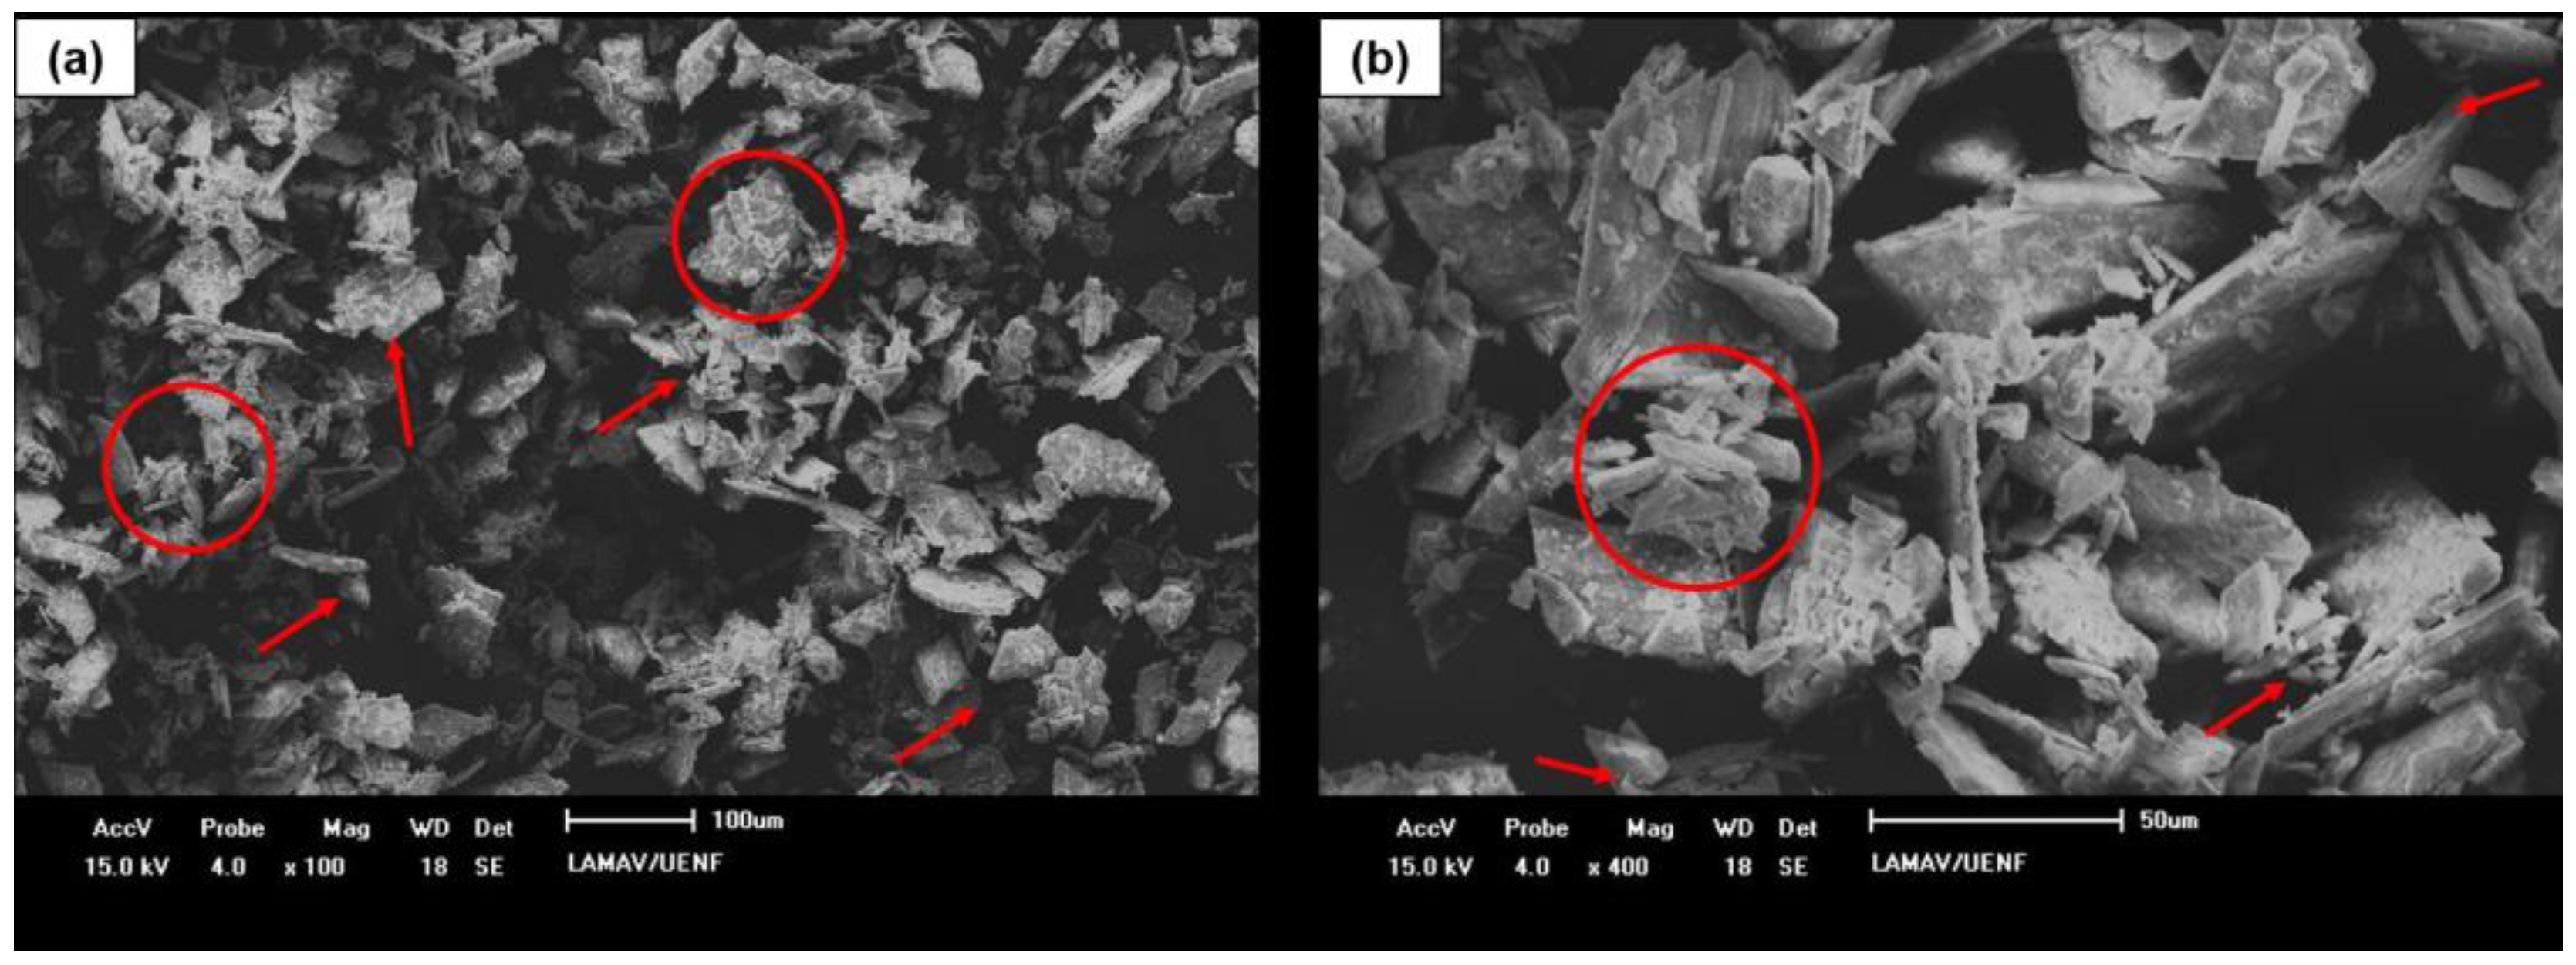
According to the analysis of the byproduct gypsum sample via scanning electron microscopy, it was possible to observe the microstructural and morphological characteristics of the component particles. Figure 5 presents the micrographs of the byproduct gypsum, obtained through scanning electron microscopy, with image magnification of 100 times in Figure 5a and 400 times in Figure 5b. It is possible to observe that microstructures of hemi hydrated gypsum particles appeared as crystals with hexagonal shapes, with a smooth surface (highlighted by arrows) and others with irregular shapes, some with overlapping crystals with different sizes (highlighted by circles). The crystal morphology of gypsum hemihydrate appeared in the form of large blocks.
This lamellar-shaped crystal structure, with a smooth and irregular surface, found in this study was also identified by other authors [14,16,27,28,29].

3.2. Tests Results in the Fresh State

The mortars were made in a ratio of 1:6 (cement:sand) according to the procedures of [7], with the addition of 0, 3, 6 and 10% of byproduct gypsum in relation to the cement.
  • Consistency index
The amount of water required for each trace under study was determined by the consistency test, the results of which are described in Table 4. All traces corresponded to the limit of 260 ± 5 mm, established by [8].
The W/C ratio was constant for the reference mixes and the mixes with additions of 3, 6 and 10% of byproduct gypsum, in relation to the type of CPII-E cement. This constancy is justified by the low levels of byproduct gypsum added to the respective traces. As the byproduct gypsum was added, the water/dry materials ratio decreased, as it was possible to maintain the spreading limit suggested by the standard, adding the same amount of water as the reference mix.
The water/dry materials ratio was different in the different mixtures, since the amount of water remained, but the amount of byproduct gypsum in each mixture increased, that is, the amount of dry materials in each mixture increased; however, it did not change the amount of water.
  • Fresh mass density and incorporated air content
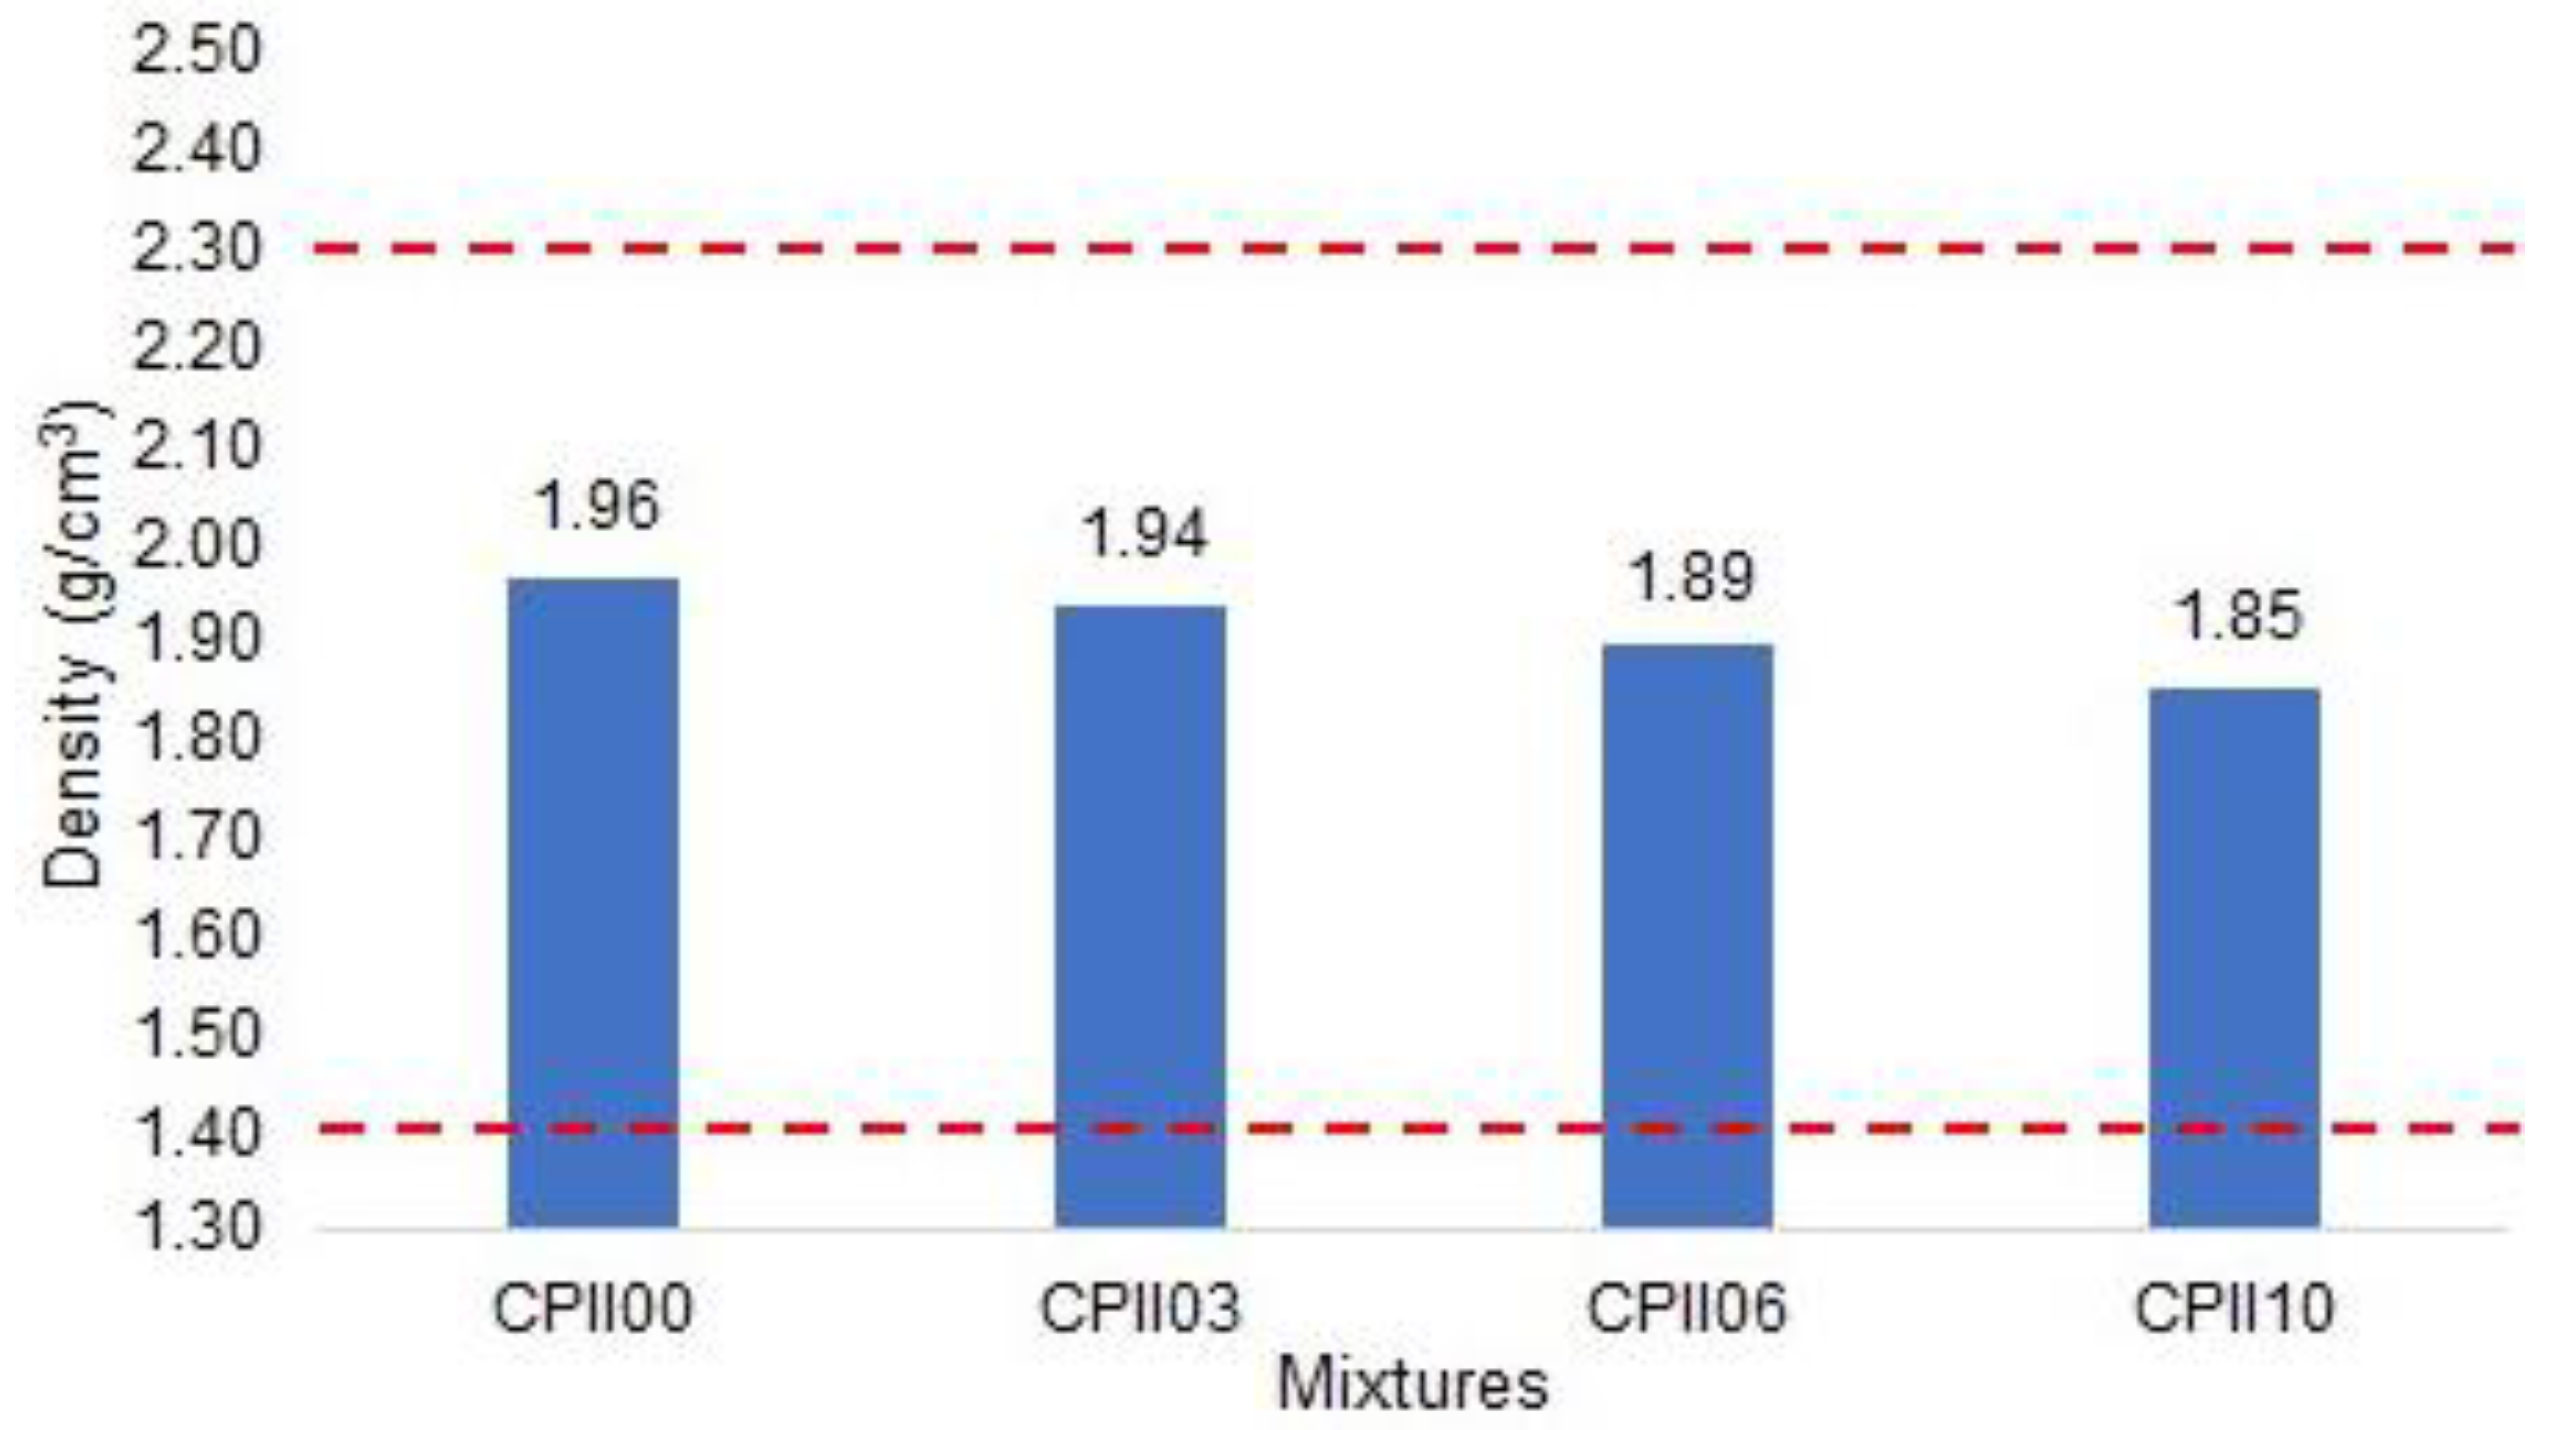
Figure 6 shows the results obtained in the fresh density test.
According to the results obtained, it is notable that the addition of byproduct gypsum caused a decrease in mass density in mortars with Portland CPII cement. This behavior is justified by the hydration process of the byproduct gypsum, responsible for consuming part of the water present in the mortar, causing a drop in density, although the specific mass of the water is lower than that of the byproduct gypsum.
The results of the incorporated air content, presented in Figure 7, corroborate the aforementioned justifications, as an increase in the incorporated air content is observed for the mixes with gypsum additions. The trace with the highest incorporated air content is CPII10 with 12.1%.
The incorporated air content of mortars with byproduct gypsum additions was higher than the reference mortar and increased with increasing gypsum additions. It is worth highlighting that although the granulometry of the byproduct gypsum is in the form of fine particles (2.36 µm in D10), this factor interferes with the air incorporation process, so that the finer the particles, the more water will be required to achieve the consistency of the mixture. In this way, the addition of fine particles would result in more free water for air incorporation and would reduce the incorporated air content [30]. However, the result obtained was contrary, as the added byproduct gypsum content is relatively low, it becomes insufficient to fill the existing voids and consequently reduce the incorporated air content.
The increase in incorporated air content with the addition of the byproduct gypsum can be explained by the better workability when gypsum is added, as shown in Table 4.
The high content of incorporated air interferes with compression resistance and can cause excessive porosity in mortars, thus allowing increased permeability and infiltration, contributing to pathologies in the coatings [31].
In [32], a limit for the air content incorporated in mortars is established in the range of 8 to 18%. Therefore, despite the increase in the air content incorporated in mortars with gypsum additions, it does not make their use unfeasible, since the values obtained are within pre-established limits.
  • Rheological characterization: squeeze flow method
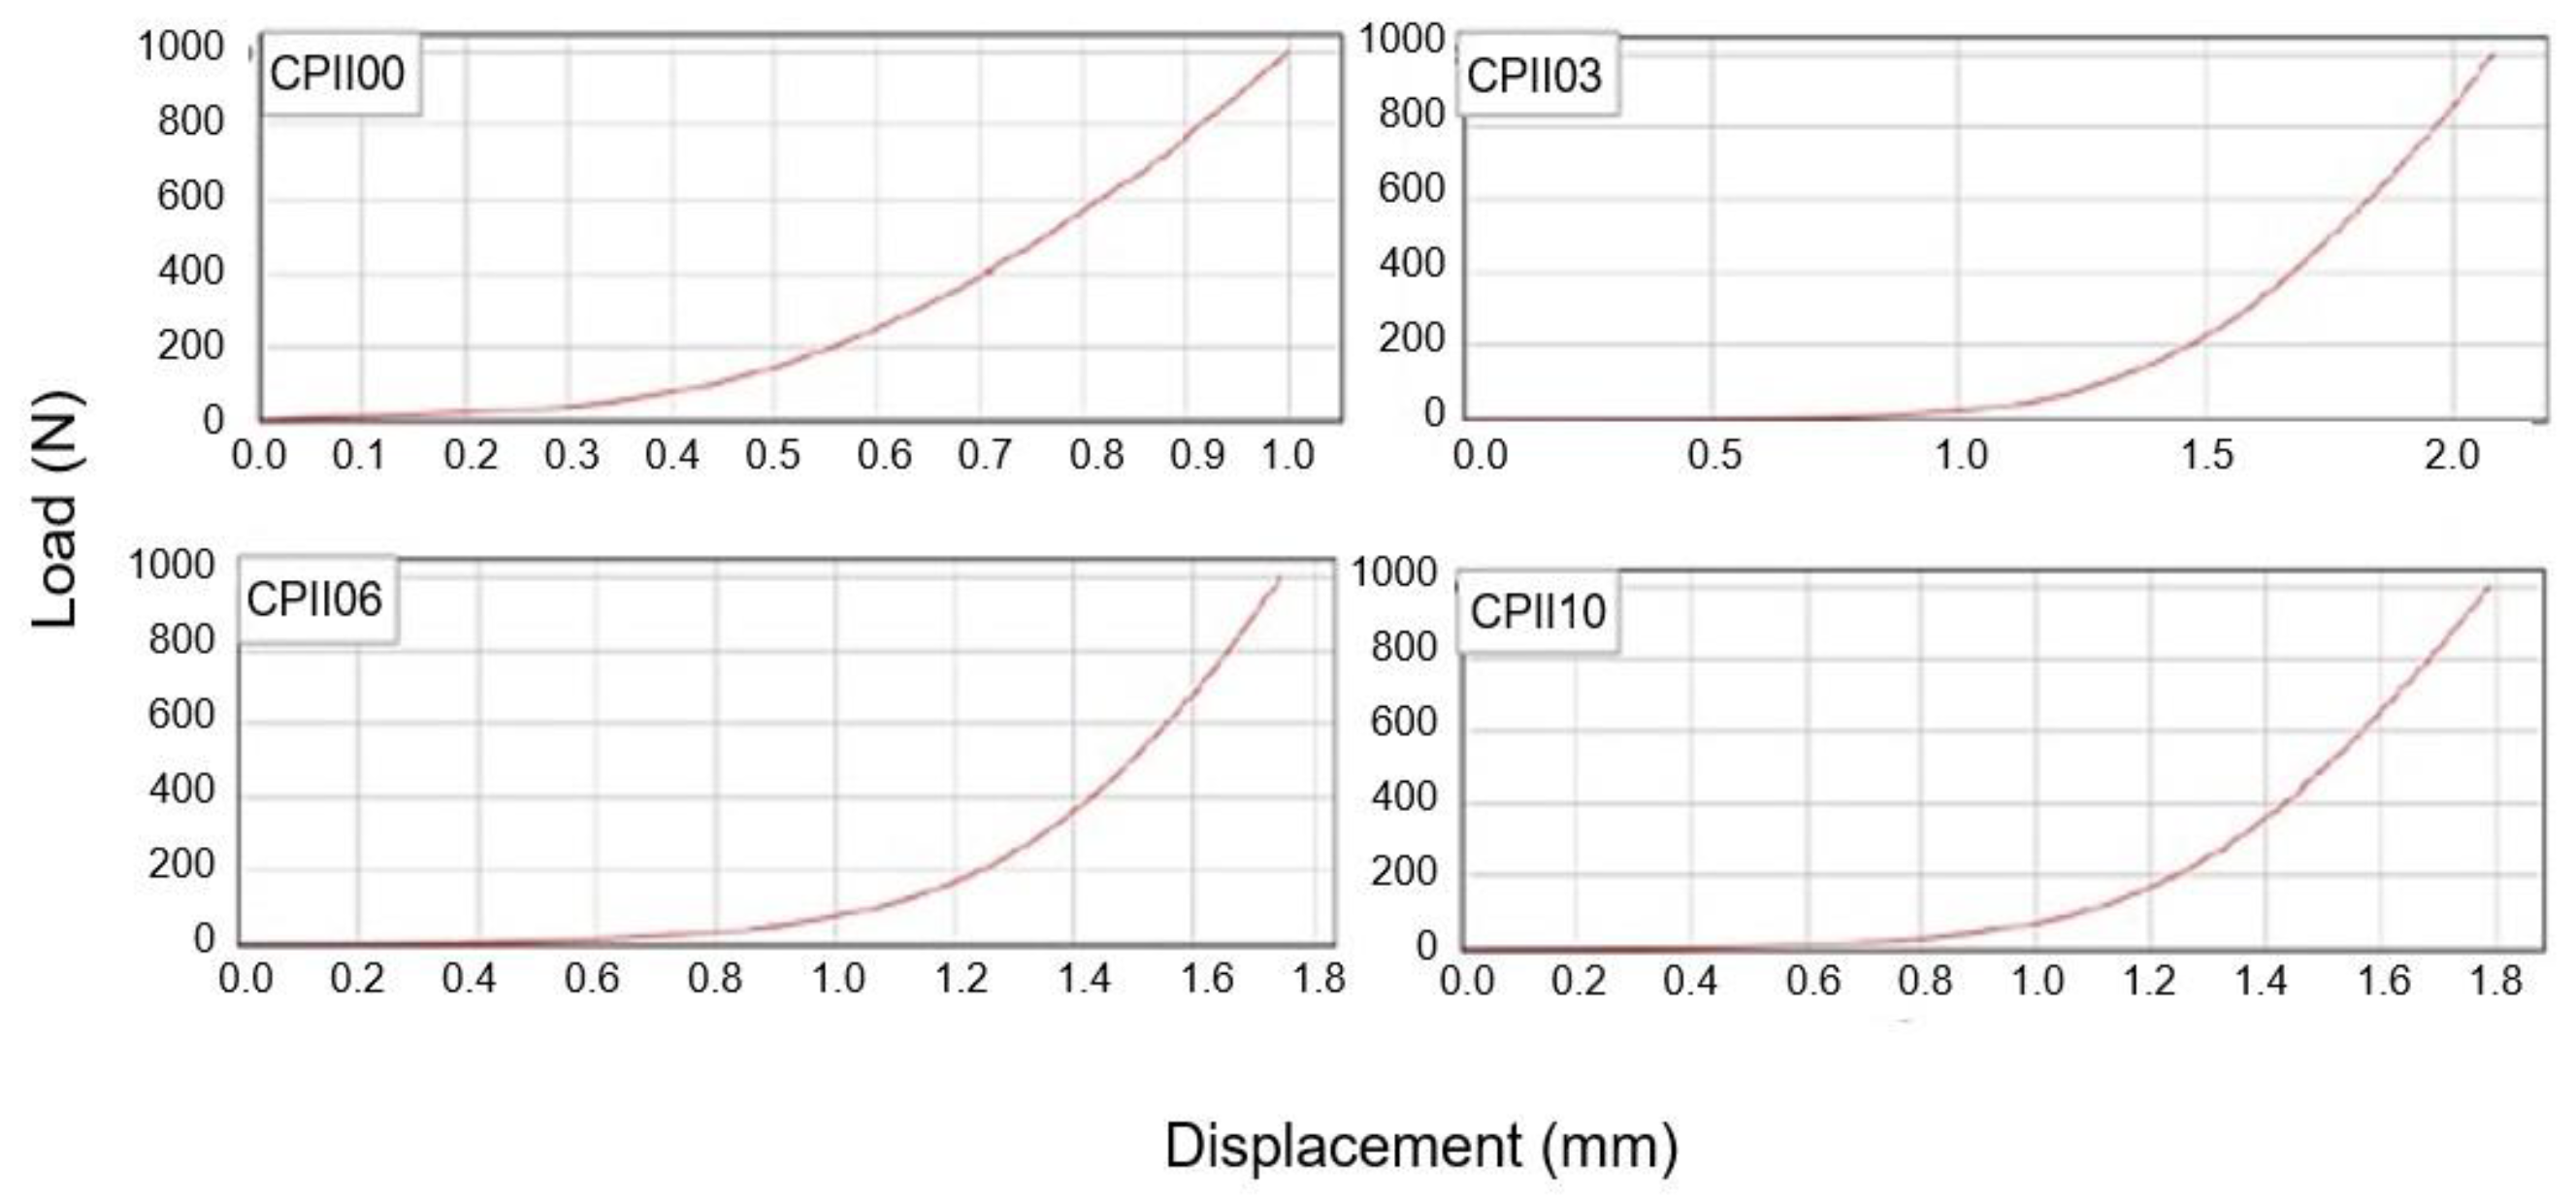
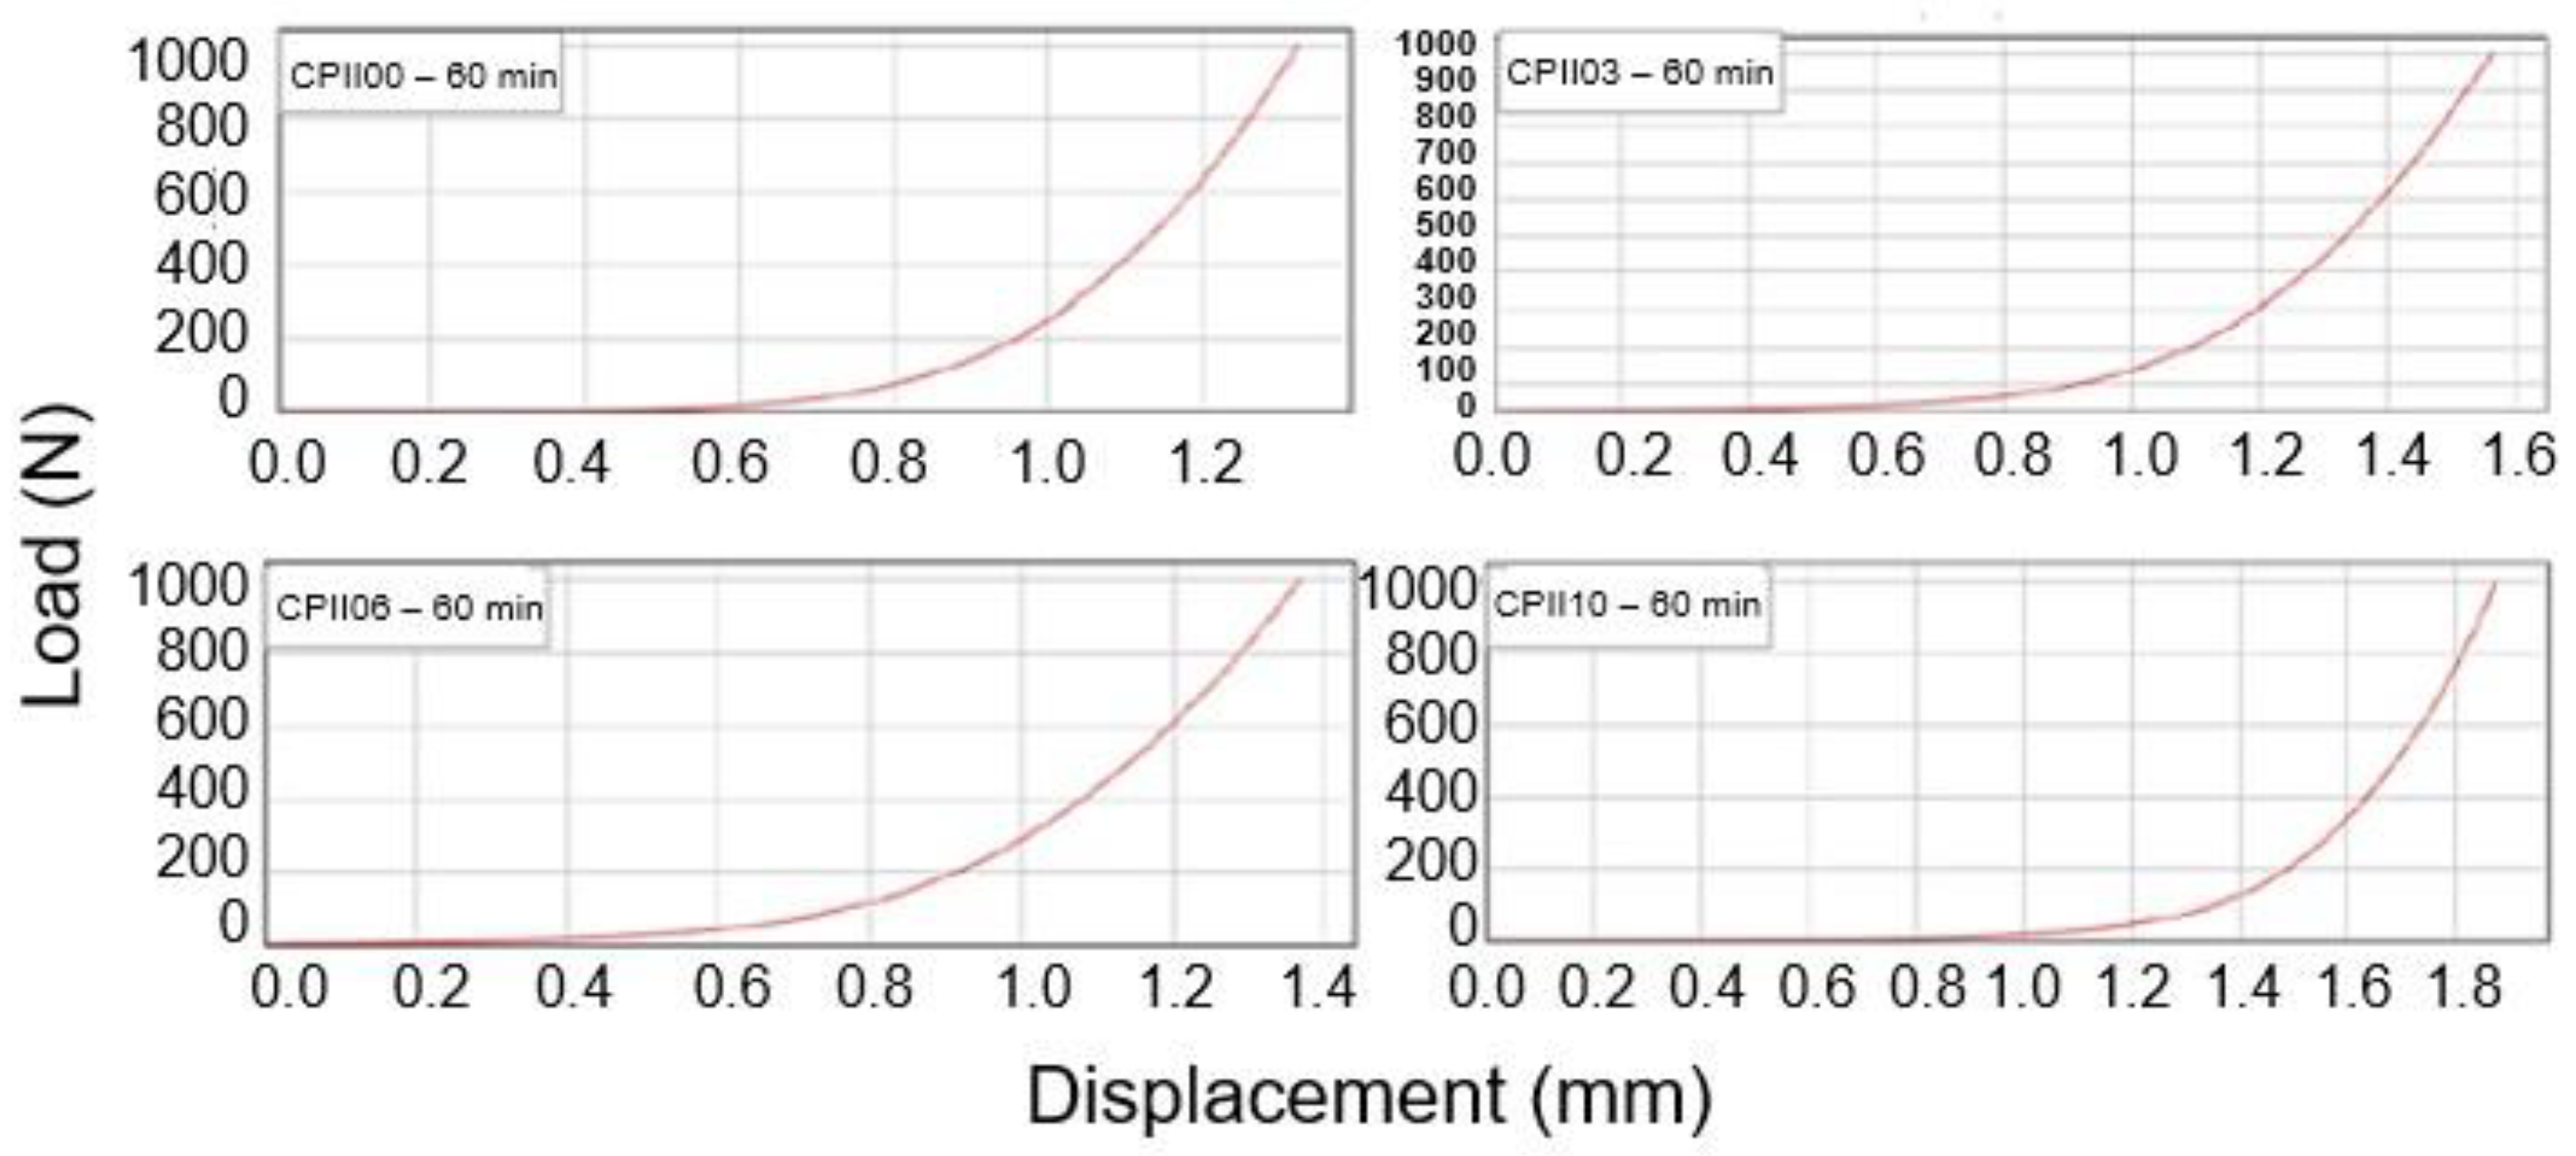
The squeeze flow test was carried out according to the guidelines of [33]. The test was carried out in three different periods in relation to the preparation of the mortar: freshly prepared, after 15 min and after 60 min. The speed at which the test was performed was 0.1 mm/s.
Figure 8 shows the load × displacement curve for material compression speeds of 0.1 mm/s, for newly prepared mortars, whose maximum loads were 1000 N.
When analyzing the behavior of the curves, it is noticeable that the traces with additions of byproduct gypsum obtained greater displacement. In the curve referring to the samples without byproduct additions, 1000 N were needed to cause a displacement of 1 mm, while the others were less than 200 N. Therefore, the samples with additions were more deformable when compared to the references.
Figure 9 shows the load × displacement curve for material compression speeds of 0.1 mm/s, for mortars after 15 min, whose maximum loads were 1000 N.
In the mortar traces tested after 15 min, the behavior of the curves was similar; the displacement variation was minimal, except for the CPII10-15 min sample, which showed greater displacement, indicating greater workability after 15 min of preparation.
The sample with the upper gypsum trace, CPII10 for a time of 15 min, showed good workability, indicating a delay in setting time caused by the addition of byproduct gypsum. This behavior is similar to that observed in the consistency index, since mortars with higher gypsum contents showed greater spread, indicating better workability of the mortar.
Comparing the freshly prepared samples with those tested after 15 min, a greater displacement is noted for the CPII00 and CPII10 samples.
The curvature related to the CPII03 mortar in a time of 15 min was irregular; compared to the others, this behavior indicates that the material tested presented problems of internal friction (shear) causing differences in the component particles such as the presence of sand and particles of plaster, causing these particles to slide over each other [34].
Figure 10 shows the load × displacement curve for material compression speeds of 0.1 mm/s, for mortars after 60 min, whose maximum loads were 1000 N.
After 60 min of preparation, the samples showed curvature with similar behavior for mortars with CPII-E. There was a greater displacement for samples CPII00 and CPII10; however, the variation was not significant. Mortars with gypsum additions showed lower flow in 60 min; this reduction occurs due to the gypsum hydration process using part of the water contained in the mortar, reducing its workability.
In general, the curves showed typical behavior, where region I is small and can be disregarded, in all traces, compared to region II. Region III is characterized by a significant increase in load, favoring the continuity of displacement, observed in all traces studied.
  • Isothermal calorimetry
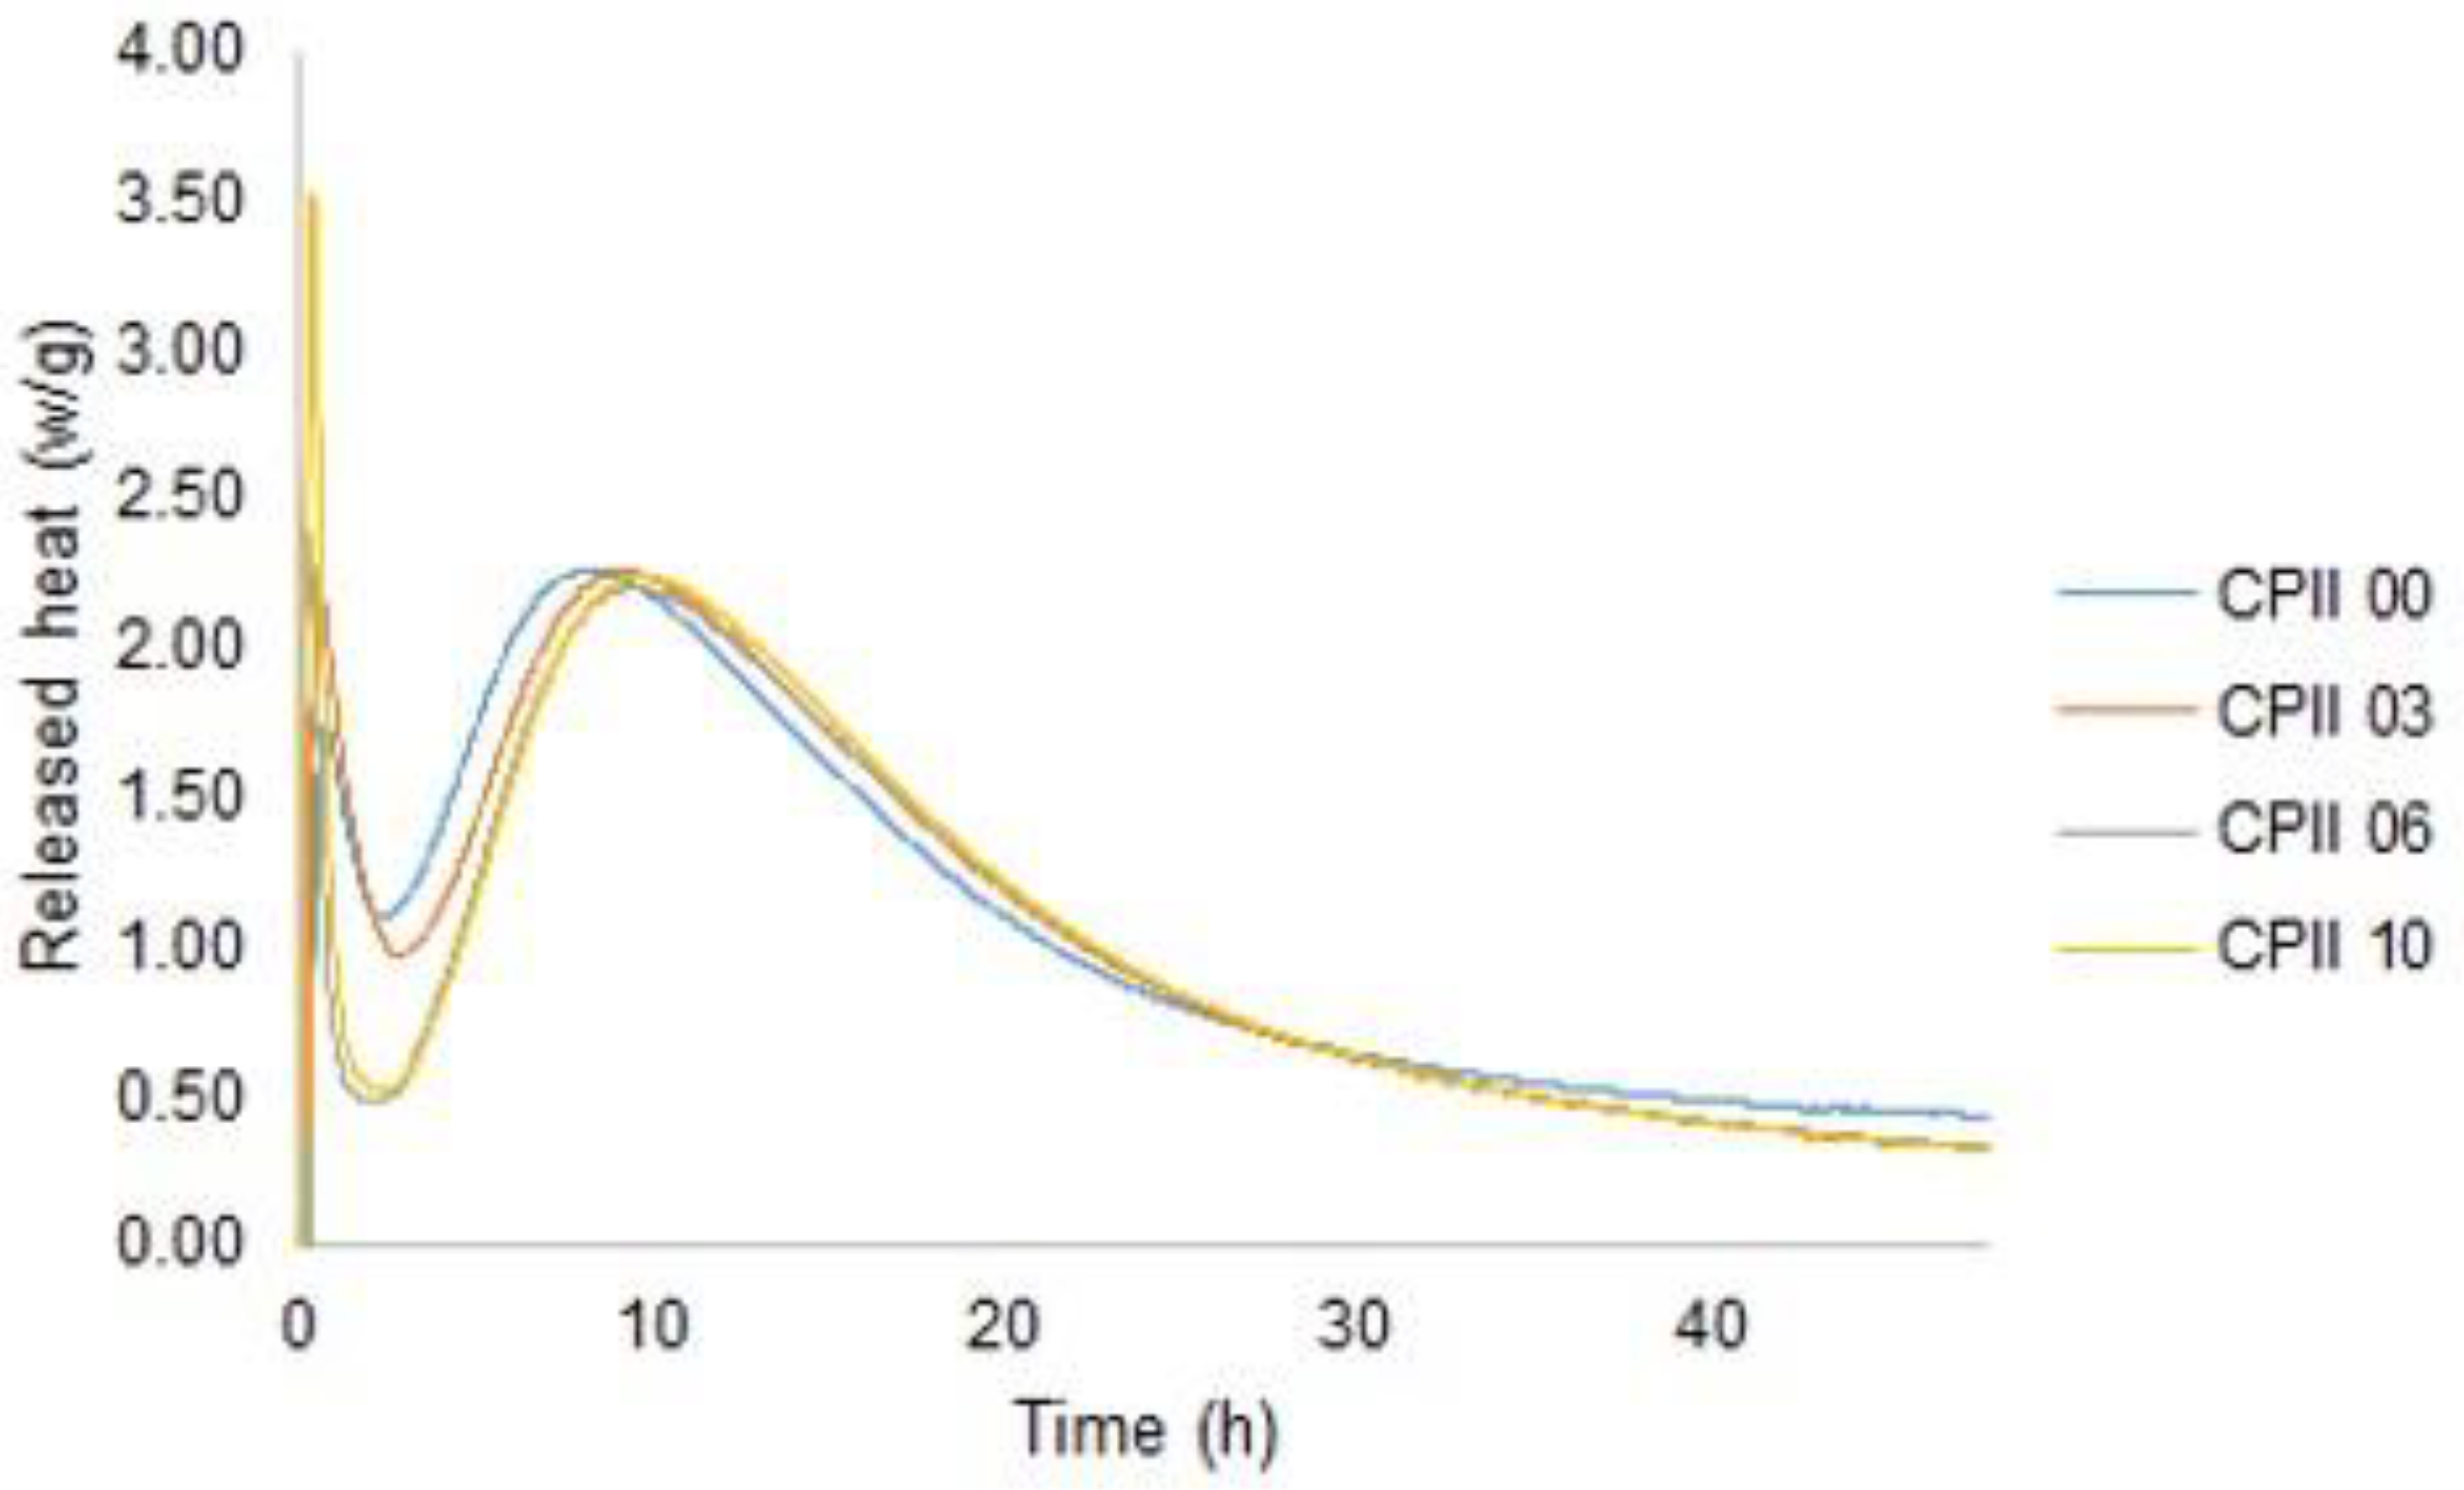
The samples were subjected to the calorimetry test, following the guidelines of [35]. The released and accumulated heat flux curves were plotted as a function of time during 48 h of monitoring. Figure 11, Figure 12 and Figure 13 show the results obtained for the CPII-E samples.
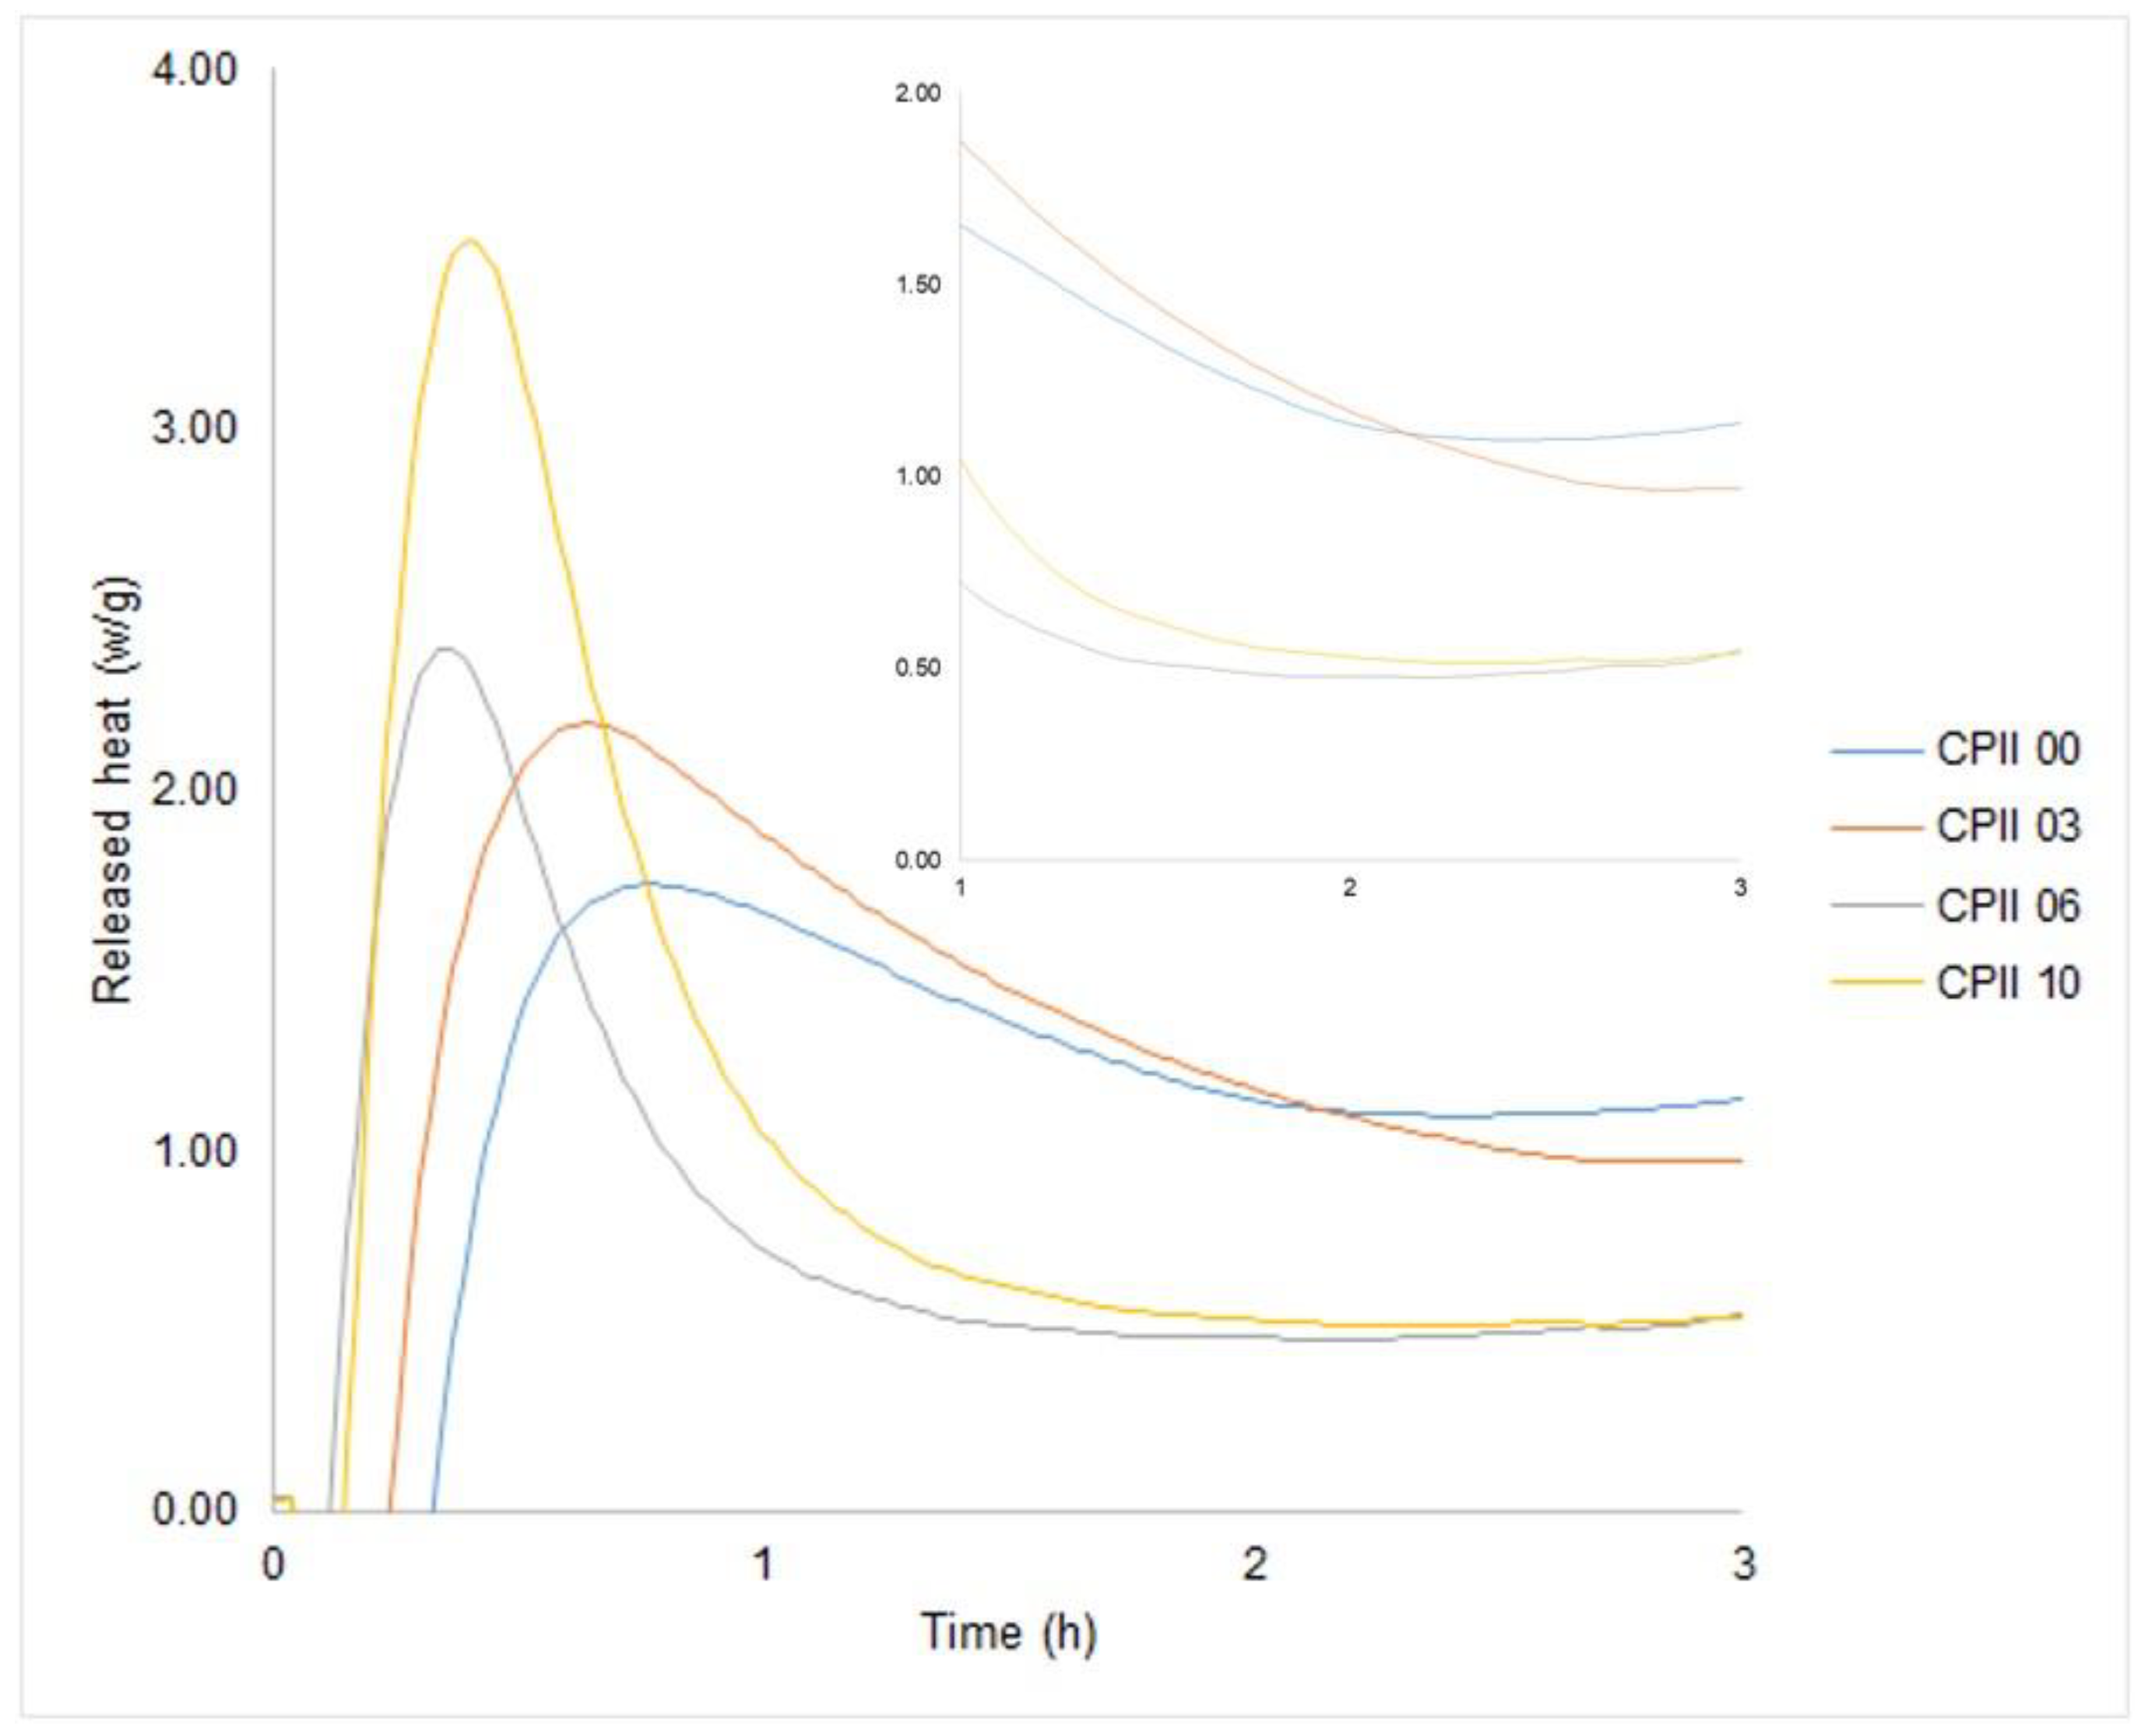
In the curves shown in Figure 11 and Figure 12, it is possible to observe that in stage I the mixes with additions of byproduct gypsum, CPII03, CPII06 and CPII10, released 2.2 w/g, 2.4 w/g and 3.5 w/g, respectively: higher heat release than the reference trace Figure 11. This occurs because there is an increase in CaSO4 as the byproduct is added. In the dormancy period (stage II), the values of heat released are similar for CPII00 and CPII03, as well as CPII06 and CPII10. Furthermore, in the enlarged version of Figure 12 it appears that the addition of gypsum increased the induction period; the same happened in the research by [36] who analyzed mixtures of C3S (alite) and gypsum. In stage III, all traces presented values close to heat release in the second exothermic peak. However, this peak occurred at different times, in CPII00 it was in 8 h, CPII03 in 9 h and both CPII06 and CPII10 in 10 h; that is, the greater the amount of byproduct gypsum present, the longer it took for the second peak to occur, but this did not affect the amount of heat release. In the next stages, the mortars enter the hydration stage, whose reactivity is low, but there is a gain in resistance [37].
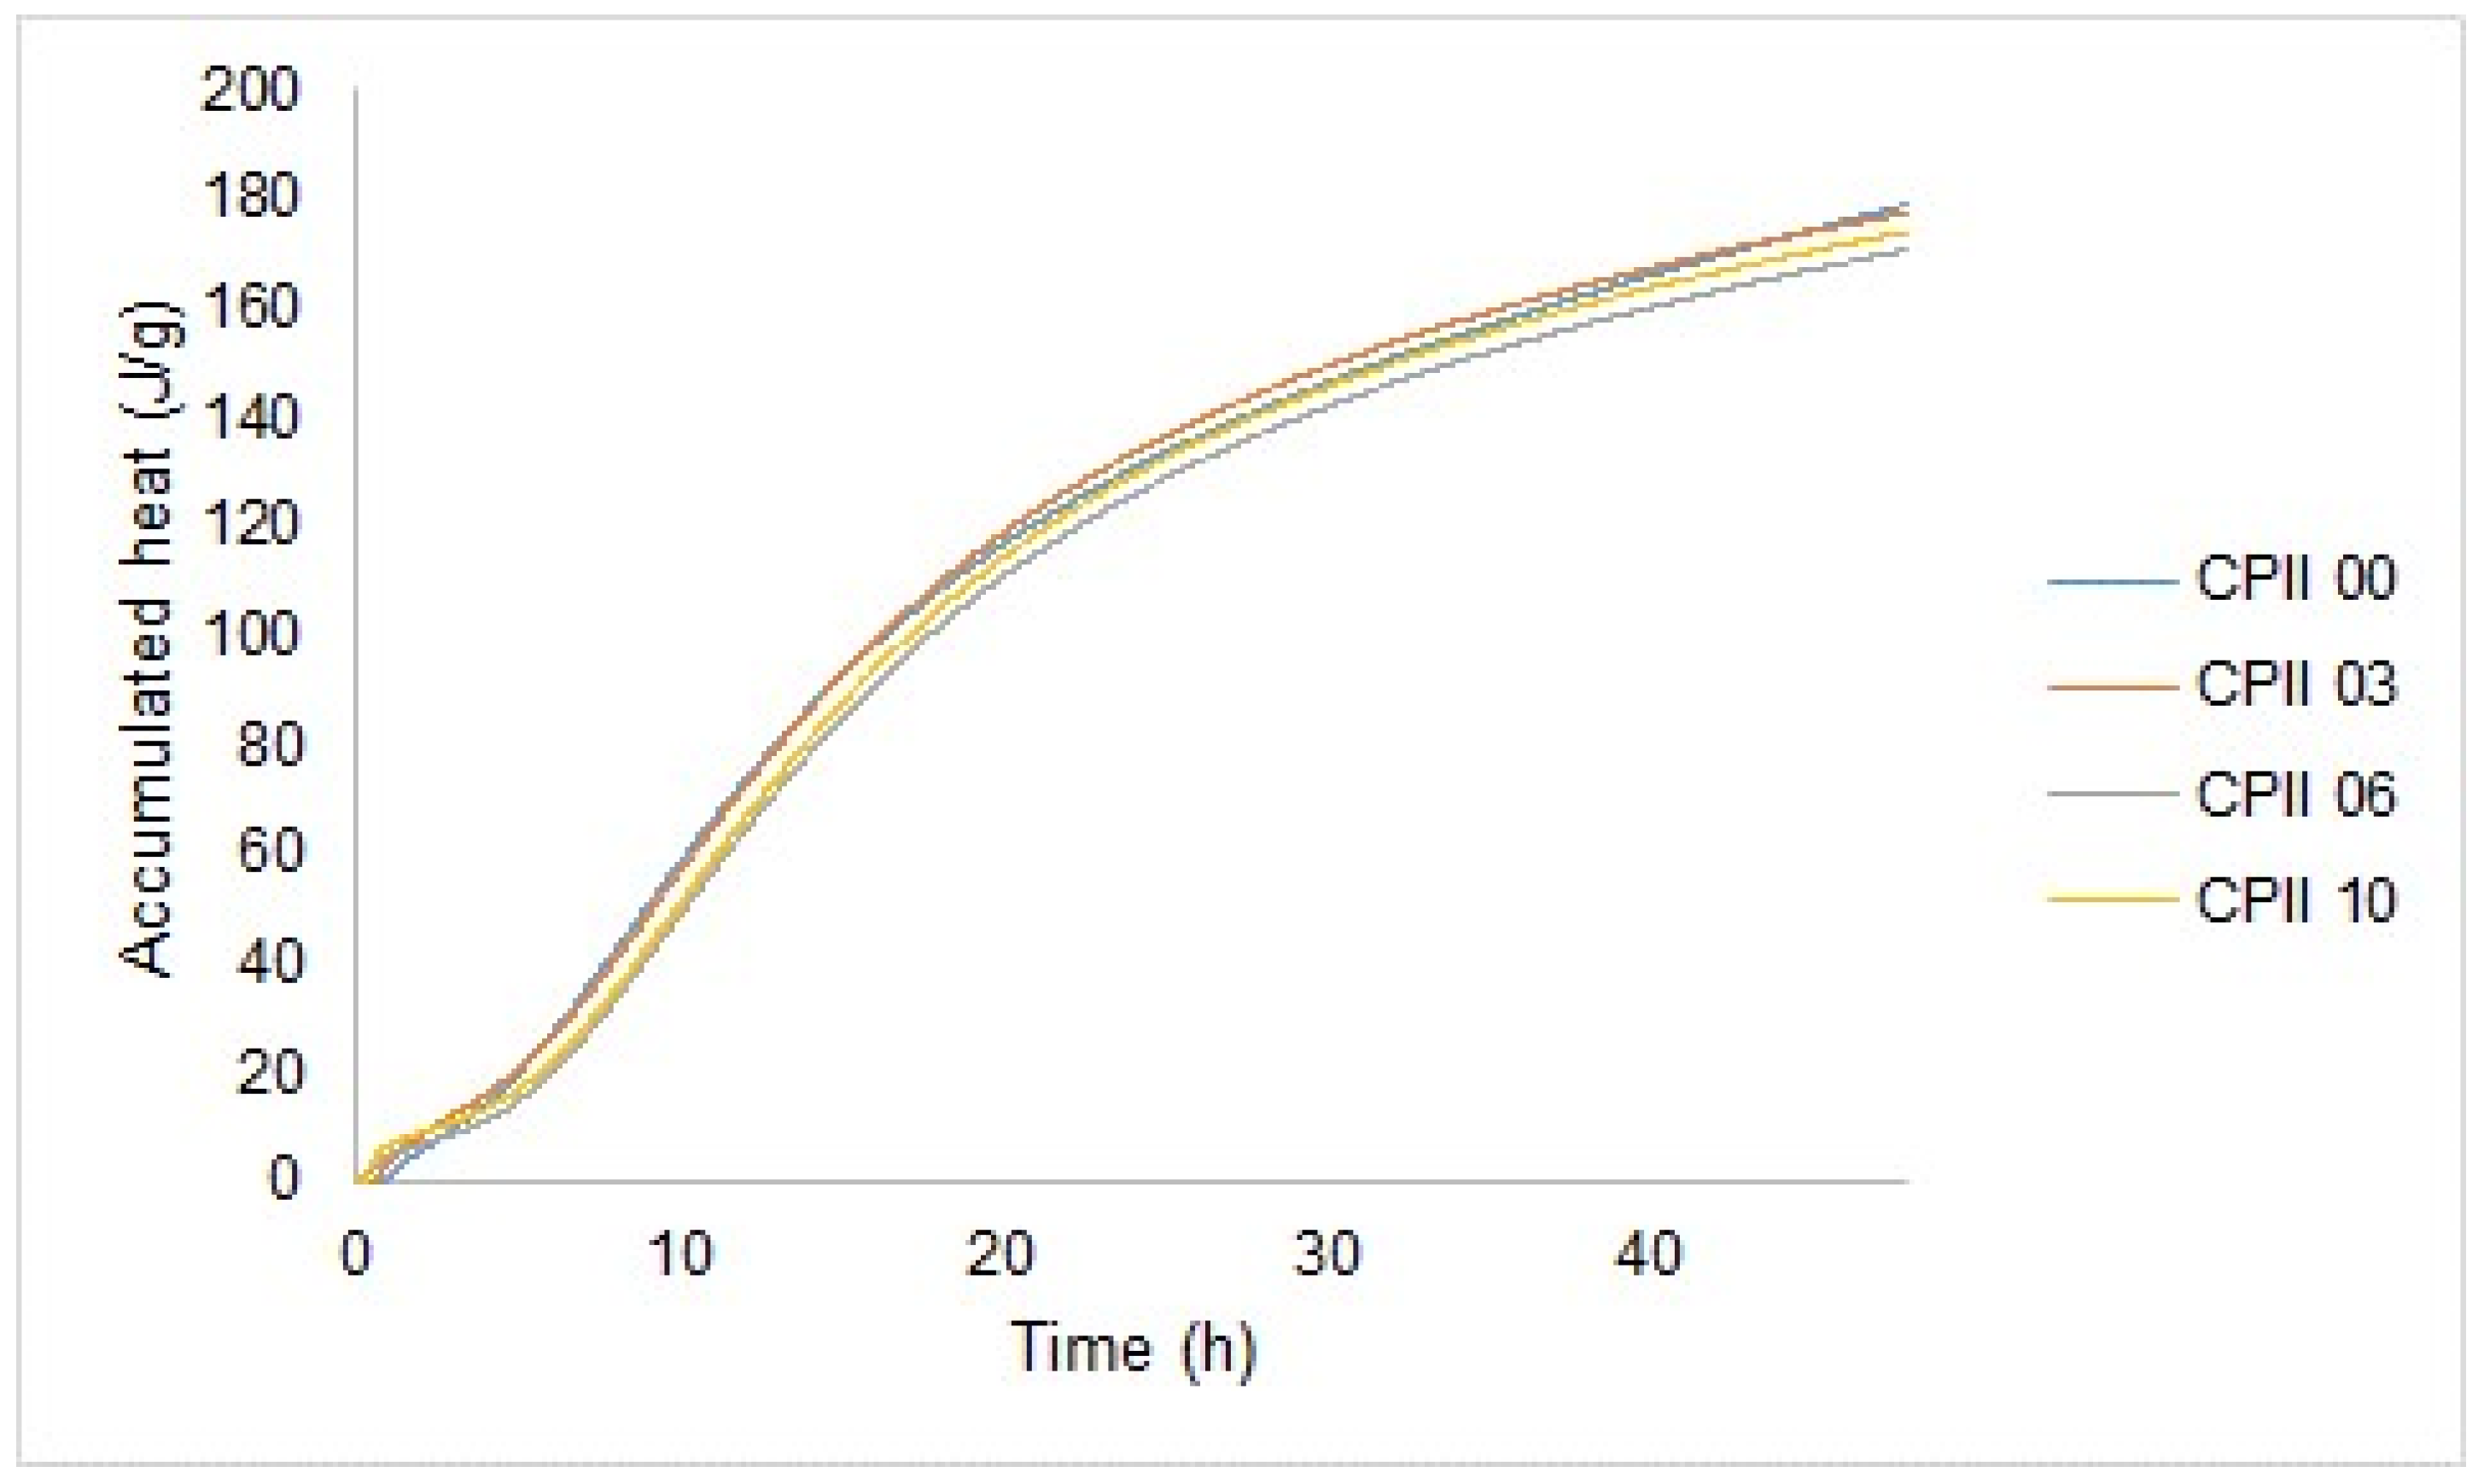
The accumulated heat curves, presented in Figure 13, indicate that the studied traces obtained the same behavior, with little variation in the values achieved. In the initial hours, it is observed that the samples with a greater amount of byproduct gypsum have greater accumulated heat; this is due to the fact that both the cement and the byproduct are hydrating, since the byproduct gypsum only has a crystalline phase (CaSO4·0.5H2O) found in DRx Figure 3. After this period, the CPII00 and CPII03 mixes showed greater accumulated heat, around 180 J/g and 177 J/g, respectively, while the mixtures with a greater amount of byproduct had a small drop in accumulated heat, approximately 170 J/g. This shows that the amount of byproduct gypsum may be causing a reduction in heat release.

3.3. Test Results in the Hardened State

For the following tests, prismatic test bodies with dimensions 4 × 4 × 16 cm were molded, in accordance with the procedures of [7], using the mixing proportion shown in Table 4. After 48 h, specimens were demolded and subsequently cured until 28 days of age at an ambient temperature of 21 °C and relative humidity of 78%.
  • Flexural mechanical strength
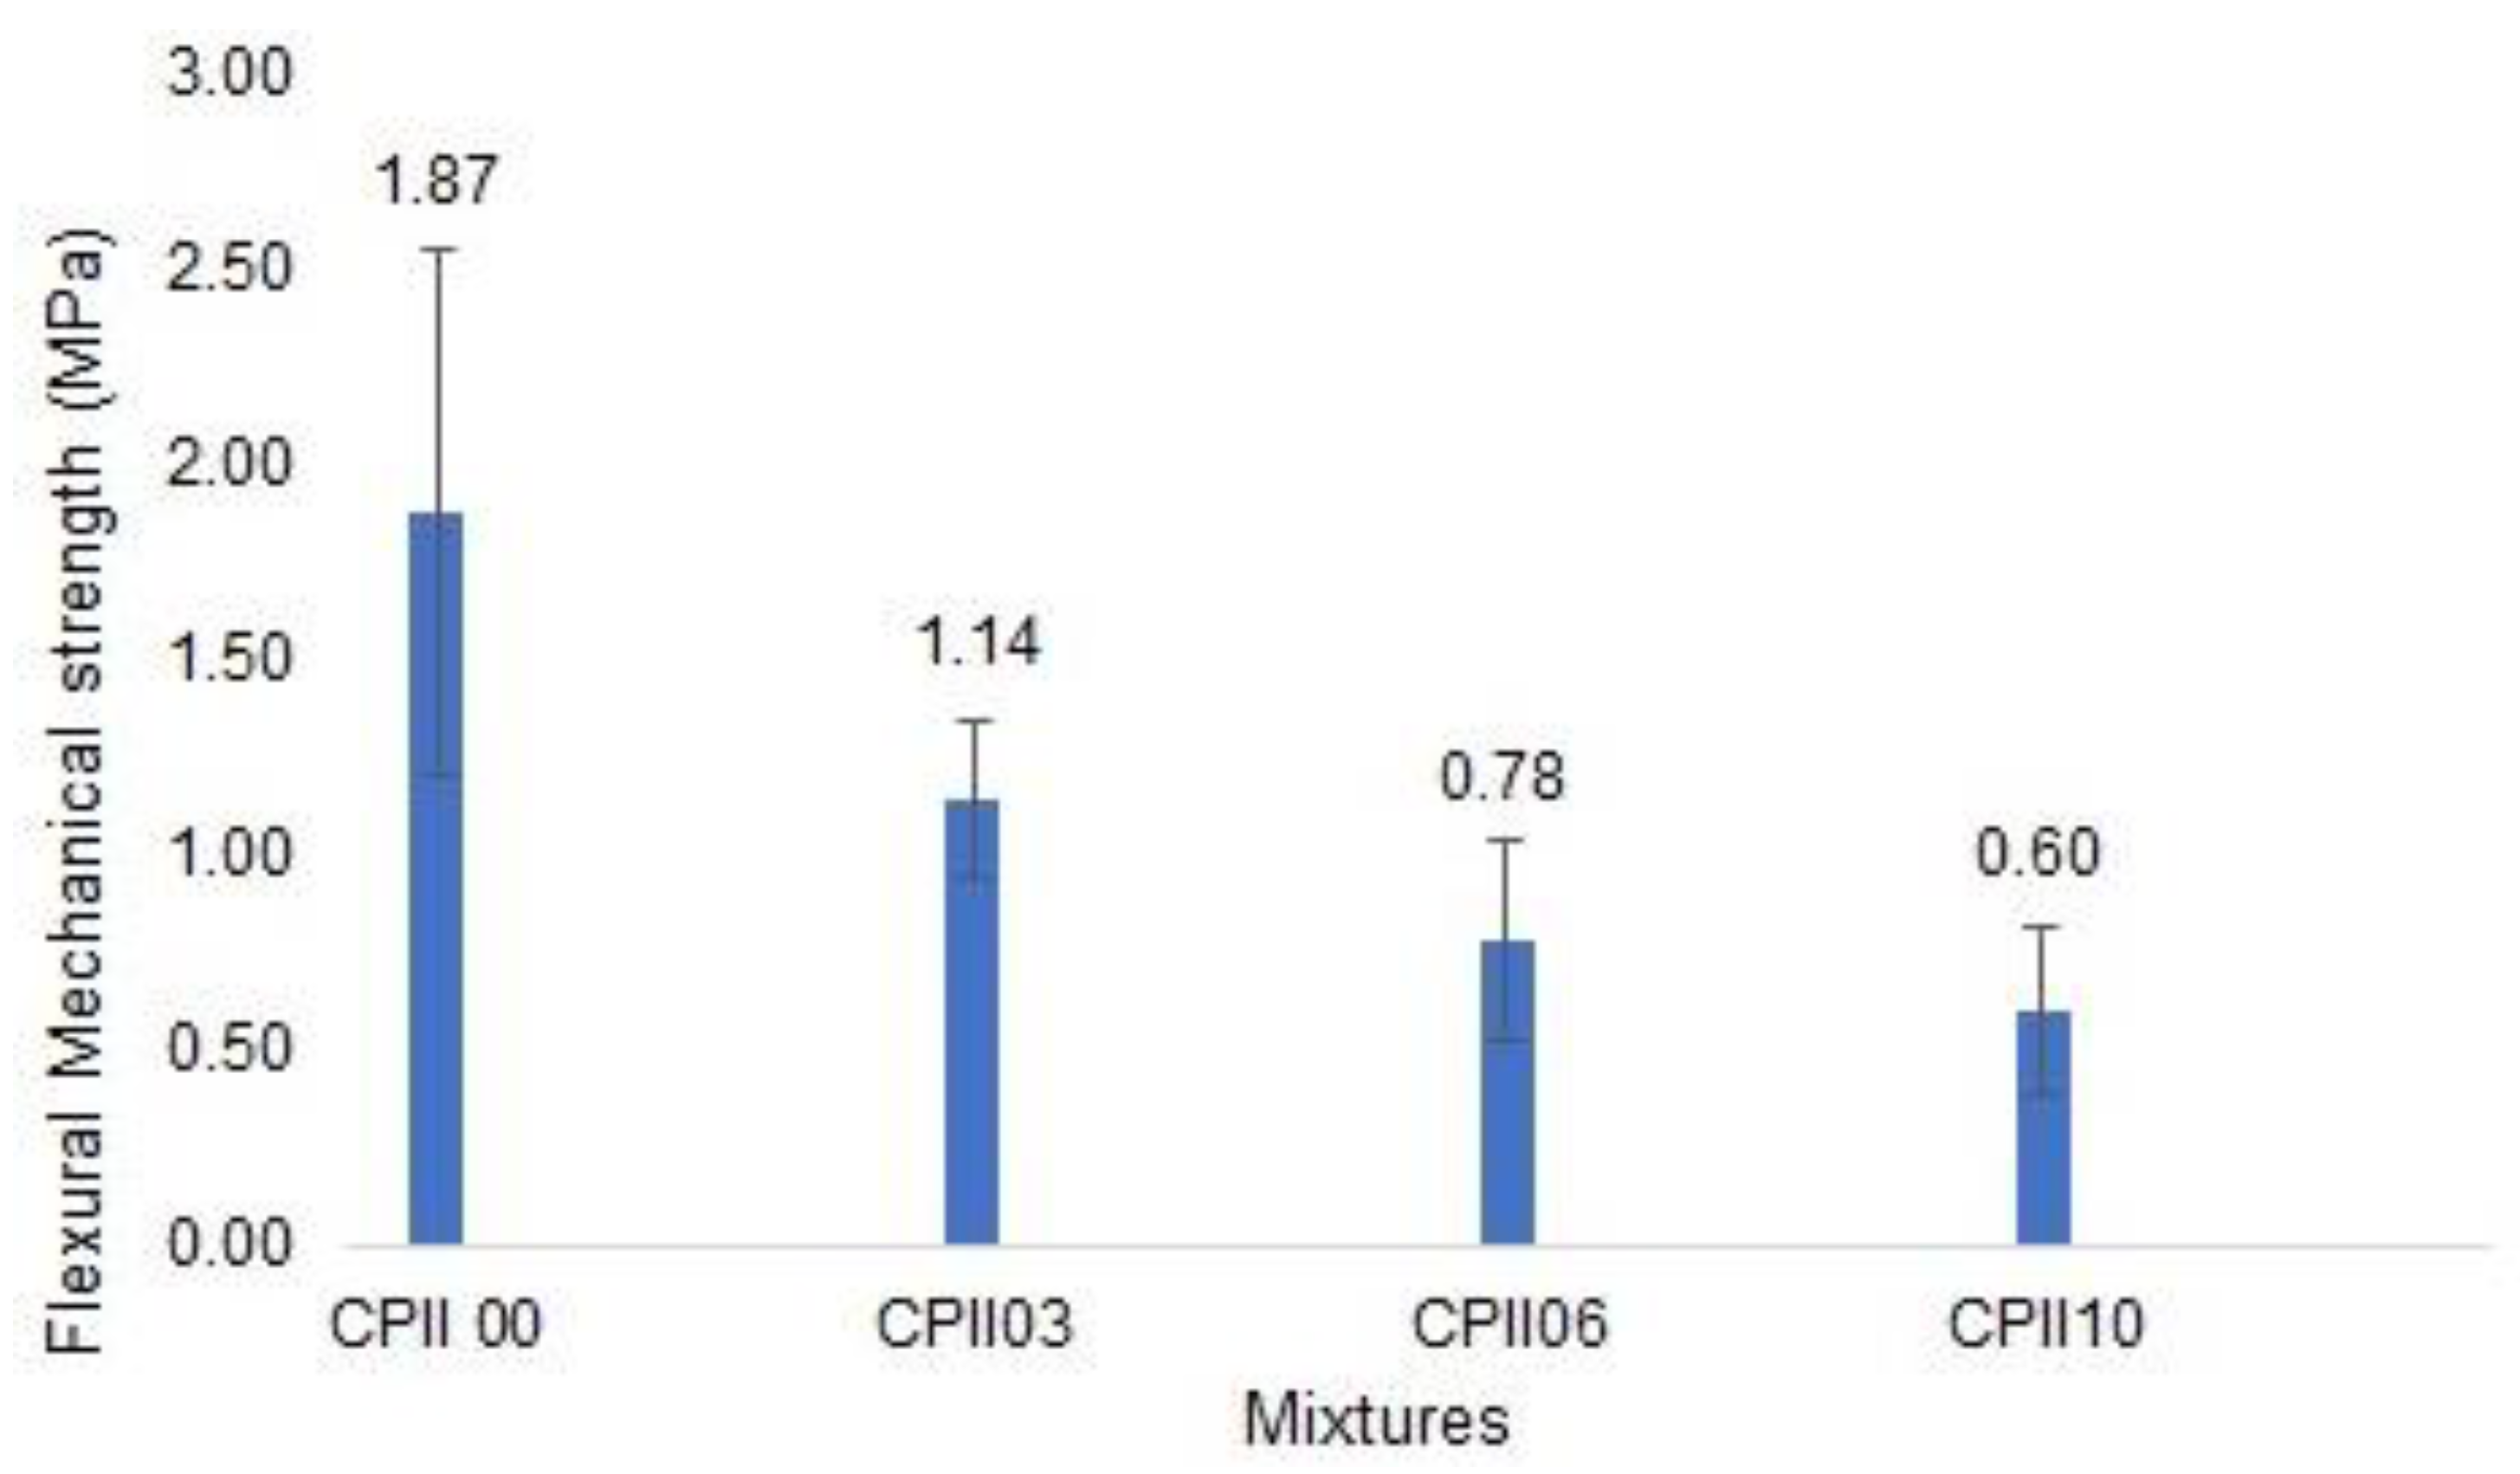
The tensile strength test was carried out after 28 days, in accordance with [11], shown in Figure 14.
The mix that presented the greatest resistance was CPII00 with 1.87 MPa. Therefore, all mixes with byproduct gypsum additions showed a reduction in their tensile strength; the greater the addition of byproduct gypsum, the lower the mechanical resistance. This behavior can be justified by the greater porosity caused by the addition of byproduct gypsum, observed mainly in samples with higher gypsum additions (10%) [16]. Furthermore, as previously shown, mortars with the addition of gypsum had a high content of incorporated air, which may contribute to a reduction in resistance.
  • Compressive mechanical strength
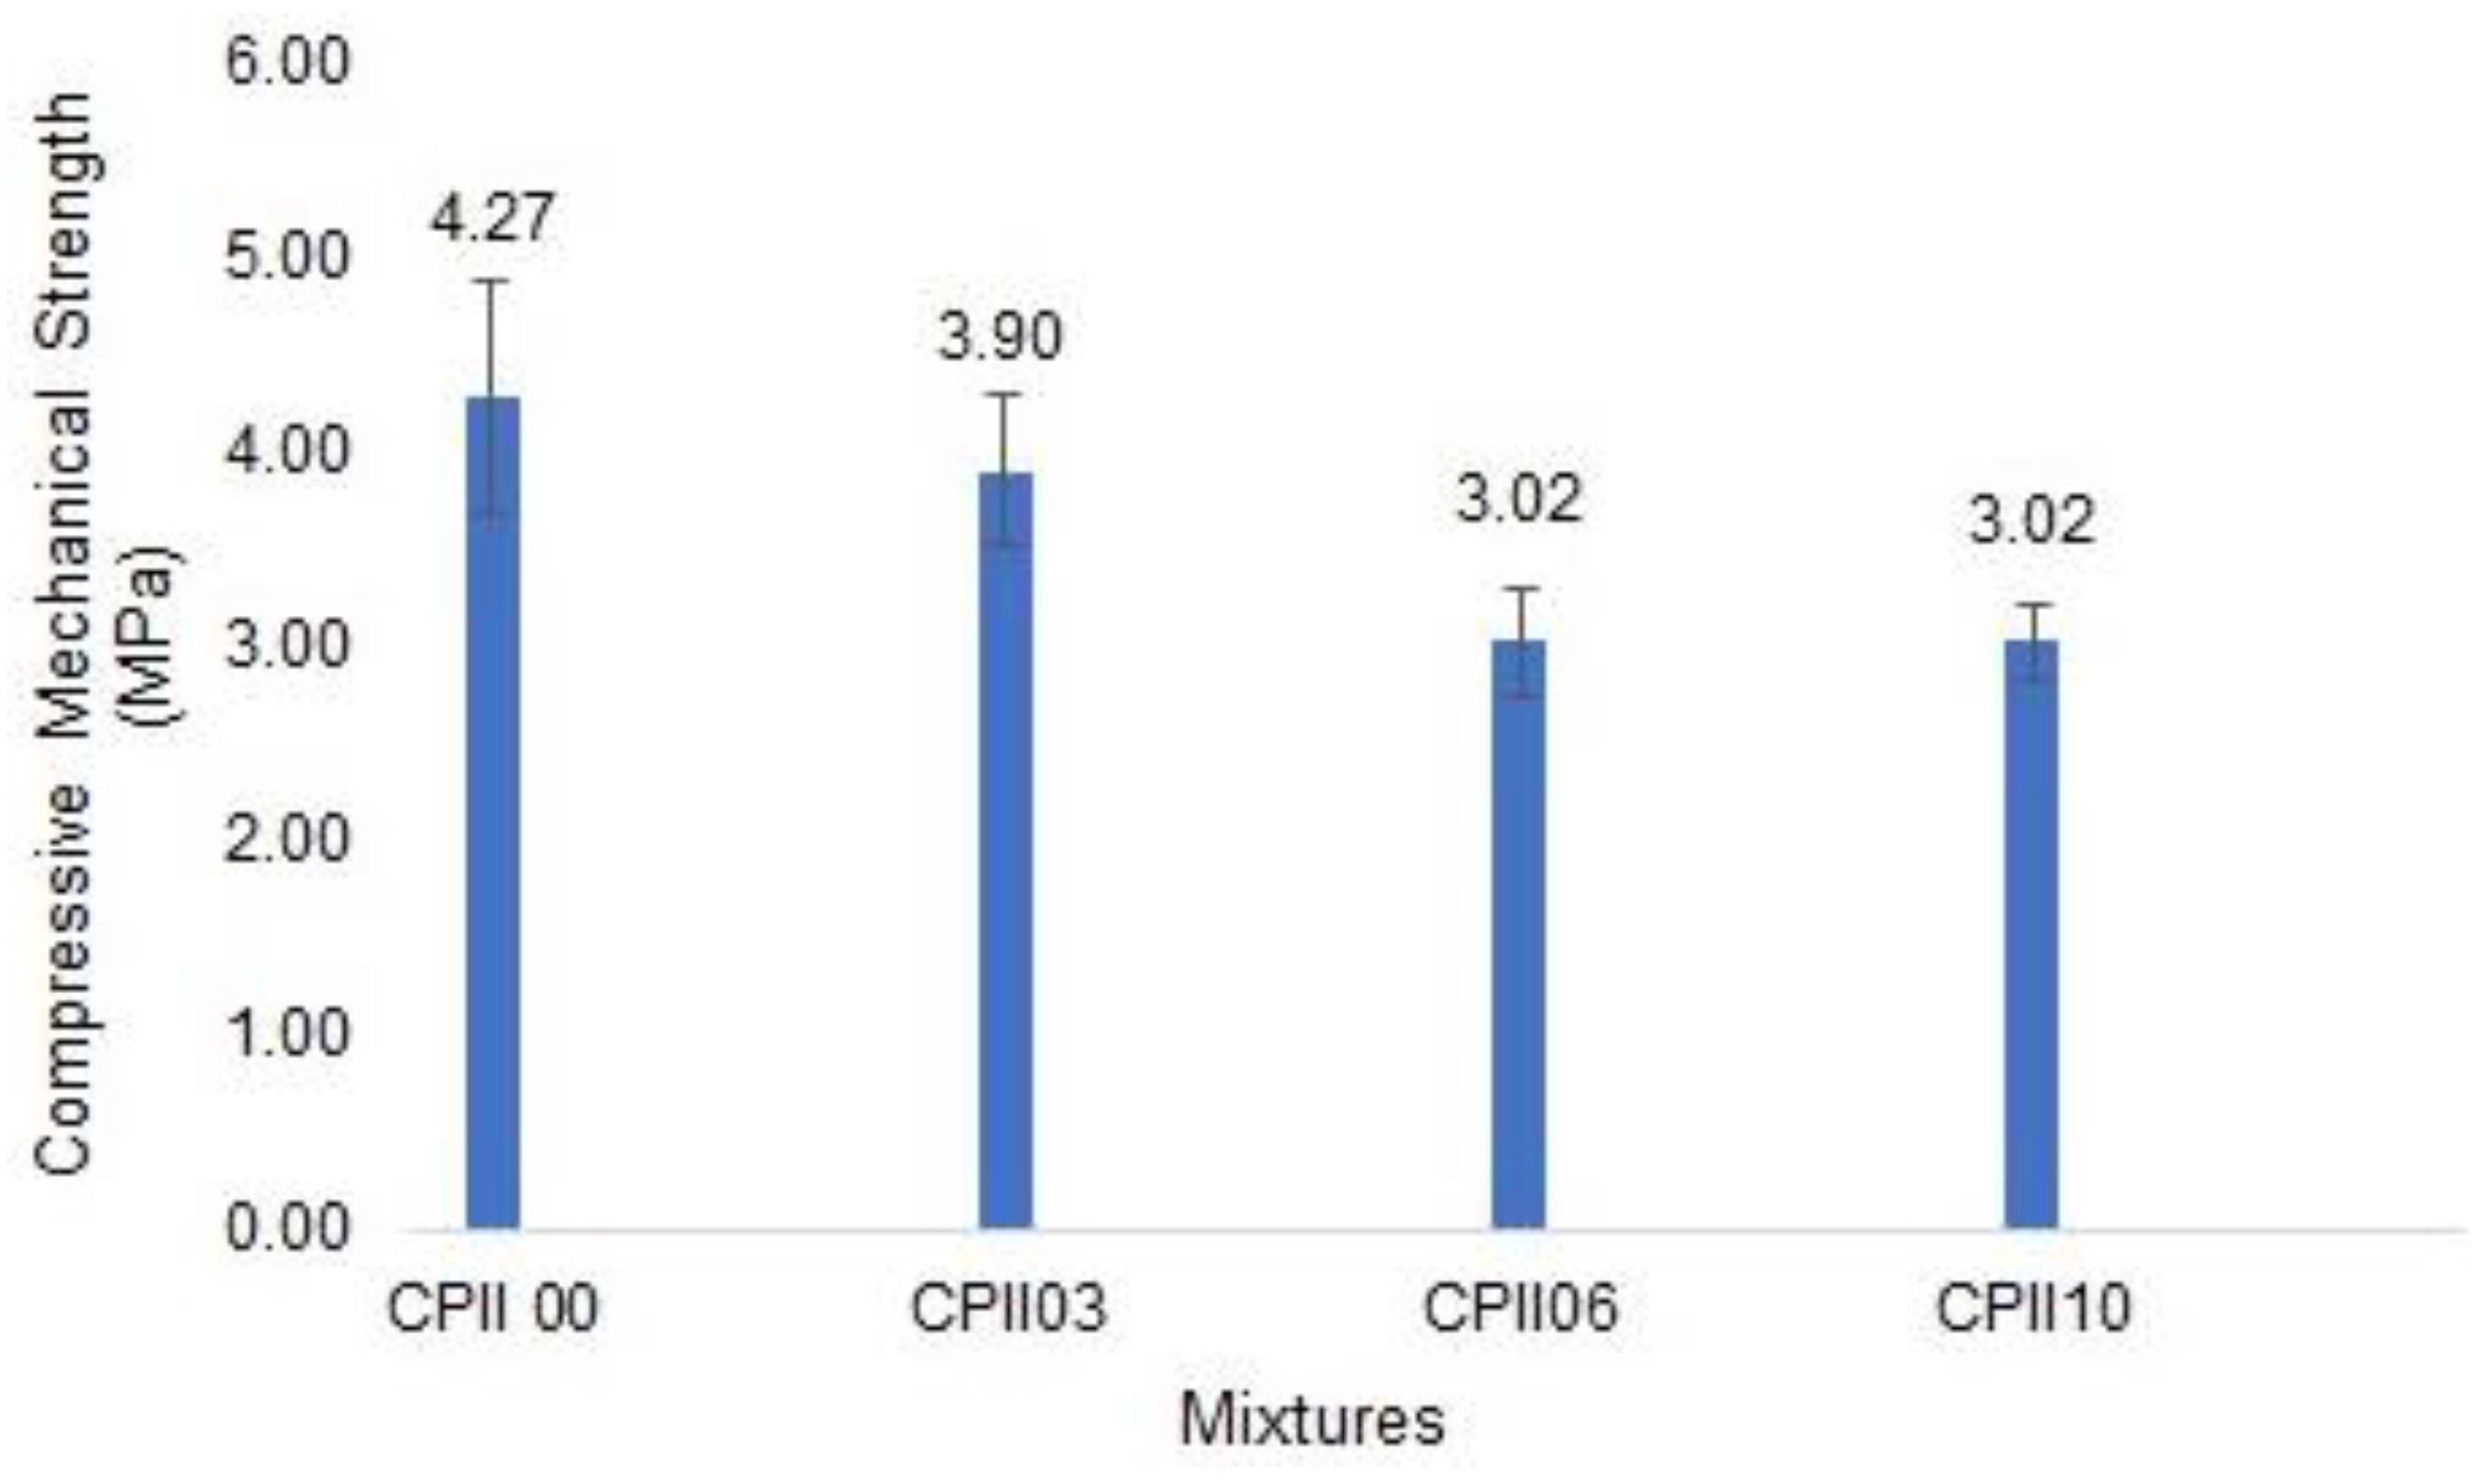
The compressive strength test was carried out on the samples after 28 days, in accordance with [11]. The results are presented in Figure 15.
Among the mixes with gypsum additions, the highest value obtained for compressive strength was the CPII03 mix with 3.90 MPa. The lowest value obtained was for the mix with the highest addition of byproduct gypsum, CPII10 with 3.02 MPa. According to the results obtained for the flexural tensile strength test, the addition of byproduct gypsum also caused a reduction in mechanical strength.
The drop in compressive strength of mortars with gypsum additions is notable compared to reference mortars, for mortars prepared with Portland CPII cement. This behavior results from the overlapping and little intertwining of the gypsum crystals, verified in the SEM (Figure 5), which causes low adhesion between them and consequently promotes a decrease in the mechanical properties of the material. The reduction in compressive strength is also observed for mortars with higher levels of gypsum addition, being 3.90 MPa for CPII03 and 3.02 for CPII06 and CPII10.
Other authors analyzed the effect of aggregates with high gypsum content in Portland cement mortars and also found that the compressive strength of conventional mortar was lower with higher gypsum contents in natural sand at all ages due to the internal sulfate attack induced by the composition [38].
  • Capillary absorption
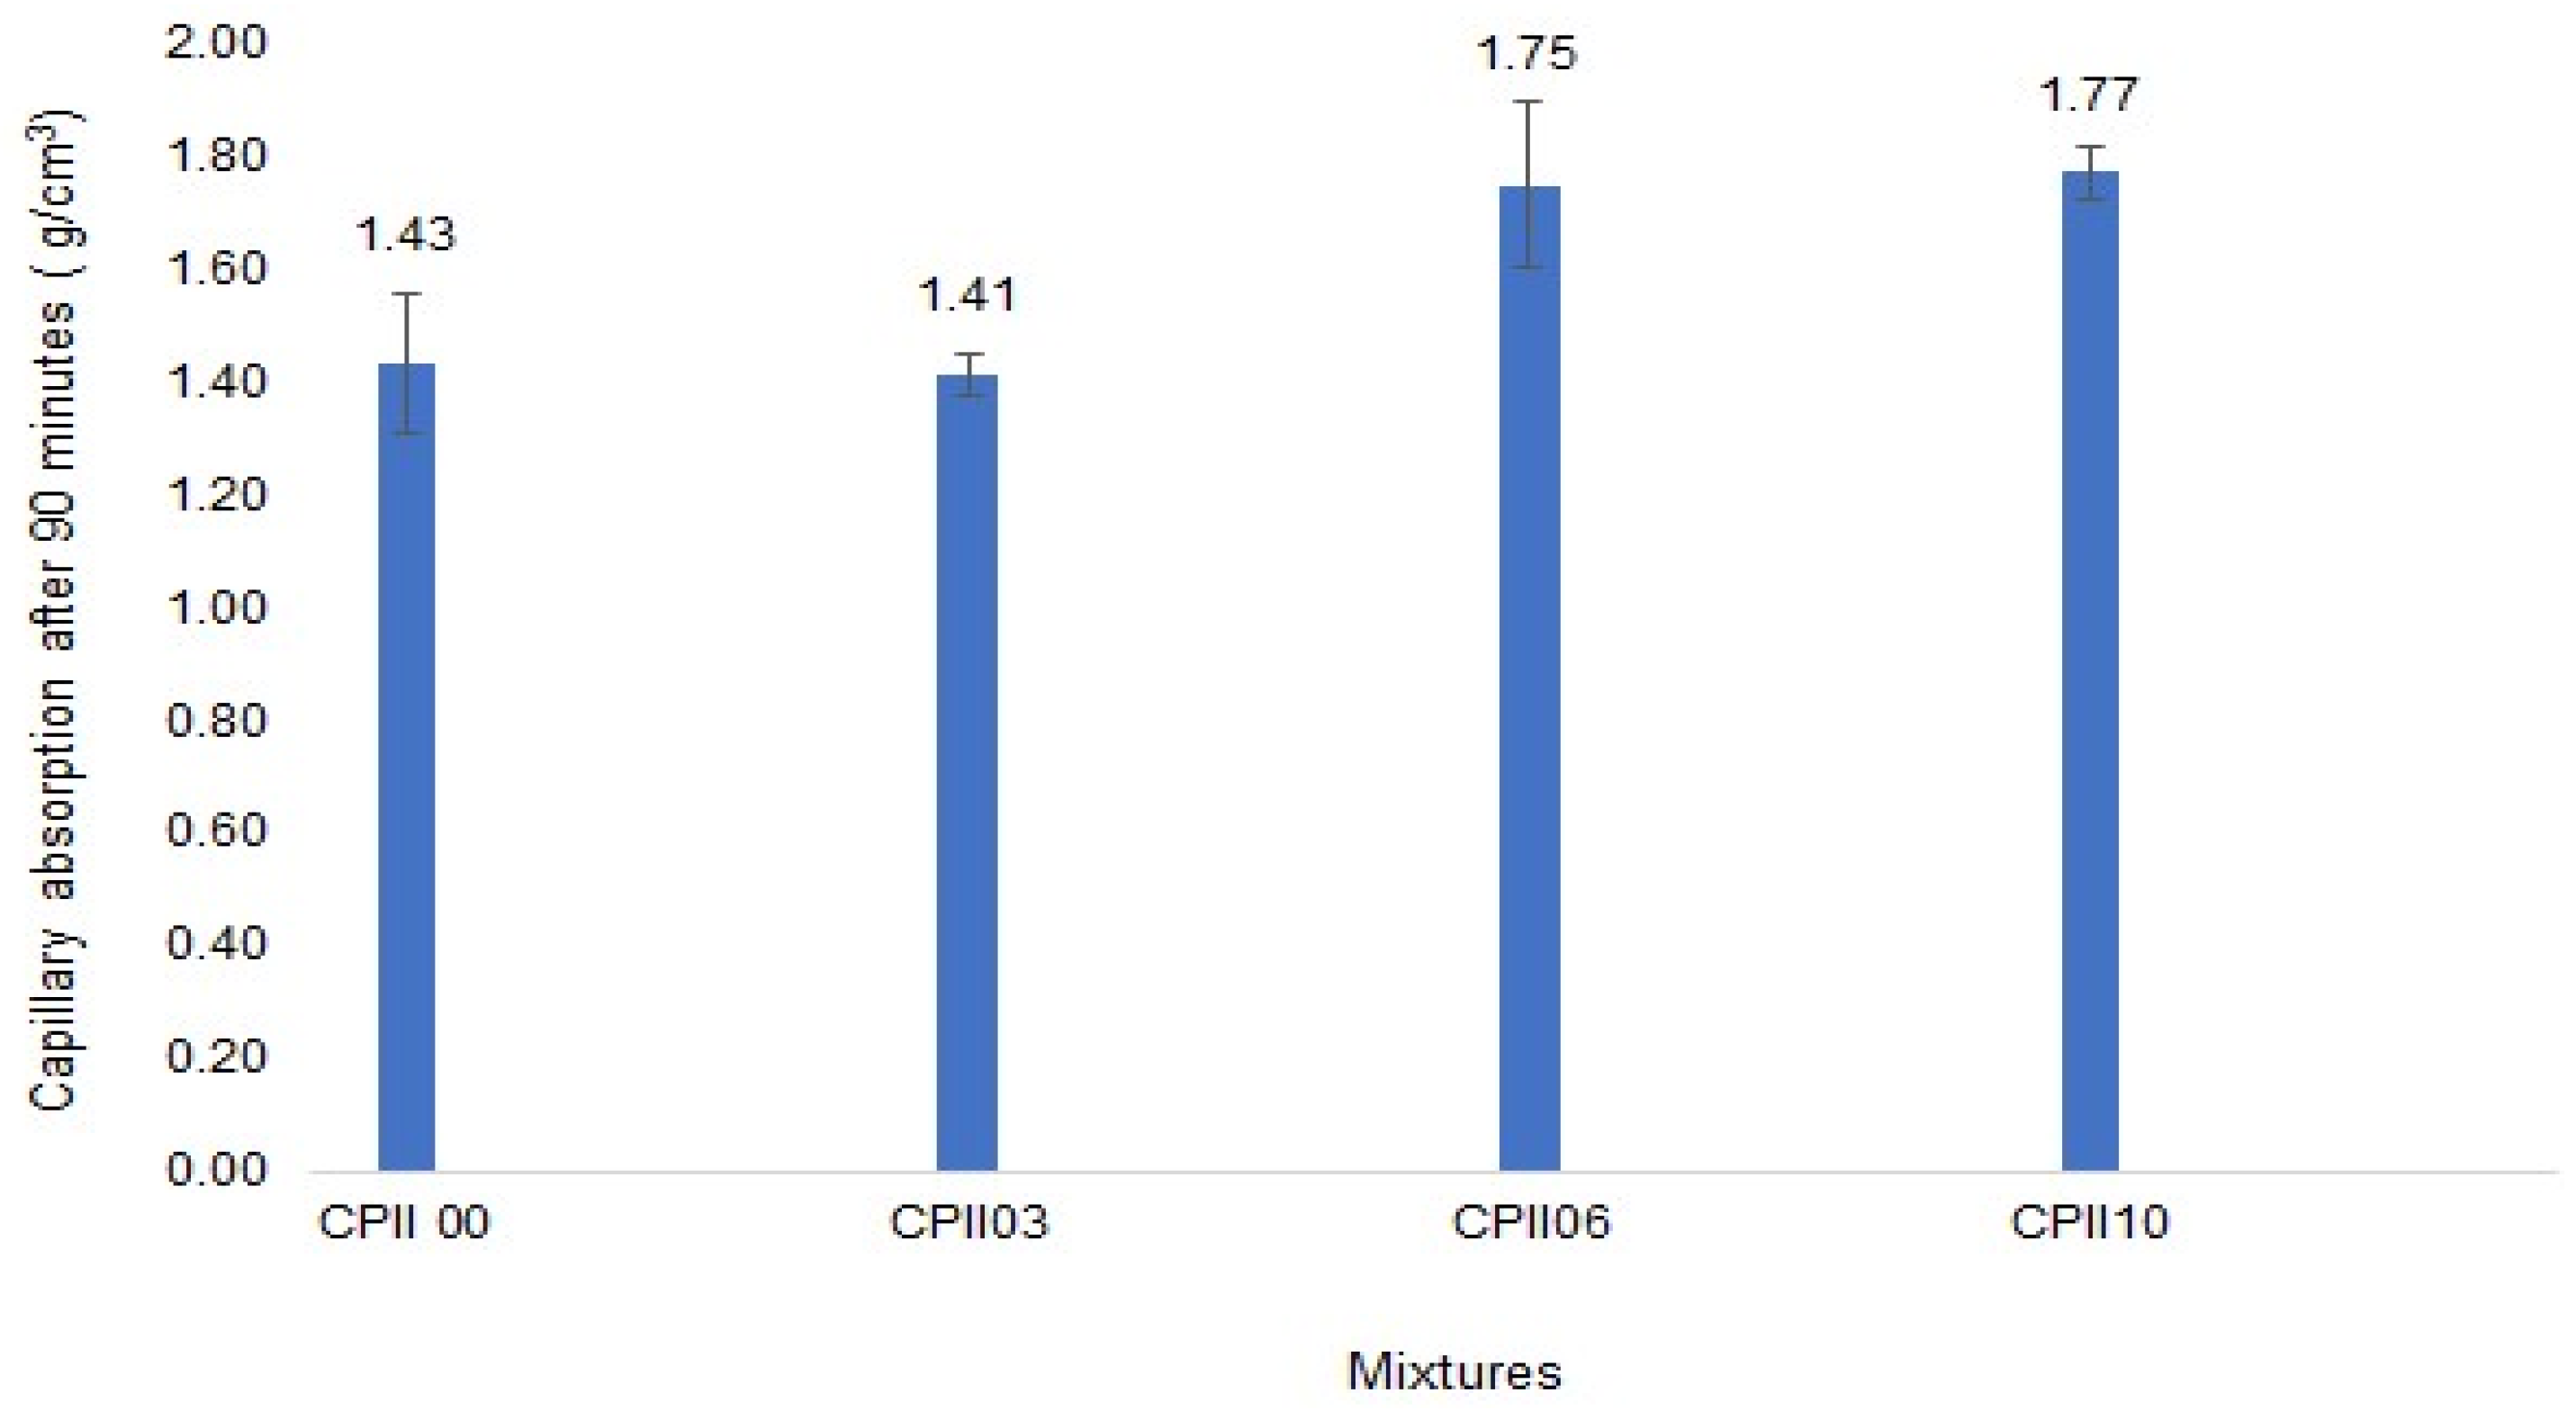
Figure 16 shows the results of the capillary absorption test.
The best results were attributed to the mix with higher gypsum addition, CPII10 with 1.77 g/cm3. Traces with higher byproduct gypsum additions showed greater absorption, as the increase in byproduct gypsum generated greater porosity.
Ref. [16] evaluated the effect of adding water to gypsum powder β (CaSO4·0.5H2O) and found high porosity resulting from the material, due to the remaining water from the gypsum powder hydration process. Since the gypsum hydration process results from the chemical reaction between the hemihydrate and water, generating the dihydrate again, the reverse reaction of the formation of gypsum in gypsum releases heat, as shown in Equation (1).
C a S O 4 · 0.5 H 2 O h e m i h y d r a t e + 1.5 H 2 O C a S O 4 · 2 H 2 O d i h y d r a t e + e n e r g y
The resulting porosity is due to the use of an amount of water greater than the stoichiometric value for hydration of the hemihydrate, with the water that does not react with the powder occupying the volume between the crystals and, after curing the dihydrate, this water evaporates leaving voids in the material. The presence of these voids in the samples causes a drop in mechanical resistance, as verified in the tensile strength tests in flexion and axial compression, where samples with a higher content of gypsum addition showed lower resistance.

3.4. Microstructural Characterization of Samples after 60 Days

  • Scanning electron microscopy (SEM)
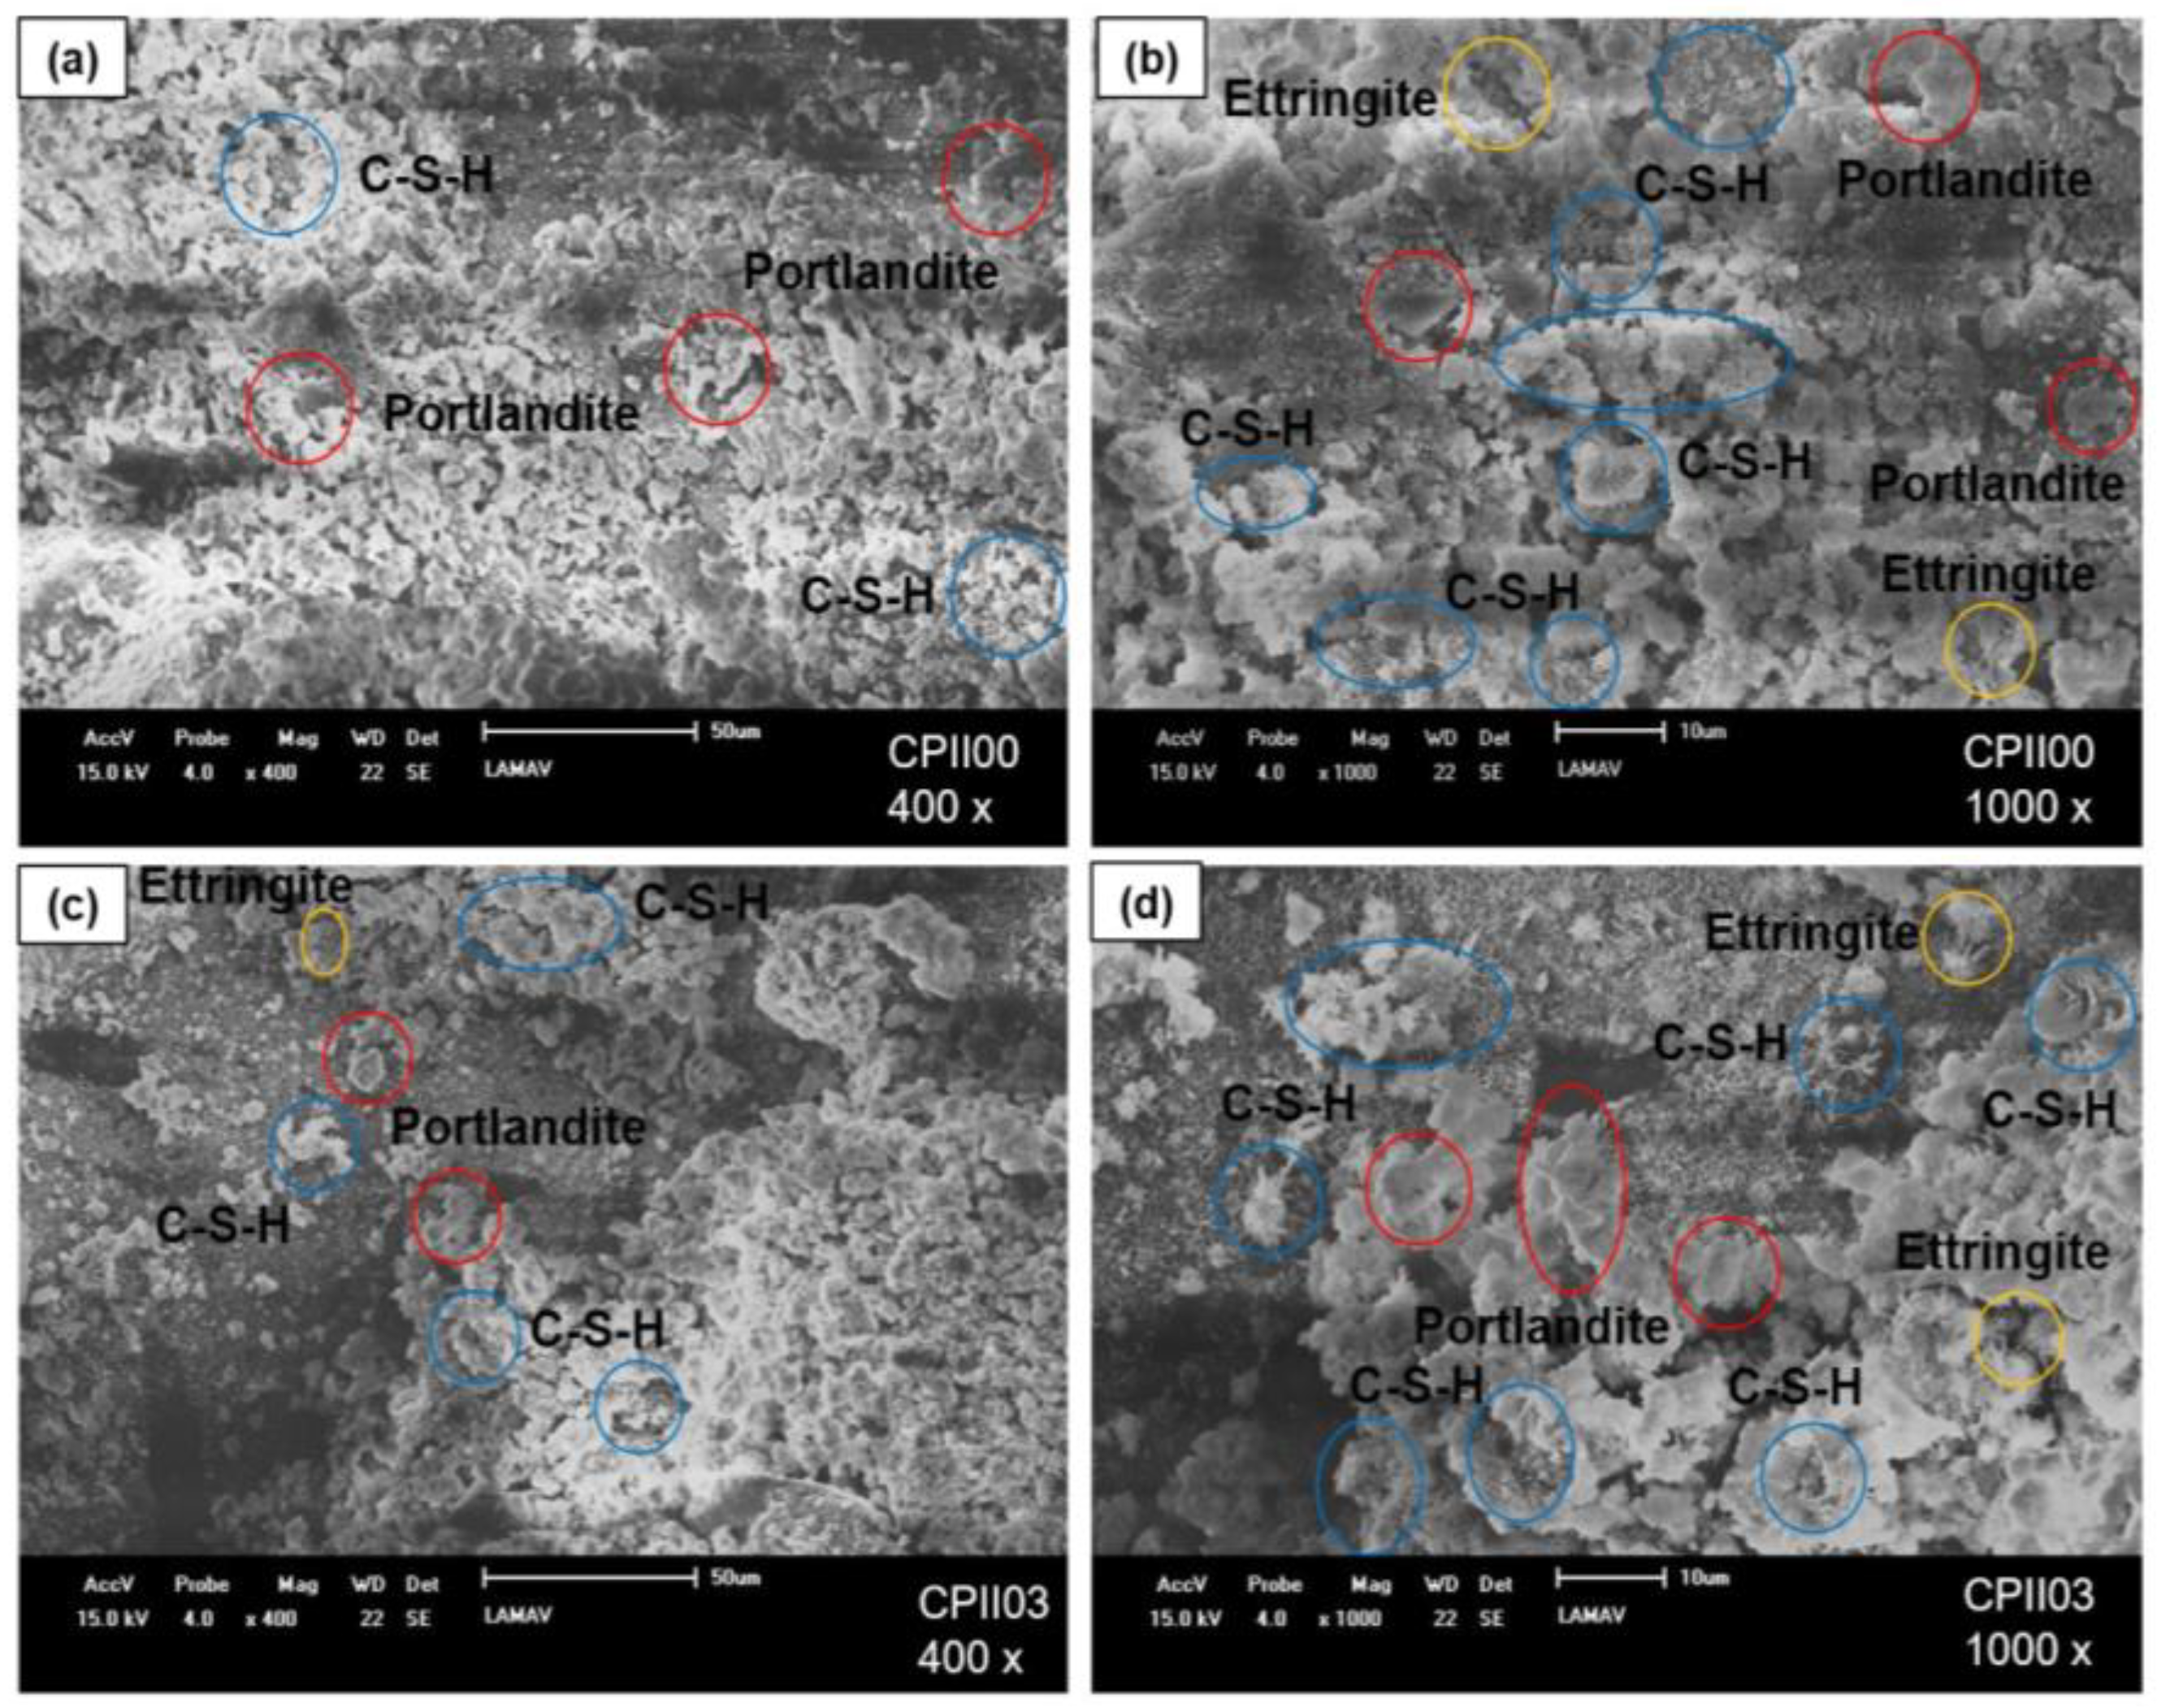
Figure 17 shows the micrographs obtained via SEM for the mortars that showed the best results, CPII00 and CPII03, after 60 days, with magnification of 400× and 1000×.
In the micrograph obtained for the reference sample CPII00, it is possible to verify greater surface roughness and the presence of pores. However, the samples with the addition of byproduct gypsum presented smoother surfaces, due to the filler effect.
The presence of hydration products, such as Ettringite crystals, C-S-H (hydrated calcium silicate) and Portlandite, is evident in the CPII samples. The late formation of these crystals implies a continuous increase in resistance at more advanced ages, since the micrographs were obtained after 60 days.
The CPII03 trait had fewer pores, in accordance with the performance observed in the capillary absorption test (Figure 17).
  • X-ray diffraction
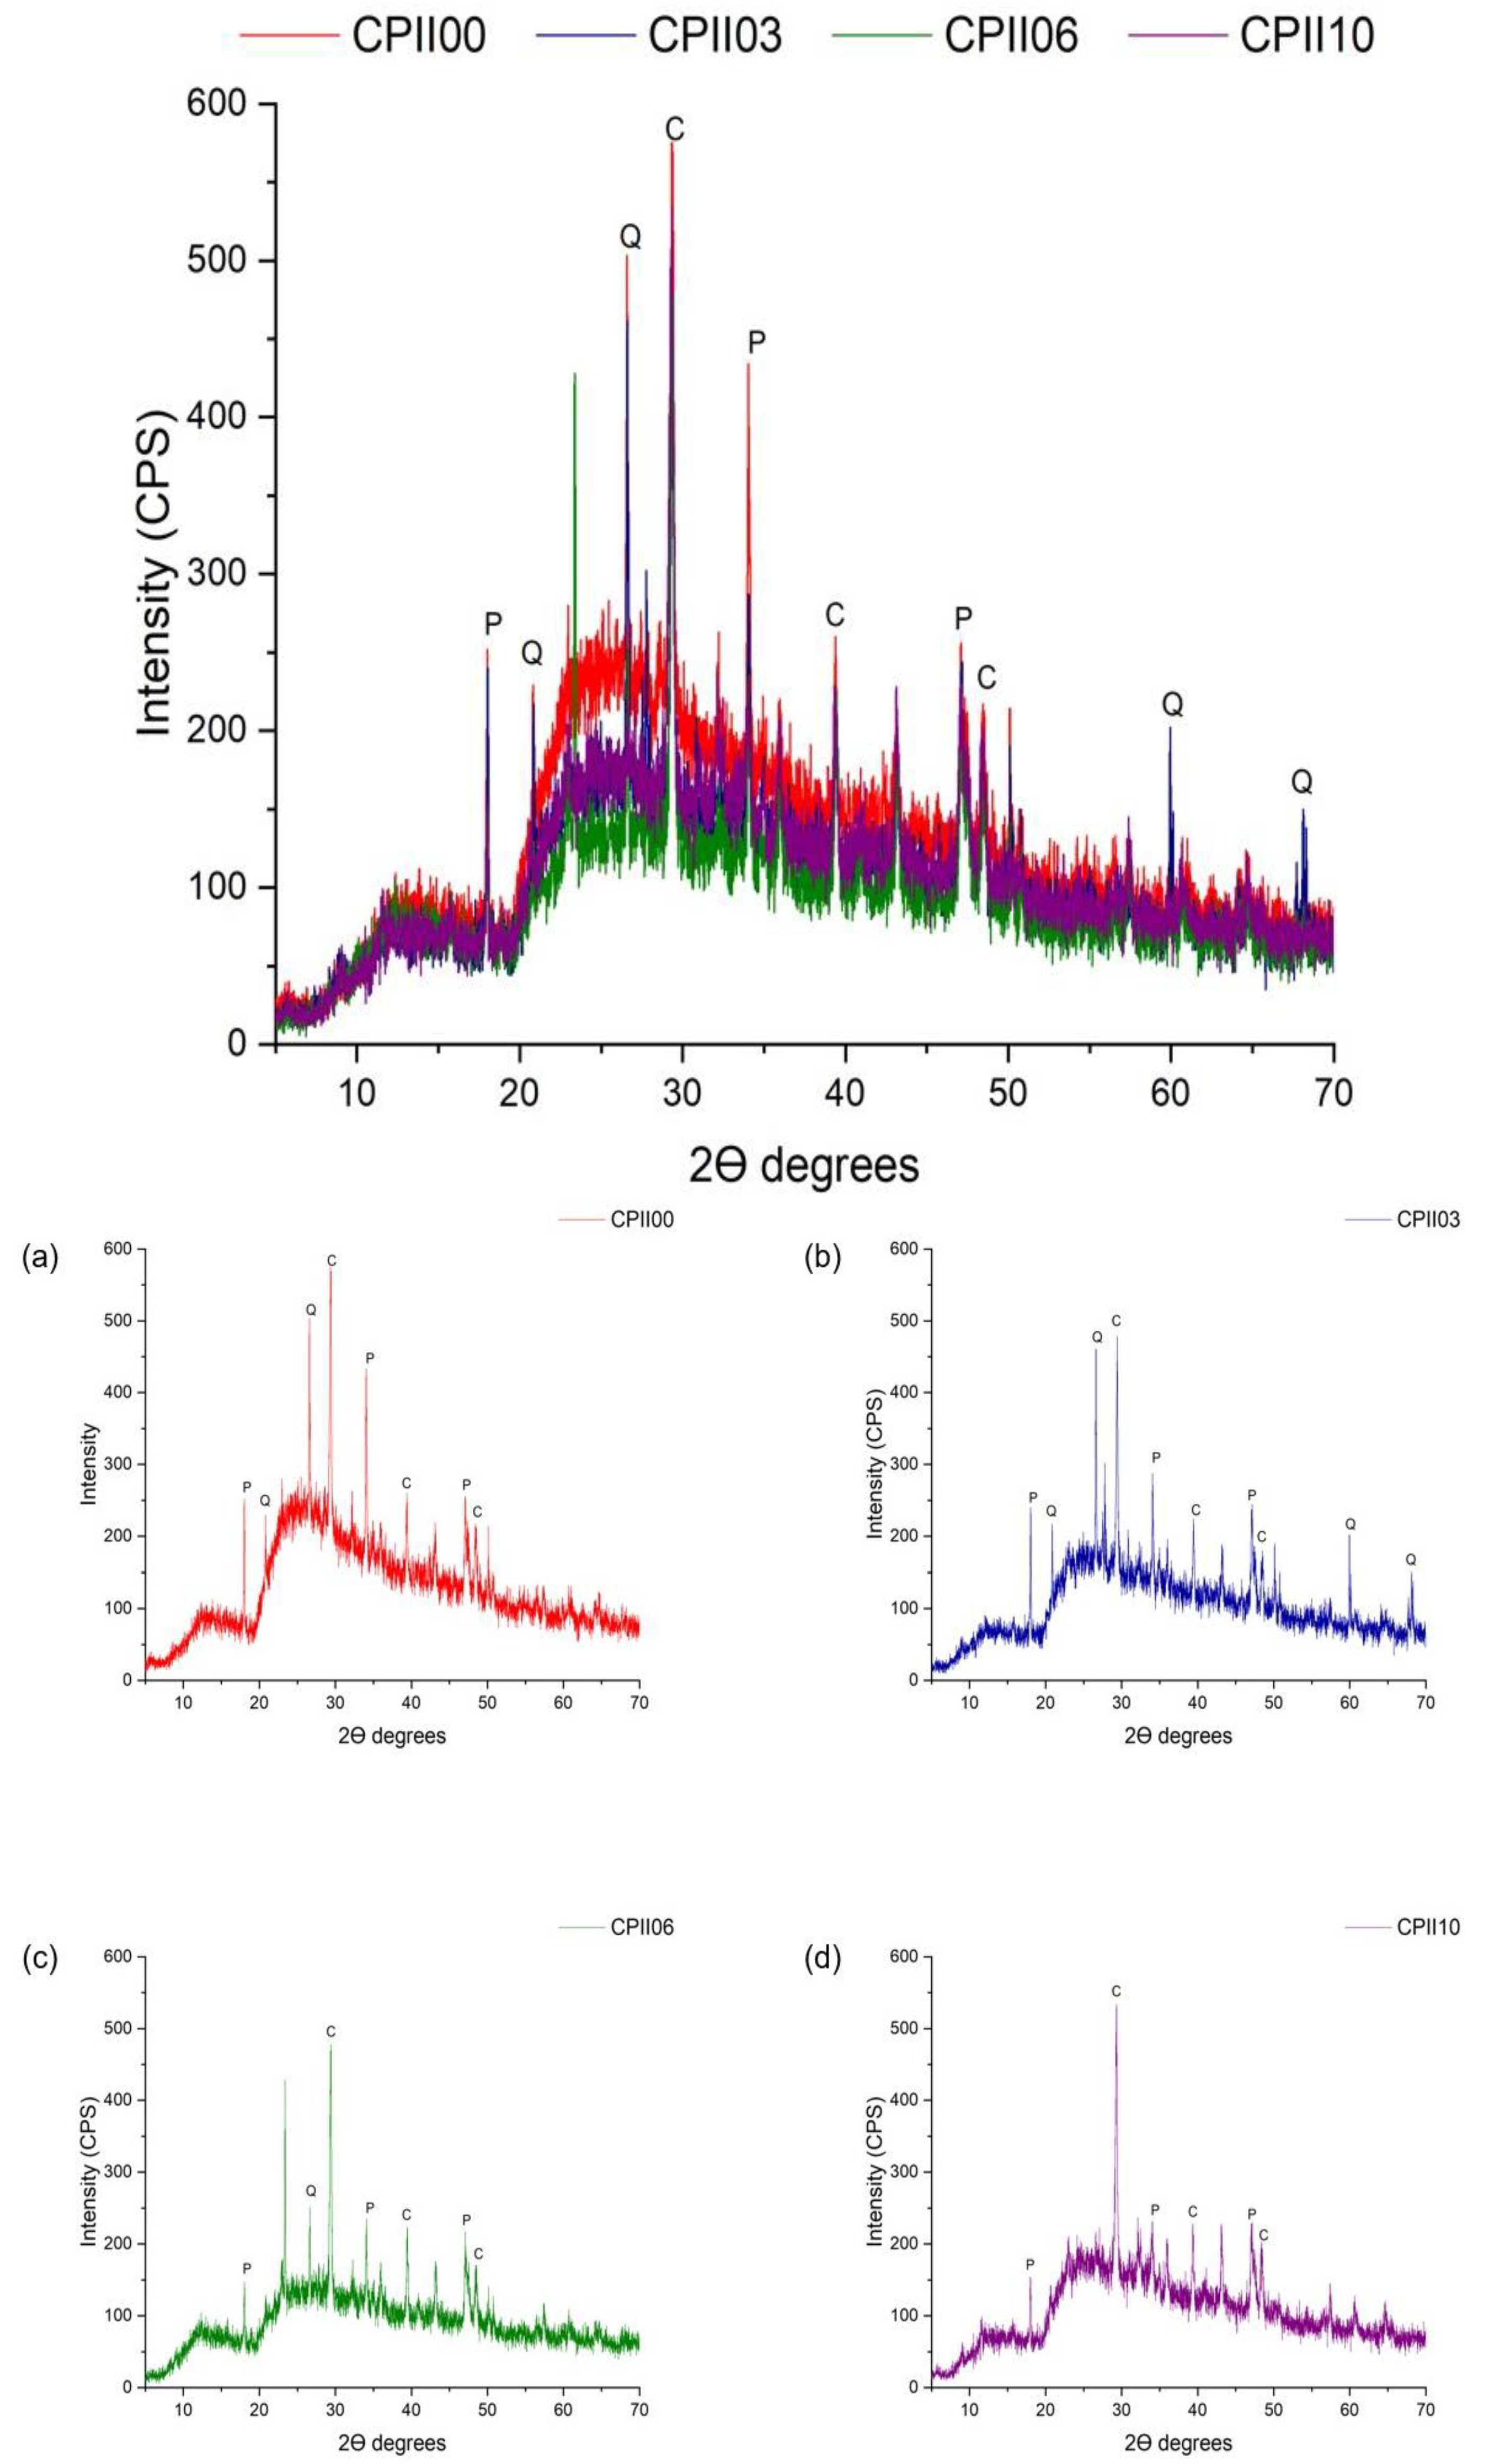
Figure 18 shows the peaks identified in mortar samples with CPII-E Cement. The hydrated compounds identified in DRx in these mortars after 60 days were portlandite, calcite and quartz.
The identification of the peaks corresponding to calcite comes from the limestone filler that makes up the anhydrous cement, and there is also quartz, a crystalline constituent present in the sand. The identification of both constituents is in agreement with the results of the FRx analysis.
The identification of portlandite in all pastes indicates the presence of calcium hydroxide, which is essential for determining the reactivity of mineral additions. Therefore, the results of the XRF analysis are coherent, since the presence of calcium oxide was detected in the composition of the byproduct gypsum and the CPII-E cement [39].
The halo identified in the diffractogram of the CPII-E samples, shown in Figure 18, between 18° and 36° 2θ, is characteristic of C-S-H, which does not present a well-defined crystalline structure, having characteristic peaks together with an elevation in relation to the line base in the region between 18° and 36° 2θ [40,41].

4. Conclusions

Gypsum from the production of lactic acid has a morphology with lamellar crystals, with a smooth and irregular surface. It is composed of the following elements: Ca, S and O. The X-ray diffractogram of the gypsum powder shows that the sample is essentially composed of hemihydrate, as the characteristic peaks of bassanite (β-CaSO4·0.5H2O).
Regarding the chemical composition of the byproduct gypsum, a low content of SiO2, Al2O3 and Fe2O3 was observed, totaling less than 2%, indicating the absence of pozzolanic activity. In the consistency test, it was possible to maintain the same W/C ratio even for mortars with gypsum additions; however, mortars with higher gypsum contents showed greater spreading, indicating greater workability.
The properties in the fresh state, the density values, showed significant reductions with the use of the byproduct gypsum. The incorporated air content values were higher for mortars with gypsum additions due to the use of a quantity of water greater than the stoichiometric value for the hydration of the gypsum hemihydrate and due to the maximum content (10%) of byproduct gypsum addition being insufficient to fill the voids in the material, promoting a reduction in the entrained air content.
In relation to the tensile strength test, the mixes with higher gypsum contents showed lower tensile strength, which was expected since they showed greater workability, a higher content of incorporated air and consequently lower resistance. In the capillarity coefficient, water absorption via capillarity at 90 min showed that, as the amount of ceramic waste increased, water consumption increased, indicating that large percentages of byproduct gypsum causes the loss of the gypsums filler function and consequently the mix has more pores and tends to absorb greater water.
In relation to the tensile strength test, it was observed that the mixes with higher gypsum contents showed lower tensile strength, which was already expected as they presented greater workability, a higher content of incorporated air and consequently lower resistance. The SEM micrographs confirmed these results, indicating that the reference mortars have more porous surfaces than the traces with the addition of plaster, with porosity being a factor that influences the mechanical resistance of mortars in a hardened state.
The micrographs of the CPII-E samples showed hydration products, such as crystals of Ettringite, C-S-H (hydrated calcium silicate) and Portlandite, demonstrating the formation of late crystals, suggesting a continuous increase in resistance at more advanced ages.
In the DRx results, it was possible to identify peaks corresponding to calcite, coming from the limestone filler that makes up anhydrous cement, and quartz, a crystalline constituent present in sand. The identification of both constituents is in agreement with the results of the FRx analysis. Given the consumption of Portlandite as the gypsum addition content increases, due to the particle size of the byproduct gypsum being finer (2.36 µm in D10) and favoring the heterogeneous nucleation of small particles, the formation of portlandite in the cement matrix is consequently reduced.

5. Suggestions for Future Work

  • Evaluate the resistance of mortars with additions of byproduct gypsum for ages greater than 28 days;
  • Evaluate the combined incorporation with other pozzolanic residues, together with the byproduct gypsum;
  • Evaluate mortars with higher levels of gypsum addition;
  • Check the feasibility of using lime in mortars with gypsum additions;
  • Test the viability of plaster mortar for coverings.

Author Contributions

C.G.D.R.: Conceptualization, Research, Methodology and Writing—original version. G.d.C.X.: Formal analysis and Supervision. L.d.S.B.: Research and Methodology. C.M.F.V.: Supervision. A.R.G.d.A.: Supervision. S.N.M.: Supervision. All authors have read and agreed to the published version of the manuscript.

Funding

The participation of A.R.G.A. was sponsored by FAPERJ through the research fellowships proc. no: E-26/210.150/2019, E-26/211.194/2021, E-26/211.293/2021, and E-26/201.310/2021 and by CNPq through the research fellowship PQ2 307592/2021-9 and 401602/2023-0.

Institutional Review Board Statement

Not applicable.

Informed Consent Statement

Not applicable.

Data Availability Statement

No new data were created or analyzed in this study. Data sharing is not applicable to this article.

Acknowledgments

The authors would like to thank the support for this investigation from Brazilian agencies: CAPES and FAPERJ.

Conflicts of Interest

The authors declare no conflict of interest.

List of Abbreviations

XRF, X-ray fluorescence; USP, University of São Paulo; ICDD, International Center for Diffraction Data; UFSC, Federal University of Santa Catarina; UENF, University of the Northern Rio de Janeiro; LAMAV, Advanced Materials Laboratory; LECIV, Civil Engineering Laboratory; XRD, X-ray diffraction; PLA, poly lactic acid; SEM, scanning electron microscopy; W/C, water/cement ratio and C-S-H, hydrated calcium silicate.

References

  1. Veiga, R. Air lime mortars: What else do we need to know to apply them in conservation and rehabilitation interventions? A review. Constr. Build. Mater. 2017, 157, 132–140. [Google Scholar] [CrossRef]
  2. Vijayakumar, J.; Aravindan, R.; Viruthagiric, T. Recent Trends in the Production, Purification and Application of Lactic Acid. Chem. Biochem. Eng. Q. 2008, 22, 245–264. [Google Scholar]
  3. Lima, U.A. Industrial Biotechnology: Fermentative and Enzymatic Processes; Edgard Blucher: New York, NY, USA, 2002; Volume 3, 616p. [Google Scholar]
  4. Pinho, C.L.C.; Oliveira, C.E.S.D.; Coimbra, J.C.; Cotrim, W.D.S. Production of lactic acid in a medium based on food industry effluents using an immobilized mixed dairy culture. Braz. J. Food Technol. 2019, 22. [Google Scholar] [CrossRef]
  5. NBR NM 52; Fine Aggregate—Determination of Specific Mass and Apparent Specific Mass. Brazilian Association of Technical Standards: Rio de Janeiro, Brazil, 2009.
  6. NBR 16605; Determination of the Specific Mass of Cement. Brazilian Association of Technical Standards: Rio de Janeiro, Brazil, 2017.
  7. NBR 16541; Mortar for Laying and Covering Walls and Ceilings—Preparation of the Mixture for Carrying Out Tests. Brazilian Association of Technical Standards: Rio de Janeiro, Brazil, 2016.
  8. NBR 13276; Mortars for Laying and Covering Walls and Ceilings—Determination of the Consistency Index. Brazilian Association of Technical Standards: Rio de Janeiro, Brazil, 2016.
  9. Mohammed, S.; Safiullah, O. Optimization of the SO3 content of an Algerian Portland cement: Study on the effect of various amounts of gypsum on cement properties. Constr. Build. Mater. 2018, 164, 362–370. [Google Scholar] [CrossRef]
  10. NBR 13278; Mortar for Laying Walls and Coating Walls and Ceilings: Determination of Mass Density and Incorporated Air Content. Brazilian Association of Technical Standards: Rio de Janeiro, Brazil, 2005.
  11. NBR 13279; Mortar for Laying Walls and Cladding Walls and Ceilings Determination of Compressive Resistance. Brazilian Association of Technical Standards: Rio de Janeiro, Brazil, 2005.
  12. NBR 15259; Mortar for Laying and Covering Walls and Ceilings—Determination of Water Absorption by Capillarity and Capillarity Coefficient. Brazilian Association of Technical Standards: Rio de Janeiro, Brazil, 2005.
  13. NBR 13207; Plaster for Civil Construction. Brazilian Association of Technical Standards: Rio de Janeiro, Brazil, 2017.
  14. Costa, J.E.B.; Costa, A.F.; Melo, M.A.F.; Melo, D.M.A.; Melo, V.R.M. Comparative Analysis between Gypsum Obtained from Salt Production and Commercial Gypsum. In Proceedings of the 58º Congresso Brasileiro de Cerâmica, Bento Gonçalves, RS, Brasil, 18–21 May 2014. [Google Scholar]
  15. Moreira, P.I.; Dias, J.O.; Xavier, G.C.; Vieira, C.M.; Alexandre, J.; Monteiro, S.N.; Ribeiro, R.P.; Azevedo, A.R.G. Ornamental Stone Processing Waste Incorporated in the Production of Mortars: Technological Influence and Environmental Performance Analysis. Sustainability 2022, 14, 5904. [Google Scholar] [CrossRef]
  16. Barbosa, A.A.; Ferraz, A.V.; Santos, G.A. Chemical, mechanical and morphological characterization of gypsum obtained at Araripe, PE, Brazil). Cerâmica 2014, 60, 501–508. [Google Scholar] [CrossRef]
  17. Bortoletto, M.; Sanches, A.O.; Santos, J.A.; Silva, R.G.d.; Tashima, M.M.; Payá, J.; Soriano, L.; Borrachero, M.V.; Malmonge, J.A.; Akasaki, J.L. New insights on understanding the Portland cement hydration using electrical impedance spectroscopy. Constr. Build. Mater. 2023, 407, 133566. [Google Scholar] [CrossRef]
  18. Mohit, M.; Haftbaradaran, H.; Riahi, H.T. Investigating the ternary cement containing Portland cement, ceramic waste powder, and limestone. Constr. Build. Mater. 2023, 369, 130596. [Google Scholar] [CrossRef]
  19. Caldas, P.H.C.H.; de Azevedo, A.R.G.; Marvila, M.T. Silica fume activated by NaOH and KOH in cement mortars: Rheological and mechanical study. Constr. Build. Mater. 2023, 400, 132623. [Google Scholar] [CrossRef]
  20. Gardette, M.; Thérias, S.; Gardette, J.L.; Murariu, M.; Dubois, P. Photooxidation of polylactide/calcium sulphate Composites. Polym. Degrad. Stab. 2011, 96, 616–623. [Google Scholar] [CrossRef]
  21. Murariu, M.; Ferreira, A.d.S.; Pluta, M.; Bonnaud, L.; Alexandre, M.; Dubois, P. Polylactide (PLA)–CaSO4 composites toughened with low molecular weight and polymeric ester-like plasticizers and related performances. Eur. Polym. J. 2008, 44, 3842–3852. [Google Scholar] [CrossRef]
  22. Bardella, P.S.; Camarini, G. Recycled Plaster: Physical and Mechanical Properties. Adv. Mater. Res. 2011, 374377, 1307–1310. [Google Scholar] [CrossRef]
  23. Ferreira, F.C.; Sousa, J.G.G.; Carneiro, A.M.P. Mechanical characterization of plaster for coating produced at the Araripe Gesseiro Complex. Ambiente Construído 2019, 19, 207–221. [Google Scholar] [CrossRef]
  24. Qin, W.; Haiyu, Z.; Yue, W.; Sihan, S.; Kejun, L. Influence of phosphorus impurities on the structure and performance of cellulose-ether-modified gypsum. Constr. Build. Mater. 2022, 345, 128230. [Google Scholar] [CrossRef]
  25. Nalon, G.H.; Alves, M.A.; Pedroti, L.G.; Ribeiro, J.C.L.; Fernandes, W.E.H.; Oliveira, D.S. Compressive strength, dynamic, and static modulus of cement—Lime laying mortars obtained from samples of various geometries. J. Build. Eng. 2021, 44, 102626. [Google Scholar] [CrossRef]
  26. Hagemann, S.E.; Gastaldini, A.L.G.; Cocco, M.; Jahn, S.L.; Terra, L.M. Synergic effects of the substitution of Portland cement for water treatment plant sludge ash and ground limestone: Technical and economic evaluation. J. Clean. Prod. 2019, 214, 916–926. [Google Scholar] [CrossRef]
  27. Assis, M.S.; da Silva, M.A.; Cortez, F.L.C.; Leitão, M.d.S.A. Influence of Calcination and Granulometry on the Manufacturing of Recycled Gypsum Blocks. In Proceedings of the 3rd South American Congress on Solid Waste and Sustainability, Gramado, RS, Brazil, 25 March 2020. [Google Scholar]
  28. Rashad, M.M.; Mahmoud, I.A.; Ibrahim, E.A.; Abdel-Aal, E.A. Crystallization of calcium sulfate dehydrate under simulated conditions of phosphoric acid production in the presence of aluminum and magnesium ions. J. Cristal. Growth 2004, 267, 372–379. [Google Scholar] [CrossRef]
  29. Singh, N.B.; Middendorf, B. Calcium sulphate hemihydrates hydration leading to gypsum crystallization. Prog. Cryst. Growth Charact. Mater. 2007, 53, 57–77. [Google Scholar] [CrossRef]
  30. Antoniazzi, J.P.; Mohamad, G.; Casali, J.M.; Schmidt, R.P.B. Air incorporation in ready mix mortars: Influence of admixtures, aggregates and mixing time. Ambiente Construído 2020, 20, 285–304. [Google Scholar] [CrossRef]
  31. Tokarski, R.B.; Matoski, A.; Cechin, L.; Weber, A.M. Behavior of coating mortars in the fresh state, composed of limestone crushed sand and natural sand. Revista Matéria 2018, 23, 3. [Google Scholar] [CrossRef]
  32. NBR 13281; Mortar for Laying and Covering Walls and Ceilings—Requirements. Brazilian Association of Technical Standards: Rio de Janeiro, Brazil, 2005.
  33. NBR 15839; Mortar for Laying and Covering Walls and Ceilings—Rheological Characterization Using the Squeeze-Flow Method. Brazilian Association of Technical Standards: Rio de Janeiro, Brazil, 2010.
  34. Marvila, M.T.; Azevedo, A.R.; Barroso, L.S.; Barbosa, M.Z.; de Brito, J. Gypsum plaster using rock waste: A proposal to repair the renderings of historical buildings in Brazil. Constr. Build. Mater. 2020, 250, 118786. [Google Scholar] [CrossRef]
  35. C1679-17; Measuring Hydration Kinetics of Hydraulic Cementitious Mixtures Using Isothermal Calorimetry. American Society for Testing and Materials: West Conshohocken, PA, USA, 2017.
  36. Huang, T.; Yuan, Q.; Zuo, S.; Xie, Y.; Shi, C. New insights into the effect of gypsum on hydration and elasticity development of C3S paste during setting. Cem. Concr. Res. 2022, 159, 106860. [Google Scholar] [CrossRef]
  37. Langaro, E.A.; da Luz, C.A.; Buth, I.S.; Moraes, M.C.; Filho, J.I.P.F.; Matoski, A. The influence of chemical composition and fineness on the performance of alkali activated cements obtained from blast furnace slags. Rev. Matéria 2017, 11792, 1517–7076. [Google Scholar]
  38. Gesoglu, M.; Güneyisi, E.; Nahhab, A.H.; Yazıcı, H. The effect of aggregates with high gypsum content on the performance of ultra-high strength concretes and Portland cement mortars. Constr. Build. Mater. 2016, 110, 346–354. [Google Scholar] [CrossRef]
  39. Filho, J.H.; Pires, C.; Leite, O.; Garcez, M.; Medeiros, M. Red ceramic waste as supplementary cementitious material: Microstructure and mechanical properties. Constr. Build. Mater. 2021, 296, 123653. [Google Scholar] [CrossRef]
  40. Cherene, M.G.P.; Xavier, G.d.C.; Barroso, L.d.S.; Oliveira, J.d.S.M.; de Azevedo, A.R.G.; Vieira, C.M.; Alexandre, J.; Monteiro, S.N. Technological and microstructural perspective of the use of ceramic waste in cement-based mortars. Constr. Build. Mater. 2023, 367. [Google Scholar] [CrossRef]
  41. Robayo-Salazar, R.A.; Valencia-Saavedra, W.; Ramírez-Benavides, S.; de Gutiérrez, R.M.; Orobio, A. Eco-House Prototype Constructed with Alkali-Activated Blocks: Material Production, Characterization, Design, Construction, and Environmental Impact. Materials 2021, 14, 1275. [Google Scholar] [CrossRef] [PubMed]
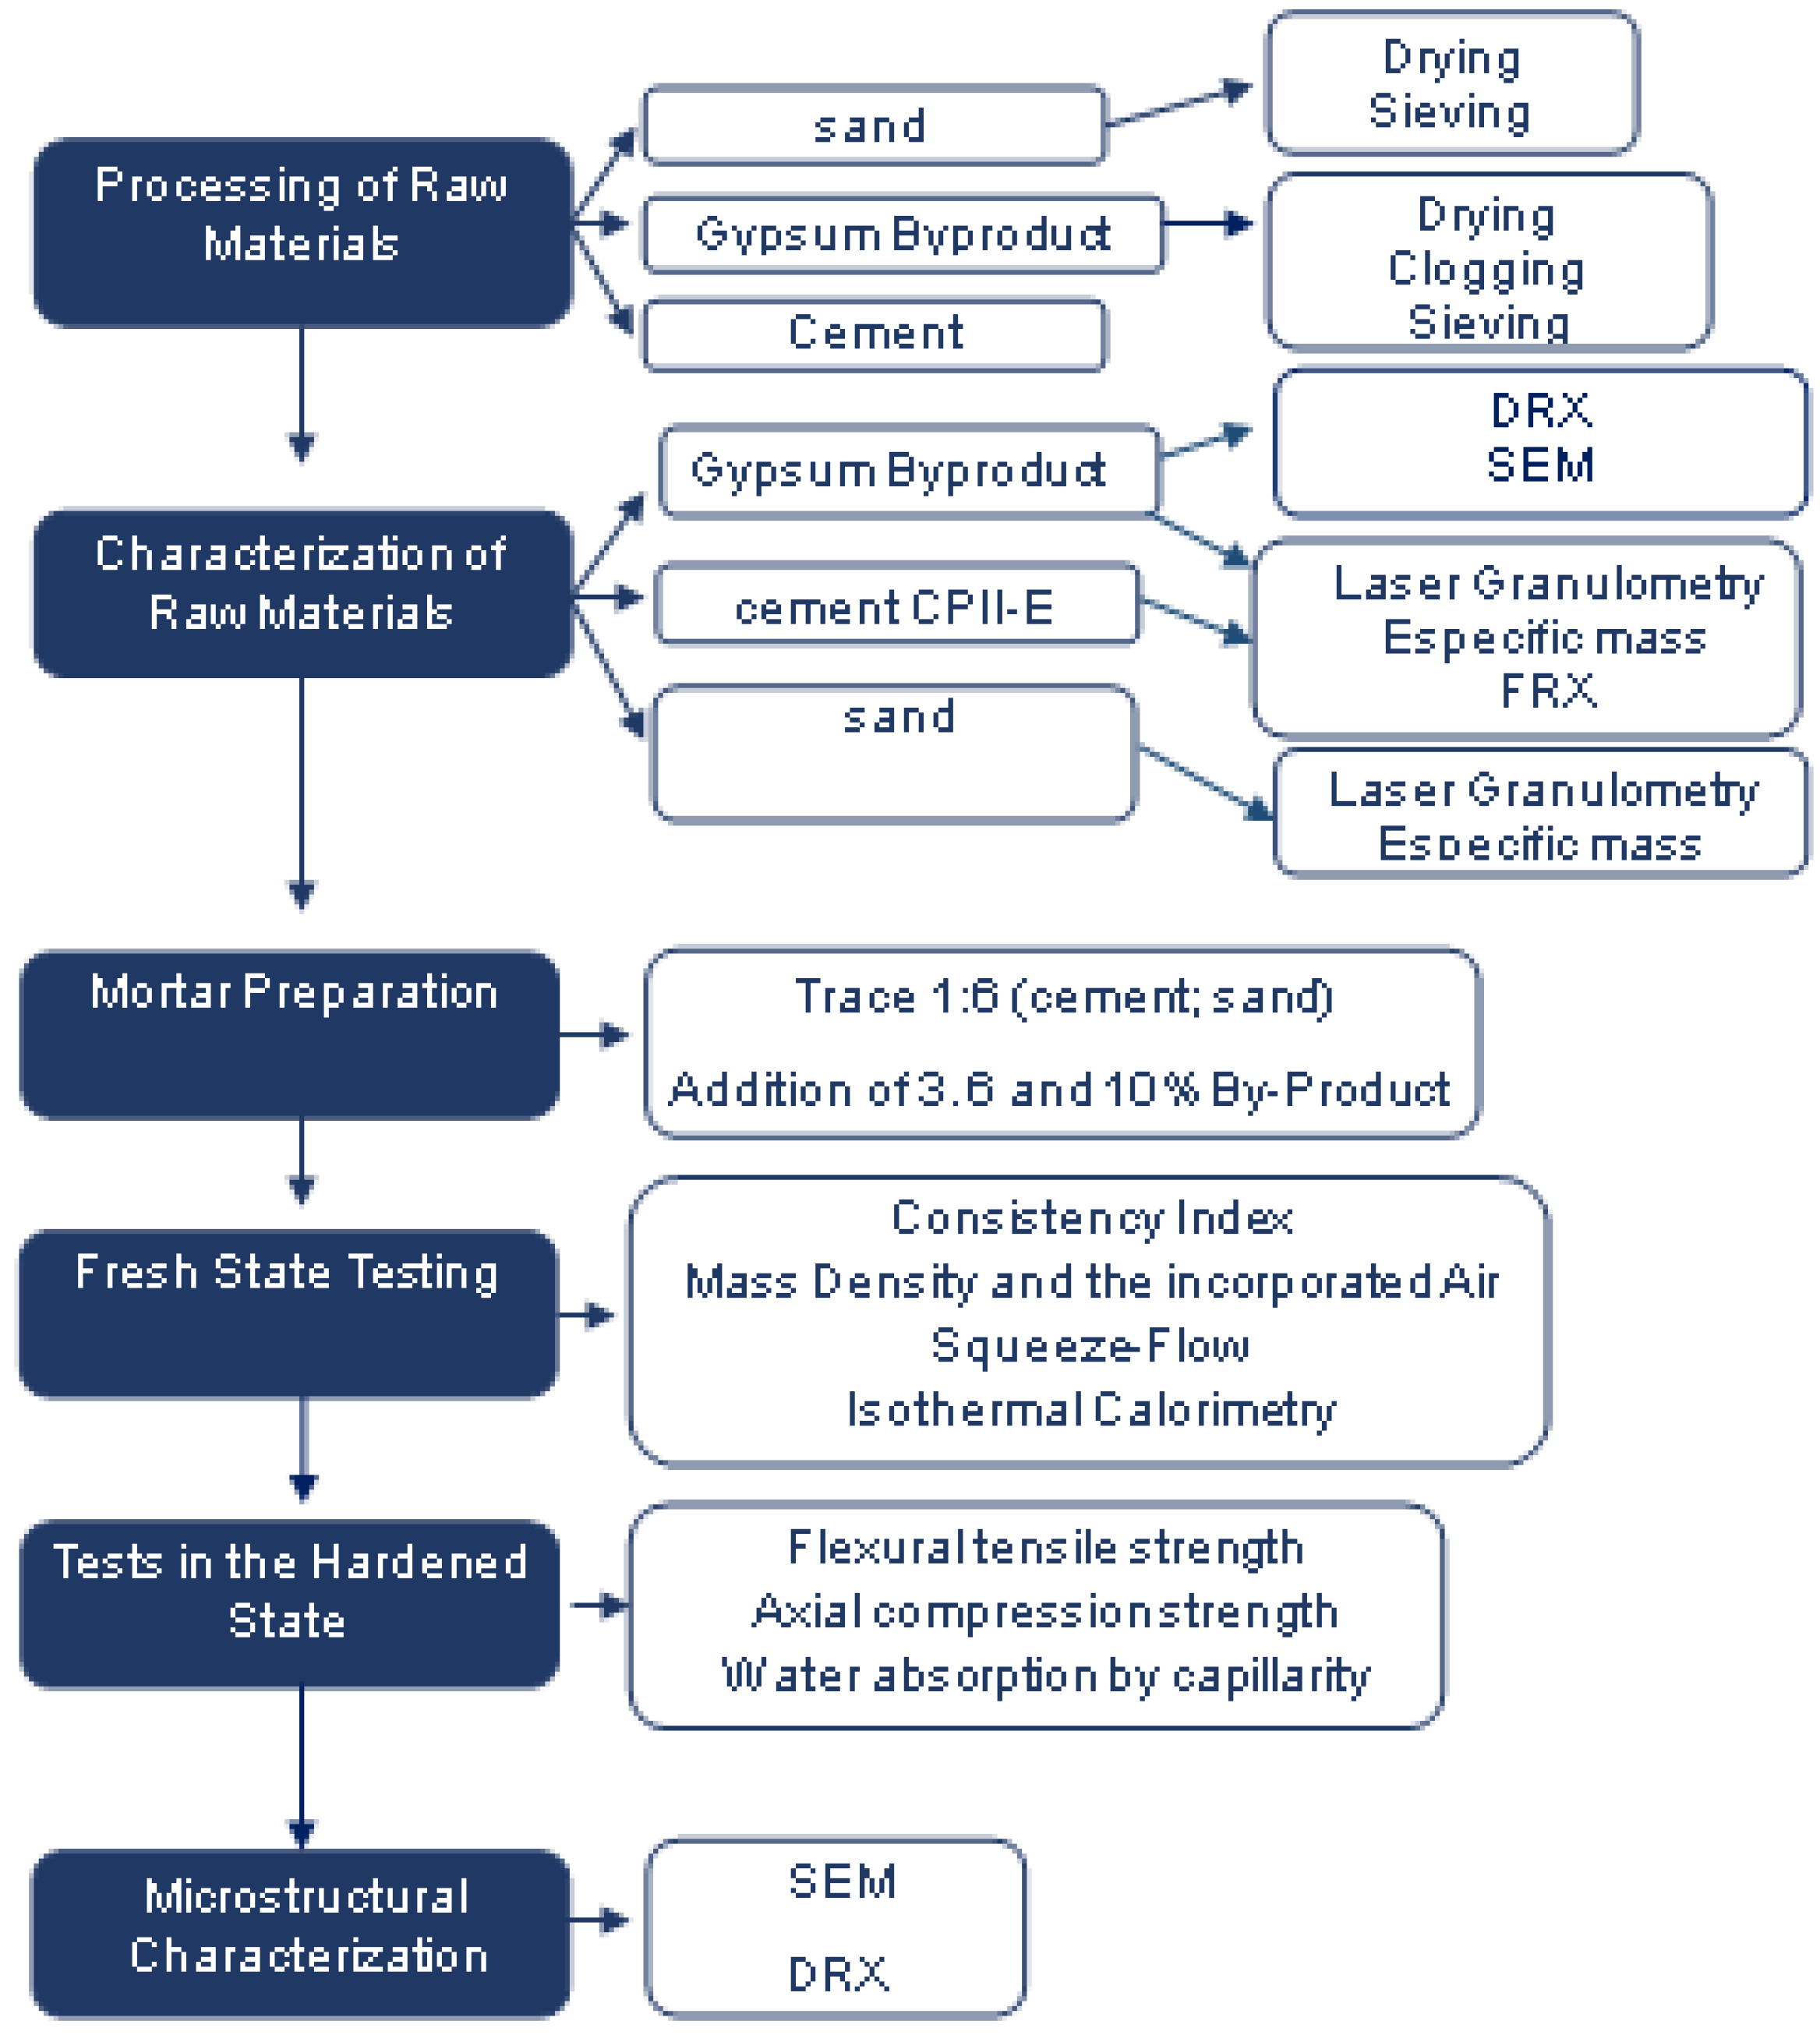
Figure 1. Experimental program flowchart.
Sustainability 16 01193 g001
Figure 2. Byproduct gypsum (a) in natura and (b) natural drying after 48 h.
Sustainability 16 01193 g002
Figure 3. X-ray diffraction diagram of the byproduct gypsum.
Sustainability 16 01193 g003
Figure 4. Laser particle size curve.
Sustainability 16 01193 g004
Figure 5. SEM of the byproduct gypsum. (a) 100× and (b) 400×.
Sustainability 16 01193 g005
Figure 6. Results of the mass density test.
Sustainability 16 01193 g006
Figure 7. Results of the incorporated air test.
Sustainability 16 01193 g007
Figure 8. Load (N) × displacement (mm) curve at speed 0.1 mm/s—in freshly prepared CPII mortars.
Sustainability 16 01193 g008
Figure 9. Load (N) × displacement (mm) curve at speed 0.1 mm/s—in CPII mortars after 15 min.
Sustainability 16 01193 g009
Figure 10. Load (N) × displacement (mm) curve at speed 0.1 mm/s—in CPII mortars after 60 min.
Sustainability 16 01193 g010
Figure 11. Released heat flux curves as a function of time over a period of 48 h, in CP II-E samples.
Sustainability 16 01193 g011
Figure 12. Released heat flux curves as a function of time, up to 3 h, in CP II-E samples.
Sustainability 16 01193 g012
Figure 13. Accumulated heat flux curves as a function of time, in CP II-E samples.
Sustainability 16 01193 g013
Figure 14. Flexural mechanical strength.
Sustainability 16 01193 g014
Figure 15. Compressive mechanical strength.
Sustainability 16 01193 g015
Figure 16. Capillary absorption results.
Sustainability 16 01193 g016
Figure 17. Micrographs of the mortar sample CPII00-400× (a), CPII00-1000× (b), CPII03-400× (c) and CPII03-1000× (d) after 60 days.
Sustainability 16 01193 g017
Figure 18. Diffractography of CPII-E samples after greater ages (60 days). Caption: (Q) Quartz; (C) Calcite and (P) Portlandite.
Sustainability 16 01193 g018
Table 1. Nomenclature adopted for each mortar formulation.
Nomenclature Composition
CPII00Reference mortar with Portland CPII cement without added byproduct gypsum.
CPII03Mortar with Portland CPII cement and 3% waste addition.
CPII06Mortar with Portland CPII cement and 6% waste addition.
CPII10Mortar with Portland CPII cement and 10% waste addition.
Table 2. Chemical composition.
ComponentByproduct Gypsum
(% Mass)
CPII
(% Mass)
MgO-1.14
Al2O30.915.54
SiO20.9217.06
P2O50.080.18
SO353.292.64
Cl0.090.07
K2O0.160.71
CaO44.5667.84
Fe2O3-3.30
Ag2O-1.52
Table 3. Specific mass.
MaterialSpecific Mass (g/cm3)
(NBR 16605, 2017) [6]
Byproduct gypsum2.73
CPII-E2.94
Sand2.67
Table 4. Spreading and W/C ratio.
Mixture Consistency Index (mm) Water/Dry Materials Ratio W/C
CPII002550.20401.43
CPII032570.20311.43
CPII062630.20231.43
CPII102650.20111.43
Disclaimer/Publisher’s Note: The statements, opinions and data contained in all publications are solely those of the individual author(s) and contributor(s) and not of MDPI and/or the editor(s). MDPI and/or the editor(s) disclaim responsibility for any injury to people or property resulting from any ideas, methods, instructions or products referred to in the content.