Article

Heavy Metal Pollution in Sediments of the Yu River in a Polymetallic Ore Concentration Area: Temporal–Spatial Variation, Risk Assessment, and Sources Apportionment

1
Engineering Technology Research Center for Deep Hole Drilling for Metal Minerals in Henan Province, Zhengzhou 450014, China
2
Henan Province Institute of No. 3 Geological Exploration Co., Ltd., Zhengzhou 450014, China
3
MNR Key Laboratory of Metallogeny and Mineral Assessment, Institute of Mineral Resources, Chinese Academy of Geological Sciences, Beijing 100037, China
4
Department of Environmental Sciences and Engineering, Beijing University of Chemical Technology, Beijing 100029, China
5
Academy of Agricultural Planning and Engineering, Key Laboratory of Technologies and Models for Cyclic Utilization from Agricultural Resources, Ministry of Agriculture and Rural Affairs, Beijing 100125, China
*
Authors to whom correspondence should be addressed.
Sustainability 2024, 16(3), 1154; https://doi.org/10.3390/su16031154
Submission received: 30 November 2023 / Revised: 15 January 2024 / Accepted: 23 January 2024 / Published: 30 January 2024

Abstract

:
In a polymetallic ore concentration area, large-scale mining activities can dramatically increase heavy metal concentrations in river sediments, and their temporal–spatial variation and source apportionment are significant for understanding heavy metal migration in rivers and formulating management strategies for environmental protection and the mining industry. Sediment samples were collected along the Yu River, which flows through the Luanchan polymetallic ore concentration area in China, during high-water period (HWP), low-water period (LWP) and flat-water period (FWP) to assess the pollution level and identify the sources of Mo, Cr, W, Cu, Zn, As, Cd, Pb and Hg in the sediments. The findings revealed that Mo, Cd, W, Zn, Pb and Cu were the main pollutants, and Hg was extremely high at some specific locations. Sediments in the upstream region of the Yu River were more severely polluted by heavy metals and had greater ecological risk due to stronger mine exploration. Furthermore, consistent distribution patterns of various heavy metals during different seasons were not found. Some sharp decreases in heavy metal concentrations between adjacent sediments were observed; moreover, at some sites, heavy metal concentrations during LWP and FWP were lower than those during HWP. The results indicated that heavy metals in the Yu River mainly migrated in dissolved form. Mo, Cu, Pb and As for HWP, Mo and As for LWP and Mo, Cr and W for FWP mainly originated from Mo/W mines. Pb/Zn mines contributed to the amounts of W, Zn and Cd during HWP, Cu, Zn, Cd and Pb during LWP and Cu, Zn, Cd and Pb during FWP. Hg was mainly attributed to Au mines, and Cr was the geogenic element. The results could contribute to the sustainability of the mining industry and the formulation of science-based remediation and protection strategies for the rivers near mining areas.

1. Introduction

Heavy metals have been of great concern in the past few decades due to their high toxicity, bioaccumulation and non-degradability [1,2,3,4]. Human activities, such as transportation, agriculture and industry are common sources of external heavy metals in sediments and soils [2,5]. In the mining area, the exploration of nonferrous mines can release a great amount of heavy metals into the environment, and are the primary reason for heavy metal accumulation in sediment, seriously threatening human health and the sustainability of the mining industry [6,7,8]. For some sulfide deposits, acid mine drainage (AMD) often results from the oxidation of sulfide minerals, such as gelenite (PbS), sphalerite (ZnS) and pyrite (FeS2), with the participation of water, oxygen and microorganisms [9,10]. AMD with a low pH and containing high contents of heavy metals and sulfate ions enters the river, further increasing heavy metal concentrations in the river column and sediments. Heavy metal pollution of sediments caused by mining activities has been reported extensively [11,12,13,14]. For the Lom River, the sediments near a Au mine were severely polluted by Cr with the highest value of 3226 mg/kg [11]. The concentrations of As, Cd, Cu, Mn, Pb and Zn in sediments of the Jishui River, China, which is near some nonferrous mines, such as a Pb/Zn mine, Cu mine and Au mine, reached 864, 256.9, 3447, 1368, 545.2 and 1270 mg/kg, respectively [14]. Therefore, it is significant to pay more attention to the heavy metal pollution of sediments near mining areas.
The concentrations of heavy metals in river sediments are one of the key indicators for assessing the pollution level and ecological risk of a river. High concentrations of heavy metals in rivers can destroy aquatic ecological systems and further threaten human health. It was reported that more than 90% of the heavy metal load in an aquatic system is carried by suspended particulate matter and sediments [15]. Sediments are a sink or source of heavy metals in the aquatic system and can adsorb or release them when environmental conditions, such as the Oxidation–Reduction Potential (ORP), pH and electrical conductivity change [16,17]. The heavy metal concentrations in sediments often vary with the seasons [2,12,15]. In rainy season, intensive rain can erode soils or solid wastes leading to the release of heavy metals from the soils or solid wastes into the river [18]. Importantly, sediments can resuspend when water flow is high during rainy season, enhancing the amount of suspended particulate matter and significantly impacting the migration of heavy metals [15,19,20,21]. Furthermore, the heavy metal pollution of a river can be liable to be affected by trivial pollution events due to the reduction in the water body in dry season. Thus, the temporal–spatial variation of heavy metals in sediments is highly important for understanding the migration process of heavy metals in rivers.
For a river in a polymetallic ore concentrated area, the pollution caused by various heavy metals and the migration of heavy metals are more complicated. On the one hand, a clear source identification of the heavy metals in the river is not easily obtained due to the accompanying relationship of some heavy metals. On the other hand, incidental pollution events often occur, especially during the raining season, which cause disorder in the migration patterns of heavy metals. Therefore, it is a challenge to control the heavy metal pollution of a river in a polymetallic ore concentrated area. The Luanchuan polymetallic ore concentration area is located in Henan Province, China, and is famous for the largest reserves of polymetallic ore in Asia. The main minerals of metals in the ores are molybdenite (MoS2), scheelite (CaWO4), chalcopyrite (CuFeS2), gelenite (PbS), sphalerite (ZnS), pyrite (FeS2), pyrrhotite (Fe1−xS) and magnetite (Fe3O4) [22]. After the 1980s, large-scale mining activities have been performed, and the environmental issues caused by mining activities in the area have been of great concern. In the Luanchuan polymetallic ore concentration area, the Yu River flows from east to west, and some mines are scattered along the bank side of the Yu River and its tributary. The aims of this study were to (1) investigate the temporal–spatial variation of heavy metals in sediments of the Yu River, (2) assess pollution levels and ecological risk and (3) uncover the migration processes and sources of various heavy metals in the river.

2. Materials and Methods

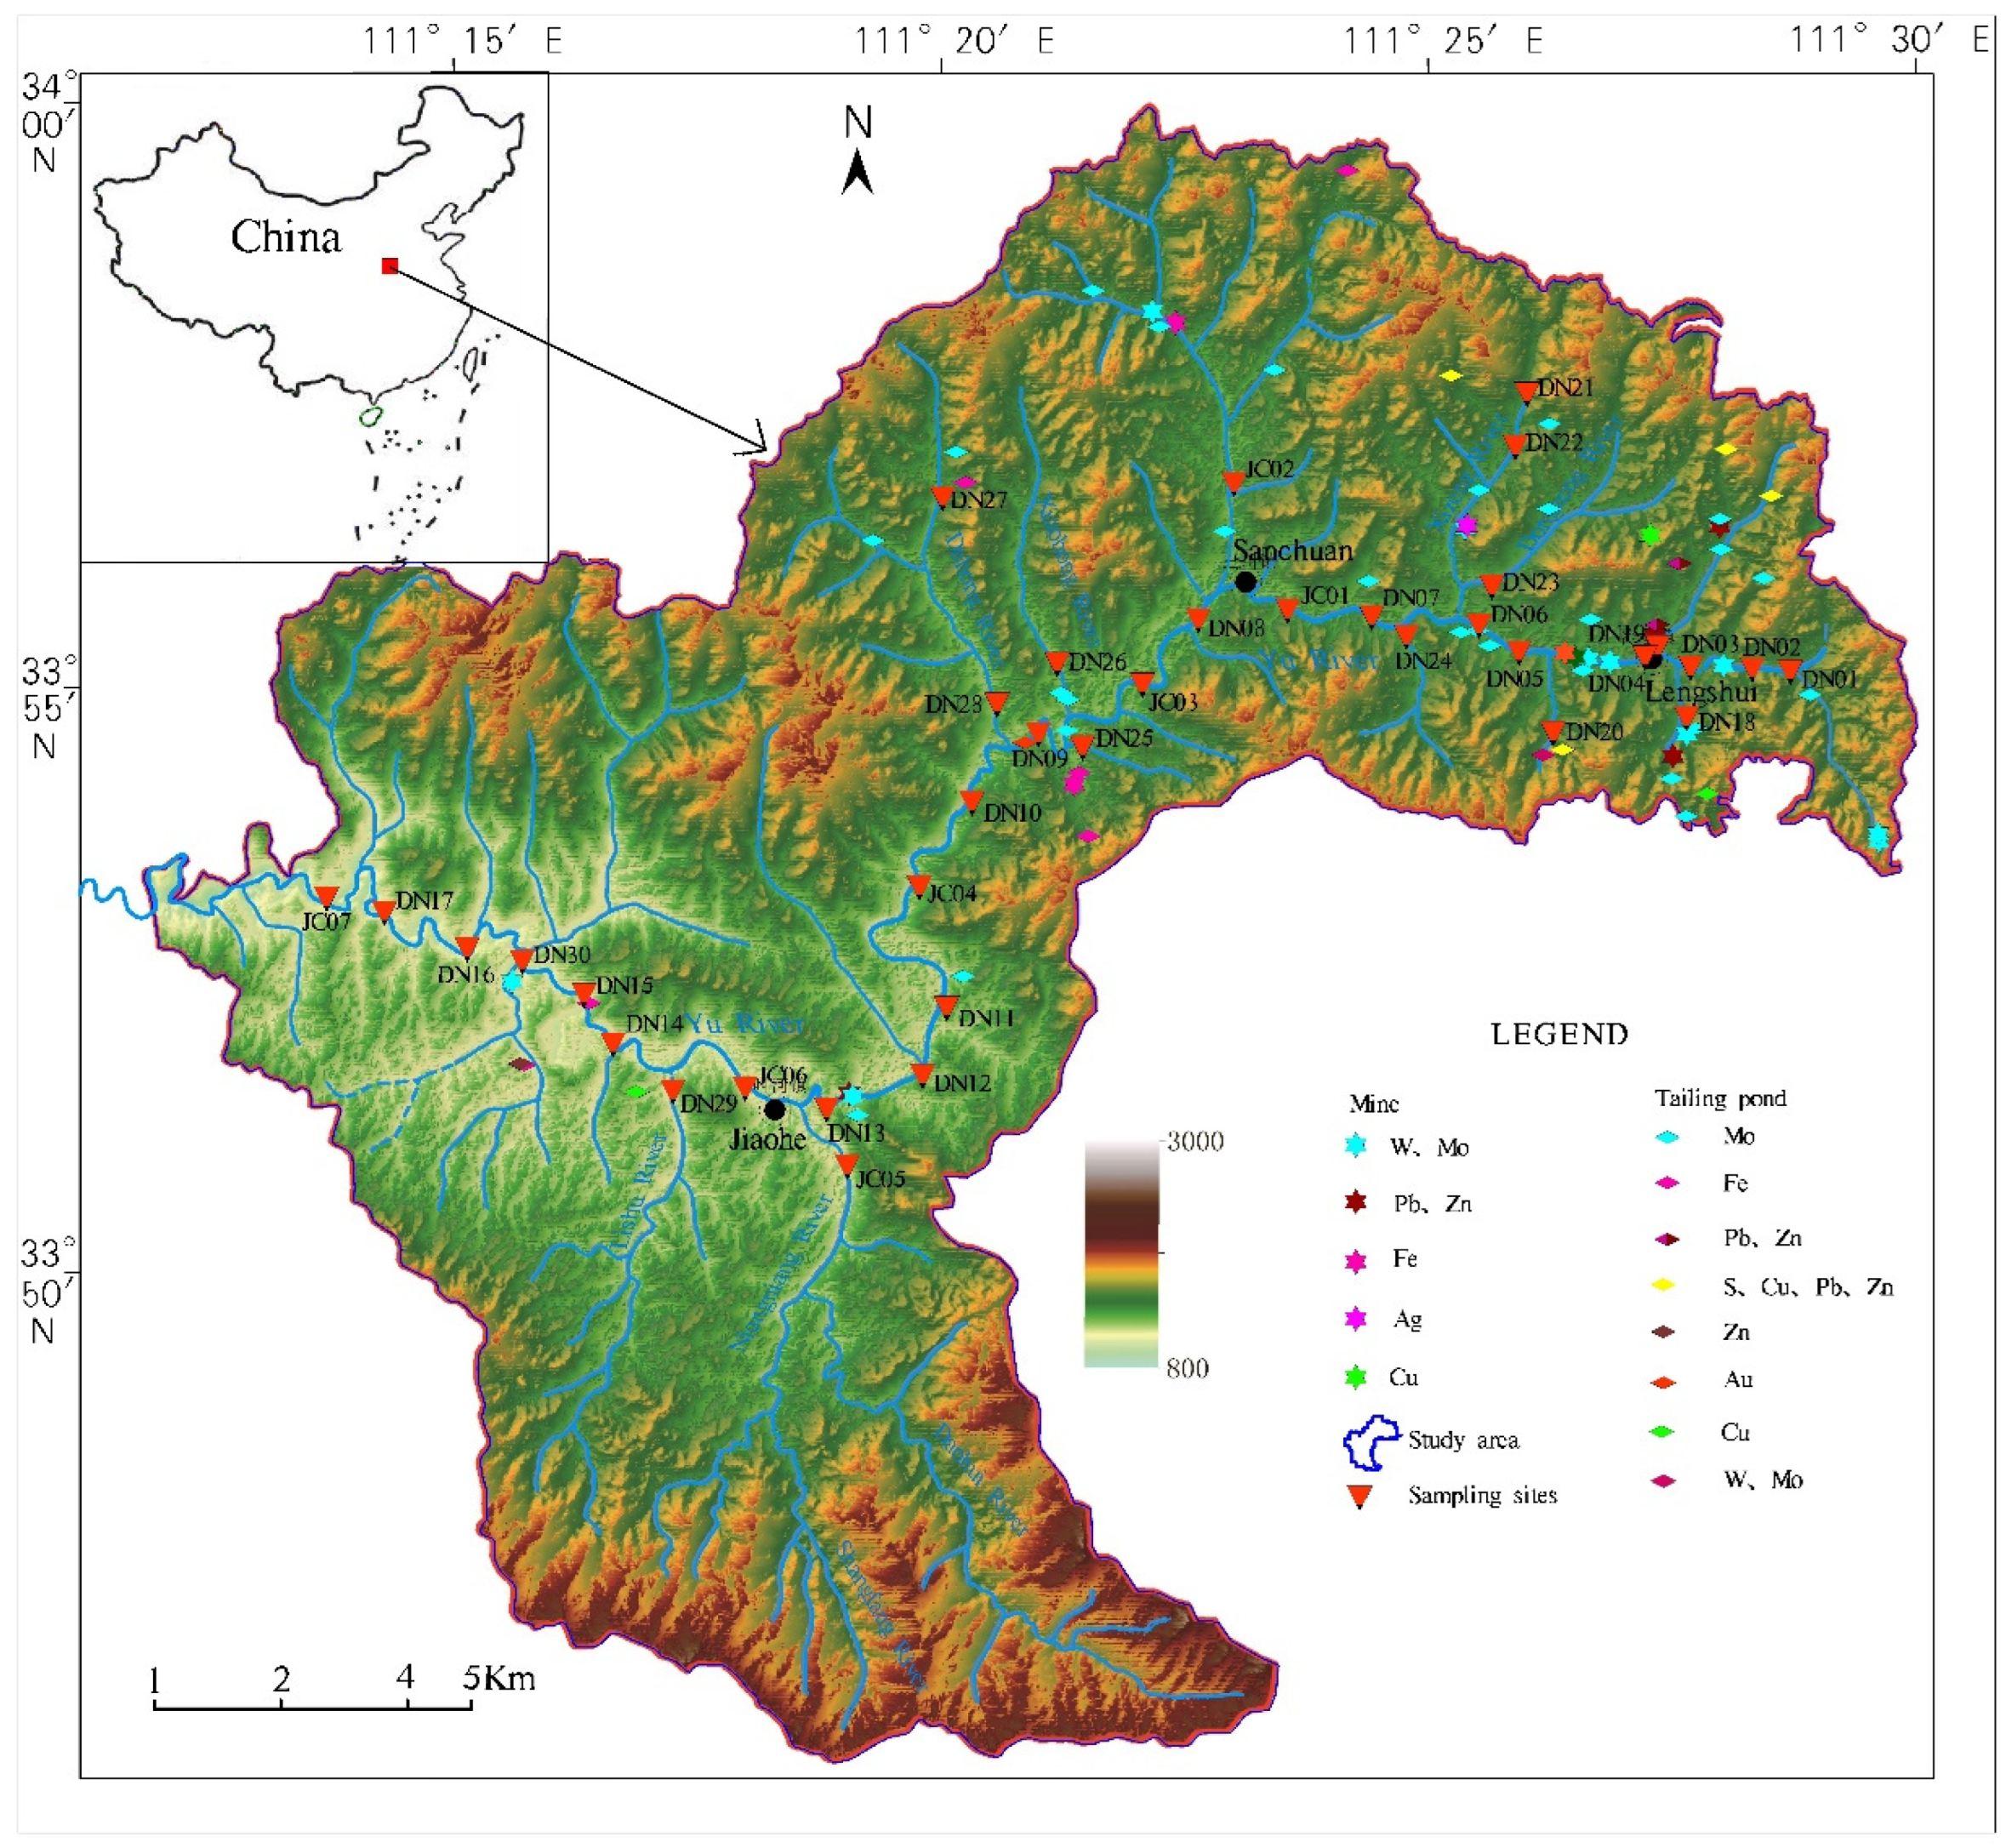
2.1. Study Area and Sampling

The Yu River begins in Luanchan city, Henan Province, China, flows from east to west, and finally into the Danjiangkou Reservoir, which is an important water source for the South–North Water Transfer Project in China (Figure 1). Thus, heavy metal concentrations in sediments of the Yu River are related to the drinking water safety for a large number of people in northern China. In the upstream region of the Yu River, molybdenum (Mo) and tungsten (W) deposits are present, and mining activities have been performed intensively for a long time. It is a world-class porphyry-Skarn-type Mo-W deposit, with Mo and W being the main deposits, containing abnormal developments of Pb, Zn, Au, Ag and Cu, and associated abnormal developments of Sn, Hg, Ni and Co [12,23]. The region has a warm temperate continental monsoon climate, with an average annual temperature and rainfall of 13.4 °C and 964.7 mm, respectively.
Sediments from a total of 24 sampling sites (9 in the upstream region and 15 in the downstream region) were collected along the mainstream of the Yu River in August (HWP) and December (LWP) 2022 and April 2023 (FWP). In the upstream region, more mines have been intensively explored, and many tailing ponds are located along the Yu River. In the downstream region, mining activity strength was obviously weaker than that in the upstream region. To identify the sources of heavy metals in the sediments, 13 sediments from the tributaries of the Yu River were also collected during HWP, LWP and FLP, respectively. The sediment samples were air-dried, sieved through with a 200-mesh polyethylene sieve, and subsequently stored in polyethylene Ziploc bags before further use.

2.2. Chemical Analysis

About 0.1 g sediment samples were digested with 3 mL of HNO3, 1 mL of HClO4 and 1 mL of HF in closed Teflon vessels for 5 h at 165 °C. After cooling, the vessels were transferred to an electric hot plate (160 °C) to eliminate silicon and any remaining HF. After the white smoke disappeared, samples were removed from the heat, and 1 mL of HNO3 was added. The samples were adjusted to 10 mL with ultrapure water. Mo and W were determined using polarography methods (POL, JP-2D, Chengdu, China) after digestion. Cr, Cu, Zn, Cd and Pb were determined via inductively coupled plasma mass spectrometry (ICP-MS) (Agilent 7900, Tokyo, Japan) after digestion using the same method used for Mo and W. As and Hg were determined using an atomic fluorescence spectrophotometer (AFS) (AFS-8330, Beijing, China). To ensure analytical quality, geochemical standard soil samples (GSS-1 and GSS-2) provided by the National Research Center for Geoanalysis of China were used to validate the analytical method. The recoveries of the standard samples ranged from 90% to 110%.

2.3. Accumulation Risk Assessment for Heavy Metals in the Soil

The geo-accumulation index (Igeo), which compares the heavy metal contents of soils with background values, was used to quantify heavy metal pollution using the following equation [24]:
Igeo = log2(Cn/1.5Bn)
where Cn is the measured concentration of heavy metal n, Bn is the background value of metal n, and 1.5 is the background matrix correlation factor due to lithogenic variation. The background values of Mo, Cd, Hg, As, Cr, Cu, Pb, W and Zn in the soil used to calculate Igeo were 0.98, 0.187, 0.036, 7.92, 75.8, 29.6, 31.6, 2.99 and 101.4 mg/kg, respectively [22]. The background value of Henan Province for W, 2.99 mg/kg, was used to calculate Igeo [25]. Igeo calculations were classified into seven categories: unpolluted, Igeo < 0; unpolluted to moderately polluted, 0 ≤ Igeo < 1; moderately polluted, 1 ≤ Igeo < 2; moderately to heavily polluted, 2 ≤ Igeo < 3; heavily polluted, 3 ≤ Igeo < 4; heavily to extremely polluted, 4 ≤ Igeo < 5; and extremely polluted, Igeo ≥ 5.

2.4. Assessment of Potential Ecological Risk

The ecological risk index (RI) proposed by Hakanson [26] was utilized to quantitatively assess the potential ecological risk of heavy metals in sediments. The RI is defined as follows:
E r i = T r i × C f i = T r i × C s i / C n i
R I = i = 1 n E r i
where C s i is the measured concentration of the heavy metal “i” in the sediments, C n i is the background value of the metal “i”, C f i is the single heavy metal pollution factor, E r i is the RI of an individual heavy metal, and T r i is the biological toxicity factor of the heavy metal, which is defined for Mo, Cr, W, Cu, Zn, As, Cd, Pb and Hg as 15, 2, 1, 5, 1, 10, 30, 5 and 40, respectively [15,27,28]. Five categories were classified according to the E r i value: low potential risk, E r i < 40; moderate potential risk, 40 ≤ E r i <80; considerable potential risk, 80 ≤  E r i < 160; high potential risk, 160 ≤  E r i < 320; and very high potential risk, 320 ≤  E r i . The following four categories were classified according to the RI value: low risk, RI < 130; moderate risk, 130 ≤ RI < 260; considerable risk, 260 ≤ RI < 520; and very high risk, 520 ≤ RI. The threshold of the RI was adjusted based on the number of heavy metals and their toxicity [26].

2.5. Multivariate Statistical Analysis

Statistical analyses were performed with the statistical software package SPSS version 20.0, Origin 2021 and Excel. Pearson’s correlation and principal component analyses (PCAs) were carried out. In a PCA, principal components were calculated based on the correlation matrix, and VARIMAX normalized rotation was employed to clearly identify the sources of heavy metals. A two-way hierarchical cluster was also conducted. In the two-way hierarchical cluster, the cluster method was group average, and the distance type was Pearson correlation.

3. Results

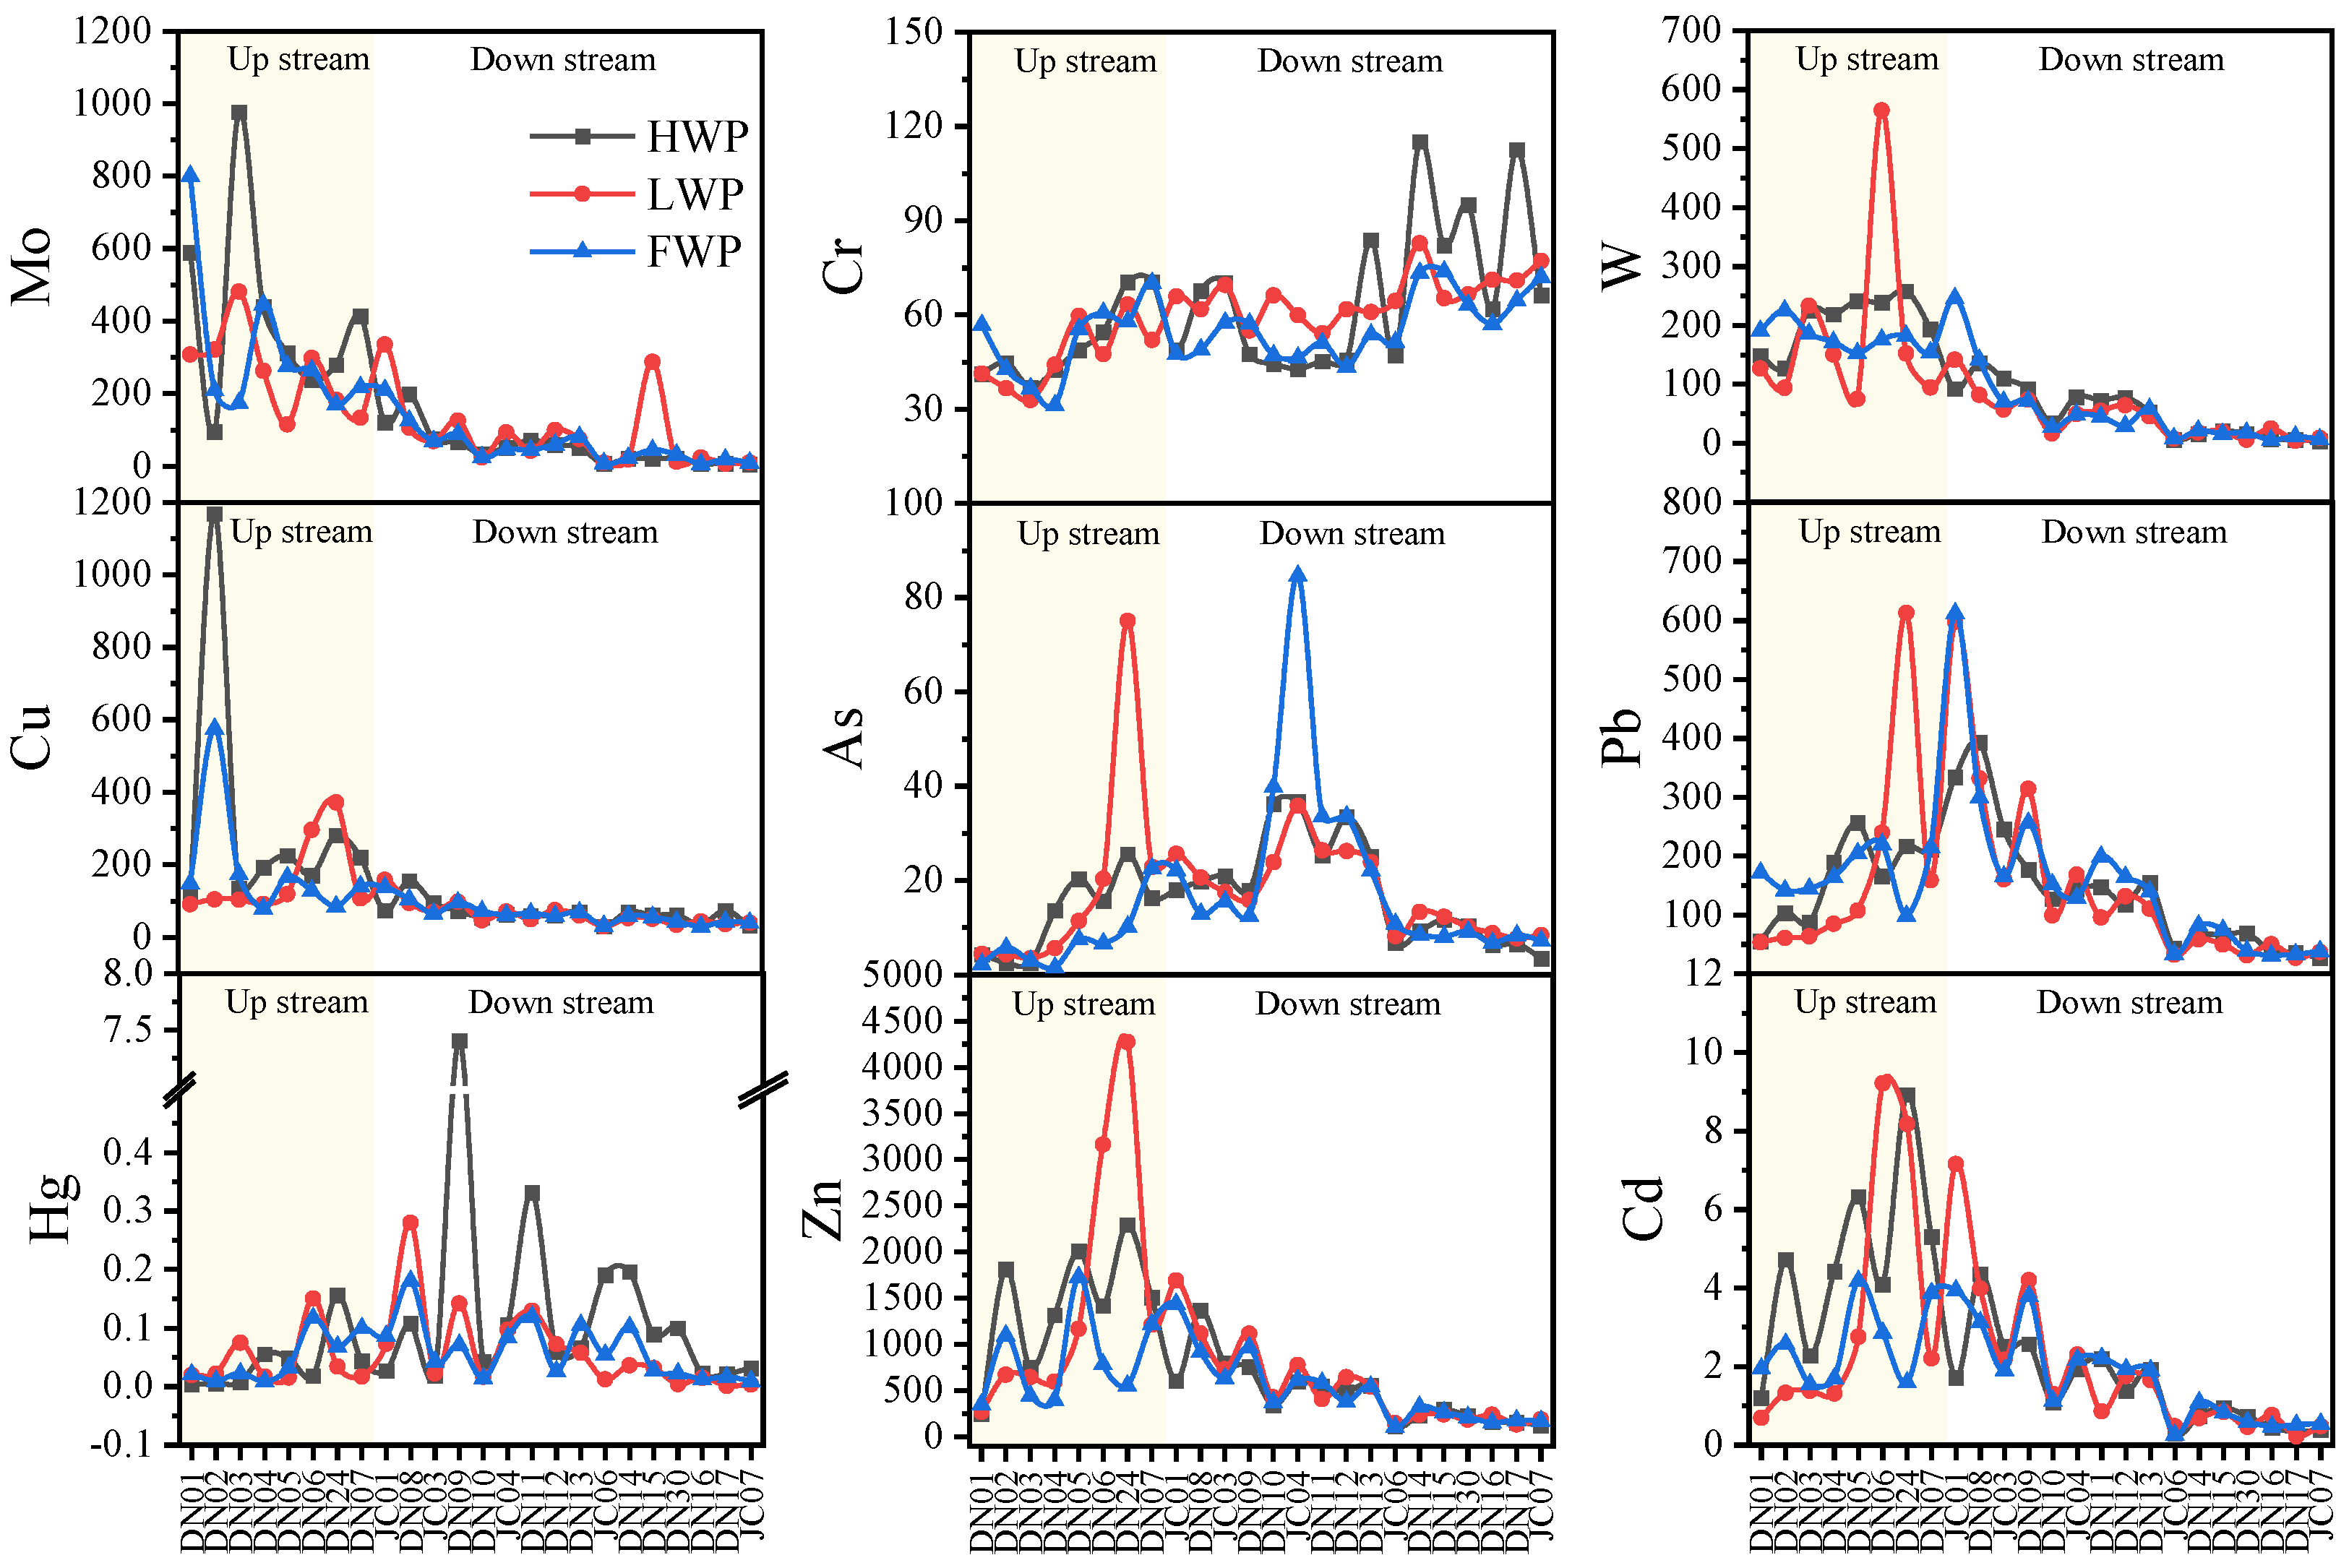
3.1. Characteristics of Heavy Metals in Sediments

The concentrations of heavy metals in sediments of the Yu River are shown in Table 1. For HWP, the mean concentrations of Mo, Cr, W, Cu, Zn, As, Cd, Pb and Hg in the upstream sediments of the Yu River, including the mainstream and tributaries, were 295.0 ± 246.8, 49.0 ± 10.9, 167.7 ± 73.9, 218.8 ± 277.5, 1181.4 ± 807.6, 15.1 ± 11.4, 4.0 ± 2.7, 158.1 ± 99.4 and 0.042 ± 0.038 mg/kg, respectively. In the downstream sediments, which included 15 samples from the mainstream and 7 samples from the tributaries, the mean concentrations of Mo, W, Cu, Zn and Cd were lower than those in the upstream sediments, with values of 288.8 ± 1164.2, 57.2 ± 95.6, 114.4 ± 254.9, 411.0 ± 326.2 and 1.6 ± 2.1 mg/kg, respectively. The mean concentrations of As, Pb and Hg were higher than those in the upstream sediments because the DN27 site near a tailing pond in the downstream region was severely affected by these metals. The CV values of various heavy metals ranged between 0.22~1.27 and 0.33~4.03 for the upstream and downstream regions, respectively, indicating significant variability in the concentrations of some heavy metals in the sediments.
For LWP, the concentrations of most heavy metals in the upstream sediments were greater than those in the downstream sediments, with values of 216.4 ± 136.6, 48.9 ± 9.2, 155.9 ± 130.6, 138.4 ± 108.8, 1318.2 ± 1193.7, 23.0 ± 25.3, 3.44 ± 3.01, 188.4 ± 192.3 and 0.045 ± 0.036 mg/kg for Mo, Cr, W, Cu, Zn, As, Cd, Pb and Hg, respectively. Most heavy metals in the downstream sediments had lower concentrations than those in the upstream sediments, such as Mo (121.4 ± 306.3 mg/kg), W (30.2 ± 26.5 mg/kg), Cu (60.3 ± 40.8 mg/kg), Zn (400.2303.9 mg/kg), Cd (1.32 ± 1.16 mg/kg) and Pb (124.0 ± 124.3 mg/kg). The concentrations of Cr, As and Hg in the downstream sediments, with mean values of 65.3 ± 8.6, 27.7 ± 40.1 and 0.052 ± 0.065 mg/kg, respectively, were comparable to those in the upstream sediments.
In the upstream sediments, Mo, Cr, W, Cu, Zn, As, Cd, Pb and Hg ranged between 52.2~800.9, 29.8~70.1, 27.1~315.6, 42.9~575.4, 173.6~2378.3, 1.5~54.9, 0.45~9.32, 30.2~612.1 and 6.6~422.4 mg/kg, respectively, during FWP. The mean values followed the order Zn (935.0 ± 640.7 mg/kg) > Mo (257.2 ± 191.5 mg/kg) > Pb (183.0 ± 135.7 mg/kg) > W (174.6 ± 68.5 mg/kg) > Cu (160.7 ± 137.1 mg/kg) > Cr (49.7 ± 12.7 mg/kg) > As (12.3 ± 14.2 mg/kg) > Cd (3.12 ± 2.20 mg/kg) > Hg (0.072 ± 0.107 mg/kg). The concentrations of most heavy metals in the downstream sediments were lower than those in the upstream sediments, which is consistent with the results of HWP and LWP. It is worth noting that, except for Cr, the mean concentrations of all heavy metals in the sediments during three sampling seasons were higher than the background values, indicating heavy metal accumulation to some extent.

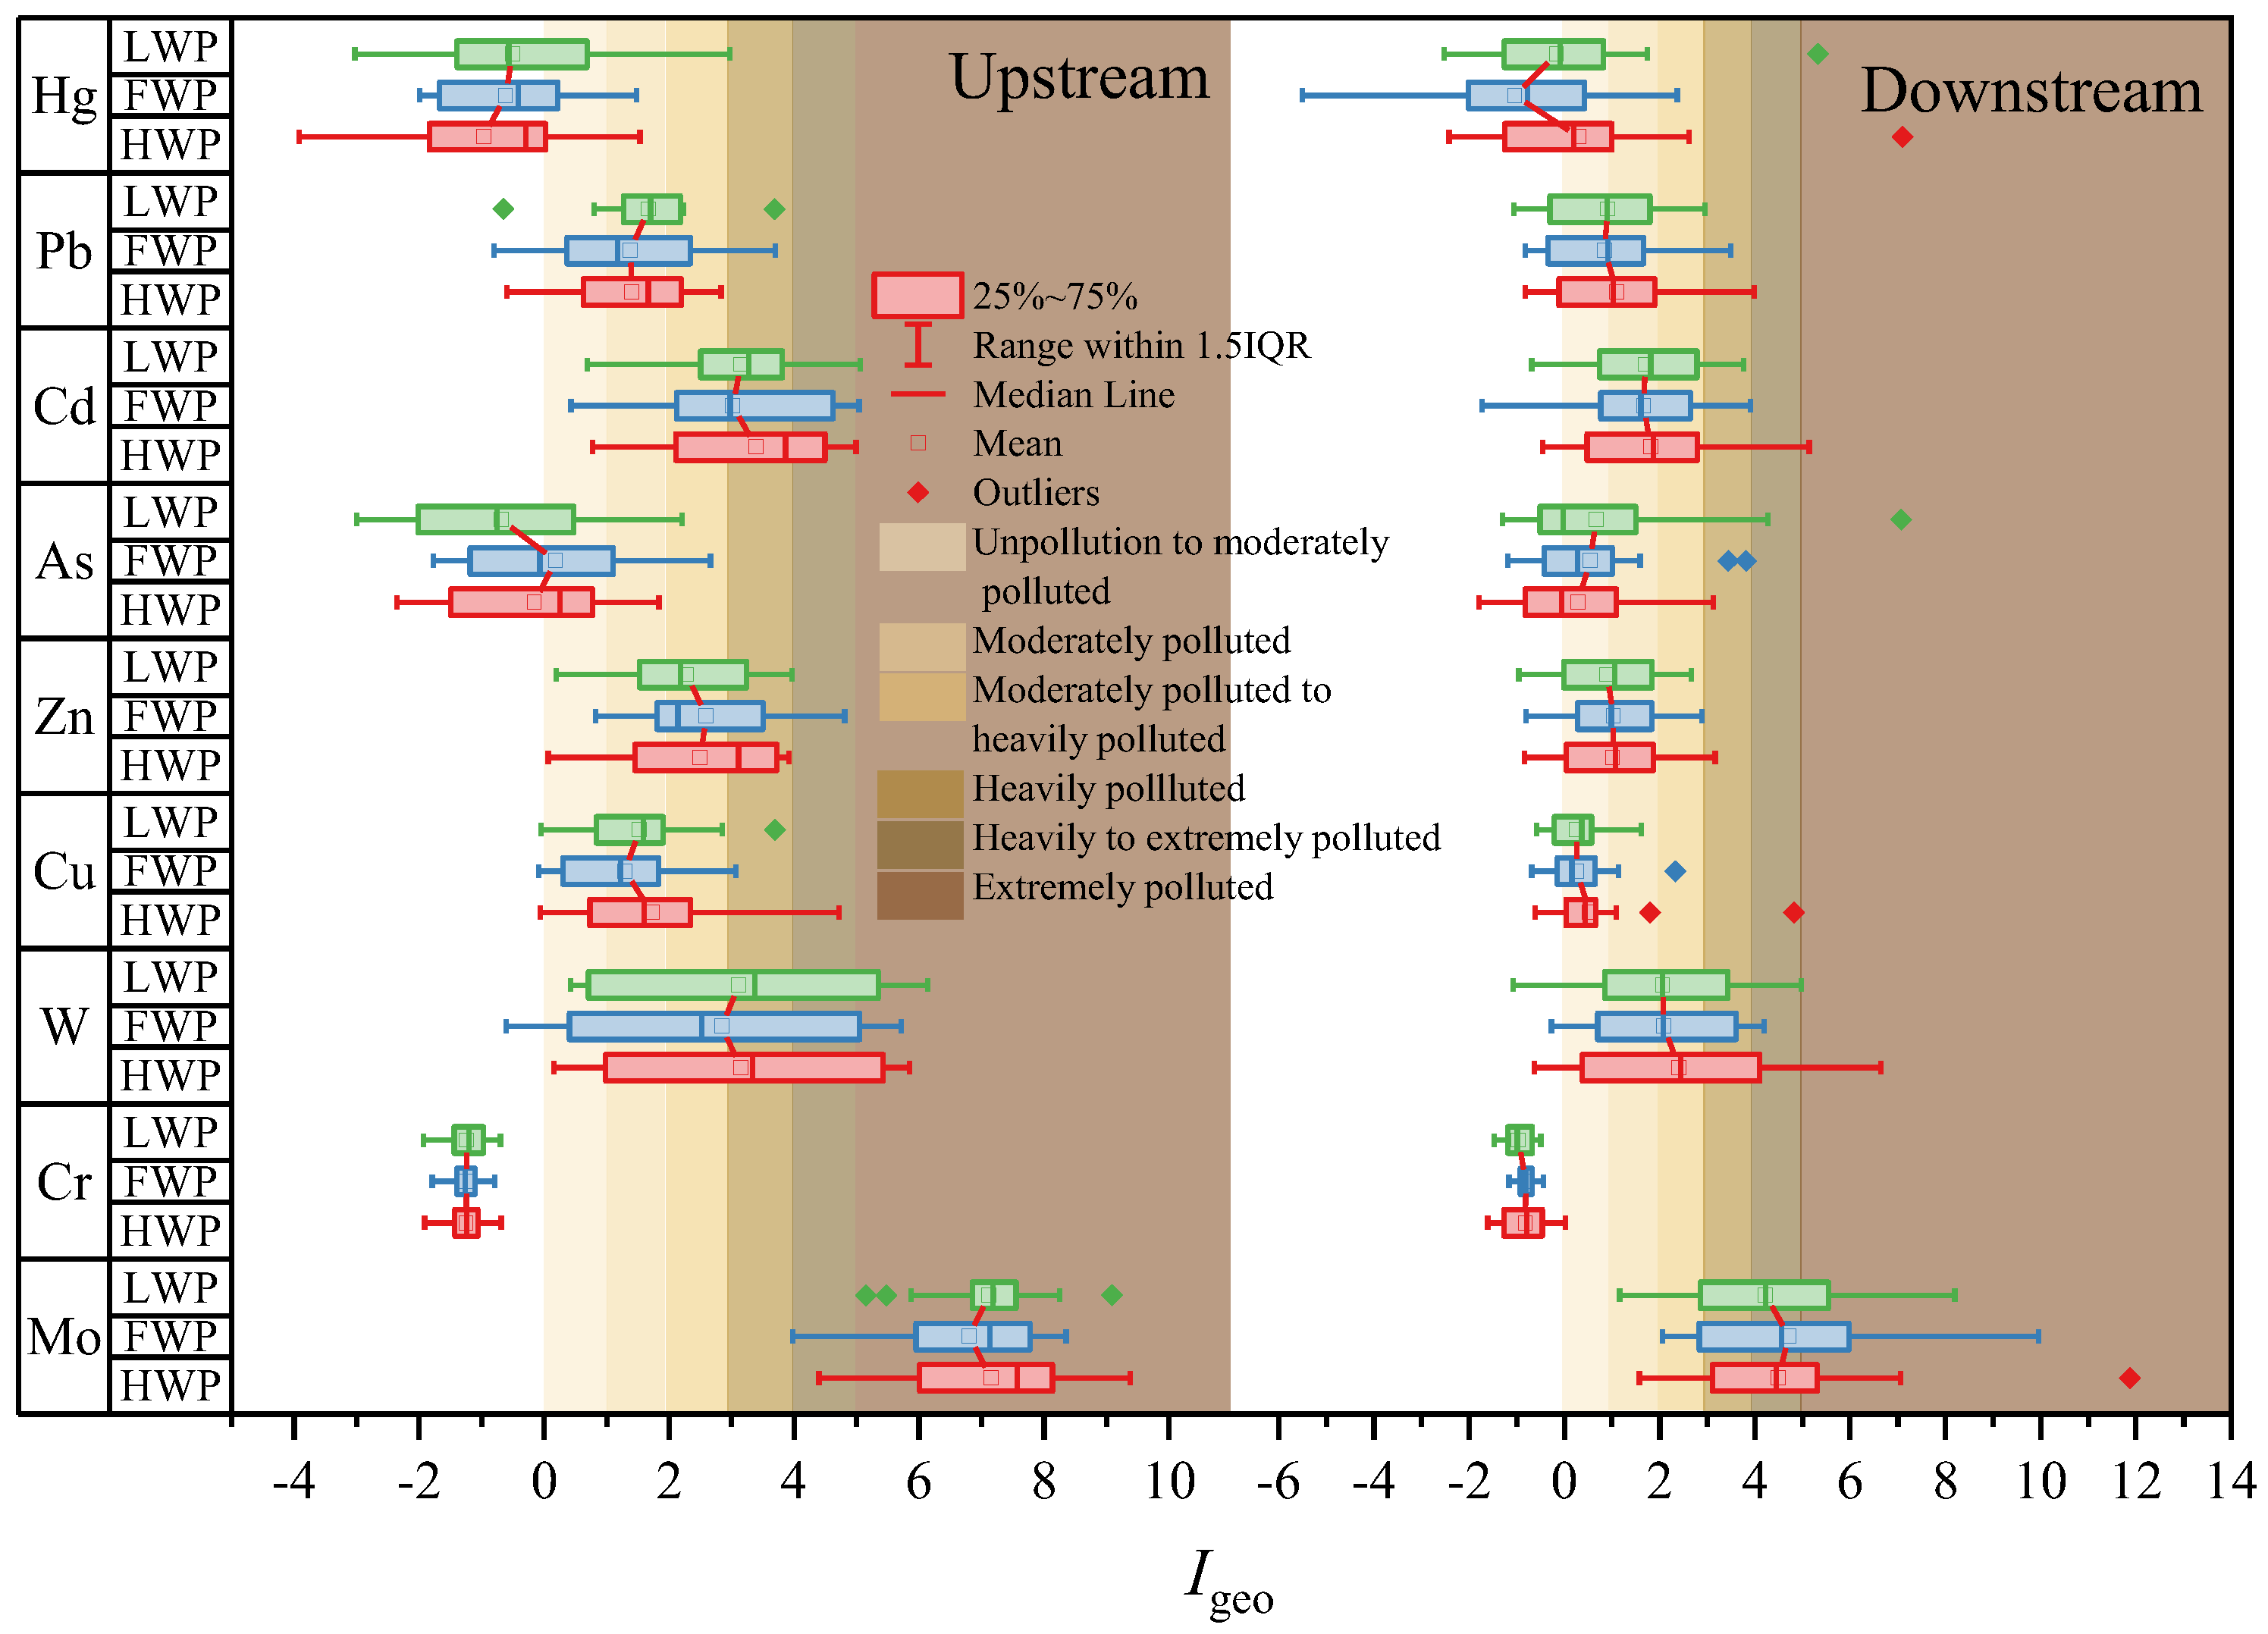
3.2. Environmental Risk Assessment

The results of Igeo for the Yu River are shown in Figure 2. During HWP, the Igeo values decreased in the following order: Mo (7.2 ± 1.3) > Cd (3.4 ± 1.3) > W (3.1 ± 2.2) > Zn (2.5 ± 1.3) > Cu (2.3 ± 2.6) > Pb (1.4 ± 1.1) > Hg (−1.0 ± 1.5) > As (−0.2 ± 1.4) > Cr (−1.2 ± 0.3) and Mo (4.5 ± 2.2) > W (2.4 ± 2.0) > Cd (1.8 ± 1.5) > Pb (1.1 ± 1.4) > Zn (1.1 ± 1.2) > Cu (0.5 ± 1.1) > As (0.3 ± 1.4) ≈ Hg (0.3 ± 2.0) > Cr (−0.8 ± 0.5). For LWP and FWP, the orders of the Igeo values of all heavy metals were both consistent with those for HWP. Mo, Cd, W, Zn, Pb and Cu had higher Igeo values, indicating that they were the main pollutants in the sediments. Furthermore, the Mo pollution level in most upstream sediments reached an extremely polluted level (Igeo > 5). Generally, upstream sediments were polluted more heavily by heavy metals than downstream sediments due to intensive mining activities being conducted in the upstream region. A strong variation of Igeo values was also found for the main pollutant heavy meals, such as Mo, W and Cd, indicating that some sampling sites were significantly affected by tailings or mining drains.
Potential ecological risk was assessed using the Er and RI values, in which the toxicity of various heavy metals was considered (Figure 3). The Er mean values of Mo in the upstream sediments were 4515.4 ± 3778.3, 311.9 ± 2090.5 and 3937.5 ± 2930.8 for HWP, LWP and FWP, respectively. The Er mean values of Mo in the downstream sediments were lower than those in the upstream sediments, with values of 4419.8 ± 178818.7, 1857.4 ± 4688.7 and 857.2 ± 1380.2 for HWP, LWP and FWP, respectively. Extremely high Er values of Mo suggested very high potential ecological risk. Cd is another heavy metal that poses a high ecological risk in the Yu River sediments. The Er values of Cd in the upstream sediments ranged between 77.1~1430.4, 60.6~1478.2 and 72.4~1494.7 for HWP, LWP and FWP, respectively. Except for HWP, the Er values of Cd in the downstream region during LWP and FWP, ranging between 13.6~672.8 and 27.9~608.7, were lower than those in the upstream region. Notably, site DN27 contained very high amounts of Cd (9.90 mg/kg) during HWP, indicating very high potential ecological risk, with an Er value of 1588.0. Generally, a considerable number of sampling sites reached a very high risk level (Er > 320) for Cd. Except for W, As and Hg, which had higher Er values in some sediments, the Er values of Cr, Cu, Zn and Pb were almost all lower than 80 indicating low potential risk or moderate potential risk. The mean RI values of upstream sediments were 5346.5 ± 3784.7, 4062.4 ± 2216.7 and 4658.9 ± 2903 for HWP, LWP and FWP, respectively. For the downstream sediments, the RI values were lower than those for the upstream sediments, with mean values of 5244.6 ± 18271.5, 2207.8 ± 4804.3 and 1404.4 ± 1948.7 during HWP, LWP and FWP, respectively. The RI values of all sampling sites upstream and the majority of sampling sites downstream were higher than 520, indicating very high ecological risk, which was attributed to high concentrations of Mo and Cd in the sediments.

4. Discussion

4.1. Temporal–Spatial Variations and Migration of Heavy Metals in Sediments

The concentrations of heavy metals in mainstream sediments fluctuated from upstream to downstream (Figure 4). The main pollutants, i.e., Mo, Cd, W, Zn, Pb and Cu, exhibited similar patterns along the Yu River during three sampling seasons. Some sites, such as DN02, DN05, DN06 and DN24, had higher concentrations of heavy metals during various water periods. These sites were all near tailing ponds or open pits and were strongly affected by mining activities. The results were consistent with other studies, in which high heavy metal concentrations were observed in the sediments near mines [11,13,14,29]. Although the Hg pattern was similar to that of the other pollutants, several different sites were found, such as DN09, which was near a Au tailing pond. The Hg concentration in the DN09 sediments was extremely high, with a value of 7.405 mg/kg for HWP. Hg is often used to extract gold in amalgamation, which induces extremely high concentrations in soils and sediments [31]. Hg pollution near Au mines was therefore reported by other studies [32,33]. The obvious effect of mining activities on heavy metal concentrations in sediments can also be demonstrated by some abnormal values for heavy metals in tributary sediments. Sediment samples from DN18, DN19 and DN27 in tributaries, which were all collected near tailing ponds, were severely polluted by heavy metals. For example, the Mo concentrations from DN27 were extremely high, with values of 5498, 1463 and 432 mg/kg for HWP, LWP and FWP, respectively. As concentrations fluctuated slightly along the river, ranging between 2.5~36.6 mg/kg, 3.5~75.1 mg/kg and 1.5~84.7 mg/kg for HWP, LWP and FWP, respectively, and extremely high concentrations of As were not be observed. Cr concentrations in sediments slightly changed along the river, and were comparable to the background value, indicating that Cr mainly originated from rock weathering [34]. In conclusion, heavy metal concentrations in the upstream sediments were higher than those in the downstream sediments resulting from intensive mining activities. The concentrations of Zn, Pb and Cu in the sediments in the present study were higher than those in the sediments near a W mine along the Taojing River, China and near a Au mine along the Tajum River, Indonesia [13,29]. However, the concentrations of Cr, Cu, Zn and Cd in sediments of the Lom River near a Au mine were apparently higher than those in the present study, with the highest values of 3226, 521, 556 and 8.6 mg/kg, respectively [11]. The pollution levels of Cu, As and Cd were lower than those in sediments of the Jishui River, which is located in a polymetallic ore concentration area (Pb/Zn mine, Au mine and Cu mine) in China [14]. The results indicate that heavy metal pollution in the sediments in mining areas is indeed more severe than that in sediments that are not near mines, such as in the sediments of the Ganga River in India [30]. Meanwhile, the pollution level depends on the intensity of mining activities and mine types.
For the different sampling seasons, especially for the upstream region, completely consistent distribution patterns of heavy metals were not observed. Generally, during HWP, intensive rainfall results in high runoff and is expected to wash more heavy metals from soils or tailings into the river [18]. However, heavy metals, especially W, As, Pb and Zn, did not show higher concentrations in the sediments during HWP. Some sites, such as DN03 and DN14, contained more Mo during HWP, whereas the Mo concentration at site DN01 was highest during FWP. In addition, W, Cd and Hg in DN06 and Cu, Zn, As and Pb in DN24 were higher during LWP than during HWP and FWP. In the downstream region, obvious temporal variation of heavy metals in sediments were not found, except for in several sites, such as DN09, DN11, JC06 and DN14 for Hg and JC04 for As. The results indicate that the temporal variation of heavy metals in upstream sediments near mines depends on the intensity of various mining activities. In addition, incidental pollution events are probably another reason for the temporal variation of heavy metals [15].
The migration of heavy metals in sediments partly depends on the river flow, as a higher river flow can lead to sediment resuspension and affect the migration of heavy metals in sediments [21,35]. Nevertheless, an apparent migration of heavy metals in sediments was not observed in the present study. For example, high concentrations of heavy metals (except Cr) can be found at site DN27 near two tailing ponds. The Mo concentrations in DN27 were 5498, 1463 and 432 mg/kg for HWP, LWP and FWP, respectively. However, the sediment from DN28, which was about 600 m away from site DN27, contained significantly lower Mo concentrations (54.8, 64.4 and 17.8 mg/kg for HWP, LWP and FWP, respectively). Dramatically decreasing concentrations of other heavy metals, such as W, Cu and Cd, were also found from DN27 to DN28. The results indicate that the mobility of Mo, W, Cu and Cd were not very strong. Notably, Zn, As, Pb and Hg did not all decrease from DN27 to DN28. During LWP, increasing concentrations of Zn (from 272 mg/kg to 361 mg/kg), As (from 129 mg/kg to 167 mg/kg) and Pb (from 142 mg/kg to 150 mg/kg) were observed. The Hg concentration in the DN28 sediment was significantly higher than that in the DN27 sediment during FWP. The results suggest that, except for the tailing ponds near DN27, other anthropogenic sources may result in high concentrations of Zn, As, Pb and Hg in DN28. Heavy metals in rivers can migrate as suspended particulate or in dissolved form [16,21]. The runoff distribution in the Yu River is extremely uneven, and the volume of flow in the upstream region is very low, which causes weak sediment resuspension and erosion [18]. Clear surface water at most sampling sites was also observed during sampling, indicating little suspended particulate matter in the river water. Thus, it can be inferred that suspended particle matter as a carrier of heavy metals is not the main mechanism of heavy metal migration in the Yu River. The results are inconsistent with those of other previous studies [15,16]. Although some higher concentrations of heavy metals were found in the sediments during HWP, the dramatic decreases in heavy metal concentrations at the same sites were observed during LWP and FWP. It was concluded that a comparable portion of heavy metals in the sediments existed in a mobile form, such as an exchangeable form, and the migration of heavy metals in sediments mainly occurred in dissolved form.

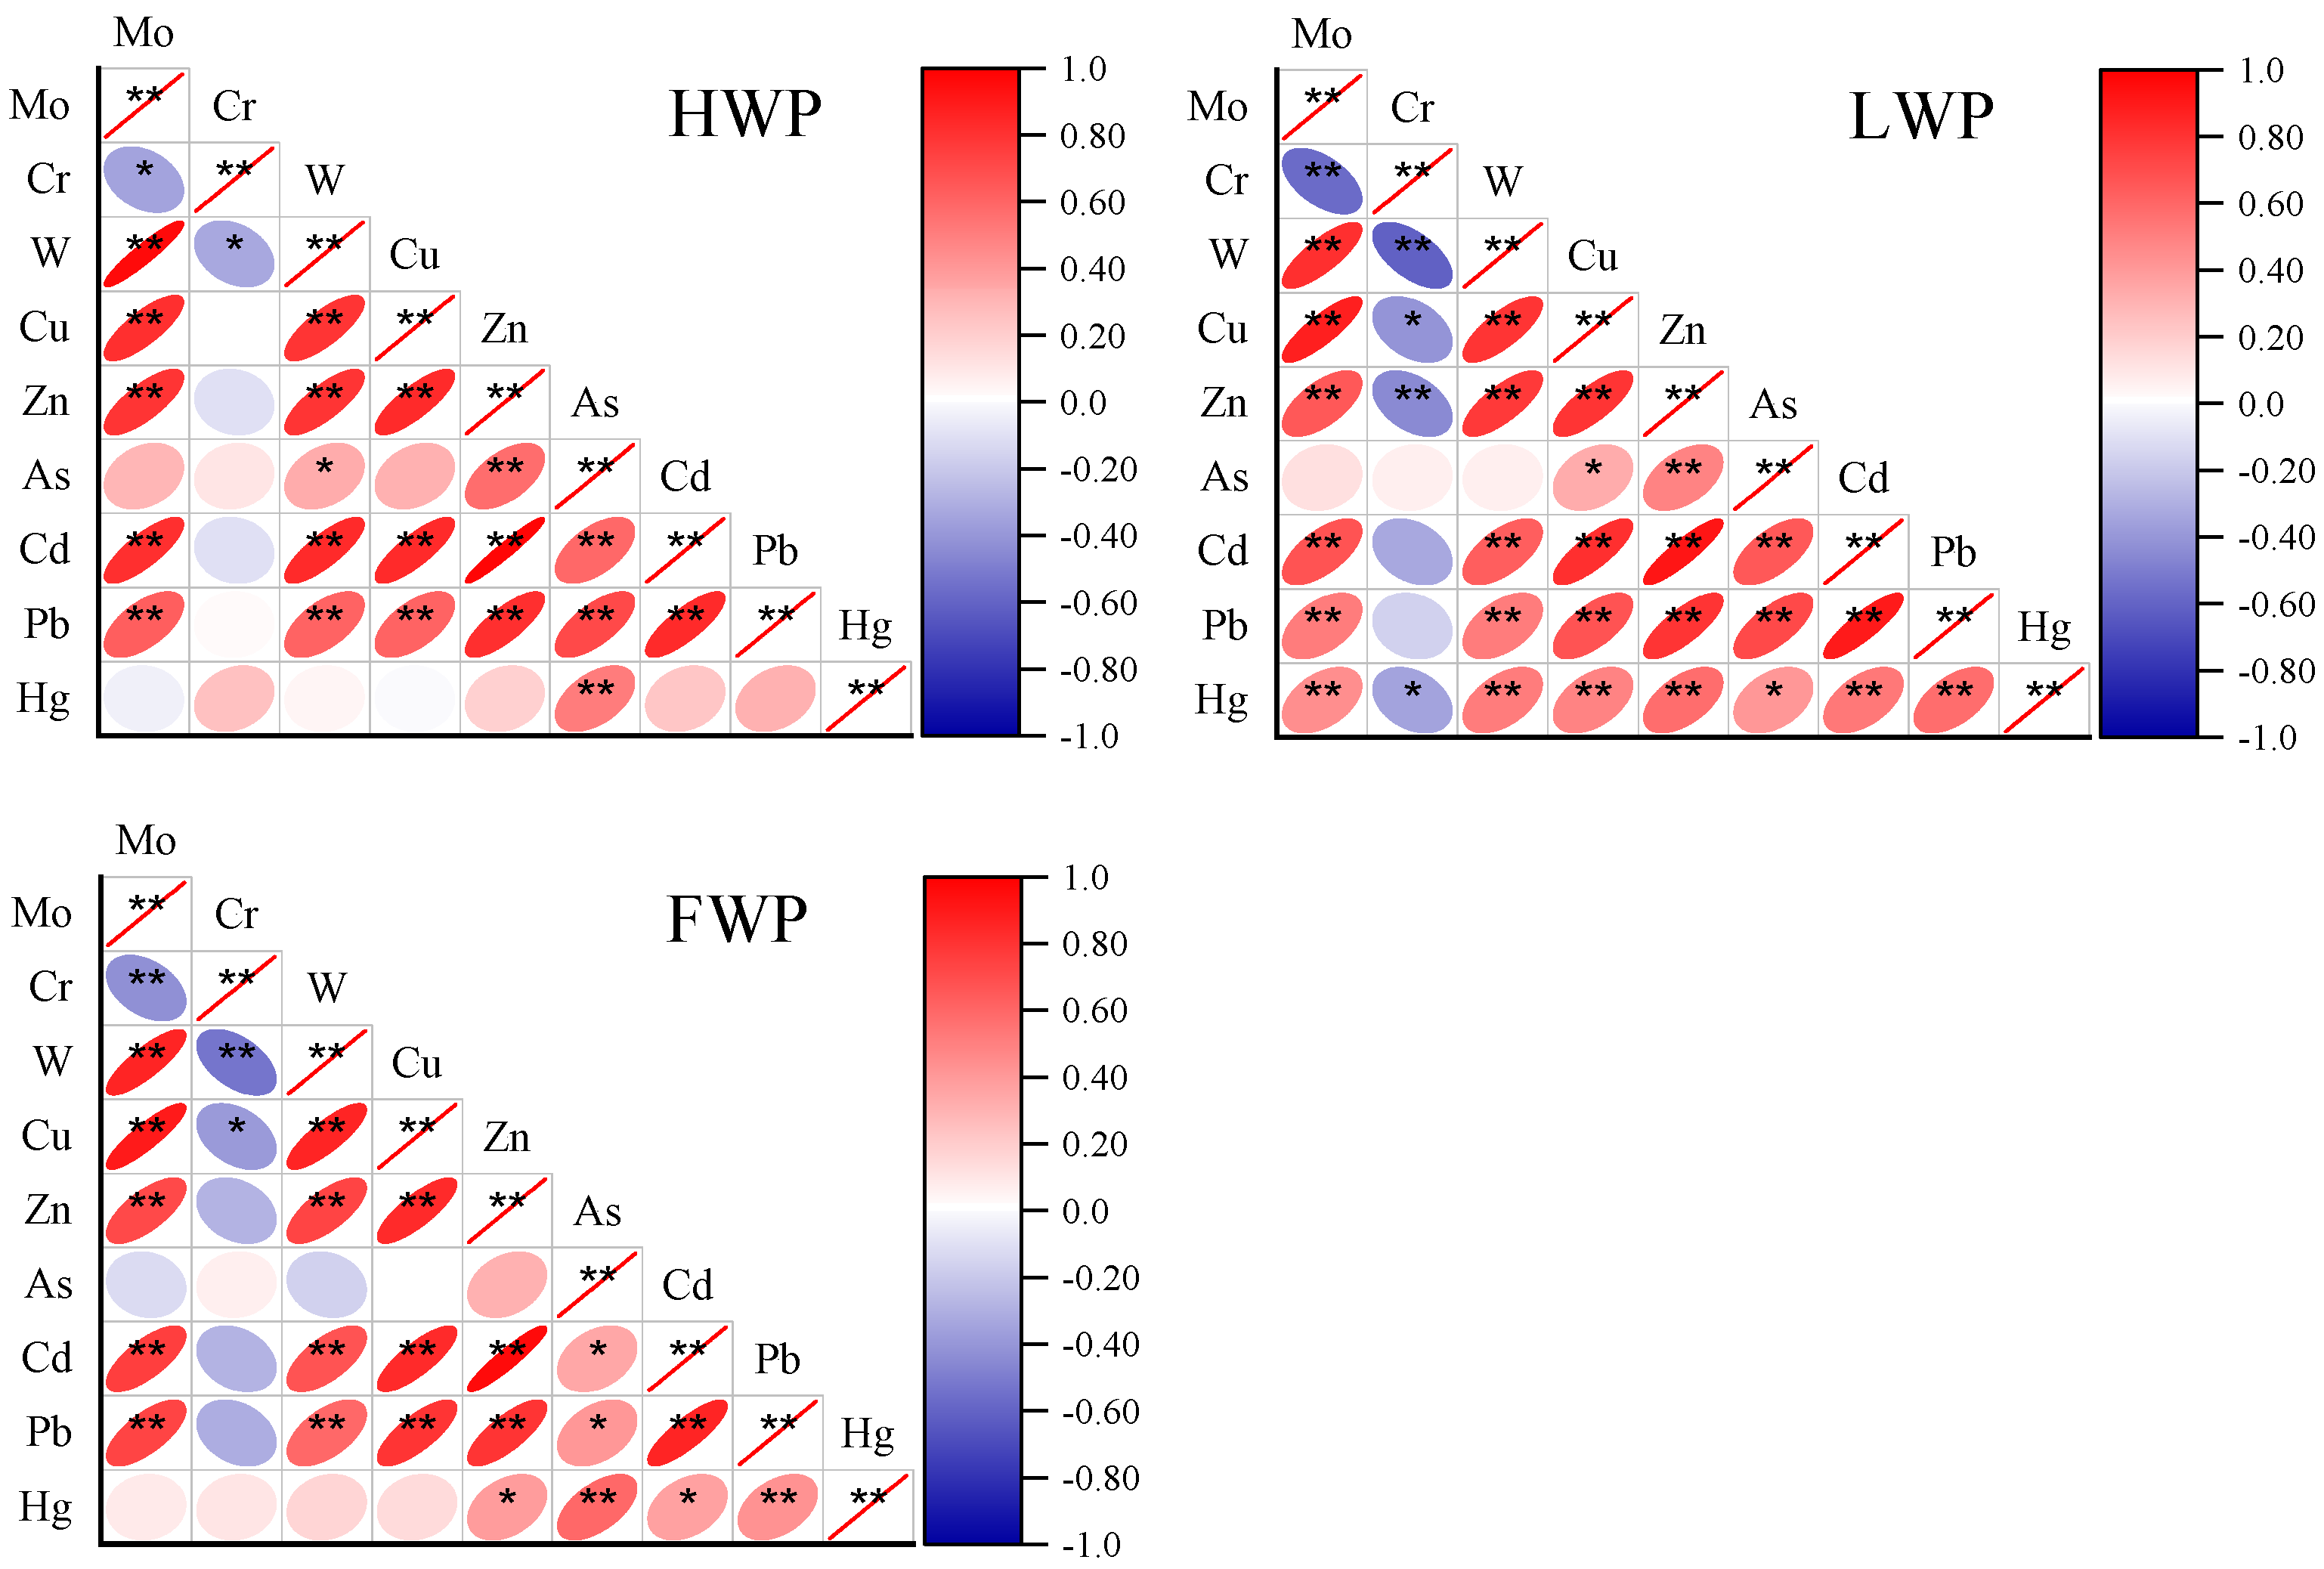
4.2. Source Apportionment of Heavy Metals in Sediments

Most heavy metals in the sediments exhibited significant correlations (Figure 5). During HWP, Mo significantly correlated with Cr, W, Cu, Zn, Cd and Pb (p < 0.05), suggesting similar or closely related sources of these heavy metals [4,36]. Cr both negatively and significantly correlated with Mo and W (p < 0.05), but a significant correlation was not observed between Cr and other heavy metals. As significantly correlated with only W, Zn and Hg (p < 0.05), and Hg significantly correlated with only As (p < 0.01). High correlation levels among Cr, As and Hg indicated that at least some portions of them were derived from the same sources. During LWP and FWP, similar correlations among heavy metals were found with those during HWP. However, Hg significantly correlated with other heavy metals (p < 0.05) during LWP, and Hg significantly correlated with Zn, As, Cd and Pb (p < 0.05) during FWP.
A PCA was also carried out to further identify the sources of heavy metals in the sediments (Table 2). A total of four principal components were obtained for the three sampling seasons, and the extracted principal components explained 83.67%, 86.34% and 81.53% of the variances for HWP, LWP and FWP, respectively (Table 2 and Table S1), indicating that the extracted principal components included sufficient information and that the results are credible. For HWP, PC1, which explained 47.93% of the variance, consisted of Mo, Cu, As and Pb. PC2 included W, Zn and Cd and accounted for 14.49% of the total variance. Cr and Hg were assigned to the third and fourth principal components (PC3 and PC4), respectively. Four components were also obtained for LWP. Cu, Zn, Cd and Pb were clustered into PC1, accounting for 47.15% of the total variance. PC2 explained 14.96% of the total variance and represented Cr and W. Mo and As were represented by PC3 and explained 14.74% of the total variance. Like for HWP, only Hg was in PC4 and explained the lowest portion of the variance (9.48%). With regard to FWP, PC1 and PC4 represented Cu, Zn, Cd and Pb and Hg, accounting for 43.17% and 11.28%, respectively, which was consistent with that of LWP. However, Mo was grouped into PC2 with Cr and W, accounting for 14.60%, and only As was grouped into PC3, accounting for 12.48%.
In the study area, about forty tailing ponds are scattered along the Yu River, and the majority of them are Mo tailing ponds. The polymetallic deposit is a world-class porphyry-Skarn-type Mo/W deposit, with Mo and W being the main deposits. W, Cu, Pb and As are the primary associated elements of the ores [12]. Moreover, at the sites near Mo tailing ponds, such as DN07 and DN27, Mo, Cu, Pb, As and W concentrations were very high. Therefore, it can be concluded that Mo, Cu, Pb and As in PC1 for HWP, Mo and As in PC3 for LWP and Mo, Cr and W in PC1 for FWP had the same source, i.e., the Mo/W mines.
PC2 (W, Zn and Cd) for HWP; PC1 (Cu, Zn, Cd and Pb) for LWP; and PC1 (Cu, Zn, Cd and Pb) for FWP, which had similar heavy metals, suggested the same pollution source. In the upstream tributary, the sediment at DN19 near a Pb/Zn tailing pond had higher concentrations of heavy metals, especially Cu, Zn, Pb and Cd. In addition, Cd, Pb and Zn were always concentrated together near Pb/Zn mines [37]. Therefore, PC2 for HWP, PC1 for LWP and PC1 for FWP were mainly attributed to the Pb/Zn mines.
Only Hg was in PC4 for various water periods. The sediment from DN09, about 100 m away from a Au mine, had high Hg concentrations, with values of 7.405, 0.142 and 0.071 mg/kg for HWP, LWP and FWP, respectively. Hg, which is used to extract gold in amalgamation, is one of the main sources of pollution in mine environments [31]. High Hg concentrations are often found in the sediments or soils near Au mines [32,33]. Thus, Au mines and related mining activities were the sources of Hg in the sediments of this study area.
Generally, Cr is a geogenic element in mine areas and was found in other studies [34]. Moreover, the concentrations of Cr in the sediments during various seasons were comparable with the background values and fluctuated less along the river. The results indicated that Cr mainly originated from rock weathering. Notably, W during LWP and Mo and W during FWP were grouped into the same principal component with Cr. The studied area is a metallogenic geological body of Mo and W deposits, and the background values of Mo and W are relatively high [12]. The results suggested that Cr in PC3 for HWP; Cr and W in PC2 for LWP; and Cr, Mo and W in PC2 for FWP were geogenic elements.
A two-way hierarchical cluster was conducted to cluster heavy metals and sampling sites into different groups (Figure 6). Four groups of heavy metals were obtained for the three seasons. The hierarchical cluster result for HWP was consistent with that of the PCA. For LWP, W, Cu, Zn, Cd and Pb were clustered into the same groups through the hierarchical cluster, while W and Cr were grouped into one group based on the result of the PCA. The W coefficients in PC1 and PC2 were 0.615 and 0.647, respectively (Table 2), indicating that a considerable portion of W had the same sources as Cu, Zn, Cd and Pb. For FWP, Mo, W, Cu, Zn, Cd and Pb were clustered together through the two-way hierarchical cluster, and Cr, As and Hg were clustered into the other three groups. Although the PCA grouped Mo, W and Cr together (PC2), considerable portions of Mo and W belonged to PC1. Generally, the results of the hierarchical cluster and PCA were similar, which further proves that the results are credible and reasonable. Two groups of the sampling sites were obtained through the two-way hierarchical cluster for each sampling season. Notably, the majority of sampling sites in the upstream region were grouped together, and most sampling sites in the downstream region were divided into another group. The number of sampling sites in the same groups were different, which was attributed to the temporal variation of some heavy metal concentrations (Figure 6).

5. Conclusions

Sediments of the Yu River in the Luanchuan polymetallic ore concentration area were collected in different seasons to comprehensively understand the heavy metal migration processes and sources apportionment of heavy metals. It was found that heavy metals in the sediments of the Yu River were polluted heavily by various types of mines. Mo, Cd, W, Zn, Pb and Cu were the main pollutants. At some sites, high Hg concentrations in sediments were also observed. Generally, sediments in the upstream region of the Yu River, which experiences stronger mine exploration, accumulated more heavy metals during different seasons. Consistent patterns of heavy metals in sediments during different seasons, especially upstream, were not found. The temporal–spatial variations of heavy metal concentrations in the sediments indicated that a dissolved form of the heavy metals may be the primary way of heavy metal migration in the Yu River. It is necessary to monitor point sources of heavy metals, i.e., tailing ponds, to cope with incidental pollution events in a timely manner. Igeo, Er and RI values were used to assess pollution level and ecological risk. The results indicate that Mo in the upstream sediments showed an extremely polluted level and high ecological risk. Mo/W mines, Pb/Zn mines and Au mines were responsible for various heavy metals in the sediments, and Cr in the sediments mainly originated from rock weathering. The accurate management of environmental protection must be conducted based on the clear source identification of heavy metals in the Yu River. This study can contribute to the sustainability of the mining industry in the studied area and to the formulation of science-based remediation and protection strategies for the Yu River.

Supplementary Materials

The following supporting information can be downloaded at: https://www.mdpi.com/article/10.3390/su16031154/s1, Table S1: Total variance of explained and rotated component matrix for total concentrations of heavy metals in sediments of The Yu River.

Author Contributions

H.B. designed the study and drafted the manuscript; G.L. conceptualized, revised, edited and refined the manuscript; D.C., Z.X., Y.W. and Y.Z. contributed to the collection and determination of the samples; J.W. contributed to the interpretation of the results and editing of the manuscript. All authors have read and agreed to the published version of the manuscript.

Funding

This work was financially supported by the Geological Environment Research Project of the Henan Provincial Bureau of Geo-exploration and Mineral Development (YUDIHUAN [2022]2).

Institutional Review Board Statement

Not applicable.

Informed Consent Statement

Not applicable.

Data Availability Statement

The data presented in this study are available on request from the corresponding author.

Conflicts of Interest

Authors Heling Bai, Danli Chen and Zhengsong Xing were employed by the company Henan Province Institute of No. 3 Geological Exploration Co., Ltd. The remaining authors declare that the research was conducted in the absence of any commercial or financial relationships that could be construed as a potential conflict of interest.

References

  1. Usman, Q.A.; Muhammad, S.; Ali, W.; Yousaf, S.; Jadoon, I.A.K. Spatial distribution and provenance of heavy metal contamination in the sediments of the Indus River and its tributaries, North Pakistan: Evaluation of pollution and potential risks. Environ. Technol. Innov. 2021, 21, 101184. [Google Scholar] [CrossRef]
  2. Nguyen, B.T.; Do, D.D.; Nguyen, T.X.; Nguyen, V.N.; Phuc Nguyen, D.T.; Nguyen, M.H.; Thi Truong, H.T.; Dong, H.P.; Le, A.H.; Bach, Q.-V. Seasonal, spatial variation, and pollution sources of heavy metals in the sediment of the Saigon River, Vietnam. Environ. Pollut. 2020, 256, 113412. [Google Scholar] [CrossRef] [PubMed]
  3. Pavlychenko, A.; Kovalenko, A.; Pivnyak, G.; Bondarenko, V.; Kovalevs’ka, I.; Illiashov, M.K. The investigation of rock dumps influence to the levels of heavy metals contamination of soil. Min. Miner. Depos. 2013, 237, 238. [Google Scholar]
  4. Algül, F.; Beyhan, M. Concentrations and sources of heavy metals in shallow sediments in Lake Bafa, Turkey. Sci. Rep. 2020, 10, 11782. [Google Scholar] [CrossRef] [PubMed]
  5. Tang, J.; He, M.; Luo, Q.; Adeel, M.; Jiao, F. Heavy metals in agricultural soils from a typical mining city in China: Spatial distribution, source apportionment, and health risk assessment. Pol. J. Environ. Stud. 2020, 29, 1379–1390. [Google Scholar] [CrossRef] [PubMed]
  6. Punia, A. Role of temperature, wind, and precipitation in heavy metal contamination at copper mines: A review. Environ. Sci. Pollut. Res. 2021, 28, 4056–4072. [Google Scholar] [CrossRef]
  7. Chen, T.; Wen, X.; Zhou, J.; Lu, Z.; Li, X.; Yan, B. A critical review on the migration and transformation processes of heavy metal contamination in lead-zinc tailings of China. Environ. Pollut. 2023, 338, 122667. [Google Scholar] [CrossRef]
  8. Kusin, F.M.; Azani, N.N.M.; Hasan, S.N.M.S.; Sulong, N.A. Distribution of heavy metals and metalloid in surface sediments of heavily-mined area for bauxite ore in Pengerang, Malaysia and associated risk assessment. CATENA 2018, 165, 454–464. [Google Scholar] [CrossRef]
  9. Zheng, X.; Lu, Y.; Xu, J.; Geng, H.; Li, Y. Assessment of heavy metals leachability characteristics and associated risk in typical acid mine drainage (AMD)-contaminated river sediments from North China. J. Clean. Prod. 2023, 413, 137338. [Google Scholar] [CrossRef]
  10. Willscher, S.; Pohle, C.; Sitte, J.; Werner, P. Solubilization of heavy metals from a fluvial AMD generating tailings sediment by heterotrophic microorganisms: Part I: Influence of pH and solid content. J. Geochem. Explor. 2007, 92, 177–185. [Google Scholar] [CrossRef]
  11. Elvine Paternie, E.D.; Hakkou, R.; Ekengele Nga, L.; Bitom Oyono, L.D.; Ekoa Bessa, A.Z.; Oubaha, S.; Khalil, A. Geochemistry and geostatistics for the assessment of trace elements contamination in soil and stream sediments in abandoned artisanal small-scale gold mining (Bétaré-Oya, Cameroon). Appl. Geochem. 2023, 150, 105592. [Google Scholar] [CrossRef]
  12. Yao, L.; Liu, Y.; Yang, K.; Xi, X.; Niu, R.; Ren, C.; Wang, C. Spatial-temporal analysis and background value determination of molybdenum concentration in basins with high molybdenum geochemical background—A case study of the upper Yi River basin. J. Environ. Manag. 2021, 286, 112199. [Google Scholar] [CrossRef]
  13. Budianta, W. Heavy metal pollution and mobility of sediment in Tajum River caused by artisanal gold mining in Banyumas, Central Java, Indonesia. Environ. Sci. Pollut. Res. 2021, 28, 8585–8593. [Google Scholar] [CrossRef] [PubMed]
  14. Tao, L.; Liu, G.; Liu, X.; Zhang, C.; Cheng, D.; Wang, A.; Li, R. Trace metal pollution in a Le’an River tributary affected by non-ferrous metal mining activities in Jiangxi Province, China. Chem. Ecol. 2014, 30, 233–244. [Google Scholar] [CrossRef]
  15. Fan, J.; Jian, X.; Shang, F.; Zhang, W.; Zhang, S.; Fu, H. Underestimated heavy metal pollution of the Minjiang River, SE China: Evidence from spatial and seasonal monitoring of suspended-load sediments. Sci. Total Environ. 2021, 760, 142586. [Google Scholar] [CrossRef] [PubMed]
  16. Wang, J.; Liu, G.; Wu, H.; Zhang, T.; Liu, X.; Li, W. Temporal-spatial variation and partitioning of dissolved and particulate heavy metal(loid)s in a river affected by mining activities in Southern China. Environ. Sci. Pollut. Res. 2018, 25, 9828–9839. [Google Scholar] [CrossRef]
  17. Hanfi, M.Y.; Mostafa, M.Y.A.; Zhukovsky, M.V. Heavy metal contamination in urban surface sediments: Sources, distribution, contamination control, and remediation. Environ. Monit. Assess. 2019, 192, 32. [Google Scholar] [CrossRef]
  18. Song, Y.; Ji, J.; Mao, C.; Yang, Z.; Yuan, X.; Ayoko, G.A.; Frost, R.L. Heavy metal contamination in suspended solids of Changjiang River—environmental implications. Geoderma 2010, 159, 286–295. [Google Scholar] [CrossRef]
  19. Liu, C.; Fan, C.; Shen, Q.; Shao, S.; Zhang, L.; Zhou, Q. Effects of riverine suspended particulate matter on post-dredging metal re-contamination across the sediment–water interface. Chemosphere 2016, 144, 2329–2335. [Google Scholar] [CrossRef] [PubMed]
  20. Zou, X.; Li, Y.; Wang, L.; Ahmed, M.K.; Chen, K.; Wu, J.; Xu, Y.; Lin, Y.; Xiao, X.; Chen, B.; et al. Distribution and assessment of heavy metals in suspended particles in the Sundarban mangrove river, Bangladesh. Mar. Pollut. Bull. 2022, 181, 113856. [Google Scholar] [CrossRef]
  21. Liu, S.; Yu, F.; Lang, T.; Ji, Y.; Fu, Y.; Zhang, J.; Ge, C. Spatial distribution of heavy metal contaminants: The effects of water-sediment regulation in the Henan section of the Yellow River. Sci. Total Environ. 2023, 892, 164568. [Google Scholar] [CrossRef]
  22. Chen, D.; Liu, G.; Xing, Z.; Lu, W.; Pan, F.; Xu, J.; Zhao, Y. Accumulation and Source Apportionment of Soil Heavy Metals in Molybdenum-Lead-Zinc Polymetallic Ore Concentration Area of Luanchuan (in Chinese). Rock Miner. Anal. 2023, 42, 839–851. [Google Scholar]
  23. Zhang, Z.; Wang, G.; Ma, Z.; Carranza, E.J.M.; Jia, W.; Du, J.; Tao, G.; Deng, Z. Batholith-stock scale exploration targeting based on multi-source geological and geophysical datasets in the Luanchuan Mo polymetallic district, China. Ore Geol. Rev. 2019, 118, 103225. [Google Scholar] [CrossRef]
  24. Muller, G. Index of geoaccumulation in sediments of the Rhine River. Geojournal 1969, 2, 108–118. [Google Scholar]
  25. CNEMC. The Backgrounds of Soil Environment in China; China Environment Science Press: Beijing, China, 1990. [Google Scholar]
  26. Hakanson, L. An ecological risk index for aquatic pollution control.a sedimentological approach. Water Res. 1980, 14, 975–1001. [Google Scholar] [CrossRef]
  27. Niu, L.; Li, J.; Luo, X.; Fu, T.; Chen, O.; Yang, Q. Identification of heavy metal pollution in estuarine sediments under long-term reclamation: Ecological toxicity, sources and implications for estuary management. Environ. Pollut. 2021, 290, 118126. [Google Scholar] [CrossRef] [PubMed]
  28. Zheng, X.-J.; Chen, M.; Wang, J.-F.; Li, F.-G.; Liu, Y.; Liu, Y.-C. Ecological Risk Assessment of Heavy Metals in the Vicinity of Tungsten Mining Areas, Southern Jiangxi Province. Soil Sediment Contam. Int. J. 2020, 29, 665–679. [Google Scholar] [CrossRef]
  29. Chen, M.; Li, F.; Tao, M.; Hu, L.; Shi, Y.; Liu, Y. Distribution and ecological risks of heavy metals in river sediments and overlying water in typical mining areas of China. Mar. Pollut. Bull. 2019, 146, 893–899. [Google Scholar] [CrossRef] [PubMed]
  30. Siddiqui, E.; Pandey, J. Assessment of heavy metal pollution in water and surface sediment and evaluation of ecological risks associated with sediment contamination in the Ganga River: A basin-scale study. Environ. Sci. Pollut. Res. 2019, 26, 10926–10940. [Google Scholar] [CrossRef] [PubMed]
  31. Pinedo-Hernández, J.; Marrugo-Negrete, J.; Díez, S. Speciation and bioavailability of mercury in sediments impacted by gold mining in Colombia. Chemosphere 2015, 119, 1289–1295. [Google Scholar] [CrossRef]
  32. Gao, Z. Evaluation of heavy metal pollution and its ecological risk in one river reach of a gold mine in Inner Mongolia, Northern China. Int. Biodeterior. Biodegrad. 2018, 128, 94–99. [Google Scholar] [CrossRef]
  33. Leiva Guzmán, M.; Morales, S. Environmental assessment of mercury pollution in urban tailings from gold mining. Ecotoxicol. Environ. Saf. 2013, 90, 167–173. [Google Scholar] [CrossRef] [PubMed]
  34. Zhang, Z.; Lu, Y.; Li, H.; Tu, Y.; Liu, B.; Yang, Z. Assessment of heavy metal contamination, distribution and source identification in the sediments from the Zijiang River, China. Sci. Total Environ. 2018, 645, 235–243. [Google Scholar] [CrossRef] [PubMed]
  35. Xie, M.; Alsina, M.A.; Yuen, J.; Packman, A.I.; Gaillard, J.-F. Effects of resuspension on the mobility and chemical speciation of zinc in contaminated sediments. J. Hazard. Mater. 2019, 364, 300–308. [Google Scholar] [CrossRef]
  36. Islam, M.S.; Hossain, M.B.; Matin, A.; Islam Sarker, M.S. Assessment of heavy metal pollution, distribution and source apportionment in the sediment from Feni River estuary, Bangladesh. Chemosphere 2018, 202, 25–32. [Google Scholar] [CrossRef]
  37. Anju, M.; Banerjee, D. Multivariate statistical analysis of heavy metals in soils of a Pb–Zn mining area, India. Environ. Monit. Assess. 2012, 184, 4191–4206. [Google Scholar] [CrossRef]
Figure 1. Locations of the study area and sampling sites.
Sustainability 16 01154 g001
Figure 2. Igeo values of heavy metals in sediments of the Yu River.
Sustainability 16 01154 g002
Figure 3. Assessment of potential ecological risk in sediments of the Yu River.
Sustainability 16 01154 g003
Figure 4. Variations of heavy metals in the mainstream sediments of the Yu River.
Sustainability 16 01154 g004
Figure 5. Pearson correlations of heavy metals in the mainstream sediments of the Yu River. * Correlation is significant at the 0.05 level (two-tailed). ** Correlation is significant at the 0.01 level (two-tailed).
Sustainability 16 01154 g005
Figure 6. Two-way hierarchical cluster analysis for the heavy metals and sampling sites.
Sustainability 16 01154 g006
Table 1. Concentrations of heavy metals in sediments (mg/kg).
Sampling PeriodsLocationStatistical ValuesMoCrWCuZnAsCdPbHg
HWPUp stream (n = 15)Min31.030.228.142.5159.32.30.531.30.004
Max976.470.5257.71168.82299.042.48.9337.20.157
Mean295.049.0167.7218.81181.415.14.0158.10.042
SD246.810.973.9277.5807.611.42.799.40.038
CV0.840.220.441.270.680.760.680.630.910
Down stream (n = 22)Min4.437.32.929.184.93.40.226.80.010
Max5497.6115.1448.01249.01366.1104.09.9747.27.405
Mean288.867.857.2114.4411.023.11.6164.80.415
SD1164.222.195.6254.9326.227.22.1190.71.563
CV4.030.331.672.230.791.181.281.163.770
LWPUp stream (n = 15)Min23.132.924.141.8268.53.50.3827.20.014
Max481.065.9564.7371.94273.475.19.21613.10.151
Mean216.448.9155.9138.41318.223.03.44188.40.045
SD136.69.2130.6108.81193.725.33.01192.30.036
CV0.630.190.840.790.911.100.871.020.800
Down stream (n = 22)Min6.150.83.727.687.45.20.0826.70.001
Max1462.784.081.6222.21120.1167.04.19532.70.280
Mean121.465.330.260.3400.227.71.32124.00.052
SD306.38.626.540.8303.940.11.16124.30.065
CV2.520.130.880.680.761.450.881.001.230
FWPUp stream (n = 15)Min52.229.827.142.9173.61.50.4530.20.007
Max800.970.1315.6575.42378.354.99.32612.10.422
Mean257.249.7174.6160.7935.012.33.12183.00.072
SD191.512.768.5137.1640.714.22.20135.70.107
CV0.740.250.390.850.691.150.700.741.480
Down stream (n = 22)Min3.341.12.129.578.44.80.1722.80.009
Max432.280.5141.5136.3969.71600.13.79365.12.159
Mean56.059.431.358.0365.399.61.30120.30.152
SD90.211.733.226.4258.1338.61.0593.70.450
CV1.610.201.060.460.713.400.810.782.970
Lom River, Cameroon (Au mine) [11]0.3~22.526~3226/123~52114.2~55611~1110.17~8.66~161/
Taojiang River, China (W mine) [29]/7.02~80.44.42~54.523.53~55.644.94~2126.26~27.20.2~65.88.33~107.20.07~6.6
Jishui River, China (Pb/Zn mine, Au mine, Cu mine) [14]///34~344759~127012~8640.2~256.931.6~545.2/
Ganga River, India [30]/7.12~155.0/2.1~73.896.3~104.3/0.21~3.62.1~36.5/
Tajum River, Indonesia (Au mine) [13]///87~21083~550/1.5~6.534~110/
Background values0.9875.82.9929.6101.47.920.18731.60.036
Table 2. Rotated factor pattern calculated from PCA for heavy metals in sediments.
ElementsHWPLWPFWP
PC1PC2PC3PC4PC1PC2PC3PC4PC1PC2PC3PC4
Mo0.9280.107−0.080−0.0780.0810.3940.787−0.0690.2200.6560.459−0.288
Cr0.024−0.0920.972−0.065−0.027−0.863−0.105−0.101−0.084−0.8480.070−0.219
W0.5650.616−0.332−0.0680.6150.674−0.1230.1090.6350.663−0.095−0.147
Cu0.6600.435−0.073−0.1270.8790.2300.315−0.0530.5980.462−0.013−0.126
Zn0.0660.980−0.0530.0250.9550.1280.0380.0750.9680.093−0.0210.021
As0.7870.0820.0860.0680.211−0.1990.8420.060−0.019−0.0610.9370.074
Cd0.4730.863−0.0320.0130.9210.1300.1510.2110.9230.1300.0880.066
Pb0.7480.3270.0450.0840.769−0.2300.1440.3720.6410.1700.5020.070
Hg0.0010.003−0.0610.9850.1980.154−0.0160.9490.0340.0300.0640.952
Disclaimer/Publisher’s Note: The statements, opinions and data contained in all publications are solely those of the individual author(s) and contributor(s) and not of MDPI and/or the editor(s). MDPI and/or the editor(s) disclaim responsibility for any injury to people or property resulting from any ideas, methods, instructions or products referred to in the content.

