


A Frontier Approach to Eco-Efficiency Assessment in the World’s Busiest Sea Ports

Abstract
1. Introduction
- (a)
- Develop models for the assessment of operational efficiency considering the international reporting standards and sustainability guidelines for eco-efficient maritime operations;
- (b)
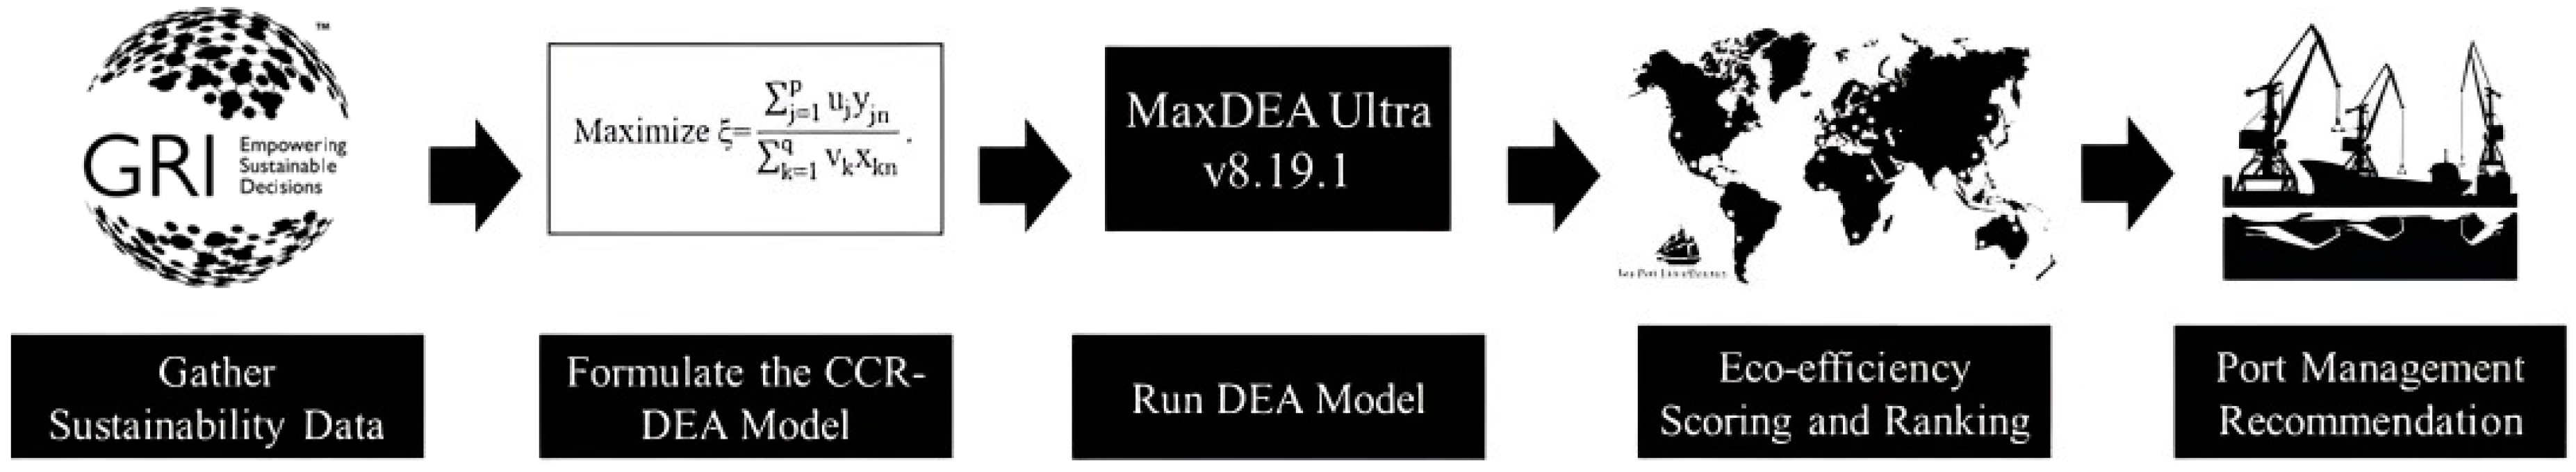
- Build a CCR (Charnes, Cooper, and Rhodes)-based data envelopment analysis (DEA) model to assess the eco-efficiency performance of the 21 busiest seaports in the world;
- (c)
- Examine recommended reference points to provide a specified evaluation method to improve port sustainability performance;
- (d)
- Provide a framework for port managers to achieve sustainability based on managerial implications as a result of the assessments made.
Theoretical Background
2. Materials and Methods
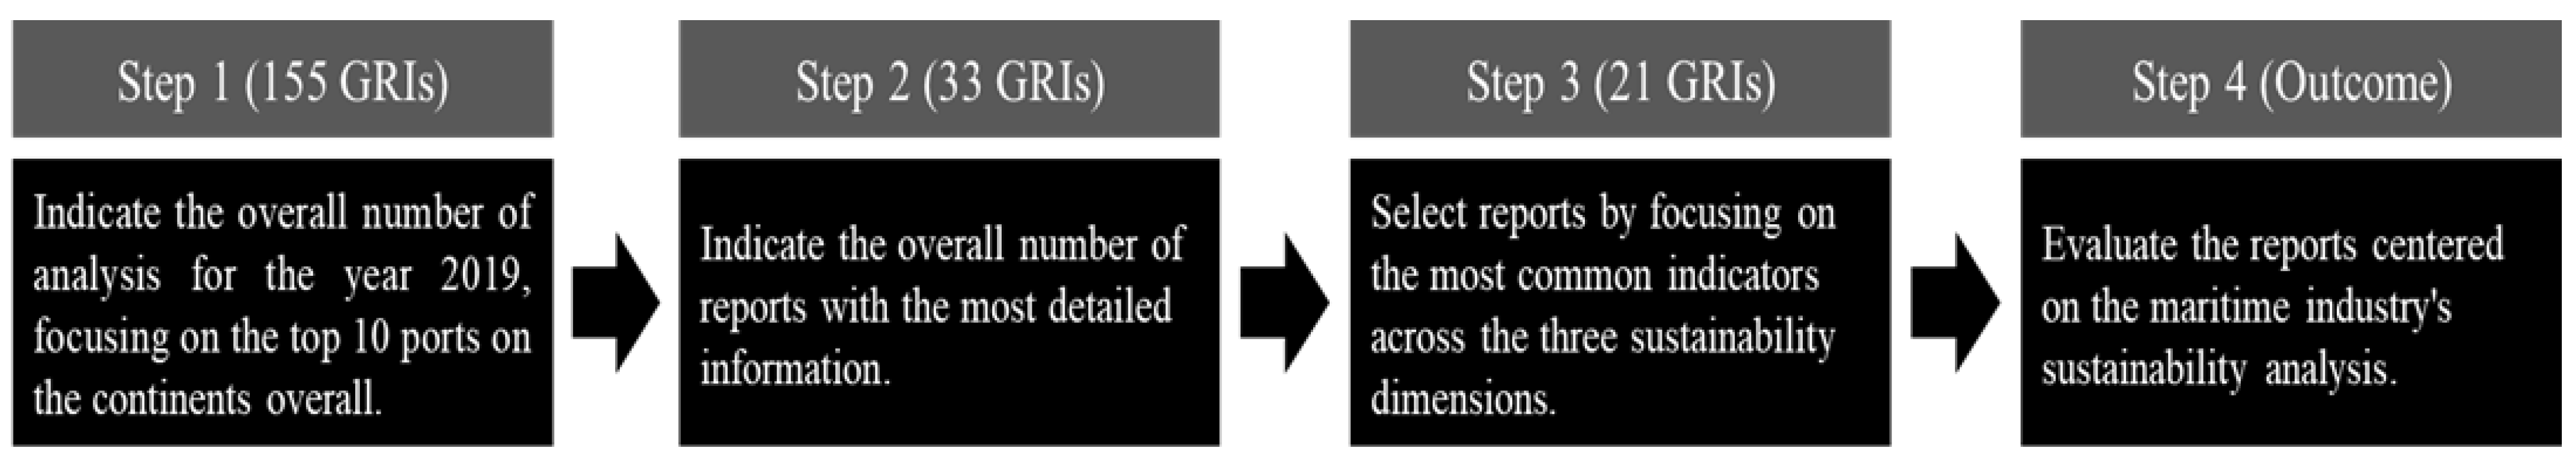
2.1. Global Reporting Initiative (GRI)
2.2. Data Envelopment Analysis
- Q1: What are the most critical parameters to be addressed considering the triple bottom-line goals in the port operations?
- Q2: How can the maritime industry achieve the decarbonization goals of the United Nations (UN) Climate Action program and port city transition towards resilient and sustainable urban units?
- Q3: How can eco-efficiency assessment help the maritime industry to improve the equilibrium between economic enhancement, environmental mitigation, and social growth to ensure its long-run viability?
2.3. Data Analysis with a DEA Approach
3. Results and Discussion
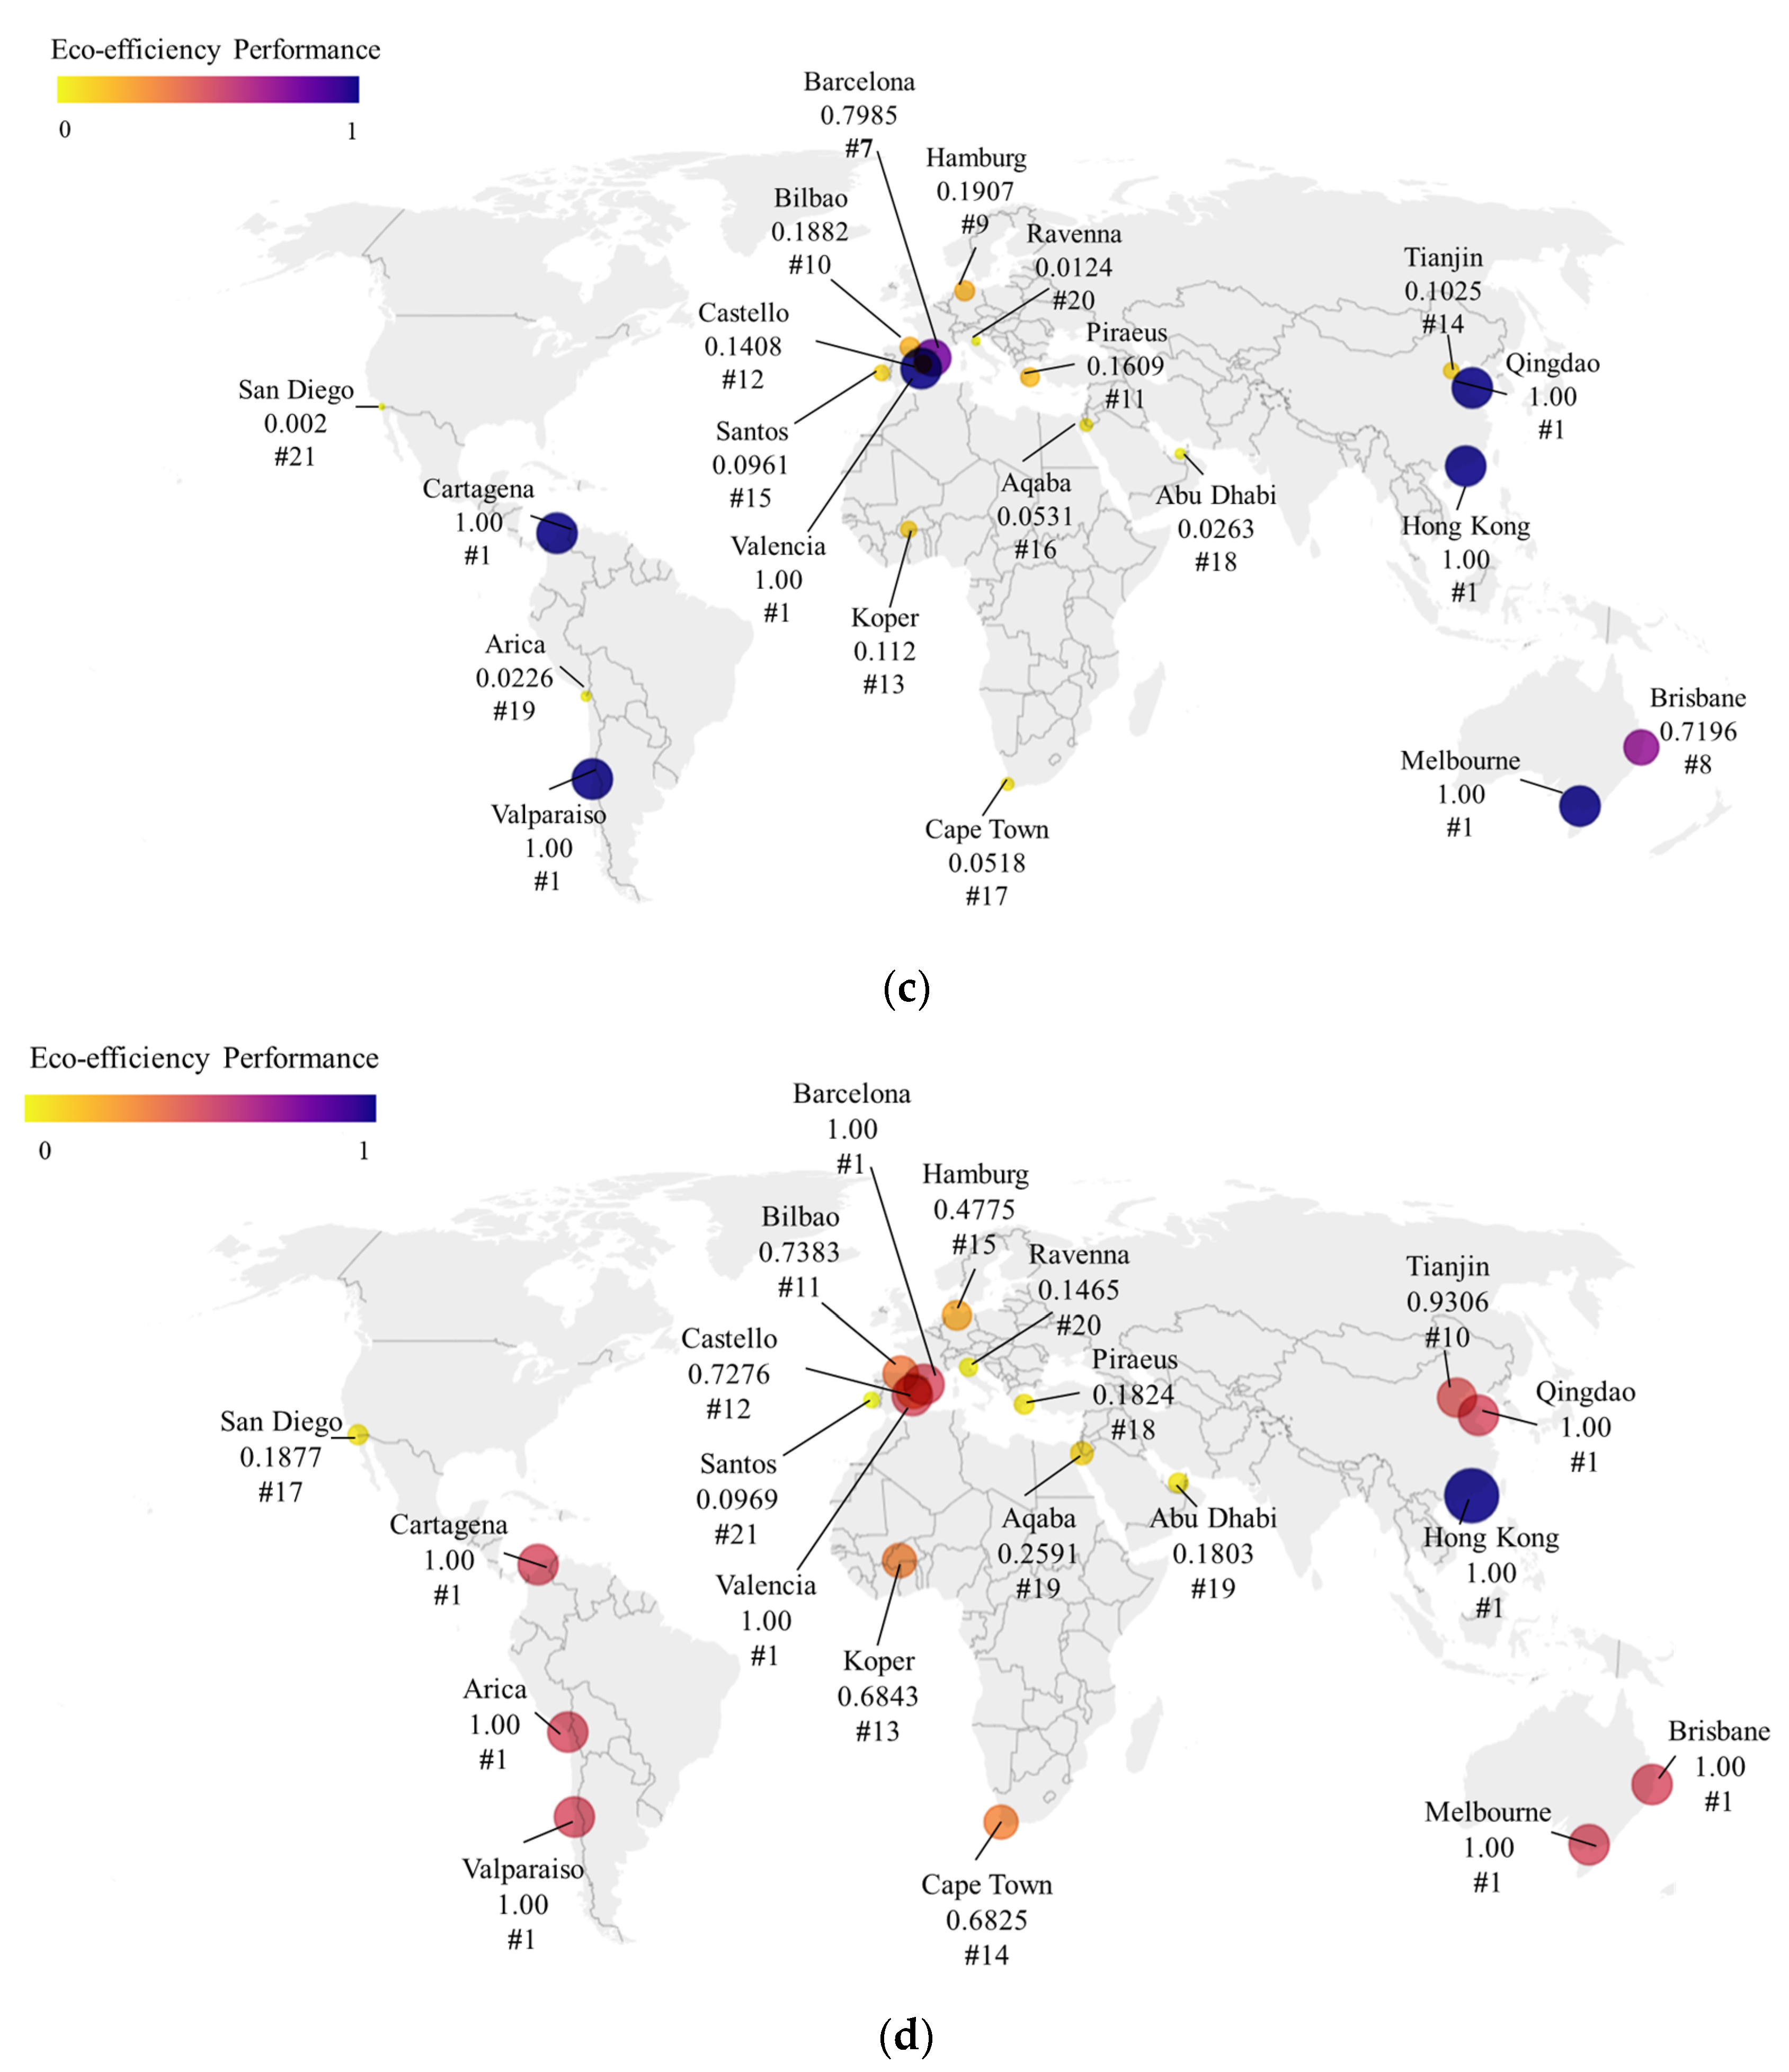
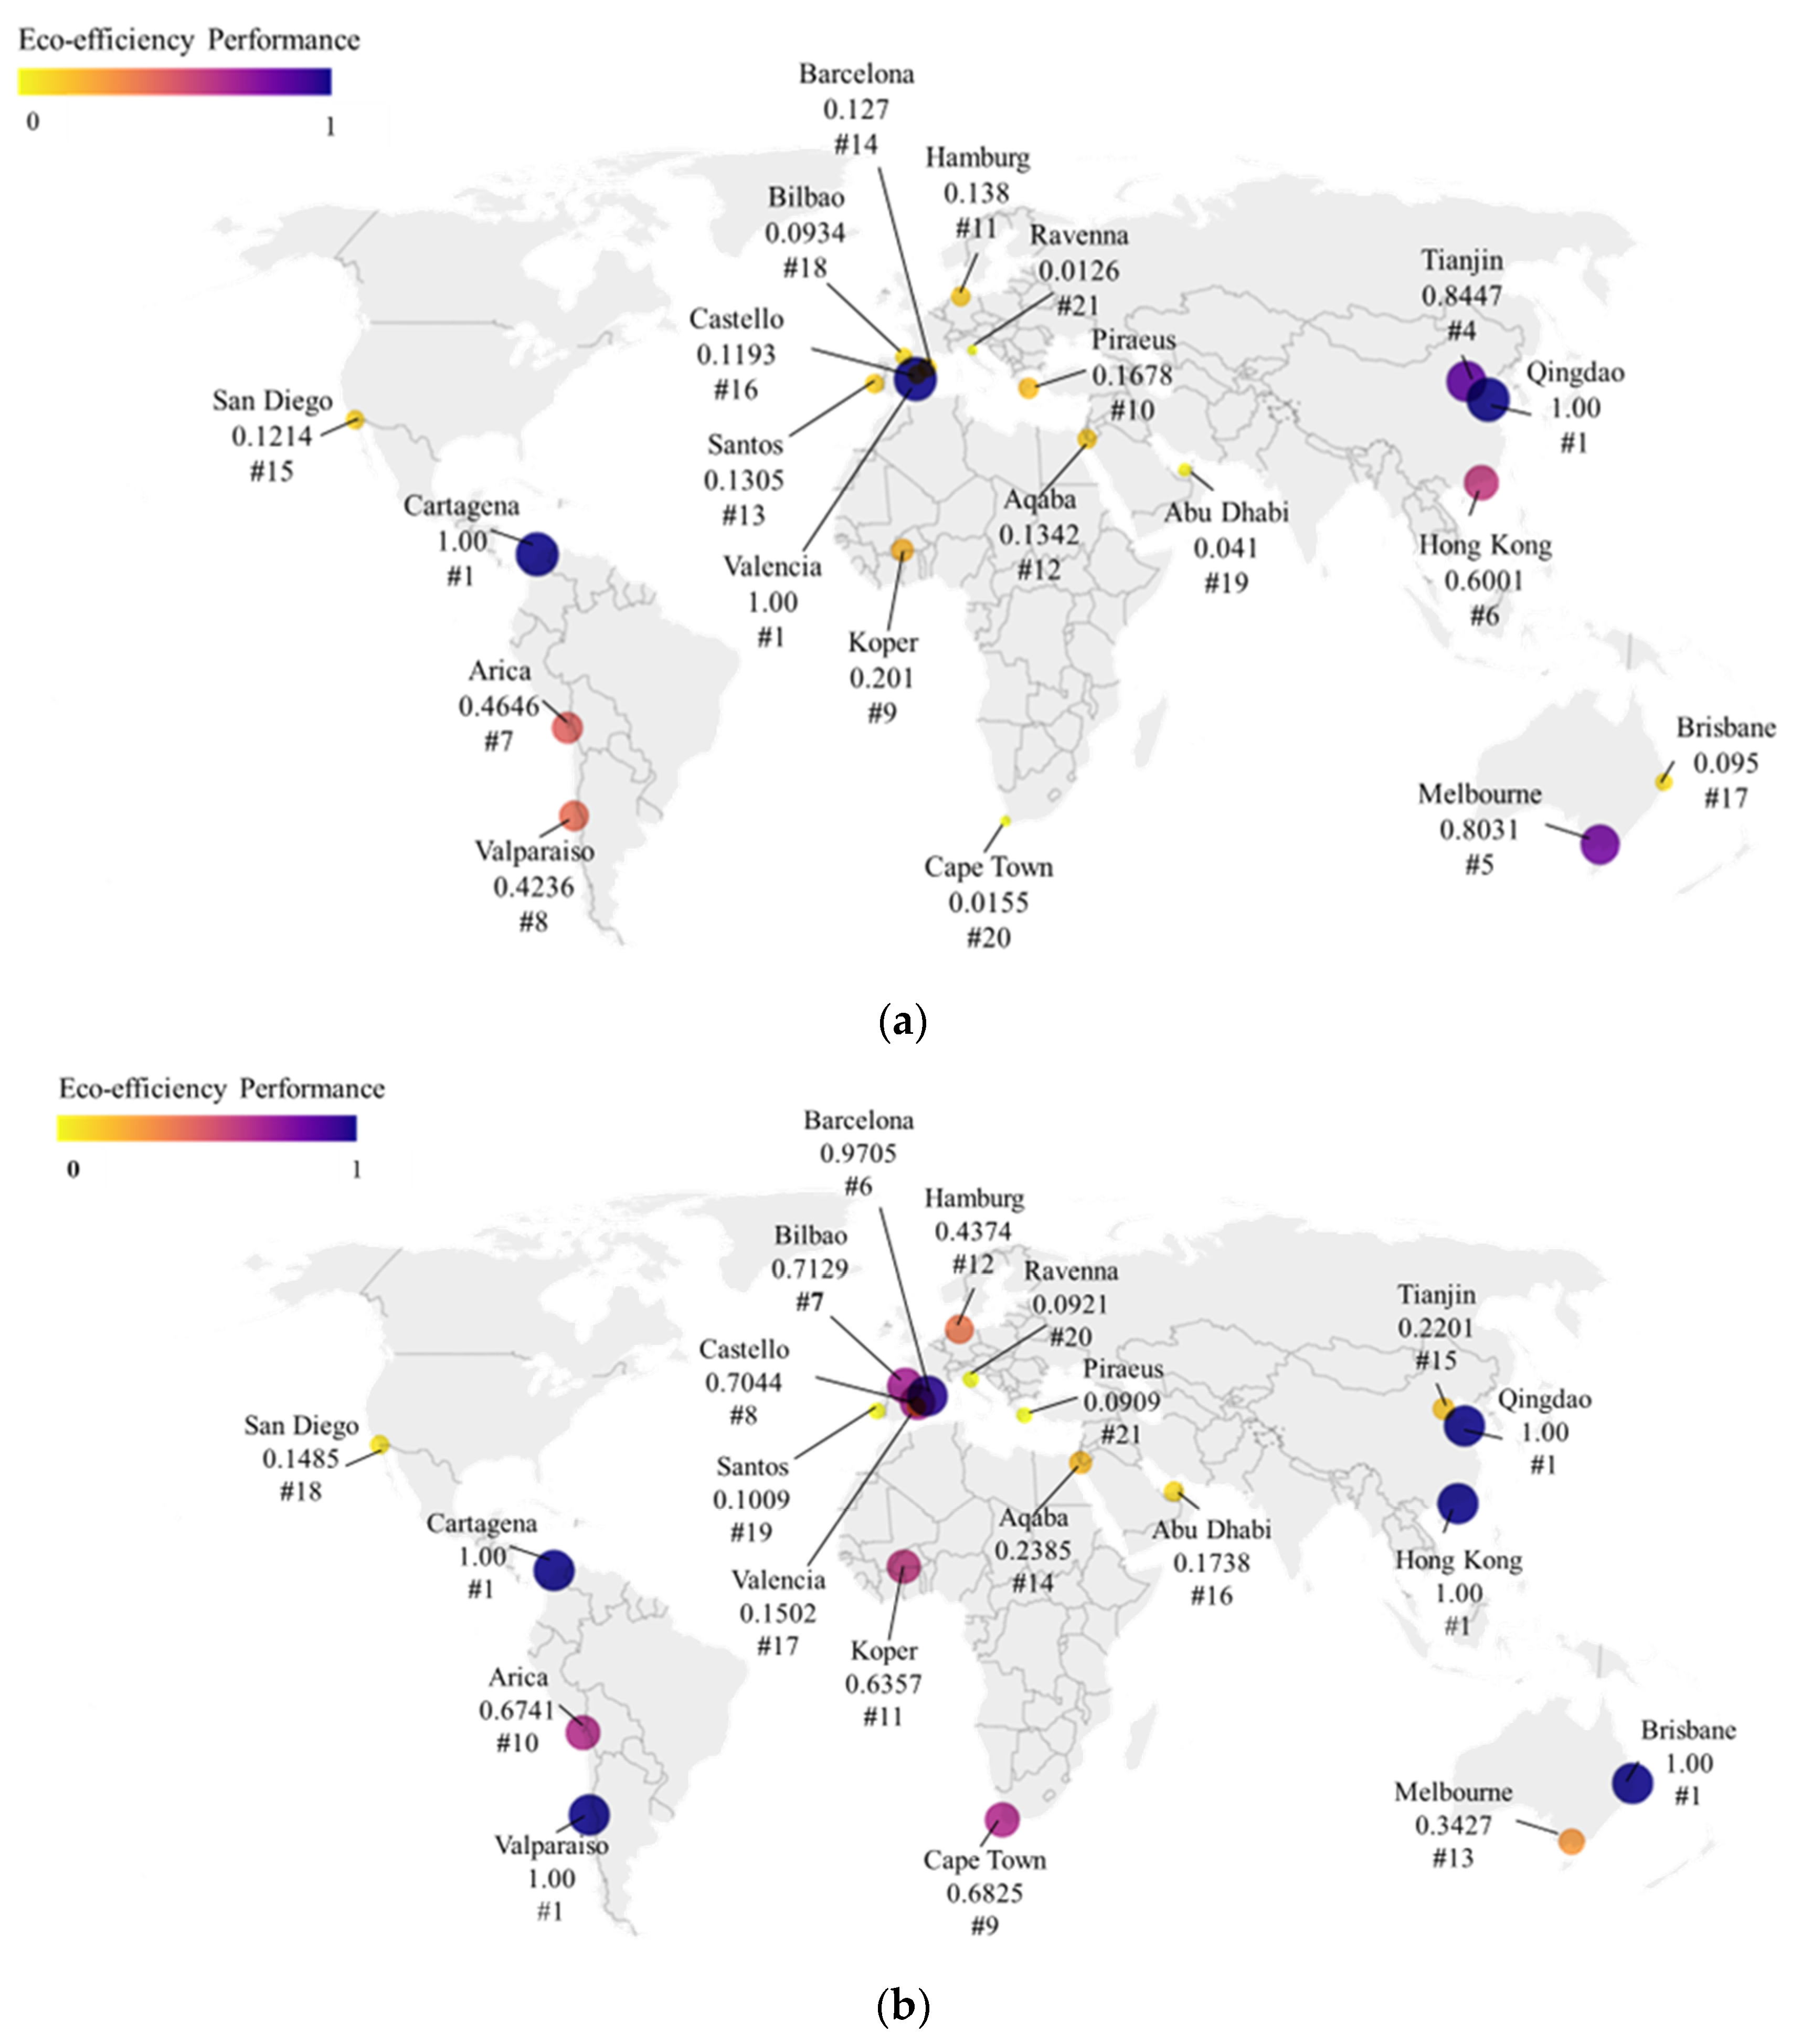
3.1. Ecoefficiency Performance
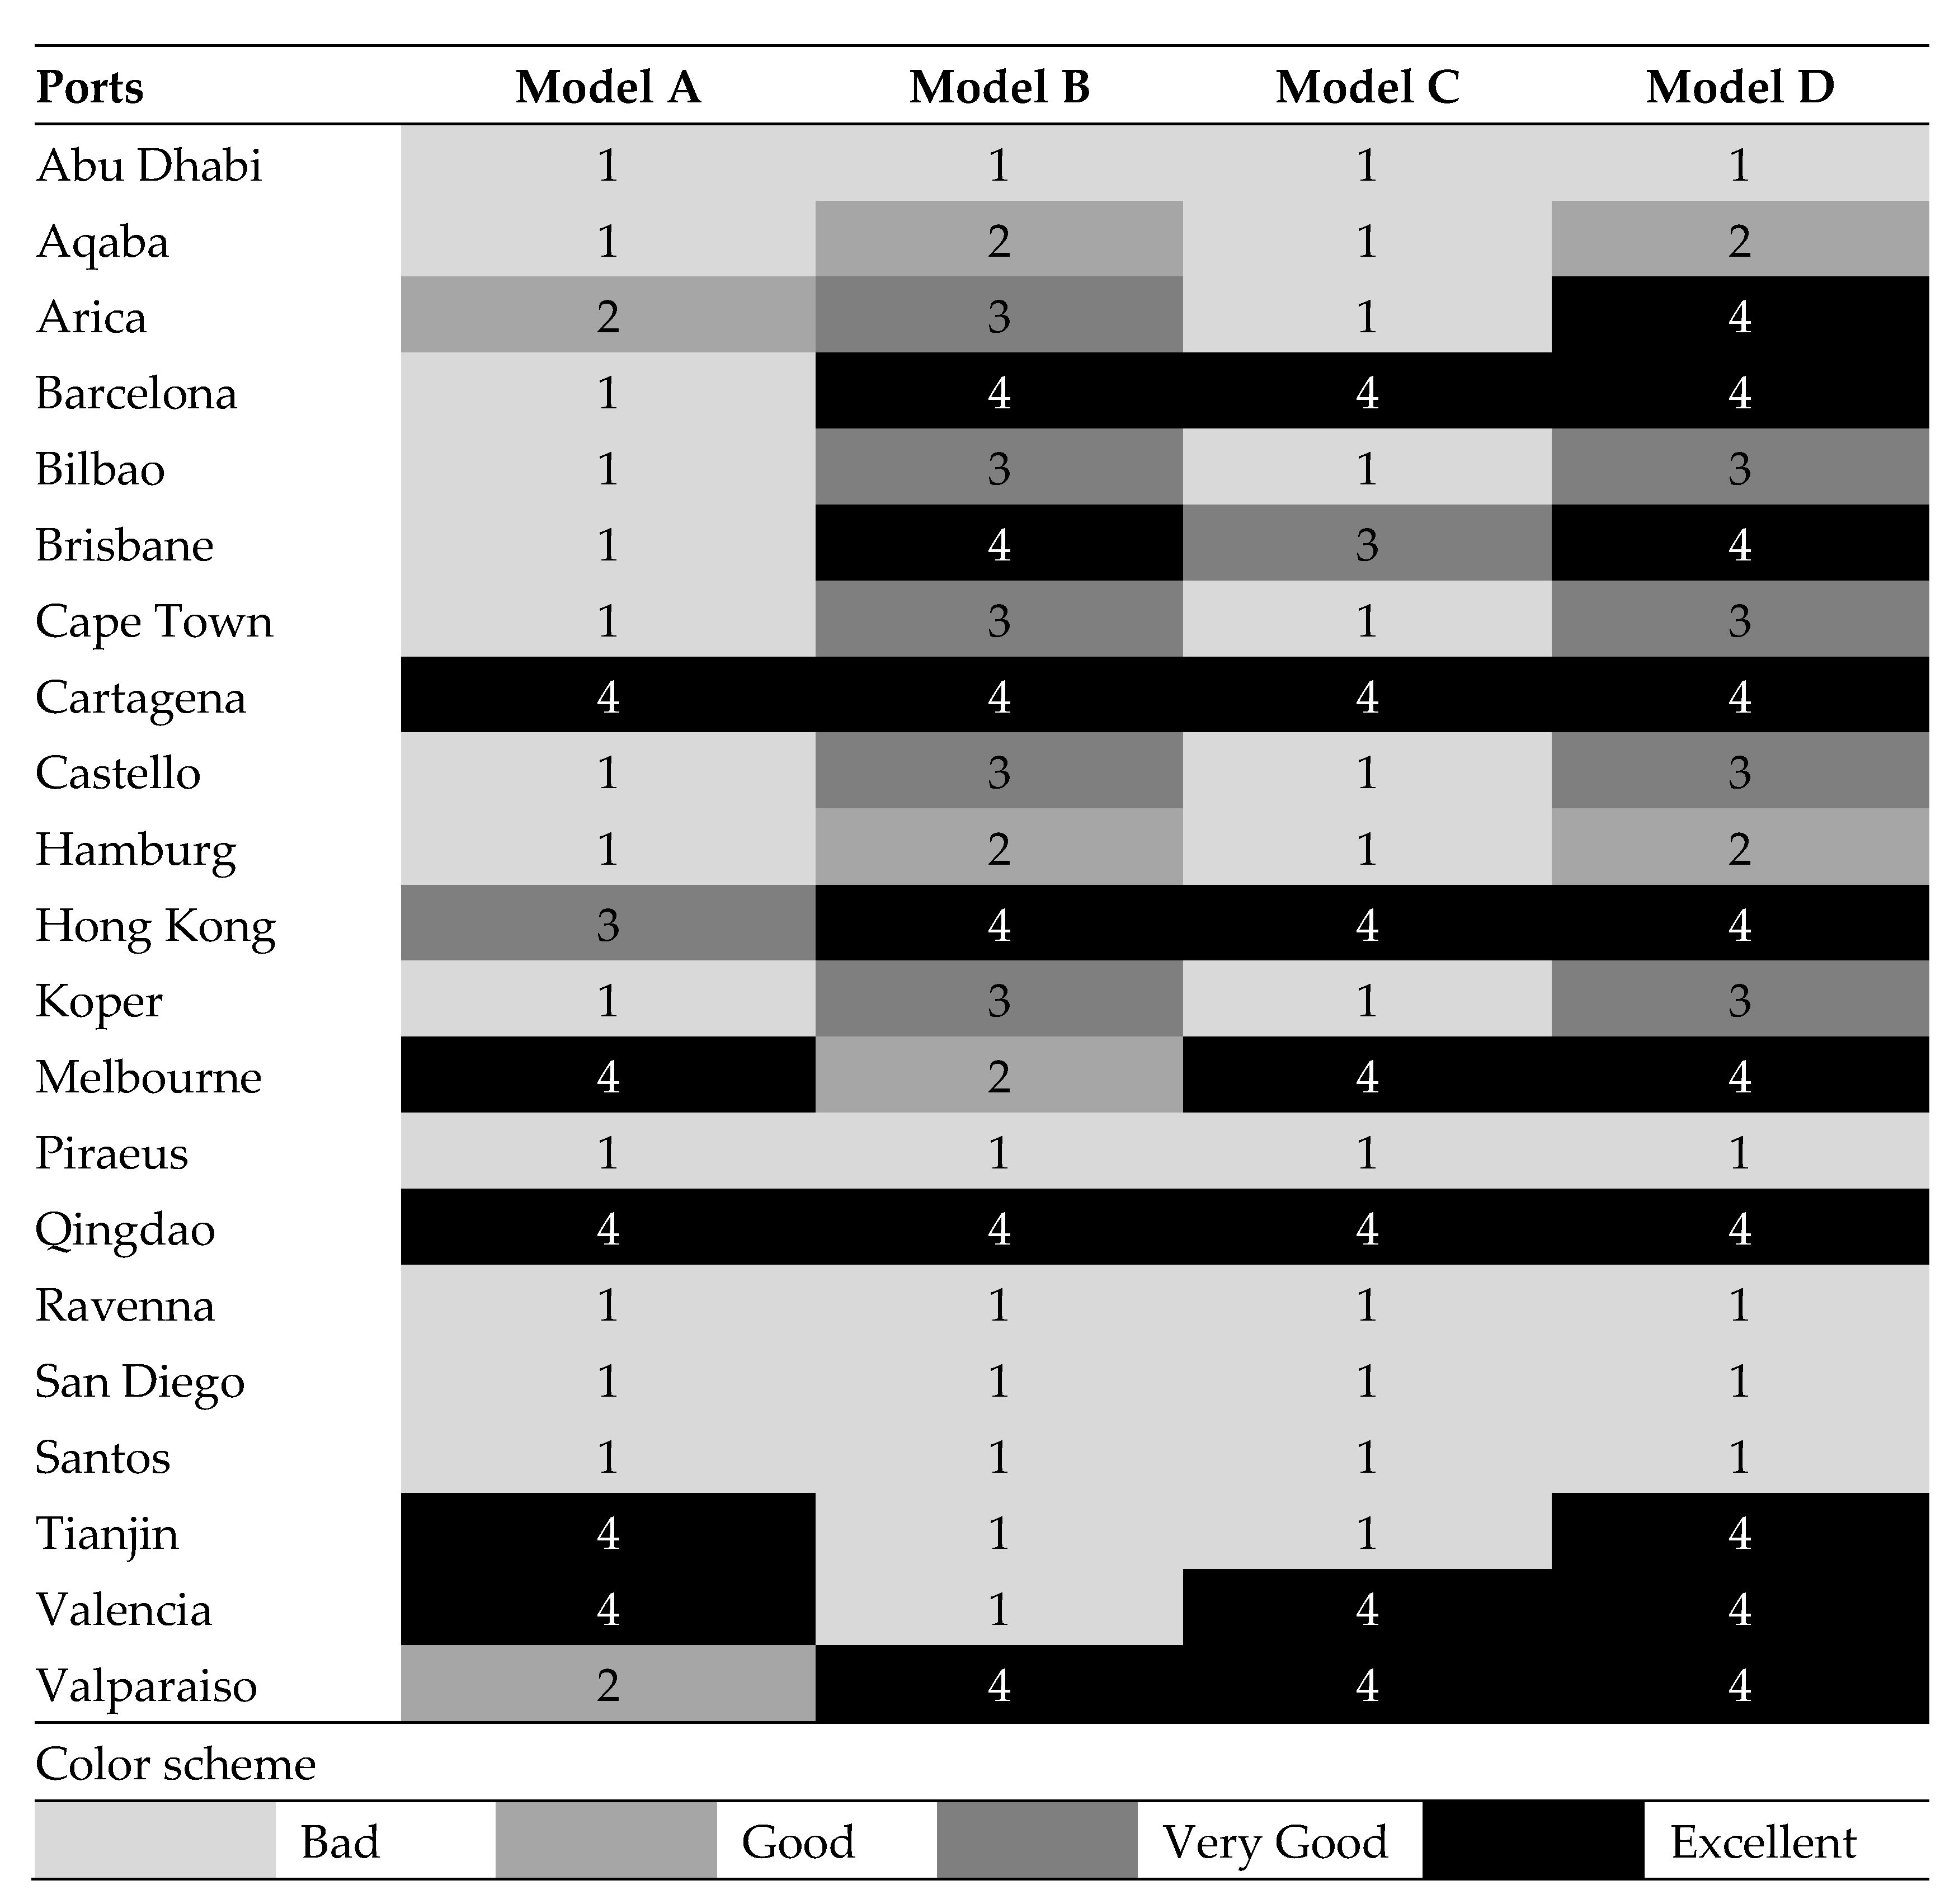
3.2. Efficiency Performance Grouping
3.3. Variability Estimation of DEA Models
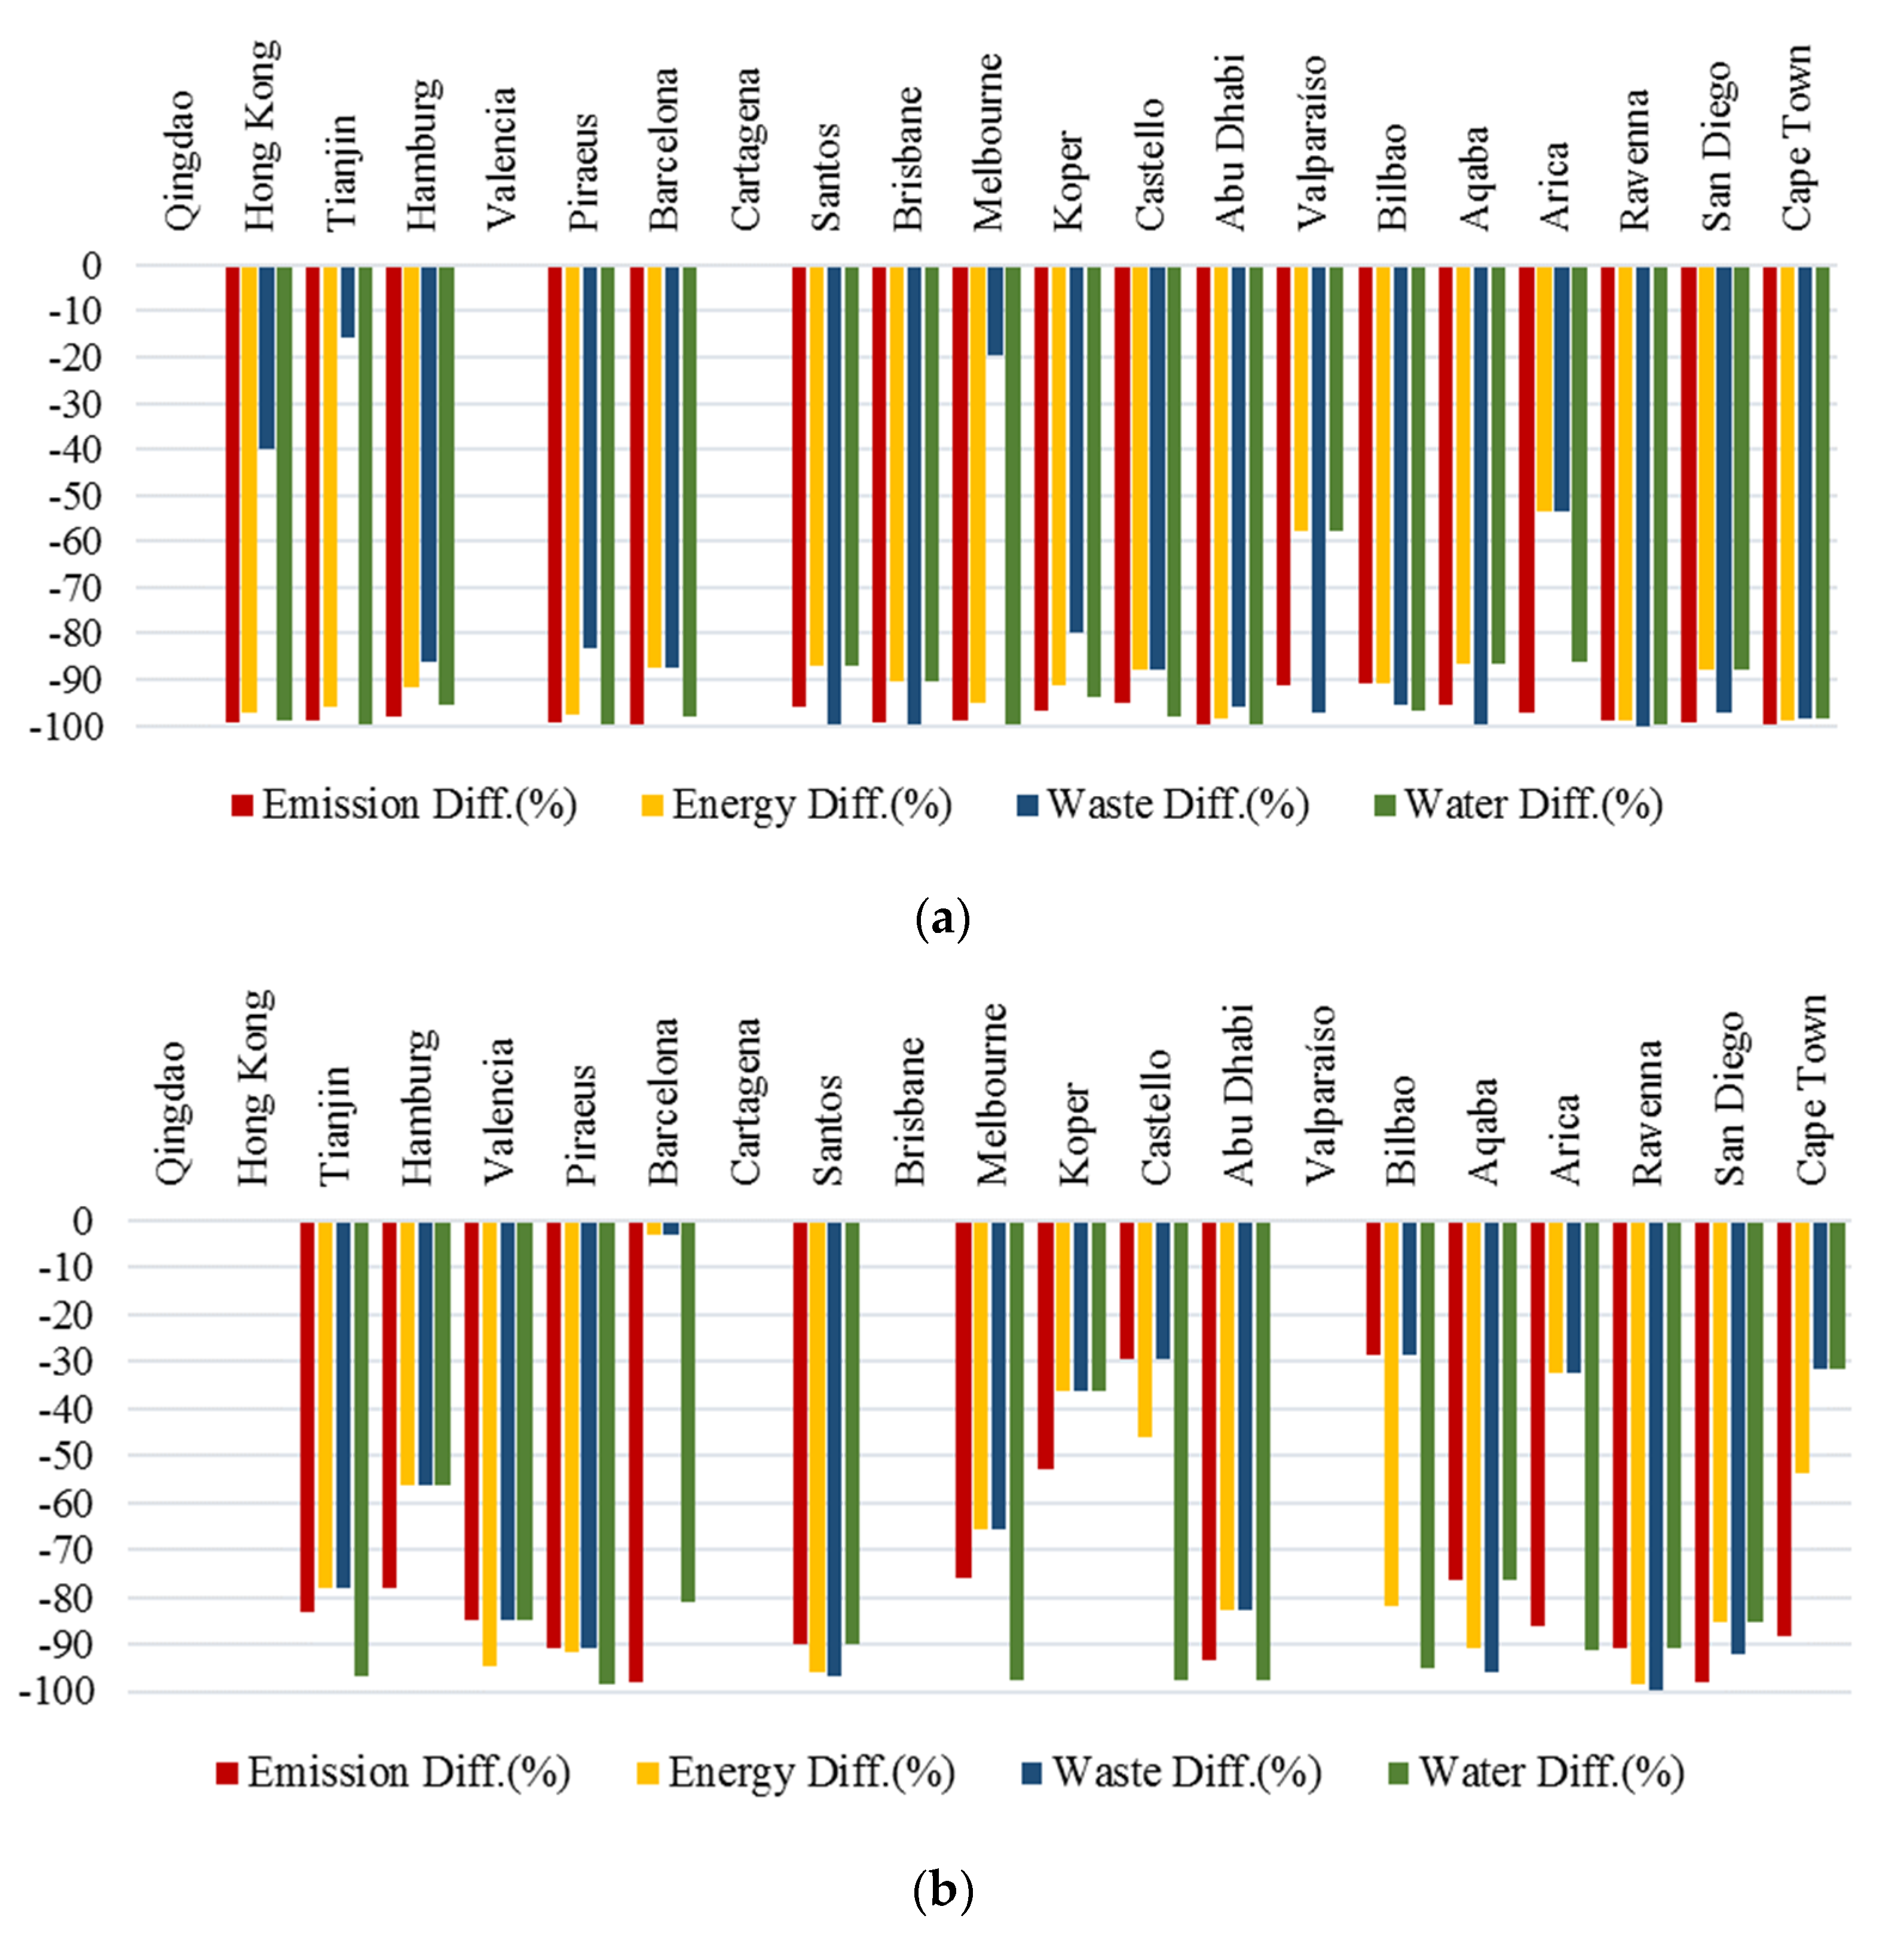
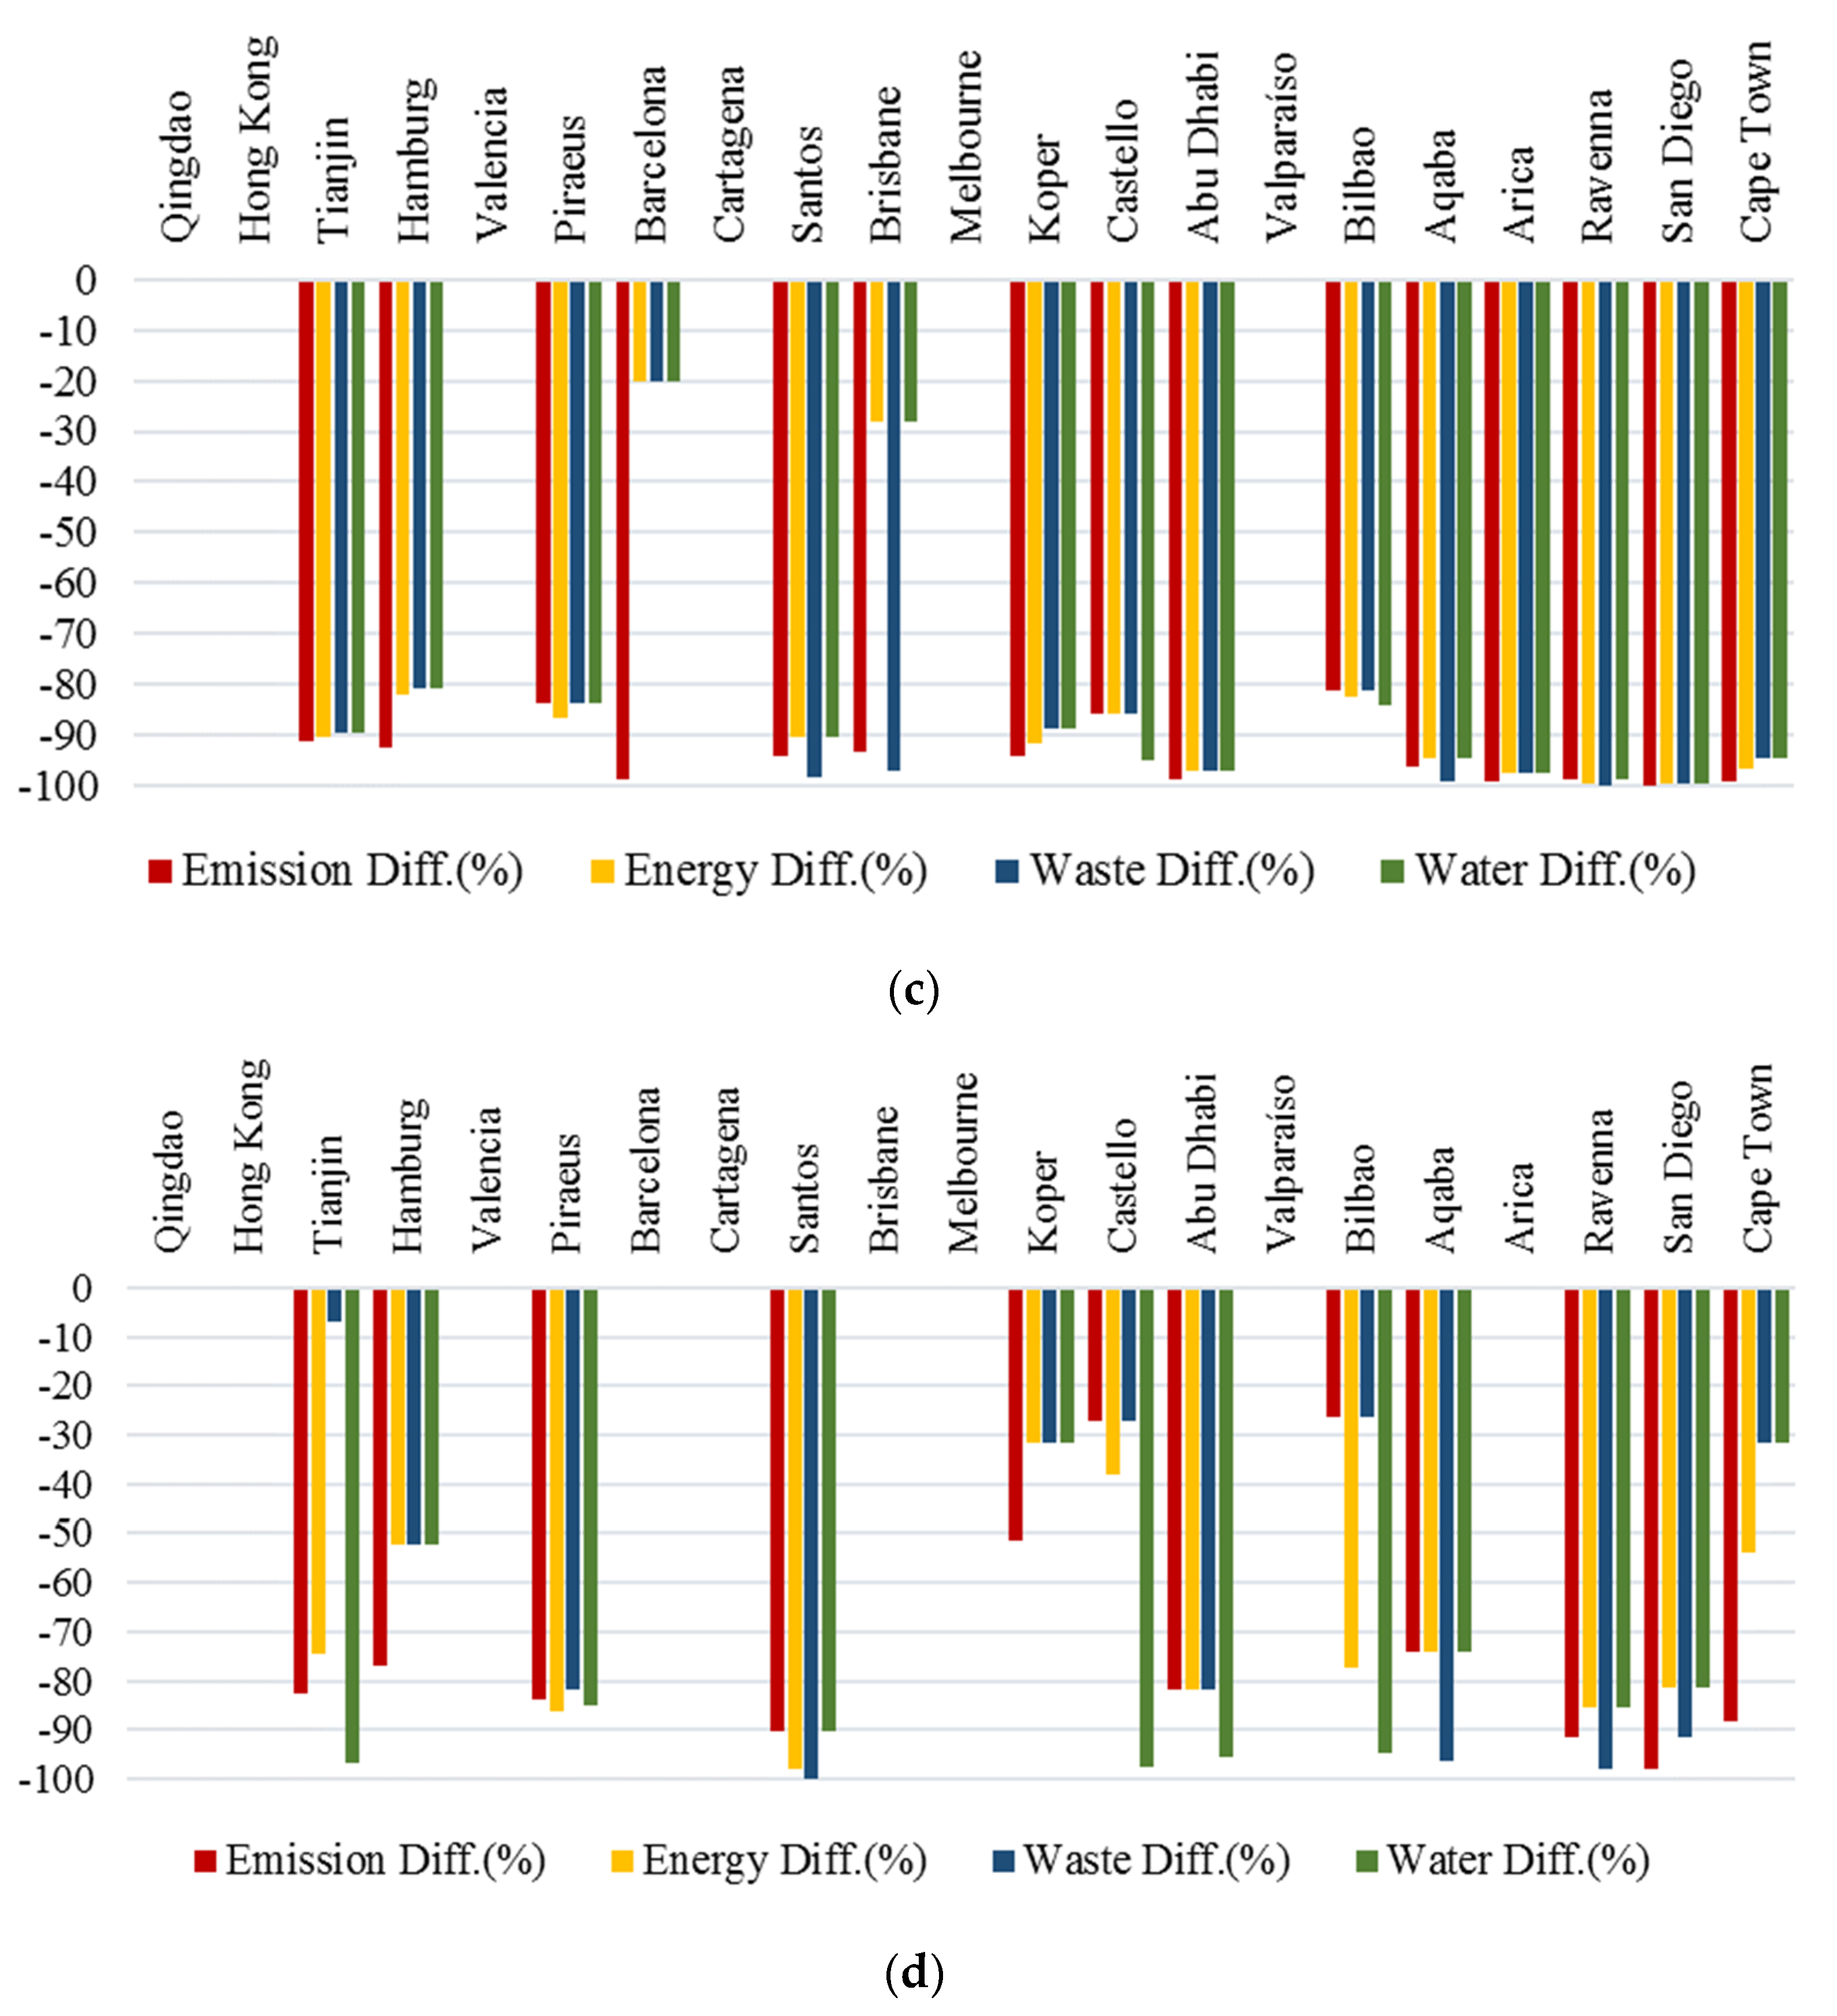
3.4. Projection-Level Analysis
4. Conclusions
Funding
Institutional Review Board Statement
Informed Consent Statement
Data Availability Statement
Conflicts of Interest
Appendix A

| Variables | Port of Ravenna Best-Level in 2019 | Benchmark Unit | Average Projection (%) | |
|---|---|---|---|---|
| CO2 emission (tons) | s84.856 | Port of Valencia | 98.744 | |
| Total electricity consumption (kWh) | 293,471.55 | 98.888 | ||
| Waste generation (ton) | 33.595 | 99.999 | ||
| Water use (m3) | 132.306 | 99.803 | ||
| Variables | Port of Piraeus Best-Level in 2019 | Benchmark Unit | Average Projection (%) | |
|---|---|---|---|---|
| CO2 emission (tons) | 5856.47 | Port of Hong Kong Port of Valparaiso | 90.911 | |
| Total electricity consumption (kWh) | 5,947,909.8 | 91.69 | ||
| Waste generation (ton) | 98.748 | 90.907 | ||
| Water use (m3) | 8766.56 | 98.518 | ||
| Variables | Port of San Diego Best-Level in 2019 | Benchmark Unit | Average Projection (%) | |
|---|---|---|---|---|
| CO2 emission (tons) | 21.643 | Port of Cartagena, Port of Valparaiso | 99.976 | |
| Total electricity consumption (kWh) | 13,999.28 | 99.805 | ||
| Waste generation (ton) | 155.588 | 99.894 | ||
| Water use (m3) | 913.982 | 99.805 | ||
| Variables | Port of Santos Best-Level in 2019 | Benchmark Unit | Average Projection (%) | |
|---|---|---|---|---|
| CO2 emission (tons) | 2886.59 | Port of Valencia, Port of Cartagena, Port of Valparaiso | 90.311 | |
| Total electricity consumption (kWh) | 5,446,157.41 | 98.039 | ||
| Waste generation (ton) | 9530.97 | 99.858 | ||
| Water use (m3) | 10,867.8 | 90.311 | ||
Appendix B
Appendix C
| Ports | CO2 Emission (tons) | Electricity Consumption (kWh) | Waste (tons) | Water (m3) | Total Employees | Total Revenue (USD) | Container Throughput (TEU) |
| Port of Qingdao | 2 × 10⁵ | 6 × 10⁸ | 9 × 10³ | 5 × 10³ | 9 × 10³ | 2 × 10⁹ | 2 × 10⁷ |
| Port of Hong Kong | 5 × 10⁴ | 5 × 10⁷ | 3 × 10² | 7 × 10⁴ | 9 × 10² | 1 × 10⁹ | 2 × 10⁷ |
| Port of Tianjin | 4 × 10⁵ | 3 × 10⁸ | 2 × 10³ | 3 × 10⁶ | 8 × 10³ | 2 × 10⁹ | 2 × 10⁷ |
| Port of Hamburg | 2 × 10⁵ | 1 × 10⁸ | 8 × 10³ | 1 × 10⁵ | 6 × 10³ | 1 × 10⁹ | 9 × 10⁶ |
| Port of Valencia | 4 × 10³ | 1 × 10⁷ | 1 × 10³ | 6 × 10³ | 8 × 10³ | 2 × 10⁷ | 5 × 10⁶ |
| Port of Piraeus | 6 × 10⁴ | 7 × 10⁷ | 1 × 10³ | 6 × 10⁵ | 1 × 10³ | 2 × 10⁸ | 6 × 10⁶ |
| Port of Barcelona | 3 × 10⁵ | 7 × 10⁶ | 1 × 10³ | 5 × 10⁴ | 5 × 10² | 2 × 10⁸ | 3 × 10⁶ |
| Port of Cartagena | 4 × 10² | 3 × 10⁶ | 7 × 10³ | 1 × 10⁵ | 2 × 10² | 5 × 10⁷ | 3 × 10⁶ |
| Port of Santos | 3 × 10⁴ | 4 × 10⁷ | 5 × 10⁵ | 7 × 10⁴ | 3 × 10³ | 2 × 10⁸ | 4 × 10⁶ |
| Port of Brisbane | 1 × 10⁴ | 3 × 10⁶ | 4 × 10⁴ | 2 × 10³ | 2 × 10² | 2 × 10⁸ | 1 × 10⁶ |
| Port of Melbourne | 5 × 10³ | 4 × 10⁶ | 4 | 7 × 10⁴ | 1 × 10² | 4 × 10⁷ | 3 × 10⁶ |
| Port of Koper | 2 × 10⁴ | 3 × 10⁷ | 1 × 10³ | 2 × 10⁴ | 2 × 10³ | 3 × 10⁸ | 1 × 10⁶ |
| Port of Castello | 1 × 10³ | 2 × 10⁶ | 1 × 10³ | 9 × 10⁴ | 1 × 10² | 4 × 10⁷ | 2 × 10⁵ |
| Port of Abu Dhabi | 3 × 10⁵ | 1 × 10⁸ | 4 × 10³ | 1 × 10⁶ | 9 × 10² | 5 × 10⁸ | 2 × 10⁶ |
| Port of Valparaíso | 4 × 10² | 2 × 10⁵ | 2 × 10³ | 2 × 10³ | 6 × 101 | 4 × 10⁷ | 9 × 10⁵ |
| Port of Bilbao | 1 × 10³ | 5 × 10⁶ | 4 × 10³ | 7 × 10⁴ | 3 × 10² | 7 × 10⁷ | 6 × 10⁵ |
| Port of Aqaba | 1 × 10⁴ | 1 × 10⁷ | 3 × 10⁵ | 3 × 10⁴ | 1 × 10³ | 1 × 10⁸ | 8 × 10⁵ |
| Port of Arica | 6 × 10³ | 1 × 10⁶ | 4 × 10² | 2 × 10⁴ | 3 × 10² | 3 × 10⁷ | 2 × 10⁷ |
| Port of Ravenna | 7 × 10³ | 3 × 10⁷ | 3 × 10⁶ | 7 × 10⁴ | 2 × 10² | 6 × 10⁷ | 2 × 10⁵ |
| Port of San Diego | 9 × 10⁴ | 7 × 10⁶ | 1 × 10⁵ | 5 × 10⁵ | 6 × 10² | 2 × 10⁸ | 7 × 10⁴ |
| Port of Cape Town | 4 × 10⁶ | 3 × 10⁹ | 4 × 10⁴ | 3 × 10⁴ | 8 × 10² | 5 × 10⁹ | 5 × 10⁶ |
References
- Yan, R.; Wang, S.; Zhen, L.; Laporte, G. Emerging Approaches Applied to Maritime Transport Research: Past and Future. Commun. Transp. Res. 2021, 1, 100011. [Google Scholar] [CrossRef]
- UNCTAD. COVID-19: A 10-Point Action Plan to Strengthen International Trade and Facilitation in Times of Pandemic. No. 79. Available online: https://unctad.org/publication/covid-19-10-point-action-plan-strengthen-international-trade-and-transport-facilitation (accessed on 26 September 2023).
- Psaraftis, H.N.; Zis, T. Shipping Decarbonization and Green Ports. Marit. Transp. Res. 2022, 3, 100068. [Google Scholar] [CrossRef]
- Taleb, M.; Khalid, R.; Emrouznejad, A.; Ramli, R. Environmental Efficiency under Weak Disposability: An Improved Super Efficiency Data Envelopment Analysis Model with Application for Assessment of Port Operations Considering NetZero. Environ. Dev. Sustain. 2022, 25, 6627–6656. [Google Scholar] [CrossRef]
- Krmac, E.; Djordjević, B. Port environmental efficiency assessment using the one-stage and two-stage model DEA: Comparison of Koper and Dublin ports. Environ. Dev. Sustain. 2023, 1–31. [Google Scholar] [CrossRef]
- Kong, Y.; Liu, J. Sustainable Port Cities with Coupling Coordination and Environmental Efficiency. Ocean Coast. Manag. 2021, 205, 105534. [Google Scholar] [CrossRef]
- Argyriou, I.; Sifakis, N.; Tsoutsos, T. Ranking Measures to Improve the Sustainability of Mediterranean Ports Based on Multicriteria Decision Analysis: A Case Study of Souda Port, Chania, Crete. Environ. Dev. Sustain. 2021, 24, 6449–6466. [Google Scholar] [CrossRef]
- Di Vaio, A.; Varriale, L. Management innovation for environmental sustainability in seaports: Managerial accounting instruments and training for competitive green ports beyond the regulations. Sustainability 2018, 10, 783. [Google Scholar] [CrossRef]
- Zanobetti, F.; Pio, G.; Jafarzadeh, S.; Ortiz, M.M.; Cozzani, V. Decarbonization of maritime transport: Sustainability assessment of alternative power systems. J. Clean. Prod. 2023, 417, 137989. [Google Scholar] [CrossRef]
- Tsai, H.L.; Lu, C.S. Port institutional responses and sustainability performance: A moderated mediation model. Marit. Policy Manag. 2022, 49, 1075–1096. [Google Scholar] [CrossRef]
- Nikčević, J.; Škurić, M. A contribution to the sustainable development of maritime transport in the context of blue economy: The Case of Montenegro. Sustainability 2021, 13, 3079. [Google Scholar] [CrossRef]
- The World Association for Waterborne Transport Infrastructure. WG150 ‘Sustainable Ports’ A Guidance for Port Authorities; Revision 6; The World Association for Waterborne Transport Infrastructure: Brussels, Belgium, 2013. [Google Scholar]
- PIANC/IAPH. Sustainable Ports: A Guide for Port Authorities; PIANC/IAPH: Brussels, Belgium, 2014. [Google Scholar]
- Kutty, A.A.; Wakjira, T.G.; Kucukvar, M.; Abdella, G.M.; Onat, N.C. Urban Resilience and Livability Performance of European Smart Cities: A Novel Machine Learning Approach. J. Clean. Prod. 2022, 378, 134203. [Google Scholar] [CrossRef]
- Onat, N.C.; Abdella, G.M.; Kucukvar, M.; Kutty, A.A.; Al-Nuaimi, M.; Kumbaroğlu, G.; Bulu, M. How Eco-Efficient Are Electric Vehicles across Europe? A Regionalized Life Cycle Assessment-Based Eco-Efficiency Analysis. Sustain. Dev. 2021, 29, 941–956. [Google Scholar] [CrossRef]
- Yi, S.; Lim, H.S. Evaluation of the Eco-Efficiency of Waste Treatment Facilities in Korea. J. Hazard. Mater. 2021, 411, 125040. [Google Scholar] [CrossRef] [PubMed]
- Kuo, K.-C.; Lu, W.-M.; Le, M.-H. Exploring the Performance and Competitiveness of Vietnam Port Industry Using DEA. Asian J. Shipp. Logist. 2020, 36, 136–144. [Google Scholar] [CrossRef]
- Seiford, L.M.; Zhu, J. Context-Dependent Data Envelopment Analysis—Measuring Attractiveness and Progress. Omega 2003, 31, 397–408. [Google Scholar] [CrossRef]
- Wang, Z.; Wu, X.; Guo, J.; Wei, G.; Dooling, T.A. Efficiency Evaluation and PM Emission Reallocation of China Ports Based on Improved DEA Models. Transp. Res. Part D Transp. Environ. 2020, 82, 102317. [Google Scholar] [CrossRef]
- Lozano, S.; Villa, G.; Canca, D. Application of Centralised DEA Approach to Capital Budgeting in Spanish Ports. Comput. Ind. Eng. 2011, 60, 455–465. [Google Scholar] [CrossRef]
- Krmac, E.; Mansouri Kaleibar, M. A Comprehensive Review of Data Envelopment Analysis (DEA) Methodology in Port Efficiency Evaluation. Marit. Econ. Logist. 2022, 25, 1–65. [Google Scholar] [CrossRef]
- Garg, C.P.; Kashav, V.; Wang, X. Evaluating Sustainability Factors of Green Ports in China under Fuzzy Environment. Environ. Dev. Sustain. 2022, 25, 7795–7821. [Google Scholar] [CrossRef]
- Cunha, D.R.; Pereira, N.N.; de Santana Porte, M.; Campos, C.R. Sustainability Practices for SDGs: A Study of Brazilian Ports. Environ. Dev. Sustain. 2023. [Google Scholar] [CrossRef]
- Spengler, T.; Tovar, B.; Wilmsmeier, G. Are Output Disaggregation and Energy Variables Key When Measuring Container Terminal Efficiency? Marit. Policy Manag. 2022, 1–25. [Google Scholar] [CrossRef]
- Park, J.; Lee, B.K.; Low, J.M.W. A Two-Stage Parallel Network DEA Model for Analyzing the Operational Capability of Container Terminals. Marit. Policy Manag. 2020, 49, 118–139. [Google Scholar] [CrossRef]
- Ghiara, H.; Tei, A. Port Activity and Technical Efficiency: Determinants and External Factors. Marit. Policy Manag. 2021, 48, 711–724. [Google Scholar] [CrossRef]
- Schrobback, P.; Meath, C. Corporate Sustainability Governance: Insight from the Australian and New Zealand Port Industry. J. Clean. Prod. 2020, 255, 120280. [Google Scholar] [CrossRef]
- Bini, L.; Bellucci, M. Integrated Sustainability Reporting; Springer: Cham, Switzerland, 2020. [Google Scholar]
- Gunawan, J.; Permatasari, P.; Fauzi, H. The Evolution of Sustainability Reporting Practices in Indonesia. J. Clean. Prod. 2022, 358, 131798. [Google Scholar] [CrossRef]
- Orazalin, N.; Mahmood, M. Economic, Environmental, and Social Performance Indicators of Sustainability Reporting: Evi-dence from the Russian Oil and Gas Industry. Energy Policy 2018, 121, 70–79. [Google Scholar] [CrossRef]
- GRI, Global Reporting Initiative. 2006. Available online: http://www.globalreporting.org (accessed on 22 October 2023).
- Orazalin, N.; Mahmood, M. Determinants of GRI-Based Sustainability Reporting: Evidence from an Emerging Economy. J. Account. Emerg. Econ. 2019, 10, 140–164. [Google Scholar] [CrossRef]
- Yang, Y.; Orzes, G.; Jia, F.; Chen, L. Does GRI Sustainability Reporting Pay Off? An Empirical Investigation of Publicly Listed Firms in China. Bus. Soc. 2019, 60, 000765031983163. [Google Scholar] [CrossRef]
- Valenza, G.; Damiano, R. Sustainability Reporting and Public Value: Evidence from Port Authorities. Util. Policy 2023, 81, 101508. [Google Scholar] [CrossRef]
- Cooper, W.W. Handbook on Data Envelopment Analysis; Springer: Berlin/Heidelberg, Germany, 2010. [Google Scholar]
- Tsaples, G.; Papathanasiou, J. Multi-Level DEA for the Construction of Multi-Dimensional Indices. MethodsX 2020, 7, 101169. [Google Scholar] [CrossRef]
- Kucukvar, M.; Alawi, K.A.; Abdella, G.M.; Bulak, M.E.; Onat, N.C.; Bulu, M.; Yalçıntaş, M. A Frontier-Based Managerial Approach for Relative Sustainability Performance Assessment of the World’s Airports. Sustain. Dev. 2020, 29, 89–107. [Google Scholar] [CrossRef]
- Banker, R.D.; Charnes, A.; Cooper, W.W. Some Models for Estimating Technical and Scale Inefficiencies in Data Envelopment Analysis. Manag. Sci. 1984, 30, 1078–1092. [Google Scholar] [CrossRef]
- Charnes, A.; Cooper, W.W.; Rhodes, E. Measuring the Efficiency of Decision-Making Units. Eur. J. Oper. Res. 1979, 3, 339. [Google Scholar] [CrossRef]
- Lombardi, G.V.; Stefani, G.; Paci, A.; Becagli, C.; Miliacca, M.; Gastaldi, M.; Giannetti, B.F.; Almeida, C.M.V.B. The Sus-tainability of the Italian Water Sector: An Empirical Analysis by DEA. J. Clean. Prod. 2019, 227, 1035–1043. [Google Scholar] [CrossRef]
- Fancello, G.; Carta, M.; Serra, P. Data Envelopment Analysis for the Assessment of Road Safety in Urban Road Networks: A Comparative Study Using CCR and BCC Models. Case Stud. Transp. Policy 2020, 8, 736–744. [Google Scholar] [CrossRef]
- Roll, Y.; Hayuth, Y. Port Performance Comparison Applying Data Envelopment Analysis (DEA). Marit. Policy Manag. 1993, 20, 153–161. [Google Scholar] [CrossRef]
- Ashar, A. Counting the moves. Port Dev. Int. 1997, 13, 25–29. [Google Scholar]
- Cook, W.D.; Seiford, L.M. Data Envelopment Analysis (DEA)—Thirty Years On. Eur. J. Oper. Res. 2009, 192, 1–17. [Google Scholar] [CrossRef]
- Elisa Périco, A.; da Silva, G.R. Port Performance in Brazil: A Case Study Using Data Envelopment Analysis. Case Stud. Transp. Policy 2020, 8, 31–38. [Google Scholar] [CrossRef]
- Zarbi, S.; Shin, S.-H.; Shin, Y.-J. An Analysis by Window DEA on the Influence of International Sanction to the Efficiency of Iranian Container Ports. Asian J. Shipp. Logist. 2019, 35, 163–171. [Google Scholar] [CrossRef]
- Bai, X.; Zhang, X.; Li, K.X.; Zhou, Y.; Yuen, K.F. Research Topics and Trends in the Maritime Transport: A Structural Topic Model. Transp. Policy 2021, 102, 11–24. [Google Scholar] [CrossRef]
- Castellano, R.; Ferretti, M.; Musella, G.; Risitano, M. Evaluating the Economic and Environmental Efficiency of Ports: Evidence from Italy. J. Clean. Prod. 2020, 271, 122560. [Google Scholar] [CrossRef]
- Nguyen, T.L.H.; Park, S.-H.; Yeo, G.-T. An Analysis of Port Networks and Improvement Strategies for Port Connections in the Ho Chi Minh Area. Asian J. Shipp. Logist. 2020, 36, 223–231. [Google Scholar] [CrossRef]
- Fernandez, M. Concentration Evolution of the Container Throughput on the Mediterranean Ports. Master’s Thesis, Universitat Politècnica de Catalunya, Barcelona, Spain, 2017. [Google Scholar]
- UNCTAD. World Investment Report 2018. Investment and Industrial Policies. Available online: https://unctad.org/publication/world-investment-report-2018 (accessed on 22 October 2023).
- Vier, T.B. Hub Ports: A case study of Port of Singapore. 2010. Available online: https://www.semanticscholar.org/paper/Hub-ports-%3A-a-case-study-of-port-of-Singapore-Vier/7f02da81cadd0e9217b0ae87547b829761a62166 (accessed on 22 October 2023).
- Kanellos, F.D.; Volanis, E.-S.M.; Hatziargyriou, N.D. Power Management Method for Large Ports with Multi-Agent Systems. IEEE Trans. Smart Grid 2019, 10, 1259–1268. [Google Scholar] [CrossRef]
- Notteboom, T. The Adaptive Capacity of Container Ports in an Era of Mega Vessels: The Case of Upstream Seaports Antwerp and Hamburg. J. Transp. Geogr. 2016, 54, 295–309. [Google Scholar] [CrossRef]
- Mustafa, F.S.; Khan, R.U.; Mustafa, T. Technical Efficiency Comparison of Container Ports in Asian and Middle East Region Using DEA. Asian J. Shipp. Logist. 2021, 37, 12–19. [Google Scholar] [CrossRef]
- Zahedi-Seresht, M.; Khosravi, S.; Jablonsky, J.; Zykova, P. A Data Envelopment Analysis Model for Performance Evaluation and Ranking of DMUs with Alternative Scenarios. Comput. Ind. Eng. 2021, 152, 107002. [Google Scholar] [CrossRef]
- Abdella, G.M.; Khalifa, N.A.; Tayseer, M.A.; Hamouda, A.M.S. Modelling Trends in Road Crash Frequency in Qatar State. Int. J. Oper. Res. 2019, 34, 507. [Google Scholar] [CrossRef]
- Park, Y.S.; Egilmez, G.; Kucukvar, M. A Novel Life Cycle-Based Principal Component Analysis Framework for Eco-Efficiency Analysis: Case of the United States Manufacturing and Transportation Nexus. J. Clean. Prod. 2015, 92, 327–342. [Google Scholar] [CrossRef]
- Abdella, G.M.; Kucukvar, M.; Onat, N.C.; Al-Yafay, H.M.; Bulak, M.E. Sustainability Assessment and Modeling Based on Supervised Machine Learning Techniques: The Case for Food Consumption. J. Clean. Prod. 2020, 251, 119661. [Google Scholar] [CrossRef]
- Lam, J.S.L.; Li, K.X. Green Port Marketing for Sustainable Growth and Development. Transp. Policy 2019, 84, 73–81. [Google Scholar] [CrossRef]
- de la Peña Zarzuelo, I.; Freire Soeane, M.J.; López Bermúdez, B. Industry 4.0 in the Port and Maritime Industry: A Literature Review. J. Ind. Inf. Integr. 2020, 20, 100173. [Google Scholar] [CrossRef]


| Model | Inputs | Outputs |
|---|---|---|
| Model A | Carbon dioxide emission, electricity consumption, waste, water consumption | Employee |
| Model B | Carbon dioxide emission, electricity consumption, waste, water consumption | Revenue |
| Model C | Carbon dioxide emission, electricity consumption, waste, water consumption | Container throughput |
| Model D | Carbon dioxide emission, electricity consumption, waste, water consumption | Employee Revenue Container throughput |
| Metrics | Economic | Environmental | Social |
|---|---|---|---|
| Revenue | √ | ||
| Number of employees | √ | ||
| Number of passengers | √ | ||
| Assets | √ | ||
| CO2 | √ | ||
| Electricity consumption | √ | ||
| Waste | √ | ||
| Water consumption | √ | ||
| Fuel consumption | √ | ||
| Number of accidents | √ | ||
| Injury rate | √ | ||
| Amount of training | √ |
| Emissions | Electricity | Waste | Water | Employees | Revenue | Container Throughput | |
|---|---|---|---|---|---|---|---|
| Max | 3.78 × 10⁶ | 3.18 × 10⁹ | 2.55 × 10⁶ | 3.06 × 10⁶ | 8.74 × 10³ | 5.07 × 10⁹ | 2.10 × 10⁷ |
| Min | 3.57 × 10² | 2.29 × 10⁵ | 3.87 | 1.81 × 10³ | 6.10 × 101 | 1.73 × 10⁷ | 2.17 × 10⁴ |
| Avg | 2.57 × 10⁵ | 2.15 × 10⁸ | 1.68 × 10⁵ | 2.88 × 10⁵ | 2.02 × 10³ | 6.39 × 10⁸ | 4.85 × 10⁶ |
| σ | 7.96 × 10⁵ | 6.74 × 10⁸ | 5.43 × 10⁵ | 6.73 × 10⁵ | 2.85 × 10³ | 1.15 × 10⁹ | 6.19 × 10⁶ |
| Emissions | Electricity | Waste | Water | Employees | Revenue | Throughput | |
|---|---|---|---|---|---|---|---|
| Emissions | 1.00 | 0.99 | 0.08 | 0.01 | 0.03 | 0.90 | 0.05 |
| Electricity | 0.99 | 1.00 | 0.07 | 0.01 | 0.05 | 0.93 | 0.14 |
| Waste | 0.08 | 0.07 | 1.00 | 0.09 | 0.15 | 0.13 | 0.20 |
| Water | 0.01 | 0.01 | 0.09 | 1.00 | 0.38 | 0.20 | 0.37 |
| Employees | 0.03 | 0.05 | 0.15 | 0.38 | 1.00 | 0.26 | 0.71 |
| Revenue | 0.90 | 0.93 | 0.13 | 0.20 | 0.26 | 1.00 | 0.47 |
| Throughput | 0.05 | 0.14 | 0.20 | 0.37 | 0.71 | 0.47 | 1.00 |
| Test Models | K-Stat | p-Value | Outcome | |
|---|---|---|---|---|
| Significant | Insignificant | |||
| Model A vs. Model B | 12.214 | 0.101 | √ | |
| Model A vs. Model C | 19.429 | 0.003 | √ | |
| Model A vs. Model D | 21.452 | 0.004 | √ | |
| Model B vs. Model C | 23.786 | 0.000 | √ | |
| Model B vs. Model D | 9.238 | 0.215 | √ | |
| Model C vs. Model D | 19.024 | 0.011 | √ | |
Disclaimer/Publisher’s Note: The statements, opinions and data contained in all publications are solely those of the individual author(s) and contributor(s) and not of MDPI and/or the editor(s). MDPI and/or the editor(s) disclaim responsibility for any injury to people or property resulting from any ideas, methods, instructions or products referred to in the content. |
© 2024 by the author. Licensee MDPI, Basel, Switzerland. This article is an open access article distributed under the terms and conditions of the Creative Commons Attribution (CC BY) license (https://creativecommons.org/licenses/by/4.0/).
Share and Cite
Bulak, M.E. A Frontier Approach to Eco-Efficiency Assessment in the World’s Busiest Sea Ports. Sustainability 2024, 16, 1142. https://doi.org/10.3390/su16031142
Bulak ME. A Frontier Approach to Eco-Efficiency Assessment in the World’s Busiest Sea Ports. Sustainability. 2024; 16(3):1142. https://doi.org/10.3390/su16031142
Chicago/Turabian StyleBulak, Muhammet Enis. 2024. "A Frontier Approach to Eco-Efficiency Assessment in the World’s Busiest Sea Ports" Sustainability 16, no. 3: 1142. https://doi.org/10.3390/su16031142
APA StyleBulak, M. E. (2024). A Frontier Approach to Eco-Efficiency Assessment in the World’s Busiest Sea Ports. Sustainability, 16(3), 1142. https://doi.org/10.3390/su16031142