Article

Evaluation of Service Quality in Passenger Transport with a Focus on Liner Maritime Passenger Transport—A Systematic Review

by
Jelena Žanić Mikuličić
1,*,
Ines Kolanović
2,
Alen Jugović
2 and
Dalibor Brnos
3
1
Faculty of Maritime Studies, University of Split, 21 000 Split, Croatia
2
Faculty of Maritime Studies, University of Rijeka, 51 000 Rijeka, Croatia
3
Port Authority Pula, Kandlerova 42, 52 000 Pula, Croatia
*
Author to whom correspondence should be addressed.
Sustainability 2024, 16(3), 1125; https://doi.org/10.3390/su16031125
Submission received: 19 December 2023 / Revised: 15 January 2024 / Accepted: 22 January 2024 / Published: 29 January 2024
(This article belongs to the Special Issue Sustainability in the Maritime Transport Research and Port logistics)

Abstract

:
Every mode of passenger transport plays an important, strategic role in the lives of a country’s people, its economy, its global business, and its tourism. In today’s competitive world, passenger transport relies heavily on its performance, which in turn is determined by service quality provided to customers. The evaluation of service quality in passenger transport is crucial to ensure acceptable quality standards for users and to improve the services offered to passengers and travelers. The aim of this paper is to provide an overview of the methods used to evaluate service quality in passenger transport in the Web of Science (WoS) Core Collection, with a particular focus on liner maritime passenger transport. The results show that a combination of qualitative and quantitative methods is most frequently used in the selected articles. However, the number of scientific articles dealing with this topic has increased in recent years. This shows the growing interest in analyzing service quality for a particular mode of transport. The majority of articles are assigned to the areas of Transportation, Business and Economics, Science and Technology, Environmental Sciences, etc. Future research should focus on evaluating service quality through the impact of new technologies such as artificial intelligence, including relevant factors, on service quality in passenger transport.

1. Introduction

Many people use the different modes of transport in their daily lives. Transport activity depends on the development of other economic sectors and is linked to the social and economic development of a country. When predicting the economic development of a country, it is therefore important to analyze and evaluate the direct and indirect influence of a transport system and its individual branches on the social and economic sectors of a country or region. Furthermore, a well-integrated and efficient transport system is an important driver of economic prosperity as it connects people, businesses, and markets in a dynamic and interconnected global landscape [1].
The maritime industry is concerned with the transport of goods and passengers by ship and can therefore be divided into cargo and passenger shipping. It makes a major contribution to economic growth and job creation. In addition to the seafarers who operate the ships, this sector supports a large number of jobs in shipbuilding, harbor operations, logistics, and related industries and thus makes a significant contribution to a country’s employment situation [2]. Furthermore, sea transport handles more than 10 billion tons of shipments, constituting over 80% of global merchandise trade. Maritime transportation and shipping hold immense importance for numerous countries across the globe. It is the backbone of international trade, providing a cost-effective and efficient means of moving goods between countries [3,4]. Many countries rely on seaborne trade to secure a stable and reliable supply of energy, ensuring the functioning of industries and meeting the energy needs of their populations. Addressing the existing challenges in maritime transport is crucial to ensure the sustainability, safety, and efficiency of this essential mode of global trade. Moreover, maritime transportation contributes to environmental challenges. There is a growing need to transition towards more sustainable practices to minimize the environmental impact of shipping [5]. In addition, the maritime industry should take advantage of the increased digitalization and technology adoption to improve its efficiency. The introduction of network visualization techniques would include nodes representing key players in the maritime industry, such as companies, regulatory bodies, and technological advances, in general [6].
Nevertheless, liner shipping is also of particular importance in the maritime sector, as it ensures constant and regular connections over long distances within a country, between the coasts of neighboring countries, between islands and the mainland, and between the islands themselves for their social and economic development. It is an effective means of transport for travelers and islanders to go inland when a bridge or other routes cannot connect the areas. Public liner shipping has a constant schedule and a fixed direction of travel over a long period, as well as several ports of embarkation and disembarkation with a larger number of vessels, which should be characterized by the stability of transport [7,8]. Therefore, time management is of crucial importance. Various factors such as unfavorable weather conditions, port congestion, mechanical failure, or unforeseen events can lead to disruptions in the established schedules and affect service quality. Therefore, punctuality and adherence to timetables are key components of service quality. Moreover, consistent and reliable scheduled services create customer confidence and contribute to overall customer satisfaction [9,10].

2. Literature Review on Service Quality

2.1. Service Quality in Passenger Transport

Service quality (SQ) is an organization’s ability to meet and exceed customer expectations. It is determined by comparing expected performance with the customer’s perception of how that performance was delivered. Service quality is evaluated through various dimensions, including reliability, safety, flexibility, convenience, and empathy. These dimensions represent the gap between users’ expectations and their perception of the service [11]. According to Dewa, service quality monitors how well an organization’s level of service meets customer requirements. It means understanding customer expectations, setting standards, implementing monitoring mechanisms, utilizing technology, and continuously improving to ensure that a company’s services meet customer requirements [12].
Service quality in passenger transport refers to the overall quality of service provided to passengers during their journey on the different modes of transport such as buses, trains, planes, and ships. The emphasis on service quality has become increasingly important in the transport industry as passengers not only want to travel efficiently and on time but also expect a positive and satisfying experience. Satisfaction with passenger transport has the most direct influence on people’s willingness to use public transport. It embodies the image and service level of transport companies. Evaluating the different aspects of service quality in passenger transport could highlight areas where the service is poor, with the aim of improving it and attracting new users [13]. Therefore, the success of a passenger transport system depends on the number of passengers it can attract and retain. Furthermore, service quality reflects the perspective of transport users and is usually represented by a qualitative and a quantitative measurement or prediction of how a transport link, facility, or system performs under specific demand, supply, and control conditions. Moreover, service quality in passenger transport comprises many factors such as speed, reliability, comfort, convenience, safety, special services and innovation, system efficiency, pollution, etc. [14].
When talking about SQ in passenger transport, it is inevitable to mention the European standard EN 13816:2002 (Public Passenger Transport Services) that serves as a Europe-wide benchmark for evaluating the quality of public passenger transport operators. In parallel, the ISO 9001:2015 standard [15] is fundamental in the realm of quality management. ISO 9001 defines quality control as a process wherein stakeholders within a company evaluate the quality of all factors involved in production [16,17].

2.2. Methods for Service Quality Evaluation in Passenger Transport

In evaluating service quality in passenger transport, various methods are employed to evaluate the effectiveness of provided services. These methods play a crucial role in identifying areas for improvement and ensuring a high level of passenger satisfaction [18]. They are tailored to the specific context of influencing factors, which include lifestyle, individual characteristics, the type of trip, and mode choice options [19].
Bearing this in mind, considerable progress has been achieved in the discussion on how to measure service quality, particularly within the rich literature of the transport sector, where various methods have been explored and research continues to grow. The choice of the most appropriate method depends on the specific objective of the analysis. Analyzing the quality aspects of transport services is crucial for identifying strategies to enhance service and satisfy users. Therefore, the service quality evaluation holds fundamental importance [20]. Numerous authors have delved into the concept and evaluation of service quality in transport service, exploring the relationships between service quality, customer satisfaction, and purchase intentions.
Parasuraman et al. propose five dimensions of service quality and introduce the SERVQUAL (Service Quality Model), a survey model based on the premise that customers evaluate service quality by comparing their perceptions with their expectations. This model employs the RATER scale to measure reliability, safety, tangibility, empathy, and responsiveness [21,22]. Although applicable in a wide range of service industries, such as financial institutions, libraries, hotels, medical centers, and transport, some of its components may require reformulation or supplementation with additional elements. As an alternative to SERVQUAL, the pure performance measure (SERPERF) was developed [23,24].
In addition to various methods based on customer evaluation, data types can be broadly categorized into two main groups: qualitative and quantitative. Qualitative data involve information that are categorized and described, often in the form of textual descriptions [25,26]. Common qualitative methods for evaluating service quality include interviews, questionnaires, and surveys. In these methods, users assign values to defined quality attributes using measurement scales. On the other hand, quantitative data comprise numerical measurements that can be analyzed statistically. Quantitative methods for evaluating service quality include regression analysis, confirmatory analysis, multi-criteria analysis, Six Sigma, fuzzy logic, etc. [27]. These models establish relationships between global service quality (dependent variable) and specific attributes (independent variables). Linear models, such as multiple regression models, non-linear models, such as structural equation modeling (SEM), and logit models, where all random components are independent and identically distributed [28], fall within this category.
The aim of this paper is to provide an overview of the methods used to evaluate service quality in passenger transport with a particular focus on liner maritime passenger transport. The overview is conducted through three approaches: (1) a structured review of the literature, examining the relevant terms in titles and abstracts of scientific articles about service quality in passenger transport and methods in the Web of Science Core Collection, (2) a detailed review of selected scientific articles found in the Web of Science Core Collection, and (3) a detailed review of selected scientific articles published on the evaluation methods of service quality in passenger transport. To ensure the overall review process adheres to standards, this paper follows the Preferred Reporting Items for Systematic Reviews and Meta-Analyses (PRISMA 2020) guidelines [29]. Therefore, the methodology used is presented in the PRISMA flow (Figure 1).
The search is performed using the string All fields in the Web of Science database for the keywords service quality* AND maritime passenger transport* (Figure 1). The general search for abstracts of scientific articles in the Web of Science found 80 relevant publications on service quality in passenger transport. Some of the articles were excluded by reading the entire publication.

3. Results

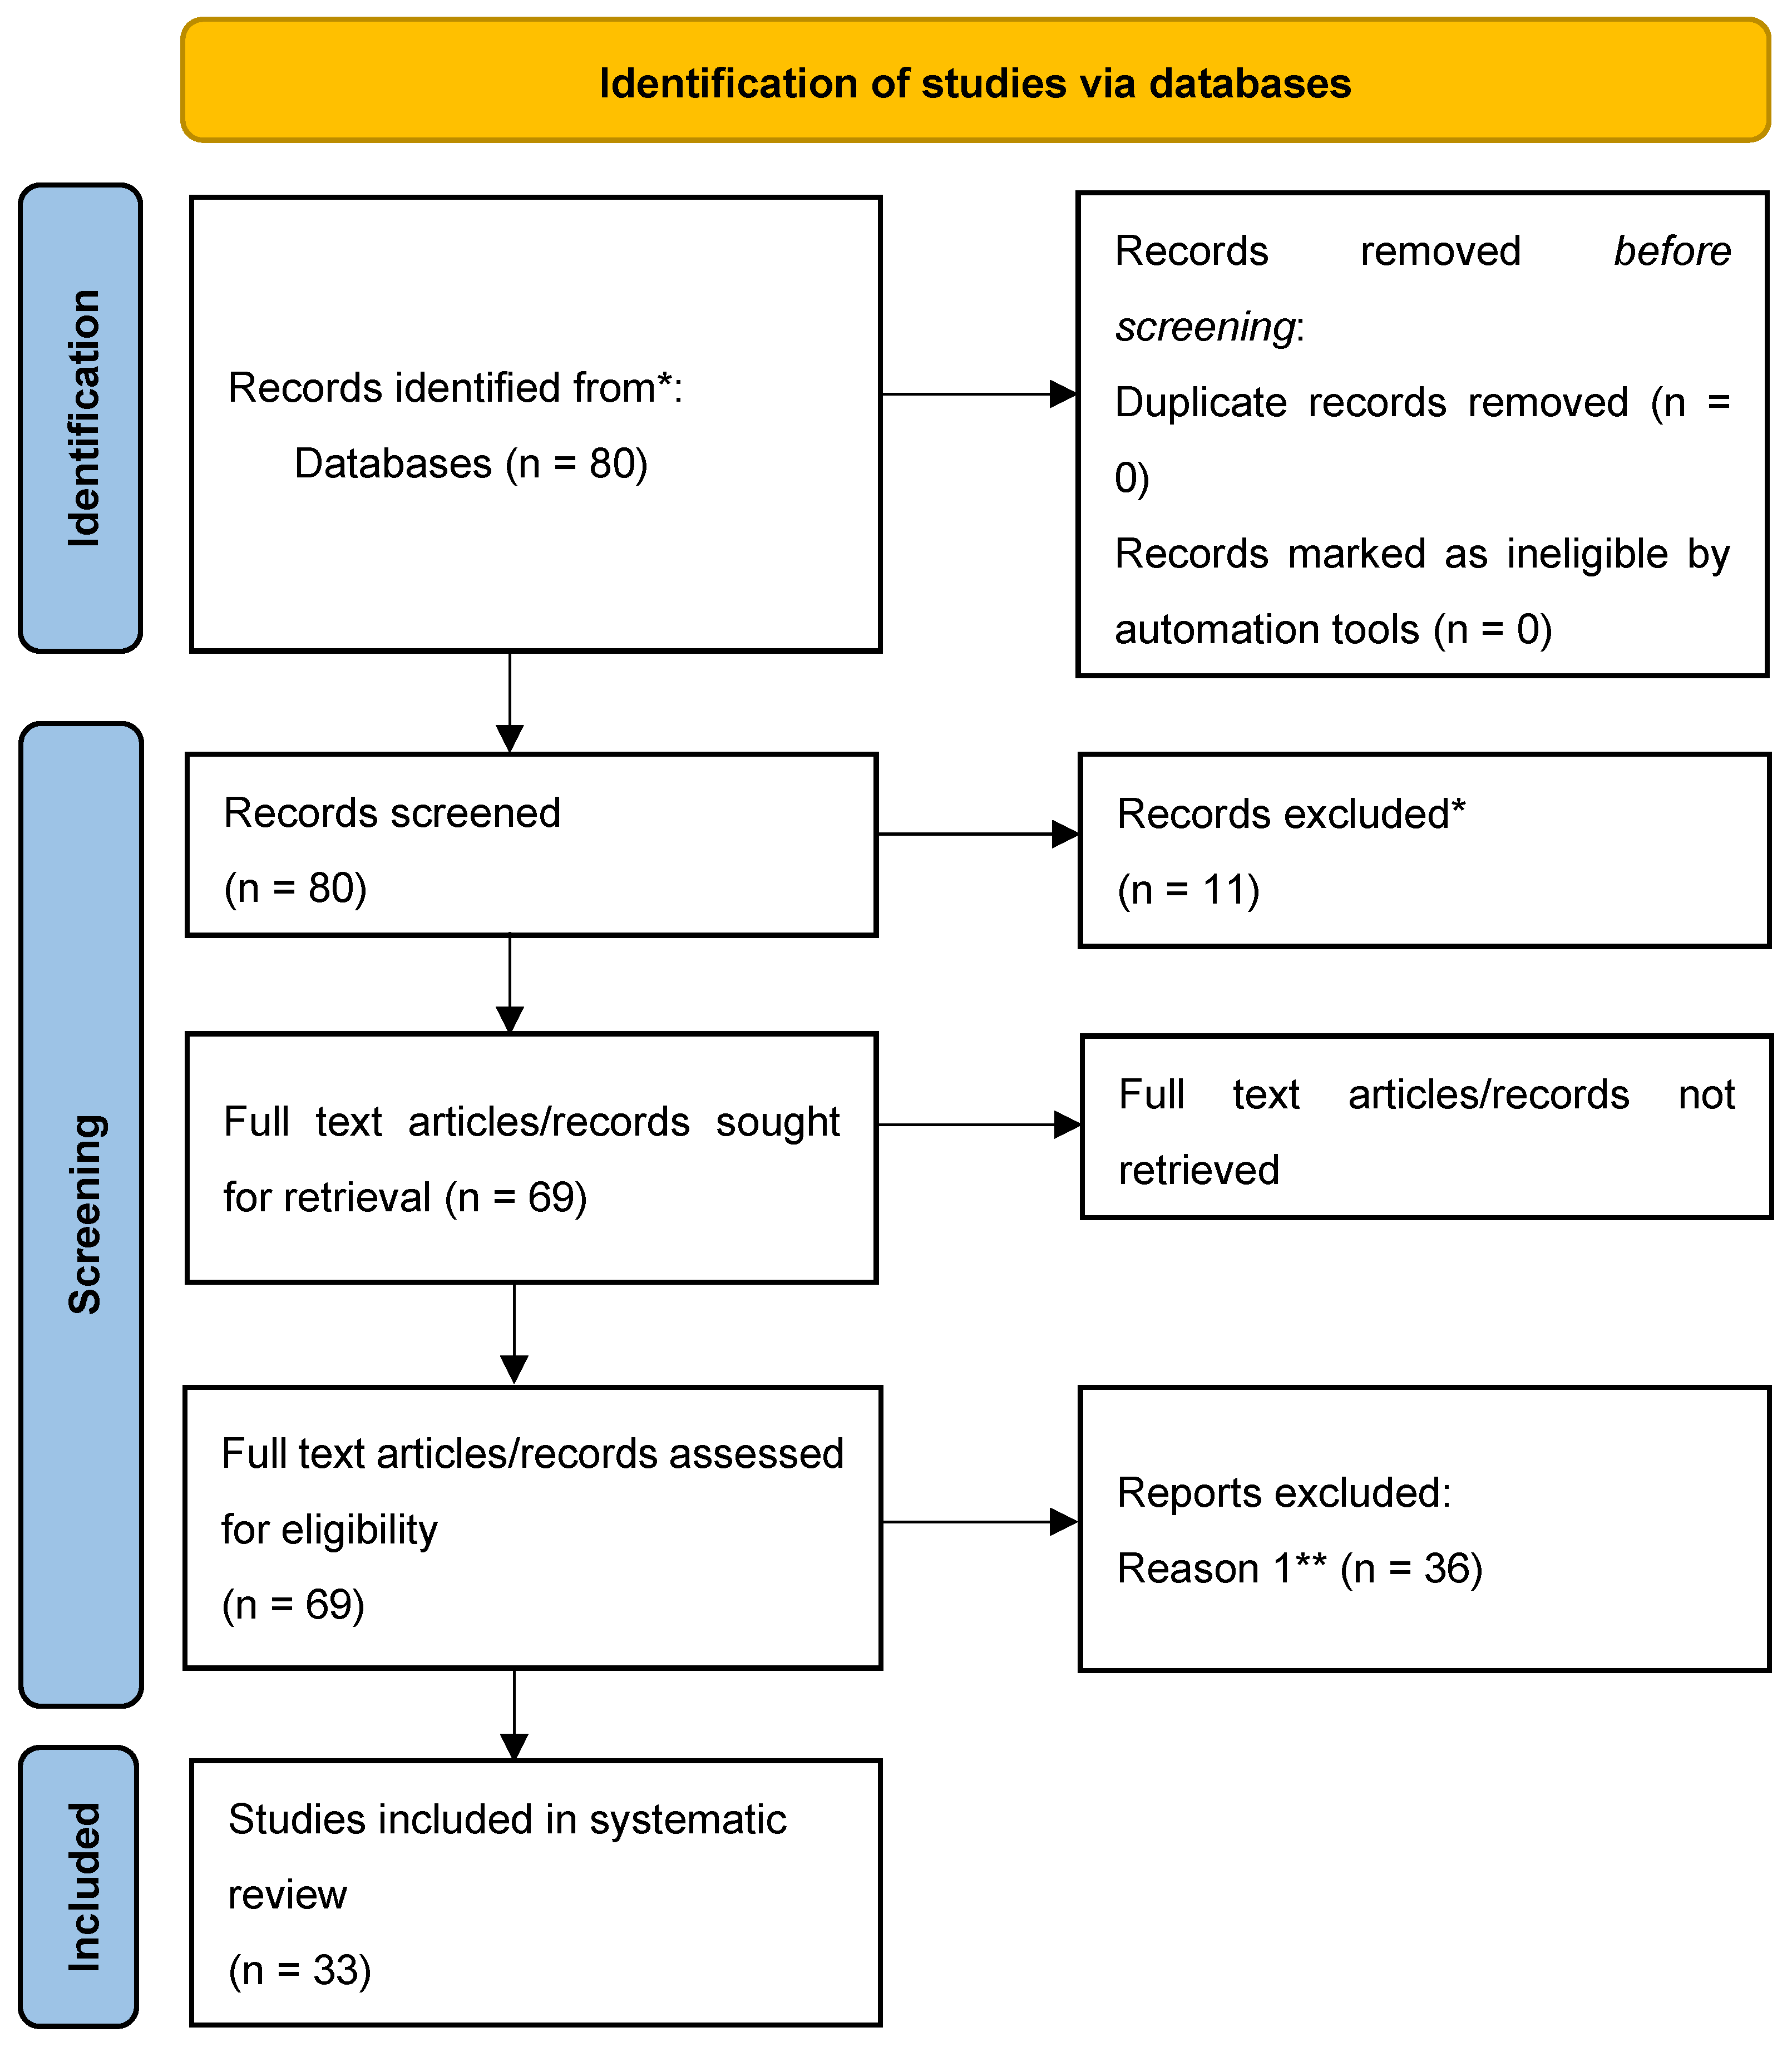
3.1. A Structured Review of the Literature

After screening the data sets, the search was changed according to the provided keywords that were entered into the Web of Science Core Collection search. Applying the keywords service quality* AND passenger transport*, the search resulted in 2627 articles. The keywords service quality evaluation* AND passenger transport* excluded 364 articles. Furthermore, service quality* AND passenger transport* and methods* AND evaluation* resulted in 69 articles. The search limited the number of articles found with the keywords service quality* AND maritime passenger transport* (80), service quality evaluation* AND maritime passenger transport* (5), and service quality* AND maritime passenger transport* AND evaluation* (5). The keywords service quality* AND coastal maritime passenger transport* excluded four articles. Finally, a search for articles on service quality* AND coastal maritime passenger transport* AND evaluation* produced one Ex particle, as did service quality* AND liner maritime passenger transport* and service quality* AND line maritime passenger transport* AND evaluation*. There were no articles found with the keywords service quality* AND maritime passenger transport* and methods* AND evaluation*, or service quality* AND public coastal line maritime transport*. The search based on the keywords service quality* AND line maritime passenger transport* resulted in 10 articles.
It should be noted that this search also yielded scientific articles dealing with other types of transport, although only passenger transport was specified in the Web of Science search. It is assumed that the reason for this could be the fact that all modes of transport use similar methodologies to evaluate service quality.

3.2. Overview of the Selected Articles

After excluding certain articles that did not correspond to our search, there were 33 scientific articles that were further researched. In this step, the articles were classified according to the authors, methods, research area, and publication year.
Taking into account the methods used, the majority of the articles combined qualitative and quantitative methods. The qualitative approach included methods like questionnaires (paper or QR code questionnaires) and Ishikawa diagram. Most of the articles related to service quality attributes were dominated by the SERVQUAL dimension. None of the articles focused only on a qualitative type of method. The various quantitative methods include Structural Equation Modeling (SEM) Partial Least Square Structural Equation Modeling (PLS-SEM), Quality Function Deployment (QFD), the Importance-Performance analysis (IPA), regression analyses, confirmatory and exploratory factor analyses, MIMIC model, multicriteria data analysis (MANOVA), descriptive statistics, alternative queuing method (AQM), simulation modeling, metaheuristic methods VNB, VNDS, mathematical models (Analytic Hierarchy Process (AHP), Preference Ranking Organization Method or Enrichment Evaluations (PROMETHEE), genetic algorithm model, Rasch model and Order Probit model. In 31 articles, qualitative and quantitative methods were combined, while in two articles, only quantitative methods were used. The authors used different quantitative methods to analyze the data obtained with qualitative methods. Articles that used only quantitative methods provided data from previous research or other available sources, such as information on queue length and the average time customers spent in the queue (“queueing theory”) [30] or the “time–space” network to analyze the formation of passengers’ travel chains [31].
When looking at explanatory variables, it is observed that the majority of authors evaluated service quality through the dimensions of the SERVQUAL model such as tangibles, reliability, responsiveness, assurance, and empathy. Depending on the topic of the article, authors added specific sub-dimensions (factors or attributes). The sub-dimensions or factors utilized in the articles are safety, loyalty, competitiveness, cleanliness, value for money, speed, lines, the modernization of ships and buses, socioeconomic feature, physical features, service guarantee, servicescape, information materials, updated schedule, the frequency of departures and arrivals, transfer time, environmental awareness, etc. According to the analyzed articles, following explanatory variables have proven to be most significant for the respondents, i.e., have the greatest impact on service quality in passenger transport: staff courtesy (empathy) [30,32,33,34,35,36], loyalty [37,38,39,40], comfort [41,42,43,44], additional lines [45,46,47,48], physical features [49,50,51], service and safety perception [52,53], value for money, costs [31,54], reliability [55], safety [56], speed [57], the frequency of buses [58], servicescape [59], socioeconomic feature [60], cleanliness [61], and environmental awareness [62]. The articles also indicated certain methods that are generally best suited for evaluating service quality. These are regression, confirmatory, and exploratory factor analysis as they serve to reduce the dimensionality of a data set. Therefore, variables that are highly correlated are generated by the same factor. Compared to other approaches for evaluating service quality, the methods mentioned are general methods that can be applied to a larger number of respondents (passengers) and data sets. They can also be used to evaluate service quality in other transport and other industries. However, a brief overview of other methods used in some articles is as follows.
The questionnaire and confirmatory factor analysis (CFA) were used in the article “A hierarchical model of service quality in the airline industry” in order to evaluate service quality in airline service [44]. A questionnaire was distributed to the passengers who had used airline services during the past 12 months. The aforementioned research adequately describes the concept of service quality in the airline industry.
An interesting example of AHP and PROMETHEE methods is shown in the article “A Hybrid MCDA Methodology to Evaluate Ferry Fleet Assignment to Routes in the Greek Islands” that evaluates the optimal ferry routes [45]. For eight routes, six criteria are introduced. These criteria are passenger capacity (number), lane meters (number), cabin berths (number), speed (knots), the maneuvering ability of ship (index), and comfort (index). Results indicate that the current ferry system would be better if the ferries currently in use are reallocated between different routes. This would increase the accessibility of islands and the efficiency due to higher utilization factors.
Furthermore, the article “Passenger satisfaction evaluation of public transport using alternative queuing method under hesitant linguistic environment” investigates passenger satisfaction level in the railway transport [47]. The authors presented linguistic term sets and the queuing method (AQM) in three stages. In addition, a comparative analysis with the Fuzzy Topsis, VICTOR, and COPRAS methods was conducted. The proposed method has the following advantages: it deals with fuzziness in the evaluation process and is suitable for large groups of passengers. In contrast, the other methods are limited to small groups of passengers.
The article “Applying QFD to assess quality of short sea shipping: An empirical study on Cross-Strait high-speed ferry service between Taiwan and Mainland China” applies the QFD method and SERVQUAL to identify measures to improve the quality of the high-speed ferry service between China and Taiwan [35]. The relationship matrix for the HoQ is deciphered to assess the high-speed ferry operators. The results of this research are important to both ferry operators and policy makers. The limitations of the study are that all passenger surveys were distributed on board, and operations were limited due to bad weather.
The method used in the article “Analyze of Tanjung Api-Api Ferry Port Service Performance South Sumatera, Indonesia” is the Importance and Performance Analysis (IPA). It was used after collecting information through questionnaires from respondents (passengers and employees) of Tanjung Api-Api ferry terminal [49]. The questionnaire included parameters based on SERVQUAL—vessel operational schedule, tariff, safety, convenience, facility and availability in terms of the SQ of physical appearance (tangible), reliability, responsiveness, assurance, and empathy. The analysis using IPA method resulted in an evaluation of the level of respondents’ expectation and the level of their satisfaction.
The authors also used QFD analysis in the article “Tools of Quality in Determining the Characteristics of Services in Maritime Passenger Transport” [56]. Using the Ishikawa diagram, the authors defined the main characteristics of a maritime passenger transport service to be established on a specific route. The factors of transportation services relevant to this research are as follows: individual travel cost, travel time, safety, the social cost of transportation, and the ability to create the transportation service. A two-stage QFD process provided a comparative analysis to fulfill the required characteristics: fast passenger ships, bus, train, and car. The results not only show the dominance of road transport (car), but also point to a competitive advantage of the potential fast passenger shipping lines between ports over buses or trains.
In addition to the methods, the authors also provided an overview of the research area and publication year. According to Table 1, most articles are classified into the Transportation research area (11), then come Business and Economics, Transportation (8), Business and Economics (4), Science and Technology—Other Topics—Environmental Sciences and Ecology (3), Engineering (2), Science and Technology—Other Topics—Transportation (1), Psychology (1), Social Sciences—Other Topics—Business and Economics (1), Nuclear Science and Technology, Physics (1), and Engineering Transportation (1). Most of the articles are categorized into one research area (53%), but certain articles are also categorized into more than one research area according to the WoS (47%).
Nevertheless, the number of scientific articles dealing with the topic of service quality in passenger transport has increased in recent years according to the publication year. Most articles dealing with service quality in passenger transport according to Table 1 were published in 2018 (six of them). In 2022, 2021, and 2019, four articles were published. There were three articles published in 2023, 2016, and 2015 and two in 2017. One article each was published in 2010, 2013, 2014, and 2017. Thus, it is evident that many researchers show an increasing interest in studying service quality and its evaluation in a particular mode of transport.
In addition, the authors also provided an overview of the scientific articles dealing with service quality in liner maritime passenger transport (Table 2). These articles are excluded from the 33 listed above. The articles are also classified according to article, methods, research area, and publication year.
As presented in Table 2, there were five articles selected dealing with service quality in liner maritime passenger transport. The articles use a combination of qualitative and quantitative methods. The qualitative methods include questionnaires in all five articles, whereas the quantitative methods include confirmatory and exploratory analyses [32,33,51], descriptive statistics [48], and Quality Function Deployment [38].
Explanatory variables such as staff courtesy (empathy) [32,33,35], physical features [51], and additional lines [48] have proven to be the most significant for the respondents, i.e., they have the greatest impact on service quality in liner maritime passenger transport. There is a brief overview of other methods used in the articles.
The article “The role of onboard experiencescape and social interaction in the formation of ferry passengers’ emotions” examines whether and how social interactions between the crew and passengers affect passengers’ emotions in ferries in Greece [32]. Data were collected through a survey of 839 international ferry passengers and were analyzed using exploratory and confirmatory factor analyses, as well as regression analyses. The results showed that social interactions onboard affect passengers’ emotions and verified the applicability of the “experiencescape” scale in the ferry sector. Authors suggest that future studies should examine more recent studies in order to reach specific conclusions that will enrich knowledge about the relevant areas.
The combination of qualitative and quantitative methods is also used in the article “Examining the Mediating Effect of Customer Experience on the Emotions–Behavioral Intentions Relationship: Evidence from the Passenger Transport Sector” [33]. The paper examines the influence of customers’ experience on the relationship between customers’ emotions and customers’ behavioral intentions. After the questionnaire-based survey of ferry passengers (840), the data were collected and analyzed through exploratory and confirmatory factor analyses and regression analysis. The results of the research emphasize the mediating role of customer experience in the relationship between customers’ emotions and customers’ behavioral intentions. The limitation of the study is that a larger sample could have been used. Further research is needed to improve the understanding of the principles of service quality and customer satisfaction and their evaluation, as these concepts are critical to the sustainability and development of service organizations.
The authors of the article “Applying QFD to assess quality of short sea shipping: An empirical study on Cross-Strait high-speed ferry service be-tween Taiwan and Mainland China” tried to explore the customer requirements and technical measures to evaluate service quality in high-speed ferries in Taiwan through the QFD method [35]. The first step was a modified questionnaire based on the SERVQUAL dimension. The results show that passengers are generally satisfied with the employees’ service and courtesy, but there is a certain lack of special assistance, safety, and efforts from ferry operators.
In the article “Development Opportunities of Liner Maritime Passenger Traffic in the Republic of Croatia” the authors examine consumer satisfaction with the services of liner maritime passenger traffic in Croatia [48]. The data were collected by the means of a questionnaire survey of 117 passengers. The results show that more ferry crossings should be introduced in order to decrease traffic congestion and waiting times. The limitation of the study is that the questionnaires could have been distributed to the tourist offices where passenger ships park. In addition, the questionnaire was completed online, and it is likely that many people were unable to participate, especially older one, etc.
In the article “The relative importance of service features in explaining customer satisfaction: A comparison of measurement models” the author created a model, “servicescape,” for directly measuring the physical features of the service [51]. The paper tried to assess the relative importance of various service quality dimensions in explaining customer satisfaction and to examine whether this evaluation is affected by the measurement instrument that is used. Data were collected through a survey of 434 passengers in Greece (the port of Piraeus) and tested through the SERVQUAL model. The study found out that there is an indirect effect on customer satisfaction from intangible service attributes. The results create considerations about the application of SERVQUAL in passenger shipping. The authors encountered certain problems, and it seemed more appropriate to test a two-factor model such as the Nordic quality model. It could offer the possibility of developing a condensed and valid instrument for overall satisfaction that contains only a “physical” and an “interactive” component.
According to Table 2, three articles were published in Business and Economics and one each in Transportation Research Area and Psychology. One of these articles is also divided into two categories (Business and Economics, Transportation). Three articles were published in 2018, 2020, and 2023, while one each was published in 2010 and 2022.

4. Discussion and Conclusions

The aim of this paper is to provide an overview of articles focusing on methods used for the evaluation of service quality. The authors were focused on the evaluation of service quality in passenger transport only present in the Web of Science Core Collection (WoS). They selected 33 relevant articles on the evaluation of service quality in passenger transport, and 5 of those articles focused on the evaluation of service quality in liner maritime passenger transport. According to the studied articles, it can be concluded that data on SQ and its evaluation methods are the basis of any service used by consumers and are often the deciding factor in the choice of transport mode and thus the means of transport. Nevertheless, the number of scientific articles dealing with this topic has increased in recent years according to publication year in WoS. This shows an increasing interest in analyzing service quality in a particular mode of transport. Additionally, the analysis of the research areas of the selected articles from WoS showed that the majority of articles were published in the areas of Transportation, Business and Economics, Science and Technology, and Environmental Sciences.
A systematic review of the articles was conducted to select and categorize the types of methods used. Its detailed search process is described in Figure 1 and Table 1 and Table 2. Depending on the methods used, each article was classified into a qualitative and a quantitative approach category. The search revealed that authors predominantly combined qualitative and quantitative methods. Qualitative data included questionnaires and the Ishikawa diagram. The selected quality attributes were assigned values, primarily using the Likert scale. These attributes were mostly obtained from the SERVQUAL model. Later, the data were processed using statistical methods or genetic algorithms for modeling and optimization, incorporating the specific estimation coefficients. Authors that used only quantitative methods collected data from previous research or other available sources. The most commonly used quantitative methods for evaluating service quality included confirmatory and exploratory analyses, multicriteria data analysis, structural equation modeling, Partial Least Square Structural Equation Modeling (PLS-SEM), Quality Function Deployment (QFD), Importance Performance Analysis (IPA), MIMIC model, Preference Ranking Organization Method for Enrichment Evaluations (PROMETHEE), genetic algorithm model, Rasch model, Order-Probit model, etc. The articles have shown that the best methods for evaluating service quality are regression, confirmatory and exploratory analyses. According to the explanatory variables, staff courtesy (empathy), loyalty, comfort, additional lines, and physical features have the greatest impact on service quality in passenger transport.
The study highlighted three important facts: the continued importance of the SERVQUAL model as a foundation for many researchers engaged in service quality evaluations; the application of qualitative methods as the basis for obtaining data for the application of quantitative methods; and the validity and the applicability of these methods in the dynamic landscape of passenger transport and service quality. Therefore, the main contribution of this paper is a summary of the most commonly used methods for evaluating service quality in passenger transport.
However, this research has potential limitations, such as considering only one database due to the extensive research topic and the potential different interpretations of the terms or keywords searched. Some papers dealing with this topic may not have been included because they were not published in WoS, or the search was only conducted with the specific keywords relevant to those papers, as described in Section 3.1. It would be interesting for future research to compare several databases on the same topic and observe which new methods are used by researchers to evaluate service quality in passenger transport. As the transportation industry undergoes a rapid change due to technological advances, the changing consumer expectations, and the increasing importance of sustainability, there is an urgent need for continuous research to evaluate and improve service quality. Understanding how new technologies impact factors such as safety, efficiency, and passenger experience is essential for the development of future-proof metrics for service quality.
The existing literature identified in this paper can serve as a basis for a more in-depth analysis of the methods that can be used to identify the elements contributing to the evaluation of service quality in passenger transport. It is necessary to identify all factors of passenger transport (economic, social, environmental, technical, technological, organizational, and others) that influence service quality. Future research can incorporate these findings to guide service quality methods in logistics applications, cargo shipping, ports, etc.

Author Contributions

Conceptualization, J.Ž.M., I.K. and A.J.; methodology J.Ž.M. and I.K.; validation, J.Ž.M.; formal analysis J.Ž.M., I.K., A.J. and D.B.; original draft preparation J.Ž.M.; visualization I.K. and D.B.; writing J.Ž.M.; review and editing I.K. and A.J. All authors have read and agreed to the published version of the manuscript.

Funding

This research was funded by the ZIP UNIRI project, UNIRI—ZIP—2103-1-22 and UNIRI—ZIP—2103-5-22 of the University of Rijeka.

Institutional Review Board Statement

Not applicable.

Informed Consent Statement

Not applicable.

Data Availability Statement

Data are contained within the article.

Conflicts of Interest

The authors declare no conflicts of interest.

References

  1. Rodrigue, J.P.; Notteboom, T. Transportation and Economic Development. Geogr. Transp. Syst. 2013, 3, 76–83. [Google Scholar]
  2. Li, B.; Elmi, Z.; Manske, A.; Jacobs, E.; Lau, Y.; Chen, Q.; Dulebenets, M.A. Berth allocation and scheduling at marine container terminals: A state-of-the-art review of solution approaches and relevant scheduling attributes. J. Comput. Des. Eng. 2023, 10, 1707–1735. [Google Scholar] [CrossRef]
  3. Kim, J.; Kim, H. Evaluation of the Efficiency of Maritime Transport Using a Network Slacks-Based Measure (SBM) Approach: A Case Study on the Korean Coastal Ferry Market. Sustainability 2021, 13, 609. [Google Scholar] [CrossRef]
  4. Wei, Z.; Zhao, L.; Zhang, X.; Lv, W. Jointly optimizing ocean shipping routes and sailing speed while considering involuntary and voluntary speed loss. Ocean Eng. 2022, 245, 110460. [Google Scholar] [CrossRef]
  5. Dulebenets, M.A. Multi-objective collaborative agreements amongst shipping lines and marine terminal operators for sustainable and environmental-friendly ship schedule design. J. Clean. Prod. 2022, 342, 130897. [Google Scholar] [CrossRef]
  6. Ma, W.; Zhang, J.; Han, Y.; Zheng, H.; Ma, D.; Chen, M. A chaos-coupled multi-objective scheduling decision method for liner shipping based on the NSGA-III algorithm. Comput. Ind. Eng. 2022, 174, 108732. [Google Scholar] [CrossRef]
  7. Chen, X.; Wang, Z.; Hua, Q.; Shang, W. AI-Empowered Speed Extraction via Port-Like Videos for Vehicular Trajectory Analysis. IEEE Trans. Intell. Transp. Syst. 2023, 24, 4541–4552. [Google Scholar] [CrossRef]
  8. Xiao, G.; Chen, L.; Chen, X.; Jiang, C. A hybrid visualization model for knowledge mapping: Scientometrics, SAOM, and SAO. IEEE Trans. Intell. Transp. Syst. 2023, 99, 1–14. [Google Scholar] [CrossRef]
  9. Hu, H.H.; Kandampully, J.; Juwaheer, D.D. Relationships and impacts of service quality, perceived value, customer satisfaction, and image: An empirical study. Serv. Ind. J. 2009, 29, 111–125. [Google Scholar] [CrossRef]
  10. Elmi, Z.; Li, B.; Liang, B.; Lau, Y. An epsilon-constraint-based exact multi-objective optimization approach for the ship schedule recovery problem in liner shipping. Comput. Ind. Eng. 2023, 183, 109472. [Google Scholar] [CrossRef]
  11. Prakash, G. Understanding service quality: Insights from the literature. J. Adv. Manag. Res. 2019, 16, 64–90. [Google Scholar] [CrossRef]
  12. Dewa, A. Empirical Analysis of Service Quality on Consumer Satisfaction in Maritime Transportation. Res. Horiz. 2023, 3, 531–541. [Google Scholar]
  13. Too, L.; Earl, G. Public transport service quality and sustainable development: A community stakeholder perspective. Sustain. Dev. 2010, 18, 51–61. [Google Scholar] [CrossRef]
  14. De Oña, J.; de Oña, R.; López, G. Transit service quality analysis using cluster analysis and decision trees: A step forward to personalized marketing in public transportation. Transportation 2016, 43, 725–747. [Google Scholar] [CrossRef]
  15. ISO 9001:2015; Quality Management Systems—Requirements. ISO: Geneva, Switzerland, 2015.
  16. EN 13816:2002 (MAIN); Transportation-Logistics and Services-Public Passenger Transport-Service Quality Definition, Targeting and Measurement. 2002. Available online: https://standards.iteh.ai/catalog/standards/cen/3e200479-ad74-4a53-95c6-db473da922fb/en-13816-2002 (accessed on 30 August 2023).
  17. Hrvatski Normativni Dokument. Available online: https://repozitorij.hzn.hr/norm/HRN+EN+13816%3A2008 (accessed on 30 August 2023).
  18. Yannis, T.; Georgia, A. A complete methodology for the quality control of passenger services in the public transport business. Eur. Transp. 2008, 38, 1–16. [Google Scholar]
  19. Guirao, B.; García-Pastor, A.; López-Lambas, M.E. The importance of service quality attributes in public transportation: Narrowing the gap between scientific research and practitioners’ needs. Transp. Policy 2016, 49, 68–77. [Google Scholar] [CrossRef]
  20. Joewono, T.B.; Tarigan, A.K.; Susilo, Y.O. Road-based public transportation in urban areas of Indonesia: What policies do users expect to improve the service quality? Transp. Policy 2016, 49, 114–124. [Google Scholar] [CrossRef]
  21. Parasuraman, A.; Zeithaml, V.A.; Berry, L.L. A conceptual model of service quality and its implications for future research. J. Mark. 1995, 49, 41–50. [Google Scholar] [CrossRef]
  22. Zeithaml, V.A.; Parasuraman, A.; Berry, L.L. Delivering Quality Service: Balancing Customer Perceptions And Expectations; The Free Press: New York, NY, USA, 1990. [Google Scholar]
  23. Ebong, J. A qualitative analysis of service experience, perceptions of service quality and service management. Int. J. Qual. Res. Serv. 2017, 2, 280–294. [Google Scholar] [CrossRef]
  24. Eboli, L.; Mazzulla, G. Customer satisfaction as a measure of service quality in public transport planning. Int. Encycl. Transp. 2021, 13816, 220–224. [Google Scholar]
  25. Jelaska, I.; Mandić-Jelaska, P.; Lovrić, F. Experimental comparation of Guttman Kaiser, Plum Brandy, scree and parallel analysis-Monte Carlo criterions in exploratory factor analysis via selected kinesiological research. Acta Kinesiol. 2012, 6, 80–84. [Google Scholar]
  26. De Oña, J.; De Oña, R.; Eboli, L.; Mazzulla, G. Perceived service quality in bus transit service: A structural equation approach. Transp. Policy 2013, 29, 219–226. [Google Scholar] [CrossRef]
  27. Cascetta, E. Transportation Systems Engineering: Theory and Methods; Springer Science & Business Media: Berlin/Heidelberg, Germany, 2013; Volume 49, ISBN 0792367928. [Google Scholar]
  28. Gounaris, S. Measuring service quality in b2b services: An evaluation of the SERVQUAL scale vis-à-vis the INDSERV scale. J. Serv. Mark. 2005, 19, 421–435. [Google Scholar] [CrossRef]
  29. University of Guelph-Humber Library Services Page Title: PRISMA Diagram and Checklist. Available online: https://guelphhumber.libguides.com/c.php?g=213266&p=1406923 (accessed on 27 August 2023).
  30. Begen, M.A.; Fung, R.; Granot, D.; Granot, F.; Hall, C.; Kluczny, B. Evaluation of a centralised transportation assistance system for passengers with special needs at a Canadian airport. Int. J. Shipp. Transp. Logist. 2018, 10, 355–376. [Google Scholar] [CrossRef]
  31. Lu, J.; Yang, Z.; Dong, X.; Zhu, X. Design of timetable for airport coach based on ‘time–space’ network and passenger’s trip chain. Transport 2015, 33, 32–40. [Google Scholar] [CrossRef]
  32. Pantouvakis, A.; Gerou, A. The role of onboard experiencescape and social interaction in the formation of ferry passengers’ emotions. WMU J. Marit. Aff. 2023, 22, 365–384. [Google Scholar] [CrossRef]
  33. Gerou, A. Examining the Mediating Effect of Customer Experience on the Emotions–Behavioral Intentions Relationship: Evidence from the Passenger Transport Sector. Behav. Sci. 2022, 12, 419. [Google Scholar] [CrossRef]
  34. Sun, S.; Xu, L.; Yao, Y.; Duan, Z. Investigating the determinants to retain spurious-loyalty passengers: A data-fusion based approach. Transp. Res. Part A Policy Pract. 2021, 152, 70–83. [Google Scholar] [CrossRef]
  35. Huang, S.T.; Shang, K.C.; Su, C.M.; Chang, K.Y.; Tzeng, Y.T. Applying QFD to assess quality of short sea shipping: An empirical study on Cross-Strait high-speed ferry service between Taiwan and Mainland China. Int. J. Shipp. Transp. Logist. 2020, 12, 284–306. [Google Scholar] [CrossRef]
  36. Sun, S.C. Public Transit Loyalty Modeling Considering the Effect of Passengers’ Emotional Value: A Case Study in Xiamen, China. J. Adv. Transp. 2018, 4682591. [Google Scholar] [CrossRef]
  37. Rotaris, L.; Scorrano, M.; Campisi, B.; Rossi, P. Corporate social responsibility and passengers’ behavioral intentions: A case study on railway services. Res. Transp. Bus. Manag. 2023, 47, 100951. [Google Scholar] [CrossRef]
  38. Chiou, M.R.; Chao, S.L.; Hsieh, H.Y. The Moderating Role of Service Recovery on Customer Loyalty in the Context of Cruise Passengers. Marit. Policy Manag. 2021, 48, 150–166. [Google Scholar] [CrossRef]
  39. Zhang, C.; Liu, Y.; Lu, W.; Xiao, G. Evaluating passenger satisfaction index based on PLS-SEM model: Evidence from Chinese public transport service. Transp. Res. Part A Policy Pract. 2019, 120, 149–164. [Google Scholar] [CrossRef]
  40. Fu, X.; Juan, Z. Drivers of transit service loyalty considering heterogeneity between user segments. Transp. Plan. Technol. 2018, 40, 611–623. [Google Scholar] [CrossRef]
  41. Fu, X.M.; Zhang, J.H.; Chan, F.T.S. Determinants of loyalty to public transit: A model integrating Satisfaction-Loyalty Theory and Expectation-Confirmation Theory. Transp. Res. Part A Policy Pract. 2018, 113, 476–490. [Google Scholar] [CrossRef]
  42. Bulut, E.; Duru, O.; Huang, S.T. A multidimensional QFD design for the service quality evaluation of Kansai International Airport, Japan. Total Qual. Manag. Bus. Excell. 2018, 29, 202–224. [Google Scholar] [CrossRef]
  43. Ekinci, Y.; Uray, N.; Ülengin, F.; Duran, C. A segmentation based analysis for measuring customer satisfaction in maritime transportation. Transport 2015, 33, 104–118. [Google Scholar] [CrossRef]
  44. Wu, H.C.; Cheng, C.C. A hierarchical model of service quality in the airline industry. J. Hosp. Tour. Manag. 2013, 20, 13–22. [Google Scholar] [CrossRef]
  45. Papaioannou, G.; Nathanail, E.; Polydoropoulou, A. A Hybrid MCDA Methodology to Evaluate Ferry Fleet Assignment to Routes in the Greek Islands; Springer: Cham, Switzerland, 2023; pp. 1517–1540. [Google Scholar] [CrossRef]
  46. Škurić, M.; Maraš, V.; Davidović, T.; Radonjić, A. Optimal allocating and sizing of passenger ferry fleet in maritime transport. Res. Transp. Econ. 2021, 90, 100868. [Google Scholar] [CrossRef]
  47. Li, Q.; Liu, R.; Zhao, J.; Liu, H.C. Passenger satisfaction evaluation of public transport using alternative queuing method under hesitant linguistic environment. J. Intell. Transp. Syst. Technol. Plan. Oper. 2021, 26, 330–342. [Google Scholar] [CrossRef]
  48. Naletina, D.; Ačkar, I.; Vuletic, A.; Petljak, K.; Štulec, I. Development Opportunities of Liner Maritime Passenger Traffic in the Republic of Croatia. Econ. Soc. Changes Facts Trends Forecast. 2018, 11, 182–197. [Google Scholar] [CrossRef]
  49. Marissa, Y.; Iqbal, M.M.; Juliantina, I. Analyze of Tanjung Api-Api Ferry Port Service Performance South Sumatera, Indonesia. J. Phys. Conf. Ser. 2019, 1198, 082002. [Google Scholar] [CrossRef]
  50. Weng, J.C.; Di, X.J.; Wang, C.; Wang, J.J.; Mao, L.Z. A Bus Service Evaluation Method from Passenger’s Perspective Based on Satisfaction Surveys: A Case Study of Beijing, China. Sustainability 2018, 10, 2723. [Google Scholar] [CrossRef]
  51. Pantouvakis, A. The relative importance of service features in explaining customer satisfaction: A comparison of measurement models. Manag. Serv. Qual. 2010, 20, 366–387. [Google Scholar] [CrossRef]
  52. Li, G.; Zhang, R.; Guo, S.; Zhang, J. Analysis of Ride-Hailing Passenger Satisfaction and Life Satisfaction Based on a MIMIC Model. Sustainability 2022, 14, 10954. [Google Scholar] [CrossRef]
  53. Zhang, C.; Juan, Z.; Lu, W.; Xiao, G. Do the organizational forms affect passenger satisfaction? Evidence from Chinese public transport service. Transp. Res. Part A Policy Pract. 2016, 94, 129–148. [Google Scholar] [CrossRef]
  54. Tsafarakis, S.; Kokotas, T.; Pantouvakis, A. A multiple criteria approach for airline passenger satisfaction measurement and service quality improvement. J. Air Transp. Manag. 2018, 68, 61–75. [Google Scholar] [CrossRef]
  55. Amrapala, C.; Chocharukul, K. Perceived Service Quality and Commuter Segmentation of Informal Public Transport Service in Bangkok, Thailand. Eng. J.-Thail. 2019, 23, 1–18. [Google Scholar] [CrossRef]
  56. Plazibat, V.; Krčum, M.; Skračić, T. Tools of Quality in Determining the Characteristics of Services in Maritime Passenger Transport. Naše More 2015, 62, 53–58. [Google Scholar] [CrossRef]
  57. Zhou, Z.; Yang, M.; Cheng, L.; Yuan, Y.; Gan, Z. Do passengers feel convenient when they transfer at the transportation hub? Travel Behav. Soc. 2022, 29, 65–77. [Google Scholar] [CrossRef]
  58. Vilke, S.; Krljan, T.; Debelić, B. A proposal of measures towards a qualitative enhancement of bus transport services in the Primorsko-goranska county. Pomorstvo 2018, 32, 50–58. [Google Scholar] [CrossRef]
  59. Pantouvakis, A.; Renzi, M.F. Exploring different nationality perceptions of airport service quality. J. Air Transp. Manag. 2016, 52, 90–98. [Google Scholar] [CrossRef]
  60. Zhang, C.; Wang, D.; Ni, A.; Ni, X.; Xiao, G. Different Effects of Contractual Form on Public Transport Satisfaction: Evidence from Large- and Medium-Sized Cities in China. Sustainability 2019, 11, 5453. [Google Scholar] [CrossRef]
  61. Chou, P.F.; Lu, C.S.; Chang, Y.H. Effects of service quality and customer satisfaction on customer loyalty in high-speed rail services in Taiwan. Transp. A Transp. Sci. 2014, 10, 917–945. [Google Scholar] [CrossRef]
  62. Sharafuddin, M.A.; Madhavan, M.; Wangtueai, S. Assessing Island Destination Service Quality—An Integrated Model through Co-creation of Destination E-image. Glob. Bus. Rev. 2022. [Google Scholar] [CrossRef]
Figure 1. Preferred Reporting Items for Systematic Reviews and Meta-Analyses (PRISMA) analysis flow, which deals with service quality in passenger transport. * the exclusions correspond to articles that were removed after reading the abstracts. The article does not apply to service quality in passenger transport. ** the exclusions correspond to the articles that were removed after reading the full text. The article does not apply to the evaluation of service quality in passenger transport.
Sustainability 16 01125 g001
Table 1. Overview of scientific articles on service quality in passenger transport according to article, methods, research area, and publication year.
Ordinal NumberArticleMethodsExplanatory VariablesResearch AreaPublication Year
1Pantouvakis, A. and Gerou, A. [32]qualitative
(questionnaire) and quantitative (exploratory and confirmatory factor analyses, regression analyses)
“social interaction with crew”,
“social interaction with other passengers”, and
“experiencescape on board”
Transportation2023
2Rotaris, L., Scorrano, M., Campisi, B., and Rossi, P. [37]qualitative
(questionnaire) and quantitative (confirmatory factor analysis)
“environmental awareness”,
“risk propensity”, and
“customer satisfaction”
Business and Economics, Transportation2023
3Papaioannou, G., Nathanail, E., and Polydoropoulou, A. [45] qualitative
(questionnaire) and quantitative (AHP and PROMETHEE)
“passenger capacity”,
“lane meters”,
“cabin berths”,
“speed”,
“maneuvering ability of ship” and
“comfort”
Science and Technology—Other Topics—Transportation2023
4Zhou, Z., Yang, M., Cheng, L., Yuan, Y., and Gan, Z. [57] qualitative
(questionnaire) and quantitative (Rasch model, MIRT)
“comfort”,
“frequency of departures”,
“route to the ticket office”,
and
“location of the entrances to different transportation modes”
Transportation2022
5Sharafuddin, M. A., Madhavan, M., and Wangtueai, S. [62] qualitative
(questionnaire) and quantitative (exploratory factor analysis)
“assurance”,
“reliability”,
“empathy”,
and
“tangibles”
Business and Economics2022
6Li, G., Zhang, R., Guo, S., and Zhang, J. [52] qualitative
(questionnaire) and quantitative (MIMIC model)
“service perception”,
“safety perception”,
“external influence”, and “operation service”
Science and Technology—Other Topics, Environmental Sciences and Ecology2022
7Gerou, A. [33] qualitative
(questionnaire) and quantitative (confirmatory factor analyses and regression analysis)
“customer experience”, “emotions”, and
“behavioral intentions”
Psychology2022
8Sun, S., Xu, L., Yao, Y., and Duan, Z. [34] qualitative
(questionnaire) and quantitative (regression analysis)
“technical
quality of transport service (TQTS)”,
“quality of value-added transport service (QVTS)”,
“hedonic value”,
“satisfaction”, and
“attitudinal loyalty”
Business and Economics, Transportation2021
9Škurić, M., Maraš, V., Davidović, T., and Radonjić, A. [46]quantitative (matheuristic methods VNB, VNDS, and VINS)“purchased ferry fleet”,
“chartered-in ferry fleet”, and
“existing ferry fleet for transporting local inhabitants and tourists”
Business and Economics, Transportation2021
10Li, Q., Liu, R., Zhao, J., and Liu, H. C. [47] qualitative
(questionnaire) and quantitative (AQM, DHHLTS)
“assurance”,
“empathy”,
“reliability”,
“responsiveness”, and
“tangibles”
Transportation2021
11Chiou, M. R., Chao, S. L., and Hsieh, H. Y. [38] qualitative
(questionnaire) and quantitative (SEM)
“customer satisfaction”,
“service recovery”, and “customer loyalty”
Transportation2021
12Huang, S. T., Shang, K. C., Su, C. M., Chang, K. Y., and Tzeng, Y. T. [35] qualitative
(questionnaire) and quantitative (QFD)
“reliability service”,
“responsiveness service”,
“assurance service”, and
“empathy service”
Business and Economics, Transportation2020
13Zhang, C., Wang, D., Ni, A., Ni, X., and Xiao, G. [60] qualitative
(questionnaire)
quantitative (ECSI, PSI, regression analysis)
“contractual form”,
“the individual socioeconomic status”,
“travel characteristics”, and
“city characteristics”
Science and Technology—Other Topics—Environmental Sciences and Ecology2019
14Amrapala, C and Chocharuku K. [55] qualitative
(questionnaire)
quantitative (confirmatory factor analyses)
“reliability”,
“in-vehicle environment”,
“comfort and convenience”, and
“environmental impact”
Engineering2019
15Zhang, C., Liu, Y., Lu, W., and Xiao, G. [39] quantitative
(PLS-SEM, PSI, ACSI)
“passenger expectation”,
“passenger perceived quality”,
“passenger perceived value”,
“passenger satisfaction”,
“passenger complaint”, and
“passenger loyalty”
Business and Economics, Transportation2019
22Marissa, Y., Iqbal, M. M., and Juliantina, I. [49] qualitative
(questionnaire) and quantitative (Importance and Performance Analysis—IPA)
“tangibles”,
“reliability”,
“responsiveness”,
“assurance”, and
“empathy”
Nuclear Science and Technology, Physics2019
16Weng, JC., Di, XJ., Wang, C., Wang, JJ., and Mao, LZ. [50] qualitative
(questionnaire) and quantitative (regression analysis)
”timeliness”,
“safety”,
“convenience”,
“physical feature-bus type”,
“comfort”,
“reliability”, and
“economy”
Science and Technology—Other Topics—Environmental Sciences and Ecology2018
19Naletina, D., Ačkar, I., Vuletic, A., Petljak, K., and Štulec, I. [48] qualitative
(questionnaire) and quantitative (descriptive statistics)
“additional lines”,
“transfer time”,
“modernization of ships”,
“poor offer”,
“high prices”,
“online tickets”,
“the ratio of price and quality”,
“staff courtesy”, and
“competitiveness”
Business and Economics2018
20Vilke, S., Krljan, T., and Debelić, B. [58]qualitative
(questionnaire) and quantitative (regression analysis)
“motivation”,
“public transport offer”,
“comfort”,
“frequency”, and
“ecological awareness”
Transportation2018
26Sun, S. C. [36] qualitative
(questionnaire) and quantitative (SEM)
“service guarantee”,
“operational services and efficiency”,
“emotional value”,
“perceived value”,
“expectation”,
“satisfaction”, and
“loyalty”
Engineering, Transportation2018
28Fu, X. and Juan, Z. [40] qualitative
(questionnaire) and quantitative (SEM)
“operation”,
“personnel”,
“facility”,
“value”,
“loyalty”, and
“expectations”
Transportation2018
25Begen, M. A., Fung, R., Granot, D., Granot, F., Hall, C., and Kluczny, B. [30] quantitative (simulation modeling queuing analysis)“estimated number of passenger arrivals for a
departing flight”, and
“time of passenger arrival before the flight departure time”
Business and Economics, Transportation2018
21Tsafarakis, S., Kokotas, T., and Pantouvakis, A. [54] qualitative
(questionnaire)
quantitative (multicriteria analysis)
“pricing policy”,
“low fare calendar”,
“flight schedule and routes”,
“during flight”,
“security”, and
“website”
Transportation 2017
23Fu, X. M., Zhang, J. H., and Chan, F. T. S. [41] qualitative
(questionnaire)
quantitative (order Probit model)
“route schedule”,
“route information”,
“convenience”,
“comfort”,
“ticket price”, and
“safety”
Business and Economics, Transportation2017
24Bulut, E., Duru, O., and Huang, S. T. [42] qualitative
(questionnaire) and quantitative (multilayer QFD model)
“comfort”,
“facilities”,
“security and safety”,
“signposting/wayfinding”,
“safe and speed airfield operation”,
“convenience of ticketing, boarding, gate management, transfers, duty-free floor”, and
“baggage handling”
Business and Economics2016
17Pantouvakis, A. and Renzi, MF. [59] qualitative
(questionnaire) and quantitative (Rasch modeling technique)
“servicescape and image”,
“signage”, and
“service”
Transportation2016
29Zhang, C., Juan, Z., Lu, W., and Xiao, G. [53] qualitative
(questionnaire) and quantitative (PLS-SEM)
“passenger expectation”,
“passenger perceived value”,
“passenger satisfaction”,
“passenger complaint”, and
“passenger loyalty”
Business and Economics, Transportation2016
18Ekinci, Y., Uray, N., Ülengin, F., and Duran, C. [43] qualitative
(questionnaire) and quantitative (MANOVA)
“supportiveness and guidance”,
“adequacy and accessibility of information”,
“quality and comfort”,
“availability and quality of information materials”,
“availability and convenience of transportation”, and
“availability of new lines”
Transportation2015
27Lu, J., Yang, Z., Dong, X., and Zhu, X. [31] quantitative
(genetic algorithm model)
“passenger volume”,
“flight departure time”,
“network
construction”, and
“coach travel time”
Transportation2015
30Plazibat, V., Krčum, M., and Skračić, T. [56] qualitative
(Ishikawa diagram) and quantitative (QFD)
“individual travel costs”,
“voyage time”,
“safety”,
“social traffic costs”, and
“transport service”
Engineering2015
31Chou, P. F., Lu, C. S., and Chang, Y. H. [61] qualitative
(questionnaire) and quantitative (SEM)
“appearance”,
“customer satisfaction”, and
“customer loyalty items”
Transportation2014
32Wu, H. C. and Cheng, C. C. [44] qualitative
(questionnaire) and quantitative (confirmatory factor analysis)
“interaction quality”,
“physical
environment quality”,
“outcome quality”, and
“access quality”
Social Sciences—Other Topics—Business and Economics2013
33Pantouvakis, A. [51]qualitative
(questionnaire) and quantitative (exploratory factor analysis)
“tangibles”,
“reliability”,
“responsiveness”,
“assurance”,
“empathy”,
“satisfaction”,
“servicescape”, and
“interactive quality”
Business and Economics2010
Table 2. Overview of scientific articles on service quality in liner maritime passenger transport according to the article, methods, research area, and publication year.
Ordinal
Number
ArticleMethodsExplanatory VariablesResearch AreaPublication Year
1Pantouvakis, A. and Gerou, A. (2023) [32]qualitative
(questionnaire) and quantitative (exploratory and confirmatory factor analyses, regression analyses)
“social interaction with crew”,
“social interaction with other passengers”, and
“experiencescape on board”
Transportation2023
2Gerou, A. (2022) [33]qualitative
(questionnaire) and quantitative (exploratory and confirmatory factor analyses, regression analyses)
“customer experience”,
“emotions”, and
“behavioral intentions”
Psychology2022
3Huang, S. T., Shang, K. C., Su, C. M., Chang, K. Y., and Tzeng, Y. T. (2020) [35]qualitative
(questionnaire) and quantitative (QFD)
“reliability service”,
“responsiveness service”,
“assurance service”, and
“empathy service”
Business and Economics, Transportation2020
4Naletina, D., Ačkar, I., Vuletic, A., Petljak, K., and Štulec, I. (2018) [48]qualitative
(questionnaire) and quantitative (descriptive statistics)
“additional lines”,
“transfer time”
“modernization of ships”
“poor offer,”
“high prices”,
“online tickets”,
“the ratio of price and quality”,
“staff courtesy”, and
“competitiveness”
Business and Economics2018
5 Pantouvakis, A. (2010) [51]qualitative
(questionnaire) and quantitative (exploratory factor analysis)
“tangibles”,
“reliability”,
“responsiveness”,
“assurance”,
“empathy”,
“satisfaction”,
“servicescape”, and
“interactive quality”
Business and Economics2010
Disclaimer/Publisher’s Note: The statements, opinions and data contained in all publications are solely those of the individual author(s) and contributor(s) and not of MDPI and/or the editor(s). MDPI and/or the editor(s) disclaim responsibility for any injury to people or property resulting from any ideas, methods, instructions or products referred to in the content.

