Article

The Impacts of Land-Use Changes on Ecosystem Service Value in the Yunnan–Kweichow Plateau, China

1
Kunming General Survey of Natural Resources Center, China Geological Survey, Kunming 650111, China
2
Yunnan Province Field Science Observation and Research Station on the Evolution of Soil and Water Resources and the Carbon Sequestration Enhancement Effects in the Alpine Gorge Area of the Jinsha River, Chuxiong 651400, China
3
Technology Innovation Center for Natural Carbon Sink, Kunming 650111, China
4
Key Laboratory of Coupling Process and Effect of Natural Resources Elements, Beijing 100055, China
5
Institute of Space Weather, School of Atmospheric Physics, Nanjing University of Information Science and Technology, Nanjing 210044, China
*
Author to whom correspondence should be addressed.
Sustainability 2024, 16(3), 1062; https://doi.org/10.3390/su16031062
Submission received: 20 October 2023 / Revised: 20 January 2024 / Accepted: 22 January 2024 / Published: 26 January 2024

Abstract

:
The Yunnan–Kweichow Plateau serves as a critical ecological security barrier in southwest China. The region has witnessed substantial transformations in land use patterns due to rapid urban expansion, economic development, and population growth. These changes have significantly impacted the structure and services of regional ecosystems. Conducting a quantitative analysis of the influence of land-use changes on ecosystem service value (ESV) proves to be invaluable for guiding regional land planning and environmental conservation efforts. Utilizing land use data, we calculated ESV variations linked to dynamic land-use changes spanning the period from 1980 to 2020. This comprehensive study delved into the spatiotemporal fluctuations and regional disparities in ESV. To enhance the reliability of our evaluation, we applied a regional coefficient to adjust the equivalent factor of ecosystem service value. Over the 40 years, the total ESV exhibited a decrease from USD 122,215.03 million to USD 121,838.82 million. Notably, water supply experienced the most significant decline, while hydrological regulation witnessed the largest increase. The continuous decline in water supply service capacity raises concerns about exacerbating water resource shortages in the region. Spatially, the ESVs in the study region primarily concentrated within the medium-low to medium-high value range. However, except for regions with medium values, the area of other level regions is expanding, and is particularly evident in the increase in low-value regions. The reduction of forestland, grassland, and cultivated land, coupled with the expansion of built-up land, emerged as the primary contributors to the overall ESV decrease. In particular, the negative ecological contribution rate of built-up land reached 37.97%, and the ESV decreased by USD 866.64 million, underscoring that the expansion of water bodies could not compensate for this loss. The study highlights the increasing sensitivity of ESV to land-use changes in the region. As a response, there is a pressing need for managers to reinforce the implementation of ecological engineering and engage in rational planning for production, living, and ecological spaces. This research serves as a crucial reference for establishing an ecological security pattern system and fostering the sustainable development and utilization of land resources in the region.

1. Introduction

Ecosystem services refer to the life-supporting products and services obtained directly or indirectly through the structure, processes, and functions of ecosystems [1,2,3,4], including food production, climate regulation, biodiversity protection, aesthetic landscape, and more [5], with key implications for the consumption of fossil fuels in production systems [6,7,8,9]. This concept can be traced back to the 1960s [10,11]. Ecosystem services are crucial for sustaining economic activities and enhancing human well-being, which can offer vital resources and functions [5,12,13]. The loss of ecosystem services will affect the stability of social development, as well as the safety and health of humanity, posing a threat to regional and global ecological security [14,15,16,17]. Land-use change occurs as a consequence of the enduring interplay and impact between human society and the natural environment. This process will contribute to major changes in the Earth’s surface structure, change the climate, hydrology, soil, geological geomorphology, cycles of biology, and chemistry, deeply influencing the ability of the ecosystem productions and services; that is, ecosystem service value (ESV) [14,15].
As the fundamental environment for human survival and socio-economic development, assessing and quantifying the value of terrestrial ecosystems’ services, effectively managing their service functions, and enhancing socially sustainable development capacity is also a current hotspot in ecological research [18,19,20,21,22,23,24,25,26,27]. Establishing the response mechanism of ecosystem service value to land-use change and incorporating ecosystem service assessment into land planning can play a positive role in balancing urbanization and ecosystem protection. As such, DeLoyde et al. (2023) used ecosystem service value as an ecological indicator for land management decision making in southern Ontario, Canada, indicating the importance of maintaining natural conservation areas instead of converting them into urban development areas in the long term [28]. After studying the impact of urban expansion and cropland loss on ecosystem services in the western United States, Brandt et al. (2019) pointed out the need for decision makers to incorporate society’s demand for ecosystem services into urban planning to ensure policy flexibility [29]. In China, researchers have incorporated multiple ecosystem services into the delineation of ecological red-lines and urban development planning. Bai et al. (2018) combined ecosystem services, biodiversity and ecological vulnerability hotspots, landscape structure, and stakeholders’ opinions to jointly determine Shanghai’s ecological red-line areas [30]. Yang et al. (2023) proposed suggestions for the coordinated development of ecological protection and urbanization by exploring the spatiotemporal relationship between ecosystem service functions in the Yellow River Basin, urbanization, and their interactive stressors [31]. By incorporating ecosystem services into land-use planning, Li et al. (2022) generated the optimal sustainable development plan for the city of Xuzhou [32]. It can be seen that under the background of global environmental change, the relationship between land use and ecosystem services is becoming closer, which is the core content of global environmental change and sustainable development research [33].
The earliest research on ESV assessment began in the 1980s. The publication of “Nature’s Services: Societal Dependence on Natural Ecosystems” [1] and “The Value of the World’s Ecosystem Services and Natural Capital” [34] in the 1990s sparked a global trend in ecosystem services research. In particular, Costanza et al. (1997) provided clarification on the principles and techniques used for estimating ESV [34]. This assessment model was widely recognized and laid a foundation for later research. According to this model, subsequent generations have developed three primary types of pricing methods for ecosystem services based on market theory: the actual market approach, the alternative market approach, and the virtual market approach. Among these, the most commonly used method in the actual market approach is the unit area equivalent factor method [35]. In China, Xie et al. [36,37,38] developed an ecosystem service evaluation unit price system that aligns with the country’s ecological environment based on Costanza et al.’s research results [34]. They later improved and developed the static evaluation method of the unit area value equivalence factor and constructed a dynamic assessment method of ecosystem services on the Chinese continent using the unit area value equivalence factor method. Additionally, they categorized ecosystem services into four main types and eleven secondary services [39].
The Yunnan–Kweichow Plateau serves as a source and crucial water conservation area for significant rivers such as the Yangtze River, Pearl River, Nu River, and Lancang River. It acts as a vital ecological barrier for ecological environment security and regional sustainable development in southwestern China and southeast Asian countries [40]. Secondly, the Yunnan–Kweichow Plateau is distributed with a large area of karst ecologically fragile areas, which are hot spots and key areas affected by global climate change and human activities. With the continuous advancement of the Yangtze River Economic Belt and the Great Western Development Strategies, the economy of the Yunnan–Kweichow Plateau has experienced rapid development. The rapid advancement of industrialization and urbanization has led to the agglomeration of the non-agricultural population in the region and the expansion of the industrial and commercial space, which has accelerated the transformation of land-use patterns [41,42,43]. However, due to regional productivity restrictions, low coupling coordination between urban agglomeration urbanization and resource-carrying capacity [44], and the relatively extensive development and utilization of natural resources, various resource and environmental problems continue to emerge [45]. These issues greatly impact the maintenance and balance of the regional nature–society–economy composite ecosystem.
The current research on the correlation between ESV and land-use change in the Yunnan–Kweichow Plateau places specific emphasis on regions of medium- and small-scale [41,46,47]. The existing studies fail to integrate the current state of regional resources and environment, and re-correct and adjust the equivalent factors from a dynamic perspective. Then, the predecessors analyzed the spatiotemporal characteristics of ESV based on administrative divisions, which could not truly reflect the ESV changes of important resources and environmental units and their relationships with land use. However, it is more crucial to note that there have been limited quantitative analyses on the impact of land-use change on ESV and the spatiotemporal variability and regional differences of ESV changes in the Yunnan–Kweichow Plateau. This has hindered the construction and development of a regional ecological security pattern system.
Utilizing land-use data and socio-economic statistics of the Yunnan–Kweichow Plateau between 1980 and 2020, the equivalent factor method was employed to evaluate the ESV in this study. With high credibility, this approach is extremely practical, simple to compute, and enables the rapid evaluation of the ESV in extensive areas. To further clearly represent the changes in the spatiotemporal characteristics of ESV in the study region, this study breaks the constraints of administrative boundaries. Meanwhile, the most important thing is that this study re-corrects and adjusts the equivalent factors, which can more scientifically reflect the relationship between land use change and ESV. We hold the conviction that this study will furnish a scientific groundwork for creating a regional ecological security pattern system, as well as the high-caliber construction and advancement of the social economy.

2. Study Region and Data
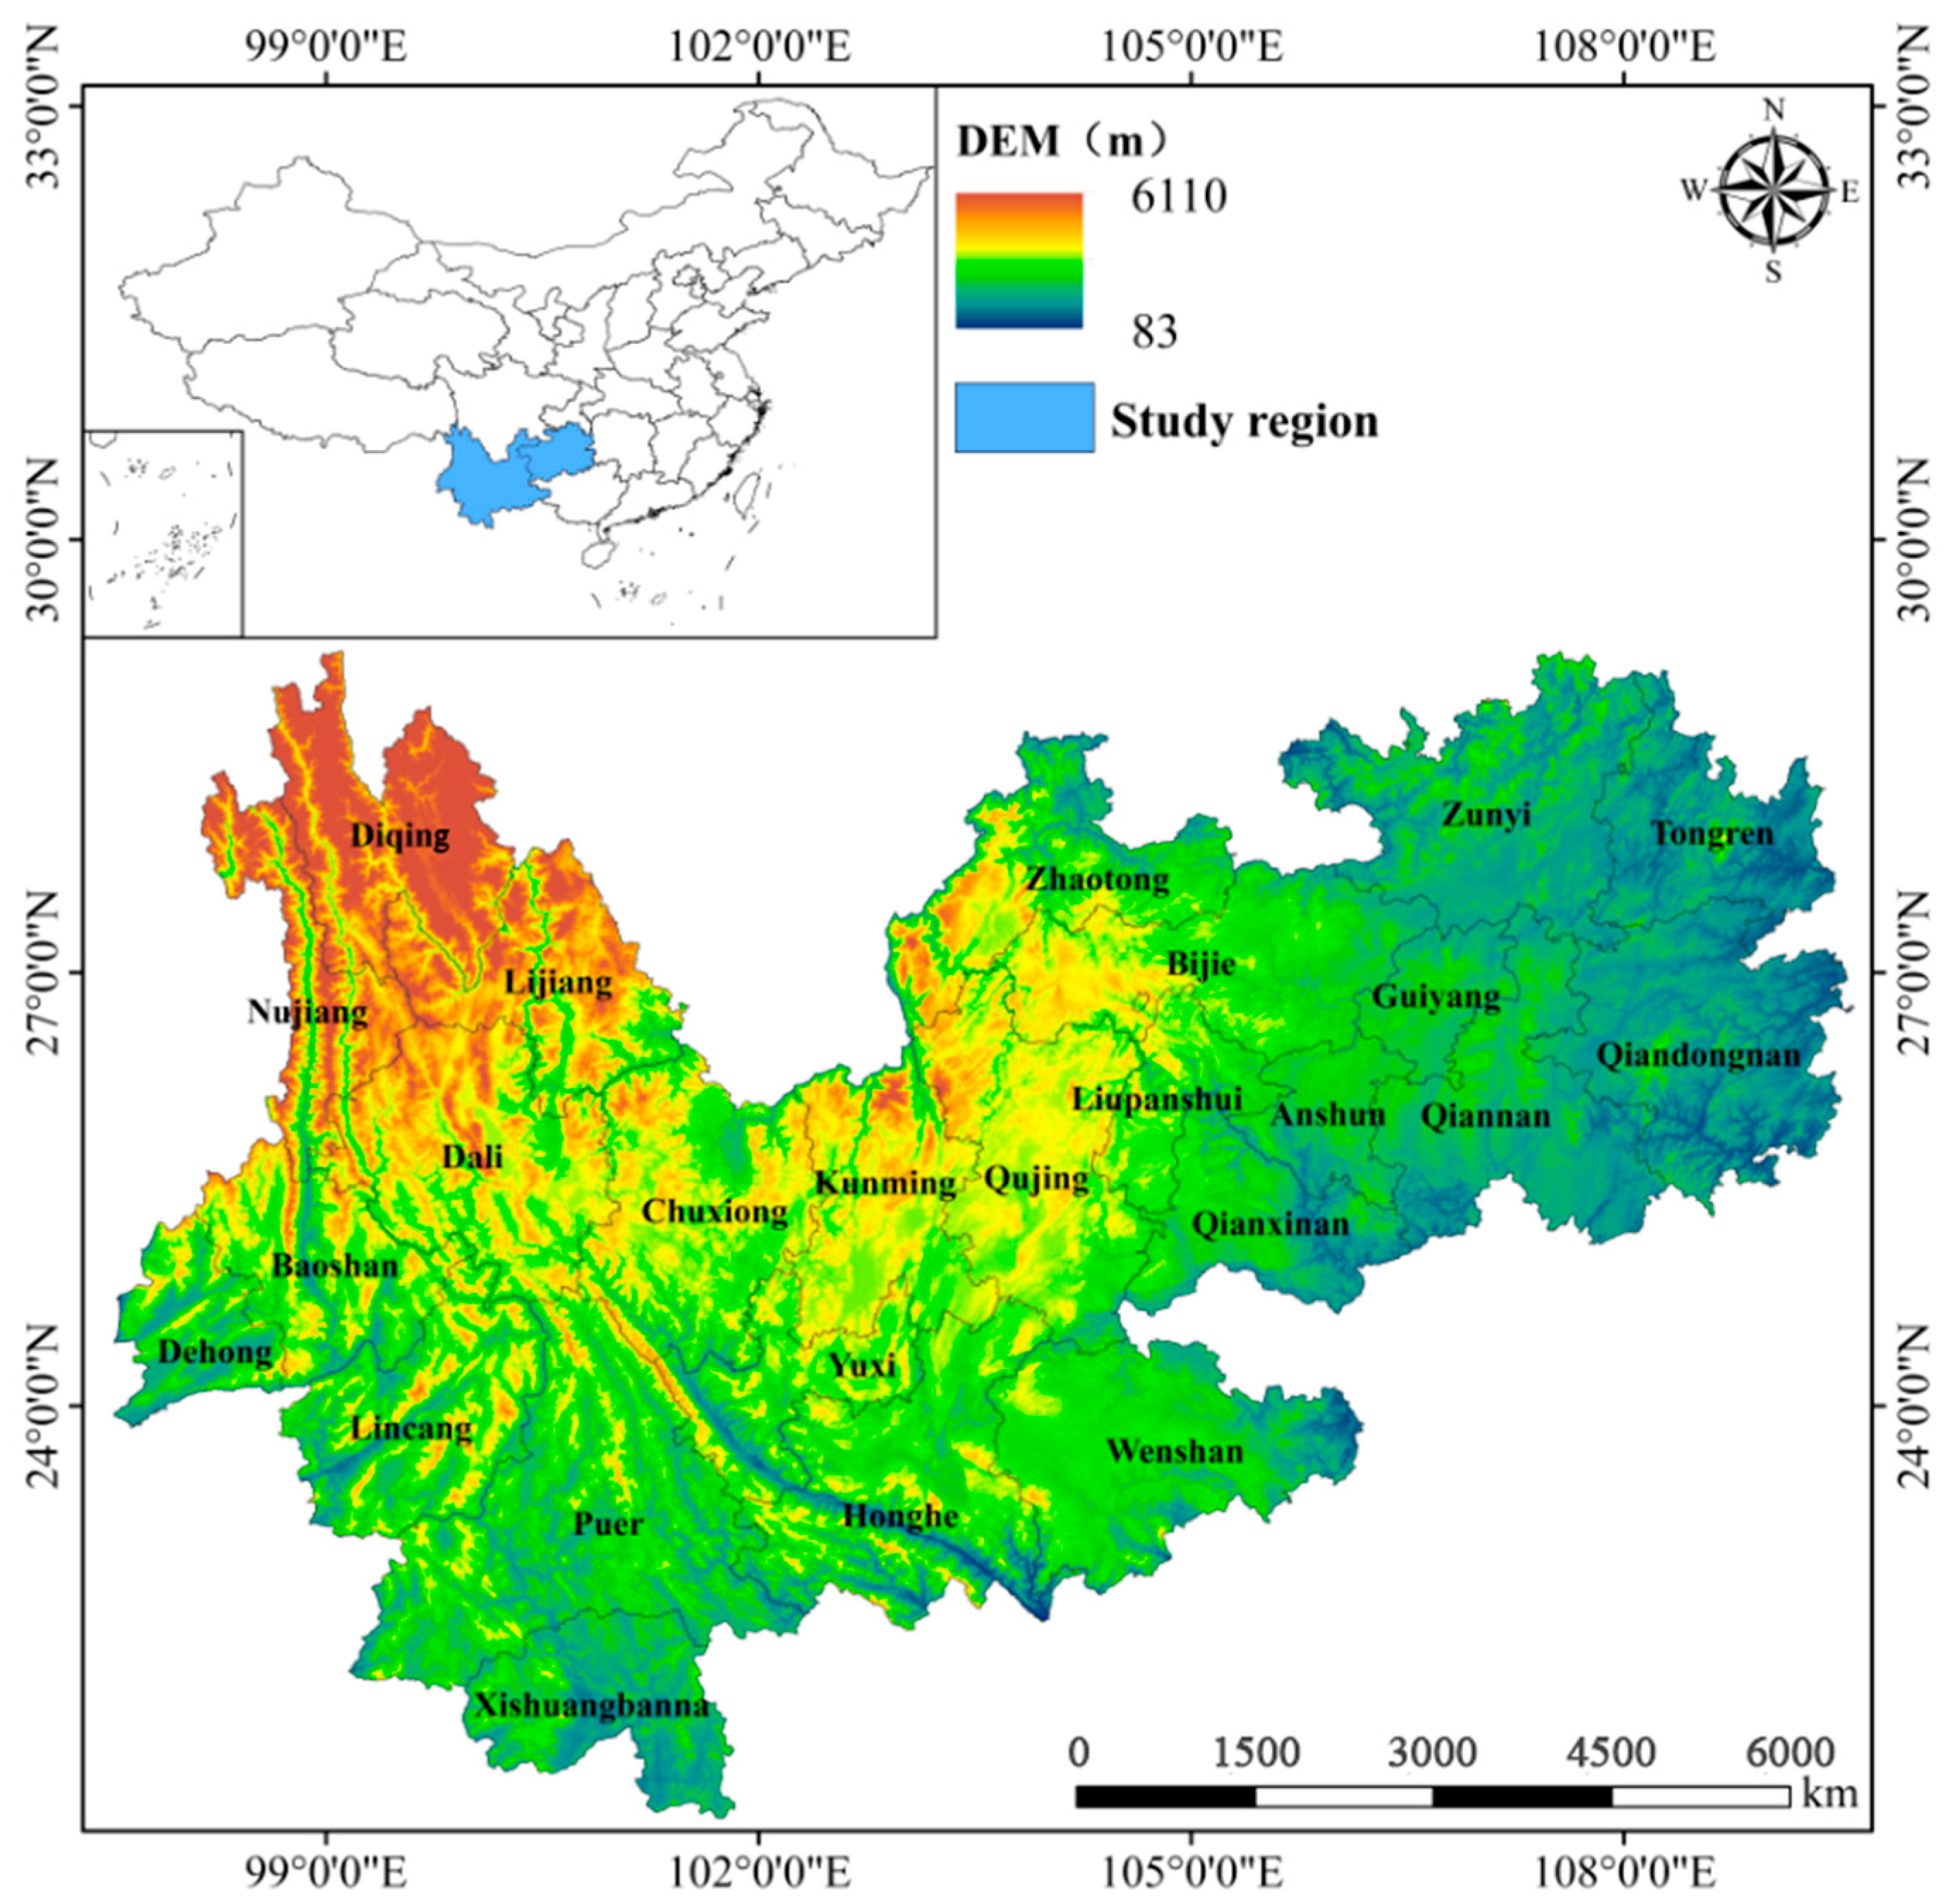
2.1. Study Region

Situated in southwestern China, the Yunnan–Kweichow Plateau covers a vast area that falls predominantly within the provinces of Yunnan and Kweichow (Figure 1). Therefore, the Yunnan–Kweichow Plateau referred to in this article will be bounded by the administrative boundaries of the two provinces, encompassing a total of 57.02 million ha. Because of the comprehensive impact of high terrain, low latitude, and monsoon climate, the climate types in the plateau are diverse, and vertical climate is obvious, spanning seven climate zones from cold temperate zones to tropical zones. The annual precipitation in most regions is about 800 to 2100 mm. The yearly mean temperature ranges from 5 to 24 °C. As an important ecological security barrier, the Yunnan–Kweichow Plateau has the unique advantage of natural resources, with the characteristics of diverse types, large total amounts, and high potential value. The entire region boasts abundant mineral resources, and its total water resources rank first nationwide. Meanwhile, the biological resource is superior, and the forestland coverage rate is high, with many vegetation types from tropical forestlands to alpine tundra. Ensuring the stable growth of the regional economy in the southwest, this resource strategic base holds significant importance.

2.2. The Classification of Data and Land Use

All the land-use data, digital elevation model (DEM), and administrative boundary data in the study region are sourced from the Resources and Environment Science and Data Center (RESDC) from the Chinese Academy of Sciences. The land-use data is from China’s Multi-period Land-use and Cover Change Remote Sensing Monitoring Dataset (CNLUCC), which boasts a highly detailed spatial resolution of 30 × 30 m. This dataset adopts a secondary classification system, and the first level is divided into six land-use types, and the second tier is additionally categorized into twenty-five subcategories based on the first level [48]. The administrative boundaries of the region researched are based on the latest provincial and municipal administrations in the Yunnan and Kweichow Provinces in 2022 [49]. The socio-economic statistic data like grain prices, grain production, and planting area are from the Compilation of National Agricultural Product Cost Benefit Data, the Statistical Yearbook of Yunnan Province and Kweichow Province.
In conjunction with the real-life land cover and the secondary classification of CNLUCC, the various land-use categories present in the Yunnan–Kweichow Plateau have been reclassified into seven distinct types: cultivated land, forestland, grassland, water bodies, wetland, bare land, and built-up land.

3. Methods

3.1. An Analysis of Land-Use Change

The single dynamic index of land use serves as a viable metric in appraising the velocity of regional land-use modifications, whilst simultaneously facilitating accurate prognostication of land-use shifts yet to come [50,51]:
K = U a U b U a × 1 T × 100 %
where K represents the single dynamic index of land use; Ub and Ua denote the area of a certain land-use type at the initial and final stages of a particular study period, respectively; T signifies the study period.

3.2. ESV Assessment

  • ESV equivalence factor and ESV coefficient
This paper mainly uses the latest improved ESV equivalence factor per unit area in 2015 [39]. According to the current situation of land resources, we adjusted the value equivalent factors of ecosystem services for different land types. The ESV equivalence value of cultivated land was taken from the mean value of dry land and paddy fields; the value of forestland was taken from the mean value of coniferous forest, mixed coniferous broad-leaved forest, broad-leaved forest, and shrub; the value of grassland was taken from the mean value of steppe, shrub-grassland, and meadow; the value of water bodies was taken from the mean value of river system and glacier snow; the value of bare land was taken from the original value [41]. Meanwhile, referring to the correction method of ecosystem service value equivalent per unit area based on biomass factor proposed by existing research [37,39,41,52], the study regional correction coefficient (0.635) [37] was obtained. In addition, Xie et al. [39]. did not assign the ESV equivalence value to built-up land, but human activities might have positive or negative impacts on ecosystem services’ function and value. To better precisely delineate the ramifications of the swift expansion of local urban areas on ESV, this research refers to the ESV equivalence factor assignment of built-up land by Deng [53], which revised the ecosystem service equivalent value per unit area in the study region (Table 1).
In view of this research focusing on the influence of changes in land use on ESV, to facilitate the comparative research of different periods and mitigate the influence of the fluctuation in crop price on the overall value, the annual mean grain yield is calculated to be 4459.83 kg/ha, by choosing the seeded area and yield of three primary crops (rice, wheat, and maize) in 1980–2020. Based on the average prices (USD 0.3657 kg−1) of three crops in 2020, the economic value of 1 standard ESV equivalence value is calculated by the following formula [36] to be USD 232.99 ha−1 yr−1:
E a = 1 7 × P g × Q g
where Ea represents the economic value of 1 standard equivalence ecosystem service (US USD ha−1 yr−1); Pg represents the annual mean grain yield; Qg represents the mean grain price.
  • Calculation of ESV
The ESV coefficient table of Yunnan–Kweichow Plateau (Table 2) is obtained by the combination of ESV equivalence in the study region and 1 standard equivalent ecosystem service’s economic value. In conclusion, the ESV is determined using the subsequent equations:
E S V = i = 1 n V C i × A i
V C i = f = 1 k E C i f × E a
where VCi is the unit area ESV of the i-th land-use type (US USD ha−1 yr−1); Ai is the area of the i-th land-use type; ECif is the equivalence factor of f-th ESV for the i-th land-use type.
  • Ecological contribution rate
The percentage of the variation in ESV is attributed to differing land-use types during a defined duration, relative to the aggregate ESV; that is, the ecological contribution rate. This indicator is instrumental in elucidating the principal catalysts influencing ESV changes, whilst concurrently shedding light on the pivotal and more delicate factors that catalyze such changes within the examined region [54]:
S i = | E S V i | i = 1 7 | E S V i |
where Si is the ecosystem services contribution rate of the i-th land-use type; ΔESV is the change of ESV of the i-th land-use type.
  • Calculating elasticity of ESV
To accomplish research on the response of the change rate of ESV to the change rate of land use, this research calculated the elasticity of ESV [55]:
E e l = | E S V j E S V i E S V i × 1 T × 100 % L T P |
L T P = | n = 1 7 L C A i n = 1 7 L C A i × 1 T × 100 % |
where Eel represents the elastic response of ESV to land-use change; Ej represents the ESV when the research period ended; Ei represents the ESV when the research period started; LTP represents the annual change rate of single land-use type; ∆LCAi is the transition area of the i-th land-use type; LCAi represents the area of the i-th land-use type; T represents the year during the research period.
  • Analysis of the value flow of ecosystem services
We determined the overall effect of land-use change on ESV by calculating the net gains or losses in ESV caused by the transition between different land-use types using transition data [56]:
P L i j = ( V C j V C i ) × A i j
where PLij is the ESV gains and losses after the transition from the i-th land-use type to the j-th land-use type; VCi and VCj are, respectively, the ESV coefficients of the i-th and the j-th land-use types; Aij is the area of the transition from the i-th land-use type to the j-th land-use type.
  • Analysis of sensitivity
We calculated the sensitivity index of ESV using the economic principle of elasticity to assess the association between the change in time of ESV and the coefficient. To measure the change in total ESV, the ESV coefficient of all land-use types is modified by ±50% [28]:
C S = | ( E S V j E S V i ) / E S V i ( E S V j k E S V i k ) / E S V i k |
where CS is calculated using the original and adjusted ESVs (ESVi and ESVj), and the original and adjusted ESV coefficients (VCik and VCjk). When CS is greater than 1, it signifies that ESV is responsive to VC, meaning a 1% alteration in the independent variable will result in a more than 1% alteration in the dependent variable. The accuracy is bad and reliability is low. Conversely, if the CS value is less than 1, this suggests that ESV has insufficient elasticity towards VC, thus ensuring the credibility of the outcome.

4. Results

4.1. The Characteristics of Land-Use Change

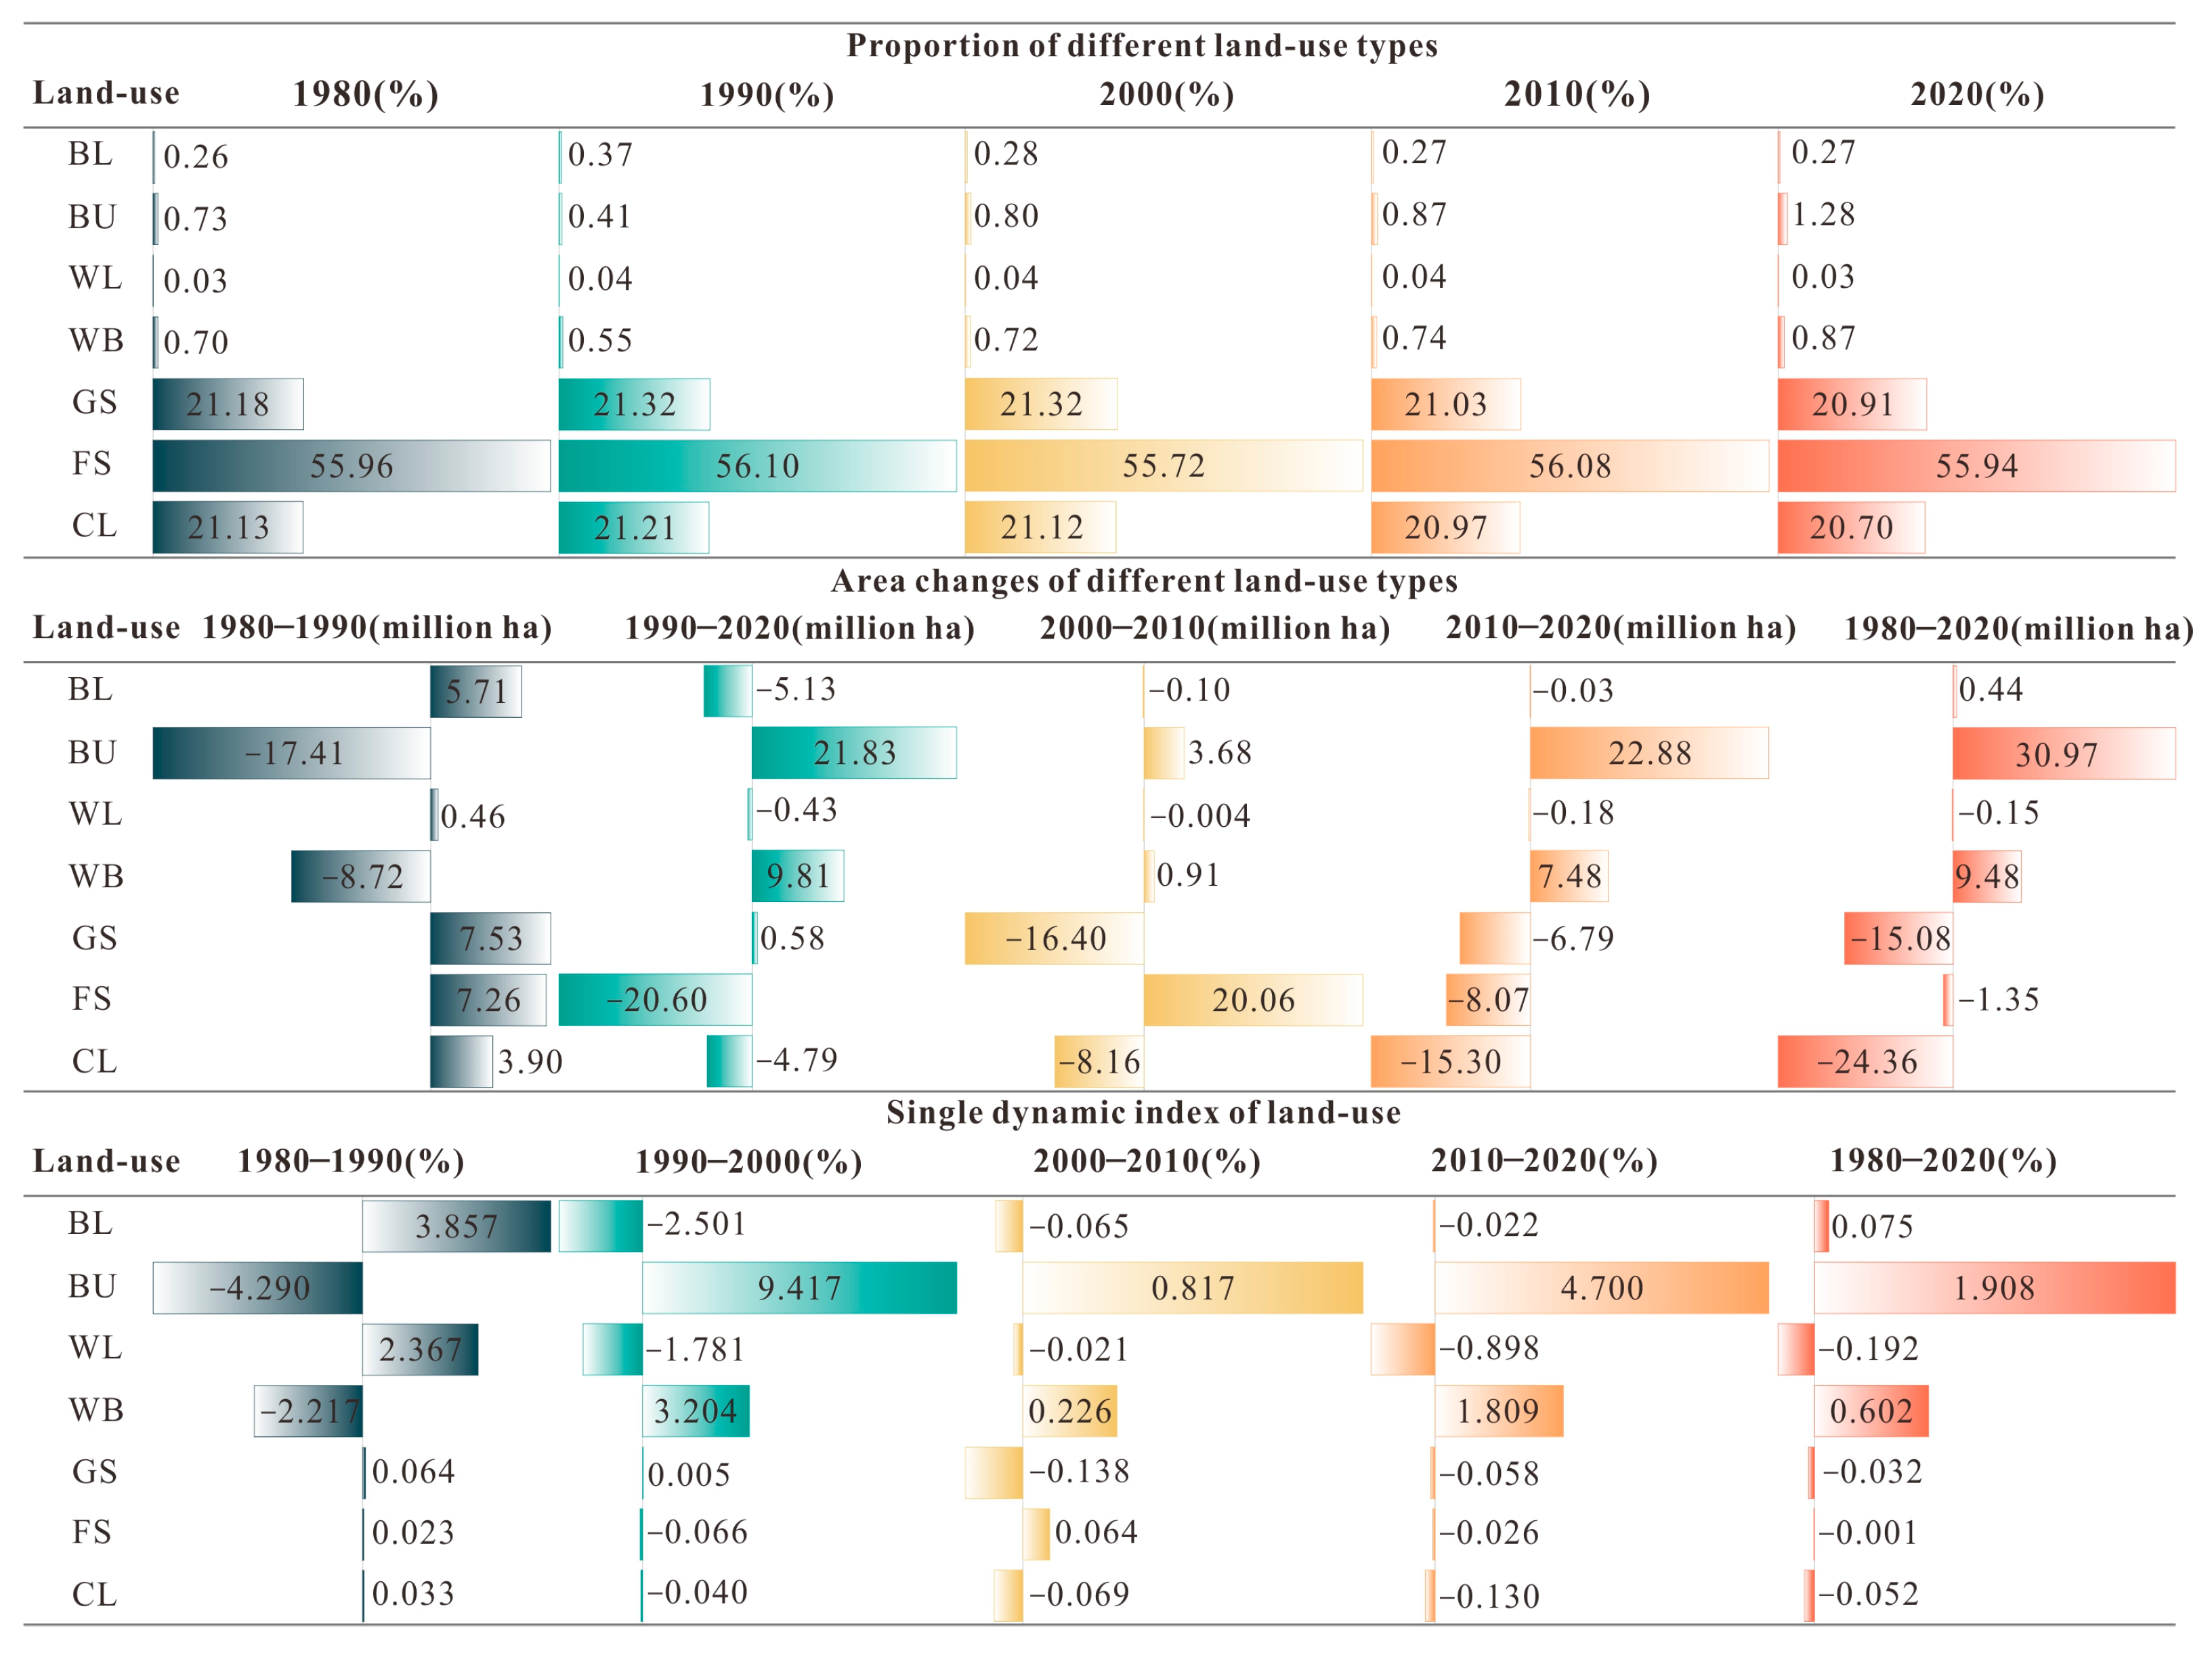
4.1.1. Land-Use Structure Change

The land-use types in the Yunnan–Kweichow Plateau center on forestland, and its areas in different research periods all account for more than 55.00%, followed by grassland and cultivated land (Figure 2 and Table 3). The percentage of water bodies, wetlands, and bare land is very low. Except for built-up land, which was over 1.00% in 2020, the weights of the above land types were less than 1.00% in all periods. From the perspective of space, the forestland is concentrated in the west of the Yunnan–Kweichow Plateau. A large amount of cultivated land is focused in the basin, especially around the lake. Important urban agglomerations and town clusters are where the majority of the built-up land is concentrated. The concentrated and continuous region of stony desertification is where the bare land is predominantly distributed (Figure 3). From 1980 to 2020, forestland, cultivated land, grassland, and wetlands all experienced a decline. The most substantial reductions were observed in cultivated land and grassland, with respective values of 243,585.94 ha and 150,819.53 ha. The decrease in forestland was comparatively less pronounced. The built-up land area experienced significant growth, reaching 309,701.98 ha, and, especially in core cities such as Kunming and Guiyang, it is more clearly visible (Figure 3). Significantly, the size of water bodies also notably expanded, experiencing a growth of 94,773.61 ha.

4.1.2. The Single Dynamic Index of Land-Use

From 1980 to 2020, the forestland, grassland, cultivated land, and wetland in the Yunnan–Kweichow Plateau experienced an annual decrease of 0.001%, 0.032%, 0.052%, and 0.192%, respectively, and water bodies, bare land, and built-up land, respectively, annually increased by 0.602%, 0.075%, and 1.908% (Figure 2). In terms of various stages and types of land, the built-up land experienced the highest annual decrease (4.290%) from 1980 to 1990, followed by water bodies (2.217%). The highest annual increase was in wetlands (2.367%) and water bodies (3.857%). Urbanization has been steadily increasing since 1990, leading to a swift growth of built-up land, which has the highest growth rate in the past three research stages, reaching 9.417%, 0.817%, and 4.700%, respectively. During the past three periods, the land categories experiencing the most significant yearly decline include bare land (2.501%), grassland (0.138%), and wetland (0.898%), in that order. It should be pointed out that the states of land use were generally stable from 2000 to 2010.

4.1.3. The Characteristics of Land-Use Transitions

In different stages of 1980–2020, there were frequent mutual transitions between all the land-use types in the Yunnan–Kweichow Plateau (Figure 4), with the most remarkable transition between forestland, grassland, and cultivated land. The cultivated land is the maximum resource of transition into built-up land in all the periods, with a total transition of 199.70 thousand ha. Furthermore, 46.62% of cultivated land was found to be converted to grassland and forestland, which indicates that a significant amount of decrease in cultivated land is connected to the continual expansion of urban areas. On the other hand, this also has something to do with the Grain for Green Project (GGP) (Figure 3) and the National Natural Forestland Protection Project (NNFPP). In addition, the situation of cultivated land occupying forestland and grassland still exists. In the past 40 years, approximately 189.02 thousand ha of forestland and grassland have been converted into farmland. There were 59,902.38 ha of grassland transiting into bare land in 1980–1990. Then, in the period of 1990–2000, the area of bare land changed greatly. There were 67,977.18 ha of bare land transitioning into cultivated land, grassland, and forestland, and the area of grassland was the biggest (59,301.36 ha), which indicated that the increase in bare land area was mainly related to the grassland degeneration in the early stage. After 1990, with the increased attention to natural environment protection, various ecological recovery projects gradually were conducted. Consequently, the amount of bare land steadily diminished. Forestland is the primary contributor to the rise in water bodies. There were relatively few transitions between wetlands and other land-use types in different stages. To sum up, the transformation of land-use categories was a two-way occurrence rather than a one-way occurrence.

4.2. Changes in ESV

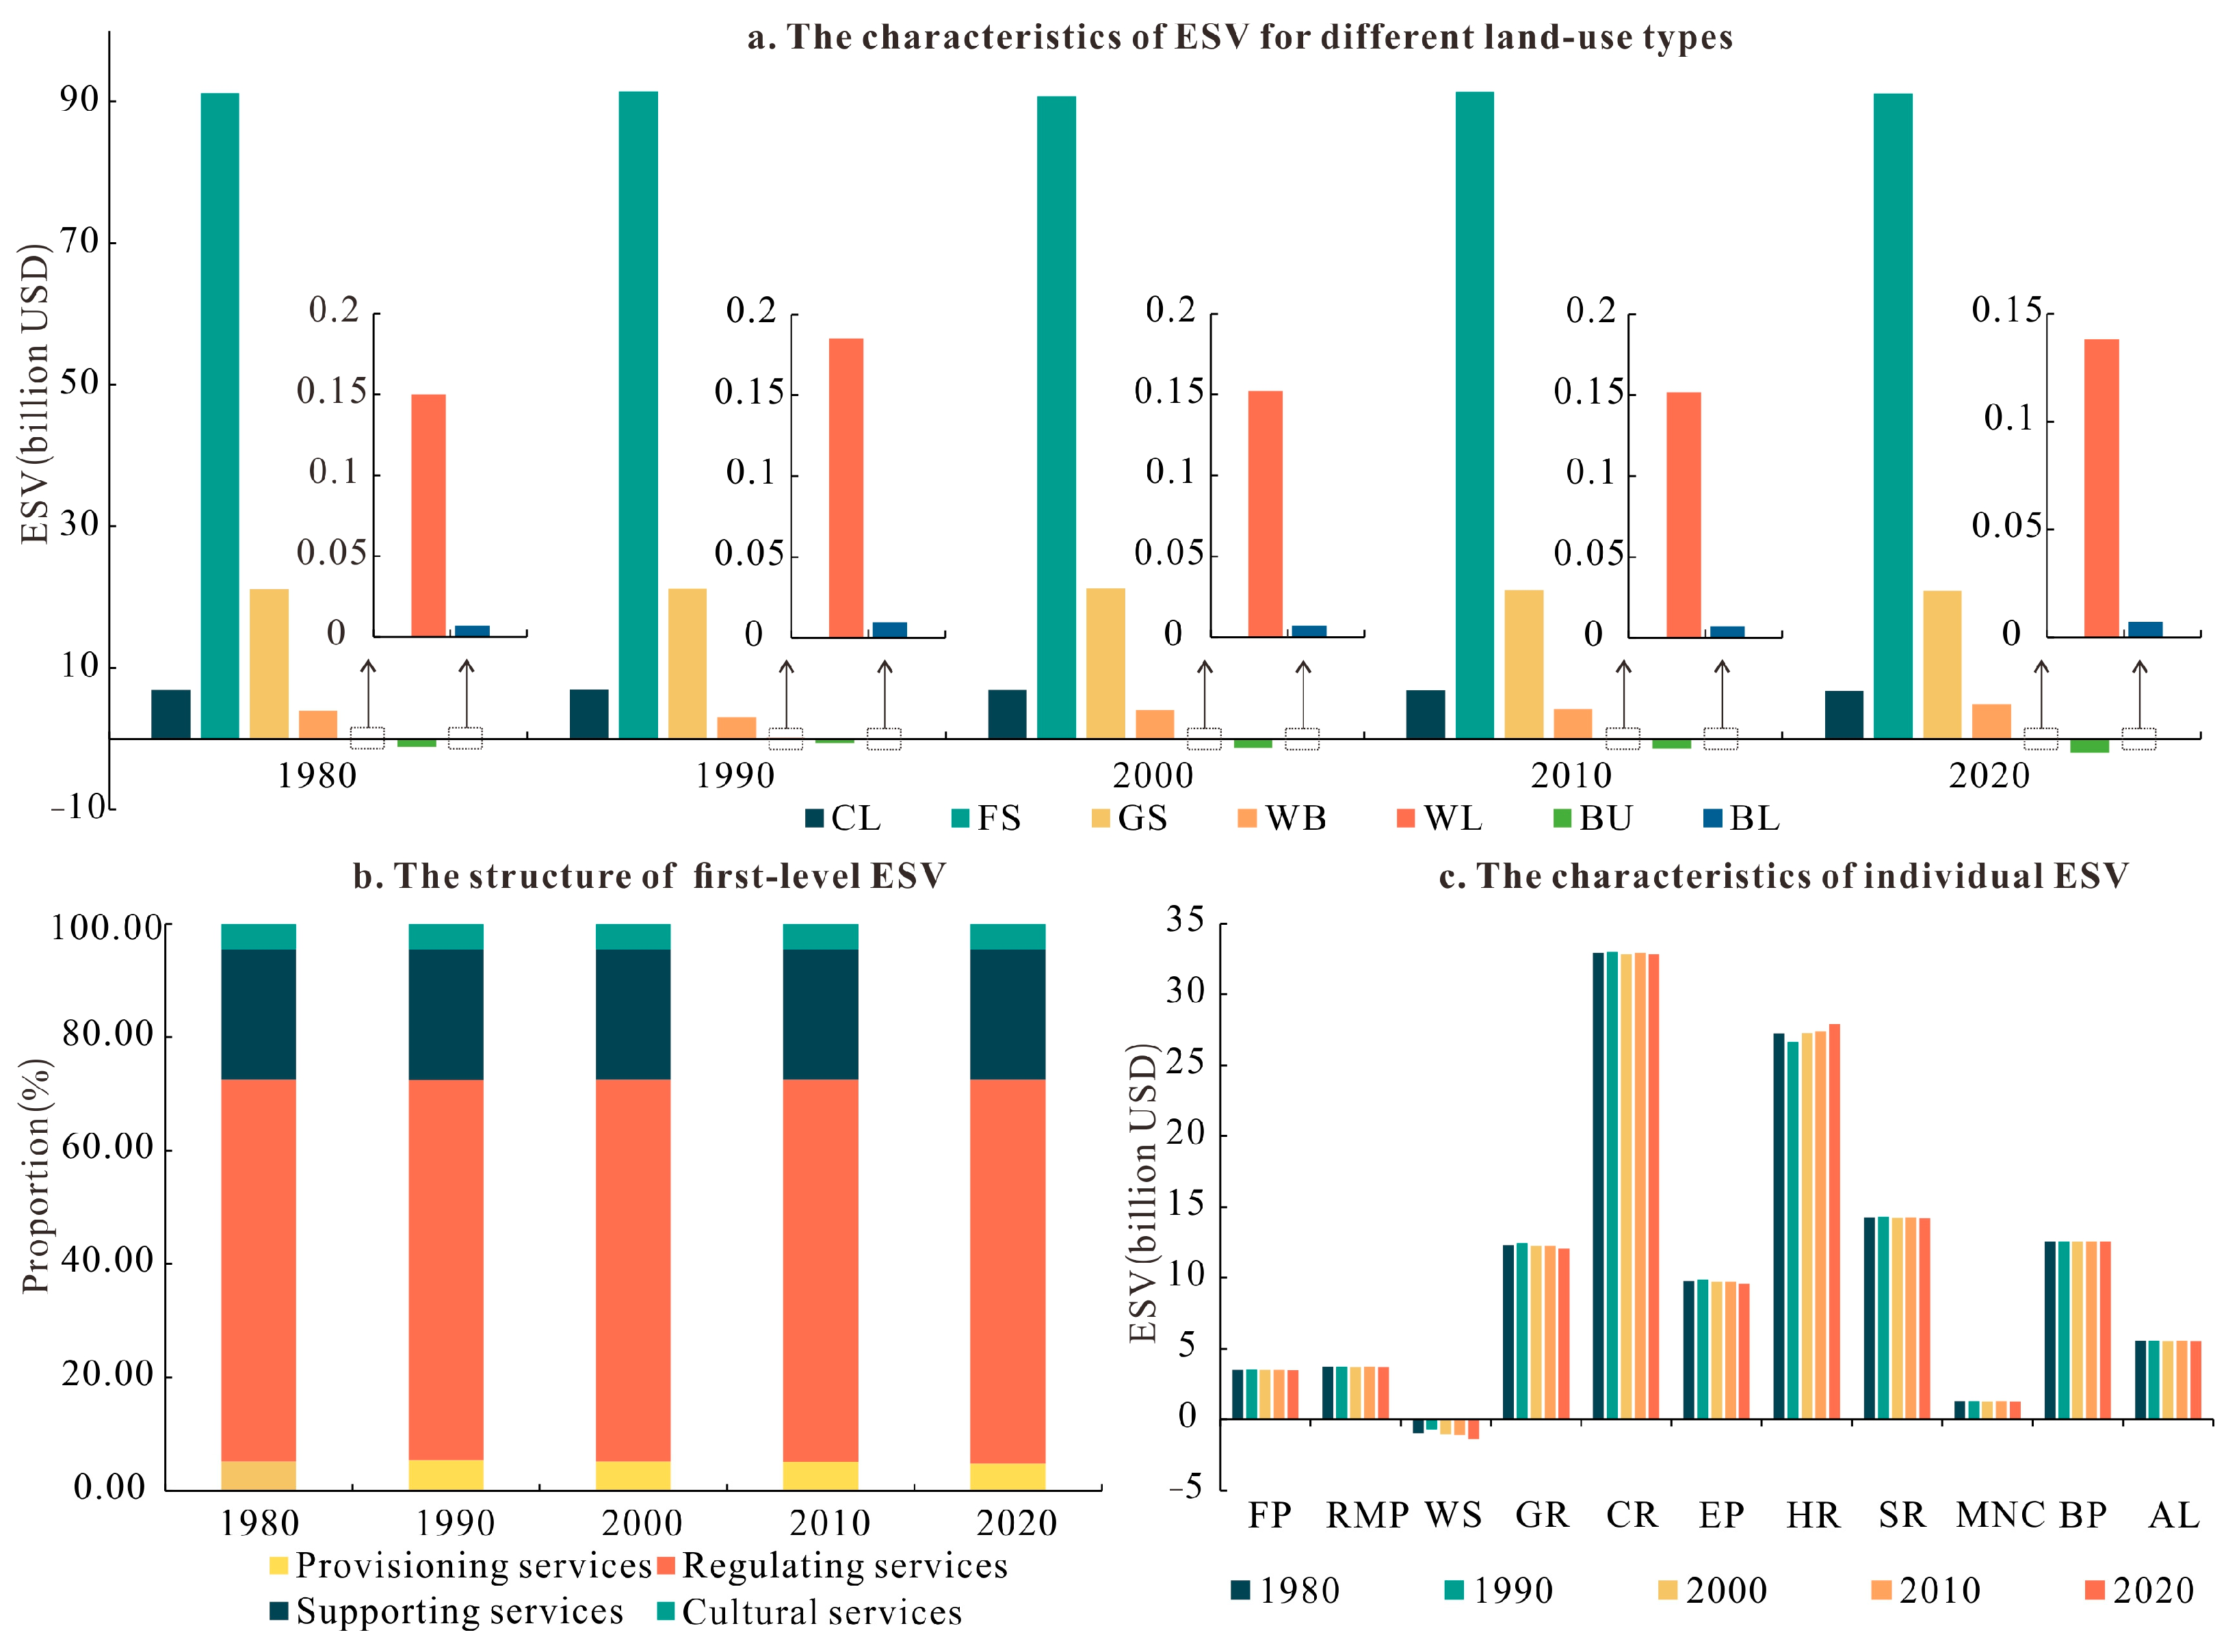
4.2.1. The Change in Total ESV

The total ESVs in 1980, 1990, 2000, 2010, and 2020 in the Yunnan–Kweichow Plateau, were USD 122,215.03 million, USD 122,232.68 million, USD 121,954.25 million, USD 122,187.01 million, and USD 121,838.82 million (Table 4). In each period, the forestland constitutes the primary component of ESV, with a proportion of over 74.00%, which is consistent with the high forest cover in the Yunnan–Kweichow Plateau. Followed by grassland and cultivated land, the proportion of both in each stage is above 17.00% and 5.50%, respectively. The ESV of water bodies increased by USD 952.68 million from 1980 to 2020, and the ecological contribution rate reached 41.74%. The ESV of built-up land decreased by USD 866.64 million, and the negative ecological contribution rate reached 37.97%, aligning closely with the rapid growth of this type of land usage. Due to the limited size of wetlands and bare land, the percentages of the ESVs during various periods are relatively small (Figure 5a).

4.2.2. The Changes in Individual ESVs

According to the first-level classification of service function, the contribution to total ESV is, in order, regulating service > provisioning service > supporting service > cultural service; especially, the contribution of regulation service was over 67.00% in all periods (Figure 5b and Table 5). In terms of individual ESVs, that is, the second-level classification of service function, the contribution of hydrological regulation and climate regulation is the highest, approaching 50.00% in all the periods, followed by soil formation and retention, biodiversity protection, gas regulation, and environment purification (Figure 5c). This indicates that in the Yunnan–Kweichow Plateau, the natural condition for vegetation growth is superior, and the biodiversity is rich. In contrast, the contribution of maintaining nutrient circulation, food production, and raw material production is relatively small to the total ESV, with a proportion of only around 7.00% in each of the research periods. In particular, the contribution of water supply to ESV is negative, and this impact is continuously increasing.
From 1980 to 2020, except for hydrological regulation and biodiversity protection, other kinds of service value were all decreasing. Among them, the maximum decrease was water supply, which decreased by USD 427.05 million, followed by gas adjustment and environment purification. The service value of hydrological regulation increased by USD 647.99 million. There is a widespread shortage of water in various regions of the Yunnan–Kweichow Plateau, especially in the urban agglomerations of central Yunnan and central Guizhou, where water resources are relatively scarce and the demand for water for industry, agriculture, and daily life is high. The per capita ecological surplus of water resources is relatively low. The core cities such as Kunming and Guiyang have had per capita water resources for many years that are lower than the internationally recognized minimum standard of 1000 cubic meters per person, and are in a state of severe water shortage. At the same time, the carrying capacity of water resources is on the verge of overload, and may have even exceeded the limit of reasonable development. Therefore, the continuous decline in the supply capacity of water resources will make the shortage of water resources more complex and severe.

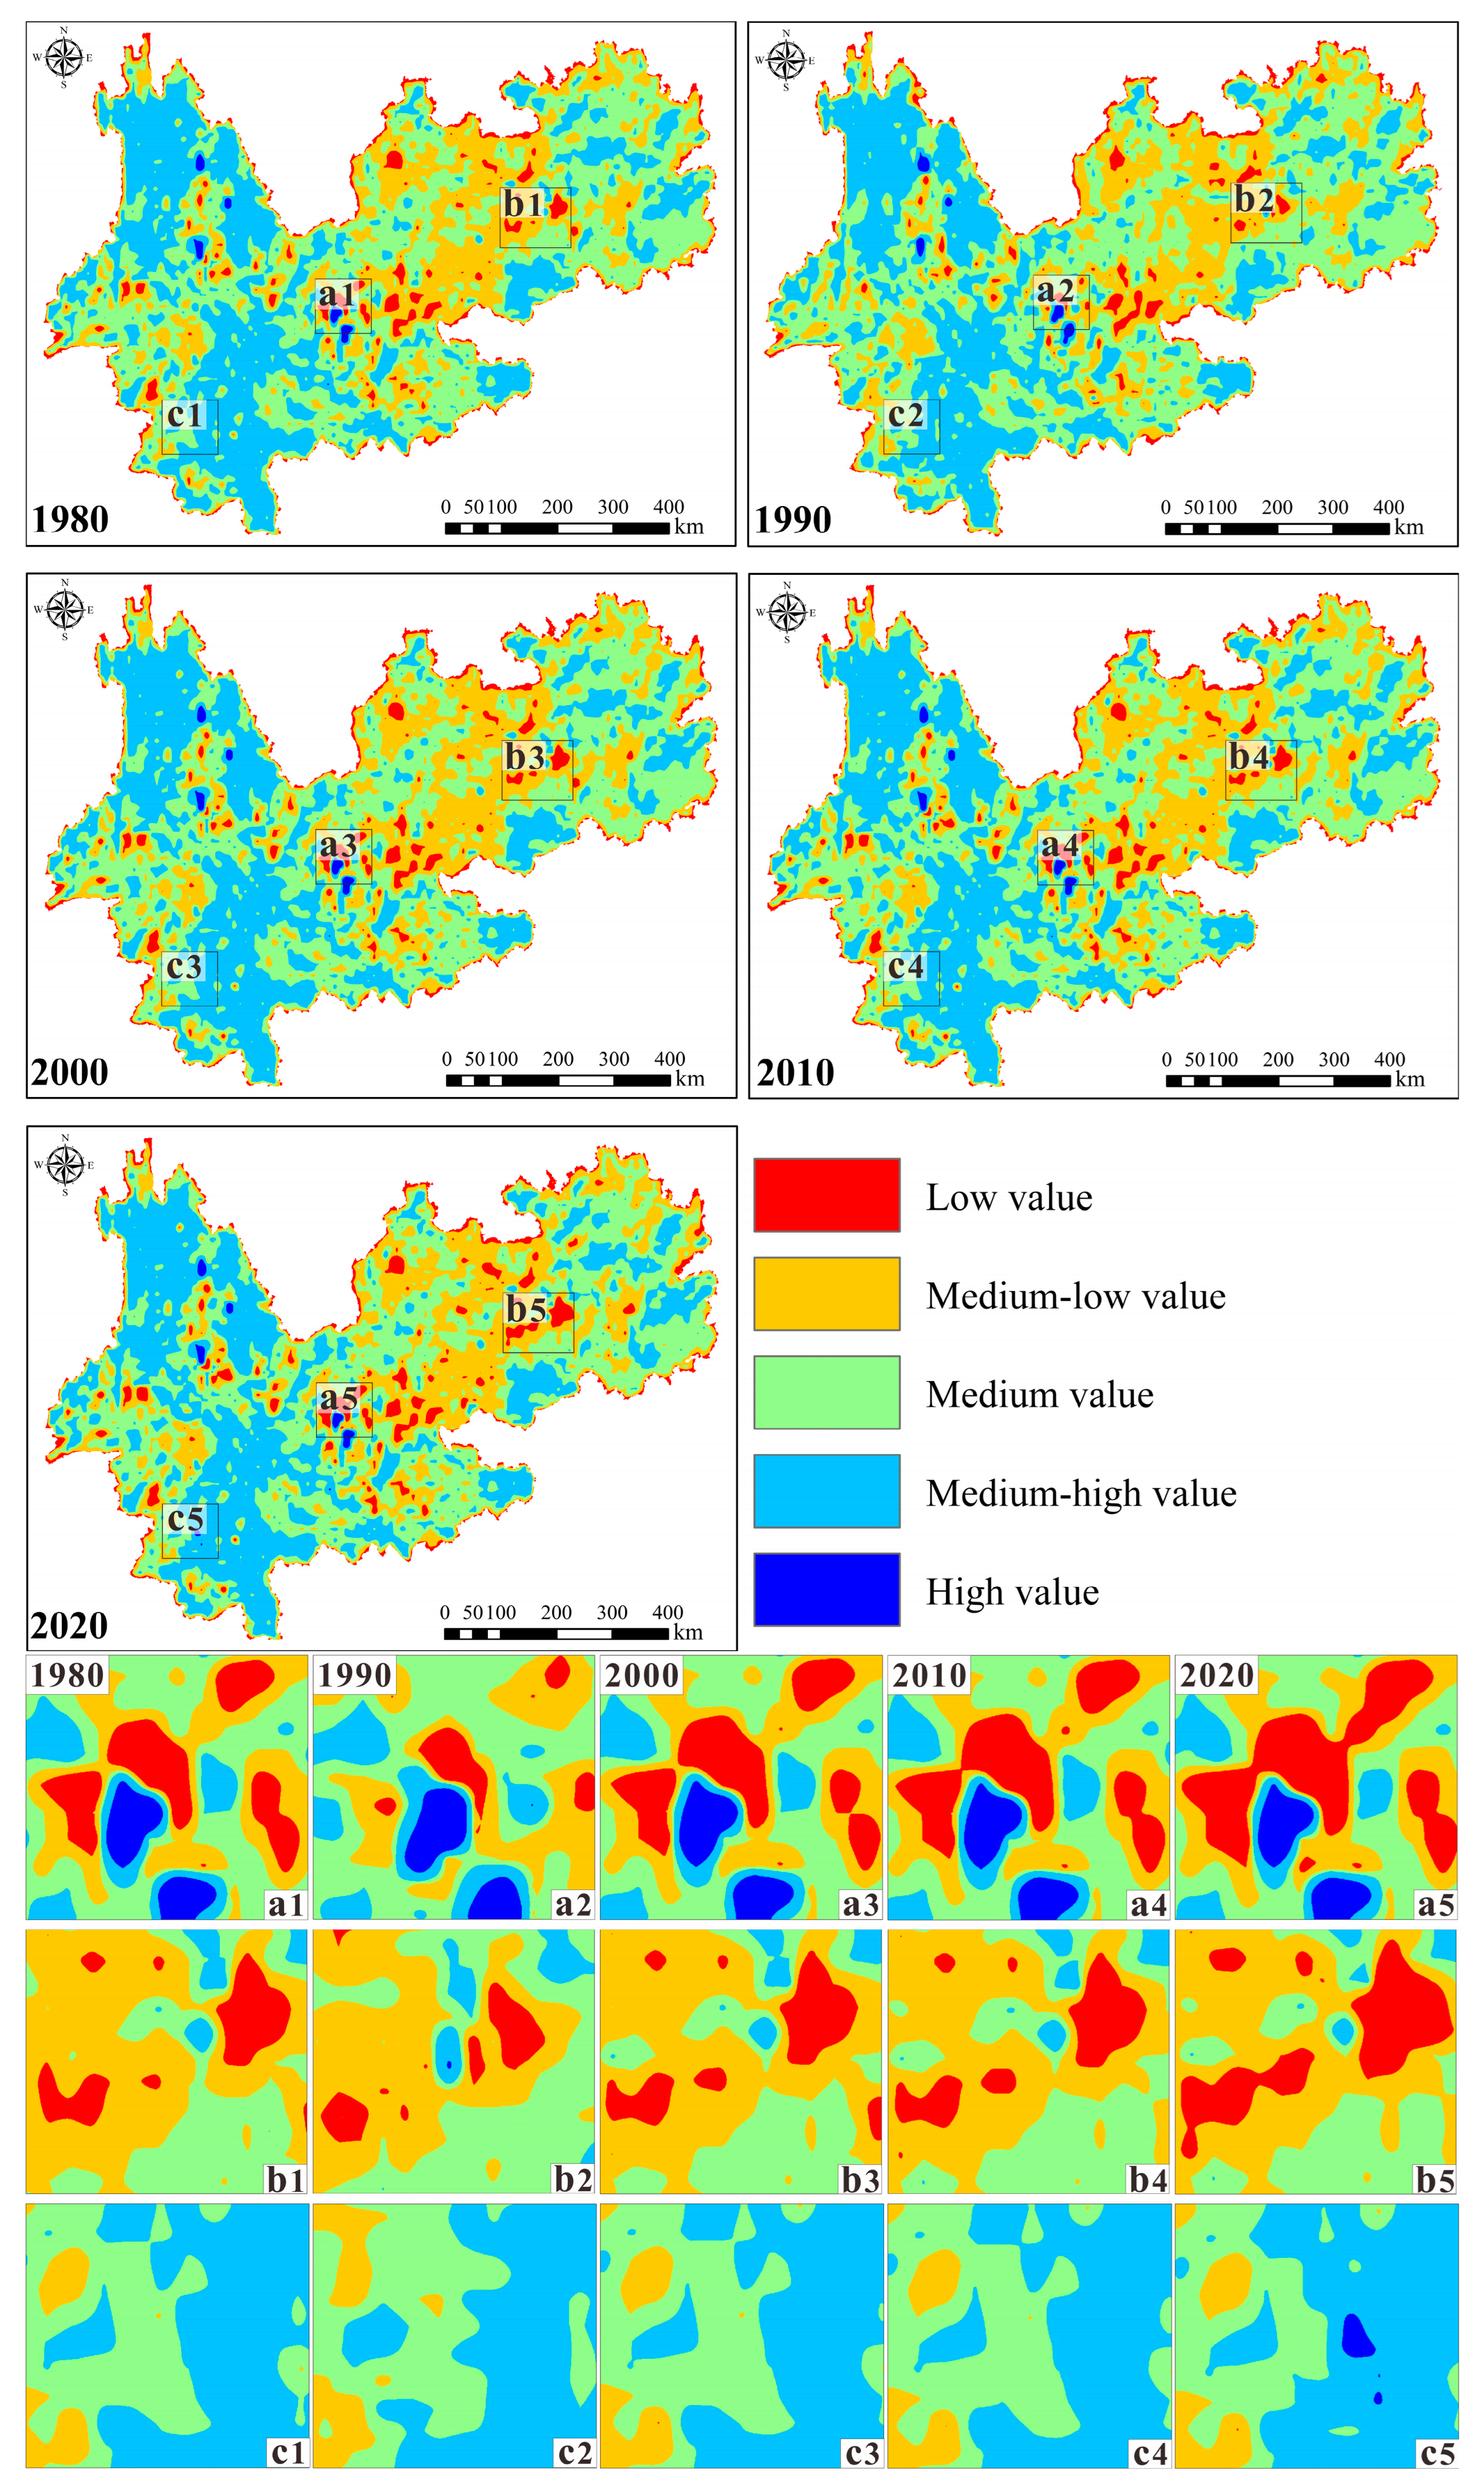
4.2.3. The Spatiotemporal Distribution Characteristics of ESV

The statistical results were averaged and adjusted based on the natural discontinuity method. According to the value of ecosystem services, they were divided into five levels: low value regions (≤USD 14.17 million), medium-low value regions (USD 14.17 million~ USD 19.37 million), medium value regions (USD 19.37 million~ USD 23.42 million), medium-high value regions (USD 23.42 million ~USD 35.57 million), and high-value regions (≥USD 35.57 million) (Figure 6), and the calculation of alterations in the extent and pace of ecosystem services across diverse levels within the study area during the preceding 40 years period was also tabulated (Table 6).
From 1980 to 2020, the ESVs in the study region were primarily concentrated in the medium-low- to medium-high-value range, while the low- and high-value areas had a relatively small distribution. The high-value-region is mainly focused on the plateau lakes like Lake Dianchi, Lake Erhai, and Lake Fuxian. The medium-high-value region is mainly around some important ecological belts, including key point lines like the Ecological Barrier in the southeast of the Qinghai–Tibet Plateau, the Ailao Mountain–Wuliang Mountain Ecological Barrier, and the Miaoling Ecological Zones. The low-value region and the medium-low-value region especially focused on southeast and central Yunnan regions, central Kweichow, as well as northeast Yunnan, and northwest and southwest Kweichow on both sides of the Wumeng Mountain. On the one hand, this is interrelated to the high urbanization intensity and large constructed land area in these regions; on the other hand, the regions of southeast Yunnan, northeast Yunnan, northwest Kweichow, and southwest Kweichow are the concentrated and continuous regions of stony desertification in the Yunnan–Kweichow Plateau, with low vegetation coverage, serious water and soil loss, extremely fragile and sensitive ecological environment, and low ecological carrying capacity.
During the study period, except for the medium-value regions, the area of other-level regions increased (Table 6); in particular, the area of low-value regions was the most obvious, increasing by 549.32 thousand ha, followed by the medium-high-value regions, the area of which increased by 371.58 thousand ha. The trend of this transformation became particularly evident after 1990. From the regional differences in ESV changes, on the one hand, with the advancement of urbanization, the scale of built-up land in core urban areas is still expanding, and a large number of forestland, cultivated land, and grassland are occupied, which leads to a significant increase in the area of low-value regions and medium-low-value regions (Figure 6(a1–a5,b1–b5)). On the other hand, with the implementation of various ecological projects, the natural environment of important ecological function areas is improving, which makes the area of medium-high-value regions and high-value-regions increase (Figure 6(c1–c5)).

4.3. The Impact of Land-Use Change on ESVs

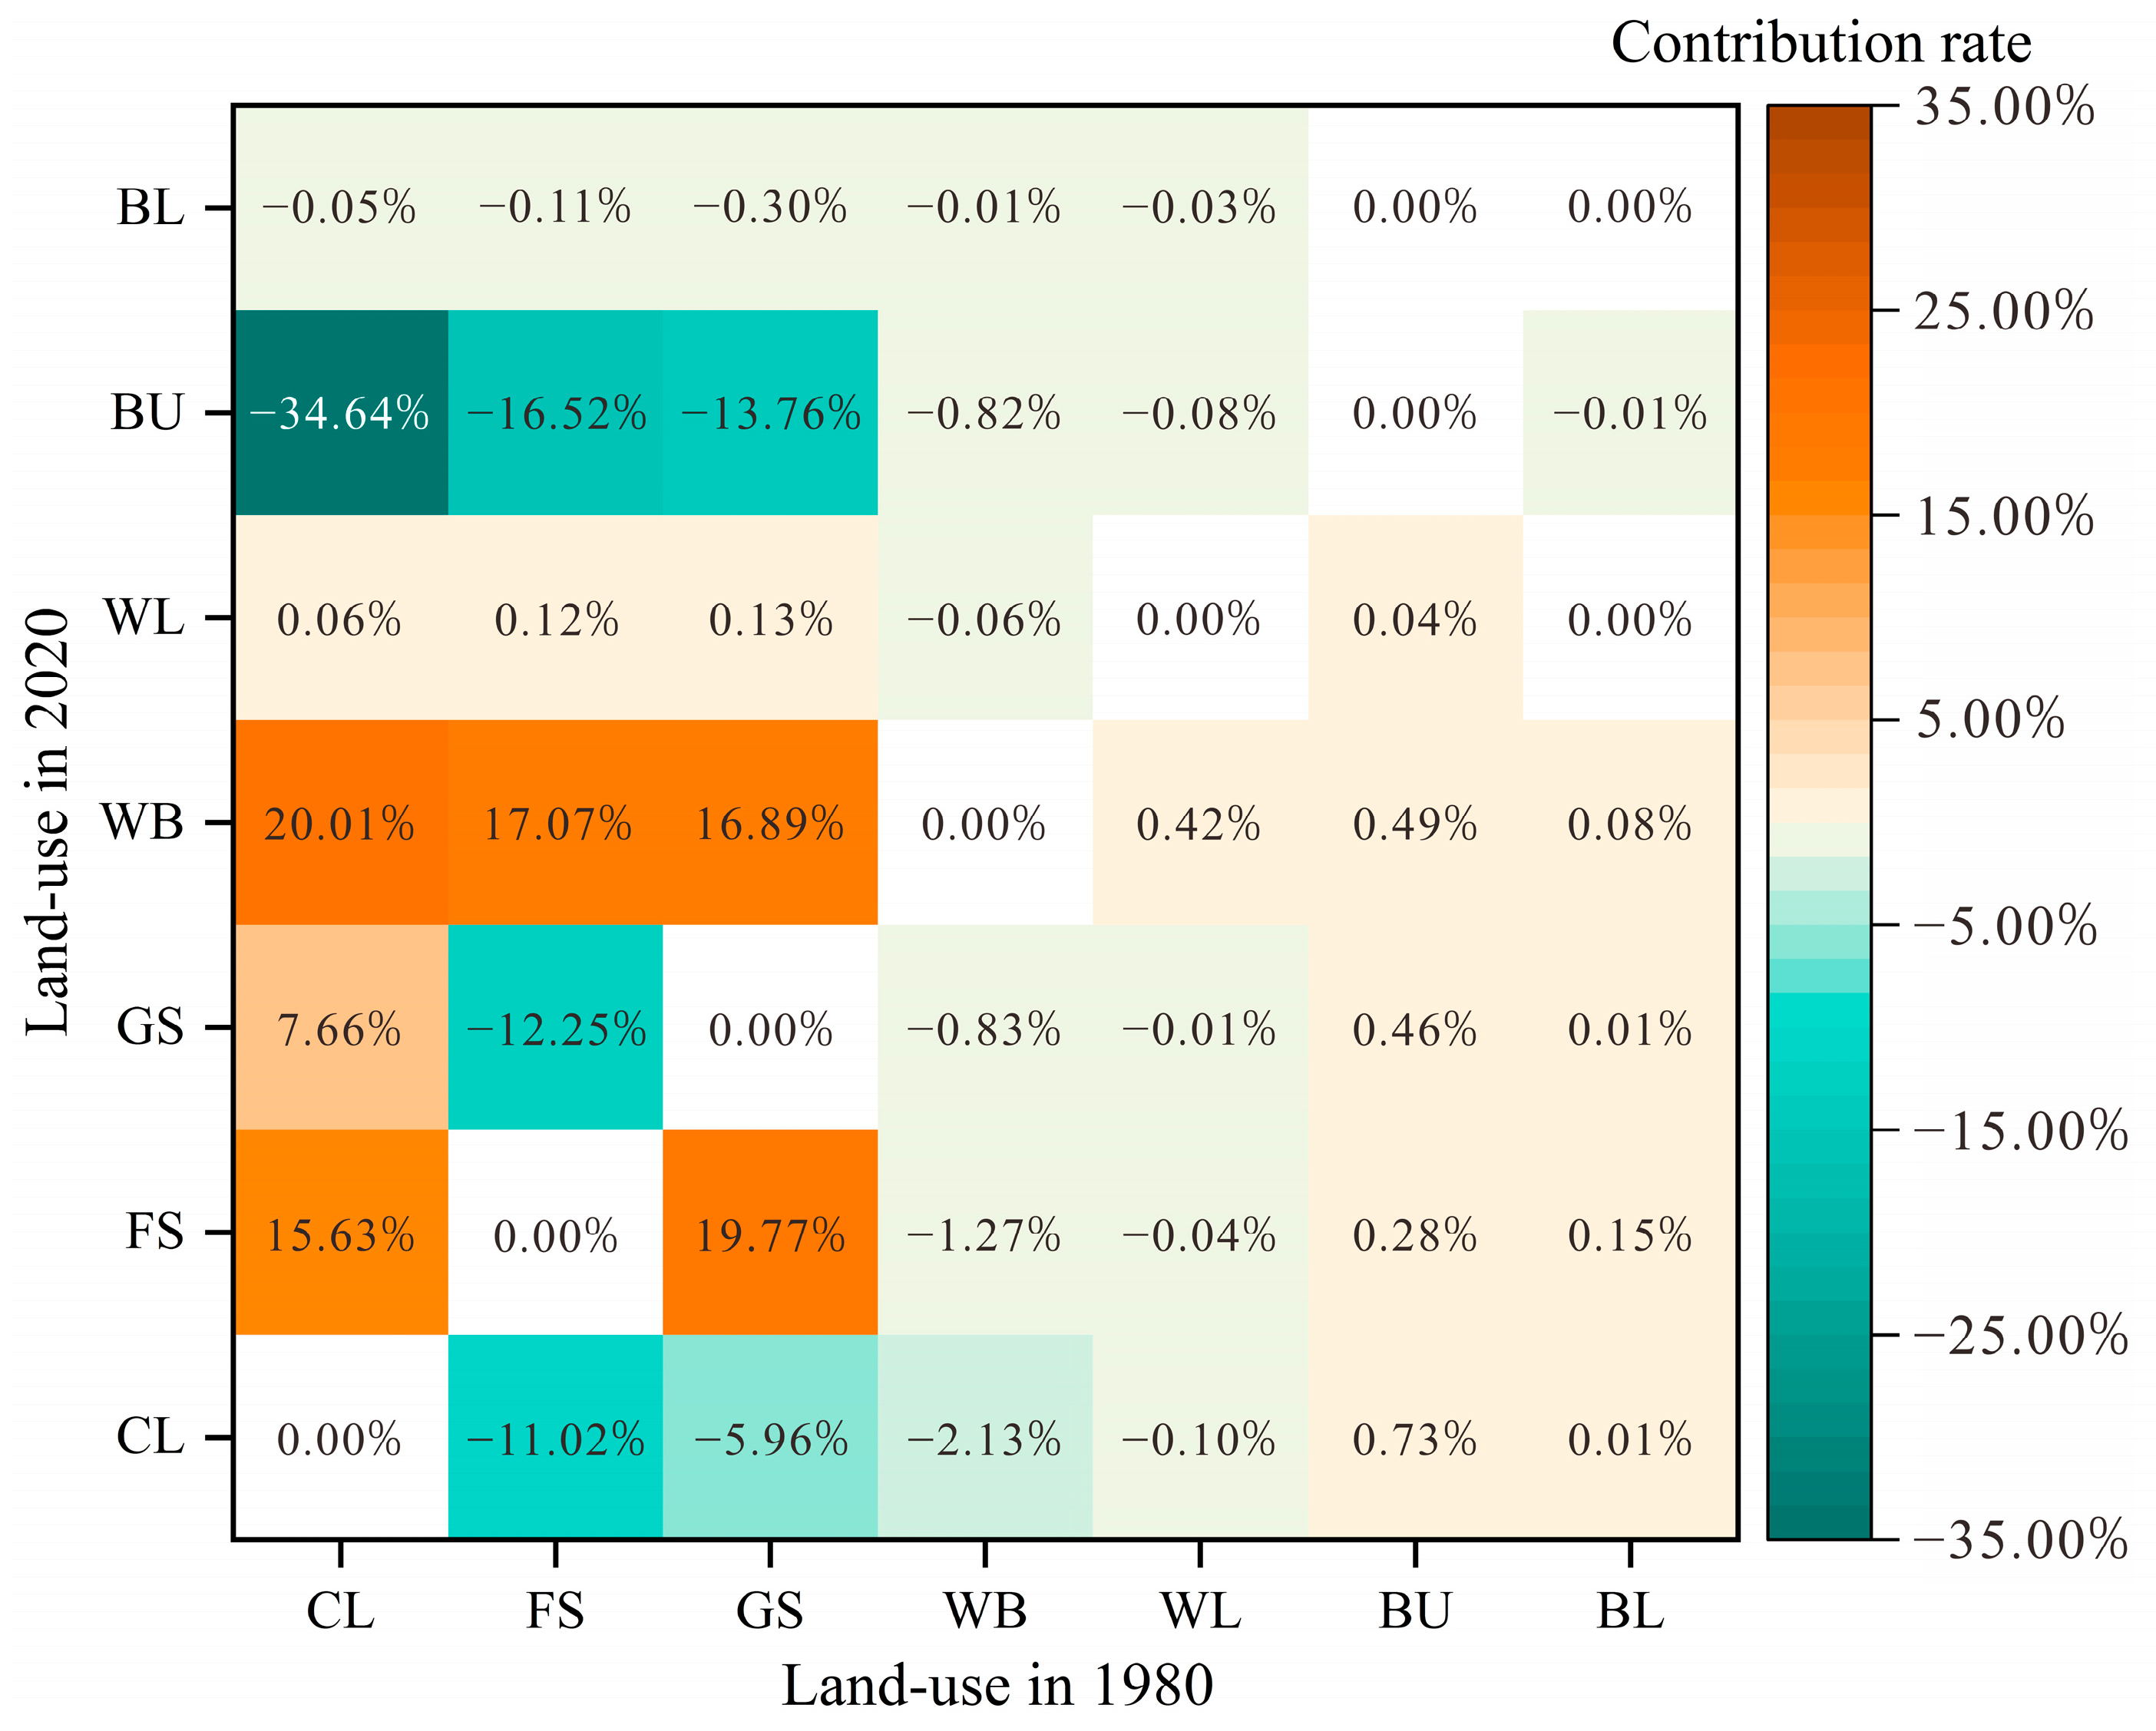
4.3.1. An Analysis of Contribution Factors

The value flow of ecosystem services suggests that the transition from cultivated land to built-up land is the primary cause of the loss of ESV in the Yunnan–Kweichow Plateau, with a value of USD 675.53 million (Figure 7), and the contribution rate of land transfer to a decrease in ESV reached −36.64% (Figure 8). Moreover, the shift from forestland to built-up land and from grassland to built-up land has also led to a decline in ESV, with a loss of USD 322.17 million (−16.52%) and USD 268.31 million (−13.76%), respectively. Additionally, the ESV loss caused by the transitions from forestland to cultivated land (−11.02%) and grassland (−12.25%), and from grassland land to cultivated land (−5.96%), cannot be neglected. The transitions from forestland, cultivated land, and grassland to water bodies, coupled with that of cultivated land and grassland to forestland, have been identified as the principal reasons behind the overall growth of ESV in the Yunnan–Kweichow Plateau. These transitions resulted in a total value of USD 1403.76 million, and the contribution rate of land transfer to the increase in ESV amounted to 89.37%. Accordingly, the transition out of forestland, grassland, and cultivated land, and the transition into built-up land, are the main causes of the loss in ESV in study regions. On the contrary, the transition in land-use types with grand ecological value coefficients like forestland, as well as water bodies, will lead to the improvement in ESV in study regions.
In different research stages, the response elasticities of ESV to land-use change are, respectively, 0.018, 0.203, 0.216, and 0.262, with an increased tendency. Prior studies have demonstrated that ecosystem services’ response to land-use change is directly proportional to the value of the elasticity’s magnitude [57]. Based on the characteristics of elasticity value in all the periods in the Yunnan–Kweichow Plateau, as time went on, the change response for ESV to land use in this region became more and more sensitive. Therefore, it is particularly important to develop reasonable territorial spatial planning.

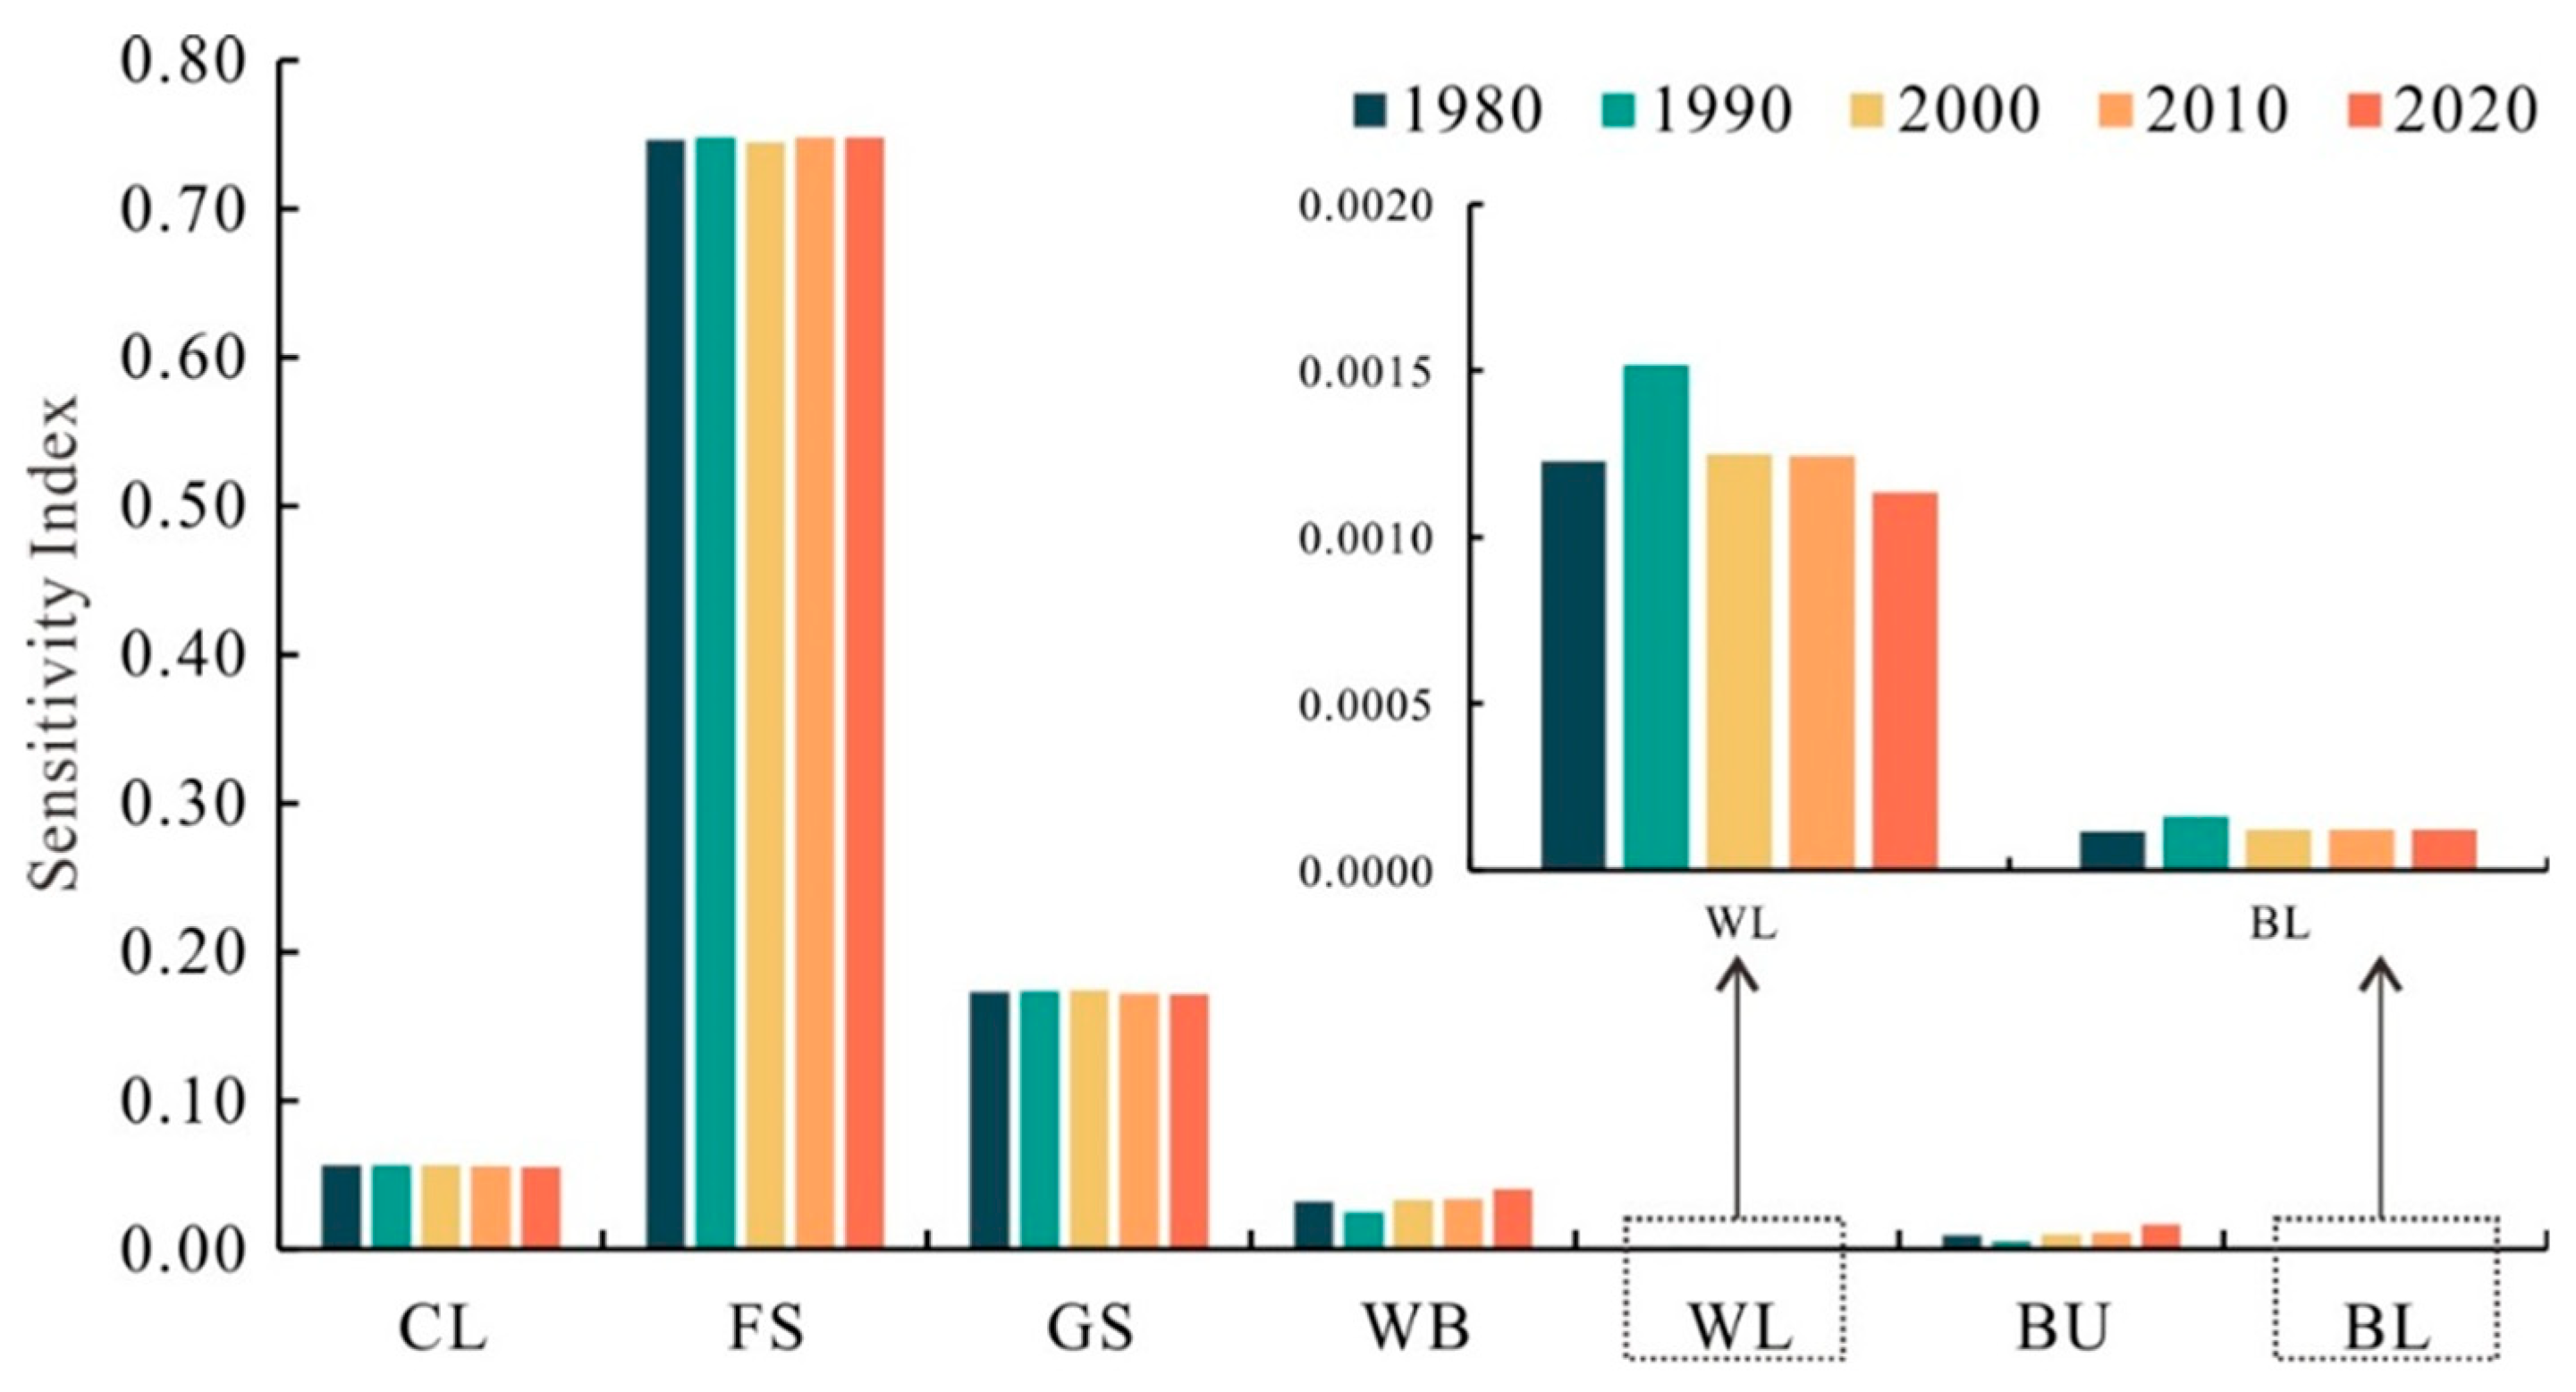
4.3.2. An Analysis of Sensitivity

The results indicate that after adjusting the value coefficients by ±50%, the sensitivity coefficients in different periods for each land-use type are all less than one (Figure 9). The highest sensitivity coefficient for forestland is 0.7446–0.7481, indicating that a 1% increase in the ecological value coefficient of forestland will result in a corresponding increase of 0.7446–0.7481 percentage points in the total ESV. This shows that the impact of forestland’s ecological value coefficient change on the total ESV change is relatively obvious, which is consistent with the high coverage rate of forest in the Yunnan–Kweichow Plateau, the large areas of forestland, and the high weight of the total land area. The minimum sensitivity coefficient for bare land is 0.0001, which indicates that the adjustment of the ecological value coefficient for bare land has minimal influence on the total ESV change. The sensitivity index indicates that the ecological value coefficient lacks elasticity in the study region, and the evaluation result remains reliable.

5. Discussion

5.1. The Driving Mechanism of Land-Use Change

The Yunnan–Kweichow Plateau serves as the core region for establishing the economic belt along the Yangtze River and for executing the Western Development Strategy, and is presently at a crucial stage in the development of new-style urbanization. The rapid growth of the economy has led to significant changes in land use. Especially, with the economic growth (Figure 10a) and population increase (Figure 10b), all kinds of infrastructures and road nets expand continuously (Figure 10c), which leads to the obvious rise in the proportion of urbanized land and the serious occupation of other land-use types, particularly farmland, aggravating the loss from cultivated land to non-agricultural fields. Previous research indicates that from 2001–2016, the amount of cultivated land collected by urban construction in the Yunnan–Kweichow Plateau cities was 222.5 thousand ha, and the amount of that in the Yunnan Province alone was 197.9 thousand ha, which ranked first in China, and had the highest marginal consumption value of cultivated land. Nonetheless, the expansion of land designated for construction fails to facilitate the acceleration of urbanization ratios [58], which are related to the low land-use intensity rate in urban extension and the land extensive-use model. The direct result is to cause a large amount of waste and area decrease for cultivated resources. Secondly, there was much sloping in cultivated land of over 15° in the study region, with a proportion of 45.27% for agricultural acreage [59,60], which is an important region for the conduction of GGP. This also deepens the reduction in cultivated land area in another aspect [16,61].
The reduction in the wetland also has a relatively consistent relation to urbanization expansion. Most wetland in the Yunnan–Kweichow Plateau is distributed in the basin and around lakes, where the population is dense, industry and agriculture are concentrated, and where there is relatively rapid economic growth. The disturbance of human activities is very remarkable. The ecosystem suffers relatively huge stress, which leads to the rapid worsening of the natural environment of lakes and the wetlands around them, and appears to be the phenomenon of area reduction, water pollution, eutrophication, water and soil loss, and sedimentation. However, it should be noted that the decrease in the water surface of plateau lakes does not affect the overall increase in water surface area. This is consistent with the continuous increase in hydraulic and water-power engineering. From 1980 to 2020, there was a significant rise in the number of reservoirs across the entire region, and the total water surface area of reservoirs reached 253.7 thousand ha [59,60]. On the other hand, the annual generating capacity contained by water resources in the study region is huge, and the study region is the south channel and an important output place of the west–east electricity transmission project. There are five of the thirteen Chinese water-power bases in the Yunnan–Kweichow Plateau. Recently, the number of constructions of cascade hydropower stations has been continuously increasing. Taking Yunnan Province as an example, up to 2020, the number of hydropower stations in each major drainage basin reached 64 (including those under construction) [64]. After the construction of power stations, the water levels in reservoir regions rose, resulting in a noticeable increase in the water’s area. Meanwhile, a significant portion of forestland, grassland, and cultivated land were submerged, which led to decreased land areas, a loss of animal and plant habitats, and a reduction in forestland coverage rate [65].
In the Yunnan–Kweichow Plateau, bare land mainly is concentrated in the karst rocky desertification area. The stony desertification area is a very typical land resource problem in the Yunnan–Kweichow Plateau. In particular, before the 1990s, the stony desertification problem of karst regions continued to worsen, and the area expanded significantly [66,67]. Then, in the 21st century, through various forms of recovery and management organized by the country, the situation of stony desertification has been effectively contained, the ecological environment has improved gradually, the stony desertification region has turned into forestland and grassland, especially the grassland, and the area has decreased gradually. However, due to the long-term and arduous nature of the management process and the ongoing expansion of stony desertification in local areas, the annual rate of decrease in stony desertification areas has been declining. The statistics indicate that the bare land area in the Yunnan–Kweichow Plateau during the research period shows an overall tendency to increase first, decrease, and then remain stable, which is consistent with the evolution tendency of stony desertification. This also indicates that the degree of the evolution tendency of stony desertification is the leading crucial factor of the area change of bare land.

5.2. The Dynamic Response of ESV to Land-Use Change

Owing to land-use change, the ESV of the Yunnan–Kweichow Plateau decreased by USD 376.21 million from 1980 to 2020. The decrease in forestland, grassland, and cultivated land, and the significant increase in built-up land owing to the urbanization process are the main causes. These changes led to a respective reduction in ESV by USD 39.40 million, USD 269.19 million, USD 142.36 million, and USD 866.64 million. Even though the increase in water bodies has had a positive impact on the ESV, it has not been able to fully compensate for the decline in ESV due to the reduction of other land and the expansion of constructed land. It is worth noting that the negative ecological contribution rate of built-up land is highlighted (Table 4). On the one hand, this is related to its lower ESV coefficient (Table 2). However, more importantly, it is closely related to the large-scale expansion of built-up land. That is, the significant increase in built-up land comes at the expense of the reduction in land areas with high ESV coefficients, such as cultivated land, grassland, and forestland (Figure 7). Therefore, it is extremely important to reasonably restrict the expansion of built-up land to enhance the ecosystem service value of the Yunnan–Kweichow Plateau.
Studies indicate that the rise in population density and the growth of cities in Yunnan, Guangxi, Sichuan, Kweichow, and Chongqing have resulted in the transformation of forestland, grassland, and cultivated land into urbanized land, thus resulting in a significant decline in the overall ESV. This trend is particularly pronounced in economic development core regions such as Chengdu, Nanning, Guiyang, and the city group in middle Yunnan, indicating that the unbridled pursuit of economic efficiency and urban expansion have been the primary causes behind the decline in ESV [41,42,54,55,68,69]. This situation is relatively common in other countries. For example, in the Dhaka region in Bangladesh, as other land-use types transitioned to constructed land in 1990–2020, ESV decreased by 59.55% [27]. In the middle region of Ethiopia, the expansion of agriculture and settlement, along with the decline in forestland from 1973 to 2015, caused a significant loss in ESV amounting to USD 3.69 million [14]. However, this situation is not unavoidable; Zhang et al. pointed out that if nature reserves were established and conservation laws and policies were conducted, the ESV loss caused by city expansion would be reduced [70].
From individual ecosystem services, the provisioning service is most significantly affected by land-use change, followed by the regulating service. The decline in forestland, grassland, cultivated land, and wetland, coupled with the growth of built-up land, has resulted in a substantial reduction in the ESV for water supply, gas regulation, climate regulation, soil formation and retention, and environmental purification (Table 7). In particular, the water supply service of built-up land alone decreased by USD 541.93 million, leading to a significant reduction in the value of the provisioning services. Conversely, the rise in ESV of regulating services can be ascribed to the growth of water bodies, which has promoted the improvement of hydrological regulation services (Table 7). For the same land-use type, the effects of area change on different ecosystem services are different [71,72]. The increase in built-up land has led to a decline in the ESV of water supply, gas regulation, and environmental purification. However, it has had a positive influence on food production, aesthetic landscape, biodiversity protection, and soil conservation. Meanwhile, the implementation of the GGP in the study region has led to a reduction in the area of cultivated land and a corresponding decrease in grain production capacity, and the service value of grain production decreased by USD 39.29 million (Table 7). However, it has also facilitated the restoration and revegetation of vegetation types, leading to enhanced service functions such as climate control, the regulation of water resources, the preservation of soil, and the protection of biodiversity. All in all, the influence of land-use changes on ESV is a two-way process, and the impact of different land-use modifications on ecosystem service functions is significantly different [69,73,74,75,76,77].

5.3. Future Land Policy Formulation

The significant rise in the built-up land of the Yunnan–Kweichow Plateau squeezes the space of forestland, grassland, and particularly cultivated land. This leads to the obvious decrease in ecological land, the breakage and isolation of the ecological landscape, and a huge loss in ESV. Meanwhile, based on the scarcity of cultivated resources in the Yunnan–Kweichow Plateau, the few cultivated land areas per person, the high proportion of steep-slope cultivated land and drought land, and the low input-output ratio, the continuous decrease in cultivated land is bound to have an adverse effect on agriculture production security and ecological environment protection, which is closely linked to regional sustainable development. On one side, the increase in water area on the one hand significantly enhances the ESV; however, it also inundates extensive areas of forests, grasslands, and cultivated land, leading to varying effects on agricultural output and biodiversity. In addition, to local regions, the stony desertification land is still expanding. In some areas where stony desertification has been controlled and restored, the ecological environment remains fragile [78]. With global warming, the slightly unreasonable land-use model will result in the appearing degeneration of significant amounts of vegetation.
When crafting land-use policies, it is crucial to consider the improvement of the following policies on ESV in the Yunnan–Kweichow Plateau. Firstly, it is crucial to effectively manage the growth of built-up land in core cities and city groups, enhance the intensive use-ratio of existing constructed land, reduce the occupation of urbanization to forestland, grassland, and cultivated land, and reduce the strain on the ecosystem. Secondly, it is to ensure the cultivated land requisition–compensation balance. As the environment services’ payment is the tool for regulating the ecosystem [79], putting ESV loss owing to the acquisition of cultivated land during urbanization construction into land acquisition compensation can truly reflect on the scarcity of cultivated land. Moreover, an essential factor in the execution of GGP is the steepness of the slope, where agricultural land with a gradient exceeding a specific angle (referred to as the desired slope) must be transformed into woodland or meadow. Hence, it is crucial to rationally and scientifically determine the desired inclination while implementing GGP for sloping farmland in various areas, aiming to minimize the loss of high-quality cultivated land. Additionally, it is that the construction of water resources and hydropower engineers should consider the ecological regulation objectives in the impacted regions. Also, the organization of a diversified ecosystem dispatch model should be established, one should sufficiently consider the coordination between social service functions like flood prevention and electricity generation, and ecosystem service functions like biodiversity, food production, and soil conservation, to reduce or eliminate the negative impact of cascade hydropower stations. Another step is to formulate ecological protection red lines around plateau lakes and wetlands, establish natural reserves and administration and decision-making organizations to evaluate the anthropogenic impacts on the ecosystem, and to ensure the reasonable use of plateau lakes and wetland resources; the fifth is to continue to implement the NNFPP, and to formulate a sustainable green development model of ecological environmental protection in stony desertification regions, and to pursue the exploration of land resources based on natural solutions. It is important to establish a collaborative restoration model and development mechanism that integrates soil and water conservation, water source conservation, and biodiversity.

5.4. Future Research Opportunities and Study Constraints

One of the Sustainable Development Goals of the United Nations (SDGs) is about protecting, recovering, and promoting the sustainable use of terrestrial ecological systems, sustainable forest management, desertification prevention and treatment, preventing and reversing land degradation, and containing the loss of biodiversity. As the most direct expression pattern of the effect of human activities on terrestrial ecosystems, land-use change plays a decisive role in maintaining ecosystem service functions and their sustainable utilization. At the same time, the monetization of ESV can effectively improve people’s knowledge of the ecological environment, and more importantly, help decision makers to formulate reasonable land-use plans. The unit area equivalence factor method is a commonly used approach in recent ecosystem services valuation. Meanwhile, to improve the credibility of the estimation of ESV, this study used the multi-year average grain yield of farmland in the Yunnan–Kweichow Plateau, and combined it with biomass factors to adjust the ecosystem services’ value coefficient. Finally, a sensitivity analysis was conducted to effectively improve the accuracy of the research results. However, there are some limitations to this research method. The period of this study is large and has some deficiencies in the detailed describing of the change tendency characteristics of ESV. When analyzing the impact of land-use change on ecosystem services’ valuation, the lack of subdivision within forestland and grassland types due to spatiotemporal scales presents a limitation. Secondly, the ESV is continuously changing during the whole ecological process. This dynamic change reflects the transformation in the study region’s social development stage, resource scarcity, and land-use pattern. Although this research modified the ESV coefficients based on biomass factors, it did not deeply consider the impact of socio-economic conditions like population density, urbanization rate, and consumption level on local ESV changes. In other words, it did not thoroughly analyze the ESV changes from a more dynamic standpoint. In addition, this study did not predict various future scenarios, nor did it quantitatively analyze the impact of natural, social, and economic drivers on the profit and loss of ESV. More importantly, due to the lack of the spatiotemporal exploration of the interaction between ESV and landscape ecological risk in the study, it is not possible to formulate more detailed ecological policies, which will be the focus of our next work.

6. Conclusions

This study quantitatively analyzed the impact of land-use changes on ecosystem service value in the Yunnan–Kweichow Plateau between 1980 and 2020, providing a reference for the sustainable development and utilization of land resources:
  • The rapid development of urbanization has led to significant changes in land use in the Yunnan–Kweichow Plateau. The area of cultivated land, forestland, grassland, and wetland has decreased, while the area of water bodies, built-up land, and bare land has increased. In particular, the large-scale expansion of built-up land has occupied vast areas of forestland, grassland, and cultivated land, leading to a significant reduction in the total area of cultivated land, which has a negative impact on agricultural production safety. Moreover, the decrease in cultivated land is also linked to the implementation of the Grain for Green Project. The continuous increase in the number of water bodies can be attributed primarily to the ongoing rise in water conservancy and hydropower projects. In the meantime, the growth of urbanization led to a reduction in the wetland area, whereas alterations in the bare land area were associated with the degradation of grasslands and the spread of stony desertification;
  • The forestland has the highest total ecosystem service value, followed by grassland and cultivated land. Climate regulation and hydrological regulation make the greatest contribution to the total ecosystem service value, while water supply is the only ecosystem service type that has a negative impact on the total ecosystem service value, and the negative impact is increasing, which may exacerbate regional water-scarcity issues. Spatially, the ecosystem service value in the Yunnan–Kweichow Plateau is mainly concentrated in the medium-low- to medium-high-value range. The spatial distribution changes of ecosystem service value have shown a trend of two-level differentiation due to the development of urbanization and the implementation of ecological engineering projects.
  • The elastic response of ecosystem service value in the Yunnan–Kweichow Plateau to land-use change is becoming increasingly sensitive. During the study period, the ecosystem service value of hydrological regulation and biodiversity conservation increased, while the value of other ecosystem services decreased. The total ecosystem service value of the entire Yunnan–Kweichow Plateau decreased by USD 376.21 million, which is closely related to the reduction in forestland, grassland, and cultivated land area, as well as the significant increase in built-up land, particularly with the highest negative ecological contribution rate from built-up land. To enhance the ecosystem service functions of the Yunnan–Kweichow Plateau, managers need to further strengthen the protection of cultivated land and implement ecological restoration projects, while strictly controlling the expansion of construction land and improving the intensive utilization rate of construction land.
  • This study deeply explores the interactive relationship between the spatiotemporal characteristics of ecosystem service value and land-use change in the Yunnan–Kweichow Plateau, providing important ecological indicators for managers to further understand the evolution laws of regional development and the supply and demand of ecosystem services. This enables managers to make rational decisions on land development and utilization between resource development, urban development, and ecosystem service trade-offs, which has a positive role in promoting sustainable urbanization development.

Author Contributions

Conceptualization, C.Y. and J.L.; methodology, C.Y. and J.L.; software, S.J., W.Y. and H.D.; validation, C.Y. and S.J. and C.L.; formal analysis, C.Y. and W.Y.; investigation, W.Y., Y.T. and C.L.; resources, C.Y.; data curation, C.Y.; writing—original draft preparation, C.Y., J.L. and S.J.; writing—review and editing, C.Y. and J.L.; visualization, C.L., Z.W. and Y.H.; supervision, C.Y. and Y.T.; project administration, C.Y.; funding acquisition, C.Y. All authors have read and agreed to the published version of the manuscript.

Funding

This research was funded by [China Geological Survey] grant number [DD20220888, DD20220879, and DD20220873] and the [National Natural Science Foundation of China] grant number [42271094 and U2102209].

Data Availability Statement

The land-use data (DOI: 10.12078/2018070201) and administrative boundary data (DOI: 10.12078/2023010102; DOI: 10.12078/2023010103) associated with this article were downloaded from the Resources and Environment Science and Data Center (RESDC), Chinese Academy of Sciences (https://www.resdc.cn/Default.aspx). The DEM was also downloaded from RESDC (https://www.resdc.cn/data.aspx?DATAID=284). The socioeconomic data was downloaded from the China Economic and Social Big Data Research Platform (https://data.cnki.net/). All links accessed on 19 October 2023.

Conflicts of Interest

The authors declare no conflict of interest.

References

  1. Daily, G.C. Nature’s Services: Societal Dependence on Natural Ecosystems; Island Press: Washington, DC, USA, 1997. [Google Scholar]
  2. Egoh, B.; Rouget, M.; Reyers, B.; Knight, A.T.; Cowling, R.M.; van Jaarsveld, A.S.; Welz, A. Integrating ecosystem services into conservation assessments: A review. Ecol. Econ. 2007, 63, 714–721. [Google Scholar] [CrossRef]
  3. Wainger, L.A.; King, D.M.; Mack, R.N.; Price, E.W.; Maslin, T. Can the concept of ecosystem services be practically applied to improve natural resource management decisions? Ecol. Econ. 2010, 69, 978–987. [Google Scholar] [CrossRef]
  4. Lautenbach, S.; Kugel, C.; Lausch, A.; Seppelt, R. Analysis of historic changes in regional ecosystem service provisioning using land-use data. Ecol. Indic. 2011, 11, 676–687. [Google Scholar] [CrossRef]
  5. Millennium Ecosystem Assessment (MA). Ecosystems and Human Well-Being: Synthesis; Island Press: Washington, DC, USA, 2005. [Google Scholar]
  6. Abbas, A.; Waseem, M.; Ahmad, R.; Ahmed khan, K.; Zhao, C.Y.; Zhu, J.T. Sensitivity analysis of greenhouse gas emissions at farm level: Case study of grain and cash crops. Environ. Sci. Pollut. Res. 2022, 29, 82559–82573. [Google Scholar] [CrossRef]
  7. Abbas, A.; Zhao, C.Y.; Waseem, M.; Ahmed khan, K.; Ahmad, R. Analysis of energy input–output of farms and assessment of greenhouse gas emissions: A case study of Cotton Growers. Front. Environ. Sci. 2022, 9, 826838. [Google Scholar] [CrossRef]
  8. Elahi, E.; Khalid, Z.; Zhang, Z.X. Understanding farmers’ intention and willingness to install renewable energy technology: A solution to reduce the environmental emissions of agriculture. Appl. Energy 2022, 301, 118459. [Google Scholar] [CrossRef]
  9. Elahi, E.; Khalid, Z. Estimating smart energy inputs packages using hybrid optimisation technique to mitigate environmental emissions of commercial fish farms. Appl. Energy 2022, 326, 119602. [Google Scholar] [CrossRef]
  10. King, R.T. Wildlife and man. N. Y. Conserv. 1966, 20, 8–11. [Google Scholar]
  11. Helliwell, D.R. Valuation of wild life resources. Reg. Stud. 1969, 3, 41–47. [Google Scholar] [CrossRef]
  12. Zheng, H.; Li, Y.F.; Ouyang, Z.Y.; Luo, Y.C. Progress and perspectives of ecosystem services management. Acta Ecol. Sin. 2013, 33, 702–710. [Google Scholar] [CrossRef]
  13. Yan, Y.; Zhu, J.Y.; Wu, G.; Zhan, Y.J. Review and prospective applications of demand, supply, and consumption of ecosystem services. Acta Ecol. Sin. 2017, 37, 2489–2496. [Google Scholar] [CrossRef]
  14. Tolessa, T.; Senbeta, F.; Kidane, M. The impact of land-use/land cover change on ecosystem services in the central highlands of Ethiopia. Ecosyst. Serv. 2017, 23, 47–54. [Google Scholar] [CrossRef]
  15. Arowolo, A.O.; Deng, X.Z.; Olatunji, O.A.; Obayelu, A.E. Assessing changes in the value of ecosystem services in response to land-use/land-cover dynamics in Nigeria. Sci. Total Environ. 2018, 636, 597–609. [Google Scholar] [CrossRef] [PubMed]
  16. Peng, J.; Tian, L.; Zhang, Z.M.; Zhao, Y.; Green, S.M.; Quine, T.A.; Liu, H.Y.; Meersmans, J. Distinguishing the impacts of land-use and climate change on ecosystem services in a karst landscape in China. Ecosyst. Serv. 2020, 46, 101199. [Google Scholar] [CrossRef]
  17. Peng, K.F.; Jiang, W.G.; Ling, Z.Y.; Hou, P.; Deng, Y.W. Evaluating the potential impacts of land-use changes on ecosystem service value under multiple scenarios in support of SDG reporting: A case study of the Wuhan urban agglomeration. J. Clean. Prod. 2021, 307, 127321. [Google Scholar] [CrossRef]
  18. Sala, O.E.; Chapin, F.S.; Armesto, J.J.; Berlow, E.; Bloomfield, J.; Dirzo, R.; Huber-Sanwald, E.; Huenneke, L.F.; Jackson, R.B.; Kinzig, A.; et al. Global biodiversity scenarios for the year 2100. Science 2000, 287, 1770–1774. [Google Scholar] [CrossRef]
  19. Li, J.C.; Wang, W.L.; Hu, G.Y.; Wei, Z.H. Changes in ecosystem service values in Zoige Plateau, China. J. Agric. Ecosyst. Environ. 2010, 139, 766–770. [Google Scholar] [CrossRef]
  20. Sterling, S.M.; Ducharne, A.; Polcher, J. The impact of global land-cover change on the terrestrial water cycle. Nat. Clim. Change 2013, 3, 385–390. [Google Scholar] [CrossRef]
  21. Fu, B.J.; Zhang, L.W. Land-use change and ecosystem services: Concepts, methods and progress. Prog. Geogr. 2014, 33, 441–446. [Google Scholar] [CrossRef]
  22. Douglas, I. Ecosystems and Human Well-Being. Ref. Module Earth Syst. Environ. Sci. 2018, 4, 185–197. [Google Scholar] [CrossRef]
  23. Bren d’Amour, C.; Reitsma, F.; Baiocchi, G.; Barthel, S.; Güneralp, B.; Erb, K.H.; Haberl, H.; Creutzig, F.; Seto, K.C. Future urban land expansion and implications for global crop-lands. Proc. Natl. Acad. Sci. USA 2016, 114, 8939–8944. [Google Scholar] [CrossRef] [PubMed]
  24. Zhang, F.; Yushanjiang, A.; Jing, Y.Q. Assessing and predicting changes of the ecosystem service values based on land-use/cover change in Ebinur Lake Wetland National Nature Reserve, Xinjiang, China. Sci. Total Environ. 2019, 656, 1133–1144. [Google Scholar] [CrossRef]
  25. Hu, M.M.; Li, Z.T.; Wang, Y.F.; Jiao, M.Y.; Li, M.; Xia, B.C. Spatio-temporal changes in ecosystem service value in response to land use/cover changes in the Pearl River Delta. Resour. Conserv. Recycl. 2019, 149, 106–114. [Google Scholar] [CrossRef]
  26. Msofe, N.K.; Sheng, L.X.; Li, Z.X.; Lyimo, J. Impact of land-use/cover change on ecosystem service values in the Kilombero Valley Floodplain, Southeastern Tanzania. Forests 2020, 11, 109. [Google Scholar] [CrossRef]
  27. Rahman, M.M.; Szabó, G. Impact of land-use and land-cover changes on urban ecosystem service value in Dhaka, Bangladesh. Land 2021, 10, 793. [Google Scholar] [CrossRef]
  28. DeLoyde, C.N.M.; Mabee, W.E. Ecosystem service values as an ecological indicator for land management decisions: A case study in southern Ontario, Canada. Ecol. Indic. 2023, 151, 110344. [Google Scholar] [CrossRef]
  29. Narducci, J.; Quintas-Soriano, C.; Castro, A.; Som-Castellano, R.; Brandt, J.S. Implications of urban growth and farmland loss for ecosystem services in the western United States. Land Use Policy 2019, 86, 1–11. [Google Scholar] [CrossRef]
  30. Bai, Y.; Wong, C.P.; Jiang, B.; Hughes, A.C.; Wang, M.; Wang, Q. Developing China’s Ecological Redline Policy using ecosystem services assessments for land use planning. Nat. Commun. 2018, 9, 3034. [Google Scholar] [CrossRef]
  31. Yang, M.H.; Gao, X.D.; Siddique, K.H.M.; Wu, P.; Zhao, X.N. Spatiotemporal exploration of ecosystem service, urbanization, and their interactive coercing relationship in the Yellow River Basin over the past 40 years. Sci. Total Environ. 2023, 858, 159757. [Google Scholar] [CrossRef]
  32. Li, X.; Xu, H.B.; Ma, X.D.; Huang, Y. A two-step spatially explicit optimization approach of integrating ecosystem services (ES) into land use planning (LUP) to generate the optimally sustainable schemes. Land Degrad. Dev. 2023, 34, 2508–2522. [Google Scholar] [CrossRef]
  33. United Nations. System of Environmental Economic Accounting—Ecosystem Accounting. 2021. Available online: https://seea.un.org/introduction-to-ecosystem-accounting (accessed on 5 June 2023).
  34. Costanza, R.; d’Arge, R.; de Groot, R.; Farber, S.; Grasso, M.; Hannon, B.; Limburg, K.; Naeem, S.; O’Neill, R.V.; Paruelo, J. The value of the world’s ecosystem services and natural capital. Nature 1997, 87, 253–260. [Google Scholar] [CrossRef]
  35. Li, L.; Wang, X.Y.; Luo, L.; Ji, X.Y.; Zhao, Y.; Zhao, Y.C.; Nabil, B. A systematic review on the methods of ecosystem services value assessment. Chin. J. Ecol. 2018, 37, 1233–1245. [Google Scholar] [CrossRef]
  36. Xie, G.D.; Lu, C.X.; Len, Y.F.; Zheng, D.; Li, S.C. Ecological assets valuation of the Tibetan Plateau. J. Nat. Resour. 2003, 18, 189–196. [Google Scholar] [CrossRef]
  37. Xie, G.D.; Xiao, Y.; Zhen, L.; Lu, C.X. Study on ecosystem services value of food production in China. J. Eco-Agric. 2005, 13, 10–13. [Google Scholar]
  38. Xie, G.D.; Zhen, L.; Lu, C.X.; Xiao, Y.; Chen, C. Expert knowledge based valuation method of ecosystem services in China. J. Nat. Resour. 2008, 23, 911–919. [Google Scholar] [CrossRef]
  39. Xie, G.D.; Zhang, C.X.; Zhang, L.M.; Chen, W.H.; Li, S.M. Value of China’s ecosystem services. J. Nat. Resour. 2015, 30, 1243–1254. [Google Scholar] [CrossRef]
  40. Wang, Z.H. Study on Typical Terrestrial Ecosystem of Yunnan–Kweichow Plateau (I): Typical Forest, Shrub Community Pattern, Maintenance and Process; Beijing Sci. Press: Beijing, China, 2011; pp. 1–15. [Google Scholar]
  41. Ran, Y.J.; Lei, D.M.; Liu, L.; Gao, L.P. Impact of land-use change on ecosystem service value in urban agglomeration of central Yunnan Province during 2000–2020. Bull. Soil Water Conserv. 2021, 41, 310–322. [Google Scholar] [CrossRef]
  42. Zhang, Y.Y.; Sun, M.Y.; Yang, R.J.; Zhang, L. Impact of land-use change on ecosystem service value in Southwest China. J. Environ. Eng. Technol. 2022, 12, 207–214. [Google Scholar] [CrossRef]
  43. Zhang, C.Y.; Li, P.; Gong, N.B.; Zhao, C.G.; Xu, Y.T.; Meng, Y.X. Evaluation of ecosystem resilience in Yunnan–Kweichow Plateau, China. Bull. Soil Water Conserv. 2023, 37, 120–126. [Google Scholar] [CrossRef]
  44. Ding, Y.; Zhang, L.; Ma, X.L. Temporal and spatial evolution of coupling coordination of mountainous urbanization and its resource and environment carrying capacity. Res. Environ. Sci. 2022, 35, 592–600. [Google Scholar] [CrossRef]
  45. Yang, C.L.; Li, C.F.; Tian, Y.F.; Ma, Y.Q.; Zhu, Z.P. Insight into the construction of a comprehensive observation system of natural resource elements in Yunnan–Kweichow Plateau. Pratacultural Sci. 2022, 39, 2629–2644. [Google Scholar] [CrossRef]
  46. Li, Y.; Geng, H.C. Evolution of land use landscape patterns in karst watersheds of Guizhou plateau and its ecological security evaluation. Land 2022, 11, 2225. [Google Scholar] [CrossRef]
  47. Sun, L.; Yu, H.J.; Sun, M.X.; Wang, Y.T. Coupled impacts of climate and land use changes on regional ecosystem services. J. Environ. Manag. 2023, 326, 116753. [Google Scholar] [CrossRef] [PubMed]
  48. Xu, X.L.; Liu, J.Y.; Zhang, S.W.; Li, R.D.; Yan, C.Z.; Wu, S.X. China Multi Period Land-Use Remote Sensing Monitoring Dataset; Resource and Environmental Science Data Registration and Publishing System: Beijing, China, 2018. [Google Scholar] [CrossRef]
  49. Xu, X.L. Multi-Period Land-Use and Cover Change Remote Sensing Monitoring Dataset; Resource and Environmental Science Data Registration and Publishing System: Beijing, China, 2023. [Google Scholar] [CrossRef]
  50. Wang, X.L.; Bao, Y.H. Study on the methods of land-use dynamic change research. Prog. Geogr. 1999, 18, 81–87. [Google Scholar]
  51. Han, Z.; Song, W.; Deng, X. Responses of ecosystem service to land-use change in Qinghai province. Energies 2016, 9, 303. [Google Scholar] [CrossRef]
  52. Guo, P.F.; Zhang, F.F.; Wang, H.Y. The response of ecosystem service value to land use change in the middle and lower Yellow River: A case study of the Henan section. Ecol. Indic. 2022, 144, 109019. [Google Scholar] [CrossRef]
  53. Deng, S.H. Dynamic Effects on Ecosystem Services Value with Regional Land-Use Change. Ph.D. Thesis, Zhejiang University, Hangzhou, China, 2012. [Google Scholar]
  54. Qiu, H.H.; Hu, B.Q.; Zhang, Z. Study on ecosystem service value of Guangxi in the past 20 years based on land-use change. J. Environ. Eng. Technol. 2022, 12, 1455–1465. [Google Scholar] [CrossRef]
  55. Lin, X.J.; Xu, M.; Cao, C.X.; Singh, R.H.; Chen, W.; Ju, H.R. Land-use/land-cover changes and their influence on the ecosystem in Chengdu city, China during the period of 1992–2018. Sustainability 2018, 10, 3580. [Google Scholar] [CrossRef]
  56. Liu, Y.R.; Wang, C.; Yan, L.J. Impacts of land-use change on ecosystem services in the agricultural area of North China Plain: A case study of Shangqiu City, Henan Province, China. J. Chin. J. Appl. Ecol. 2018, 29, 1597–1606. [Google Scholar] [CrossRef]
  57. Qi, L.P.; Yan, D.D.; Li, J.T.; Yao, X.Y.; Xue, Y.Y.; Luan, Z.Q. Dynamics of ecosystem services value in response to land-use/land cover changes in Jiangsu Province. J. Beijing Norm. Univ. 2021, 57, 255–264. [Google Scholar] [CrossRef]
  58. Yang, W.J.; Liu, D.; Gong, Q.W. Estimation loss of agroecosystem service value in farmland conversion and its provincial difference in 2001–2016. Econ. Geogr. 2019, 39, 201–209. [Google Scholar] [CrossRef]
  59. Department of Natural Resources of Yunnan Province. Main Data Bulletin of the Third National land Survey in Yunnan Province. 2021. Available online: http://dnr.yn.gov.cn/html/2021/tongjixinxi_1222/32921.html (accessed on 5 June 2023).
  60. Department of Natural Resources of Kweichow Province. Main Data Bulletin of the Third National Land Survey in Kweichow Province. 2021. Available online: https://zrzy.Kweichow.gov.cn/wzgb/zwgk/zdlyxxgk/zrzy/dcjc/202201/t20220121_72378280.html (accessed on 5 June 2023).
  61. Hu, Z.Y.; Wang, S.J.; Bai, X.Y.; Luo, G.J.; Li, Q.; Wu, L.H.; Yang, Y.J.; Tian, S.Q.; Li, C.J.; Deng, Y.H. Changes in ecosystem service values in karst areas of China. Agric. Ecosyst. Environ. 2020, 301, 107026. [Google Scholar] [CrossRef]
  62. Bureau of Statistics of Yunnan Province. Yunnan Statistical Yearbook; China Statistics Press: Beijing, China, 2021.
  63. Bureau of Statistics of Kweichow Province. Kweichow Statistical Yearbook; China Statistics Press: Beijing, China, 2021.
  64. Yang, K.; Gong, H.D. The status of biodiversity conservation in Yunnan Province. J. West Chin. For. Sci. 2021, 50, 9–15. [Google Scholar] [CrossRef]
  65. Gao, R.D.; Zhang, J.W.; Wu, X.T. Design and study on resettlement planning for Wudongde Hydropower Station. J. Yangtze River. 2014, 45, 106–109. [Google Scholar] [CrossRef]
  66. Qin, X.Q.; Zhu, M.Q.; Jiang, Z.C. A Review on recent advances in rocky desertification southwest China karst region. Carsol. Sin. 2006, 25, 234–238. [Google Scholar]
  67. Jiang, Z.C.; Lou, W.Q.; Tong, L.Q.; Cheng, Y.; Yang, Q.Y.; Wu, Z.Y.; Liang, J.H. Evolution features of rocky desertification and influence factors in karst areas of southwest China in the 21st century. Carsol. Sin. 2016, 35, 461–468. [Google Scholar]
  68. Han, H.L.; Liu, Y.; Cai, G.P.; Bai, Y.M.; Ma, S.L.; Chen, S.Y.; Luo, R.Y. Characteristics of gradient change of the value of mountain ecosystem services with the rapid urbanization in urban area—A case study of guiyang. Res. Soil Water Conserv. 2020, 27, 295–303. [Google Scholar] [CrossRef]
  69. Luo, Q.Y.; Bao, Y.; Wang, Z.T.; Chen, X.T.; Wei, W.F.; Fang, Z.Y. Vulnerability assessment of urban remnant mountain ecosystems based on ecological sensitivity and ecosystem services. Ecol. Indic. 2023, 151, 110314. [Google Scholar] [CrossRef]
  70. Zhang, Y.; Zhao, L.; Liu, J.; Liu, Y.; Li, C. The impact of land cover change on ecosystem service values in urban agglomerations along the coast of the Bohai Rim, China. Sustainability 2015, 7, 10365–10387. [Google Scholar] [CrossRef]
  71. Andrés, V.; William, J.M.; Yang, H.; Xu, Z.; Liu, J. Effects of conservation policy on China’s forest recovery. Sci. Adv. 2016, 2, e1500965. [Google Scholar] [CrossRef]
  72. Frélichová, J.; Fanta, J. Ecosystem service availability in view of long-term land-use changes: A regional case study in the Czech Republic. Ecosyst. Health Sustain. 2016, 1, 11879005. [Google Scholar] [CrossRef]
  73. Zhang, M.Y.; Zhang, C.H.; Wang, K.L.; Yue, Y.M.; Qi, X.K.; Fan, F.D. Spatiotemporal variation of karst ecosystem service values and its correlation with environmental factors in Northwest Guangxi, China. Environ. Manag. 2011, 48, 933–944. [Google Scholar] [CrossRef] [PubMed]
  74. Lawler, J.J.; Lewis, D.J.; Nelson, E.; Plantinga, A.J.; Polasky, S.; Withey, J.C.; Helmers, D.P.; Martinuzzi, S.; Pennington, D.; Radeloff, V.C. Projected land-use change impacts on ecosystem services in the United States. Proc. Natl. Acad. Sci. USA 2014, 111, 7492–7497. [Google Scholar] [CrossRef] [PubMed]
  75. Fu, B.J.; Wang, S.; Liu, Y.; Liu, J.B.; Liang, W.; Miao, C.Y. Hydrogeomorphic ecosystem responses to natural and anthropogenic changes in the Loess Plateau of China. Annu. Rev. Earth Planet Sci. 2017, 45, 223–243. [Google Scholar] [CrossRef]
  76. Bryan, B.A.; Gao, L.; Ye, Y.Q.; Sun, X.F.; Connor, J.D.; Crossman, N.D.; Stafford-Smith, M.; Wu, J.G.; He, C.Y.; Yu, D.Y.; et al. China’s response to a national land-system sustainability emergency. Nature 2018, 559, 193–204. [Google Scholar] [CrossRef]
  77. Chen, W.; Zhao, H.; Li, J.; Zhu, L.; Wang, Z.; Zeng, J. Land-use transitions and the associated impacts on ecosystem services in the Middle Reaches of the Yangtze River Economic Belt in China based on the geo-informatic Tupu method. Sci. Total Environ. 2020, 701, 134690. [Google Scholar] [CrossRef]
  78. Chen, C.J.; Yuan, D.X.; Cheng, H.; Yu, T.L.; Shen, C.C.; Edwards, R.L.; Wu, Y.; Xiao, Y.S.; Zhang, J.; Wang, T.; et al. Human activity and climate change triggered the expansion of rocky desertification in the karst areas of Southwestern China. Sci. China Earth Sci. 2021, 64, 1761–1773. [Google Scholar] [CrossRef]
  79. Salzman, J.; Bennett, G.; Carroll, N.; Goldstein, A.; Jenkins, M. The global status and trends of payments for ecosystem services. Nat. Sustain. 2018, 1, 136–144. [Google Scholar] [CrossRef]
Figure 1. Location and elevation of the Yunnan–Kweichow Plateau.
Sustainability 16 01062 g001
Figure 2. Characteristics of land-use change in Yunnan–Kweichow Plateau from 1980 to 2020.
Sustainability 16 01062 g002
Figure 3. Spatial distribution of land use in Yunnan–Kweichow Plateau from 1980 to 2020.
Sustainability 16 01062 g003
Figure 4. Transformation of land use from 1980 to 1990, 1990 to 2000, 2000 to 2010, 2010 to 2020, and 1980 to 2020 in Yunnan–Kweichow Plateau (the left side represents the area transferred out of different land types, and the right side represents the area transferred into different land types).
Sustainability 16 01062 g004
Figure 5. The characteristics of ESV in Yunnan–Kweichow Plateau.
Sustainability 16 01062 g005
Figure 6. Spatial distribution characteristics of ESVs in Yunnan–Kweichow Plateau from 1980 to 2020.
Sustainability 16 01062 g006
Figure 7. The value flow of ecosystem services of Yunnan–Kweichow Plateau from 1980 to 2020.
Sustainability 16 01062 g007
Figure 8. Contribution of land transfer to increase and decrease in ESV.
Sustainability 16 01062 g008
Figure 9. Sensitivity index of ESV for different land-use types in Yunnan–Kweichow Plateau.
Sustainability 16 01062 g009
Figure 10. Changes in socio-economic conditions in Yunnan–Kweichow Plateau from 1980 to 2020 ((a)-population density; (b)-per capita GDP; (c)-road network density) [62,63].
Sustainability 16 01062 g010
Table 1. Ecosystem service equivalent value per unit area for the different land-use types in Yunnan–Kweichow Plateau.
Service TypeSub-TypeCLFSGSWBWLBUBL
Provisioning servicesFP0.70170.16030.14820.25400.32390.01030.0032
RMP0.15560.36830.21800.07300.31750.00000.0095
WS−0.82870.19050.12073.31791.6447−7.51000.0064
Regulating servicesGR0.56521.21130.76620.30161.2065−2.42000.0413
CR0.29533.62432.02570.89852.28600.00000.0318
EP0.08571.06200.66891.81292.2860−2.46000.1302
HR0.94932.37171.483834.725015.38610.00000.0762
Supporting servicesSR0.33021.47480.93350.29531.46690.02000.0476
MNC0.09840.11270.07200.02220.11430.00000.0032
BP0.10801.34300.84880.81284.99750.34000.0445
Cultural servicesAL0.04760.58900.37470.62873.00360.01000.0191
CL, FS, GS, WB, WL, BU, and BL refers to cultivated land, forestland, grassland, water bodies, wetland, built-up land, and bare land, respectively; FP, RMP, WS, GR, CR, EP, HR, SR, MNC, BP, and AL refers to food production, raw materials production, water supply, gas regulation, climate regulation, environmental purification, hydrological regulation, soil formation and retention, maintain nutrient cycling, biodiversity protection, and the aesthetic landscape, respectively.
Table 2. ESV coefficients of the equivalent biomes for the different land-use types in Yunnan–Kweichow Plateau (USD ha−1 yr−1).
Service TypeSub-TypeCLFSGSWBWLBUBL
Provisioning servicesFP163.4937.3634.5259.1875.462.400.00
RMP36.2585.8150.8017.0273.980.000.00
WS−193.0844.3928.11773.07383.21−1749.850.00
Regulating servicesGR131.68282.23178.5370.28281.12−563.874.66
CR68.80844.46471.98209.36532.640.000.00
EP19.97247.46155.85422.42532.64−573.1923.30
HR221.20552.62345.738091.003584.990.006.99
Supporting servicesSR76.94343.63217.5068.80341.784.664.66
MNC22.9326.2616.775.1826.630.000.00
BP25.15312.93197.77189.381164.4279.224.66
Cultural servicesAL11.10137.2387.29146.48699.832.332.33
Total584.432914.371784.8510,052.177696.70−2798.2946.60
CL, FS, GS, WB, WL, BU, and BL refers to cultivated land, forestland, grassland, water bodies, wetland, built-up land, and bare land, respectively; FP, RMP, WS, GR, CR, EP, HR, SR, MNC, BP, and AL refers to food production, raw materials production, water supply, gas regulation, climate regulation, environmental purification, hydrological regulation, soil formation and retention, maintain nutrient cycling, biodiversity protection, and the aesthetic landscape, respectively.
Table 3. Area of different land-use types of Yunnan–Kweichow Plateau from 1980 to 2020 (104 ha).
Land-Use 1980 1990 2000 2010 2020
CL1181.711185.601180.811172.651157.35
FS3129.263136.523115.913135.983127.90
GS1184.221191.751192.331175.931169.14
WB39.3330.6140.4141.3348.80
WL1.952.411.981.971.80
BU40.5923.1845.0048.6871.56
BL14.8020.5115.3815.2815.25
CL, FS, GS, WB, WL, BU, and BL refers to cultivated land, forestland, grassland, water bodies, wetland, built-up land, and bare land, respectively.
Table 4. The characteristics of ESVs at each stage in Yunnan–Kweichow Plateau.
Land Use1980 1990 2000 2010 2020 Ecological Contribution Rate/%
Million USD
CL6906.23 6929.00 6901.01 6853.29 6763.88 6.24
FS91,198.23 91,409.85 90,809.40 91,394.13 91,158.84 1.73
GS21,136.57 21,270.97 21,281.28 20,988.50 20,867.38 11.80
WB3953.04 3076.47 4062.32 4154.15 4905.72 41.74
WL149.87 185.35 152.33 152.01 138.36 0.50
BU−1135.82 −648.52 −1259.26 −1362.20 −2002.45 37.97
BL6.90 9.56 7.17 7.12 7.10 0.02
Total122,215.03 122,232.68 121,954.25 122,187.01 121,838.82 /
CL, FS, GS, WB, WL, BU, and BL refers to cultivated land, forestland, grassland, water bodies, wetland, built-up land, and bare land, respectively.
Table 5. The characteristics of individual ESVs in Yunnan–Kweichow Plateau (million USD).
Service TypeSub-Type19801990200020102020
Provisioning servicesFP3535.60 3542.06 3532.73 3521.84 3496.31
RMP3723.42 3733.75 3715.98 3722.06 3707.27
WS−958.58 −721.69 −1029.16 −1066.42 −1385.62
Regulating
services
GR12,306.87 12,439.56 12,258.52 12,254.99 12,075.68
CR32,920.40 33,004.14 32,847.83 32,936.11 32,840.09
EP9772.47 9869.72 9731.53 9736.71 9602.58
HR27,253.51 26,639.65 27,294.97 27,404.83 27,901.49
Supporting servicesSR14,274.14 14,313.50 14,246.33 14,274.09 14,225.42
MNC1293.95 1297.68 1291.66 1292.36 1285.93
BP12,561.57 12,575.48 12,541.58 12,574.46 12,562.14
Cultural servicesAL5531.68 5538.83 5522.28 5535.98 5527.52
FP, RMP, WS, GR, CR, EP, HR, SR, MNC, BP, and AL refers to food production, raw materials production, water supply, gas regulation, climate regulation, environmental purification, hydrological regulation, soil formation and retention, maintain nutrient cycling, biodiversity protection, and the aesthetic landscape, respectively.
Table 6. The proportion of area and ESV changes in Yunnan–Kweichow Plateau from 1980 to 2020.
ESV Level198019902000
Area (103 ha)ProportionArea (103 ha)ProportionArea (103 ha)Proportion
Low value2585.98 4.63%2305.56 4.13%2663.31 4.77%
Medium-high value13,467.06 24.10%13,584.16 24.31%13,648.13 24.42%
Medium value22,484.17 40.23%23,292.40 41.68%22,410.99 40.10%
Medium-high value17,166.10 30.71%16,500.84 29.53%16,981.87 30.38%
High value186.38 0.33%200.42 0.36%185.21 0.33%
ESV Level20102020Area of Change
Area (103 ha)ProportionArea (103 ha)Proportion1980–2020 (103 ha)
Low value2664.52 4.77%3135.30 5.61%549.32
Medium-low value13,403.74 23.98%13,601.68 24.34%134.63
Medium value22,397.07 40.07%21,420.85 38.33%−1063.31
Medium-high value17,240.25 30.85%17,537.68 31.38%371.58
High value183.76 0.33%193.73 0.35%7.35
Table 7. The characteristics of changes in ESVs for different land use types from 1980 to 2020 (million USD).
Sub-Service Type1980–2020 (ΔESV)
CLFSGSWBWLBUBLTotal
FP−39.82 −0.51 −5.21 5.61 −0.11 0.74 0.00 −39.29
RMP−8.83 −1.16 −7.66 1.61 −0.11 0.00 0.01 −16.14
WS47.03 −0.60 −4.24 73.27 −0.57 −541.93 0.01 −427.04
GR−32.08 −3.82 −26.93 6.66 −0.42 −174.63 0.04 −231.17
CR−16.76 −11.42 −71.18 19.84 −0.80 0.00 0.03 −80.28
EP−4.87 −3.35 −23.50 40.03 −0.80 −177.52 0.13 −169.86
HR−53.88 −7.47 −52.14 766.81 −5.36 0.00 0.08 648.04
SR−18.74 −4.65 −32.80 6.52 −0.51 1.44 0.05 −48.69
MNC−5.59 −0.36 −2.53 0.49 −0.04 0.00 0.00 −8.02
BP−6.13 −4.23 −29.83 17.95 −1.74 24.54 0.05 0.60
AL−2.70 −1.86 −13.17 13.88 −1.05 0.72 0.02 −4.15
CL, FS, GS, WB, WL, BU, and BL refers to cultivated land, forestland, grassland, water bodies, wetland, built-up land, and bare land, respectively; FP, RMP, WS, GR, CR, EP, HR, SR, MNC, BP, and AL refers to food production, raw materials production, water supply, gas regulation, climate regulation, environmental purification, hydrological regulation, soil formation and retention, maintain nutrient cycling, biodiversity protection, and the aesthetic landscape, respectively.
Disclaimer/Publisher’s Note: The statements, opinions and data contained in all publications are solely those of the individual author(s) and contributor(s) and not of MDPI and/or the editor(s). MDPI and/or the editor(s) disclaim responsibility for any injury to people or property resulting from any ideas, methods, instructions or products referred to in the content.

