1. Introduction
Sustainable development, as defined in the Brundtland Report, addresses the interconnected challenges of economics, society, and the environment, striving to meet present needs without compromising the future. Achieving this balance between economic growth, social equity, and environmental protection remains a pressing goal, with ongoing tensions between growth and ecological limits [
1]. To promote enduring prosperity, the circular economy model emphasizes resource-efficient strategies like reduce, reuse, and recycle, necessitating holistic metrics and integrated policies for a sustainable transition.
While development studies have seen a shift towards contextual middle-range theories, there is a continued need for broader theoretical frameworks. Classical political economists like Smith, Mill, and Marx introduced grand theories that encompass both middle-range theories and reveal overarching historical laws in human societies and development. These theories distinguish between transhistorical and historical development notions and underscore the importance of interdisciplinary approaches for comprehensive analyses. Recognizing the influence of both historical trends and societal structures on development, it is essential to strike a balance between theoretical generalization and historical specificity, drawing insights from history to inform development theories and policies. Incorporating these ideas into discussions of sustainable development enriches our understanding of how historical factors interplay with development dynamics, offering valuable insights for sustainable policymaking [
2].
To address the challenges of sustainable development, including its environmental aspects, it is crucial to consider the practical implications of these theoretical frameworks. The exponential rise in global urbanization and industrialization has fueled a significant surge in waste production. Projections suggest that by 2050, the annual trash generation could double, soaring from the current 2.01 billion tons to an alarming 3.4 billion tons [
3,
4]. This dramatic rise is attributed to the burgeoning global utilization of materials, expected to double again by 2060 [
4]. This alarming escalation poses profound threats to both human well-being and the environment [
4]. Particularly in densely populated urban centers, effective waste management has become an urgent priority [
5].
To address this pressing challenge, a paradigm shift toward a circular economic model has become imperative. The conventional “take–make–dispose” linear system must evolve into a “reduce, reuse, and recycle” closed-loop approach, known as the circular economy (CE) [
6]. The CE has gained prominence in recent European policy, but its roots stretch back to the 1970s, influenced by the field of industrial ecology. This vision has been actively pursued by the European Union (EU) since 2015, marked by the launch of the EU Circular Economy Action Plan and, subsequently, the 2020 Circular Economy Action Plan (CEAP) [
7]. These strategic initiatives align seamlessly with the 2019 European Green Deal, which aspires to reshape the EU into a resource-efficient, circular economy by 2050 [
7].
Yet, despite the concerted efforts of EU policies, the recycling landscape presents significant challenges. In 2020, secondary materials constituted less than 12% of all materials used, and the recycling rates for critical elements remained stubbornly low, hovering around 1%. However, there has been substantial growth within the circular economy sectors, characterized by private investments surging to EUR 121.6 billion in 2021, while employment in these sectors increased by 11%, encompassing 4.3 million jobs from 2015 to 2021 [
8].
Furthermore, despite the commendable 25% reduction in greenhouse gas emissions from production between 2008 and 2021, the EU concurrently witnessed a 4% escalation in its consumption footprint from 2010 to 2021 [
8]. These figures underscore the pressing need for a more pronounced and accelerated transition towards circularity in Europe, essential not only for environmental sustainability but also for economic resilience.
Achieving sustainable waste management is critical for sustainable development, as it reduces resource use, minimizes waste, and lowers environmental impacts. In this context, the EU’s circular economy monitoring framework emerges as a pivotal instrument, encompassing four key dimensions: production and consumption, waste management, secondary raw materials, and competitiveness and innovation. Notably, it delves into significant aspects, prominently focusing on recycling rates and circular material use rates. Recycling rates are meticulously determined by calculating the ratio of recycled materials to the total waste generated, providing a precise gauge of recycling effectiveness. On the other hand, circular material use rates gauge the extent to which recycled materials meet material demands, effectively reducing dependence on primary raw materials [
7].
Our research endeavors to bridge a significant gap in the existing knowledge base by focusing on the development of predictive models for the generation of municipal waste per capita (GMWp) across European nations. To achieve this, we plan to leverage circular economy indicators, such as recycling rates, and apply advanced machine learning techniques, including XGBoost and SHAP (SHapley Additive exPlanations). Our primary objective is to not only enhance the accuracy of our predictions but also to provide a deeper understanding of the factors influencing GMWp within the context of a circular economy.
The European Union’s Circular Economy Action Plan has established a formidable target—halving the amount of municipal solid waste (MSW) requiring recycling or preparation for re-use by 2030 [
4]. Achieving this ambitious objective necessitates precise quantitative estimates of MSW generation across member states, underscoring the importance of evidence-based, sustainable waste management policies and infrastructure development. Accurate forecasting of MSW generation rates, as envisioned in our study, can significantly bolster waste legislation, comprehensively evaluate environmental impacts, rigorously assess economic and social costs, and optimize integrated waste management systems [
9,
10,
11].
Reflecting on the importance of accurate MSW forecasting, studies by Oguz-Ekim [
9] and Abbasi et al. [
10,
11] have demonstrated the effective use of machine learning algorithms, including neural networks and support vector regression, in predicting the MSW generation. These methodologies are not only applicable in countries with robust data collection methods like the EU but also in regions with limited resources, highlighting the versatility of these approaches. The success of these algorithms in different countries underlines the potential of our research to contribute significantly to the field of waste management forecasting.
Our research aspires to develop predictive models of GMWp across European countries, harnessing the power of circular economy indicators alongside traditional predictors, such as GDP per capita and domestic material consumption per capita (DMCp). Additionally, we account for country-specific socio-economic disparities by incorporating the country as an input feature in our modeling. Through this amalgamation of circular economy metrics with data-driven forecasting employing XGBoost and SHAP methodologies, our work aspires to generate policy-relevant insights poised to drive progress towards the EU’s ambitious circular economy vision and sustainability targets.
The remainder of this paper is structured as follows:
Section 2 provides an in-depth analysis of prior research.
Section 3 covers the data sources used and outlines the machine learning methodology.
Section 4 presents the empirical results.
Section 5 summarizes the key findings and draws conclusions for the paper.
2. Literature Review
The transition to a circular economy requires a comprehensive understanding of sustainable strategies that promote economic growth while minimizing waste through efficient resource utilization. Our literature review identified recent studies that delve into the practical implementation of circular economy principles in specific sectors, such as textiles [
12] and construction [
13]. These studies emphasize the need for continuous leadership commitment, monitoring, and efforts to transform business models, ultimately minimizing sectoral environmental impacts through circular economy strategies.
In addition to sector-specific studies, we focused on the critical role of optimizing municipal waste management (MWM) systems in the transition to a circular economy. Recent advancements in machine learning (ML) techniques have become pivotal tools in enhancing MWM systems. One notable application is the use of ML to forecast municipal waste generation, providing valuable insights for waste management policy and planning.
Our literature review highlights a variety of methods and variables employed in forecasting MSW generation, as showcased in
Table 1 [
5,
9,
14,
15,
16,
17,
18,
19,
20]. Notably, Wu et al. (2020) demonstrated the significance of geographic differentiation in achieving accurate predictions through their regional approach in China [
14]. Magazzino et al. (2020) conducted a comparative analysis of multiple models, underscoring the importance of rigorous model evaluation [
15]. Abbasi et al. (2019) highlighted the effectiveness of the radial basis function in forecasting MSW generation in Iran. These findings shed light on the diversity of approaches and methodologies used in MSW forecasting [
16].
One key observation from Wu et al. (2020) [
14] is the substantial improvement in prediction accuracy when developing regional artificial neural network (ANN) models. This emphasizes the importance of recognizing variations in predictor variables across regions. Moreover, our literature review identified a departure from existing research by incorporating panel data. Recognizing the impact of country-specific policies and characteristics on GMWp is essential, and our methodology explicitly includes each country as a distinct feature to capture these nuances.
Furthermore, we have taken steps to enhance the generalizability of our model by training an XGBoost model using data from the 27 EU countries. This approach makes our model more versatile and capable of making predictions across different countries, addressing a significant limitation in the existing literature.
Regarding the limitation of randomly splitting data for model training and testing, we acknowledge this concern. In our proposed methodology, we have adopted a time series split, which provides a more realistic representation of model performance in practical settings by utilizing historical data for future event predictions.
The literature review has highlighted the increasingly vital role of machine learning in advancing municipal waste management within a circular economy context. We have emphasized significant advancements, including the use of region-specific ANN models, the incorporation of panel data, and the development of a flexible XGBoost model that leverages data from the EU-27 countries. This methodological approach not only solidifies the foundation of the research but also substantially contributes to the development of more efficient and accurate waste management strategies, in line with the principles of a circular economy.
3. Research Method and Data
In this study, we conducted an analysis of annual data spanning from 2010 to 2020 for the EU-27 region. We incorporated various input features, including the gross domestic product (GDP) per capita in euros, energy consumption (EC) in million tonnes of oil equivalent, municipal waste recycling rate (RMW), circular material use rate (CMR), domestic material consumption per capita (DMCp), and resource productivity (RP) in euros per kilogram. Our primary focus was on assessing the generation of municipal waste per capita (GMWp) in kilograms. The data used for this analysis were sourced from Eurostat for the year 2022.
The computational aspects of this study were executed on a system equipped with an Intel i7 10700 processor operating at 2.9 GHz, complemented by 32 GB of RAM (Intel Corporation, Santa Clara, CA, USA). Our analysis and modeling tasks were implemented using Python 3.10, utilizing the sklearn library, a versatile tool for machine learning and data analysis.
3.1. Decision of Input Parameters
In this study, we meticulously analyzed annual data spanning from 2010 to 2020 for the EU-27 region with the aim of predicting the municipal waste generation per capita (GMWp). The input features encompass a range of economic factors and circular economy (CE) indicators sourced from Eurostat 2022.
Our analysis was meticulously conducted using Python 3.10 in conjunction with XGBoost v2.0.3, a robust tool suited for handling diverse and complex data. By including the “Country” variable, we effectively accounted for national variations. The circular economy indicators selected for our study directly evaluate waste management, material circularity, and recycling:
- 1.
The recycling rate of municipal waste (RMW) serves as a metric for measuring waste management effectiveness and resource recovery, both central tenets of the circular economy. A higher RMW value signifies enhanced recovery and circularity.
- 2.
The circularity rate (CR) offers insights into industry dynamics, particularly in terms of reusing, remanufacturing, and recycling materials back into the economy. An increase in the CR signifies more efficient circular economy loops.
We anticipate an inverse relationship between these indicators and the GMWp, as heightened recycling and circularity typically lead to reduced waste disposal. The extent of this impact, however, hinges on factors such as waste composition and management systems.
Complementing our circular economy indicators are critical economic features, including GDP, DMCp (domestic material consumption per capita), and RP (resource productivity). These features holistically account for consumption patterns, material flows, and production efficiency—a trifecta of factors significantly influencing waste generation, as underscored by Oguz-Ekim’s seminal research [
9].
Furthermore, in a bid to augment the depth of our analysis, we integrated the variable “Energy Consumption (EC).” Drawing inspiration from Sung et al.’s pioneering work in 2020, we extend our analysis to encompass energy consumption patterns within the EU-27 region [
21]. This expansion is founded on the correlation observed in Taiwan, where energy consumption intricately relates to waste generation behaviors.
We also integrated insights from SHAP (SHapley Additive exPlanations) to shed light on the predictive power of various features and their relative impacts. This information informs the development of targeted waste policies within the framework of the circular economy.
3.2. Model Development by Extreme Gradient Boosting (XGBoost)
XGBoost originated from the decision tree method proposed by Chen and Guestrin (2016) [
22]; it can form a model of the non-linear relationship between GMWp and the input indicators. With the improvement in gradient boosting from Friedman (2002) [
23], it can show better performance. To begin with, XGBoost builds a set of Classification and Regression Trees (CART) as the base learners. The key feature and formulas in the XGBoost methodology are:
Iterative Tree Building and prediction accuracy: We iteratively build Classification and Regression Trees (CART), focusing on minimizing errors and refining predictions. The model’s predictive strength is showcased through the formula:
Here, represents the predicted output for each instance , and denotes the prediction of the m-th tree.
Objective function and regularization techniques: XGBoost’s objective function combines a loss function,
, and a regularization term,
:
This approach, including the regularization term
ensures high accuracy and robustness against overfitting. The regularization term,
, controls the complexity of the model, with hyperparameters
and
being tunable to suit specific data requirements.
In our study, we apply the XGBoost model, drawing from its demonstrated success in environmental forecasting as seen in referenced studies [
24,
25,
26]. XGBoost’s effectiveness in predicting municipal solid waste (MSW) generation was highlighted in Multan, Pakistan [
24], and Northern Ireland [
25], where it outperformed other models with higher R
2 values and lower RMSEs. Additionally, its application in air quality assessment, specifically in predicting PM2.5 concentrations in Tehran [
26], showcased its precision in environmental health scenarios. These examples underline XGBoost’s versatility and robustness in complex environmental data analysis, qualities we leveraged in our study for MSW generation forecasting.
Our study employs these principles and demonstrates XGBoost’s utility in environmental management and policy planning. The iterative enhancement of predictions using XGBoost allows us to effectively model the relationship between GMWp and various economic and environmental indicators, echoing the successful applications observed in the referenced studies.
3.3. Shapley Additive exPlanation (SHAP)
The Shapley additive explanation (SHAP) method, which was devised by Lundberg and Lee in 2017 [
27], has its roots in the principles of game theory and leverages the notion of Shapley values to enhance the interpretability of prediction models. Shapley values estimate the relative significance of each feature in a model through its mean marginal feature contribution. The computation of the Shapley value for a prediction model necessitates the calculation of the average marginal contribution of each feature to the model’s overall output. This is expressed in the following equation.
where
S is the set of all feature subsets, and
is the set of all features.
is the trained model, and
is the
i-th input variable’s contribution to the model [
28,
29].
3.4. Workflow of Developing ML Models
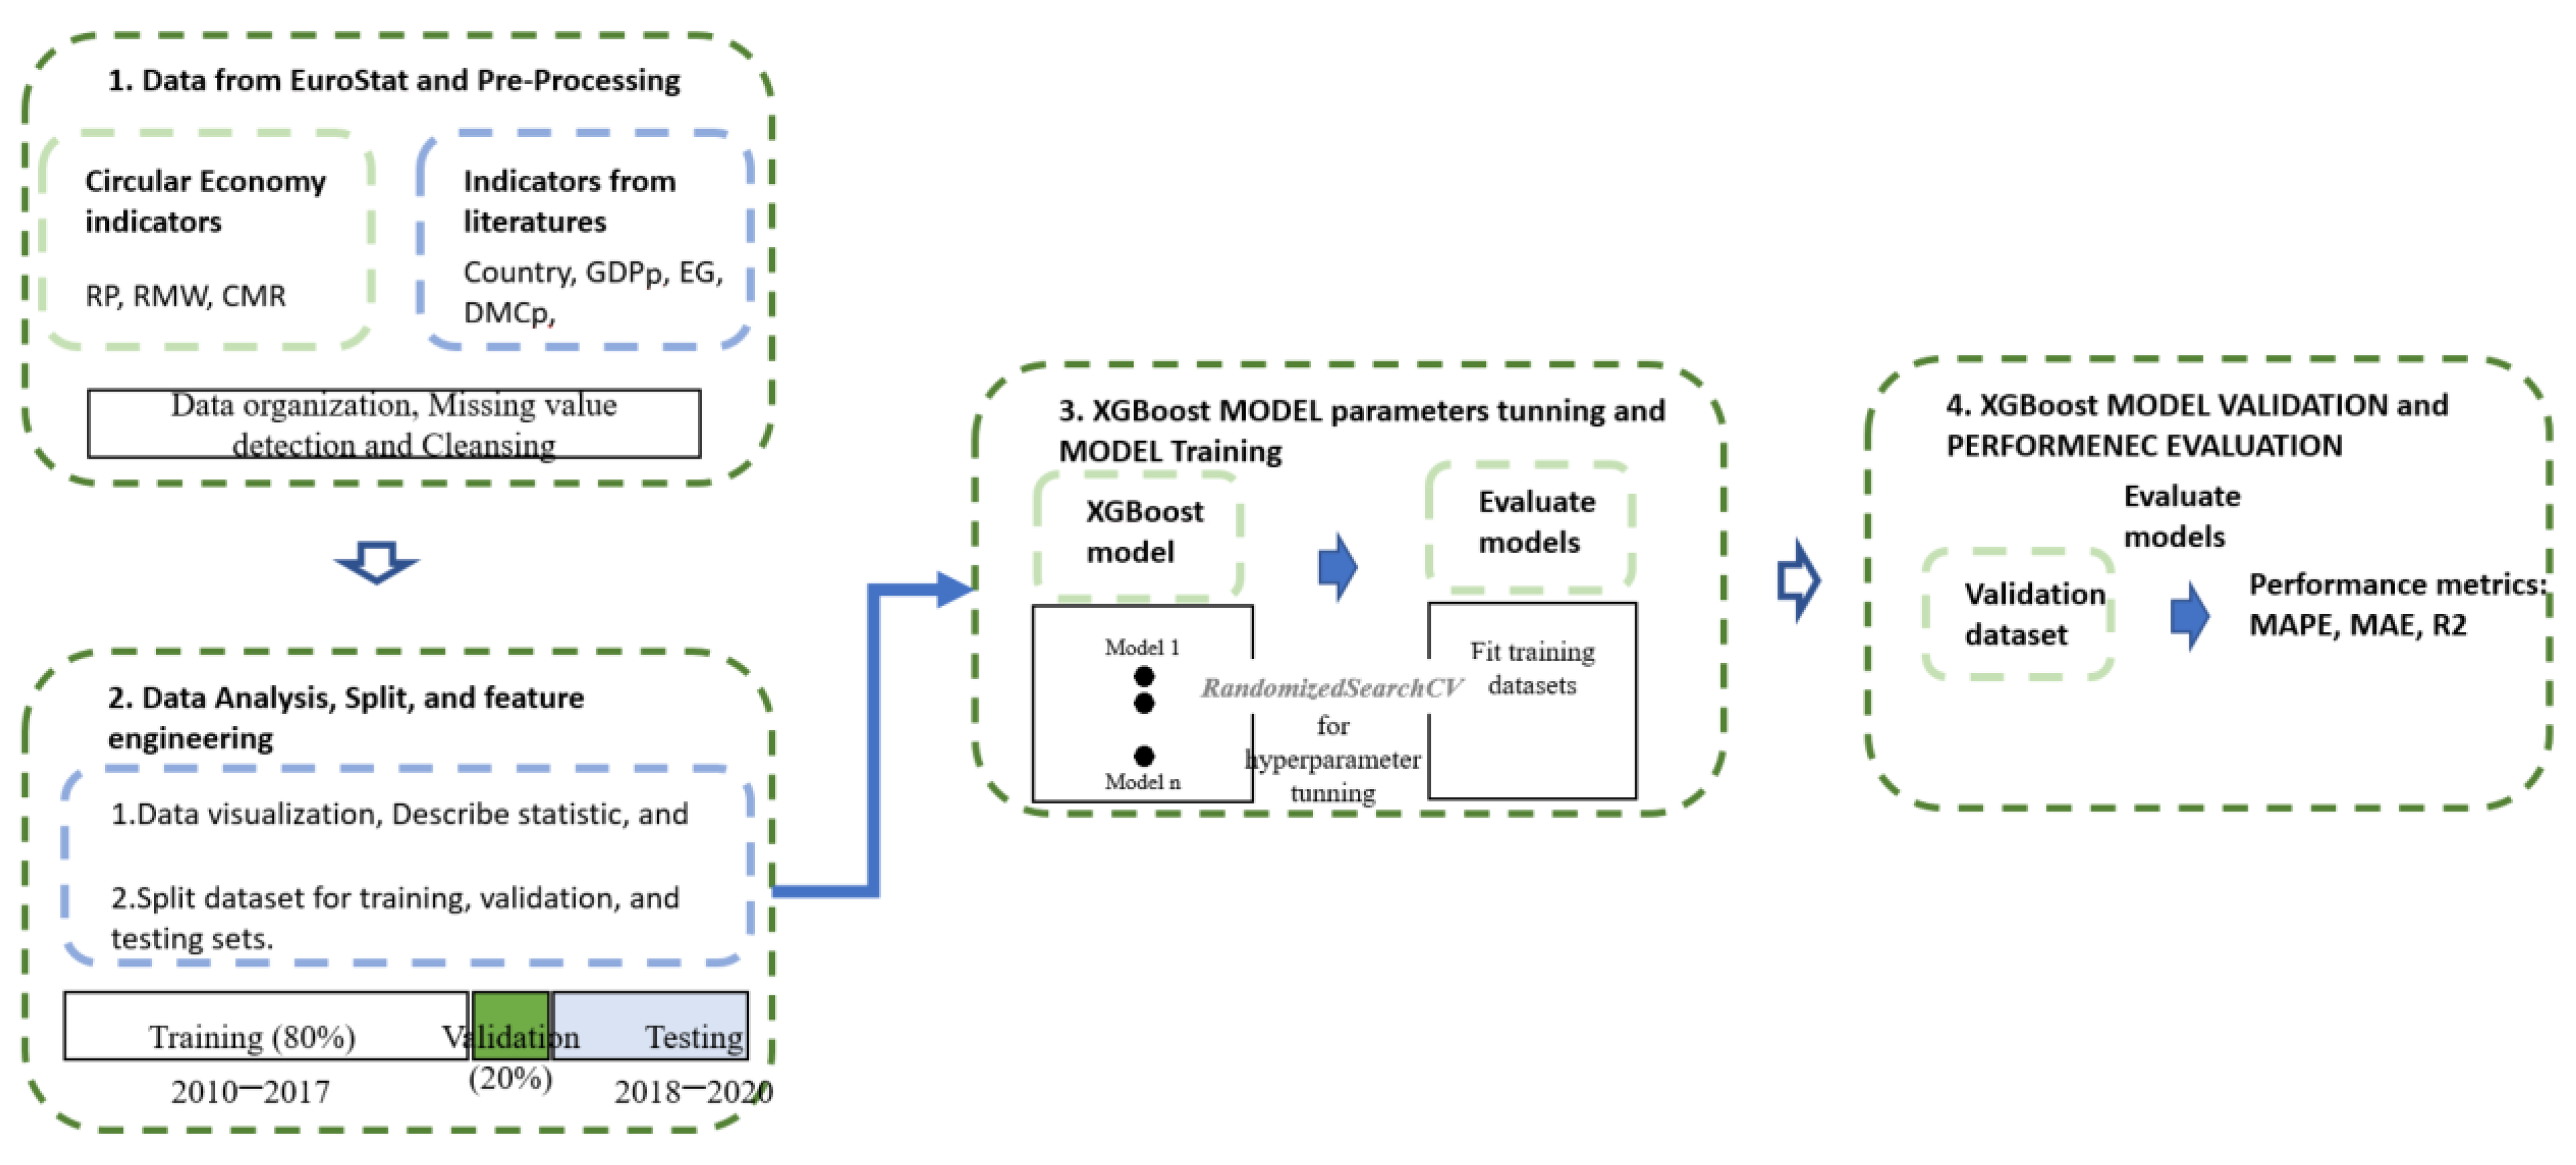
The flowchart (
Figure 1) showcases the empirical process. In the initial stage, data collection and preprocessing were carried out, which involved transforming the data into appropriate data structures, eliminating outliers and missing data, and scaling input features such as country, GDPp, EC, DMCp RP, RMW, and CMR. Throughout the project, the Python programming language was utilized, and scripts were created to automate the tasks of data loading, preprocessing, and integration, ensuring the consistency and reproducibility of the results.
After the data were preprocessed, the study conducted a descriptive statistical analysis and visualization of the data. The data were divided into training and validation sets, covering the time frame from 2010 to 2017, using the commonly used 80:20 ratio split, as stated by Azadi and Karimi-Jashni (2016) [
30]. To optimize the XGBoost model’s parameters, the Random Search Hyper-Parameter Optimization method was applied, as recommended by Bergstra and Bengio (2012) [
31]. The predictive performance of the model was evaluated using three metric,: the mean-squared error (MSE), the mean absolute percentage error (MAPE), and the coefficient of determination (
R2), which were calculated using Equations (5)–(7), respectively, as described by Hastie et al. (2009) [
32].
The number of observations is represented by “n”. The value predicted by the model is represented by , while the observed value is represented by . is the mean value of the GMWp. The mean-squared error (MSE) was expressed as a percentage value by computing its square root, which is the root-mean-squared error (RMSE), and normalizing it with the mean of the observations (). Both the training and validation (2010–2017) datasets were used to calculate the MSE, MAPE, and R2, comparing training and testing performance. Generally, the training error is lower than the test error as the model parameters and structure are adjusted to fit the training dataset.
Following the hyper-parameter optimization using a random search, the XGBoost model was configured with the set hyper-parameters. The learning curves for both the training and test datasets were then plotted, showcasing the relationship between the model’s predictive performance and the size of the training sample. The examination of learning curves can reveal problems with the learning process, like underfitting or overfitting, and assess the suitability of the training and validation datasets. Typically, the model performance on the training dataset is superior or exhibits a lower loss than on the validation dataset. Upon observing a stable convergence of the learning curves for both training and validation, the final model can be employed for prediction purposes.
4. Discussion
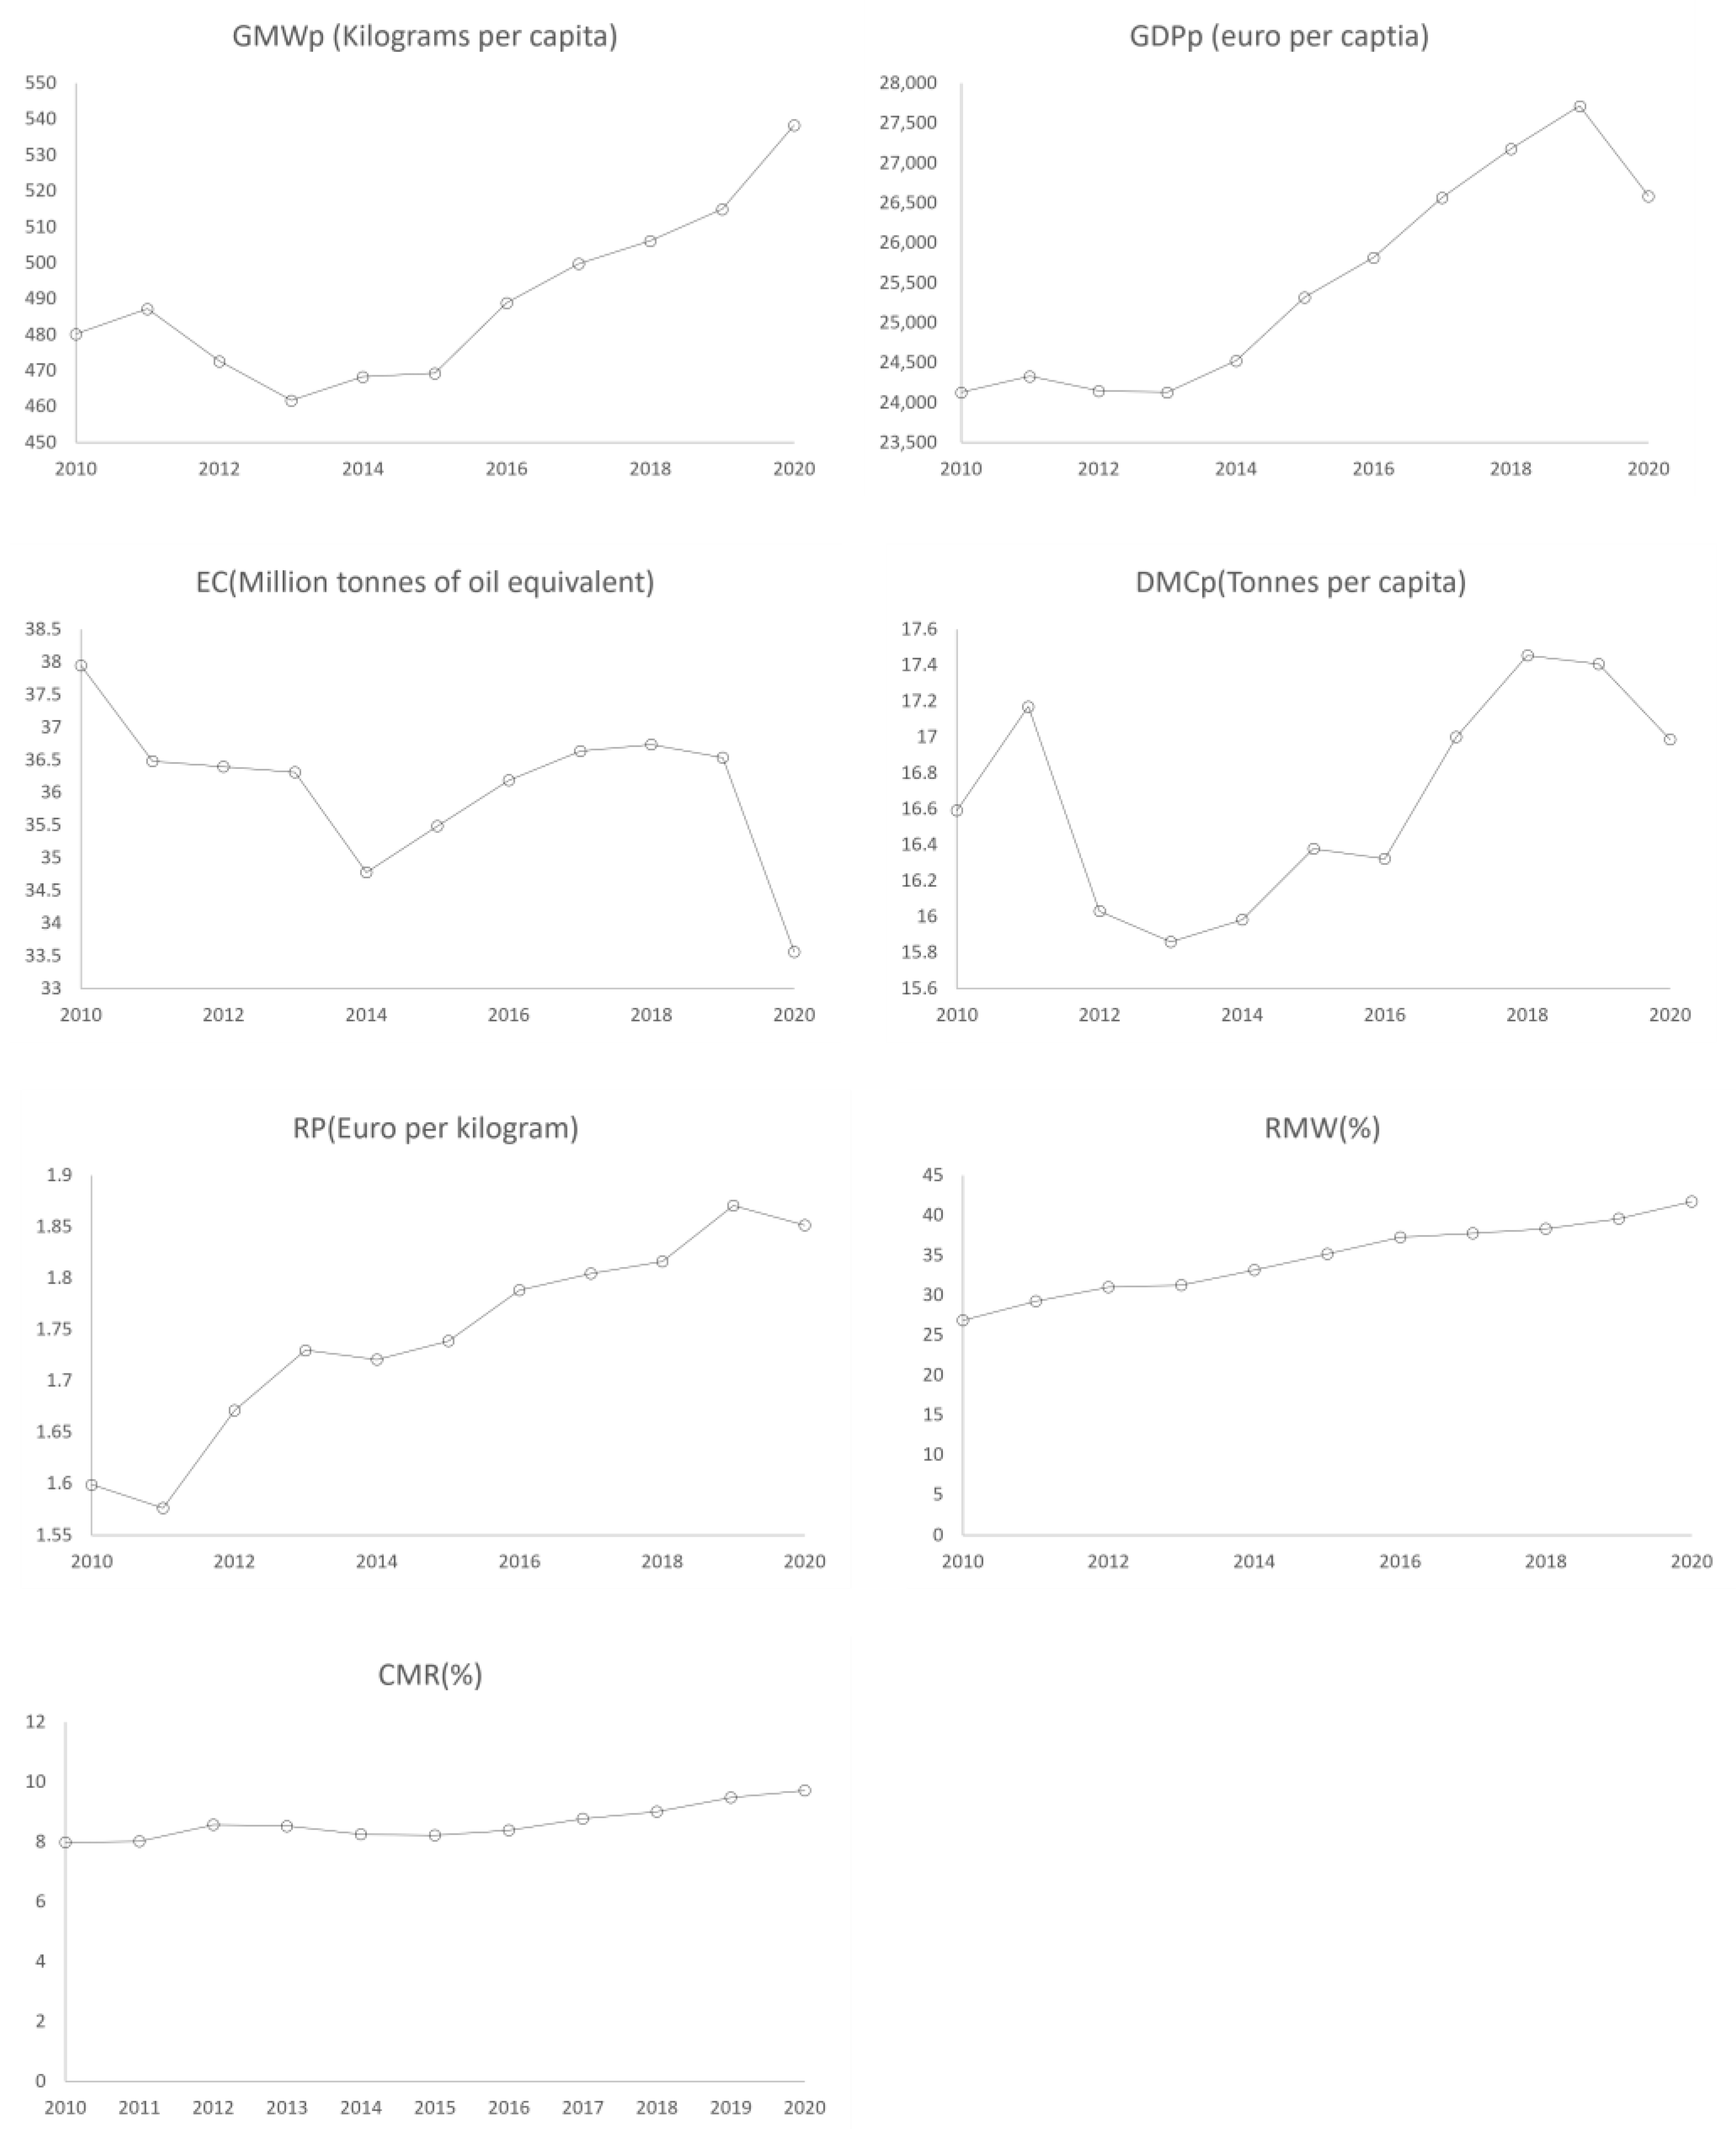
The analysis of the 10-year Compound Annual Growth Rate (CAGR) reveals several noteworthy trends in the European Union’s economic and environmental landscape (
Table 2). Notably, GDP per capita (GDPp), resource productivity (RP), and material consumption per capita (DMCp) exhibited an increasing CAGR, signifying growth in these areas during the analyzed period. Conversely, the declining CAGR of energy consumption (EC) indicates a concerted effort within the European Union to prioritize environmental sustainability without compromising economic progress.
The CAGR trends for the circular economy indicators (
Figure 2), specifically the recycling rate (RMW) and circular material use rate (CMR), also demonstrate positive trajectories. However, to fully transition to a circular economic model, further advancements through research and development investments and tax incentives are required.
It is noteworthy that GMWp experienced a decline between 2010 and 2015, followed by a subsequent rebound with an upward trend from 2016 to 2020. A similar pattern is observed for DMCp, suggesting a potential impact of the 2015 EU Circular Economy Act on reversing the upward trajectory of GMWp during this period.
The identified trends are in alignment with the summary statistics, with GDP per capita, DMCp, and EC showing decreases in 2019–2020, potentially due to the impacts of the COVID-19 pandemic. Overall, the CAGR analysis provides indicative insights into the complex relationships between economic activities, resource utilization, and waste generation within the European Union. The findings underscore the importance of a tighter integration of circular economy strategies to sever the linkages between economic growth and the rising generation of waste, fostering a more sustainable and resilient future.
4.1. XGB Forecasting Result
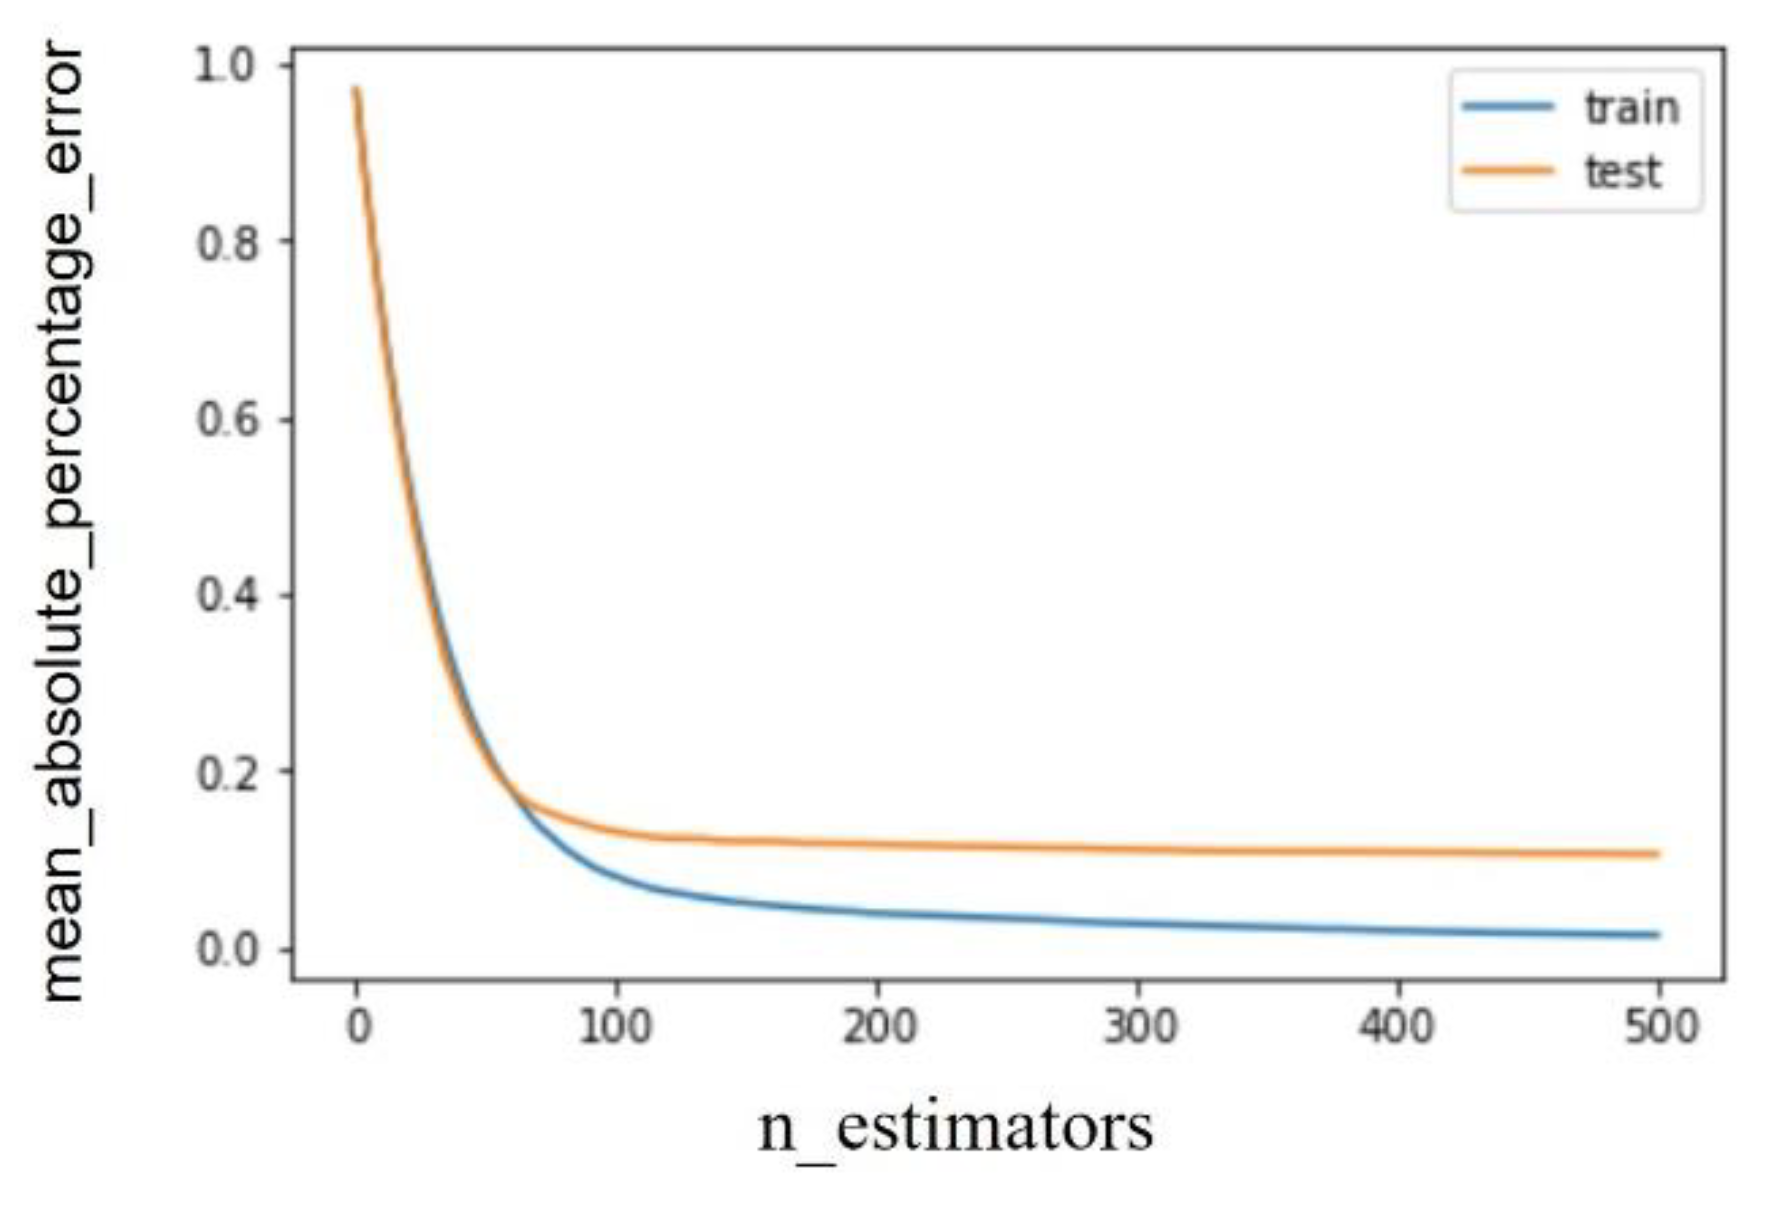
The XGBoost model was optimized for precision in predicting GMWp, with a focus on minimizing the MAPE during hyperparameter tuning. The dataset, covering the period from 2010 to 2020, was divided into training/validation (2010–2017) and test (2018–2020) sets, following an 80:20 ratio.
As illustrated in
Figure 3, the model demonstrated a robust learning capability, as evidenced by the convergence of the training and validation losses with increasing iterations, ensuring optimal fitting without overfitting. This convergence indicates the model’s efficacy in capturing the trends within the training data, laying a solid foundation for reliable predictions.
The performance metrics, detailed in
Table 3, show the model’s high predictive accuracy on the training and validation sets, with R
2 values of 99.761% and 99.809%, respectively. The MAE and RMSE were recorded as 4.403 and 5.733 for the training set and 3.523 and 5.541 for the validation set, respectively.
On the test set, the model achieved an R
2 of 75.271% with an MAE of 32.885 and an RMSE of 58.429, indicating effective real-world applicability.
Figure 4 presents a comparative visualization between the actual data and model predictions, showcasing the model’s capability to track both upward and downward trends in GMWp, albeit with slightly reduced precision compared to the training data.
4.2. Model Interpretability
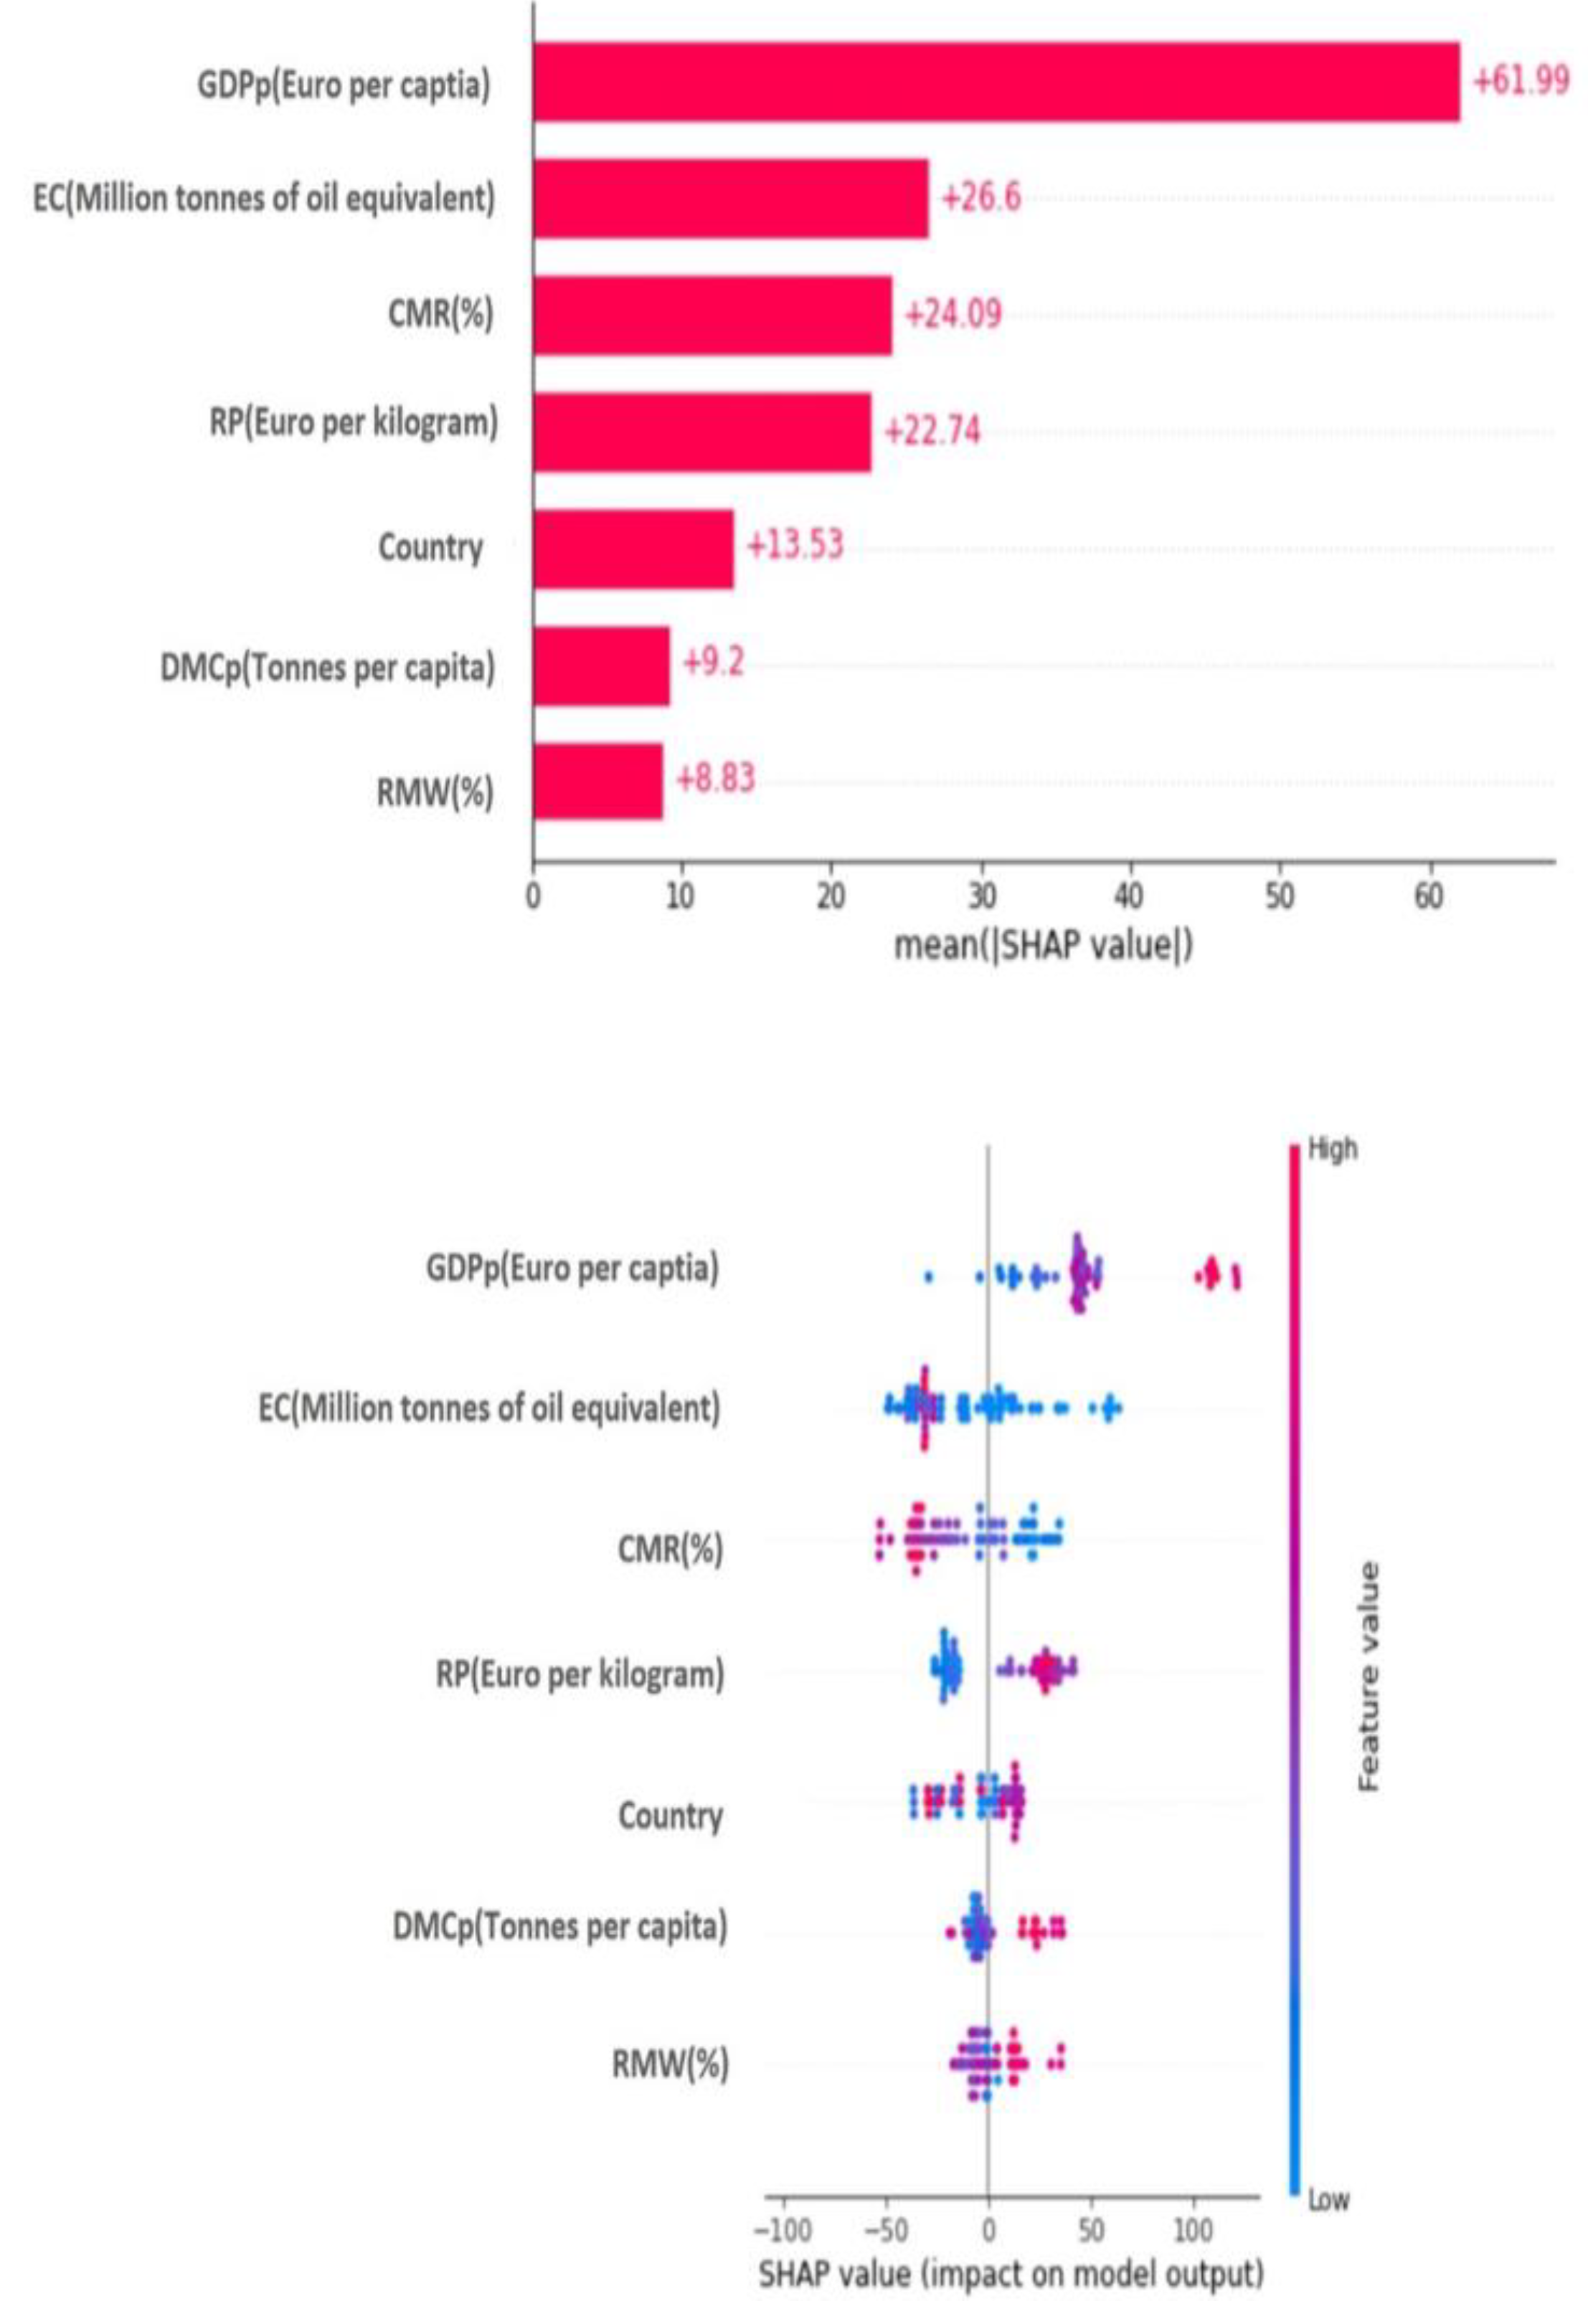
The analysis of feature importance within the XGBoost model was conducted through an examination of each feature’s frequency in splitting nodes across the constructed trees. This process, depicted in
Figure 5, provides a hierarchical ranking of feature importance. Complementing this, the SHAP method was employed to dissect individual feature contributions to the model’s output. A comparison of the results from both XGBoost and SHAP reveals a consistent ranking in the relative significance of the features.
GDPp emerged as the most influential predictor, followed by EC, CMR, and RP, which held intermediate importance, while factors such as the country variable, DMCp, and RMW were less influential.
The SHAP analysis, particularly the graphical representation in the left section of
Figure 5, uses blue and red color coding to denote lower and higher feature values, respectively. This representation illuminates the impact of each variable on GMWp. Notably, higher GDPp values correlate with an increased GMWp, highlighting the waste-intensive nature of economic growth. In contrast, lower values of EC significantly curb GMWp, emphasizing the interplay between economic activity and environmental impact.
This study’s in-depth exploration of MSW generation forecasting in the EU, using a machine-learning-based XGBoost model, marks a substantial advancement in waste management strategy and operational efficiency. The model’s commendable R2 values of 99% for in-sample data and 75% for out-of-sample data reflect its substantial predictive strength. The incorporation of SHAP values enables a nuanced understanding of the influential factors, particularly the preeminence of CMR, GDPp, and EC in shaping GMWp forecasts.
The observed relationship between economic growth and waste generation underscores the need for integrated strategies that foster sustainable growth alongside waste reduction. Additionally, the impact of energy consumption on waste generation highlights the potential of energy efficiency and renewable energy adoption as pathways to waste mitigation. The study also reveals the effectiveness of circular economy strategies, particularly CMR, in reducing waste, advocating for a paradigm shift towards material recycling and reuse, supported by a comprehensive approach to waste management and reduction.
5. Conclusions
Our comprehensive analysis spanning
Section 4 offered pivotal insights into the dynamics of municipal solid waste generation within the European Union.
Section 4′s examination of the 10-year CAGR unveiled significant trends in economic indicators and environmental sustainability efforts, particularly highlighting the interconnectedness of GDP, resource productivity, material consumption, and waste generation. The XGBoost forecasting model in
Section 4.1 provided a robust predictive framework, revealing the intricate relationships between economic growth, energy consumption, and waste production. In
Section 4.2, the interpretability analysis using SHAP values emphasized the paramount role of circular economy metrics, energy consumption, and economic indicators in shaping waste generation patterns. These findings collectively form the basis for the following strategic implications, theoretical contributions, and acknowledgments of the study’s limitations.
5.1. Strategic Implications for Policy
- 1.
Economic indicators and waste generation: Reflecting on the CAGR trends and the XGBoost model’s results (
Section 4), there is a clear indication that economic growth correlates with waste generation. This necessitates policies aimed at decoupling these two factors, such as implementing waste reduction regulations and incentivizing sustainable practices.
- 2.
Circular economy as a key strategy: the positive trajectory of circular economy indicators like the recycling rate and circular material use rate, coupled with their identified impact in the model interpretability (
Section 4.2), underscores the need for policies that promote circular economy practices, including material recycling and reuse.
- 3.
Energy efficiency and renewable energy: The decline in energy consumption and its significant influence on waste generation, as revealed in our analysis (
Section 4), advocate for policies that support energy efficiency and renewable energy adoption. This approach can indirectly contribute to waste reduction.
- 4.
Holistic waste management: in light of the model’s findings (
Section 4.2), while recycling is crucial, it should be integrated into a broader waste management strategy, encompassing enhanced recycling infrastructure and comprehensive waste management practices.
5.2. Theoretical Implications
Enhancing circular economy metrics: our study, by incorporating circular economy metrics in waste generation forecasting, not only improves predictive accuracy but also deepens the understanding of the relationship between circular economy practices and waste dynamics.
Advancing waste management forecasting: utilizing advanced machine learning techniques, our research enriches the theoretical framework for waste management, showcasing the effectiveness of data-driven approaches in forecasting GMWp.
Interdisciplinary relevance: this research bridges environmental economics, waste management, and data science, offering insights into the interplay between economic and consumption patterns and waste production.
5.3. Limitations of This Study
Data collection challenges: our reliance on Eurostat data, while comprehensive, may not fully capture the granular aspects of MSW generation across different EU regions.
Modeling constraints: the XGBoost and SHAP models, despite their predictive power, may not account for unforeseen future shifts in waste generation patterns.
Temporal scope: the study covers data from 2010 to 2020, which might not fully reflect longer-term trends and cyclical patterns in waste generation.


