Article

Spatial and Temporal Deposition Rate of Beach Litter in Cadiz Bay (Southwest Spain)

by
Elisabetta Ciufegni
1,
Giorgio Anfuso
1,*,
Julia Cristina Gutiérrez Romero
1,
Francisco Asensio-Montesinos
1,
Christian Rodríguez Castle
1,
Carlos J. González
2 and
Oscar Álvarez
3
1
Departamento de Ciencias de la Tierra, Facultad de Ciencias del Mar y Ambientales, Campus Río San Pedro s/n, Universidad de Cádiz, Puerto Real, 11510 Cádiz, Spain
2
Division of Naval Support, Marine Hydrographic Institute, Plaza San Severiano 3, 11007 Cadiz, Spain
3
Departamento de Física Aplicada, Facultad de Ciencias del Mar y Ambientales, Campus Río San Pedro s/n, Universidad de Cádiz, Puerto Real, 11510 Cádiz, Spain
*
Author to whom correspondence should be addressed.
Sustainability 2024, 16(3), 1010; https://doi.org/10.3390/su16031010
Submission received: 30 November 2023 / Revised: 10 January 2024 / Accepted: 22 January 2024 / Published: 24 January 2024

Abstract

:
This study explores the spatial and temporal distribution of beach litter accumulation rates at seven sites in Cadiz Bay, Southwest Spain, during October 2022 (i.e., autumn) and March 2023 (i.e., spring). Beach litter was collected during low tide conditions at the strandline during two series of 10 consecutive daily surveys. The main aim of this paper is to comprehensively analyze the influence of seasonality and hydrodynamic and wind patterns on litter abundance and composition. In October, 4199 items (22.58 kg) were recorded, increasing to 4634 items (22.68 kg) in March. Overall, the average litter abundance remained relatively consistent but notable variations were observed at different beach locations. Plastic litter was the most abundant in the total litter amount with 71.13% and 88.39% in October and March, respectively. Litter categories increased from 90 to 107 from October to March and the top 10 litter categories included cigarette butts (1746 in autumn and 514 in spring), plastic fragments (985 and 339) and plastic packaging (297 and 211). Statistical analyses showed no significant seasonal impact on litter quantities but confirmed seasonal variations in litter types. For instance, cigarette butts were more abundant in October, i.e., in autumn, as they are linked to the intensive use of beaches during the summer period (June–September), while wet wipes were prevalent in March, i.e., in spring, because they are associated with an increase in wastewater and river discharges recorded during the late autumn and winter months (November–February). No clear correlations were found between litter quantity and wave height, but specific patterns emerged at exposed and sheltered beaches. The findings provide valuable insights for optimizing coastal clean-up efforts with customized strategies. Further investigations are needed to fully understand the relationships between litter and environmental factors.

1. Introduction

Marine litter is any persistent, manufactured, or processed solid waste material discarded or abandoned in marine and/or coastal environments [1] and is now ubiquitous in all the oceans and beaches around the world [2,3,4,5]. Litter is associated with land-based sources (ca. 80%), i.e., it is transported into the marine environments from the land through rivers, sewage, runoff, wind, etc. [6,7], or it is abandoned on the beach by visitors, especially in summer [3,8], and marine-based sources (ca. 20%), i.e., off-shore gas/oil extraction activities, fishing and shipping activities, etc. [9,10]. When litter enters oceans and seas, it is transported by marine currents, winds and waves and is able to arrive at remote places and islands [11] and even on very deep ocean floors [7,12,13]. Most marine litter (70%) is deposited on marine ocean floors, and the rest is equally distributed between the beach environment and the water column (i.e., 15% each [2]). Litter negatively affects the quality of marine environments, constituting a risk for wildlife because of ingestion of litter items by sea birds, mammals, reptiles, fish, etc. [14,15,16], the entanglement of wildlife in abandoned/lost fishing gear and lines [17] and transport of alien species [18,19] and contaminants, e.g., POPs (persistent organic pollutants) and heavy metals [20]. Litter has also economic impacts on fishing activities [21] and tourism [22], e.g., “no litter” is one of the Big Five criteria that beach visitors take into account when choosing a tourist destination [23] and litter is potentially dangerous to beach visitors, e.g., because of cuts and injuries and the biological risk linked to medical and sanitary waste [24].
Beach litter is essentially (ca. 80%) composed of plastics [18,25,26] that, during recent decades, have been accumulating in marine environments because of their great use, discharge rates, durability and low rates of recovery [27]. Regarding beach litter monitoring programs, Botero et al. [28] highlighted that most beach litter studies are based on single or seasonal surveys and very little attention has been devoted to quantifying the short-term dynamics of beach litter [29] that has been assessed by daily litter collection campaigns [30,31], the use of images obtained by webcams [32] and litter mark-recapture/tagging [29,33].
This paper deals with beach litter abundance at seven different beach sectors of the Cadiz Bay coastal area along the Atlantic side of Andalusia, SW Spain. Beach litter has relevant implications in Andalusia since its coast represents an attractive “Sun, Sea and Sand” tourist destination visited by a total of 23 million national and international tourists during 2022. Malaga and Cadiz were the most visited provinces in Andalusia, with the latter recording 5.4 million in 2022 and 2.4 million visitors in the first semester of 2023 [34]. Despite most existing beach litter papers [28] and previous studies in Cadiz province, such as those of Williams et al. [35] and Asensio-Montesinos et al. [36], focusing on single and isolated samples, this paper introduces an innovative approach—a daily monitoring program conducted over 10 consecutive days at seven beach sectors during two study periods: mid-autumn (20th–29th October 2022) and early spring (15th–24th March 2023), hereafter autumn and spring. Therefore, this research aims to record daily variations in the abundance, typology and accumulation rates of “fresh” beach litter [3,33] and to compare such data with wave and wind characteristics and the location and exposure of beach sectors. The term fresh beach litter is defined as litter that has recently arrived or appeared on the beach and has been used by authors such as Williams and Tudor [29] and Asensio-Montesinos et al. [33] to monitor litter items.
The methodology used in this work can be applied to other areas where basic information on the utilized parameters is available and the results obtained can be used to optimize present and expensive clean-up operations and to promote sound management actions to reduce beach litter pollution.

2. Study Area

The province of Cadiz faces the Atlantic Ocean and administratively belongs to the Andalusia region (Southwest Spain, Figure 1). It is a densely populated tourist area with ca. 1.2 million inhabitants and 8 million stay-night visitors recorded in 2022; 80% of them are located within 30 km of the shoreline [37], highlighting the local economic relevance of beach tourism linked to coastal attractiveness and good weather conditions recorded during most of the year [38].
The coastline, which is a mesotidal environment (tidal range between 2 and 4 m), shows a NW–SE orientation and is exposed to both westerly and easterly winds. Atlantic low-pressure systems, approaching from western directions, are responsible for most relevant rainy events, marine storms and both sea and swell waves with significant associated height values that are usually lower than 1 m [39]. E to SE winds, originally formed in the Mediterranean Sea and channeled through the Gibraltar Strait, give rise to small sea waves because of the limited fetch. Due to the interaction between approaching wavefronts and the coastline, the prevailing littoral drift flows southeastward. A secondary and limited opposite drift is also occasionally recorded [40] (Figure 2).
The Guadalete River, which is 172 km in length, flows directly into the investigated coastal area, and the San Pedro tidal creek is observed at the southern end of Valdelagrana spit (Figure 1).
The seven coastal sectors investigated, belonging to El Puerto de Santa Maria municipality, presented different lengths (Table 1) and included both exposed and sheltered beaches that showed different orientations, morphological beach states and natural and geological constraints such as the presence of rocky shores, a port (Puerto Sherry), two long jetties and several short groins (Figure 1). Concerning morphological and sedimentological characteristics, the investigated coastal sectors are characterized by fine to medium quartz-rich sediments that give rise to dissipative or intermediate morphodynamic beach states [35,41,42]. All sites belonged to the “urban beach” typology according to Williams and Micallef [23] terminology. Daily beach cleaning operations are manually carried out early in the morning by local authorities from March to October and mechanical clean-up operations are conducted during the April–September period [35].

3. Materials and Methods

3.1. Wave and Wind Data

Wave and wind data during the study period were obtained from the “Puertos del Estado” website [43] and used to analyze the wave climate (significant wave height, peak wave period, and direction) and wind properties (wind speed and direction) during the high tide previous to each sampling data. To compute the relative average wind direction, the statistical method known as the “resultant vector average wind direction” [44] was applied, using R Studio as the analytical tool (https://www.r-project.org/, accessed 15 October 2023).
Detailed fields of wave heights and propagation directions were computed by means of numerical simulations with the Simulating Waves Nearshore (SWAN) wave propagation model [45], forced by different, representative offshore wave conditions. High-resolution topo-bathymetric and tidal conditions were provided by the previous simulations of a 2-D hydrodynamic model [46] within a calculation grid with a spatial horizontal resolution of 40 m, covering the entire Cadiz Bay and related marshes and creeks (E −6°23′35.1″ to −6°8′47.0″; N 36°20′39.0″ to 36°37′56.5″), determined based upon the Spanish Marine Hydrographic Institute (IHM) nautical charts 443A and 443B and direct topo-bathymetric measurements of the intertidal areas [47].

3.2. Sampling Method

The data used in this study were collected through two series of 10 surveys carried out from 20 October to 29 October 2022 (first campaign, autumn) and from 15 March to 24 March 2023 (second campaign, spring) at 7 different beaches in the El Puerto de Santa Maria municipality. Dates were strategically chosen to minimize the influence of beachgoers on the beach litter amount, i.e., were conducted not in correspondence with the tourist season. During weekdays, the beach cleaning company, which is responsible for beach clean-up operations along the coast of the El Puerto de Santa Maria municipality, conducted litter collection during the morning low tide of working days, while the authors of the study conducted sampling at the weekends.
The aim of this study is focused on the determination of beach litter daily deposition rates due to forcing agents. For this reason, sampling was performed during low tide in the strandline, covering a variable length (Table 1) and a consistent width of 5 m. This specific area was chosen due to its propensity for accumulating the most abundant quantity of stranded beach litter [35]. Furthermore, to distinguish fresh litter from items abandoned by beach users, an accurate visual assessment was carried out by taking into account litter characteristics such as the presence of signs of exposure to sun and saltwater, e.g., abrasion and discoloration, and the presence of marine organisms’ remains, e.g., shells, corals or algae attached to the items recollected. Items left by users were always easily recognizable because were intact and/or contained remains of food. Last, it has to be highlighted that the quantity of items left by beach users is very limited during autumn, winter and spring in the Mediterranean area and that items abandoned by beach users are usually accumulated in the dry beach [35]. Considering all the above, it is possible to state that items considered in this paper are surely and almost exclusively stranded on the beach by marine processes.
Collected beach litter was categorized following the Joint List of Litter Categories for Macrolitter Monitoring (items > 2.5 cm), which was developed by the MSFD Technical Group on Marine Litter [48] in collaboration with EU Member States and the Regional Sea Conventions [49]. Plastic tangled wet wipes were added to the classification list.

3.3. Data Analysis

To facilitate comparisons with other studies, the data were presented in terms of litter abundance and average litter accumulation rates per linear meter. Statistical analyses were performed with the “R” computer program (http://www.r-project.org, accessed 20 October 2023). Statistical analyses were performed with a significance level of α = 0.05. The Kruskal–Wallis test was employed to assess seasonal variations between the “autumn” and “spring” seasons, considering the non-normal distribution of the data. Further analysis, incorporating both seasonal and spatial dimensions, utilized the Friedman test and analysis of variance (ANOVA) to discern variations across specific beach locations and seasons. The investigation extended to daily litter deposition rates, employing a two-way ANOVA to dissect the interactive influence of season and beach location on litter quantities.
Detailed insights were obtained from a beach-by-beach analysis, employing ANOVA and Kruskal–Wallis tests. Visualization of findings was facilitated through box plots. A chi-square test scrutinized the distribution of the 20 most frequent litter categories between campaigns, highlighting dominant litter categories.
Cluster analysis was used to represent the dissimilarity of beaches based on litter categories. Linear regression (or Spearman correlation for non-normal data) assessed the links between litter quantity, wave height and wind. Poisson regression probed deeper into factors influencing litter quantity, allowing us to examine the interaction between wave direction, beach exposure and litter quantity; such results were supported by the analysis of deviance. The analytical approaches collectively offer an overview of the multifaceted dynamics governing beach litter, sorting out the relevance of seasonal, spatial and environmental factors at the surveyed beaches.

4. Results and Discussions

4.1. Beach Litter Spatial and Temporal Distribution

At the seven surveyed beach sectors, in autumn 2022, a total of 4199 items with a combined weight of 22.58 kg were recorded. This number increased to 4634 items with a total weight of 22.68 kg in spring 2023.
The average litter abundance during autumn and spring was 0.28 ± 0.18 items m−1 (0.60 ± 0.30 items m⁻2) and 0.32 ± 0.45 items m−1 (0.21 ± 0.35 items m⁻2), respectively (Table 2). Litter composition and abundance displayed substantial variations from one location to another, with pronounced seasonal changes. The highest abundance was observed at La Puntilla Beach, with 0.48 ± 0.25 items m−1 in autumn and 1.34 ± 0.61 items m−1 in spring. Conversely, the lowest abundance was recorded at sector 1 of Valdelagrana Beach (0.08 ± 0.06 items m−1) during autumn and at El Castillito Beach (0.08 ± 0.04 items m−1) during spring (Table 2).
In order to analyze the seasonal influence on beach litter quantities and content, a statistical analysis was conducted. A first statistical analysis was conducted using a Kruskal–Wallis test. The dependent variable was the average of the daily number of items per meter recorded at the seven beach sectors, while the independent variable represented the season, i.e., autumn and spring. The test results, yielding a p-value of 0.33, indicated that there was no significant difference in the distribution of litter amounts per meter between the two seasons. This suggests that litter abundance remained relatively consistent regardless of the season. Furthermore, a Friedman test was performed to examine how the dependent variable, i.e., the average daily number of items recorded in each beach, varied versus the independent variables, i.e., “Seasons” (autumn and spring) and “Beaches” (different beaches). The results indicated that the seasonality did not significantly affect litter quantities recorded on the different beaches (p-value = 0.70).
To gain a more comprehensive understanding of the seasonal impact on litter characteristics, the analysis was extended by incorporating daily litter deposition rates. Initially, an ANOVA test compared the daily litter quantity versus the seasons, “autumn” and “spring”. However, this test did not yield significant results (p-value = 0.79). Subsequently, a two-way ANOVA was performed, with the dependent variable being the daily litter deposition rate recorded at each beach. The independent variables included the season during which the measurements were taken (autumn, spring), the different beach locations and the combined effect of the season and beach. The statistical analysis suggested that, despite season alone having no significant impact on litter quantities, a different trend was recorded considering all surveys at each beach. The interaction between season and beach location was highly significant (p-value for season = 0.66; p-value for location < 0.001; p-value for interaction between season and beach location < 0.001).
Further investigations were conducted through a detailed beach-by-beach analysis. ANOVA and Kruskal–Wallis tests, considering the normality of the data, were performed to identify the beaches where the season had a significant impact on the daily accumulation rate. The results are summarized in Table 3.
To visualize and compare these findings, box plots were also used; they clearly highlighted seasonal variations in the litter amount recorded at each beach sector (Figure 3).
Comparing litter data across different studies presents challenges due to variations in methodologies, sampling and measurement units [50,51]. Despite the fact that the methodology used in this paper deviates from many traditional studies based on single sampling campaigns generally focused on a standard beach sector 100 m in length (longshore) with different widths (according to beach dimensions and water level at the time of the survey), the fact that most of the beach litter accumulates along the strandline, especially during the non-tourist season, i.e., when most of the litter found on the beach is stranded by waves and currents [35], enables us to broadly compare the results obtained in this paper with other studies. Therefore, litter amounts recorded in this paper are consistent with values observed in the province of Cadiz by Asensio-Montesinos et al. [36] who carried out a single survey in autumn 2018 at 40 beaches along 100 m transects covering the entire beach surface from the water line position, at low tide, to the backshore. Such authors recorded an average value of 0.06 items m−2, with a range from 0.003 to 0.26 items m−2. Differences were observed at La Puntilla and Valdelagrana of 0.132 and 0.128 items m−1, respectively; such values are lower than the ones recorded in this paper (Table 2). Additionally, data recorded in this paper align with observations from various Mediterranean coastlines, such as Ceuta, where Asensio-Montesinos et al. [52] conducted a total of three surveys on 12 beaches, recording litter quantities ranging from 0.212 items m−2 in February and 0.235 items m−2 in March to 0.356 items m−2 in April 2019. Similarly, a study conducted in the province of Alicante (Spain), with a single survey carried out at 56 sites, found litter averages of 0.062 items m−2 in spring and 0.116 items m−2 in summer [53]. Higher litter amount values were found in the Adriatic and Ionian Seas, where Vlachogianni et al. [54] conducted four campaigns every three months on 31 beaches across seven Mediterranean countries and observed average values of 0.67 items m−2, with a wide variation from 11 items m−2 recorded at a Croatian site to 0.08 items m−2 recorded on different beaches in Greece.
Beach litter abundance significantly varied from one location to another, and this seems to be a common trend due to various factors. This was also observed in Cape Town (South Africa), where deposition values widely varied among different beaches, ranging from 36 to 2961 items per day within 100 m of beach length [31]. In Indonesia, Cordova et al. [55] recorded stranded litter on 18 beaches through monthly samplings, obtaining much higher average values (2.69 ± 1.31 items m−2) compared to this paper. Kusui and Noda [56] carried out campaigns on 18 beaches in Japan and 8 beaches in Russia, using 10 × 10 m transects, i.e., a surface of 100 m2. The average litter amount was 341 items per 100 m2 in Japan and 21 items per 100 m2 in Russia.

4.2. Beach Litter Composition

Beach litter was composed of different materials (Figure 4), with plastic being the most abundant, representing 71.13% and 88.39% of the total in autumn and spring, respectively. The remaining materials included chemicals (0.92%–0.02%), clothing (1.01%–2.35%), glass and ceramics (1.46%–3.13%), metals (1.85%–4.04%), organic food (0.68%–0.02%), paper (1.82%–0.82%), rubber (19.19%–0.56%) and wood (1.95%–0.67%).
Litter diversity, expressed in terms of the number of categories, exhibited some differences between autumn and spring. Using the Joint List classification [48], 90 and 107 litter categories for autumn and spring surveys were identified, respectively, and 117 considered both.
Based on the Joint List classification, the top 10 litter categories encountered for each season were as follows (Table 4):
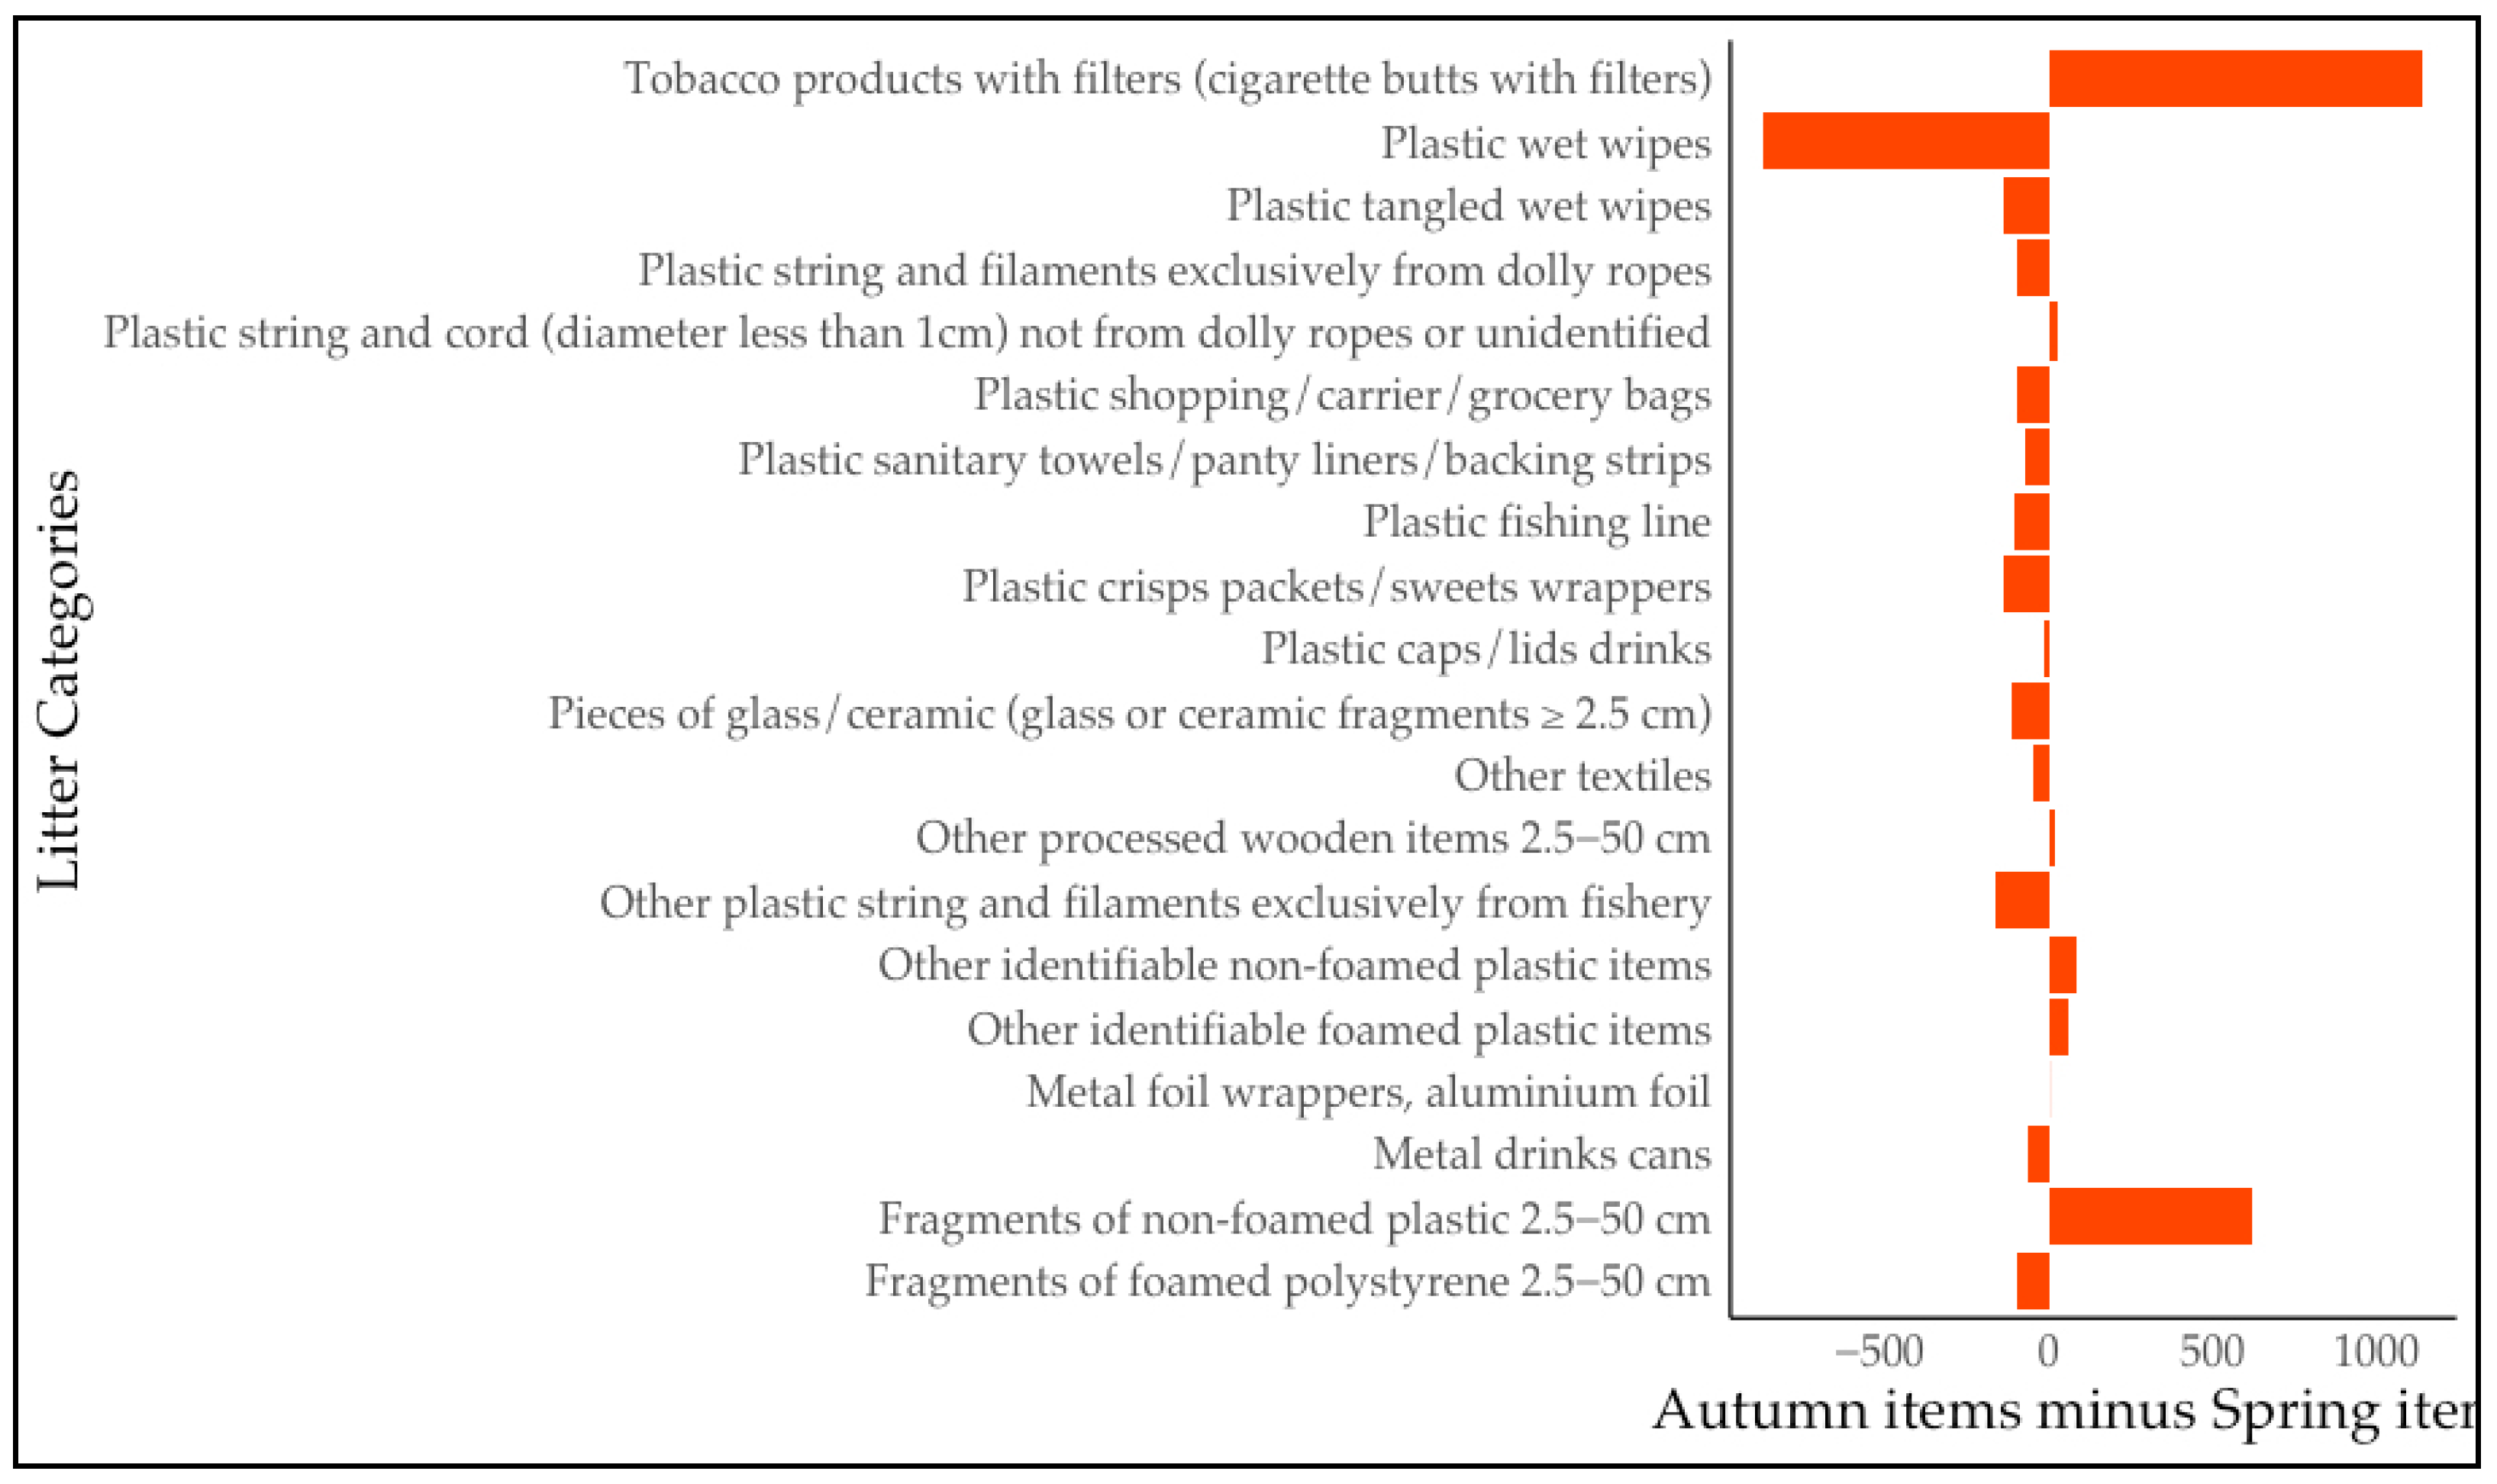
  • Autumn 2022: cigarette butts (1746 items); fragments of non-foamed plastic 2.5–50 cm (985 items); plastic crisps packets/sweets wrappers (297 items); fragments of foamed polystyrene 2.5–50 cm (181 items); other identifiable non-foamed plastic items (177 items); plastic string and cord (Ø < 1 cm) not from dolly ropes or unidentified (96 items); other identifiable foamed plastic items (85 items); plastic cotton bud sticks (68 items); plastic shopping/carrier/grocery bags (56 items); other processed wooden items 2.5–50 cm (51 items).
  • Spring 2023: plastic wet wipes (900 items); cigarette butts (514 items); plastic crisps packets/sweets wrappers (423 items); fragments of non-foamed plastic 2.5–50 cm (339 items); fragments of foamed polystyrene 2.5–50 cm (211 items); other plastic string and filaments exclusively from fishery (167 items); plastic shopping/carrier/grocery bags (150 items); pieces of glass/ceramic (glass or ceramic fragments ≥ 2.5 cm) (142 items); plastic tangled wet wipes (142 items); plastic fishing line (120 items).
Beach litter can have both marine and terrestrial origins. “Marine origin” refers to litter generated directly in the sea through activities like fishing, offshore gas/oil extraction and cruises. In contrast, “terrestrial origin” is linked to litter stemming from activities on land, such as beach tourism, or items transported to the coast by wind, rainwater, rivers, etc. [6,57]. Determining the exact source of beach litter is complex and often uncertain [58]. Therefore, in this paper, items were categorized by use rather than source by means of the Joint List subcategories [59]. These categories include construction, clothing, fishing, food, healthcare, personal care, recreation, smoking and undefined. The highest percentage, represented by the “Undefined Use” category in both campaigns (Figure 5), reflects the difficulty in the determination of the specific use of many items. In the first campaign, the most common category was the one related to smoking and, in the spring campaign, personal hygiene items, due to wet wipes, constituted the second-highest category.
Plastic was always the dominant material, confirming a global trend [60,61]. It is also worth noting that many of the encountered categories aligned with previous research conducted along the coast of different European countries [62], in the province of Cadiz, Spain [36], in continental Portugal and in the Azores Islands [63], among others.
The great abundance of cigarette butts, which constituted the most prevalent items in this study, falls in line with the findings of numerous other studies [25,36,64,65,66,67], highlighting their ubiquitous presence in coastal environments. We identified a total of over 2000 cigarette butts, with 1746 collected in the autumn season and 514 in the spring season. It is important to mention that this paper was exclusively focused on cigarette butts that visually exhibited degradation levels clearly linked to items stranded on the beach by waves and currents. These observations are in accordance with the degradation levels proposed by Araújo et al. [68] and concerns level 3 of their classification, i.e., the cigarette butt retains its fibrous filter with some signs of wear and discoloration, and with level 4, where only the compacted filter fibers are found, lacking the outer paper coating. An explanation of the differences in the amount of cigarette butts observed in autumn and spring is probably related to the fact that the beaches of El Puerto de Santa Maria, during the summer months, experience a significant flux of tourists who leave behind a large number of cigarette butts on the beach. This behavior aligns with the findings of Araújo [69] and Asensio-Montesinos et al. [36], who emphasize that the frequency of beachgoers is one of the key factors in determining the accumulation of cigarette butts on beaches. Such small, lightweight debris can float for a long period in the sea [70]. Subsequently, marine conditions and tides may gradually bring the cigarette butts back to the beach or cause them to sink to the sea floor, and when they are stranded on the beach, they often elude mechanical beach cleaning operations; because of their small dimensions, they go through the sieves used [71]. All of the above reflect the influence of summer tourism on cigarette butts’ presence in autumn [69], and their low frequency observed in spring is linked to their degradation and probably their transport offshore [36] because of marine storms that greatly affect Cadiz beaches during the November–February period [40].
Finally, the great abundance of wet wipes, especially at La Puntilla beach, is a matter of notable concern. They presented huge seasonal differences as they were almost absent in autumn (29) and became the prevalent item in spring (900). The exact causes of such relevant variations remain unknown. They are surely linked to the Guadalete River [35,36,72] that recollects wastewater from different cities, among them El Puerto de Santa Maria, whose water supplies (and associated litter discharge) increase during fall and winter seasons, as observed in other areas by Poeta et al. [73]. This concept is supported by the “Personal hygiene and care-related items” percentage, which is 2.56% in autumn and increases to 25.18% in spring (Figure 4). It is important to note that not only wet wipes contribute to the increase in this category but also sanitary towels and tampons, which were only 13 in autumn and increased to 84 in spring.
Another cause may be the malfunctioning of the sewage plants in the Bay of Cadiz, as mentioned in the “Plan Hidrológico de la Demarcación Hidrográfica del Guadalete-Barbate”. Several problems with different origins are observed such as (i) the poor efficiency demonstrated on numerous occasions by the “Las Galeras” sewage treatment plant in El Puerto de Santa María, in which wastewaters are poured into the Guadalete River. The plant is outdated and operates at the limit of its capacity. (ii) Specific cases of pollution are observed during heavy rains that cause sewer spills in the area [74].
Concerning the 20 most frequently observed litter categories, a chi-square test was employed to compare their distribution during the two campaigns, revealing highly significant differences (p < 0.001). “Plastic wet wipes” and “cigarette butts” notably emerged as the most prominent categories (Figure 6).
Finally, the cluster analysis showed the dissimilarity of all beaches, according to litter category content variations observed in the two campaigns, highlighting the relevance of the season (Figure 7).

4.3. Hydrodynamic and Wind Conditions

Wind speed and direction and significant wave height and direction are presented in Table 5. Wind principally blew during the autumn survey from the third quadrant with an average value of 3.8 m/s and in spring from the fourth quadrant with an average value of 4.6 m/s (Table 4). During the autumn and spring surveys, wavefronts broadly reflected wind conditions and prevalently approached from the third and fourth quadrants, respectively. Wave height in autumn ranged from 0.71 to 1.70 m (average = 1.08 m) and in spring from 0.70 to 1.74 m (average = 1.17 m). Wave period ranged a lot and higher values, corresponding with swell wave conditions, were observed in spring (Table 5).
Recorded significant wave heights during the two monitoring surveys were propagated, and the case of an offshore significant wave height of 1.4 m and 5.7 s was identified in the pen boundary condition (Figure 8). Wavefronts recorded relevant diffraction and refraction processes and arrived at investigated beaches with small approaching angles and almost normally at La Puntilla and Valdelagrana sector 2. Significant wave height values greatly decreased during the wave propagation process (Figure 8).
Higher values (>1 m) were observed at exposed beaches, i.e., La Calita and La Muralla, and, partially, at Valdelagrana 2 (ca. 0.80 m); low values were recorded at La Puntilla (Hs = 0.40 m) and very low values (Hs = 0.20 m) at El Aculadero, El Castillito and Valdelagrana 1. Despite the exact approaching direction of offshore wavefronts, longshore transport took place according to vectors presented in Figure 7, i.e., from western to eastern directions so most of the wave energy is transmitted along the orthogonal that arrives normally at La Calita, La Muralla, Valdelagrana 2 and La Puntilla. Therefore, La Puntilla works as a “cul de sac” area [40], which is limited by the Guadalete River jetties to the south and, partially, by a short groin to the north.
Overall, data analysis revealed no clear correlations between litter quantity and wave height, as depicted in Figure 9. However, specific patterns emerged: concerning La Calita and La Muralla, the two most exposed beaches, peaks in litter abundance were observed with an increase in wave height, regardless of its approaching direction. In contrast, more sheltered beaches tended to accumulate more litter when affected by waves from the west.
Regarding La Puntilla Beach, the great number of litter items recorded are probably accumulated by longshore transport and wave energy that converge at such an area as observed in Figure 8.
Additionally, during the second campaign, a two-day time lag was observed between energetic wave events and an increase in litter quantity. In Valdelagrana, both sectors demonstrated relatively similar litter accumulation rates, with sector 2 (more exposed) receiving higher quantities.
To validate these observations, several statistical tests were conducted. Linear regression, replaced by Spearman correlation in the case of non-normal data, was employed to examine the relationship between litter quantity and wave height. Considering the observed time lag and insights from other studies [75], tests were performed using the significant wave height corresponding to the sampling day, as well as the data recorded one and two days before the survey. For the first campaign, a significant relationship was found between the same-day wave height and litter content at El Castillito (p-value = 0.02) (Figure 10) and La Puntilla (p-value = 0.01) (Figure 11). A significant relationship was also observed between the wave recorded two days before the survey and the litter amount at Valdelagrana 1 (p-value = 0.03). In the second campaign, a p-value < 0.05 was obtained comparing wave height recorded two days before the survey and litter amount at La Puntilla (p-value = 0.02) (Figure 12). Analysis of the combined data from both campaigns yielded no significant relationships.
The relationship between wind speed and litter quantity was also investigated but no significant correlation was found (Figure 13).
Last, a Poisson regression was conducted to examine the interaction between wave height and direction, beach exposure and litter quantity. The results suggest that while wave height does not significantly influence litter quantity, the sheltered category and south wave approaching direction achieved p-values of 0.02 and 0.04, respectively. Therefore, litter accumulation is higher in sheltered beaches compared to open beaches, particularly when waves approach from the south. The analysis of deviance supports the hypothesis that beach exposure is a significant predictive variable of the litter rate (Figure 14).
Contrasting results can be observed in other studies focused on the relationships between litter deposition rates and hydrodynamic variables. For example, Eriksson et al. [30] conducted daily collections of marine stranded debris in two sub-Antarctic islands, i.e., the Heard and Macquarie islands, over four months to establish the physical components related to litter deposition rates. The results obtained were inconsistent: through a multiple regression analysis, they observed that the combined effects of the maximum tidal height and wind speed and direction were associated with daily accumulation rate differences on Macquarie Island but not on Heard Island. Other studies, which employed more complex analyses and/or numerical models, reported positive correlations between the aforementioned variables. As an example, Prevenios et al. [75], based on accumulation rates obtained by means of surveys carried out every 15 days over 16 months, found a significant relationship between deposition rates and wave height using the square of the sum of wave heights from the days prior to the sampling.
Indeed, relationships between wave characteristics and litter deposition rates are complex, and further investigations are needed to fully understand them. The results obtained in this paper offer valuable insights that can be used in future studies.

5. Final Considerations

The study examined beach litter distribution across seven beaches in Cadiz Bay, Southwest Spain. In autumn 2022, 4199 items weighing 22.58 kg were found, and the litter amount slightly increased in spring 2023, showing 4634 items with a total weight of 22.68 kg. The average litter abundance in autumn was 0.28 ± 0.18 items m⁻1 (0.6 ± 0.3 items m⁻2) and in spring, 0.32 ± 0.45 items m⁻1 (0.21 ± 0.35 items m⁻2). The highest abundance occurred at La Puntilla Beach, with 0.48 ± 0.25 items m⁻1 in autumn and 1.34 ± 0.61 items m⁻1 in spring, while the lowest was at Valdelagrana sector 1 (autumn: 0.08 ± 0.06 items m⁻1) and El Castillito (spring: 0.08 ± 0.04 items m⁻1).
The investigation highlighted that, overall, litter quantities remained almost constant during the two periods, with significant variations observed at specific locations. Despite methodological disparities with previous studies, the recorded litter amounts aligned with previous observations in the province of Cadiz and other Mediterranean coastlines. Plastic emerged as the most abundant item, representing 71.13% and 88.39% of the total in autumn and spring, respectively; such values align with global trends and findings from other European and Mediterranean coastlines.
Items were categorized according to their use utilizing the Joint List subcategories. The predominance of the “Undefined Use” category in both seasons (Figure 5) reflected the difficulty in determining the specific use of many items. The second place was occupied by “smoking-related” and “personal hygiene” items for autumn and spring surveys, respectively.
Cigarette butts (2000 units) were the dominant items. Their abundance varied between autumn and spring, reflecting the influence of summer tourism on litter accumulation/characteristics in autumn.
Indeed, there exists a critical need for future interventions devoted to reducing beach litter mount due to beach users. The results obtained in this paper suggest the relevance of implementing littering prevention campaigns during peak tourist seasons. For instance, it would be of great interest to distribute recycled plastic ashtrays as a practical solution aimed at both avoiding improper cigarette butt disposal and enhancing beach visitors’ environmental awareness.
It is of the uppermost relevance to involve stakeholders to minimize cigarette butt pollution, as well as the tobacco industry and policymakers, who have to promote appropriate legal regulations [69].
Wet wipes, notably abundant at La Puntilla Beach, exhibited significant seasonal differences, potentially influenced by river water and sewage discharges. Improving wastewater treatment systems is essential to prevent specific items (i.e., wet wipes) from reaching the environment. This study provides relevant information to public authorities and environmental offices responsible for sewage water treatment and purification plants. It is crucial to inform them about the problem and emphasize the importance of adopting sound measures to minimize it.
Hydrodynamic and wind conditions were explored in relation to litter abundance, with varying patterns observed across the different beaches. The study highlighted and confirmed the complexity of the relationships between waves and litter deposition rates and characteristics, evidencing the necessity of further investigations.
Nevertheless, the substantial variation in beach litter accumulation rates across the surveyed locations demonstrates that the quantity of stranded litter is significantly influenced by specific factors. According to the present investigation, sheltered beaches present higher litter amounts compared to open beaches. Additionally, wavefronts approaching from the south are linked with a relevant increase in stranded litter amounts. These insights contribute to a more detailed understanding of the complex beach litter dynamic and accentuate the importance of developing customized cleaning strategies that consider both seasonal variations in litter composition/amount and the unique environmental characteristics of each beach.
For instance, addressing cigarette butt accumulation requires different methods in autumn (when they are very abundant) compared to spring, such as the implementation of manual cleaning that is more effective in the recollection of small items than mechanical clean-up programs.
Beach litter is not only an environmental concern but also an economic burden affecting states and citizens [76]. The “More Trash More Cash” report [77] sheds light on the significant costs that the Spanish municipalities and taxpayers have to pay, amounting to EUR 744 million annually, to clean up packaging litter on the streets and in coastal areas.
This study emphasizes the severe impact of plastic pollution on marine environments. Policymakers are therefore confronted with a growing urgency to act and implement sound solutions. Immediate actions may include reducing single-use plastic through regulations and successful recycling and deposit return strategies as reported in countries like Germany and Norway. Additionally, increased investment in researching bio-products is crucial to accelerate the transit to sustainable materials. The recycling industry needs an enhancement to adapt to these changes. Monitoring and cleaning initiatives are also essential to reduce existing plastic litter in the marine environment. Collaborative projects, such as the involvement of fishermen in cleaning efforts like the ‘fishing for litter’ activity, constitute a promise for the future but require further sponsorships. A cultural shift toward responsible disposal is essential, encouraging environmental awareness to prevent littering, particularly cigarette butts and wet wipes, which should be properly disposed of to avoid ending up in sewage.
Although the immediate impact may not be striking, continued efforts are needed to understand and manage waste dynamics more effectively.
Overall, this research contributes valuable data that can help policymakers, environmentalists, and local authorities to develop effective strategies to mitigate the impact of marine litter on coastal ecosystems. The methodology employed here is transferable to similar coastal areas, providing a basis for optimizing clean-up operations and promoting sustainable management practices. As marine litter continues to pose significant challenges globally, ongoing research efforts are crucial for developing evidence-based solutions and fostering a cleaner, healthier marine environment.

Author Contributions

Conceptualization, G.A. and F.A.-M.; methodology, O.Á., C.J.G. and J.C.G.R.; software, O.Á., C.J.G. and E.C.; validation, O.Á., C.J.G. and G.A.; formal analysis, E.C.; investigation, J.C.G.R. and E.C.; resources, F.A.-M.; data curation, C.R.C. and E.C.; writing—original draft preparation, J.C.G.R., G.A. and E.C.; writing—review and editing, J.C.G.R., E.C. and J.C.G.R.; supervision, G.A. All authors have read and agreed to the published version of the manuscript.

Funding

This research received no external funding.

Institutional Review Board Statement

Not applicable.

Informed Consent Statement

Not applicable.

Data Availability Statement

Data are contained within the article.

Acknowledgments

Special thanks to the beach-cleaning company Innovia Coptalia for their help with the sampling. This work is a contribution to the PAI Research Group RNM-373 of Andalusia, Spain.

Conflicts of Interest

The authors declare that they have no conflicts of interest.

Appendix A

Table A1. Average values of litter density, expressed as weight of items m−1 and weight of items m−2, and associated standard deviation values at surveyed beaches.
BeachWeight of Items m−1 Weight of Items m−2
AutumnSpringTotalAutumnSpringTotal
La Calita1.60 ± 0.940.64 ± 0.571.64 ± 1.860.32 ± 0.190.13 ± 0.110.22 ± 0.18
La Muralla0.52 ± 0.510.34 ± 0.290.71 ± 1.020.24 ± 0.120.07 ± 0.060.16 ± 0.13
El Aculadero0.54 ± 0.500.52 ± 0.500.90 ± 1.540.33 ± 0.270.10 ± 0.100.22 ± 0.23
El Castillito1.39 ± 1.620.87 ± 1.151.72 ± 2.710.32 ± 0.300.17 ± 0.230.24 ± 0.27
La Puntilla2.83 ± 1.876.49 ± 3.949.35 ± 19.220.57 ± 0.371.30 ± 0.790.93 ± 0.71
Valdelagrana 11.61 ± 1.520.70 ± 0.961.59 ± 2.130.32 ± 0.300.14 ± 0.190.23 ± 0.26
Valdelagrana 20.70 ± 0.941.65 ± 1.132.42 ± 4.900.14 ± 0.190.33 ± 0.230.23 ± 0.22
Total1.31 ± 0.831.60 ± 2.203.01 ± 3.020.32 ± 0.130.32 ± 0.440.28 ± 0.27

References

  1. UNEP. Marine Litter: An Analytical Overview; UNEP: Nairobi, Kenya, 2005; p. 47. [Google Scholar]
  2. Galgani, F.; Leaute, J.P.; Moguedet, P.; Souplet, A.; Verin, Y.; Carpentier, A.; Goraguer, H.; Latrouite, D.; Andral, B.; Cadiou, Y. Litter on the sea floor along European coasts. Mar. Pollut. Bull. 2000, 40, 516–527. [Google Scholar] [CrossRef]
  3. Galgani, F.; Hanke, G.; Werner, S.; DeVrees, L. Marine litter within the European Marine Strategy Framework Directive. ICES J. Mar. Sci. 2013, 70, 1055–1064. [Google Scholar] [CrossRef]
  4. Cózar, A.; Martí, E.; Duarte, C.M.; García-de-Lomas, J.; van Sebille, E.; Ballatore, T.J.; Eguíluz, V.M.; González-Gordillo, J.I.; Pedrotti, M.L.; Echevarría, F.; et al. The Arctic Ocean as a dead end for floating plastics in the North Atlantic branch of the Thermohaline Circulation. Sci. Adv. 2017, 3, 1600582. [Google Scholar] [CrossRef] [PubMed]
  5. Seas at Risk. Circular Economy: Reducing Marine Litter at Its Source. 2016, p. 2. Available online: www.seas–at-risk.org (accessed on 15 February 2019).
  6. Allsopp, M.; Walters, A.; Santillo, D.; Johnston, P. Plastic Debris in the World’s Oceans; Greenpeace: Exeter, UK, 2006. [Google Scholar]
  7. Ruiz, I.; Rubio, A.; Abascal, A.J.; Basurko, O.C. Modelling floating riverine litter in the south-eastern Bay of Biscay: A regional distribution from a seasonal perspective. Ocean Sci. 2022, 18, 1703–1724. [Google Scholar] [CrossRef]
  8. Grelaud, M.; Ziveri, P. The generation of marine litter in Mediterranean island beaches as an effect of tourism and its mitigation. Sci. Rep. 2020, 10, 20326. [Google Scholar] [CrossRef]
  9. Coe, J.M.; Rogers, D.B. Marine Debris: Sources, Impacts and Solutions; Springer: New York, NY, USA, 1997; p. 432. [Google Scholar]
  10. Ryan, P.G. The importance of size and buoyancy for long-distance transport of marine debris. Environ. Res. Lett. 2015, 10, 084019. [Google Scholar] [CrossRef]
  11. Convey, P.; Barnes, D.K.; Morton, A. Debris accumulation on oceanic island shores of the Scotia Arc, Antarctica. Polar. Biol. 2002, 25, 612–617. [Google Scholar] [CrossRef]
  12. Chiba, S.; Saito, H.; Fletcher, R.; Yogi, T.; Kayo, M.; Miyagi, S.; Ogido, M.; Fujikura, K. Human footprint in the abyss: 30 year records of deep-sea plastic debris. Mar. Policy 2018, 96, 204–212. [Google Scholar] [CrossRef]
  13. Aguilar, R.; Marín, P.; Álvarez, H.; Blanco, J.; Sánchez, N. Plastic in the Deep: An Invisible Problem. In How the Seafloor Becomes a Plastic Trap; Oceana: Washington, DC, USA, 2020; p. 24. [Google Scholar]
  14. Forrester, D.J.; White, F.H.; Woodard, J.C.; Thompson, N.P. Intussusception in a Florida manatee. J. Wildl. Dis. 1975, 11, 566–568. [Google Scholar] [CrossRef]
  15. Cadee, G.C. Seabirds and floating plastic debris. Mar. Pollut. Bull. 2002, 44, 1294–1295. [Google Scholar] [CrossRef]
  16. Romeo, T.; Pietro, B.; Pedà, C.; Consoli, P.; Andaloro, F.; Fossi, M.C. First evidence of presence of plastic debris in stomach of large pelagic fish in the Mediterranean Sea. Mar. Pollut. Bull. 2015, 95, 358–361. [Google Scholar] [CrossRef] [PubMed]
  17. Walker, T.R.; Reid, K.; Arnould, J.P.; Croxall, J.P. Marine debris surveys at bird island, south Georgia 1990–1995. Mar. Pollut. Bull. 1997, 34, 61–65. [Google Scholar] [CrossRef]
  18. Barnes, D.K. Biodiversity: Invasions by marine life on plastic debris. Nature 2002, 416, 808. [Google Scholar] [CrossRef] [PubMed]
  19. Kiessling, T.; Gutow, L.; Thiel, M. Marine Litter as Habitat and Dispersal Vector. In Marine Anthropogenic Litter; Springer: Cham, Switzerland, 2015; pp. 141–181. [Google Scholar] [CrossRef]
  20. Rochman, C.M.; Hentschel, B.T.; Teh, S.J. Long-term sorption of metals is similar among plastic types: Implications for plastic debris in aquatic environments. PLoS ONE 2014, 9, e85433. [Google Scholar] [CrossRef] [PubMed]
  21. Lau, W.W.Y.; Shiran, Y.; Bailey, R.M.; Cook, E.; Stuchtey, M.R.; Koskella, J.; Velis, C.A.; Godfrey, L.; Boucher, J.; Murphy, M.B.; et al. Evaluating Scenarios toward Zero Plastic Pollution. Science 2020, 369, 1455–1461. [Google Scholar] [CrossRef]
  22. Krelling, A.P.; Williams, A.T.; Turra, A. Differences in perception and reaction of tourist groups to beach marine debris that can influence a loss of tourism revenue in coastal areas. Mar. Policy 2017, 85, 87–99. [Google Scholar] [CrossRef]
  23. Williams, A.T.; Micallef, A. Beach Management. In Principles and Practice; Earthscan: London, UK, 2009; p. 480. [Google Scholar]
  24. Williams, A.T.; Pond, K.; Ergin, A.; Cullis, M.J. The hazards of beach litter. In Coastal Hazards; Springer: Dordrecht, The Netherlands, 2013; pp. 753–780. [Google Scholar]
  25. Martinez-Ribes, L.; Basterretxea, G.; Palmer, M.; Tintoré, J. Origin and abundance of beach debris in the Balearic Islands. Sci. Mar. 2007, 71, 305–314. [Google Scholar] [CrossRef]
  26. Hong, S.; Lee, J.; Jang, Y.C.; Kim, Y.J.; Kim, H.J.; Han, D.; Hong, S.H.; Kang, D.; Shim, W.J. Impacts of marine debris on wild animals in the coastal area of Korea. Mar. Pollut. Bull. 2013, 66, 117–124. [Google Scholar] [CrossRef]
  27. Driedger, A.G.; Dürr, H.H.; Mitchell, K.; Van Cappellen, P. Plastic debris in the Laurentian Great Lakes: A review. J. Gt. Lakes Res. 2015, 41, 9–19. [Google Scholar] [CrossRef]
  28. Botero, C.M.; Palacios, M.A.; Souza Filho, J.R.; Milanes, C.B. Beach litter in three South American countries: A baseline for restarting monitoring and cleaning after COVID-19 closure. Mar. Pollut. Bull. 2023, 191, 114915. [Google Scholar] [CrossRef]
  29. Williams, A.T.; Tudor, D. Litter Burial and Exhumation: Spatial and Temporal Distribution on a Cobble Pocket Beach. Mar. Pollut. Bull. 2001, 42, 1031–1039. [Google Scholar] [CrossRef] [PubMed]
  30. Eriksson, C.; Burton, H.; Fitch, S.; Schulz, M.; van den Hoff, J. Daily accumulation rates of marine debris on sub-Antarctic island beaches. Mar. Pollut. Bull. 2013, 66, 199–208. [Google Scholar] [CrossRef] [PubMed]
  31. Chitaka, T.Y.; von Blottnitz, H. Accumulation and characteristics of plastic debris along five beaches in Cape Town. Mar. Pollut. Bull. 2019, 138, 451–457. [Google Scholar] [CrossRef] [PubMed]
  32. Kako, S.I.; Isobe, A.; Magome, S. Sequential monitoring of beach litter using webcams. Mar. Pollut. Bull. 2010, 60, 775–779. [Google Scholar] [CrossRef] [PubMed]
  33. Asensio-Montesinos, F.; Anfuso, G.; Williams, A.T.; Sans-Lázaro, C. Litter behavior on Mediterranean cobble beaches, SE Spain. Mar. Pollut. Bull. 2021, 173, 113106. [Google Scholar] [CrossRef] [PubMed]
  34. Instituto de Estadística y Cartografía de Andalucía. Available online: https://www.juntadeandalucia.es/institutodeestadisticaycartografia/turismo/ (accessed on 20 September 2023).
  35. Williams, A.T.; Randerson, P.F.; Di Giacomo, C.; Anfuso, G.; Macias, A.; Perales, J.A. Distribution of beach litter along the coastline of Cádiz, Spain. Mar. Pollut. Bull. 2016, 107, 77–87. [Google Scholar] [CrossRef]
  36. Asensio-Montesinos, F.; Anfuso, G.; Ramírez, M.O.; Smolka, R.; Sanabria, J.G.; Enríquez, A.F.; Arenas, P.; Bedoya, A.M. Beach litter composition and distribution on the Atlantic coast of Cádiz (SW Spain). Reg. Stud. Mar. Sci. 2020, 34, 101050. [Google Scholar] [CrossRef]
  37. INE. Coyuntura Turística Hotelera (EOH/IPH/IRSH); Notas de Prensa 22 Septiembre de 2023; Instituto Nacional de Estadística: Madrid, Spain, 2023; 12p. [Google Scholar]
  38. López-Bonilla, J.M.; López-Bonilla, L.M. Tourism planning in sub-regional destinations: Heterogeneity of the tourist experience on the Andalusian Coastal Municipalities. Eur. Plan. Stud. 2010, 18, 1821–1836. [Google Scholar] [CrossRef]
  39. Costa, M.; Silva, R.; Vitorino, J. Contribuição para o estudo do clima de agitação marítima na costa portuguesa. 2ª J. Port. Eng. Costeira E Portuária 2001, 20, 20. [Google Scholar]
  40. Anfuso, G.; Benavente, J.; Del Río, L.; Gracia, F.J. An approximation to short-term evolution and sediment transport pathways along the littoral of Cadiz Bay (SW Spain). Environ. Geol. 2008, 56, 69–79. [Google Scholar] [CrossRef]
  41. Wright, L.D.; Short, A.D. Morphodynamic variability of beaches and surfzones: A synthesis. Mar. Geol. 1984, 56, 92–118. [Google Scholar] [CrossRef]
  42. Masselink, G.; Short, A.D. The effect of tide range on beach morphodynamics and morphology: A conceptual beach model. J. Coast. Res. 1993, 9, 785–800. Available online: http://www.jstor.org/stable/4298129 (accessed on 20 October 2023).
  43. Puertos del Estado. Available online: www.puerto.es (accessed on 1 November 2023).
  44. Grange, S.K. Technical Note: Averaging Wind Speeds and Directions Development of Data Analytic Approaches for Air Quality Data View Project Analysis of Air Quality Data View Project; ReseachGate: Berlin, Germany, 2014. [Google Scholar] [CrossRef]
  45. Booij, N.; Ris, R.C.; Holthuijsen, L.H. A third-generation wave model for coastal regions: 1. Model description and validation. J. Geophys. Res. Oceans. 1999, 104, 7649–7666. [Google Scholar] [CrossRef]
  46. Jiménez-Rincón, J.A.; González, C.J.; Izquierdo, A.; Álvarez, O. Changes in tide-induced asymmetries in a tidal creek by presence of intertidal flats: The San Pedro Channel (Cadiz Bay). Estuar. Coast. Shelf Sci. 2023, 295, 108572. [Google Scholar] [CrossRef]
  47. Vidal, J.; Tejedor, B. Study of the dynamic behaviour of the Sancti Petri channel, Southwest coast of Spain. Cienc. Mar. 2005, 31, 617–626. [Google Scholar] [CrossRef]
  48. EA (Environment Agency)/NALG (National Aquatic Litter Group). Assessment of Aesthetic Quality of Coastal and Bathing Beaches. In Monitoring Protocol and Classification Scheme; EA/NALG: Bristol, UK, 2000. [Google Scholar]
  49. Fleet, D.; Vlachogianni, T.; Hanke, G.; European Commission; Joint Research Centre. Joint List of Litter Categories for Marine Macro-Litter Monitoring: Manual for the Application of the Classification System; Office of the European Union: Luxembourg, 2021; Available online: https://data.europa.eu/doi/10.2760/127473 (accessed on 15 May 2023).
  50. Cesarano, C.; Aulicino, G.; Cerrano, C.; Ponti, M.; Puce, S. Marine beach litter monitoring strategies along Mediterranean coasts. A methodological review. Mar. Pollut. Bul. 2023, 186, 114401. [Google Scholar] [CrossRef]
  51. Browne, M.A.; Chapman, M.G.; Thompson, R.C.; Amaral Zettler, L.A.; Jambeck, J.; Mallos, N.J. Spatial and temporal patterns of stranded intertidal marine debris: Is there a picture of global change? Environ. Sci. Technol. 2015, 49, 7082–7094. [Google Scholar] [CrossRef]
  52. Asensio-Montesinos, F.; Anfuso, G.; Aguilar-Torrelo, M.T.; Ramírez, M.O. Abundance and temporal distribution of beach litter on the coast of Ceuta (North Africa, Gibraltar strait). Water 2021, 13, 2739. [Google Scholar] [CrossRef]
  53. Asensio-Montesinos, F.; Anfuso, G.; Williams, A. Beach litter distribution along the western Mediterranean coast of Spain. Mar. Pollut. Bull. 2019, 141, 119–126. [Google Scholar] [CrossRef]
  54. Vlachogianni, T.; Fortibuoni, T.; Ronchi, F.; Zeri, C.; Mazziotti, C.; Tutman, P.; Mandić, M. Marine litter on the beaches of the Adriatic and Ionian Seas: An assessment of their abundance, composition and sources. Mar. Pollut. Bull. 2018, 131, 745–756. [Google Scholar] [CrossRef]
  55. Cordova, M.R.; Iskandar, M.R.; Muhtadi, A.; Nurhasanah; Saville, R.; Riani, E. Spatio-temporal variation and seasonal dynamics of stranded beach anthropogenic debris on Indonesian beach from the results of nationwide monitoring. Mar. Pollut. Bull. 2022, 182, 114035. [Google Scholar] [CrossRef] [PubMed]
  56. Kusui, T.; Noda, M. International survey on the distribution of stranded and buried litter on beaches along the Sea of Japan. Mar. Pollut. Bull. 2003, 47, 175–179. [Google Scholar] [CrossRef] [PubMed]
  57. UNEP. Marine Litter: A Global Challenge; UNEP: Nairobi, Kenya, 2009; p. 13. [Google Scholar]
  58. Mira Veiga, J.M.; Fleet, D.; Kinsey, S.; Nilsson, P.; Vlachogianni, T.; Werner, S.; Galgani, F.; Thompson, R.C.; Dagevos, J.; Gago, J.; et al. Identifying Sources of Marine Litter. MSFD GES TG Marine Litter Thematic Report; JRC Technical Report; EUR: Rome, Italy, 2016; p. 28309. [Google Scholar]
  59. Online Photo Catalogue of the Joint List of Litter Categories. Available online: https://mcc.jrc.ec.europa.eu/main/photocatalogue.py?N=41&O=457&cat=all (accessed on 1 November 2023).
  60. Galgani, F.; Hanke, G.; Maes, T. Global distribution, composition and abundance of marine litter. In Marine Anthropogenic Litter; Springer: Cham, Switzerland, 2015; pp. 29–56. [Google Scholar] [CrossRef]
  61. UNEP. From Pollution to Solution: A Global Assessment of Marine Litter and Plastic Pollution; UNEP: Nairobi, Kenya, 2021; p. 14. [Google Scholar]
  62. Addamo, A.M.; Laroche, P.; Hanke, G. Top Marine Beach Litter Items in Europe A Review and Synthesis Based on Beach Litter Data; Publications Office of the European Union: Luxemburg, 2017. [Google Scholar]
  63. Iglesias, I.; Lupiac, M.; Vieira, L.R.; Antunes, S.C.; Mira-Veiga, J.; Sousa-Pinto, I.; Lobo, A. Socio-economic factors affecting the distribution of marine litter: The Portuguese case study. Mar. Pollut. Bull. 2023, 193, 115168. [Google Scholar] [CrossRef] [PubMed]
  64. Surfrider Foundation. Available online: https://www.surfrider.org/pages/beach-cleanup-activist-guide (accessed on 1 November 2023).
  65. Oigman-Pszczol, S.S.; Creed, J.C. Quantification and classification of marine litter on beaches along Armação dos Búzios, Rio de Janeiro, Brazil. J. Coast. Res. 2007, 23, 421–428. Available online: http://www.jstor.org/stable/4494211 (accessed on 15 September 2023). [CrossRef]
  66. Topçu, E.N.; Öztürk, B. Abundance and composition of solid waste materials on the western part of the Turkish Black Sea seabed. Aquat. Ecosyst. Health Manag. 2010, 13, 301–306. [Google Scholar] [CrossRef]
  67. Kungskulniti, N.; Charoenca, N.; Hamann, S.; Pitayarangsarit, S.; Mock, J. Cigarette Waste in Popular Beaches in Thailand: High Densities that Demand Environmental Action. Int. J. Environ. Res. Public Health 2018, 15, 630. [Google Scholar] [CrossRef]
  68. Araújo, M.C.B.; Costa, M.F.; Silva-Cavalcanti, J.S.; Duarte, A.C.; Reis, V.; Rocha-Santos, T.A.; Costa, J.P.; Girão, V. Different faces of cigarette butts, the most abundant beach litter worldwide. Environ. Sci. Pollut. Res. 2022, 29, 48926–48936. [Google Scholar] [CrossRef]
  69. Araújo, M.C.B.; Costa, M.F. A critical review of the issue of cigarette butt pollution in coastal environments. Environ. Res. 2019, 172, 137–149. [Google Scholar] [CrossRef]
  70. Engler, R.E. The complex interaction between marine debris and toxic chemicals in the ocean. Environ. Sci. Technol. 2012, 46, 12302–12315. [Google Scholar] [CrossRef]
  71. Ariza, E.; Jiménez, J.A.; Sardá, R. Seasonal evolution of beach waste and litter during the bathing season on the Catalan coast. Waste Manag. 2008, 28, 2604–2613. [Google Scholar] [CrossRef] [PubMed]
  72. Meijer, L.J.; Van Emmerik, T.; Van Der Ent, R.; Schmidt, C.; Lebreton, L. More than 1000 rivers account for 80% of global riverine plastic emissions into the ocean. Sci. Adv. 2021, 7, eaaz5803. [Google Scholar] [CrossRef] [PubMed]
  73. Poeta, G.; Conti, L.; Malavasi, M.; Battisti, C.; Acosta, A.T.R. Beach litter occurrence in sandy littorals: The potential role of urban areas, rivers and beach users in central Italy. Estuar. Coast. Shelf Sci. 2016, 181, 231–237. [Google Scholar] [CrossRef]
  74. Junta de Andalucía. Plan Hidrológico de la Demarcación Hidrográfica del Guadalete y Barbate 2022–2027; Junta de Andalucía: Sevilla, Spain, 2021. [Google Scholar]
  75. Prevenios, M.; Zeri, C.; Tsangaris, C.; Liubartseva, S.; Fakiris, E.; Papatheodorou, G. Beach litter dynamics on Mediterranean coasts: Distinguishing sources and pathways. Mar. Pollut. Bull. 2018, 129, 448–457. [Google Scholar] [CrossRef]
  76. Cruz, C.J.; Muñoz-Perez, J.J.; Carrasco-Braganza, M.I.; Poullet, P.; Lopez-Garcia, P.; Contreras, A.; Silva, R. Beach cleaning costs. Ocean. Coast. Manag. 2020, 188, 105118. [Google Scholar] [CrossRef]
  77. Changing Markets Foundation. More Trash, More Cash. Who is really behind the plastic crisis in Spain? 2021. Available online: www.changingmarkets.org (accessed on 15 September 2023).
Figure 1. Location map showing the seven study sites.
Sustainability 16 01010 g001
Figure 2. Wave rose for Cadiz area, observation period: 2012–2023 (source: www.puertos.es, accessed 1 October 2023).
Sustainability 16 01010 g002
Figure 3. Box plots of beach litter abundance (number of items per meter) according to season. Boxes enclose 50% of data, associated standard deviations are represented with whiskers, outliers with black dots, averages with red dots and median values with black lines.
Sustainability 16 01010 g003
Figure 4. Beach litter composition for autumn and spring surveys. Calculations are based on the number of items per meter.
Sustainability 16 01010 g004
Figure 5. Beach litter classified according to use categories proposed by the Joint List of Litter Categories for Macrolitter Monitoring. Calculations are based on the number of items per meter.
Sustainability 16 01010 g005
Figure 6. The bar chart illustrates the seasonal differences in the number of litter categories. Each bar represents a specific litter category expressed as litter amount per meter, and the length of the bars indicates the difference between autumn and spring.
Sustainability 16 01010 g006
Figure 7. Cluster dendrograms showing dissimilarity analysis among sites according to litter category.
Sustainability 16 01010 g007
Figure 8. Pathways of wavefronts associated with an offshore wave: Hs = 1.4 m and Tp = 5.7 s, approaching from the west. Numbers depicted on wavefronts correspond to wave height and arrows indicate the direction of longshore transport. Location of investigated beaches is indicated with numbers according to Figure 1 and Table 1.
Sustainability 16 01010 g008
Figure 9. Significant wave height (shadow area) and wave direction compared to daily litter abundance on each beach and the overall daily litter accumulation.
Sustainability 16 01010 g009
Figure 10. Linear regression line showing the relationship between the significant wave height (Hs, value recorded during high tide conditions) and the amount of litter (items m−1) at El Castillito in autumn.
Sustainability 16 01010 g010
Figure 11. Linear regression line showing the relationship between the significant wave height (Hs, value recorded during high tide conditions) and the amount of litter (items m−1) at La Puntilla in autumn.
Sustainability 16 01010 g011
Figure 12. Linear regression line showing the relationship between the significant wave height (Hs, value recorded during high tide conditions) two days before the sampling and the amount of litter (items m−1) at La Puntilla in spring.
Sustainability 16 01010 g012
Figure 13. Wind speed (shadow area) and wind direction compared to daily litter abundance and litter density on each beach and the overall daily litter accumulation.
Sustainability 16 01010 g013
Figure 14. The plot diagram illustrates the estimated coefficients of a Poisson regression examining the relationship between wave height, direction, beach exposure and litter quantity at different beaches. Bars represent the estimated coefficients and vertical lines indicate the 95% confidence intervals. Asterisks (*) are positioned above the coefficient bars that are statistically significant at a 95% confidence level. The x-axis represents the variables considered in the regression, while the y-axis represents the estimated coefficients. Statistically significant relationships were found for wave direction from south (p = 0.04) and for sheltered (Table 1) beaches (p = 0.02).
Sustainability 16 01010 g014
Table 1. Lengths and characteristics of sampled sectors.
Sector No.Sector Length (m)Location (Beach Name)Beach Characteristic
1172La CalitaExposed
2258La MurallaExposed
3185El AculaderoSheltered
4165El CastillitoSheltered
5212La PuntillaSheltered
6236Valdelagrana 1Sheltered
7181Valdelagrana 2Exposed
Table 2. Average values of litter abundance, expressed as number of items m−1 and number of items m−2, and associated standard deviation values at surveyed beaches. Table A1 (Appendix A) shows the presented litter density expressed as weight of items m−1 and weight of items m−2.
BeachItems m−1 Items m−2
AutumnSpringTotalAutumnSpringTotal
La Calita0.43 ± 0.330.17 ± 0.120.42 ± 0.510.09 ± 0.070.03 ± 0.020.6 ± 0.6
La Muralla0.11 ± 0.130.11 ± 0.090.19 ± 0.310.05 ± 0.010.02 ± 0.020.4 ± 0.2
El Aculadero0.44 ± 0.290.23 ± 0.170.51 ± 0.650.09 ± 0.060.05 ± 0.030.7 ± 0.05
El Castillito0.33 ±0.210.08 ± 0.040.27 ± 0.280.07 ± 0.040.04 ± 0.010.4 ± 0.4
La Puntilla0.48 ± 0.251.34 ± 0.611.94 ± 3.980.10 ± 0.050.27 ± 0.120.18 ± 0.13
Valdelagrana 10.08 ± 0.060.12 ± 0.050.19 ± 0.360.02 ± 0.010.02 ± 0.010.2 ± 0.1
Valdelagrana 20.11 ± 0.040.21 ± 0.120.33 ± 0.620.02 ± 0.010.04 ± 0.020.3 ± 0.2
Total0.28 ± 0.180.32 ± 0.450.63 ± 0.620.6 ± 0.30.06 ± 0.090.08 ± 0.06
Table 3. The results of the two-way ANOVA indicate cases where the variable “season” significantly influenced the daily litter quantity of items per meter stranded at each beach sector.
LocationLa CalitaLa MurallaEl AculaderoEl CastillitoLa PuntillaValdelagrana 1Valdelagrana 2
p-value<0.01<0.010.051<0.01<0.010.082<0.01
Table 4. Top 10 categories related to the autumn and spring campaign according to the Joint List of Litter Categories for Macrolitter Monitoring (items > 2.5 cm).
AutumnSpring
CategoryTotal ItemsCategoryTotal Items
Tobacco products with filters (cigarette butts with filters)1746Plastic wet wipes900
Fragments of non-foamed plastic 2.5–50 cm985Tobacco products with filters (cigarette butts with filters)514
Plastic crisps packets/sweets wrappers297Plastic crisps packets/sweets wrappers423
Fragments of foamed polystyrene 2.5–50 cm181Fragments of non-foamed plastic 2.5–50 cm339
Other identifiable non-foamed plastic items177Fragments of foamed polystyrene 2.5–50 cm211
Plastic string and cord (diameter less than 1 cm) not from dolly ropes or unidentified96Other plastic string and filaments exclusively from fishery167
Other identifiable foamed plastic items85Plastic shopping/carrier/grocery bags 150
Plastic cotton bud sticks68Pieces of glass/ceramic (glass or ceramic fragments ≥ 2.5 cm)142
Plastic shopping/carrier/grocery bags 56Plastic tangled wet wipes142
Other processed wooden items 2.5–50 cm51Plastic fishing line120
Table 5. Wind and wave characteristics.
DateWindWave
dd/mm/yySpeed (m/s)Direction
of Origin (°)
Mean Direction
of Origin (°)
Significant Wave Height (m)Peak Period (s)
Autumn
20/10/223.282052611.478
21/10/224.352202511.7013.3
22/10/222.512072521.0311
23/10/223.112142220.995.72
24/10/221.1052601.3612.1
25/10/223.48962640.767.5
26/10/220.632082620.717.5
27/10/226.021571630.843.9
28/10/224.451332350.778.4
29/10/229.801231861.1810.14
Spring
15/03/236.322972621.5112.1
16/03/236.81182451.2611
17/03/236.851992271.2715.22
18/03/236.972802751.7414.37
19/03/235.363112771.4911.88
20/03/231.71112750.7710.79
21/03/230.53191540.8211.58
22/03/231.572922630.7012.44
23/03/234.423272810.9611.85
Disclaimer/Publisher’s Note: The statements, opinions and data contained in all publications are solely those of the individual author(s) and contributor(s) and not of MDPI and/or the editor(s). MDPI and/or the editor(s) disclaim responsibility for any injury to people or property resulting from any ideas, methods, instructions or products referred to in the content.

