Article

Spatiotemporal Evolution Characteristics and Driving Factors of Water-Energy-Food-Carbon System Vulnerability: A Case Study of the Yellow River Basin, China

School of Management, China University of Mining and Technology-Beijing, Beijing 100083, China
*
Author to whom correspondence should be addressed.
Sustainability 2024, 16(3), 1002; https://doi.org/10.3390/su16031002
Submission received: 18 October 2023 / Revised: 7 January 2024 / Accepted: 9 January 2024 / Published: 24 January 2024
(This article belongs to the Section Development Goals towards Sustainability)

Abstract

:
With the growing influences of anthropogenic activities and climatic change, the problem concerning the vulnerability of the Water-Energy-Food-Carbon (WEFC) system in the Yellow River Basin is prominent. Using the VSD framework, the WEFC system vulnerability evaluation index system was constructed with 60 cities in the Yellow River Basin as the samples, and the WEFC system vulnerability of each city was measured from 2010 to 2019. Kernel density estimation, Theil index, and spatial correlation analysis were employed to investigate spatio-temporal evolution characteristics. Geodetector was utilized to analyze the driving factors of WEFC system vulnerability. The results demonstrate that: (1) The vulnerability of the WEFC system in the Yellow River Basin tends to decrease, with a spatial pattern of “low in the middle and high on both sides”; the vulnerability is largest in the upper and lower reaches, while smallest in the middle reaches. (2) The spatial difference in vulnerability narrows in the middle and lower reaches, while expanding in the upper reaches. The differences among the three major regions mainly originate from within the region, with the upper reaches having the largest difference and contribution; the vulnerability is featured with a significant spatial correlation, with the upper and lower reaches cities mostly displaying a “high-high” agglomeration and the middle reaches mainly showing a “low-low” one. (3) Factors, including the carbon and ecological carrying capacity coefficient, water resource development and utilization rate, and urbanization rate, mainly influence the WEFC system vulnerability; the spatial heterogeneity of core drivers at the regional scale is obvious, with the upper reaches regions being more strongly influenced by factors of the water resources system, while the middle and lower reaches regions are more sensitive to factors concerning industrial pollution of the energy subsystem. The explanatory power of carbon ecological carrying capacity reaches its peak in the middle reaches. The interaction of factors increases the strength of the impact on vulnerability. This study provides decision support and policy suggestions for achieving a balanced and coordinated development of water resource utilization, energy development, food production, and carbon cycle system in the Yellow River Basin. Investigating WEFC system vulnerability to support SDG 11 provided valuable insights and policy strategies for building cities that are inclusive, secure, resource-efficient, and resilient in the face of climate change and disaster risks.

1. Introduction

The Yellow River Basin spans across China’s eastern, central, and western regions, serving as a crucial ecological barrier and a hub for socioeconomic development. It possesses significant natural, economic, and cultural value. The distinctive resource endowment of the Yellow River Basin is characterized by abundant mineral and energy resources in the middle and lower reaches, while the Yellow Huaihai Plain, Fenwei Plain, and Hetao Irrigation Area are major grain-producing regions. However, with continuous population growth and socioeconomic development, the challenges in the Yellow River Basin cannot be underestimated. Foremost among these challenges is the issue of water scarcity in the Yellow River Basin. Over the years, the demand for water resources has steadily risen due to energy industrial production, grain cultivation, and residential consumption. Paradoxically, the Yellow River Basin faces the predicament of receiving only half the precipitation of the Yangtze River Basin, and per capita water resources amounting to just one-third of the national average. Nevertheless, the most concerning issue is the ecological problem within the Yellow River Basin. The scarcity and overexploitation of water resources and energy resources due to excessive extraction have led to the depletion and degradation of ecological functions in the upper reaches’ conservation areas, severe soil erosion in the middle reaches as it traverses the Loess Plateau, and a significant deterioration of the basin’s ecological environment. Under the pressures of a fragile ecological foundation, population growth, and economic development, the Yellow River Basin experiences resource supply–demand imbalances and ecological constraints that impede its development. Therefore, in 2021, the state issued the “Outline of the Yellow River Basin’s Ecological Protection and High-quality Development Plan” to illuminate the importance of strengthening ecological environmental protection in the Yellow River Basin. The Yellow River Basin is a pivotal energy region in China, with concentrated coal energy production and processing activities. Recently, the imbalance of the carbon cycle system, triggered by high energy consumption, pollution, and emissions brought about by industrialization and urbanization in the basin, has been particularly prominent. These issues have posed a severe threat to the fragile ecological foundation of the Yellow River [1,2,3]. In 2022, at the legislative level, the national government enacted the Yellow River Protection Law, which underscores carbon peaking and carbon neutrality as pivotal components of ecological environmental protection and high-quality economic development in the Yellow River Basin [4]. In this case, the intrinsic connection between the achievement of carbon neutrality goals and strategies for ecological protection and high-quality development in the Yellow River Basin is highlighted.
Water, energy, and food are fundamental material resources essential for human survival. The water-energy-food nexus was first proposed at the Bonn Conference in 2011 and, since then, scholars have been investigating the internal inter-relationships, as well as the external impacts and interactions, of this nexus system [5,6,7,8,9]. As a vital part of the ecosystem, the carbon system is also closely related to water, energy, and food. A series of problems, such as water scarcity, overexploitation of energy resources, large-scale emission of greenhouse gases, and degradation of ecological functions in the Yellow River Basin, collectively highlights the pronounced vulnerability characteristics of the WEFC system [10,11]. The study of WEFC linkage can rationally allocate regional resources and improve the efficiency of resource use in the region. In the face of significant environmental and climate challenges, it is crucial to elucidate the interactions of water, energy, and food resources and the ecological carbon cycle system, while enhancing the internal self-regulation capacity of the system. In recent years, scholars have actively studied the water-energy-food nexus, on the basis of which ecological services [12], agricultural development [13], resource allocation [14], and climate and meteorology [15] have been introduced into the relevant research, gradually forming a cross-disciplinary, integrated, and multidisciplinary comprehensive scientific research. The existing research on the WEFC nexus, denoted as WEFC-N, has either focused on studying ecological service systems within the WEFC framework or examined resource allocation within the WEFC system from an agricultural development perspective. However, there is a notable gap in research that fails to incorporate carbon balance from an ecosystem perspective into the study of relationships within the water, energy, food, and carbon (WEFC) nexus [16,17,18].
Qiting Zuo et al. incorporated carbon sequestration into the WEFC nexus system by taking a multi-objective optimization approach for the purpose of exploring optimal decision making for WEFC-N management in Henan Province [19]. Chen Hong et al. constructed an evaluation model for the water-soil-energy-food-carbon coordination adaptability in 31 provinces across China, analyzed the spatial heterogeneity and influencing factors of fitness, and provided a reliable basis for formulating differentiated agro-environmental management policies [20]. Chengyu Cui developed an ecological service system for water-energy-food-carbon (WEFC) in the Datong River Basin, emphasizing carbon sequestration as a crucial regulatory function within ecosystem services. They explored WEFC-N in the context of carbon neutrality and carbon peaking to optimize the development path of agriculture and animal husbandry in the basin and to comprehensively manage the basin ecosystem [21]. Hourui Ren et al. made a carbon footprint life cycle assessment to quantify carbon sinks and emissions in the entire ecosystem. They constructed an optimization model for the water-energy-food-carbon (WEFC) nexus, with the objectives of maximizing irrigation water productivity, minimizing carbon emissions, and strengthening low-carbon agricultural competitiveness. This model also provided concrete insights for improving resource utilization efficiency and assessing the environmental impact of regional agricultural production [22]. Liuyue He et al. investigated the impact of COPP on the WEFC relationship. They found that optimizing cultivation practices resulted in a 13% reduction in the region’s net carbon sequestration capacity and a 22% increase in carbon emissions, which were not beneficial for achieving regional carbon neutrality goals [23].
In the latest research associated with the vulnerability of the WEFC system, Yue Pan et al. conducted a quantitative assessment, spatiotemporal evolution analysis, and diagnostic identification of the primary obstacles hindering the reduction of WEFE system vulnerability in the Yangtze River Economic Belt [24]. Liming Liu et al. concentrated on the Yangtze River Economic Belt, providing a detailed exposition of the conceptual framework and mechanistic analysis of WEFE system vulnerability [25]. They employed the Pressure-State-Response (PSR) conceptual framework to assess vulnerability, focusing on the spatiotemporal characteristics and trend predictions of vulnerability. Junfei Chen et al. analyzed the suitability of coordination and vulnerability in the water-energy-food system in the northwest region, determining a lack of alignment [26]. Yan Chen et al. identified critical driving factors for WEF system security in the Yangtze River Economic Belt on the basis of the RF-Haken model, and took them as control variables for a scenario simulation of safety levels in certain provinces by 2025 [27]. Alma et al. employed a deep learning model to predict resource production and consumption for water, energy, and food security in a Mexican case study [28].
In terms of relevant thematic studies centering on the Yellow River Basin, Dengyu Yin et al. established a coupled coordination framework for the WEF system in this region. They explored the spatiotemporal characteristics and driving mechanisms of coupled coordination [29]. Haiyan Gao et al. directed their attention to the middle and upper reaches of the basin and, based on the perspective of sustainable development of the agricultural system, they evaluated the current status of the WEF-N regarding the reliability, coordination, and resilience [30]. Jie Wang et al. examined the adaptation and evolution of water, energy, and food resources in the region over the past two decades. From their study, it was found that water resources, arable land, and energy production were concentrated in different areas, with focal points shifting towards the northwest, northeast, and western regions of the basin [31]. From the water-energy-food perspective, Haochen Yu et al. selected indicators, including water yield, carbon sequestration, and food, to analyze the match between the supply and demand of ecosystem services, thus providing references and foundations for effective regional resource allocation and sustainable ecosystem management [32].
In summary, the research on the Water-Energy-Food-Carbon (WEFC) nexus primarily focuses on assessing coordination adaptability, evaluating the status of coupled coordination, quantifying relationships, conducting systematic assessments of carbon footprint life cycles, and optimizing resource allocation in multi-objective systems. However, only limited attention has been given to the vulnerability of the WEFC system itself. The existing research on the WEFC system has several shortcomings: The research framework has not incorporated regional ecological carbon carrying capacity into the WEFC nexus from an ecological perspective. The research content predominantly centers on coupled coordination, adaptability assessment, resource utilization efficiency measurement, and solving the multi-objective system optimization problem for resource allocation, while lacking a comprehensive digging into the vulnerability of the WEFC system, which needs to be further controlled for guaranteeing the security of water, energy, food, and carbon systems in the Yellow River Basin. The research object is mainly based on the provincial or specific river basin levels, with minimal research on uncovering the differentiated characteristics of WEFC system vulnerability within the Yellow River Basin.
In 2015, the UN introduced the Sustainable Development Goals (SDGs), consisting of 17 goals and 169 targets, including 1 SDG focused on sustainable cities and communities, with 10 targets. Cities are critical factors in implementing the sustainability agenda, and without limitation, more than 60% of the proposed SDG goals (169) target cities. Cities with an urban metabolism of 15 and/or 30 min. are essential for environmental health wellbeing [33,34].
The study on the vulnerability of the WEFC system plays a crucial role in monitoring the achievement of the Sustainable Development Goals. It transcends the isolated issues of water, energy, food, and carbon systems, serving as a potent tool for influencing the significant impacts on achieving a city that is inclusive, secure, resource-efficient, and resilient to climate change and disasters. Its expansion and alignment with Sustainable Development Goal 11 underscore its critical role in guiding urban development in the Yellow River Basin. Increasing, scholarly attention to WEFC vulnerability-related issues from various perspectives, such as ecological service systems, land use, climate change, and circular economy perspectives, is essential for supporting national and regional planning to foster positive economic, social, and environmental linkages in cities. Researchers are exploring topics such as water reuse, the impact of water reuse systems on ecosystem services, and the necessity of achieving global Sustainable Development Goals (SDGs), as highlighted by Tzanakakis et al [35]. Additionally, Uddin et al. employ a system dynamics model, incorporating water, energy, and food linkages with carbon emissions and economic growth to address circular economy issues arising from resource overexploitation [36]. Gandidzanwa et al. investigate adaptive strategies for urban communities in different income regions facing challenges related to water, energy, and food, aiming to achieve a fair distribution of resources to alleviate poverty sustainably [37]. Papadopoulou et al. utilize a water–energy–land–food–climate nexus approach, considering 17 SDGs prerequisites to formulating comprehensive policies for sustainable and efficient resource utilization in Greece [38]. Naidoo et al. link circular economy with food production, developing a strategic policy concept framework to achieve sustainable economic practices through a literature review of success, opportunities, challenges, and pathways for circular economy implementation [39].
In the study of WEFC system vulnerability, we employ geospatial analysis to analyze the spatiotemporal characteristics of vulnerability in 60 cities in the Yellow River Basin. Simultaneously, we explore the significance and spatial differentiation of driving factors. This unique approach decodes sustainable urban issues related to Sustainable Development Goal 11, aiming to analyze WEFC system vulnerability and its contribution to Sustainable Development Goal 11 from an interdisciplinary perspective. Despite the numerous studies on water, energy, food, carbon cycling, and sustainable development goals, most are based on different perspectives. Currently, there is a lack of urban spatial geographic analysis regarding the interaction between WEFC system vulnerability research and its contribution to Sustainable Development Goal 11.
Therefore, in this paper, the following three scientific hypotheses are integrated:
  • The overall and regional temporal trends of WEFC system vulnerability in the Yellow River Basin are consistent.
  • There is a spatial effect in WEFC system vulnerability in the Yellow River Basin.
  • The contribution rates of various driving factors to WEFC system vulnerability in the Yellow River Basin exhibit spatiotemporal heterogeneity.
  • The vulnerability of the WEFC system in the Yellow River Basin is mitigated by geospatial technology to support the achievement of Sustainable Development Goal 11.
  • There are deficiencies in the current research on the vulnerability of the WEFC system in the Yellow River Basin, limiting its effectiveness in better promoting Sustainable Development Goal 11.
Built upon the scientific hypotheses and subsequent validation, this paper aims to uncover the current state of research and potential directions for future studies in advancing sustainable urban development. Our focus is specifically on the vulnerability of the WEFC system due to its crucial significance in evaluating urban and environmental issues across both space and time.
In summary, this study contributes to research in the following ways: for one thing, it overcomes the collection challenges of multi-indicator panel data for evaluating the vulnerability of the WEFC system at the city level in the Yellow River Basin, thus adjusting the research scale. For another, it fills a research gap in the Yellow River Basin regarding the vulnerability of the WEFC system. Innovatively, in this study, indicators related to carbon emissions, carbon sequestration, and carbon ecological carrying capacity are incorporated into the WEFC-N framework on the basis of the carbon cycle theory. Lastly, the article identifies current research trends in the vulnerability of the WEFC system that can contribute to the promotion of sustainable urban development. By affirming the objectives and specific targets of Sustainable Development Goal 11, the study highlights areas deserving of sufficient attention, elucidating future research directions. Therefore, in this study; firstly, the vulnerability of the WEFC system in the Yellow River Basin is measured; then, its spatial and temporal dynamics are explored with the help of the Kernel Density Function (KDF), Theil’s index, and spatial autocorrelation analysis. Finally, the main driving factors of WEFC system vulnerability in the Yellow River Basin are explored using a Geodetector model. Decision support and policy recommendations are provided to realize the balanced and coordinated development of regional water resources utilization, energy development, food production, and the carbon cycle system. The research holds the following significant implications, which deserve to be focused on. On the theoretical front, it introduces the concept of vulnerability as a starting point for investigating the WEFC system, expanding the perspective and content of research in the field of WEFC system security. On the practical front, the study concentrates on addressing foundational resource and ecological security issues in the development of the Yellow River Basin. It not only provides decision support and policy recommendations for achieving coordinated and balanced development in regional water resource utilization, energy development, food production, and carbon cycle systems, but also provides practical guidance for optimizing the regional WEFC system resource industry chain and improving ecological protection and development quality in the Yellow River Basin, further achieving integrated resource management and sustainable development, as well as guaranteeing resource security.

2. Construction of Indicator System, Research Methodology, and Data Sources

2.1. Construction of Indicator System

The research on vulnerability has employed various methodological models, including VSD, PSR, DPSIRM, among others. In 2007, Polsky et al. deconstructed system vulnerability into three dimensions: exposure, sensitivity, and adaptability, presenting the VSD model framework [40,41,42]. Exposure refers to the system’s susceptibility to external pressures or shocks, where high exposure implies greater vulnerability. Sensitivity measures the degree to which the system is susceptible to stress, with higher sensitivity indicating greater susceptibility to damage and, consequently, higher vulnerability. Adaptability, on the other hand, refers to the system’s ability to recover from risk-induced damage and return to its initial stable state, with higher adaptability leading to reduced vulnerability. In the context of the Yellow River Basin’s WEFC system, vulnerability exposure is reflected in the consumption of resources and the emission of pollutants associated with socioeconomic development. It is primarily assessed through indicators related to socioeconomic development, resource depletion, and environmental pollution. Sensitivity manifests as the propensity for resources within the water, energy, food, and carbon subsystems to be vulnerable to damage, typically characterized by factors such as resource demand, utilization, and changes. Adaptability is reflected in the reserves of resources, governance efficiency, and investment levels within the water, energy, food, and carbon subsystems. The VSD framework has already been applied in assessing vulnerability in complex systems related to water resources, energy supply, food security, carbon storage, and ecology. Therefore, based on the VSD model, this paper divides the WEFC system into four subsystems: water, energy, food, and carbon. Each subsystem is further divided into the three dimensions: exposure, sensitivity, and adaptability. Drawing on previous research [5,40,43], a total of 50 indicators have been selected to construct the vulnerability assessment index system for the Yellow River Basin’s WEFC system, as presented in Table 1.

2.2. Research Methodology

2.2.1. Measurement Method for WEFC System Vulnerability

After establishing the indicator evaluation system, the entropy method was employed to calculate the weights of various subsystems and indicators within the WEFC system. In contrast to the Analytic Hierarchy Process (AHP), the entropy weighting method is an objective approach to assigning weights. This method determines the weight of each indicator on the basis of its degree of variation, with indicators exhibiting greater variability generally receiving higher weights. The entropy weighting method helps mitigate subjectivity to a certain extent, providing a more objective reflection of the relationships among indicators.
Before assigning weights, the indicators are standardized to ensure uniformity in units or scales, and the original data are subjected to normalization. Indicators are categorized as positive or negative based on their attributes. The steps of the indicator weight calculation refer to Xu Hui et al. [44].
According to the weights obtained through the entropy method, a linear weighting method is applied to compute the vulnerability levels of the WEFC system for 60 cities in the upper, middle, and lower reaches of the Yellow River Basin. The calculation formula is as follows:
W x = j = 1 n w j x i j
E y = j = 1 n w j y i j
F z = j = 1 n w j z i j
C u = j = 1 n w j u i j
where w j is the calculated weight of the indicator, and x i j , y i j , z i j , u i j are the values of the indicators within the water resources, energy, food, and carbon subsystems after being standardized on the basis of their range. W x ,     E y ,     F z ,     C u represent the evaluation indices of the development level of the corresponding subsystems, respectively.

2.2.2. Kernel Density Estimation Method

The kernel density estimation method is a non-parametric approach used to investigate non-equilibrium spatial distribution. Its primary objective is to estimate the probability density of random variables, resulting in a smoothed continuous density curve. By describing and analyzing the location, shape, ductility, and other characteristics of the distribution curve of the research object, it visualizes its dynamic evolution trend and regional differences. Through employing kernel density function plots for WEFC system vulnerability in the Yellow River Basin at different time periods and regions, the dynamic evolutionary processes and absolute differences can be visually displayed. The specific expression is as follows, as shown in Equations (5) and (6):
f x = 1 n h i = 1 n K x i x h
K t = 1 2 π e t 2 2
where f x is the density function of the random variable x , n is the total number of samples, x i represents the observed values of the samples, and h is the bandwidth, which reflects the smoothness and precision of the density curve estimation. K t is the kernel function, which is a weighted or smoothing transformation function. In this study, we employ the Gaussian kernel function.

2.2.3. Theil Index

The Theil index was employed to measure disparities in a particular attribute among regions. It was initially introduced by Theil and others to assess income disparity [45]. Its advantage lies in its ease of decomposition, breaking down the overall differences into inter-group differences and intra-group differences, while also allowing for the calculation of contributions from each part. In this study, a Theil index analysis was applied to the vulnerability of the WEFC system in the Yellow River Basin. This analysis provides insights into the differences among the Yellow River Basin as a whole and its three major regions: upstream, midstream, and downstream. The calculation formula is as follows:
T h e i l = 1 n i = 1 n y i y ¯ ln y i y ¯
where y i represents the WEFC system vulnerability index of the city i , y ¯ is the mean value of vulnerability, and n is the total number of sample cities. The Theil index ranges from 0 to 1, with higher values indicating greater disparities. The overall Theil index can be decomposed into intra-group differences T h e i l W and inter-group differences T h e i l B , as shown in Equation (8), with the calculation formulas for intra-group differences and inter-group differences outlined in Equations (9) and (10).
T h e i l = T h e i l W + T h e i l B
T h e i l W = p = 1 m n p n e ¯ p e ¯ T h e i l P
T h e i l B = p = 1 m n p n e ¯ p e ¯ ln e ¯ p e ¯
where m represents the number of upstream, midstream, and downstream city clusters. n p is the number of cities included in the group p . e ¯ p e ¯ denotes the ratio of the average indicator value for the cities group p to the average indicator value for all cities. T h e i l P is the Theil index for the indicator value differences in the group p . On this basis, contribution rates can be calculated, as demonstrated in Equations (11) and (12).
C R p = n p e ¯ p × T P T h e i l
C R p = T B T h e i l

2.2.4. Spatial Correlation Analysis

The global spatial autocorrelation value can be used to describe the overall distribution of a certain attribute value of a regional unit and reflect the average degree of agglomeration of similar attributes within the region [46]. In this study, global spatial correlation analysis was employed to explore whether there was spatial dependence in the vulnerability of the WEFC system in the Yellow River Basin. Local spatial correlation analysis was applied to identify spatial clustering characteristics among cities. The calculation formulas for the global Moran’s Index (Equations (13) and (14)) are as follows:
I g l o b a l = n i = 1 n j = 1 n w i j x i x ¯ x j x ¯ i = 1 n j = 1 n w i j i = 1 n x i x ¯ 2
The formula for calculating the local Moran index is as follows:
I l o c a l = x i x ¯ 1 n i = 1 n x i x ¯ 2 j = 1 n w i j x i x ¯
where x i and x j represent the vulnerability values of spatial regions i and j . x ¯ is the mean vulnerability value across all regions. w i j is the spatial weight matrix between regions. n is the total number of cities (60 cities in this case). The range of I g l o b a l values is [−1, 1]. I g l o b a l > 0 indicates a positive global spatial correlation in the data, with larger values indicating stronger spatial correlation. I g l o b a l < 0 indicates a negative global spatial correlation, with smaller values indicating greater spatial differences. I g l o b a l = 0 indicates random data distribution. The results of I l o c a l can be visually presented using LISA cluster maps, classifying regions into High-High (HH), High-Low (HL), Low-High (LH), and Low-Low (LL) clusters, indicating positive, negative, and no spatial correlation patterns based on the vulnerability levels of the regions and their neighbors.

2.2.5. Geodetector Model

The Geodetector is a statistical method used to detect spatial heterogeneity and analyze driving factors. The main idea is to determine whether there is spatial heterogeneity of geographic elements by comparing the magnitude of the sum of the overall variance of the study area and the variance of the sub-area, and to reveal the driving force that causes spatial heterogeneity of the dependent variable by detecting whether the spatial distributions of the independent variable and the dependent variable have similarity [47].
In this paper, we used the factor detection tool and interaction detection tool in Geodetector to identify the driving factors of the dynamic evolution process of the vulnerability of the WEFC system in the Yellow River Basin. Among them, factor detection mainly used the q statistic to express the strength and significance of different driving factors to explain the spatial heterogeneity of the vulnerability of the WEFC system in the Yellow River Basin, and then to judge the influence degree of the factor on the vulnerability heterogeneity of the WEFC system in the Yellow River Basin. The calculation formulas are as follows (Equations (15)–(17)):
q = 1 h = 1 L N h σ h 2 N σ 2
S S W = h = 1 L N h σ h 2
S S T = N σ 2
where h denotes the stratification of variable Y or factor X , also called classification or partitioning, with a total of L layers. N and N h represent the overall sample size of the study area and the sample size of the h layer, respectively. σ 2 and σ h 2 denote the variance of Y values in the study area and the h layer, respectively. The value of q is in the range of [0, 1], and the stronger the explanation of the spatial dissimilarity of Y is, the stronger the explanation of X on Y is. Equations (16) and (17) are the within-stratum sum of squares ( S S W ) and the region-wide total squares ( S S T ), respectively.
The interaction detector is used to explore the interactions between different influencing factors. It determines whether the interaction between two influencing factors, X 1 and X 2 , strengthens or weakens their combined explanatory power on the dependent variable Y .
The judgment criteria are presented in Table 2 below.

2.3. Data Sources

The study period for this research spanned from 2010 to 2019. A total of 60 cities in the Yellow River Basin (across 9 provinces) were selected to constitute the study area, while some cities with significant data gaps were excluded [45,48]. The data were mainly obtained from the Statistical Yearbook of Chinese Cities (2010–2019), statistical yearbooks of provinces (autonomous regions), and prefectural-level cities (the data were obtained from the official websites of the statistical bureaus belonging to various administrative regions). Water resources data were sourced from the “Water Resources Bulletin” for each province and city spanning from 2010 to 2019, as well as from the “Statistical Yearbook (2010–2019)” of various provinces and cities. Energy-related data were acquired from the “China Energy Statistical Yearbook” and the “Statistical Bulletin of National Economic and Social Development (2010–2019)” for each city. Urban carbon emissions and carbon sequestration data were based on relevant literature [49,50,51] from 1997 to 2017. Other than that, the time series model was optimally selected using the SPSS expert modeler, and was finally predicted by the ARIMA model and the Brownian model, with the goodness of fit exceeding 97.5%. Furthermore, it should be noted that some data that could not be obtained directly were gained by calculation, and the missing data for other individual years were completed by linear interpolation.

3. Results and Analysis

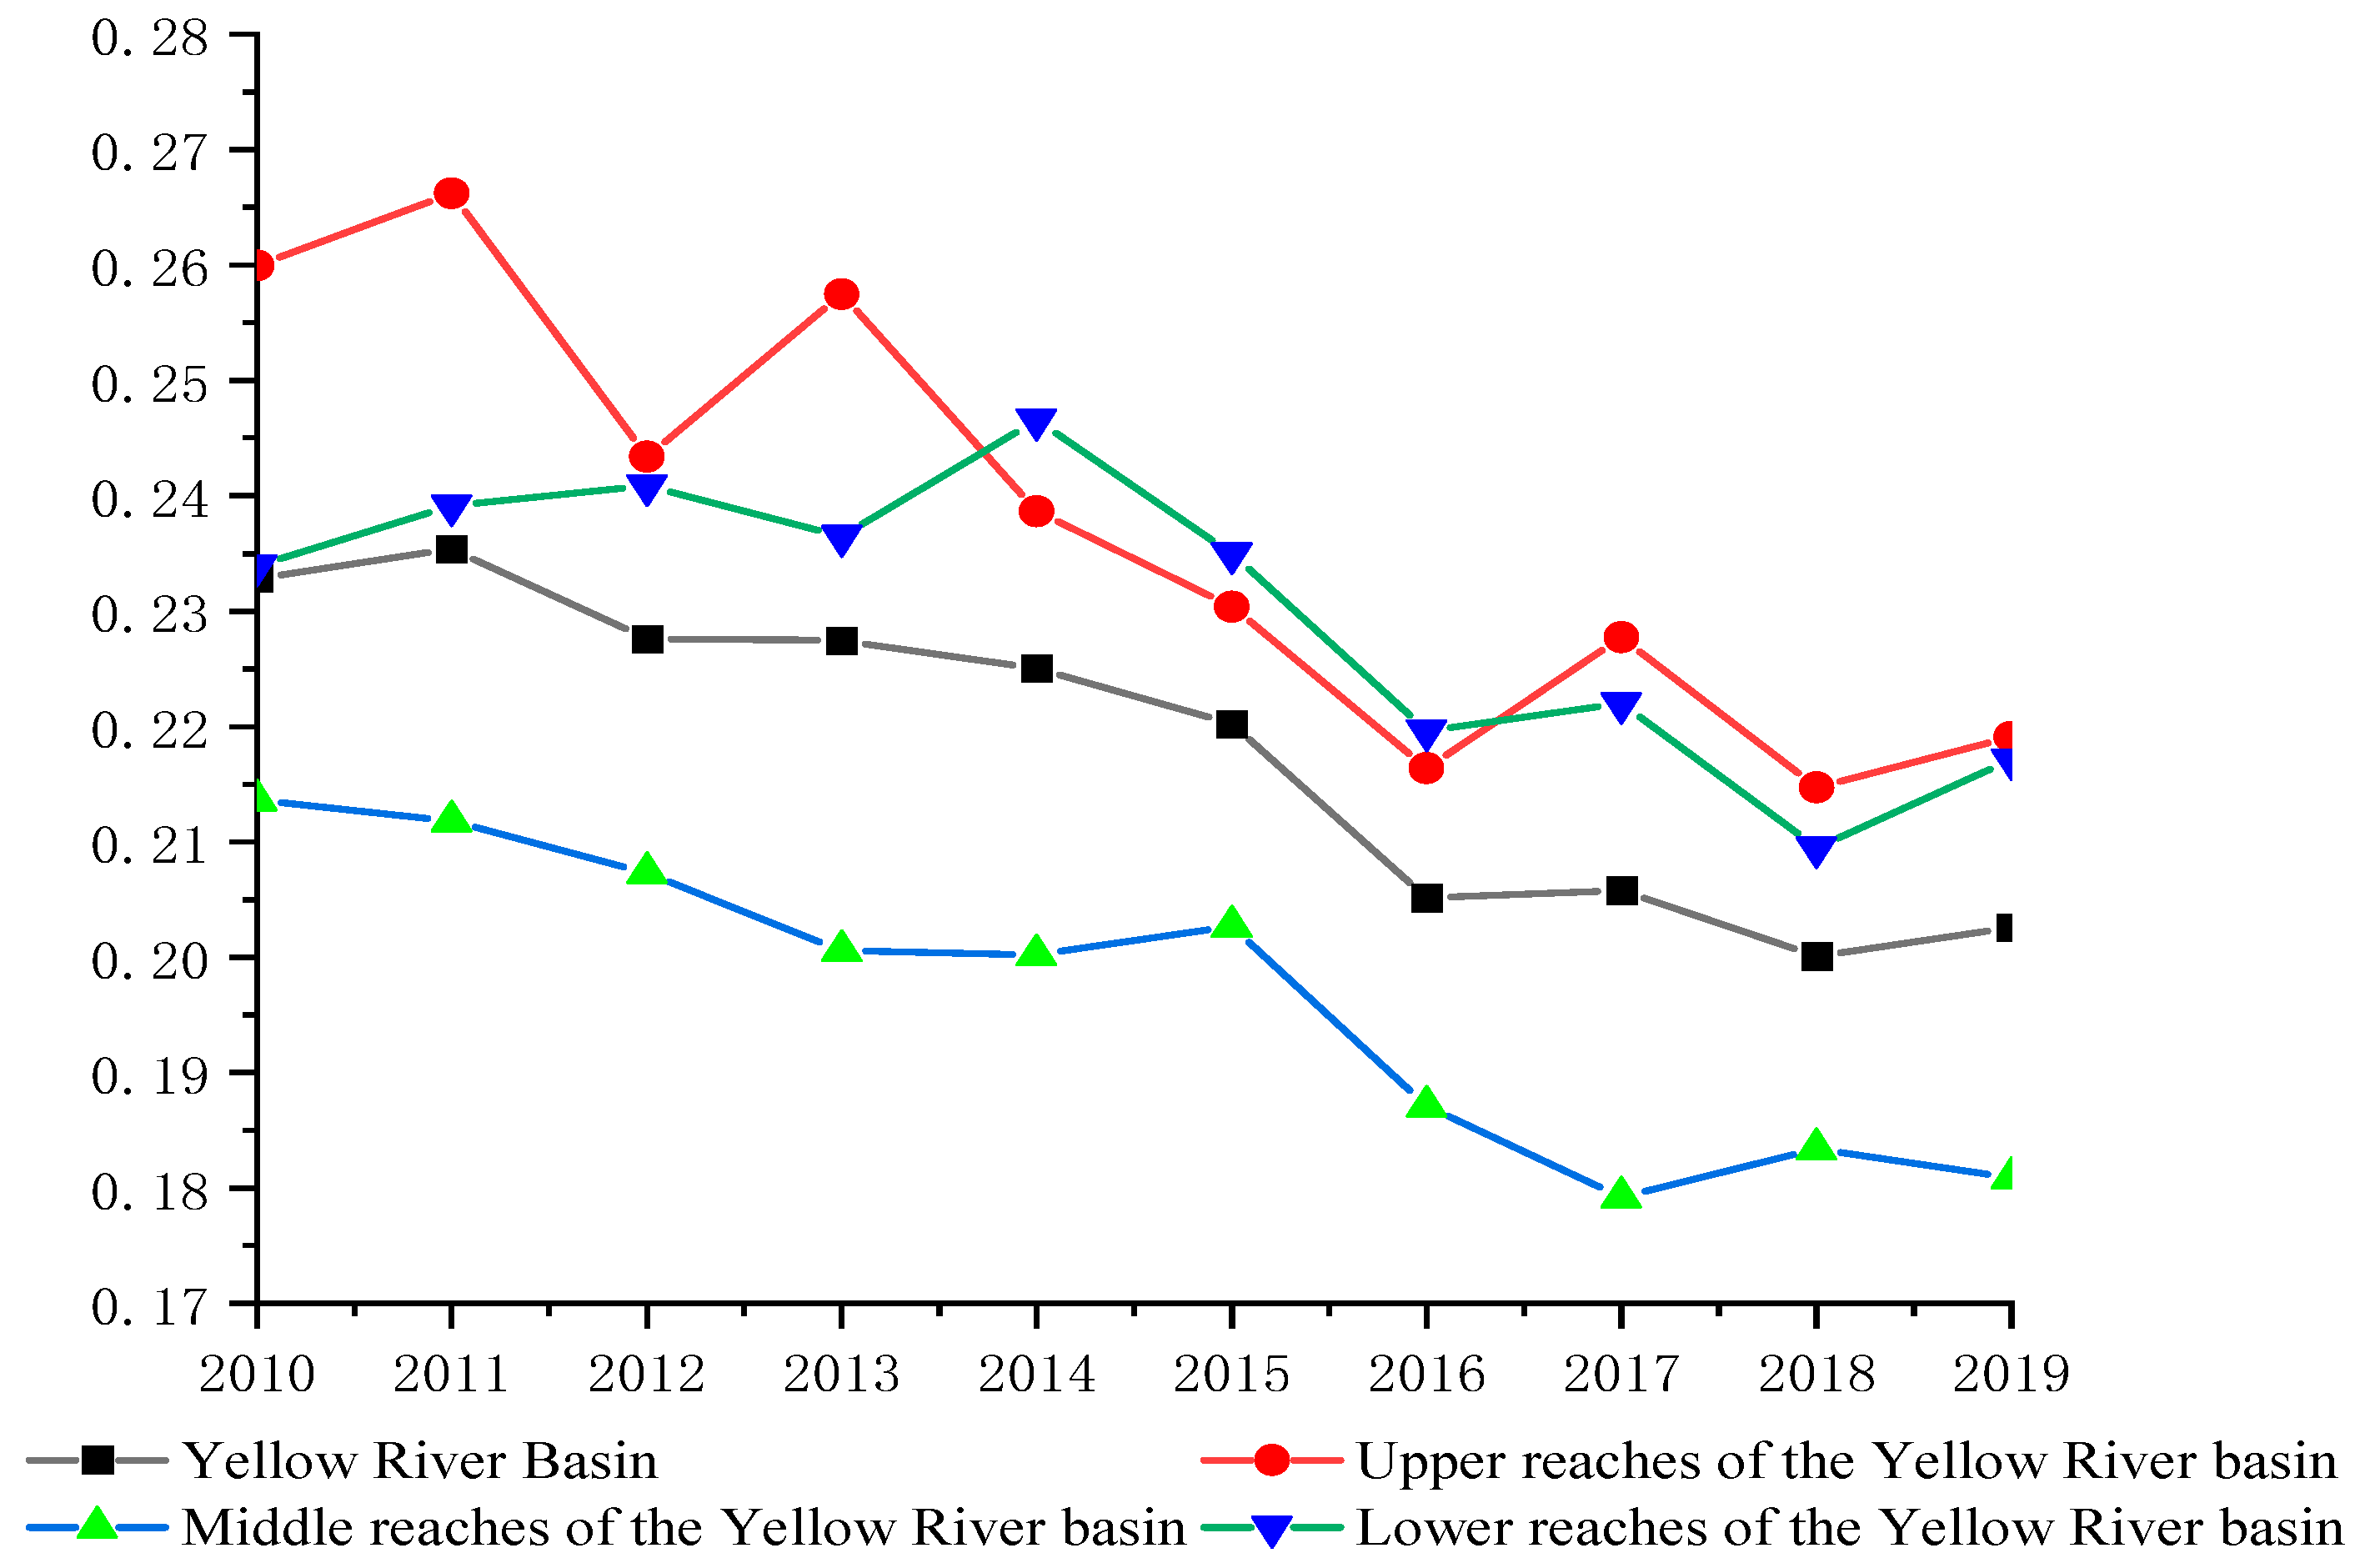
3.1. Overall Variation Characteristics of the WEFC System Vulnerability in the Yellow River Basin

Temporal Variations in WEFC System Vulnerability in the Yellow River Basin

The Yellow River Basin was divided into three major regions: upper, middle, and lower reaches. The vulnerability levels of the WEFC system in the Yellow River Basin and its upper, middle, and lower regions from 2010 to 2019 were assessed (Figure 1). The results revealed the following trends: The overall vulnerability of the WEFC system in the Yellow River Basin presented a gradual decrease over the study period, except for slight increases in 2011, 2017, and 2019, with an average annual decline rate of 1.4%. Obviously, a reduction in the vulnerability of the WEFC system in the Yellow River Basin during the study period is revealed. The upper reaches area fluctuates from 0.2599 to 0.2191, with an annual average decline rate of 1.7%, and the overall vulnerability is higher than that of the Yellow River Basin as a whole. It also displayed the greatest annual decline rate and relatively high fluctuations, indicating the significant but instable improvement in system vulnerability. The middle reaches region, with a decline from 0.2136 to 0.1809 at a rate of 1.65%, showed the second highest decline rate after the upper reaches region. However, it exhibited lower fluctuations, implying obvious and stable improvement in system vulnerability. Moreover, the vulnerability levels in this region were consistently lower than those of the entire Yellow River Basin, implying that the middle reaches region demonstrated effective interactions in water, energy, grain, and carbon cycles within the basin. The lower region, with a decline from 0.2339 to 0.2171 at a rate of 0.7%, was featured with a fluctuating trend. Its vulnerability levels were consistently higher than those of the entire Yellow River Basin, revealing poor interactions in water, energy, grain, and carbon systems that remained unresolved. In general, the vulnerability level of the WEFC system in the Yellow River Basin in 2010–2013 was upper reaches > lower reaches > Yellow River Basin > middle reaches, whereas that in 2014–2016 was lower reaches > upper reaches > Yellow River Basin > middle reaches, and that in 2017–2019 was upper reaches > lower reaches > Yellow River Basin > middle reaches. The complex geographical location and resource endowment of the upper reaches region pose numerous challenges to its water, energy, grain, and carbon system development. Issues, such as water scarcity in Gansu and energy resource overexploitation in Inner Mongolia, need to be addressed to optimize the vulnerability of the WEFC system. The middle reaches region, with relatively abundant resources, has concentrated on ecological restoration alongside resource exploitation in recent years, resulting in lower vulnerability. The lower region, a major grain-producing area with a high population density, exhibits a high demand for resources and energy, causing elevated pollution and emissions from industrial and agricultural activities, causing higher vulnerability in the WEFC system.

3.2. Spatial Evolution Characteristics of WEFC System Vulnerability in the Yellow River Basin

3.2.1. Spatial Pattern Analysis of WEFC System Vulnerability in the Yellow River Basin

In this study, a dataset in 10 years from 2010 to 2019 was employed. The natural breaks method in ArcGIS was used to classify WEFC vulnerability values of 60 cities in the upper, middle, and lower reaches regions of the Yellow River Basin into five levels, denoted as Levels I to V, ranging from low to high vulnerability. Then, spatial visualization was conducted to generate a map depicting the spatial distribution of vulnerability (Figure 2). The spatial features exhibited an overall trend characterized by higher vulnerability at both ends and lower vulnerability in the middle. The average WEFC system vulnerability assessment results for the upper reaches, middle reaches, and lower reaches regions of the Yellow River Basin over the 10-year period are presented below: the upper reaches region 0.2599, 0.2662, 0.2434, 0.2574, 0.2386, 0.2304, 0.2164, 0.2277, 0.2147, and 0.2191; the middle reaches region 0.2136, 0.2118, 0.2073, 0.2006, 0.2002, 0.2027, 0.1871, 0.1792, 0.1834, and 0.1809; the lower reaches region 0.2339, 0.2391, 0.2409, 0.2365, 0.2466, 0.2350, 0.2196, 0.2220, 0.2095, and 0.2171. From the following figure, it can be observed that the spatial pattern of vulnerability in the upper reaches region is more active in terms of evolution, which is consistent with the results of previous time-series change characteristics, and that its vulnerability has experienced fluctuating changes of rising to declining to rising to declining. Conversely, the middle reaches region displayed a relatively stable spatial pattern of WEFC system vulnerability, consistently maintaining a moderate or lower vulnerability level. The vulnerability level of the WEFC system in the lower reaches region remains at a high level after going through the process of rising-falling-rising change.
From the spatial distribution characteristics, there is obvious regional heterogeneity in the vulnerability of the WEFC system in the upper reaches, middle reaches, and lower reaches regions of the Yellow River. In the upper reaches of the Yellow River, a pronounced polarization was evident. Within this region, low vulnerability accounts for 20.6%; lower, moderate, and higher vulnerability possess 14.7%, 17.6%, and 14.7%, respectively; and high vulnerability has the highest percentage of 32.4%. Specifically, cities including Yinchuan, Shizuishan, Wuzhong, and Bayan Nur exhibited stable high vulnerability, while those like Dingxi, Longnan, and Guyuan consistently maintained a low vulnerability status. From the 10-year trend concerning the evolution of spatial pattern of vulnerability, Xining in Qinghai, Lanzhou, Baiyin, and Wuwei in Gansu are characterized with fluctuating and decreasing vulnerability. Zhongwei in Ningxia, and Hohhot, Baotou, Wuhai, Ordos, and Ulanqab in Inner Mongolia, have more active evolutionary representations, basically experiencing the process of rising to declining to rising to declining and, by 2019, except for Ordos and Ulanqab, which possess lower or low vulnerability, the other cities in Inner Mongolia were in moderate and above moderate vulnerability. Moving to the middle reaches region, apart from the provincial capital cities of Xi’an and Taiyuan and the coal city of Jiaozuo, which have been in a higher degree of vulnerability for many years, all the other cities enjoyed a moderate and below moderate degree of vulnerability all year round. Cities in Gansu, including Tianshui, Pingliang, Qingyang, and Yan’an, had consistently low vulnerability levels. In the overall middle reaches, the proportions of low and lower vulnerability were 26.8% and 33.2%, accordingly, while moderate vulnerability occupied 24.8%. Higher and high vulnerability levels comprised 14.8% and 0.4%, respectively. In the lower region, spanning Henan and Shandong provinces, no cities exhibited low vulnerability. Lower vulnerability covered 19.4%, while moderate and higher vulnerability were roughly equal at 37.2% and 37.8%, respectively. In addition, high vulnerability accounted for only 5.6%. It can be observed that the lower reaches region of the city presents a medium and higher vulnerability degree, “clustering” obvious characteristics. Among them, Zhengzhou in Henan consistently witnessed high vulnerability over several years, with a fluctuation trend between high and higher vulnerability. Although its vulnerability has a decreasing trend, it still maintains at a high level. In addition, Anyang and Xinxiang in Henan Province and Jinan and Qingdao in Shandong Province have maintained higher vulnerability for over 5 consecutive years.
In summary, the vulnerability degree of the WEFC system varied in the upper reaches, middle reaches, and lower reaches regions of the Yellow River Basin. The upper reaches areas of Xining in Qinghai, Lanzhou, and Baiyin in Gansu shifted from moderately high vulnerability to lower vulnerability and remained stable around 2017, and Wuwei changed from moderate vulnerability to lower vulnerability and stabilized in 2012. By contrast, Hohhot, Baotou, and Wuhai in Inner Mongolia had an upward trend in vulnerability in 2011 and 2017, and remained in a state of moderately high vulnerability in 2019, with a significant deterioration compared to the moderately low vulnerability in 2010. Erdos eventually stabilized at a lower vulnerability level after a rise in 2011 and a fall in 2016. Since 2015, Ulanchab has entered the low vulnerability and maintained stable vulnerability. In upper reaches, the high vulnerability areas decreased, with some cities in Inner Mongolia being critical areas of unstable vulnerability. In Ningxia, Yinchuan, Shizuishan, Wuzhong, and Zhongwei were focal points of high vulnerability. In the middle reaches region, Shaanxi’s Tongchuan and Baoji shifted from lower vulnerability to low vulnerability in 2017, although they fluctuated slightly in 2018 but stabilized at low vulnerability in 2019. Xianyang, Weinan, and Yulin changed from moderate vulnerability in 2017 to higher vulnerability in 2018, and ultimately stayed at lower vulnerability in 2019. Datong shifted from moderate to lower vulnerability in 2015 and stabilized. Yangquan, Changzhi, Yuncheng, and Luoyang had no change in moderate vulnerability after fluctuating from low vulnerability to moderate vulnerability. Jincheng, Shuozhou, Jinzhong, and Sanmenxia were perennially in a state of lower and low vulnerability and were basically stable at low vulnerability after 2017. Xinzhou, Linfen, and Lvliang experienced a lower-moderate-higher-lower vulnerability shift around 2015. The middle reaches, as a whole, have fewer high-value areas and vulnerability has changed to lower vulnerability over time. In the lower region, Hebi transitioned from lower vulnerability in 2014 to moderate vulnerability, then back to lower vulnerability in 2015, maintaining stability thereafter. Shangqiu was situated in lower vulnerability in 2011, 2017, and 2019, while, in other years, it mostly exhibited moderate vulnerability; however, there was an overall trend towards lower vulnerability. Taian consistently maintained a state of lower vulnerability. In the region, Xinxiang and Puyang changed from moderate vulnerability in around 2014 to higher vulnerability, returning to moderate vulnerability in 2019. Cities like Zibo, Dongying, Weifang, and Jining varied from higher vulnerability to moderate vulnerability in 2017. Dezhou, Liaocheng, Binzhou, and Heze experienced a change from moderately low vulnerability to moderately high vulnerability, to moderate vulnerability. In terms of the lower reaches area, as a whole, the high value area shows a stable state after fluctuation, and moderate vulnerability becomes the norm.

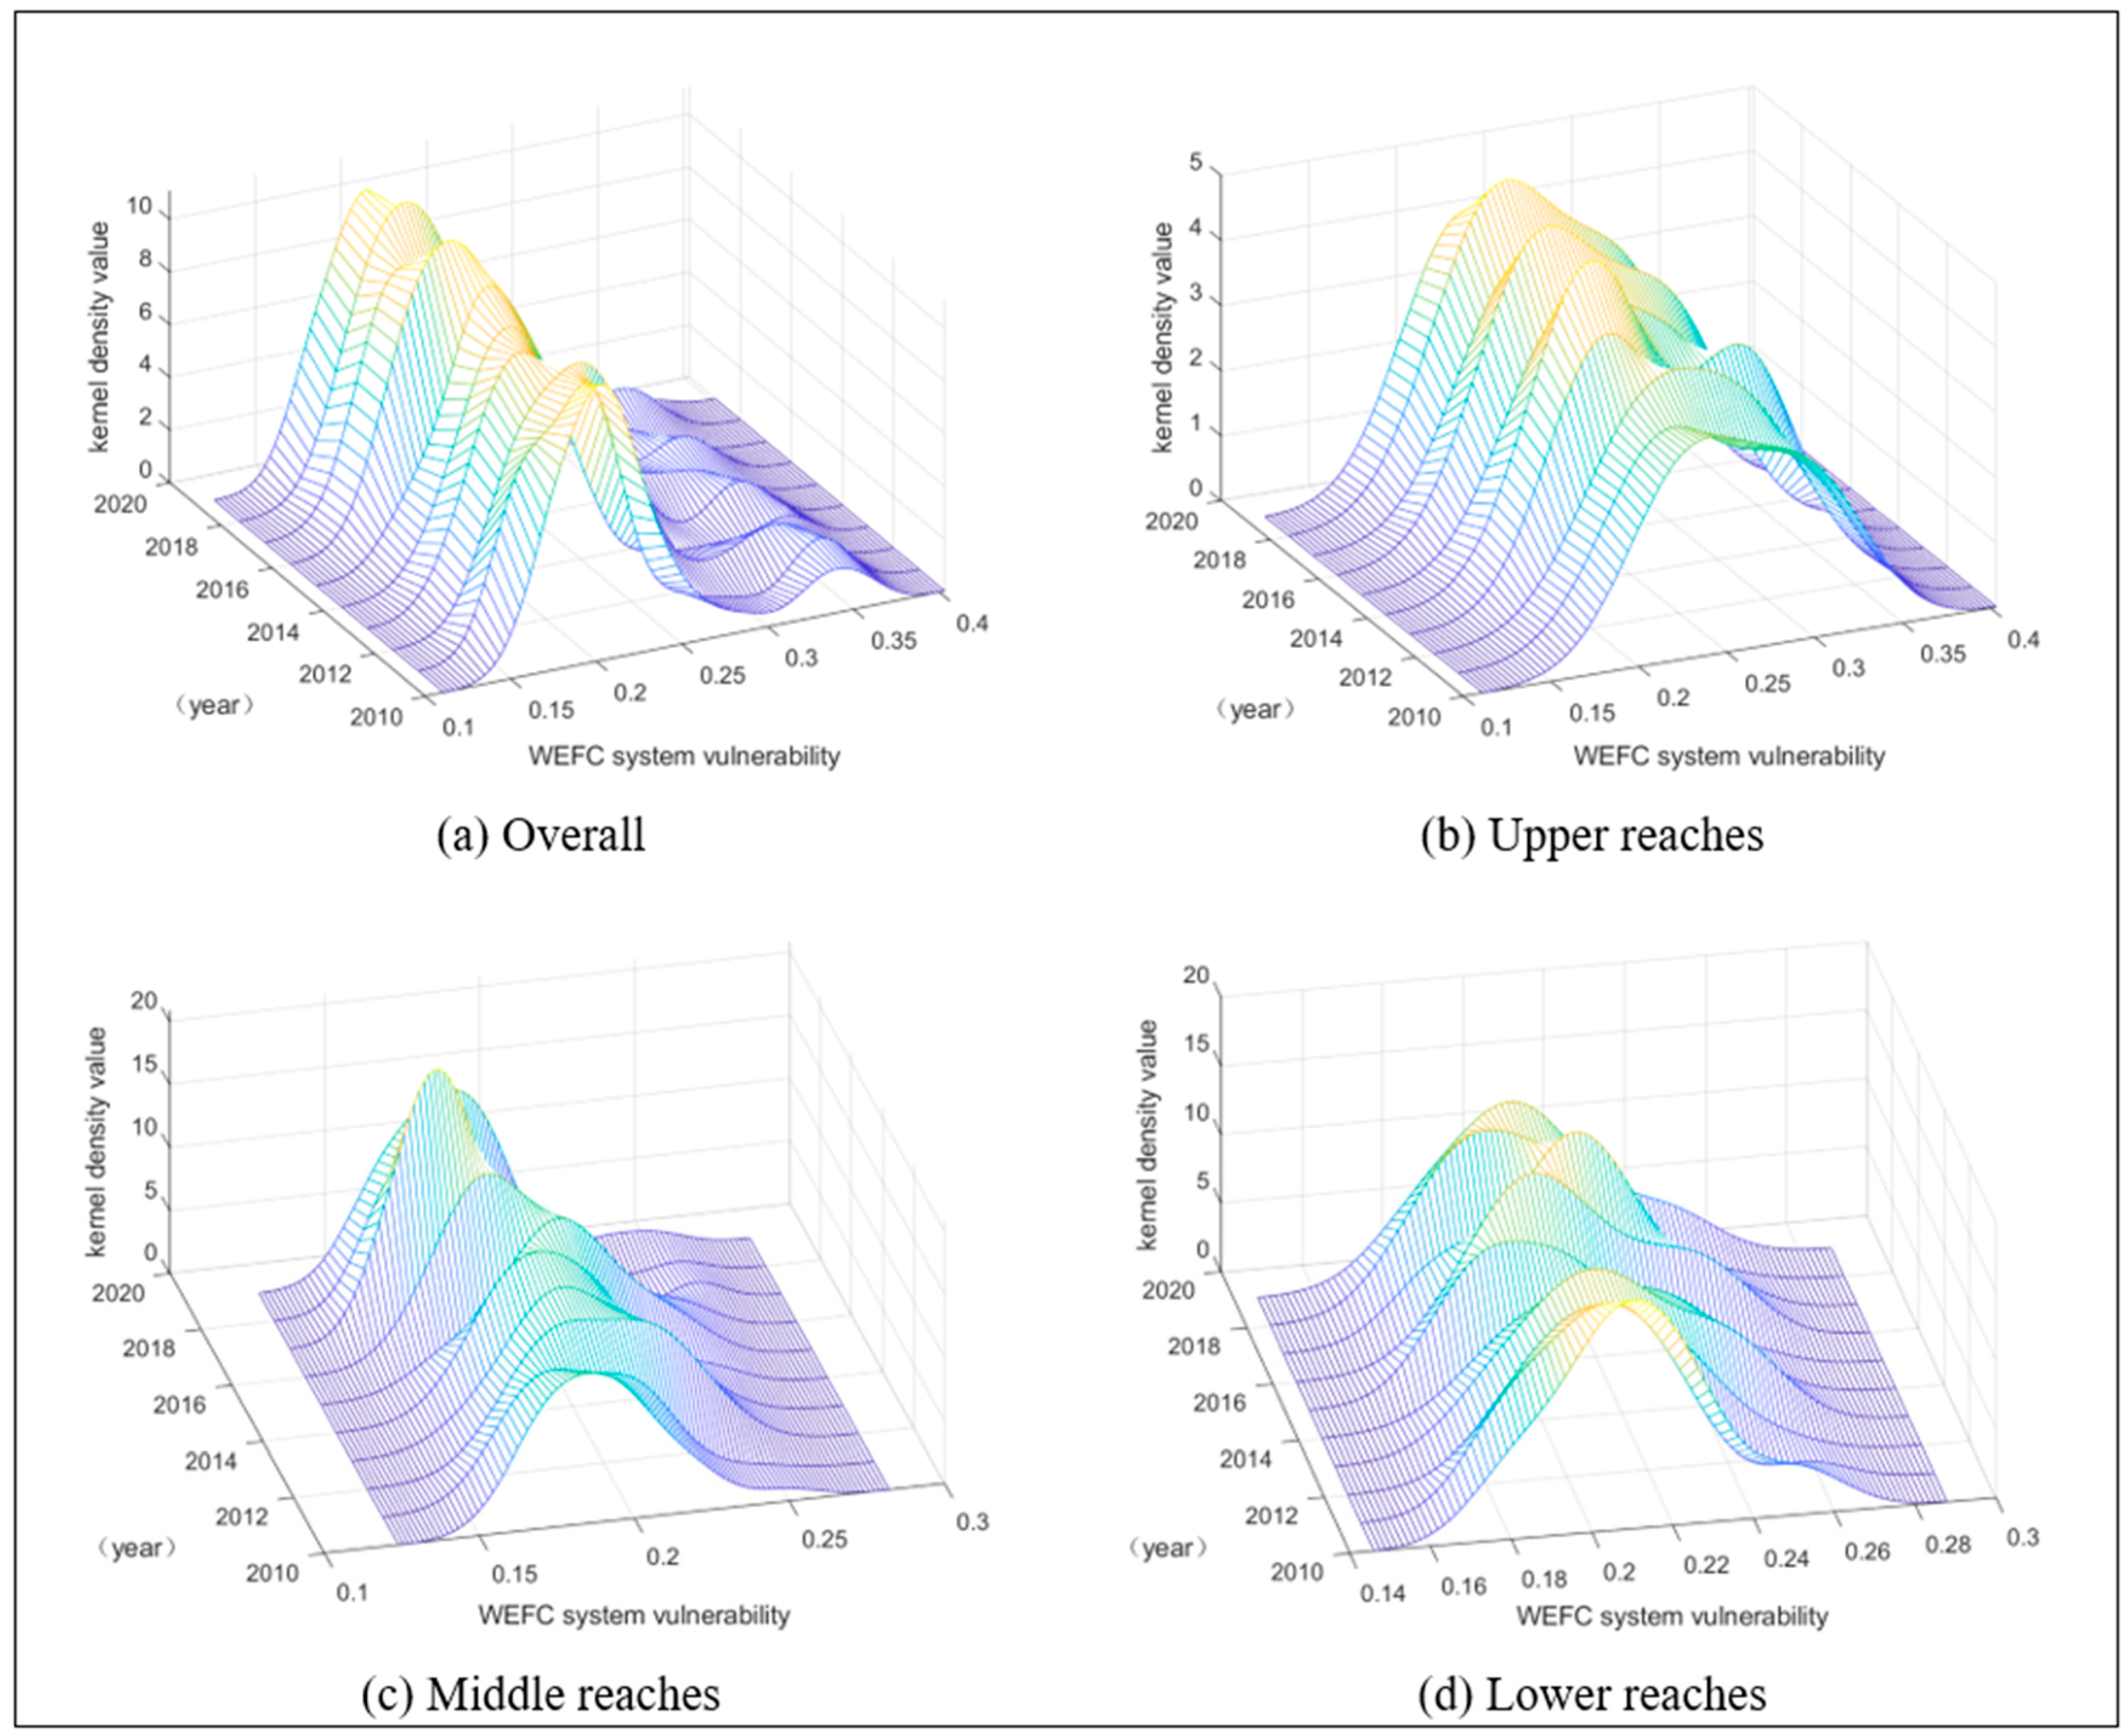
3.2.2. Dynamic Evolution Trends of WEFC System Vulnerability in the Yellow River Basin

The kernel density estimation method was employed to depict the overall shape and dynamic evolution law of the vulnerability of the WEFC system in the Yellow River Basin as a whole and in the upper reaches, middle reaches, and lower reaches regions of the region, including the distribution location, distribution trend, distribution extensibility, and polarization trend. The results are shown in Figure 3 below. From the distribution position, the main peak positions of WEFC system vulnerability in the overall Yellow River Basin and in the upper reaches, middle reaches, and lower reaches regions have presented a general leftward shift trend, which is in line with the declining vulnerability trends observed in previous calculations. Specifically, the distribution of WEFC system vulnerability in the Yellow River Basin has experienced fluctuations shifting to the left. For example, in 2012, it moved from right to left and, in 2016, it shifted from right to left again. In the upper reaches, the leftward shift began in 2012, while in the middle reaches, it started shifting from right to left in 2016. The lower reaches moved to the right after shifting to the left from 2015, and then turned to the left in 2017. The overall trends in WEFC system vulnerability in the Yellow River Basin and the upper reaches, middle reaches, and lower reaches regions are generally consistent, all moving leftward over time, revealing that WEFC system’s vulnerability levels in the Yellow River Basin reduced. From the distribution pattern of the main peak, the height and width of the main peak of the distribution curve of the Yellow River Basin as a whole and of the middle reaches and lower reaches show the characteristics of the stage peak increasing and the width decreasing. In this case, a decreasing trend in the dispersion of WEFC system vulnerability in the overall Yellow River Basin is indicated, with spatial differences tending to diminish. However, in the upper reaches, the spatial differences in WEFC system vulnerability have been inclined to increase. From the aspect of distribution extensibility, the vulnerability of the WEFC system in the Yellow River Basin as a whole and in the upper reaches, middle reaches, and lower reaches regions has exhibited the phenomenon of dragging the tail to the right, especially in the whole Yellow River Basin, which is obvious, demonstrating that there are cities with greater vulnerability within the region as a whole. From the polarization trend, there is always only one main peak in the overall distribution, manifesting a unipolar phenomenon. However, for the number of peaks, the middle reaches, and lower reaches of the Yellow River Basin have transitioned from a “one-main peak–two peaks” pattern to a “single peak” pattern over the study period, which suggests the presence of gradient effects and differentiation trends in the early stages of the study period, with a subsequent reduction in differentiation in WEFC system vulnerability towards the later period.

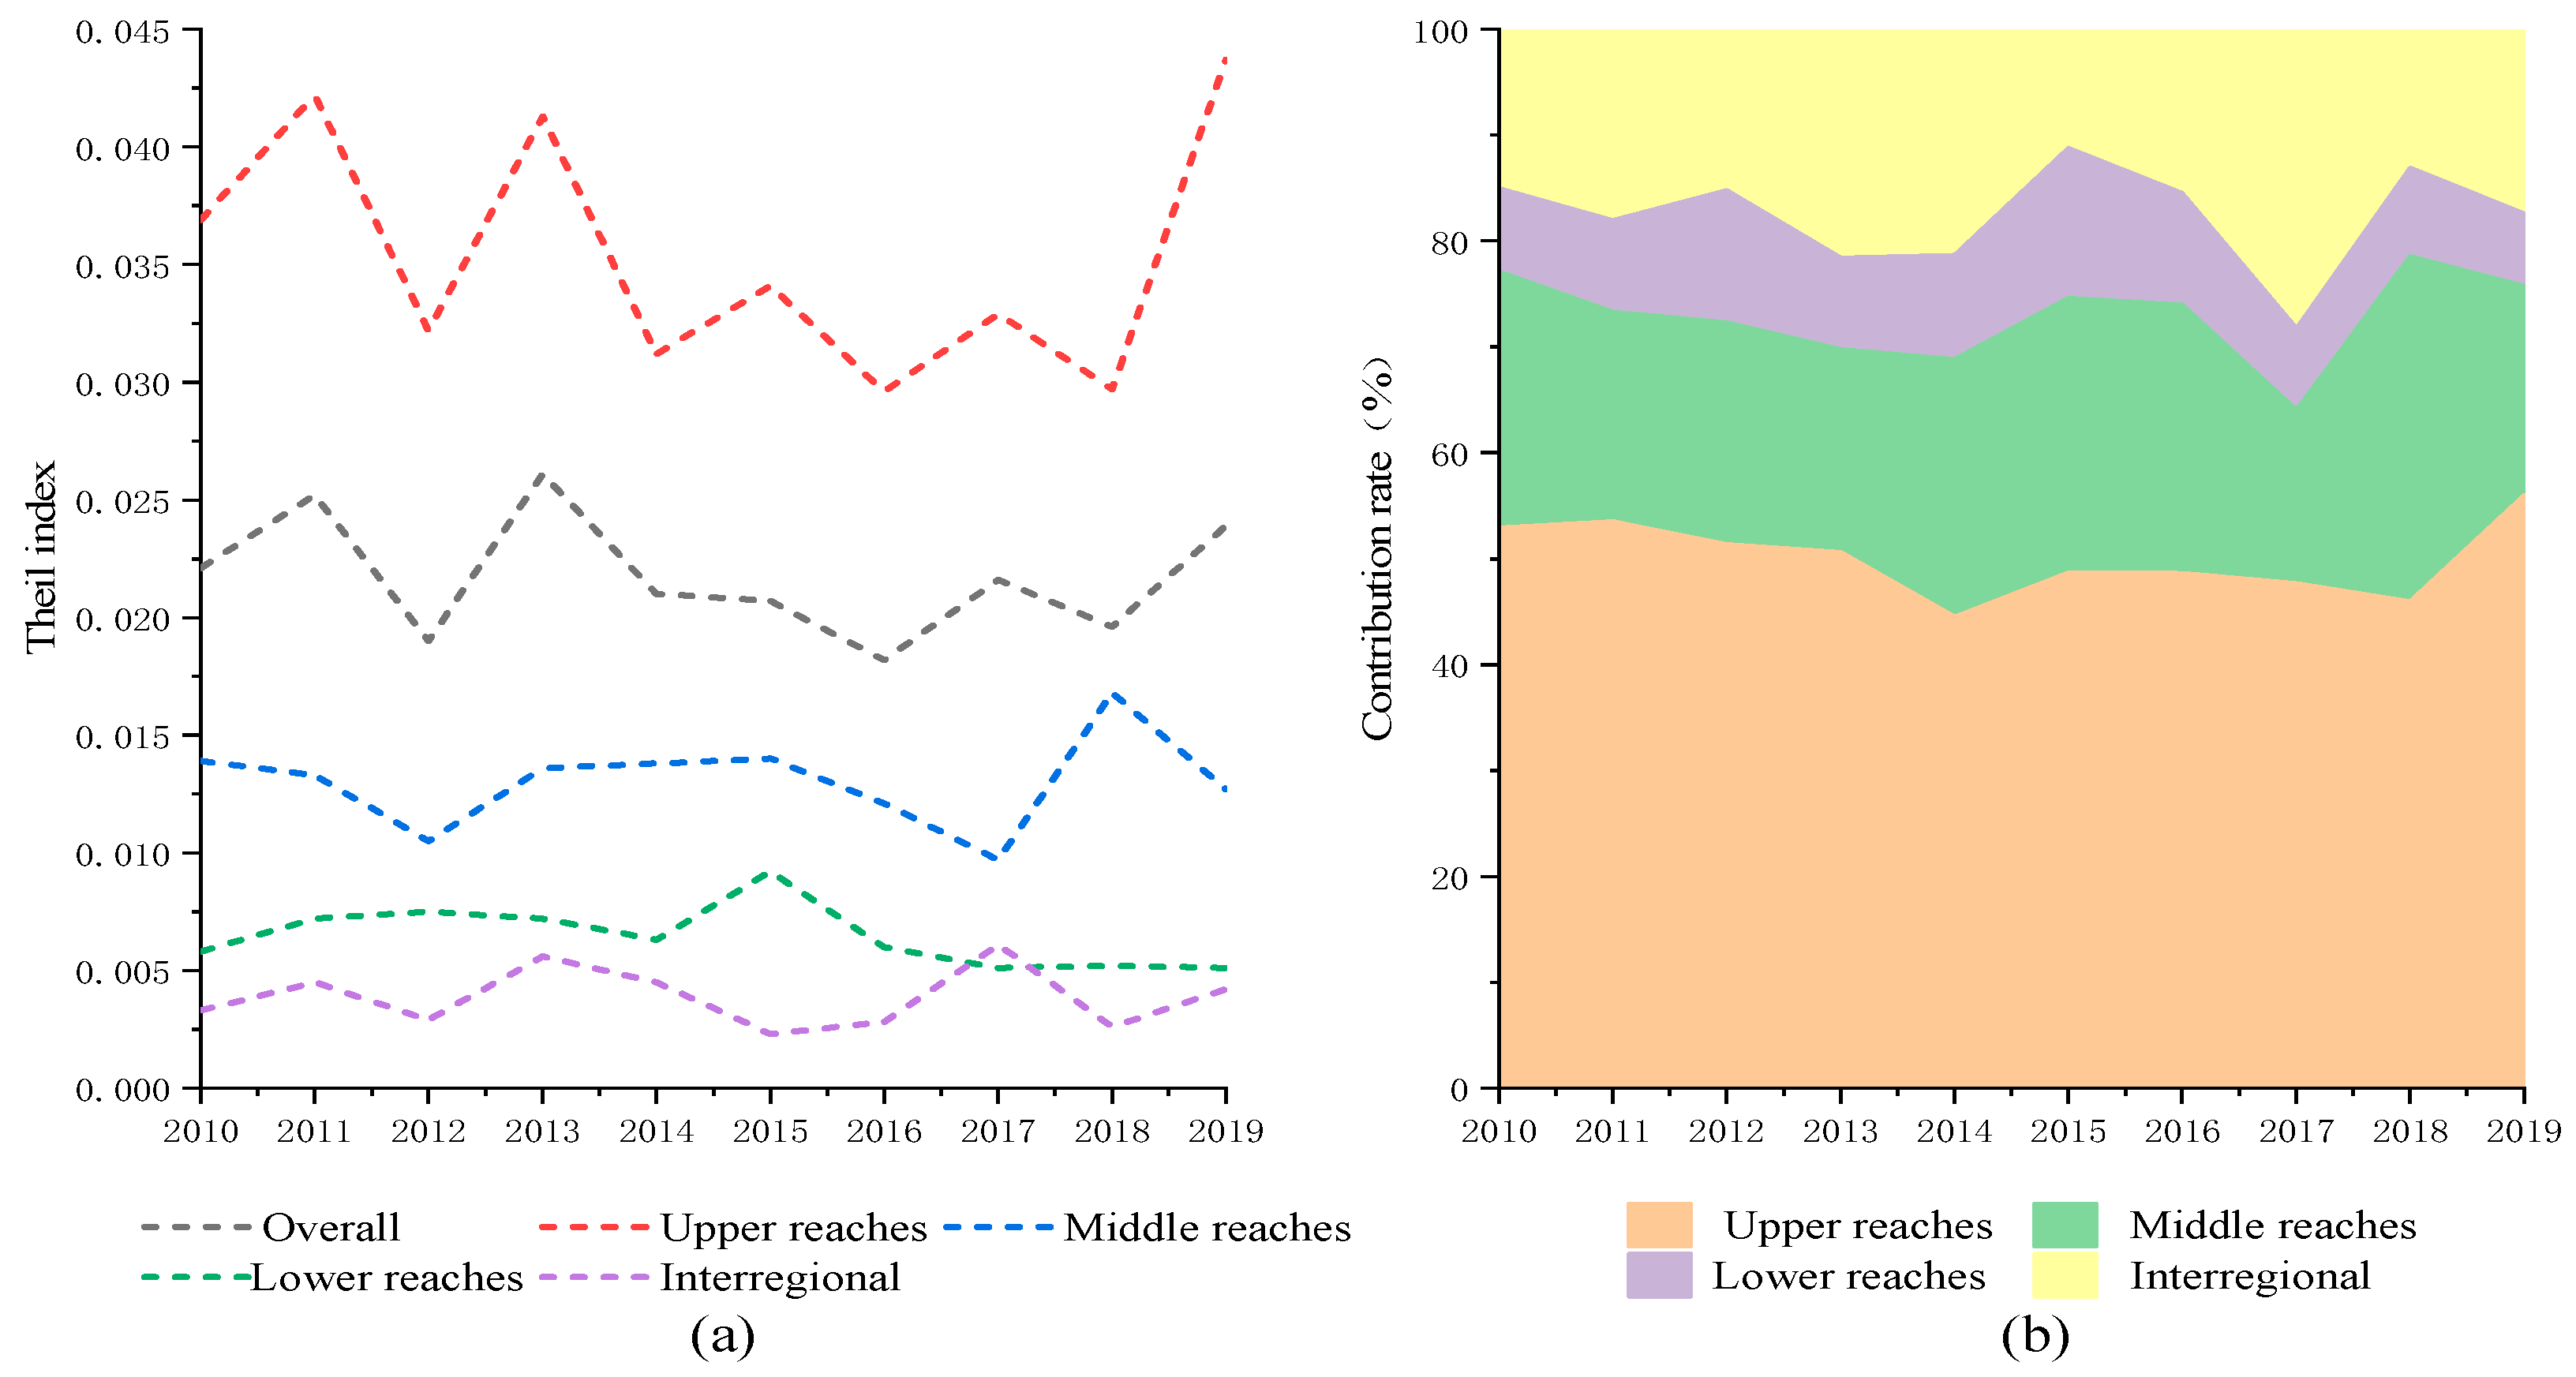
3.2.3. Spatial Disparities in WEFC System Vulnerability in the Yellow River Basin

The regional differences in WEFC system vulnerability in the Yellow River Basin as a whole and in the three major regions of the upper reaches, middle reaches, and lower reaches regions are analyzed using the Theil index. The overall differences, intra-regional differences, inter-regional differences, and their contribution rates of WEFC system vulnerability in the Yellow River Basin are calculated according to the formulae. Figure 4a illustrates the evolving trends of inter-regional and intra-regional disparities in WEFC system vulnerability in the upper reaches, middle reaches, and lower reaches regions of the Yellow River Basin from 2010 to 2019. Figure 4b depicts the contributions of inter-regional and intra-regional disparities in WEFC system vulnerability in the upper reaches, middle reaches, and lower reaches regions of the Yellow River Basin to the overall regional WEFC system vulnerability disparity from 2010 to 2019. Evidently, there is a noticeable overall disparity in WEFC system vulnerability across the Yellow River Basin regions. However, this value fluctuates around 0.02 annually. The overall Theil index started at 0.0221 in 2010, reaching fluctuating high points in 2011 and 2013, and low points in 2012, 2016, and 2018. This reveals that this disparity has persisted over the years without improvement. Furthermore, from the perspective of the difference structure, the differences in the vulnerability of the WEFC system in the Yellow River Basin during the study sample period are mainly intra-regional ones, with a contribution rate almost that stays above 70%, and even the contribution rate of intra-regional differences in 2015 was as high as 88.83%, indicating that there is a large gap in the vulnerability of the WEFC system within the Yellow River Basin region. In terms of the upper reaches, middle reaches, and lower reaches regions of the Yellow River Basin, the internal disparities in the upper reaches are significantly higher than those in the entire basin and in the middle reaches and lower reaches, which implies substantial imbalances in WEFC system vulnerability in the upper reaches and the largest contribution to the overall regional WEFC system vulnerability disparity. The trends in the Theil index for the upper reaches closely mirror those of the overall Yellow River Basin, making them a significant factor affecting overall regional disparities. The Theil index values for the middle reaches and lower reaches are relatively close to each other and lower than that of the entire basin. In the upper reaches, the contribution rate to intra-regional disparity fluctuates between 45% and 60%, followed by the middle reaches, except for a larger contribution rate of 32.62% in 2018, mainly fluctuating between 15% and 30%. The lower reaches are characterized by the smallest contribution rate, changing between 6% and 15%, reaching only 6.84% in 2019. The intra-regional differences of the upper reaches region during the period 2010–2019 featured rising to falling to rising to falling, after which there is an upward trend, while the internal differences of the middle reaches and lower reaches exhibit a fluctuating downward trend. The differences in geographical location, resource endowments, economic development levels, and urban infrastructure among cities in the upper reaches, middle reaches, and lower reaches regions contribute to these regional disparities. The huge difference within the upper reaches region mainly results from the fact that some cities in Gansu and Ningxia are economically closed and resource-poor, whereas several cities in Inner Mongolia are resource-rich and economically developed. By contrast, the middle reaches and lower reaches have densely populated cities, with similar economic development and resource distribution, resulting in smaller internal disparities.

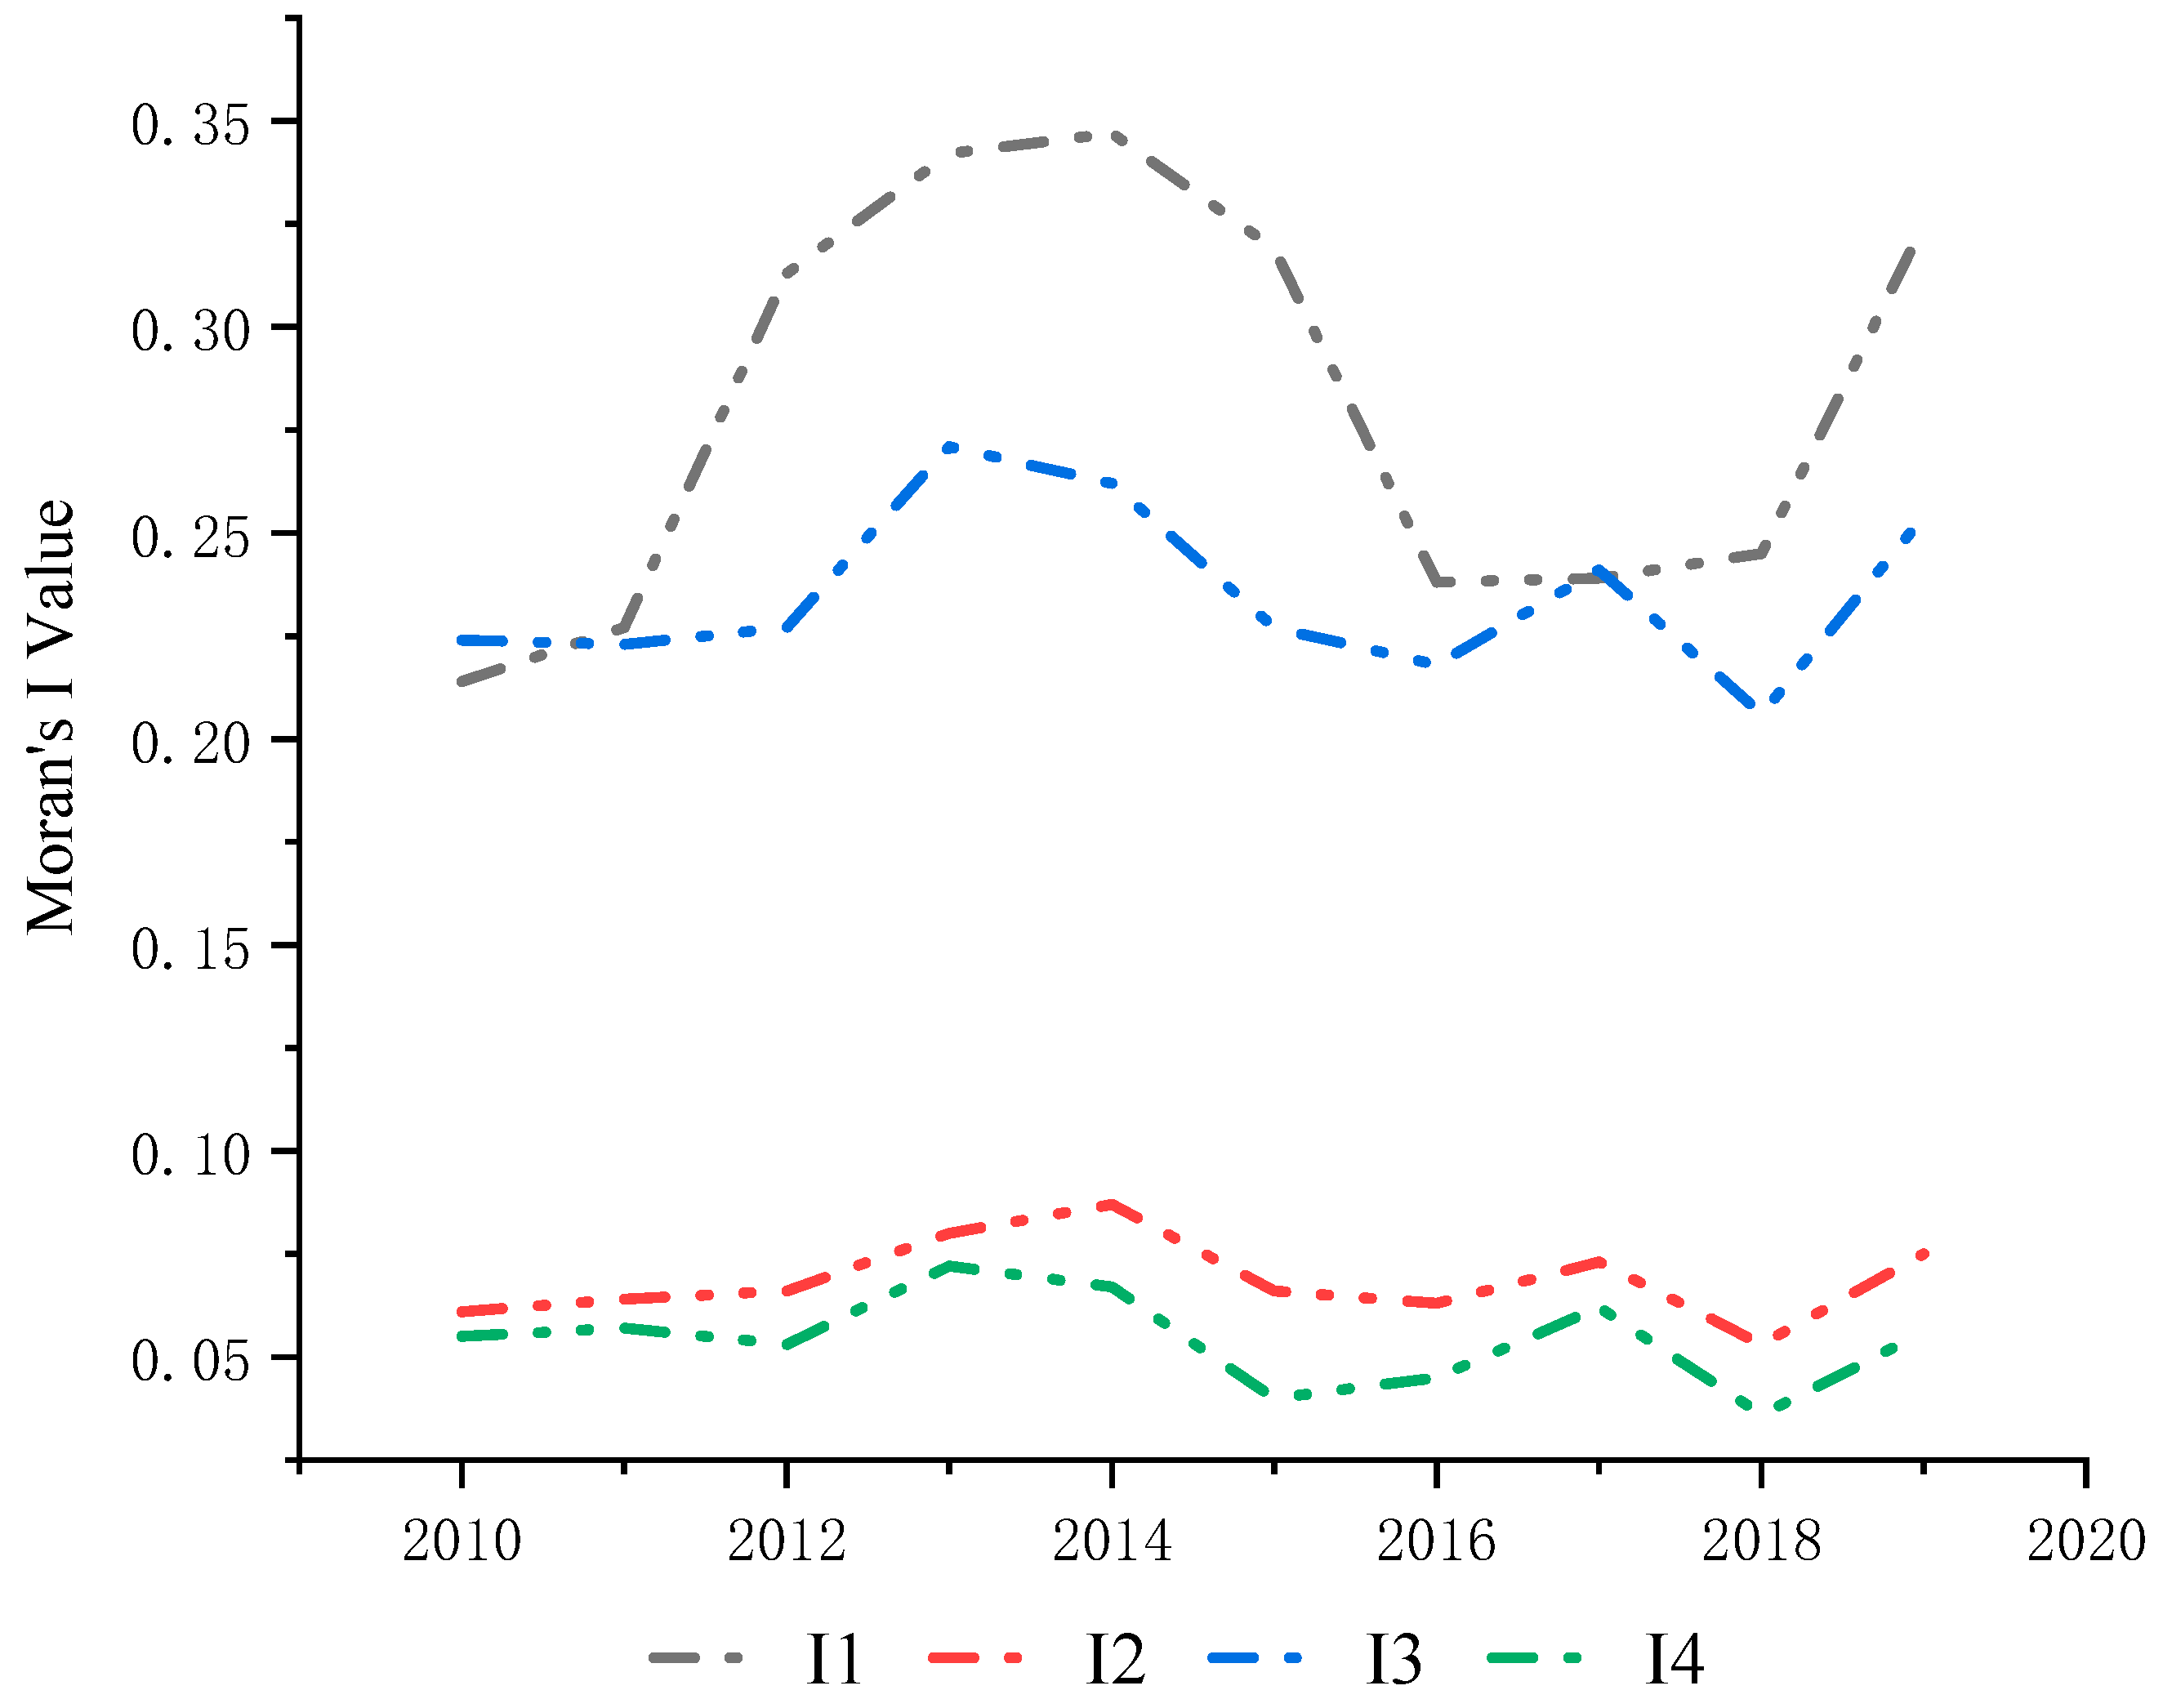
3.2.4. Spatial Correlation Analysis of WEFC System Vulnerability in the Yellow River Basin

Four different spatial weight matrices were constructed (city adjacency matrix I 1 , inverse geographic distance matrix I 2 , squared inverse geographic distance matrix I 3 , and economic-geographic distance nested matrix I 4 ) to obtain the global Moran’s index for WEFC system vulnerability in the Yellow River Basin from 2010 to 2019. The p-value represents the probability that the observed spatial pattern is generated by a random process. At a 90% confidence level (p < 0.01), the Moran’s index is considered to be statistically effective. As shown in Figure 5, there is the trend of Moran’s index for WEFC system vulnerability in 60 cities within the Yellow River Basin from 2010 to 2019. By comparing the results, it is clear that the global Moran’s index corresponding to the economic-geographic distance spatial weight matrix I 4 is notably smaller, indicating a decrease in the degree of agglomeration. The Moran’s index for the inverse geographic distance spatial weight matrix I 3 is also relatively small, while that for the city adjacency matrix I 1 is the largest. In addition, global Moran’s index values for all four spatial weight matrices from 2010 to 2019 in the Yellow River Basin fall within the range of [−1, 1], and all values are greater than 0, passing the significance test. Therefore, WEFC system vulnerability in the Yellow River Basin shows a positive spatial correlation in the study area, and the values display a fluctuating upward trend of increasing, then decreasing, followed by increasing from 2010. This implies that the spatial correlation of system vulnerability is gradually enhanced, and there is a strong spatial clustering phenomenon. With the Moran’s index corresponding to the city adjacency matrix as an example, it reached its maximum value of 0.347 in 2014, indicating the strongest spatial correlation among cities in the Yellow River Basin at that time. In summary, a strong positive correlation was found between WEFC system vulnerability and geographical location. As spatial distribution becomes more clustered, WEFC system vulnerability is more similar, and when spatial distribution becomes more dispersed, differences in vulnerability increase. In other words, the distribution of WEFC system vulnerability in the Yellow River Basin exhibits characteristics of high-high clustering and low-low clustering.
Local spatial heterogeneity results are summarized in Figure 6. The local spatial heterogeneity of WEFC system vulnerability in the Yellow River Basin reveals a significant spatial correlation. In addition, the high-high and low-low agglomeration types are predominant, and the spatial spillover effect is strong. Within the HH-type regions, certain cities in Henan, Shandong, Inner Mongolia, and Ningxia consistently appeared over several years. This type mainly encompasses a few cities in the upper reaches and lower reaches regions of the Yellow River Basin. Factors including population concentration, water scarcity, energy consumption, and environmental pollution contribute to higher WEFC system vulnerability in these areas. In LL-type regions, cities in Shaanxi, Shanxi, and Gansu consistently resided. The distribution of this type is concentrated in the upper reaches and middle reaches of the Yellow River Basin. Cities in these regions tend to have abundant resources but relatively lagging economic development, resulting in relatively low WEFC system vulnerability. Throughout the study period, lower reaches cities witnessed a trend of transitioning from HH aggregation areas to LL aggregation areas. For example, in 2019, fewer cities exhibited HH-type aggregation, with more aggregating in LL regions, indicating that urban WEFC system vulnerability in the Yellow River Basin is improving, likely due to recent ecological restoration and environmental protection efforts in the region.
Specifically, cities in the lower reaches area of the Yellow River Basin tended to gradually migrate to HH-type agglomerations during the study period. From 2010 to 2019, Zhengzhou, Xinxiang, and Puyang in Henan Province, and Qingdao and Weifang in Shandong Province fell into HH agglomerations, while other lower reaches cities, such as Kaifeng and Anyang in Henan Province, and Binzhou, Dezhou, and Liaocheng in Shandong Province, briefly belonged to LH agglomerations and then converged to HH agglomerations. By 2019, most lower reaches cities were in HH aggregation areas, except for the four cities of Hebi, Shangqiu, Dongying, and Tai’an. A notable diffusion effect of WEFC system vulnerability in the lower reaches region is revealed. The larger population, greater economic development, resource demand, and environmental pollution in the lower reaches area, coupled with developed manufacturing and industry, contribute to higher WEFC system vulnerability. In the middle reaches region, cities like Tianshui and Pingliang in Gansu, Tongchuan, Baoji, and Yan’an in Shaanxi, and Shuozhou and Linfen in Shanxi consistently resided in LL aggregation areas. Some cities, like Jincheng and Jinzhong in Shanxi, transitioned from LH aggregation areas to LL aggregation areas in 2016, and those like Xinzhou and Lvliang in Shanxi shifted from HL aggregation areas to LL aggregation areas in 2017. In 2019, Yulin and Xianyang in Shaanxi shifted from HL aggregation areas to LL aggregation areas. In general, middle reaches cities predominantly aggregated in LL areas due to their rich resource endowments, resulting in lower WEFC system vulnerability and significant spatial clustering. Cities in the upper reaches areas of the basin are considered to be economically underdeveloped. Looking at the results of the local Moran’s index, in the entire region, there is no clear single aggregation pattern. Some cities in Inner Mongolia, such as Wuhai and Baotou, as well as those in Ningxia like Yinchuan and Shizuishan, consistently remained in HH aggregation areas. Conversely, cities like Dingxi and Longnan in Gansu and Wuwei in Gansu constantly occupied LL aggregation areas. Bayannur shifted from HL cluster to HH cluster in 2018, and Baiyin transitioned from HL aggregation to LL aggregation in 2016. This lack of clear aggregation patterns can be attributed to significant internal differences, as previously indicated in the Theil index analysis. Some cities in Inner Mongolia, such as Bayan Nur, Wuhai with its neighboring Shizuishan, and Baotou are economically developed in the upper reaches region, exerting influence on their surrounding cities, which contributes to higher WEFC system vulnerability. On the contrary, cities like Dingxi and Longnan in Gansu and Guyuan in Ningxia are located in economically less endowed areas, causing relatively low WEFC system vulnerability and their placement in LL aggregation areas.
Additionally, cities like Lanzhou, Xi’an, and Taiyuan consistently appeared in the HL aggregation areas throughout the study period. These cities, serving as provincial capitals in the upper reaches and middle reaches, have significantly higher population concentrations and economic development levels compared to their neighboring cities. They exhibit higher WEFC system vulnerability than the surrounding cities. Considering that the development of the three cities is in the stage of polarization, the impact on neighboring cities is relatively limited.

3.3. Detection and Analysis concerning Key Drivers of WEFC System Vulnerability in the Yellow River Basin

3.3.1. Detection concerning Key Drivers of WEFC System Vulnerability in the Yellow River Basin (Global Scale)

The WEFC system vulnerability in the Yellow River Basin exhibits distinct spatial characteristics. To explore the spatiotemporal drivers of WEFC system vulnerability, firstly, the indicator data was discretized, and Geodetector was employed to analyze the spatiotemporal evolution’s driving factors, unraveling the mechanisms behind them. The detection of driving factors for WEFC system vulnerability across the entire Yellow River Basin from 2010 to 2019 involving 60 cities revealed the top 10 significant factors in explanatory power (Figure 7): X9 water resource development and utilization rate (0.632) > X2 per capita water consumption (0.463) > X46 effective irrigation rate (0.397) > X7 population supported by one million cubic meters of water resources (0.395) > X50 carbon ecological carrying capacity coefficient (0.390) > X31 fertilizer application per unit sown area (0.310) > X21 energy consumption intensity (0.292) > X41 gross power of agricultural machinery per unit of sown area (0.267) > X49 carbon sequestration (0.250) > X19 industrial wastewater emissions (0.242).
Detection factors in 2010, 2013, 2016, and 2019 were calculated by Geodetector (Table 3). Then, the ranking of driving factors and their explanatory power that passed the 0.05 significance test differed to some extent in different years, indicating that there was a significant spatiotemporal heterogeneity in the impact of different driving factors on the vulnerability of the WEFC system. In terms of the specific findings, the following is shown: In 2010, the 10 most influential factors affecting WEFC system vulnerability in the Yellow River Basin were: X9 water resource development and utilization rate (0.694), X47 education level (0.436), X13 precipitation (0.405), X50 carbon ecological carrying capacity coefficient (0.369), X1 urbanization rate (0.321), X20 industrial dust emissions (0.311), X38 proportion of agricultural output value (0.296), X22 industrial SO2 emissions (0.296), X24 energy self-sufficiency rate (0.287), and X44 per-capita disposable income of farmers (0.285). The top 10 factors with the strongest explanatory power in 2013 were X9 water resource development and utilization rate (0.784), X2 per capita water consumption (0.681), X7 population supported by one million cubic meters of water resources (0.620), X21 energy consumption intensity (0.541), X13 precipitation (0.503), X50 carbon ecological carrying capacity coefficient (0.464), X46 effective irrigation rate (0.448), X1 urbanization rate (0.432), X20 industrial dust emissions (0.395), and X48 carbon emissions (0.353). The top 10 indicators with the strongest drivers in 2016 were X9 water resource development and utilization rate (0.681), X50 carbon ecological carrying capacity coefficient (0.493), X13 precipitation (0.390), X48 carbon emissions (0.360), X4 wastewater discharge (0.336), X49 carbon sequestration (0.291), X17 artificial afforestation area (0.281), X24 energy self-sufficiency rate (0.246), X47 education level (0.243), and X14 sewage treatment rate (0.216). The order regarding the magnitude of the explanatory power in 2019 was X9 water resource development and utilization rate (0.750), X43 grain yield per unit area (0.512), X50 carbon ecological carrying capacity coefficient (0.510), and X7 population supported by one million cubic meters of water resources (0.481), X46 effective irrigation rate (0.473), X1 urbanization rate (0.468), X44 per-capita disposable income of farmers (0.398), X48 carbon emissions (0.386), X17 artificial afforestation area (0.350), and X24 energy self-sufficiency rate (0.337).
By observing the results of factor detection in the 4 years, the top five factors are almost all from the water resource system and the carbon system. In 2010, the driving factor with the highest explanatory power was X9 water resource development and utilization rate, with a substantial q-value of 0.694 that was significantly larger than q-values of other factors, revealing the crucial influence of water resource development and utilization during this period on the vulnerability of the WEFC system in the Yellow River Basin. In 2013, the explanatory power of the X9 water resource development and utilization rate factor became even more prominent, reaching a high q-value of 0.784. Factors associated with the water resources system, such as X2 per capita water consumption and X7 population supported by one million cubic meters of water resources, quickly moved up in the rankings, when all three factors had q-values exceeding 0.6, which suggests a pronounced conflict between the population and water resources, and the explanatory power of factors related to the water system on the vulnerability of the WEFC system is strengthened. The X21 energy consumption intensity factor experienced a substantial increase in its impact during this period, demonstrating that population pressure, water resource scarcity, and energy consumption became critical issues for WEFC system vulnerability during this time. In 2016, the explanatory power of the X9 water resource development and utilization rate factor continued to be at the top of the rankings, and WEFC system vulnerability in this period was mainly influenced by the X50 carbon ecological carrying capacity coefficient and the X48 carbon emissions factors. In 2019, in addition to factors related to water resources, other factors with strong explanatory power include X43 grain yield per unit area, X46 effective irrigation rate, and X50 carbon ecological carrying capacity coefficient. Therefore, this period was marked by apparent climate conflicts and a crisis in grain production, highlighting the significance of carbon neutrality.
From a further analysis on the annual rankings of the top 10 driving factors, with a focus on those occurring with a frequency exceeding 75%, urbanization rate (X1), water resource development and utilization rate (X9), industrial dust emissions (X20), energy self-sufficiency rate (X24), per-capita disposable income of farmers (X44), precipitation (X13), carbon ecological carrying capacity coefficient (X50), and carbon emissions (X48) were found to be the primary factors driving the vulnerability of the WEFC system. This indicates that the vulnerability of the Yellow River Basin WEFC system under the time and space under constant change is mainly affected by urban development level, water resource development and utilization, industrial pollution, energy production and consumption, economic conditions of rural residents, carbon emissions, and ecological carbon sequestration capacity. Regarding the trends in driving factors within each subsystem, it is of note that the X9 water resource development and utilization factor within the water resource system consistently ranked as the top one throughout the years. This observation underscores the significantly close association between the vulnerability of the WEFC system in the Yellow River Basin and the ongoing development and utilization of water resources. Within the energy subsystem, the driving forces of X20 industrial dust emissions and X19 industrial wastewater emissions exhibit an initial increase, followed by a subsequent decline. This pattern shows that the intensity of pollutant emissions had a strong influence on the spatial differentiation of the vulnerability of WEFC system in the Yellow River Basin before 2016, and then gradually decreased after 2016, which may be related to the introduction of policies strengthening the ecological protection, energy conservation, and emission reduction in the Yellow River Basin. The driving force of the X50 carbon ecological carrying capacity coefficient factor in the carbon system continued to rise, implying that the influence of carbon emissions and ecological carbon sequestration on the vulnerability of the WEFC system in the Yellow River Basin was becoming increasingly prominent. Therefore, the inseparable connection between the vulnerability of the WEFC system in the Yellow River Basin and carbon neutrality is highlighted.
From the ordering of the drivers at the 10-year time level from 2010 to 2019 (Figure 8), the changes in the drivers of WEFC system vulnerability in the Yellow River Basin can be summarized as follows. Firstly, the water resource system and carbon system factors manifest as the key elements of WEFC system vulnerability. The explanatory power of X9 water resource development and utilization rate, and X50 carbon ecological carrying capacity coefficient was stable above 0.5 from 2010 to 2019, and continuously ranked within the top five driving factors, which demonstrates that regulating water resource development and utilization, and enhancing carbon ecological carrying capacity are crucial for reducing the vulnerability of the WEFC system. Secondly, the ordering of driving factors displays a shift from the energy system to the grain system. Factors such as X19 industrial wastewater emissions, X22 industrial SO2 emissions, and X20 industrial dust emissions gradually increased the driving influence before 2016, and subsequently plummeted. By contrast, the driving influence of X41 gross power of agricultural machinery per unit of sown area, X46 effective irrigation rate, and X43 grain yield per unit area of the grain subsystem began to strengthen, which is manifested by the fact that three dominant factors of the energy system had an explanatory power ranked in the top 10 in 2016, and only one ranked at the end of the top 10 in 2019. During the evolution concerning the vulnerability of the WEFC system in the Yellow River Basin, the influence of the energy subsystem first rose and then fell, while the grain subsystem gradually contributed more “power” to the vulnerability of the WEFC system, especially after 2015, when the contribution gradually exceeded that of the energy subsystem. Thirdly, environmental pollution control emerged as a crucial safeguard for lowering WEFC system vulnerability. The explanatory power of indicators, such as X20 industrial dust emissions, X4 wastewater discharge, X22 industrial SO2 emissions, and X48 carbon emissions, increased year by year from 2010 to 2015, followed by an increase in the explanatory power of X17 artificial afforestation area from 2015 to 2019. From what is mentioned above, environmental pollution control can be denoted to be not only an essential aspect of safeguarding energy system vulnerability, but also a paramount consideration for the sustainable development of the WEFC system.

3.3.2. Heterogeneous Analysis of Driving Factors for WEFC System Vulnerability in the Yellow River Basin (Regional Scale)

Due to the differences in regional resource endowment and urban economy, the drivers of WEFC system vulnerability in different regions in the upper reaches, middle reaches, and lower reaches of the Yellow River Basin tended to be heterogeneous. Therefore, exploring the main factors driving WEFC system vulnerability in the three major regions in the upper reaches, middle reaches, and lower reaches of the Yellow River Basin is suggested to reveal the evolution pattern and to analyze the reasons behind the heterogeneity. Geodetector was employed to determine the explanatory power (q-value) of each driving factor on WEFC system vulnerability in the upper reaches, middle reaches, and lower reaches of the Yellow River Basin. A higher q-value indicates a more substantial impact of the detection factor on WEFC system vulnerability (Figure 9).
From the upper reaches region, the more influential core factors are X9 water resource development and utilization rate, X2 per capita water consumption, X7 population supported by one million cubic meters of water resources, X31 fertilizer application per unit sown area, and X13 precipitation. It is demonstrated that WEFC system vulnerability in the upper reaches is primarily driven by water resource scarcity and issues related to grain production. The core factors with greater influence in the middle reaches region are X50 carbon ecological carrying capacity coefficient, X19 industrial wastewater emissions, X6 population density, X22 industrial SO2 emissions, and X47 education level, which reveal that the secondary industry or the industry in the middle reaches region is more developed, featuring relatively high population density. Furthermore, industrial pollution and carbon emissions are the key factors influencing the vulnerability of the WEFC system in this region. The core factors with greater influence in the lower reaches area are X22 industrial SO2 emissions, X20 industrial dust emissions, X33 per capita arable land area, X47 education level, and X4 wastewater discharge, which means that the lower reaches area is relatively insufficient in per-capita resources due to the high density of the city and the population agglomeration, and that the environmental pollution and the tightness of arable land resources are the key to the vulnerability of the WEFC system.
In summary, within the water resources subsystem, factors such as X9 water resource development and utilization rate, X2 per capita water consumption, X7 population supported by one million cubic meters of water resources, and X13 precipitation have a more substantial impact on urban WEFC system vulnerability in the upper reaches region, and their influence decreases in the order of the upper reaches, middle reaches, and lower reaches. The factors associated with industrial pollution emissions in the energy subsystem, X19 industrial wastewater emissions, X20 industrial dust emissions, and X22 industrial SO2 emissions affect the middle reaches and lower reaches to a great extent but minimally influence the upper reaches. In the middle reaches, the X50 carbon ecological carrying capacity coefficient has the most significant impact, indicating severe carbon neutrality constraints on urban WEFC system vulnerability. In addition, factors related to the population and grain production, such as X6 population density, X33 per capita arable land area, and X34 per capita grain sown area, have a strong impact on the middle reaches and lower reaches, while the X31 fertilizer application per unit sown area factor exhibits substantial influence in the upper reaches, implying the prevalence of grain-related issues throughout the entire Yellow River Basin.
In conclusion, the importance ranking of driving factors for WEFC system vulnerability in the upper reaches, middle reaches, and lower reaches regions of the Yellow River Basin varies dramatically, demonstrating significant spatial heterogeneity.

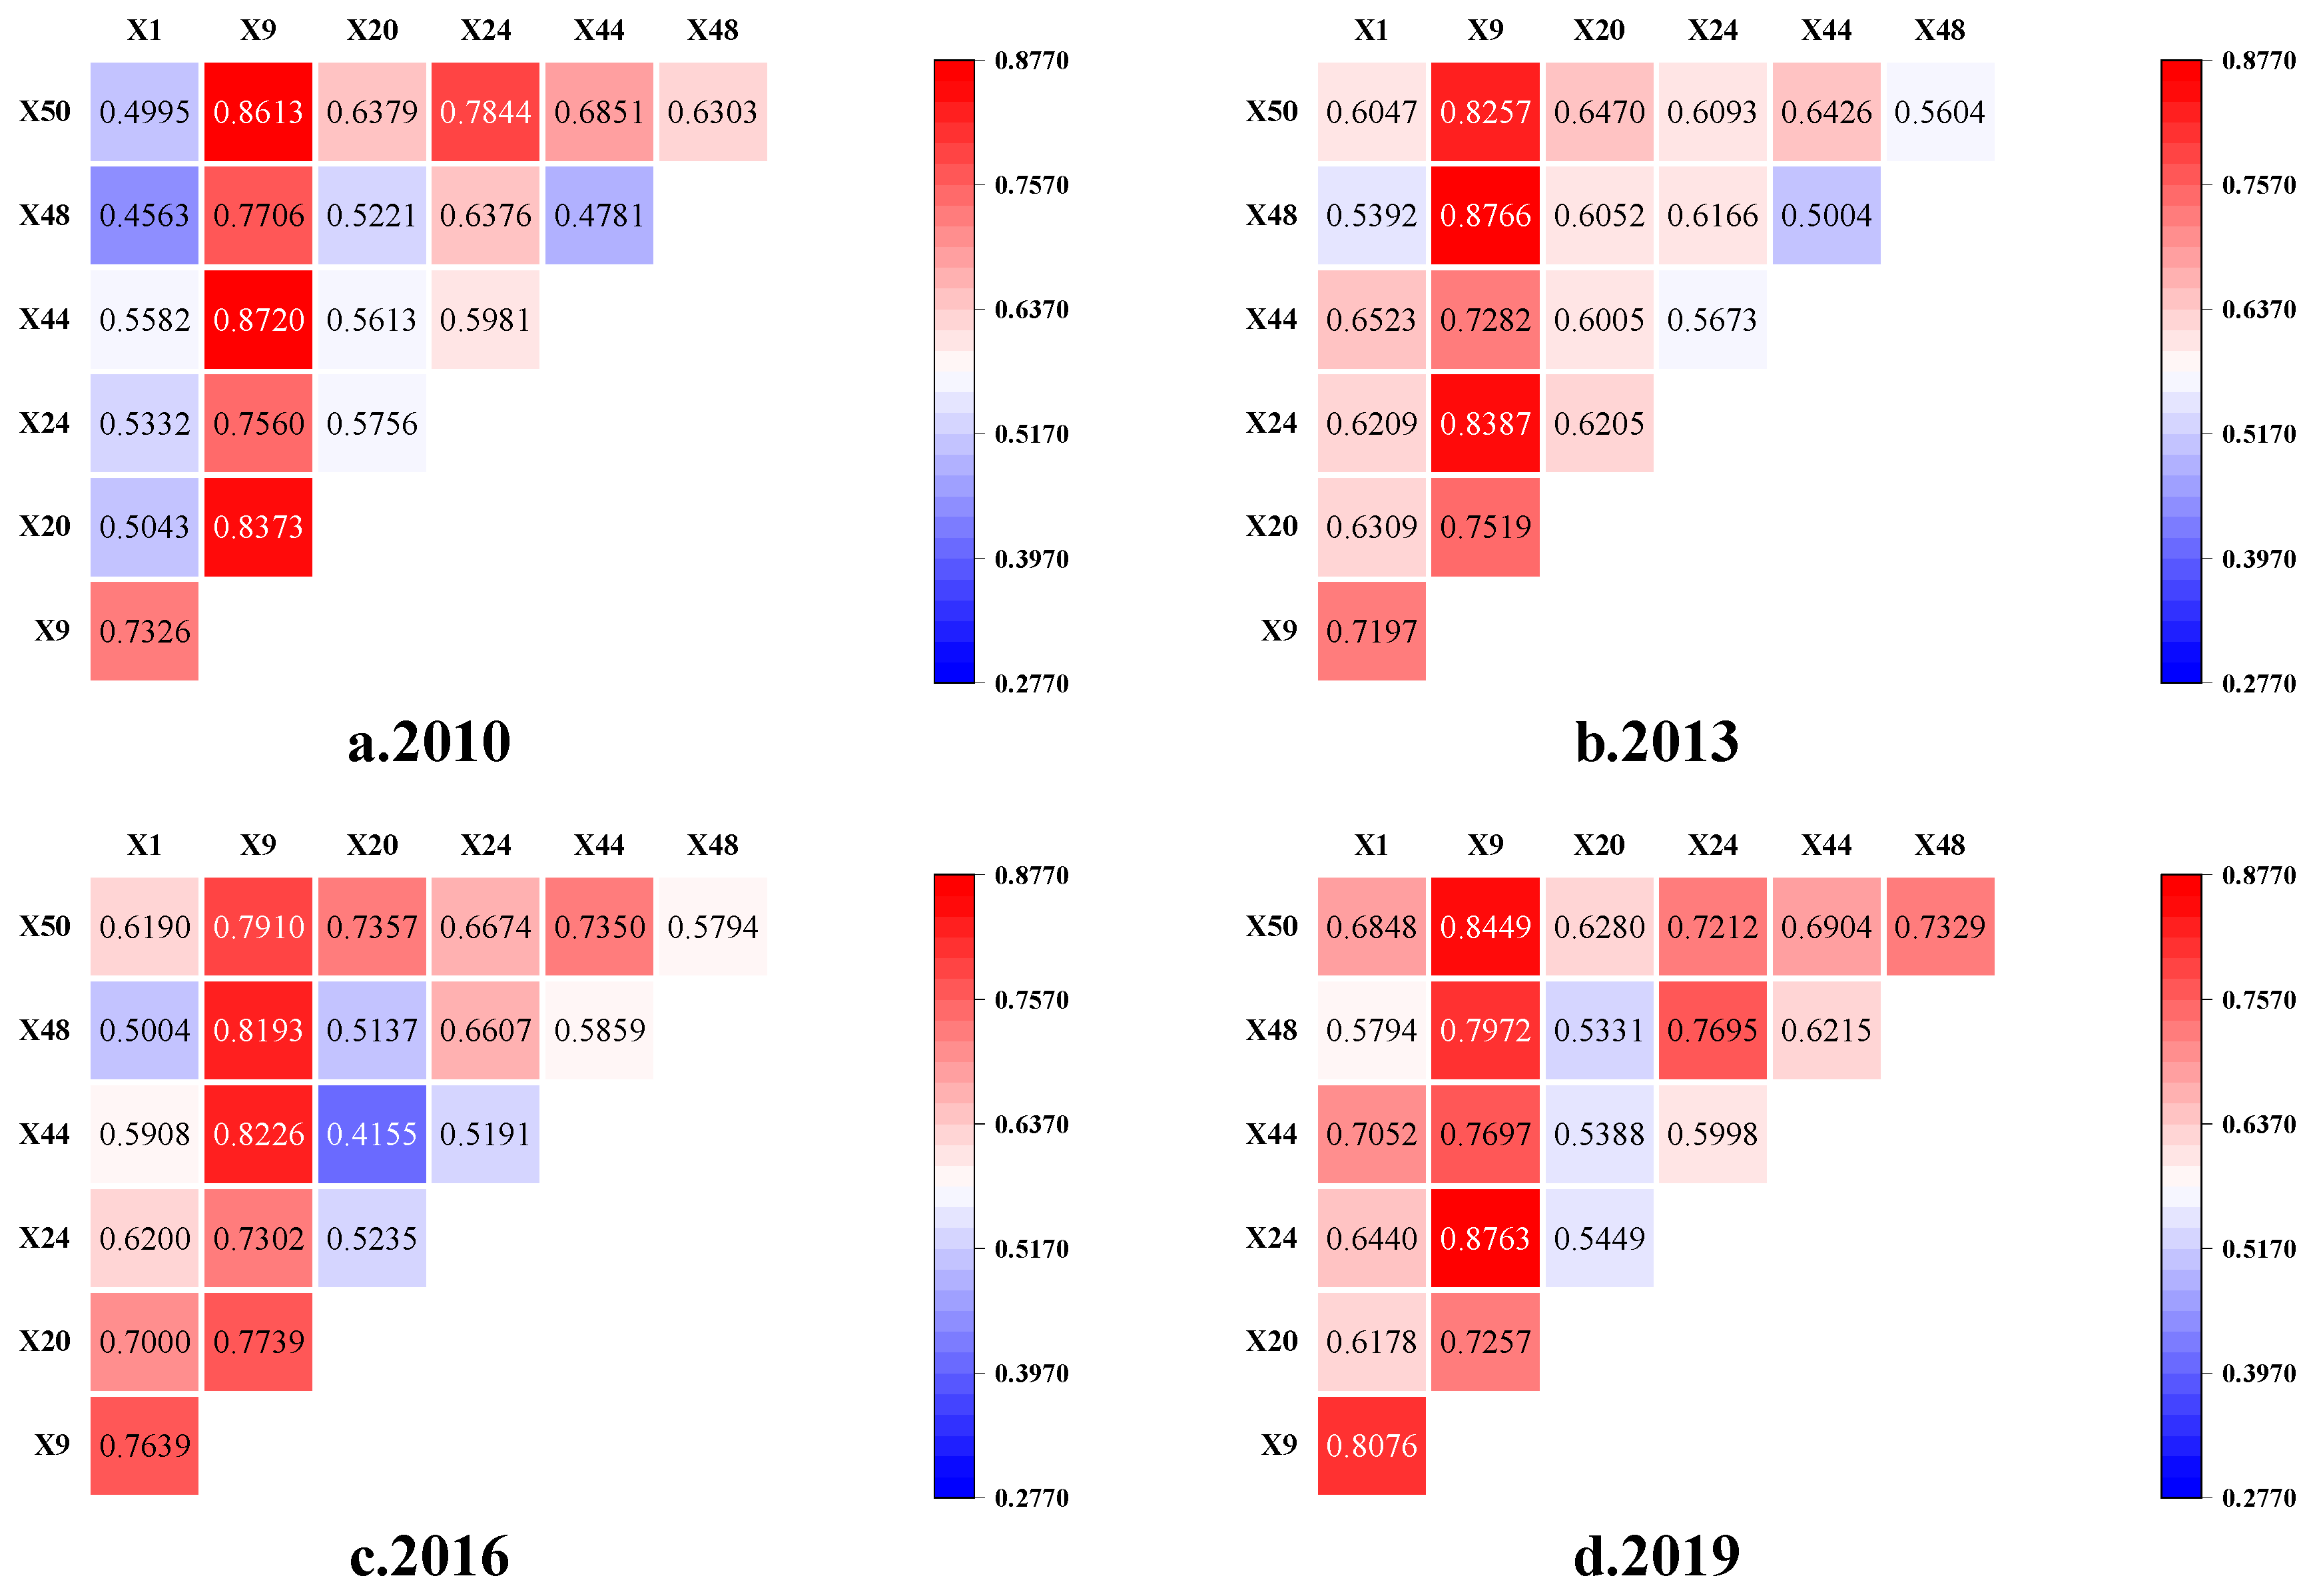
3.3.3. Interaction Detection on the Drivers of WEFC System Vulnerability in the Yellow River Basin (Interaction Detection)

To further investigate the differences in explanatory power when different driving factors interact with each other and influence the vulnerability of the WEFC system in the Yellow River Basin, seven driving factors with a frequency of occurrence exceeding 70%, namely X50 carbon ecological carrying capacity coefficient, X9 water resource development and utilization rate, X1 urbanization rate, X44 per-capita disposable income of farmers, X48 carbon emissions, X24 energy self-sufficiency rate, and X20 industrial dust emissions, were selected from the 10-year factor detection results of the WEFC system vulnerability in the Yellow River Basin from 2010 to 2019. Among them, urbanization rate (X1) represents the ratio of the urban population to the total population. A higher urbanization rate indicates an increase in rural-to-urban migration, which provides cities with a large labor force to drive urban industrial development. In turn, the energy system is affected. The relative reduction of the rural labor force influences agricultural production and development, thus impacting water resources and the food system. A large number of people are concentrated in cities, causing an increase in pollution emissions from production and living, and the large amount of greenhouse gas emissions triggers an imbalance in the carbon cycle system, resulting in the vulnerability of the WEFC system. Water resource development and utilization rate (X9) is of great importance, as water resources are vital for human survival. Excessive exploitation of water resources leads to irreversible resource depletion and poses risks to the water resources system. In addition, water resource development and utilization are closely linked to the energy, food, and carbon systems, implying its significant impact on the WEFC system vulnerability. Industrial dust emissions (X20) serve as an indicator of regional pollutant emissions, primarily associated with the production and development of the energy industry. Emissions further influence water resources and food security. Studies suggest that air quality influences the allocation of resources in the water-soil-energy-food-carbon system [20], thus being a direct factor contributing to WEFC system vulnerability. Energy self-sufficiency rate (X24) is the ratio of total regional primary energy production to consumption, directly related to the energy system. A higher energy self-sufficiency rate demonstrates favorable self-supply and consumption conditions in the region. Energy abundance supports water resource development and food production, while lower energy consumption is beneficial for the healthy development of the carbon cycle system, causing lower vulnerability of the WEFC system. Per-capita disposable income of farmers (X44) is an economic indicator reflecting the financial status of farmers. Farmers’ economic conditions are closely associated with the food system. The production and development of food facilitate an increase in farmers’ income, which, in turn, requires support from energy and water resources, and crop carbon emissions and fertilizer use are linked to the carbon system. Therefore, the per-capita disposable income of farmers is vital in determining the vulnerability of the WEFC system. Carbon emissions (X48) are directly related to the carbon system, and climate change induced by carbon emissions exacerbates water scarcity, increases energy demand, and affects the cultivation and production of food. The growth of carbon emissions significantly impacts the vulnerability of the WEFC system. The carbon ecological carrying capacity coefficient (X50) is the ratio of carbon sequestration to carbon emissions, representing the regional ecological environment protection, and the larger this ratio is, the better the ecological conservation effect of the region is. Given national requirements for ecological protection, high-quality development, and carbon neutrality in the Yellow River Basin, the carbon ecological carrying capacity coefficient is a crucial factor which can influence the vulnerability of the WEFC system.
The objective is to explore the interaction mechanism concerning the spatial differentiation of WEFC system vulnerability in the Yellow River Basin, and to identify the types of interactions, as shown in Figure 10. The results of interaction detection reveal that, except for a few cases of single-factor nonlinear weakening, the interactions between driving factors generally exhibit two-factor enhancement or nonlinear enhancement. Moreover, over 75% of these interactions demonstrate two-factor enhancement, with no evidence of mutual independence or weakening, suggesting that factor interactions generally enhance the explanatory power for WEFC system vulnerability compared to single-factor effects. Additionally, it supports the notion that WEFC system vulnerability in the Yellow River Basin is a complex process driven by factor interactions.
Specific results demonstrate that, in 2010, the interaction explanatory power of X9 water resource development and utilization rate with X20 industrial dust emissions, X44 per-capita disposable income of farmers and X50 carbon ecological carrying capacity coefficient reached more than 0.8, and that with X1 urbanization rate, X24 energy self-sufficiency rate, and X48 carbon emissions surpassed 0.7. The interaction between X50 carbon ecological carrying capacity coefficient and X24 energy self-sufficiency rate hit a high explanatory power of 0.7844. Considering this, it is indicated that during this period, factors such as water resource development and utilization rate and the carbon balance collectively determined the vulnerability of the WEFC system in the Yellow River Basin. In 2013, the interactions of X9 water resource development and utilization rate with other factors maintained a high level of explanatory power (q > 0.7). However, unlike 2010, the interactions of X1 urbanization rate and X20 industrial dust emissions with other factors showed enhanced explanatory power. For example, the explanatory power of the interaction between X1 urbanization rate and X20 industrial dust emissions increased from 0.5 in 2010 to 0.63 in 2013, and that of the interaction between X20 industrial dust emissions and X24 energy self-sufficiency rate also rose from 0.58 in 2010 to 0.62 in 2013. Thus, urban development and industrial pollution became the primary factors driving WEFC system vulnerability during this period. In 2016, the explanatory power of interactions involving X20 industrial dust emissions with other factors, except for X50 carbon ecological carrying capacity coefficient, decreased to varying degrees. The interaction between X9 water resource development and utilization rate and other factors experienced a slight decrease compared to 2013, whereas that between X24 energy self-sufficiency rate and factors related to the carbon system increased. During this period, water resource development and utilization, energy self-sufficiency rate, and carbon balance were key factors influencing WEFC system vulnerability, while the impact of industrial pollution-related factors decreased. In 2019, the interaction explanatory power of X9 water resource development and utilization rate, X1 urbanization rate, X50 carbon ecological carrying capacity coefficient, and X48 carbon emissions with other factors were almost all above 0.6. Among them, X1 urbanization rate, X50 carbon ecological carrying capacity coefficient, and X48 carbon emissions showed significant improvements in their interactions with other factors. During this time period, the degree of urban development, water resource development and utilization, and carbon ecological carrying capacity had a great impact on WEFC system vulnerability.
In terms of the evolution over time, there were certain differences in the explanatory power of interactions between different pairs of factors. However, X9 water resource development and utilization rate, X1 urbanization rate, X50 carbon ecological carrying capacity coefficient, and X48 carbon emissions factor interacting with other factors consistently exhibited strong explanatory power. Therefore, these factors were actively influencing WEFC system vulnerability during various periods. In summary, the main characteristics observed are shown below: Firstly, X9 water resource development and utilization rate interacted with other factors in a stronger way, while X9 water resource development and utilization rate and X50 carbon ecological carrying capacity coefficient (X9∩X50) on the Yellow River Basin WEFC system vulnerability of the explanatory power basically remained above 0.8. When it comes to the explanatory power over time, there were fluctuations in the enhancement of the trend, from 0.826 in 2013 to 0.791 in 2016, and then increasing to 0.845 in 2019. In addition, the interaction type was always a two-factor enhancement, suggesting that the water resource development and utilization rate and carbon ecological carrying capacity coefficient are indeed the key to the vulnerability of the WEFC system. Possible reasons for this phenomenon can be attributed to the challenging issue of water scarcity inherent in the Yellow River Basin. Cities in the middle and lower reaches, facing substantial water resource demands due to urban development and population concentration, tend to experience higher carbon emissions from energy production and daily activities. Excessive resource consumption and severe environmental pollution in these areas contribute to an elevated vulnerability of the WEFC system. By contrast, cities in the upstream regions play a role in ecological protection of the Yellow River Basin. Obviously, these cities undertake responsibilities for water and soil conservation, and the evident carbon sequestration effects of forest vegetation are conducive to a certain degree of improvement in the vulnerability of the WEFC system. Therefore, the comprehensive impact of water resource development and utilization rate and carbon emissions emerges as the primary interacting driving factor influencing the vulnerability of the WEFC system. Secondly, apart from X20 industrial dust emissions, interactions between other factors generally exhibited an increasing trend in explanatory power over time. For instance, for the interaction between X48 carbon emissions and X24 energy self-sufficiency rate, while experiencing a reduction in 2013, the explanatory power gradually increased from 2013 to 2019, with the interaction type consistently being nonlinear enhancement. It is implied that the connections between subsystems became increasingly tighter over time, leading to improved explanatory power for WEFC system vulnerability. Thirdly, the explanatory power of the carbon subsystem factor over time on the vulnerability of the WEFC system showed an unstable but upward change. Specifically, interactions between X50 carbon ecological carrying capacity coefficient and X48 carbon emissions, among other factors, dominantly exhibited fluctuating enhancements between 2010 and 2019, with interaction types always being two-factor enhancement or non-linear enhancement, mainly because the explanatory power of the X50 carbon ecological carrying capacity coefficient and X48 carbon emissions factor increased after 2016.

4. Discussion

Research indicates that the vulnerability of the WEFC system in the Yellow River Basin presented a declining trend from 2010 to 2019. Among the limited studies relevant to this study, Yue Pan et al. found a fluctuating downward trend in the overall WEFE-N vulnerability across provinces and cities in the Yangtze River Economic Belt from 2008 to 2019 [40]. By contrast, the study conducted by Liming Liu et al. yielded opposite results, demonstrating a fluctuating upward trend of WEFE system vulnerability in the Yangtze River Economic Belt from 2005 to 2020 [25]. These disparities primarily stem from variations in sample size, data of vulnerability measurement indicators, and measurement methods.
At the aspect of vulnerability measurement, in this study, the VSD framework was selected to construct the indicator system, which is consistent with that of Yue Pan et al. [40], while Junfei Chen et al. [26] and Liming Liu et al. [25] both built the indicator system on the basis of the Pressure-State-Response framework. Among them, the VSD framework is classically used to assess vulnerability, and the exposure, sensitivity, and adaptive capacity are more in line with the state response of the system when it encounters disturbances from natural or human activities. Furthermore, the entropy weight method is chosen to determine the weights and calculate the final WEFC system vulnerability. Using the entropy weighting method, the influence of subjective factors could be excluded, and the weights of the indicators were calculated to ensure scientific validity. Other researchers also varied in their selection of measurement methods, such as using data envelopment efficiency, CRITIC assignment with the TOPSIS model, the cloud model, and the random forest model to assess vulnerability. Therefore, the exploration of a more optimal framework for the indicator system and measurement methods is a focal point for future research.
In terms of spatiotemporal analysis, this study employed a combined approach of kernel density function, Theil index, and spatial exploratory analysis. This integrated method provides a more intuitive representation of the spatiotemporal evolution, spatiotemporal disparities, and spatial correlation characteristics of WEFC system vulnerability. By contrast, in their latest research, Liming Liu et al. [25] made a hot spot analysis and Kriging interpolation simulation to analyze the spatiotemporal evolution of WEFE system vulnerability. Therefore, there is potential to further investigate more comprehensive research approaches in the realm of a spatiotemporal feature analysis.
In the realm of a driving factor analysis, the Geodetector stands out as a reliable approach, acknowledged by several scholars. The findings of this study indicate that the primary factors influencing the vulnerability of the WEFC system include the carbon and ecological carrying capacity coefficient, water resource development and utilization rate, urbanization rate, per-capita disposable income of farmers, carbon emissions, energy self-sufficiency rate, and industrial dust emissions. On the contrary, by utilizing an obstacle degree model, Yue Pan et al. identify key factors affecting the WEFE vulnerability in the Yangtze River Economic Belt, including the comprehensive utilization rate of solid waste, the primary industry energy consumption ratio, energy consumption intensity, water consumption per 10,000-yuan GDP, domestic water consumption per capita and fertilizer application per unit grain sowing area.
Regarding the limitations and prospects of this paper, several key points are highlighted:
(1)
The study is constrained by limitations in time and data. Although a relatively scientific approach was taken to select vulnerability assessment indicators, issues such as incomplete indicator coverage persist. The research is performed at the city level, involving numerous indicators. Especially in the energy subsystem, some indicators have not been updated to 2020. Thus, the study period spanned only from 2010 to 2019.
(2)
The analysis of major driving factors is exclusively conducted from an internal perspective. However, external factors, such as industrial structure, marketization level, degree of openness, environmental quality, and climate, are also influential factors concerning the vulnerability of the WEFC system. Subsequent research should delve into the impact of external factors, like social, economic, and natural environmental aspects, on WEFC system vulnerability. In addition, focusing on constructing mathematical models to study the theoretical mechanisms of WEFC systems is a crucial direction for future research.
(3)
The research is centered on the entire Yellow River Basin, considering prefecture-level cities and the three major regions (upper, middle, and lower reaches). Nevertheless, it does not explore more granular scales, such as the division of the secondary basin and the tertiary basin, as well as the research on the vulnerability of the WEFC system in subdivided areas, such as urban agglomerations and counties. Multi-scale research could provide more targeted theoretical support for regulating the vulnerability of the regional WEFC system, enriching the content of research.
(4)
The future development of WEFC system vulnerability in the Yellow River Basin needs to be further investigated by scholars, providing insight into the future economic development and ecological conservation of the region. Introducing methods, such as system dynamics and neural networks to enhance the predictive scientificity and accuracy of WEFC system vulnerability simulation, is a direction for the future studies.

5. Conclusions

In this paper, the WEFC system vulnerability evaluation index system was constructed on the basis of the VSD vulnerability model framework, and WEFC system vulnerability of 60 cities in the Yellow River Basin from 2010 to 2019 was measured. in which its spatio-temporal evolution and the heterogeneity of the driving factors were further explored with the aid of the kernel density function, the Theil index, the spatial correlation analysis, and Geodetector. Finally, the following main conclusions are obtained:
(1) The vulnerability of the WEFC system in the Yellow River Basin presents a decreasing trend, with a spatial pattern of “low in the middle and high on both sides”, and upper reaches/lower reaches > overall > middle reaches. (2) The spatial difference in vulnerability tends to narrow in the middle and lower reaches, while expanding in upper reaches. The differences among the three major regions mainly originate from within the region, with the upper reaches having the largest difference and contribution; the vulnerability of the WEFC system in the Yellow River Basin is featured with a significant spatial correlation, with the upper reaches and lower reaches cities mostly displaying a “high-high” type of agglomeration, and the middle reaches mainly showing the “low-low” one. (3) In terms of the main factors affecting the vulnerability of the WEFC system, there are the carbon and ecological carrying capacity coefficient, water resource development and utilization rate, urbanization rate, per-capita disposable income of farmers, carbon emissions, energy self-sufficiency rate, and industrial dust emissions; the spatial heterogeneity of core drivers at the regional scale is obvious, with the upper reaches regions being more strongly influenced by the factors of the water resources system, while the middle and lower reaches regions are more sensitive to the factors concerning industrial pollution of the energy subsystem. In addition, the explanatory power of carbon ecological carrying capacity reaches its peak in the middle reaches. The interaction of factors increases the strength of the impact on vulnerability. To be specific, the interaction between water resource development and utilization rate and other factors has a strong explanatory power, and that of the carbon ecological carrying capacity coefficient with other factors presents an obvious improvement since 2016. The specific results of this paper are as follows:
In terms of temporal evolution, the vulnerability of the WEFC system in the Yellow River Basin was featured with an overall decreasing trend from 2010 to 2019. In general, the level in the upper reaches and lower reaches areas were higher than that of the Yellow River Basin, while the level in the middle reaches was lower than that of the Yellow River Basin. The vulnerability characterization of the upper reaches area was more active and experienced the change process of rising to declining to rising to declining, but still maintained at a high level. Moreover, the vulnerability of the lower reaches area was lower than the upper reaches level during 2010–2013, higher than the upper reaches level during 2014–2016, and then leveled off. In addition, the vulnerability value of the middle reaches region continued to stabilize at a low level.
The spatial pattern reveals an overall pattern of high vulnerability at both ends and low vulnerability in the middle. The upper reaches showed serious polarization, and the overall view of the high value area tended to decrease. Several cities in Inner Mongolia are the key to unstable vulnerability. Yinchuan, Shizuishan, Wuzhong, and Zhongwei in Ningxia are the high vulnerability aggregation. In the middle reaches, there were fewer high value zones, and the vulnerability level shifted to lower vulnerability over time. In the lower reaches, the high vulnerability areas fluctuated and then stabilized, mainly showing moderate and higher vulnerability with a comparable proportion. The vulnerability of WEFC system in the Yellow River Basin as a whole and in the upper reaches, middle reaches, and lower reaches regions is characterized by a decreasing trend. The spatial difference between the middle reaches and lower reaches is inclined to narrow, while the upper reaches have a tendency to expand. The right trailing phenomenon is obvious in the entire Yellow River Basin, while the differentiation phenomenon in the middle reaches and lower reaches regions has been weakened. The spatial difference in the vulnerability of the WEFC system in the Yellow River Basin, as a whole, is obvious and has not improved to a great extent. Additionally, the relative differences in the upper reaches areas of the three regions were enlarged, while the middle reaches and lower reaches regions showed a decrease. Furthermore, the differences among the three regions are mainly due to intra-regional differences, with the largest differences and contributions in the upper reaches region, followed by the middle reaches and lower reaches regions. The vulnerability of the WEFC system in the Yellow River Basin has significant spatial correlation, while the overall correlation displays a gradual increase in the trend, and its main characteristics are high-high and low-low agglomeration patterns. The local spatial agglomeration features mainly include “high-high” agglomeration in the upper reaches and lower reaches and “low-low” agglomeration in the middle reaches.
The factors driving the vulnerability of the WEFC system in the Yellow River Basin are diversified, heterogeneous, and interactive. X50 carbon ecological carrying capacity coefficient, X9 water resource development and utilization rate, X1 urbanization rate, X44 per-capita disposable income of farmers, X48 carbon emissions, X24 energy self-sufficiency rate, and X20 industrial dust emissions are identified as the primary long-term drivers of WEFC system vulnerability. At that point, it is suggested that the degree of water resource development and utilization, carbon ecological carrying capacity, industrial pollution, urban development, and the economic status of farmers are key determinants of WEFC system vulnerability. A heterogeneity analysis shows that the factors related to the water resource subsystem have a greater influence on the upper reaches area, but gradually smaller effects on the upper reaches, middle reaches, and lower reaches regions. Factors relevant to industrial pollution in the energy subsystem have a stronger influence in the middle reaches and lower reaches, and a weaker influence in the upper reaches, while those associated with the food subsystem affect all three major regions. The carbon ecological carrying capacity factor has the greatest influence in the middle reaches. The interaction detection results of the seven main factors present two-factor enhancement or non-linear enhancement, of which the interaction between water resource development and utilization rate and carbon emissions has the strongest explanatory power, and the interaction between water resource development and utilization rate and other factors exhibits strong explanatory power. Except for the industrial dust emissions factor, the mutual effect between all other factors tends to increase their explanatory power over time. In addition, the explanatory power of carbon subsystem factors on the vulnerability of the WEFC system over time is unstable, but tends to increase.
This study examines the spatiotemporal evolution characteristics and key driving factors of vulnerability in the WEFC system. It utilizes geospatial technology to guide the future ecological development direction of urban areas and formulates differentiated policies and planning strategies for constructing cities that are inclusive, secure, resource-efficient, and resilient to climate change and disasters, thus contributing to the achievement of Sustainable Development Goal 11.

6. Policy Recommendations

Based on the above analysis and conclusions, it is concluded that, to reduce the vulnerability of the WEFC system in the Yellow River Basin, strategies should be developed for the entire basin, while also considering regional differences. The details are shown as follows: the differences in water resources, energy, food, and carbon neutrality in the upper reaches, middle reaches, and lower reaches areas of the Yellow River Basin should be considered, and region-specific strategies should be implemented to achieve an overall reduction in WEFC system vulnerability, thereby promoting ecological security in the basin. The upper reaches area is the core area of the ecological security strategy, and there are problems of weakened soil and water conservation function and fragile ecological environment. Therefore, the preventive protection should be strengthened, the resource status of the whole upper reaches area should be monitored, and the function of the ecological line of defense should be enhanced. The middle reaches, as an essential energy base in China, have shown initial success in adjusting their energy production structure, optimizing energy efficiency, and controlling environmental pollution since the initiation of ecological protection efforts in the Yellow River Basin. This success should be kept, when focusing on governance and restoration, and giving full play to the economic agglomeration effect of the middle reaches of the energy and chemical industry, aiming to achieve sustainable growth of resource-intensive economy. The lower reaches, with their dense urban distribution and population, represent a critical area of WEFC system vulnerability in the whole basin. Protection and restoration should be prioritized in this region. An innovation-driven development strategy should be implemented, emphasizing industrial and technological innovation. In this way, the region shift from resource dependency to a model based on technological innovation and the sustained improvement of WEFC system vulnerability would be realized.
Additionally, narrowing the disparities between regions is an integral aspect of addressing the vulnerability of the WEFC system in the Yellow River Basin. The study shows that the vulnerability of the WEFC system in the Yellow River Basin has significant spatial correlation, and the cities with higher vulnerability should take the initiative to seek the sustainable path of balancing their own resource utilization, carbon neutrality, and economic development, while those with lower vulnerability should strengthen their radiation-driven role, so that they can form a coordinated development pattern of the upper reaches, middle reaches, and lower reaches areas with complementary advantages, thus reducing the regional differences in the vulnerability of the WEFC system in the Yellow River Basin.
Finally, the study suggests that water resource development and utilization rate and carbon ecological carrying capacity coefficient are the primary driving factors for the spatial and temporal evolution concerning the vulnerability of the WEFC system in the Yellow River Basin. On the one hand, it is essential to pay strict attention to the combined impact of water resource development and utilization rate with other factors, to improve the efficiency of the use of resources, to enhance energy self-sufficiency through upgrading the energy structure, to reduce the emissions of industrial pollution, and to ensure the development of agricultural production so as to increase the per-capita disposable income of farmers, and strive to realize the reduction in the vulnerability of WEFC system. On the other hand, the regional carbon ecological carrying capacity should be focused on to avoid overloading the carbon ecological carrying pressure. Therefore, this can be accomplished by promoting carbon trading between regions and enhancing the upgrade of regional industrial structures and technological innovation to reduce carbon dioxide emissions. Additionally, measures such as strengthening the ecological protection of vegetation to enhance carbon sequestration can be conducive to alleviating the promotion of vulnerability in the WEFC system due to carbon ecological carrying pressure.
In summary, this study grounded in the study on the vulnerability of the WEFC system in the Yellow River Basin, provides detailed policy suggestions for the further development of various regions in this Basin. At the national level, it is mainly combined with the Fourteenth Five-Year Plan and the Strategy for Ecological Protection and High-Quality Development of the Yellow River Basin and other specific strategic guidelines to further consolidate China’s ecological barriers, revitalize the regional economy, and safeguard national water, energy, and food security, and a healthy carbon cycle.

Author Contributions

Writing—original draft preparation, M.L.; conceptualization, M.L. and L.T.; methodology, M.L.; writing—review and editing, M.L. and L.T.; supervision, L.T. All authors have read and agreed to the published version of the manuscript.

Funding

This research received no external funding

Informed Consent Statement

Not applicable.

Data Availability Statement

The data presented in this study are available on request from the corresponding author.

Conflicts of Interest

The authors declare no conflicts of interest.

References

  1. Song, M.; Hao, X.G.; Liu, J.B. Spatio-temporal evolution characteristics of carbon balance and decoupling effect of economic growth in the Yellow River Basin. Urban. Probl. 2021, 7, 91–103. [Google Scholar]
  2. Li, H.; Hu, Y.; Li, H.; Ren, J.; Shao, R.; Liu, Z. Assessing the Impact of Spatiotemporal Evolution of Urbanization on Carbon Storage in the Mega-Urban Agglomeration Area: Case Study of Yangtze River Delta Urban Agglomeration, China. Sustainability 2023, 15, 14548. [Google Scholar] [CrossRef]
  3. Hu, W.; Liu, J. The Coupling and Coordination of Urban Modernization and Low-Carbon Development. Sustainability 2023, 15, 14335. [Google Scholar] [CrossRef]
  4. Qi, Q.; Xu, Z.; Li, N.; Xie, C. Spatiotemporal distribution pattern and influencing factors of carbon emission in the Yellow River Basin. Environ. Pollut. Control 2023, 45, 577–582. [Google Scholar]
  5. Liu, L.; Chen, J.; Wang, C. Spatiotemporal evolution and influencing mechanism of water–energy–food–ecology vulnerability: A case study of Yangtze River Economic Belt, China. Resour. Environ. Yangtze Basin 2023, 32, 1628–1640. [Google Scholar]
  6. Sun, C.; Duan, X. Ecological sustainable development capacity assessment of water-energy-food system in the Yellow River Basin. Yellow River 2023, 45, 85–90. [Google Scholar]
  7. Wang, Y.; Song, J.; Zhang, X.; Sun, H.; Bai, H. Coupling coordination evaluation of water-energy-food and poverty in the Yellow River Basin, China. J. Hydrol. 2022, 614, 128461. [Google Scholar] [CrossRef]
  8. Huang, Y.; Huang, D. Decoupling Economic Growth from Embodied Water–Energy–Food Consumption Based on a Modified MRIO Model: A Case Study of the Yangtze River Delta Region in China. Sustainability 2023, 15, 10779. [Google Scholar] [CrossRef]
  9. Wang, S.; Yang, R.; Shi, S.; Wang, A.; Liu, T.; Yang, J. Characteristics and Influencing Factors of the Spatial and Temporal Variability of the Coupled Water–Energy–Food Nexus in the Yellow River Basin in Henan Province. Sustainability 2023, 15, 13977. [Google Scholar] [CrossRef]
  10. Zhang, B.; Xia, Q.; Dong, J.; Li, L. Changes and Vulnerability Analysis of Carbon Storage in the National Central City Based on Land Use/Land Cover: A Case Study of Wuhan City. SSRN Electron. J. 2022, 30, 443–452. [Google Scholar] [CrossRef]
  11. Chen, D.; Zhou, X.; Yang, S.; Pei, Y.; Hu, X.; Hu, F. Analysis of evolution carbon stock and its vulnerability characteristics based on land use change in Guizhou Province. Bull. Soil Water Conserv. 2023, 43, 301–309. [Google Scholar]
  12. Liu, S.; Wang, L.; Lin, J.; Wang, H.; Li, X.; Ao, T. Evaluation of Water-Energy-Food-Ecology System Development in Beijing-Tianjin-Hebei Region from a Symbiotic Perspective and Analysis of Influencing Factors. Sustainability 2023, 15, 5138. [Google Scholar] [CrossRef]
  13. Chen, A.; Hao, Z.; Wang, R.; Zhao, H.; Hao, J.; Xu, R.; Duan, H. Cultivated Land Sustainable Use Evaluation from the Perspective of the Water–Land–Energy–Food Nexus: A Case Study of the Major Grain-Producing Regions in Quzhou, China. Agronomy 2023, 13, 2362. [Google Scholar] [CrossRef]
  14. Zhou, Y.; Zhang, X.; Chen, Y.; Li, H. An Optimisation–Evaluation Framework for the Sustainable Management of the Water–Energy–Food Nexus for an Irrigation District under Uncertainty. Agronomy 2023, 13, 1714. [Google Scholar] [CrossRef]
  15. Dias, I.Y.P.; Lazaro, L.L.B.; Barros, V.G. Water–Energy–Food Security Nexus—Estimating Future Water Demand Scenarios Based on Nexus Thinking: The Watershed as a Territory. Sustainability 2023, 15, 7050. [Google Scholar] [CrossRef]
  16. Xia, S.; Yang, Y. Spatio-temporal differentiation of carbon budget and carbon compensation zoning in Beijing-Tianjin-Hebei Urban Agglomeration based on the Plan for Major Function-oriented Zones. Acta Geogr. Sin. 2022, 77, 679–696. [Google Scholar]
  17. Zhao, R.Q.; Zhang, S.; Huang, X.J.; Qin, Y.C.; Liu, Y.; Ding, M.; Jiao, S. Spatial variation of carbon budget and carbon balance zoning of Central Plains Economic Region at county-level. Acta Geogr. Sin. 2014, 69, 1425–1437. [Google Scholar]
  18. Zhang, Z.; Zhang, D. Spatial relatedness of CO2 emission and carbon balance zoning in Beijing Tianjin Hebei counties. China Environ. Sci. 2023, 43, 2057–2068. [Google Scholar]
  19. Zuo, Q.; Li, Q.; Yang, L.; Jing, R.; Ma, J.; Yu, L. Incorporating carbon sequestration toward a water-energy-food-carbon planning with uncertainties. Iscience 2023, 26, 107669. [Google Scholar] [CrossRef]
  20. Chen, H.; Zhou, S.; Han, Z. The spatial heterogeneity and the influencing factors of “water-soil-energy-grain-carbon” suitability. Ecol. Econ. 2023, 39, 115–122. [Google Scholar]
  21. Cui, C. Optimization of “Water-Energy-Food-Carbon” Ecosystem Service Function in the Middle and Lower Reaches of the Datong River Basin. Master’s Thesis, Lanzhou University, Lanzhou, China, 2023. [Google Scholar]
  22. Ren, H.; Liu, B.; Zhang, Z.; Li, F.; Pan, K.; Zhou, Z.; Xu, X. A water-energy-food-carbon nexus optimization model for sustainable agricultural development in the Yellow River Basin under uncertainty. Appl. Energy 2022, 326, 120008. [Google Scholar] [CrossRef]
  23. He, L.; Xu, Z.; Wang, S.; Bao, J.; Fan, Y.; Daccache, A. Optimal crop planting pattern can be harmful to reach carbon neutrality: Evidence from food-energy-water-carbon nexus perspective. Appl. Energy 2022, 308, 118364. [Google Scholar] [CrossRef]
  24. Pan, Y.; Chen, Y. Spatio-Temporal Evolution Measurement and Obstacle Factors of the Vulnerability of Water-Energy-Food-Ecology Nexus in the Yangtze River Economic Belt. Pol. J. Environ. Stud. 2022, 31, 4789–4805. [Google Scholar] [CrossRef] [PubMed]
  25. Liu, L.; Chen, J.; Wang, C. Spatiotemporal evolution and trend prediction of regional water–energy–food–ecology system vulnerability: A case study of the Yangtze River Economic Belt, China. Environ. Geochem. Health 2023, 45, 9621–9638. [Google Scholar] [CrossRef] [PubMed]
  26. Chen, J.; Yu, X.; Qiu, L.; Deng, M.; Dong, R. Study on Vulnerability and Coordination of Water-Energy-Food System in Northwest China. Sustainability 2018, 10, 3712. [Google Scholar] [CrossRef]
  27. Chen, Y.; Xu, L. Evaluation and scenario prediction of the water-energy-food system security in the yangtze river economic belt based on the RF-haken model. Water 2021, 13, 695. [Google Scholar] [CrossRef]
  28. Raya-Tapia, A.Y.; López-Flores, F.J.; Ponce-Ortega, J.M. Incorporating deep learning predictions to assess the water-energy-food nexus security. Environ. Sci. Policy 2023, 144, 99–109. [Google Scholar] [CrossRef]
  29. Yin, D.; Yu, H.; Lu, Y.; Zhang, J.; Li, G.; Li, X. A Comprehensive Evaluation Framework of Water-Energy-Food System Coupling Coordination in the Yellow River Basin, China. Chin. Geogr. Sci. 2023, 33, 333–350. [Google Scholar] [CrossRef]
  30. Gao, H.; Liu, X.; Wei, L.; Li, X.; Li, J. Assessment of sustainable agricultural development based on the water-energy-food nexus framework in the middle and upper reaches of the Yellow River, China. Environ. Sci. Pollut. Res. 2023, 30, 96040–96054. [Google Scholar] [CrossRef]
  31. Wang, J.; Bao, Z.; Zhang, J.; Wang, G.; Liu, C.; Wu, H.; Yang, Y. Spatio-Temporal Matching and Nexus of Water–Energy–Food in the Yellow River Basin over the Last Two Decades. Water 2022, 14, 1859. [Google Scholar] [CrossRef]
  32. Yin, D.; Yu, H.; Shi, Y.; Zhao, M.; Zhang, J.; Li, X. Matching supply and demand for ecosystem services in the Yellow River Basin, China: A perspective of the water-energy-food nexus. J. Clean. Prod. 2022, 384, 135469. [Google Scholar] [CrossRef]
  33. Ali, S.M.; Appolloni, A.; Cavallaro, F.; D’adamo, I.; Di Vaio, A.; Ferella, F.; Gastaldi, M.; Ikram, M.; Kumar, N.M.; Martin, M.A.; et al. Development Goals towards Sustainability. Sustainability 2023, 15, 9443. [Google Scholar] [CrossRef]
  34. Voukkali, I.; Zorpas, A.A. Evaluation of urban metabolism assessment methods through SWOT analysis and analytical hierocracy process. Sci. Total Environ. 2021, 807, 150700. [Google Scholar] [CrossRef] [PubMed]
  35. Tzanakakis, V.A.; Capodaglio, A.G.; Angelakis, A.N. Insights into Global Water Reuse Opportunities. Sustainability 2023, 15, 13007. [Google Scholar] [CrossRef]
  36. Uddin, M.S.; Mahmud, K.; Mitra, B.; Hridoy, A.E.; Rahman, S.M.; Shafiullah, M.; Alam, M.S.; Hossain, M.I.; Sujauddin, M. Coupling Nexus and Circular Economy to Decouple Carbon Emissions from Economic Growth. Sustainability 2023, 15, 1748. [Google Scholar] [CrossRef]
  37. Gandidzanwa, C.P.; Togo, M. Adaptive Responses to Water, Energy, and Food Challenges and Implications on the Environment: An Exploratory Study of Harare. Sustainability 2022, 14, 10260. [Google Scholar] [CrossRef]
  38. Papadopoulou, C.; Papadopoulou, M.P.; Laspidou, C. Implementing Water-Energy-Land-Food-Climate Nexus Approach to Achieve the Sustainable Development Goals in Greece: Indicators and Policy Recommendations. Sustainability 2022, 14, 4100. [Google Scholar] [CrossRef]
  39. Naidoo, D.; Nhamo, L.; Lottering, S.; Mpandeli, S.; Liphadzi, S.; Modi, A.T.; Trois, C.; Mabhaudhi, T. Transitional Pathways towards Achieving a Circular Economy in the Water, Energy, and Food Sectors. Sustainability 2021, 13, 9978. [Google Scholar] [CrossRef]
  40. Pan, Y.; Chen, Y.; Liu, Y. Vulnerability evaluation and prediction of the water-energy-food-ecology nexus in the Yangtze River Economic Belt based on TOPSIS, neighborhood rough set and support vector machine. Front. Environ. Sci. 2022, 10, 944075. [Google Scholar] [CrossRef]
  41. Luo, H.; Wang, J.; Hu, X.; Li, Z. Study on coupling of vulnerability of food security and ecological security in major grain producing areas. J. Stat. Inf. 2023, 38, 117–128. [Google Scholar]
  42. Wang, Y.; Song, S.; Wang, J.; Li, H.; Xu, D.; Li, L. Vulnerability evolution of the ecological-economic-social complex system and the key influencing factors in the sandy region of Inner Mongolia from 2000 to 2018. Acta Ecol. Sin. 2023, 43, 2271–2286. [Google Scholar]
  43. Li, M.; Chen, S. Synergetic evolution of economic growth and carbon neutrality process of Chinese cities. Urban Environ. Stud. 2022, 4, 94–110. [Google Scholar]
  44. Xu, H.; Wang, Y.; Zhang, Z.; Gao, Y.; Zhang, D. Coupling mechanism of water-energy-food and spatiotemporal evolution of coordinated development in the Yellow River Basin. Resour. Sci. 2021, 43, 2526–2537. [Google Scholar] [CrossRef]
  45. Zhang, K.Y.; Zhang, Y. The evolution of regional economic disparity in the Yellow River Basin at different spatial scales. Econ. Gepgraphy 2020, 40, 1–11. [Google Scholar]
  46. Zhou, X.; Hao, H.; Ye, X.; Qin, Y.; Ma, X. A spatial-temporal analysis of regional economic inequality in Yellow River Valley. Hum. Geogr. 2016, 31, 119–125. [Google Scholar]
  47. Wang, J.; Xu, C. Geo-detector: Principle and prospective. Acta Geogr. Sin. 2017, 72, 116–134. [Google Scholar]
  48. Li, M.N.; Cai, S.; Tan, C.L. An analysis of situation of economic spatial dissimilarity in the Yellow River Valley. Econ. Geogr. 2011, 31, 379–389. [Google Scholar]
  49. Chen, J.; Gao, M.; Cheng, S.; Hou, W.; Song, M.; Liu, X.; Liu, Y.; Shan, Y. County-level CO2 emissions and sequestration in China during 1997–2017. Sci. Data 2020, 7, 391. [Google Scholar] [CrossRef]
  50. Zhang, Y.; Tian, Y. Decoupling condition between carbon emission and economic growth in Yellow River Basin urban agglomeration and its driving factors. Yellow River 2023, 45, 30–35. [Google Scholar]
  51. Zhong, W.; Gao, H.; Xu, W.; Yu, X. Exploring carbon peaking pathways and trends from a multiclustering perspective: Analysis based on panel data of 21 cities in Guangdong Province. South China J. Econ. 2021, 40, 58–79. [Google Scholar]
Figure 1. Trends of WEFC system vulnerability in the Yellow River Basin and the upper middle and lower reaches from 2010 to 2019.
Sustainability 16 01002 g001
Figure 2. Spatial distribution pattern of WEFC system vulnerability in the Yellow River Basin from 2010 to 2019.
Sustainability 16 01002 g002
Figure 3. Dynamic evolution of WEFC system vulnerability in the Yellow River Basin.
Sustainability 16 01002 g003
Figure 4. Theil index decomposition of WEFC system vulnerability in the Yellow River Basin from 2010 to 2019. (a) The evolving trends of inter-regional and intra-regional disparities in WEFC system vulnerability in the upper reaches, middle reaches, and lower reaches regions of the Yellow River Basin from 2010 to 2019. (b) The contributions of inter-regional and intra-regional disparities in WEFC system vulnerability in the upper reaches, middle reaches, and lower reaches regions of the Yellow River Basin to the overall regional WEFC system vulnerability disparity from 2010 to 2019.
Sustainability 16 01002 g004
Figure 5. Global Moran’s index of WEFC system vulnerability in the Yellow River Basin from 2010 to 2019.
Sustainability 16 01002 g005
Figure 6. Local spatial clustering map of WEFC system vulnerability in the Yellow River Basin from 2010 to 2019.
Sustainability 16 01002 g006
Figure 7. Detection ranking of driving factors for WEFC system vulnerability in the Yellow River Basin from 2010 to 2019.
Sustainability 16 01002 g007
Figure 8. Detection results of driving factors for WEFC system vulnerability in the Yellow River Basin from 2010 to 2019.
Sustainability 16 01002 g008
Figure 9. Detection results of driving factors for WEFC system vulnerability in the upper, middle, and lower reaches of the Yellow River Basin from 2010 to 2019.
Sustainability 16 01002 g009
Figure 10. Interaction detection results of driving factors for WEFC system vulnerability in the Yellow River Basin from 2010 to 2019.
Sustainability 16 01002 g010
Table 1. Evaluation index system for WEFC system vulnerability.
Evaluation Index System ImpactMeanMaxMinStd.Dev
Vulnerability of the
WEFC nexus
Vulnerability of water
subsystem
ExposureX1 Urbanization rate (%)+53.4595.1619.7015.15
X2 Per capita water consumption (cubic meters per person)+376.373084.1972.00449.14
X3 Ecological environment water usage rate (%)4.4732.040.004.79
X4 Wastewater discharge (10,000 cubic meters)+8446.0473,589.00300.0010,520.63
X5 Reclamation rate (%)+30.4068.491.4918.09
X6 Population density (people per square kilometer)+380.321440.3717.53305.99
SensitivityX7 Population supported by one million cubic meters of water resources (person)+5119.2834,896.88324.024412.65
X8 Water production coefficient0.170.440.020.09
X9 Water resources development and utilization rate (%)+2.2522.830.023.60
X10 Water consumption per 10,000-yuan GDP (cubic meters)+99.50869.007.77127.50
X11 Average temperature change rate (%)+0.5631.28−12.075.29
X12 Per capita GDP (yuan)50,062.12256,877.005304.0034,642.72
X13 Precipitation (mm)531.248235.0090.00359.88
AdaptabilityX14 Sewage treatment rate (%)91.30104.7141.148.48
X15 Green coverage rate in built-up areas (%)38.2548.012.696.52
X16 Per capita underground water reserves (cubic meters per person)104.711296.65−53.95132.69
X17 Artificial afforestation area (ha)15,099.45104,143.00182.0013,498.78
Vulnerability of energy subsystem ExposureX18 GDP proportion of secondary industry (%)+49.5373.7115.6011.49
X19 Industrial wastewater emissions (10,000 tons)+5236.4328191.0048.005142.22
X20 Industrial dust emissions (tons)+34,116.77260,939.00450.0038,296.66
X21 Energy consumption intensity (ton standard coal per 10,000 yuan)+0.090.910.010.11
X22 Industrial SO2 emissions (tons)+56,685.44305,987.00917.0051,421.53
SensitivityX23 Unit GDP energy consumption change rate (%)+4.28651.37−93.0949.01
X24 Energy self-sufficiency rate (%)63.651372.170.00172.63
X25 Per capita primary energy production (ton standard coal per person)13.32273.310.0033.57
X26 Coal consumption proportion (%)+78.0499.620.0016.69
AdaptabilityX27 Energy conservation and environmental protection expenditure (10,000 yuan)103,260.311,774,800.006000.00121,959.48
X28 Energy consumption elasticity coefficient+2.05267.74−102.2114.11
X29 Comprehensive utilization rate of general industrial solid waste (%)73.77106.450.2424.38
Vulnerability of food
subsystem
ExposureX30 Urban registered unemployment rate (%)+3.084.411.210.68
X31 Fertilizer application per unit sown area (kg/ha)+438.152022.880.28301.74
X32 Labor force per unit of cultivated area (person/ha)+2.1610.680.481.19
X33 Per capita arable land area (hectares per person)0.120.430.010.08
X34 Per capita grain sown area (ha)0.100.240.010.05
SensitivityX35 Engel Coefficient (%)+29.8545.1720.414.33
X36 Grain Total Quantity Volatility Rate (%)+6.0060.460.007.53
X37 Proportion of grain sown area (%)0.740.970.000.12
X38 Proportion of agricultural output value (%)9.9730.580.796.59
X39 Per capita grain possession (kg per person)499.191559.8150.25248.28
X40 Expenditure on health and wellness (100 million yuan)26.14115.193.4218.01
AdaptabilityX41 Gross power of agricultural machinery per unit of sown area (kW/ha)7.5023.880.003.33
X42 Cultivated land replanting index2.56729.060.6329.72
X43 Grain yield per unit area (kg/ha)5178.969102.841608.911541.22
X44 Per capita disposable income of farmers (yuan)10,229.9423,536.002299.003937.04
X45 Investment in agriculture, forestry, and water conservation (100 million yuan)34.95115.793.7918.29
X46 Effective irrigation rate (%)0.401.340.000.21
X47 Education level49,375.09330,373.00117.0051,917.19
Vulnerability of carbon
subsystem
ExposureX48 Carbon emissions (million tons)+35.77121.135.2020.28
SensitivityX49 Carbon sequestration (million tons)19.1871.360.4714.19
AdaptabilityX50 Carbon ecological carrying capacity coefficient1.4616.120.032.22
Table 2. Classification of interaction effects.
CriterionInteraction Classification
q X 1 X 2 < m i n q X 1 , q X 2 Non-linear weakening
m i n q X 1 , q X 2 < q X 1 X 2 < m a x q X 1 , q X 2 Single-factor non-linear weakening
q X 1 X 2 > m a x q X 1 , q X 2 Dual-factor enhancement
q X 1 X 2 = q X 1 + q X 2 Mutually independent
q X 1 X 2 > q X 1 + q X 2 Non-linear enhancement
Table 3. Primary driving factors of WEFC system vulnerability in the Yellow River Basin for the years 2010, 2013, 2016, and 2019.
2010201320162019
Driving Factorsq-ValueDriving Factorsq-ValueDriving Factorsq-ValueDriving Factorsq-Value
X90.694X90.784X90.681X90.750
X470.436X20.681X500.493X430.512
X130.405X70.620X130.388X500.510
X500.369X210.541X480.360X70.481
X10.321X130.503X40.336X460.473
X200.311X500.464X490.291X10.468
X380.296X460.448X170.281X440.398
X220.296X10.432X240.246X480.386
X240.288X200.395X470.243X170.350
X440.285X480.353X140.216X240.337
Disclaimer/Publisher’s Note: The statements, opinions and data contained in all publications are solely those of the individual author(s) and contributor(s) and not of MDPI and/or the editor(s). MDPI and/or the editor(s) disclaim responsibility for any injury to people or property resulting from any ideas, methods, instructions or products referred to in the content.

