Article

Biochar Application Reduces Saline–Alkali Stress by Improving Soil Functions and Regulating the Diversity and Abundance of Soil Bacterial Community in Highly Saline–Alkali Paddy Field

Agronomy College, Jilin Agricultural University, Changchun 130118, China
*
Author to whom correspondence should be addressed.
These authors contributed equally to this work.
Sustainability 2024, 16(3), 1001; https://doi.org/10.3390/su16031001
Submission received: 2 January 2024 / Revised: 22 January 2024 / Accepted: 22 January 2024 / Published: 24 January 2024

Abstract

:
Saline–alkali soils seriously restrict the soil functions and the growth and diversity of soil microorganisms. Biochar can alleviate the negative effects of saline–alkali stress. However, it remains unclear how biochar reduces saline–alkali stress by improving soil functions and regulating the abundance and diversity of the soil bacterial community in highly saline–alkali paddy fields. To address this, a paddy field experiment was conducted in a highly saline–alkali paddy field using two nitrogen application levels (0 and 225 kg ha−1) and four biochar application rates (0, 1.5%, 3.0%, and 4.5% biochar, w/w). The results show that, compared with C0, biochar application, especially when combined with N fertilizer, significantly decreased the soil pH, exchangeable sodium percentage (ESP), saturated paste extract (ECe), and sodium adsorption ratio (SAR) while significantly increasing cation exchange capacity (CEC). These indicated that biochar can effectively reduce saline–alkali stress. Biochar application significantly increased soil content of total nitrogen (TN), alkali-hydrolysable N (AN), available P (AP), available K (AK), soil organic matter (SOM), and soil C/N ratio, both with or without N fertilization. Furthermore, biochar application further increased the relative abundance of bacterial communities and modified the bacterial community structure in highly saline–alkali paddy soils. Under C3N2, C2N2, and C1N2, Chao1 increased by 10.90%, 10.42%, and 1.60% compared to C0N2. Proteobacteria, Bacteroidetes, and Chloroflexi were the top three phyla in bacterial abundance. Biochar significantly increased the abundance of Proteobacteria while reducing Bacteroidetes and Chloroflexi, regardless of N fertilization. Correlation analysis results showed that the improvements in soil chemical and saline–alkali properties, as well as nutrient bioavailability after biochar application, had a positive effect on bacterial communities in highly saline–alkali paddy soils.

1. Introduction

Soil salinity and alkalinity present significant ecological challenges to soil fertility and plant development. The Songnen Plain, situated in the northeastern region of China, spans 17.0 million hectares, with approximately 20.12% of its area—equivalent to 3.42 million hectares—designated as saline–alkali lands, making it one of the world’s top three largest expanses of such soils [1]. The main salt components in the soils of Songnen Plain are Na2CO3 and NaHCO3; the soil also contains a small amount of chloride and sulfate. A high concentration of Na+ and a high sodium adsorption ratio (SAR), exchangeable sodium percentage (ESP), and pH at the topsoil are characteristics of saline–alkali soils [2]. These factors have led to the degradation of soil structure, altered soil hydraulic properties, disrupted nutrient availability for plants, and reduced water permeability [3]. This severely hampers agricultural activities in such soil types [4]. In addition, the saline–alkali lands in Songnen Plain are expanding at an annual rate of 20,000 hectares, primarily driven by population growth, overgrazing, and inappropriate agricultural practices that have been carried out for years [1]. At present, soil salinization has become the most important factor hindering agricultural development in Songnen Plain, and it is also the primary problem of the agricultural ecological environment. Therefore, to tackle the issues related to global food security, it is crucial to reclaim and cultivate unproductive saline–alkali soils [5].
Soil microorganisms play a crucial role in mediating the impacts of saline–alkali stress on soil health, plant growth, and overall ecosystem functioning. They achieve this by participating in key soil processes such as organic matter decomposition, nutrient conversion, soil aggregation, and structure enhancement [6,7]. However, soil salinity and sodicity can have adverse effects on microbial growth, activity, and diversity through several mechanisms, including (i) salt toxicity [8,9]; (ii) decreased availability of water due to osmotic stress [10]; (iii) disintegration of soil aggregates and impaired soil structure, creating an inhospitable environment for microbial growth [11]; and (iv) diminishing organic matter content, resulting in limited energy substrates available for microorganisms [12]. Hence, gaining insights into methods for mitigating saline–alkali stress and improving the abundance and diversity of soil microorganisms is essential for remediating soil function and enhancing crop yields in highly saline–alkali lands.
Because of its multiple benefits, biochar shows promise as a potential solution for rehabilitating salt-affected soils when used as a soil amendment [5,13,14]. Recent studies have demonstrated that adding biochar can mitigate nutrient loss in salt-affected soils by enhancing the soil organic matter (SOM), nutrient bioavailability, cation exchange capacity (CEC), and soil surface area and stabilizing the soil structure [15,16,17]. Our prior studies demonstrated that biochar could significantly improve the physical and chemical characteristics of soil, enhance nutrient content, and boost soil enzyme activity in highly saline–alkali soils [18,19]. Additionally, biochar could significantly reduce sodium ion concentration in root zone soils, minimize sodium ion accumulation in rice organs, ameliorate saline–sodic stress on rice, and, consequently, enhance rice yield [20,21,22]. Numerous investigations have emphasized the potential of biochar to create a favorable habitat for soil microorganisms, stimulate their proliferation, and augment their activity and diversity in salt-affected soils [7,23,24,25]. This is achieved by mitigating salinity and sodicity stress, enhancing the soil’s physical characteristics [23,26,27], releasing soil nutrients accessible to microorganisms [28], encouraging the release of dissolved organic carbon and nitrogen through root exudation [7,29], and providing a substantial carbon source for microbial utilization [30]. Nevertheless, numerous prior experiments have indicated that biochar had negligible impacts on microbial biomass carbon in both non-saline soils [31,32] and saline soils [26,33,34]. Many studies have even documented a decline in soil microbial biomass carbon when biochar is applied [35]. These conflicting results can be attributed mainly to diverse soil types, crop varieties, and types of biochar as well as their intricate interactions [14]. Most of the existing research has predominantly concentrated on dryland crops in controlled laboratory or pot settings, with an emphasis on saline stress, alkali stress, or coastal salt–alkali stress. However, research focused on the reduction in saline–alkali stress through biochar application, aimed at improving soil functions and regulating the abundance and diversity of the soil bacterial community in highly saline–alkali paddy fields in Northeast China, remains unexplored. Hence, further field experiments are imperative to examine the influence of biochar incorporation on soil functions and the bacterial community in highly saline–alkali paddy fields.
In the current study, we hypothesized that peanut shell biochar establishes a partnership with bacteria by improving the soil’s physicochemical properties, nutrient bioavailability, and porous structure, thereby reducing the stress of saline–alkali and improving the functions of saline–alkali soils. This study aimed to evaluate the influence of peanut shell biochar on bacterial alpha diversity, bacterial beta diversity, relative abundance of bacteria, soil chemical characteristics, and soil nutrient availability in highly saline–alkali paddy soils. Additionally, we aimed to investigate the relationship between bacterial communities and soil environment. Furthermore, we studied the optimum amount of peanut shell biochar and its co-occurrence pattern with soil bacterial communities in highly saline–alkali paddy soils. The results of the study will establish a novel theoretical foundation for understanding how biochar can influence the tolerance of rice plants to saline–alkali conditions.

2. Materials and Methods

2.1. Experimental Site and Experimental Soil’s Properties

The field experiment took place at the Saline–Alkali Research Base of Jilin Agriculture University, located in Da’an City, Jilin Province, China (45°35′ N, 123°50′ E), in 2021. The average annual precipitation, evaporation, and temperature at the experimental site were 415.49 mm, 1697.11 mm, and 4.69 °C, respectively. According to the classification by the International Society of Soil Science, the soil texture in our trial comprises 23.23% sand, 38.14% silt, and 37.60% clay. The fundamental physicochemical characteristics of the topsoil layer (0–20 cm) used in this experiment are displayed in Table 1.

2.2. The Properties of Biochar

The biochar was derived from peanut shells through pyrolysis in a vertical kiln manufactured by LuSen Toner Technology Ltd., located in Qiqihaer City, China. The pyrolysis process was conducted at temperatures ranging from 350 to 550 °C for 4 h. Table 2 provides the physiochemical characteristics of the biochar. In the spring of 2021, biochar was evenly distributed over the surface of saline–alkali paddy soils, and, subsequently, it was carefully incorporated into the topsoil (0–20 cm) with the assistance of a wooden rake before transplanting rice.

2.3. Design and Field Practices for the Experiment

The field experiment employed a split-plot design, with nitrogen levels designated as the primary plot factors and biochar application rates as the secondary plot factors. The two nitrogen levels consisted of no nitrogen application (N0) and conventional nitrogen application level (N2). There were four biochar application rates, namely, C0 (no biochar), C1 (1.5% biochar, w/w), C2 (3.0% biochar, w/w), and C3 (4.5% biochar, w/w), respectively. Each treatment was repeated three times, and a total of 24 plots of 6 m × 5 m in size were established in April 2021. Buffer zones, 0.6 m in width, separated each experimental plot, and each plot had its own irrigation and drainage outlet.
The Japonica rice (Oryza sativa L.) cultivar, Changbai 9, was sown in the greenhouse on 10 April. On 16 May 2021, the seedlings were transplanted into the experimental plots, with rows spaced 0.3 m apart and individual plants placed 0.2 m from one another. Each hill included three seedlings. The rice was harvested on October 1st. In the N2 treatment, nitrogen fertilizer was applied at a rate of 225 kg N per hectare, with 50% applied as basal fertilizer (urea, 46% N), 20% applied 15 days after rice seedlings were transplanted (ammonium sulfate, 21% N), and the remaining 30% applied at the early flowering stage (urea, 46% N). The phosphate fertilizer (triple superphosphate, 50% P2O5), as the basal fertilizer, was added at 75 kg per hectare. As for the potassium fertilizer (potassium sulfate, 40% K2O), 100 kg per hectare was applied, with 60% used as basal fertilizer and 40% applied during the early flowering stage. In contrast, for the N0 treatment, there were no additional amounts of nitrogen (0 kg N per hectare), but phosphate fertilizer was applied at 75 kg P per hectare, and potassium fertilizer was applied at 100 kg K per hectare; the application of phosphate and potassium fertilizer matched the procedures used in the N2 treatment. All other field management practices followed the local production standards.

2.4. Examination of Soil Chemical and Nutrient Characteristics

After the harvest, three topsoil samples (0–20 cm) were randomly gathered from each plot using an auger, followed by air-drying and sieving the soil samples through a 2 mm mesh. The levels of Na+ and K+ were determined using a Flame photometer (M410, Sherwood Scientific Ltd., Cambridge, UK). The concentration of Ca2+ was assessed using an Atomic Absorption Spectrophotometer (AA-6300, Shimadzu, Shanghai, China). Soil pH was measured in a 1:5 soil: water (w/v) ratio using a pH meter (Mettler Toledo International Trade Co., Ltd., Shanghai, China). Soil EC (1:5) was measured by using a DDS 307 conductivity meter (Shanghai Precision Scientific Instrument Co., Ltd., Shanghai, China). Based on Chi and Wang [36], the EC of saturated paste extract (ECe) was estimated following Formula (1):
ECe = 10.88 × EC1:5
The sodium absorption ratio (SAR) was computed following Formula (2). Subsequently, the SAR of saturated paste extract (SARe) was estimated as per the method outlined by Chi and Wang [36], using Formula (3).
SAR 1 : 5 = Na + ( Ca 2 + + Mg 2 + ) / 2
SARe = 13.19 × SAR1:5
The soil cation exchange capacity (CEC) was ascertained following the Bower saturation method [2]. The exchange sodium percentage (ESP) was computed using Formula (4):
ESP   ( % ) = Exchangeable   Na + CEC
The soil samples, air-dried and sieved through a 2 mm mesh, were used to determine the soil’s total nitrogen content (TN), alkali-hydrolyzable nitrogen content (AN), available phosphorus content (AP), available potassium content (AK), and soil organic matter content (SOM). According to the soil analytical methods described by Bao [37], the content of soil TN, AN, AP, AK, and SOM were measured. The total organic carbon content was assessed through the dry combustion method, as described by Jin et al. [38], using an Elementar Vario Macro Cube CNS Analyzer (Elementar Company, Hanau, Germany).

2.5. Extraction of DNA and High-Throughput Sequencing

Total soil DNA was extracted from fresh soil using the Fast DNA SPIN Kit (MP Bio Laboratories, Carlsbad, CA, USA), following the manufacturer’s guidelines. To assess the bacterial community composition, the V3-V4 region of the 16S rRNA gene was amplified using the following primers: 341F (5′-ACTCCTACGGGAGGCAGCA-3′) and 785R (5′-GGACTACHVGGGTWTCTAAT-3′). The PCR amplicons were employed to create the sequencing library, which was subsequently sequenced using the Illumina NovaSeq platform (Illumina, San Diego, CA, USA). The raw sequencing data were analyzed through QIIME2 (https://view.qiime2.org/, accessed on 15 December 2021). The vsearch plug-in was utilized to merge the paired sequences, followed by the application of the quality filter plug-in. The effective sequencing data were processed to eliminate redundancy within the bacterial sequences, resulting in representative sequences, using the deblur plug-in.

2.6. Data Analysis

One-way ANOVA was used to assess the significant difference of related measured indexes among biochar treatments. A t-test was performed to compare nitrogen factors. A two-way ANOVA was conducted to ascertain both the main effects and interaction effects between biochar treatment and nitrogen levels. SPSS 18.0 software (IBM Corp., Armonk, NY, USA) was used to conduct ANOVA and the least significant difference test (LSD). Origin Pro 2023 (OriginLab Inc., Northampton, MA, USA) was used to conduct the Pearson correlation analysis and plot figures.

3. Results

3.1. Soil Chemical Properties

It was found that the soil pH exhibited a trend of C0 > C1 > C2 > C3 with or without N fertilization. The difference between biochar application treatments (C1, C2, and C3) and C0 reached a significant level (Table 3). Additionally, biochar combined with nitrogen fertilizer was beneficial in decreasing the soil pH value. The pH was 2.77% lower in N2 treatment than in N0 treatment. The ESP, ECe, and SARe reduced significantly with the amount of biochar application, both with or without N fertilization, but the CEC value exhibited a trend of C3 > C3 > C1 > C0 (Table 3). Under N2, the various biochar treatments significantly reduced ESP (50.60–68.60%), ECe (54.58–78.63%), and SARe (53.79–64.29%) compared with C0, whereas the CEC increased by 29.84%, 41.62%, and 48.08%, respectively. Moreover, biochar combined with nitrogen fertilizer significantly decreased soil ESP, ECe, and SARe by 12.98%, 15.78%, and 11.37%, respectively, and enhanced CEC by 6.40% compared to biochar application alone. The results of the two-way ANOVA revealed significant interactions between biochar treatments and nitrogen application levels concerning soil pH, ESP, ECe, SARe, and CEC.

3.2. Soil Nutrient Status

Biochar application significantly increased the soil content of TN, AP, AK, and SOM and C/N ratio, with or without nitrogen fertilization application (Table 4). The TN, AP, AK, SOM, and C/N ratio increased with the biochar application rate, and the differences in all biochar application treatments reached a significant level. Soil TN increased by 138.89% in C3N0 treatment compared to C0N0, and by 161.90% under C3N2 compared to C0N2. The soil AP was enhanced by 203.74% under C3N0, 117.93% under C2N0, and 60.83% under C1N0 treatment as compared with C0N0. The soil AP increased by 209.20%, 127.98%, and 56.56% in the C3N2, C2N2, and C1N2 treatments, respectively, compared to C0N2. Compared with C0, the application of biochar at different rates (C1, C2, and C3) increased the AK by 88.92–116.15%, 117.93–127.98%, and 203.74–209.20%, respectively. SOM and the C/N ratio increased by 200.00% and 157.62% in C3N0 treatment compared to C0N0 and increased by 217.05% and 76.29% under C3N2 compared to C0N2, respectively. The AN exhibited a trend of C2 > C3 > C1 < C0 with or without N fertilization, and the difference between biochar application treatments (C1, C2, and C3) and C0 reached a significant level, but no significant difference between C1 and C2 was found. In addition, the TN, AN, AP, AK, and SOM in the N2 treatment exceeded those in the N0 treatment, while the C/N ratio was lower in the N2 treatment compared to the N0 treatment (Table 4). The two-way ANOVA results revealed a significant interaction effect between biochar treatments and nitrogen fertilizer on TN, AN, AP, AK, SOM, and C/N ratio.

3.3. Alpha Diversity of the Bacterial Communities

Table 5 shows that biochar application had no significant impact on Chao1 under N0 treatment. However, under N2 treatment, Chao1 showed increases of 10.90%, 10.42%, and 1.60% for C3, C2, and C1 compared to C0, respectively. Significant differences were observed between C3, C2, and C0. Additionally, biochar combined with nitrogen fertilizer was beneficial for increasing the Chao1. Under N0 treatment, Simpson demonstrated a trend of C3 > C1 > C2 > C0, with a significant difference observed only between C3 and C0. Under N2 treatment, the treatments involving biochar application showed no significant impact on Simpson compared to C0, the highest biochar application rate treatment (C3) resulted in the maximum Simpson value. Additionally, biochar combined with nitrogen fertilizer was beneficial for increasing the Simpson value. The Simpson value was 15.77% higher in N2 treatment than in N0 treatment. The Shannon value was ranked as C3 > C1 > C0 > C2, irrespective of the presence or absence of N fertilization treatment; however, no significant differences were observed among all biochar application treatments. Biochar combined with nitrogen fertilizer was beneficial for increasing the Shannon value. The number of OTUs followed the order C0 < C1 < C2 < C3, both with or without N fertilization. A significant difference was observed between C3 and C0. The number of OTUs increased by 37.15% under the C3N0 treatment, 17.98% under the C2N0 treatment, and 9.05% under the C1N0 treatment in comparison to C0N0. Similarly, there were increases of 15.32.80%, 8.83%, and 7.97% in the C3N2, C2N2, and C1N2 treatments, respectively, compared to C0N2. The number of OTUs in the biochar application combined with nitrogen fertilizer was 15.02% higher than that in biochar application alone. Two-way ANOVA indicated that a significant interaction effect was observed between biochar treatments and nitrogen fertilizer regarding Chao1 and the number of operational taxonomic units (OTUs).

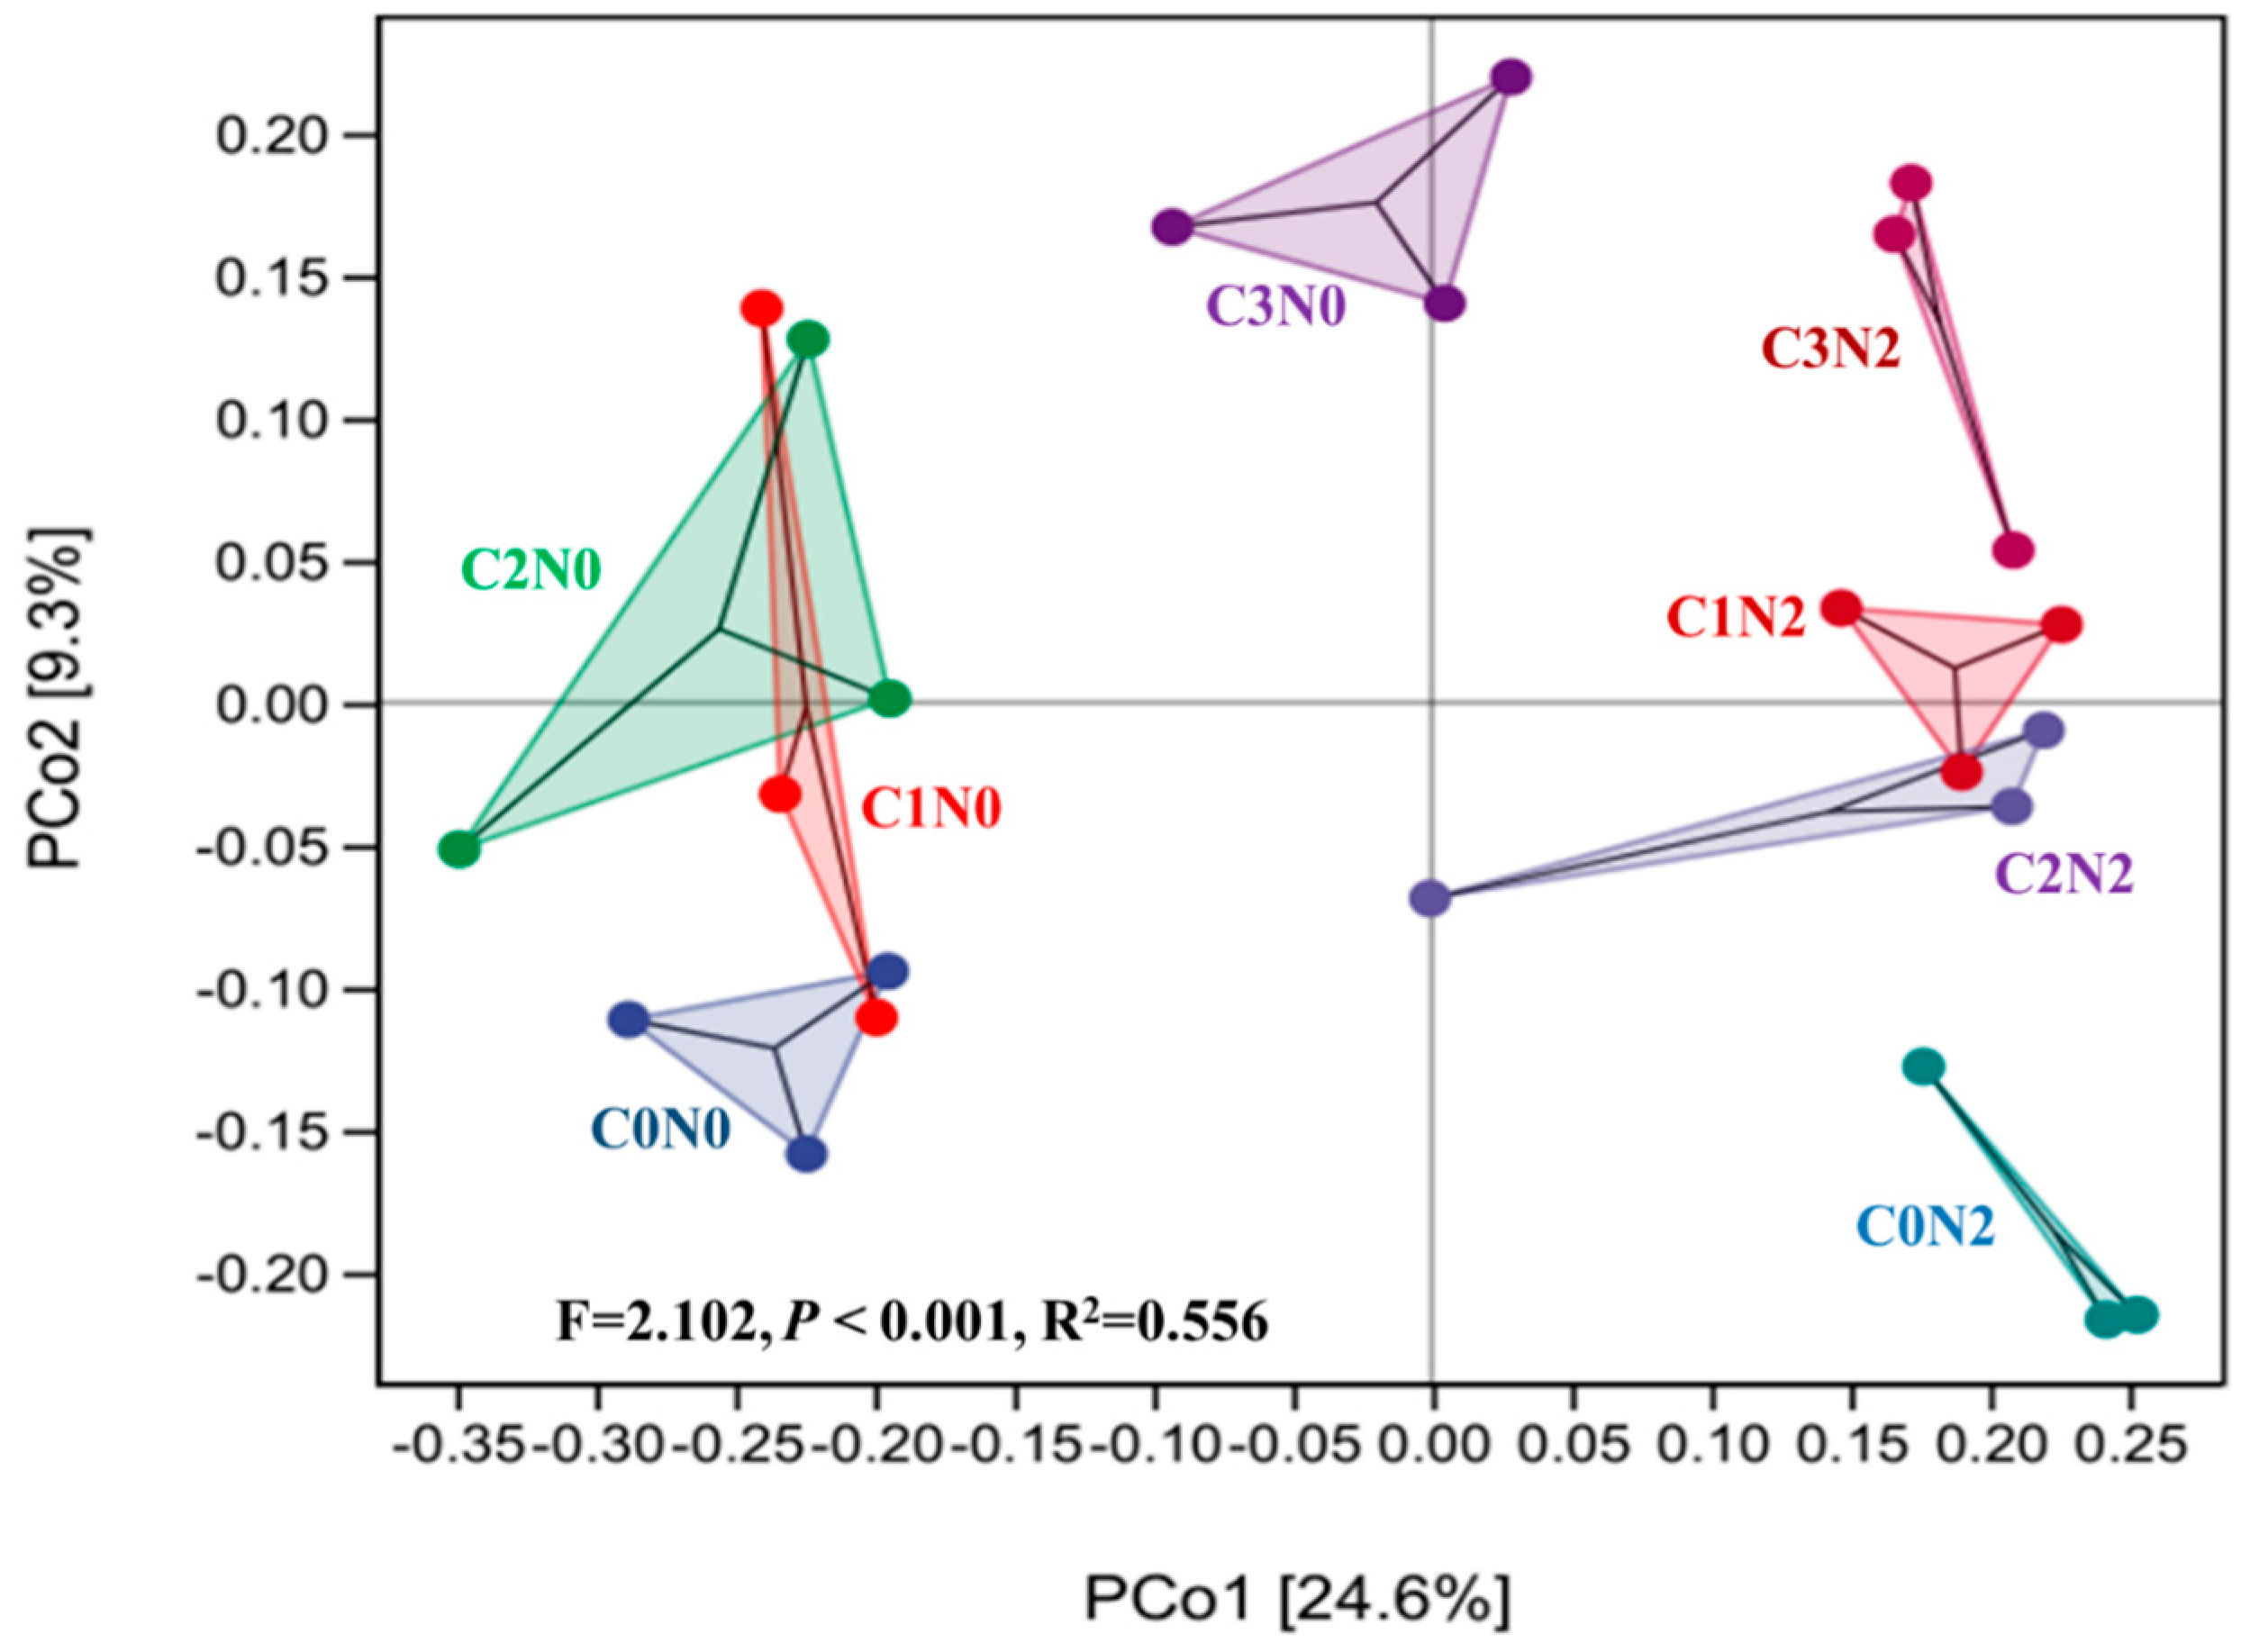
3.4. Beta Diversity of the Bacterial Communities

The composition of soil bacterial communities showed significant variations across different treatments (p < 0.001), as indicated by the outcome of the unweighted UniFrac distance analysis (Figure 1). Notably distinct bacterial communities were found in the case of the zero biochar (C0) treatment, whether with or without N fertilization (C0N0 and C0N2). The bacterial communities in the plots treated with biochar at rates C1 (1.5% biochar, w/w) and C2 (3.0% biochar, w/w) displayed a relatively similar composition to each other but differed from the bacterial communities in the fields where no biochar (C0) was applied, regardless of N fertilization. Moreover, with the further increase in the biochar application ratio, the bacterial communities under C3 treatment (4.5% biochar, w/w) were different from those of C0, C1, and C2 with or without N fertilization treatment.

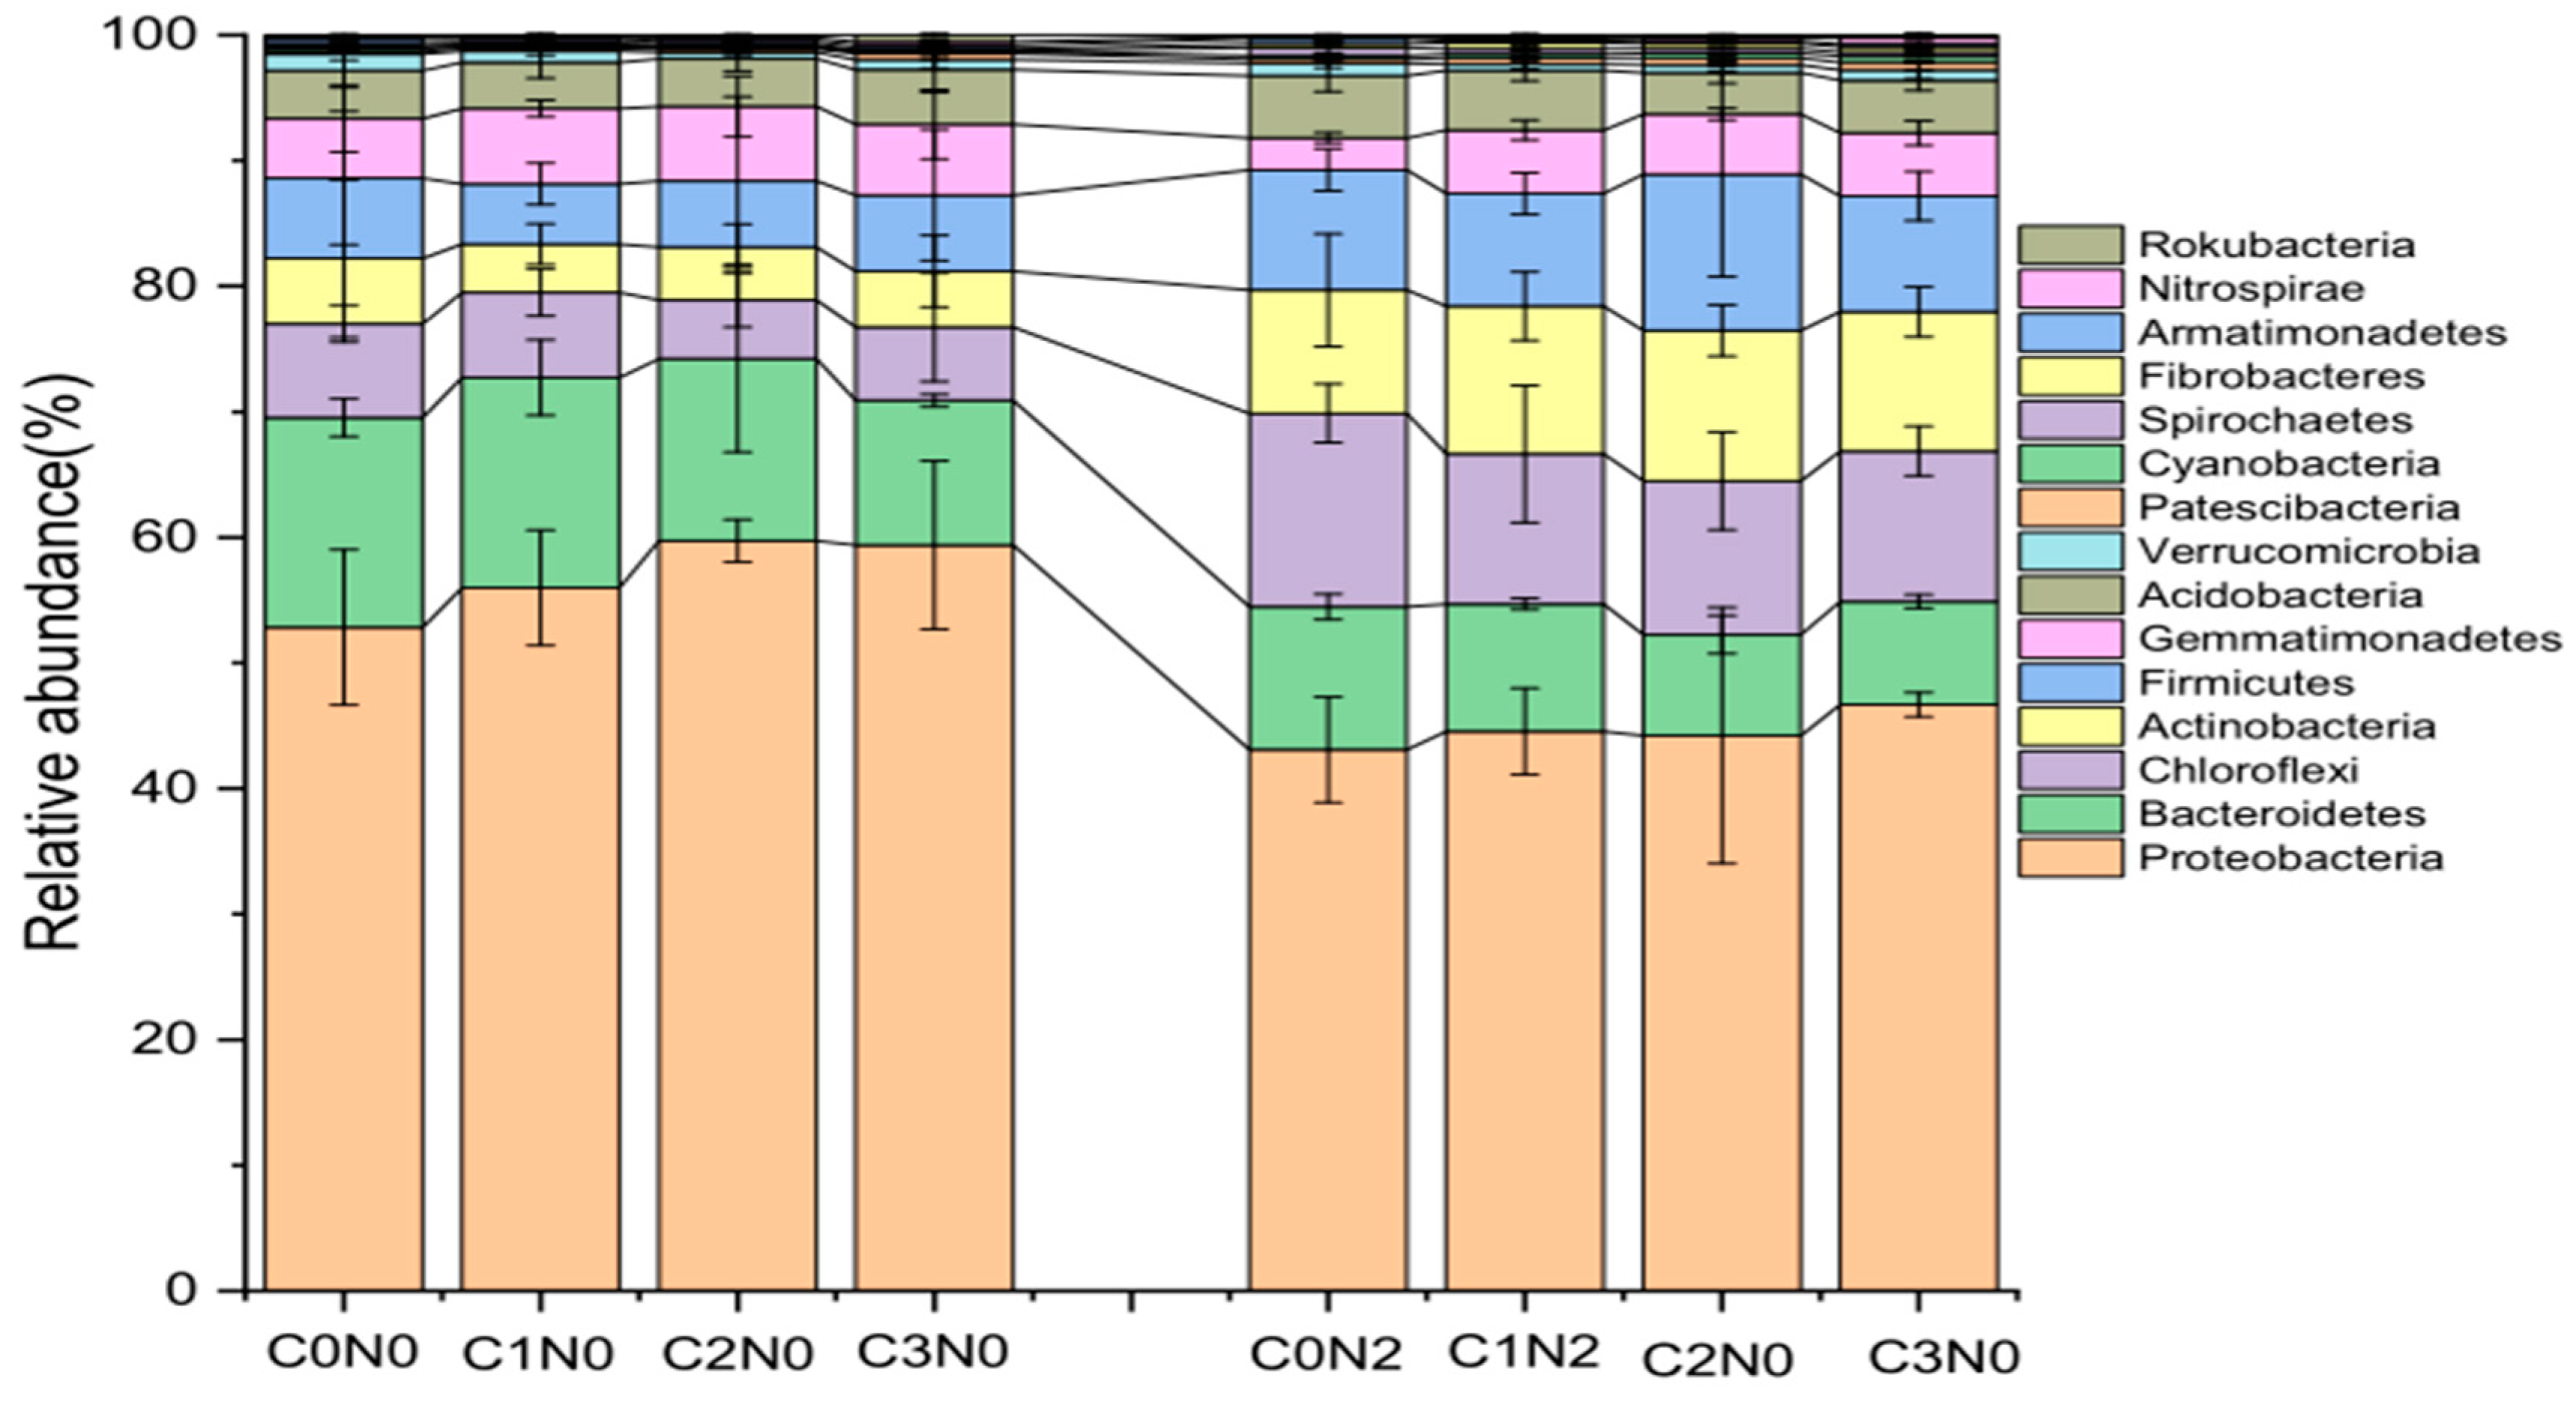
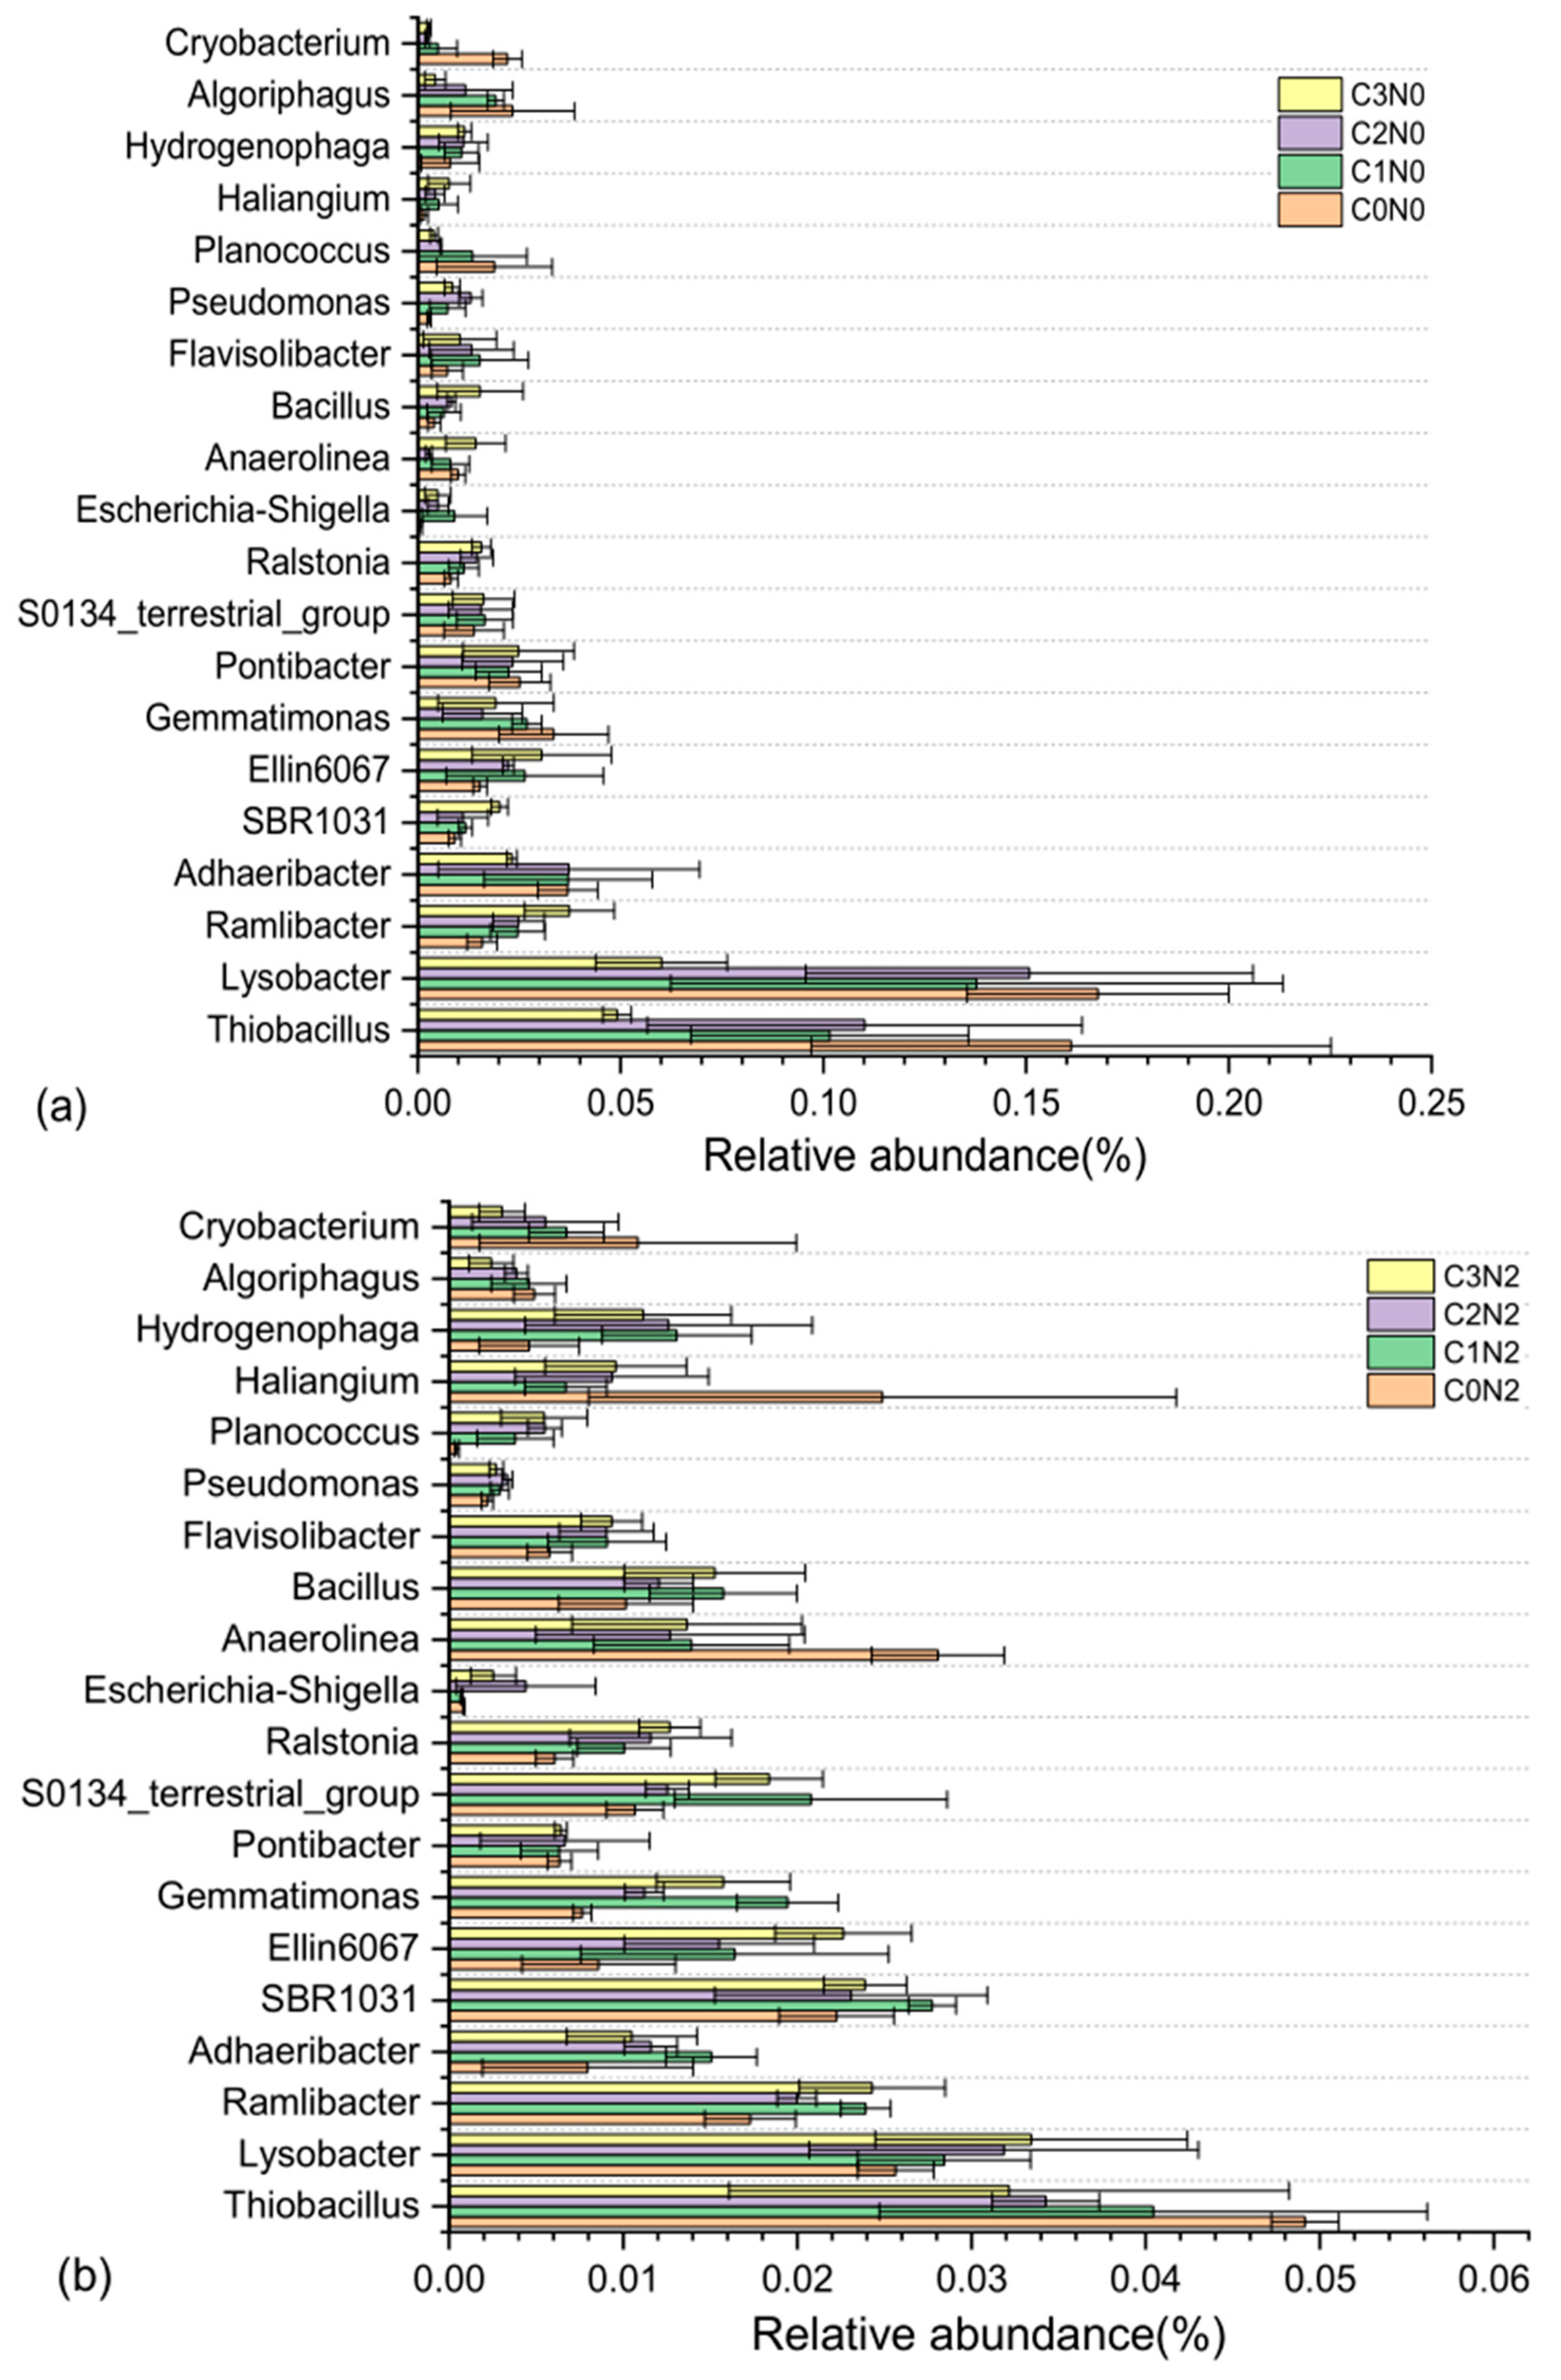
3.5. Relative Abundance of the Bacterial Communities

Figure 2 presents the relative abundance of bacterial communities at the phylum level. The dominant phyla in highly saline–alkali paddy soils under different biochar application treatments were Proteobacteria (43.66–59.38%), Bacteroidetes (8.15–16.60%), Chloroflexi (4.66–15.26%), Actinobacteria (3.82–12.10%), and Firmicutes (4.75–12.56%) with or without nitrogen fertilizer treatment, which accounted for more than 80% of the total. Biochar application treatment increased the abundance of Proteobacteria (3.24% to 10.82%), Gemmatimonadetes (17.80% to 98.13%), Patescibacteria (28.05% to 140.80%), Nitrospirae (6.93% to 247.74%), and Rokubacteria (22.11% to 254.52%) compared to C0, both with and without N fertilization. In the case of Gemmatimonadetes, Patescibacteria, Nitrospirae, and Rokubacteria, there was a significant increase in the difference between the biochar treatment and C0. Although the biochar application treatment led to a slight increase in Proteobacteria compared to C0, regardless of N fertilization, the difference was not significant. Compared to C0, the biochar application treatment resulted in a decrease in Bacteroidetes (0.024% to 32.00%), Chloroflexi (9.82% to 22.97%), Verrucomicrobia (16.80% to 61.21%), Spirochaetes (28.35% to 71.56%), and Armatimonadetes (24.54% to 55.29%), regardless of N fertilization. In the cases of Chloroflexi, Verrucomicrobia, Spirochaetes, and Armatimonadetes, there was a significant difference between the biochar treatment and C0. Under N0 treatment, the biochar application significantly reduced the relative abundance of Cyanobacteria and Fibrobacteres. Conversely, under N2 treatment, the relative abundance of Cyanobacteria and Fibrobacteres was significantly enhanced.
Figure 3 displays the relative abundance of bacterial communities at the genus level. The relative abundances of Ramlibacter (15.49–135.41%), SBR1031 (3.75–120.49%), Ellin6067 (45.22–163.41%), S0134_terrestrial_group (12.04–94.66%), Ralstonia (38.51–108.78%), Bacillus (18.57–281.89%), Flavisolibacter (56.43–109.67%), Pseudomonas (23.46–203.70%), and Hydrogenophaga (35.38–184.23%) increased compared to C0, regardless of N fertilization. In addition, the relative abundances of S0134_terrestrial_group and Hydrogenophaga in the N2 treatment were higher than those in the N0 treatment, while the relative abundances of Ramlibacter, SBR1031, Bacillus, Flavisolibacter, and Pseudomonas were lower than those in the N0 treatment (Figure 3). Compared to C0, the relative abundances of Thiobacillus, Anaerolinea, Algoriphagus, and Cryobacterium decreased by 17.72–69.50%, 18.91–72.35%, 6.36–81.67% and 37.88–89.41%, respectively, both with and without N fertilizer. The relative abundances of Lysobacter, Gemmatimonas, Planococcus, and Haliangium showed different trends under N0 and N2 treatments. Under N0 treatment, the relative abundances of Lysobacter, Gemmatimonas, and Planococcus were significantly decreased, while under N2 treatment, they exhibited a great increase. The relative abundance of Haliangium showed the opposite trend.

3.6. Correlations between the Relative Abundance of Bacterial Communities and Soil Environmental Factors

Table 6 shows that the relative abundance of Proteobacteria was negatively correlated with soil AK and SOM (p < 0.05), while Chloroflexi was positively correlated with soil AK and SOM (p < 0.001). The relative abundance of Bacteroidetes was positively correlated with pH, ESP, ECe, and SARe (p < 0.01) but negatively correlated with the soil CEC, TN, AP, AK, SOM, and C/N ratio (p < 0.01). The relative abundance of Actinobacteria was negatively correlated with the soil ESP and ECe (p < 0.01) but positively correlated with CEC, TN, AP, AK, and SOM (p < 0.05). The relative abundance of Firmicutes, Cyanobacteria, and Spirochaetes were positively correlated with CEC, AP, AK, and SOM (p < 0.05). The Patescibacteria was negatively correlated with soil pH, ESP, ECe, and SARe (p < 0.01) but positively correlated with CEC, TN, AP, AK, and SOM (p < 0.01). The Fibrobacteres was negatively correlated with pH, ESP, and ECe (p < 0.05) but positively correlated with soil CEC, TN, AP, AK, and SOM (p < 0.01). The Nitrospirae was positively correlated with soil TN and AP (p < 0.05). The Armatimonadetes was only positively correlated with soil pH (p < 0.05).

4. Discussion

4.1. Effect of Biochar Application on the Functions of Highly Saline–Alkali Paddy Field Soils

The enhancement of soil chemical characteristics reduced salinity–alkalinity and increased soil nutrient availability (Table 3 and Table 4), corroborating our hypothesis that applying biochar can enhance the performance of paddy field soils with high salinity–alkalinity. In this study, the utilization of biochar led to a notable reduction in soil pH, whether nitrogen fertilization was applied or not. Additionally, biochar combined with nitrogen fertilizer was beneficial to decreasing soil pH value (Table 3). The findings indicate that applying biochar is effective in mitigating high pH stress in highly saline–alkali paddy fields, especially when employed at higher biochar application rates in conjunction with nitrogen fertilization. The reduced pH in the highly saline–alkali paddy field may be attributed to the fact that the application of biochar can enhance soil CEC (Table 3), soil total porosity, and Ks [20], thereby aiding in the leaching of Na+ from the soil profile (Table 3) and reducing ESP and SARe (Table 3). Another potential explanation for the pH reduction could be the dissociation of H+ from the soil ion exchange complex due to interactions with K+, Ca2+, and Mg2+ (Table 2) following the application of peanut shell biochar [14,24]. This was further illustrated by the noteworthy reduction in the ECe value of highly saline–alkali paddy soils following the application of biochar (Table 3). Thirdly, the enhancement of soil physical and chemical properties resulting from the application of biochar stimulated root growth and boosted the secretion of organic acids in roots [18,39]. Furthermore, the initial pH of biochar used in this experiment was only 7.94 (Table 2), and this factor may significantly influence the alterations in pH observed in salt-affected soils due to biochar application [40]. Comparable findings were also documented in studies conducted by Lashari et al. [41] and Sun et al. [42]: they observed a substantial decrease in the pH of salt-affected soils following the incorporation of biochar. Nevertheless, some researchers have reported a notable rise in the pH of salt-affected soils when biochar was added, in contrast to saline soil without biochar [43,44]. This may be due to the differences in biochar’s raw materials feedstock, pyrolysis conditions, and application rates [14]. The initial ESP, EC, and SARe of soils in this experiment were 77.11%, 24.08 μs m−1, and 368.11 (mmolc L−1)1/2 (Table 1), which is known to severely hinder soil’s production capacity and crop growth. Numerous studies have demonstrated the positive impact of biochar in reducing ESP, EC, and SAR in salt-affected soil [16,42,45]. Nonetheless, these investigations primarily took place within the confines of short-term laboratory incubations or greenhouses. Here, biochar was added to highly saline–alkali paddy soils, which led to a significant reduction in soil ESP, ECe, and SARe, especially at higher biochar application rates combined with nitrogen fertilization (Table 3). Our results demonstrated the significant role of biochar-induced enhancements in soil properties in mitigating saline–alkali stress within the root zone. This result can be attributed to (i) biochar providing large amounts of exogenous exchangeable potassium, calcium, and magnesium ions, which can replace sodium ions on the soil colloids [20,46]; and (ii) biochar addition significantly improving the physical properties, facilitating Na+ leaching from the soil profile, and, subsequently, reducing ESP, ECe, and SARe [20,47]. The significant increase in CEC in biochar application treatment, especially combined with nitrogen fertilization treatment, can be attributed to the expansion of soil colloid exchange sites due to the presence of oxygen-containing functional groups on the biochar surface as well as the increased soil surface area [14]. Zheng et al. [25] obtained similar findings when they administered biochar (at levels of 1.5%, 5%, and 10% w/w of the total pot mass) to coastal salt-affected soil in a pot experiment, resulting in a CEC increase of 12.0% to 14.7%. Moreover, the combined use of biochar and nitrogen fertilizer demonstrated a more pronounced influence on soil pH, ESP, ECe, SARe, and CEC in comparison to the application of biochar only. This enhanced effect can be attributed to the synergistic interaction between biochar and nitrogen fertilizer, which facilitates the improved leaching of Na+ from root zone soil [48], promoting root growth [18], stimulating soil microbial activity (Figure 1, Figure 2 and Figure 3) and enzyme activities [19], and facilitating nutrient conversion [49].
In saline–sodic soils, the availability and utilization of nutrients markedly diminish due to the severe deterioration of the soil’s physical, chemical, and biological attributes [1,50] as well as the reduced input of organic matter from plant biomass and increased losses of organic matter [51]. As expected, the biochar application treatment, especially when combined with nitrogen fertilization treatment, contributes to a substantial increase in TN, AN, AP, and AK, primarily due to the considerable release of nutrient content from biochar (Table 2). On the other hand, the improvement in soil chemistry and saline–alkali properties (Table 3), coupled with the increase in soil organic matter (SOM) (Table 4), significantly enhanced the availability of soil nutrients following the application of biochar. For example, it is well known that phosphorus availability is strongly restricted by high soil pH value, and the decrease in pH and the increase in SOM in highly saline–alkali paddy soils (Table 3 and Table 4) promote the availability of phosphorus. Biochar’s extensive specific surface area and robust adsorption capacity markedly enhance nutrient immobilization while diminishing nutrient leaching [5,33]. This might be a contributing factor to the increased nutrient availability in highly saline–alkali paddy soils. Soil organic carbon stands as one of several pivotal markers of soil health. In saline–sodic soils, the meager presence of organic matter results from the degradation of the soil’s physical, chemical, and biological characteristics along with the prevalence of elevated pH and salinity conditions. A reduction in SOM has an adverse effect on soil nutrient availability and microbial activity [34]. Previous research has indicated that the incorporation of biochar can improve SOC and maintain the SOM balance [52,53,54]. In the current study, biochar application significantly increased soil organic matter (SOM) and the C/N ratio in highly saline–alkali paddy soils, particularly at high biochar addition rates (Table 4). This increase was attributed to the higher content of biochar carbon (C) (540.64 mg g−1, Table 2), which significantly enhanced the sequestration of “blue carbon” within the highly saline–alkali paddy field ecosystem [55] due to the recalcitrant nature of biochar carbon [25]. Furthermore, the combined application of biochar with nitrogen fertilizer had a significantly greater impact on SOM compared to biochar application alone (Table 4). This result suggests that biochar application, especially when combined with N fertilizer treatment, improves the soil health and functions of highly saline–alkali paddy soils, particularly at higher application rates of biochar. This can be attributed to two factors. Firstly, biochar has a high affinity for adsorbing soil organic molecules, facilitating their catalytic activity and promoting the polymerization of small organic molecules into SOM [6]. Secondly, the slow aging process of biochar contributes to the formation of humus, which enhances soil fertility over time [14].

4.2. Effect of Biochar Application on Bacterial Community Diversity and Abundance in Highly Saline–Alkali Paddy Soils

Saline–alkali stress leads to a substantial reduction in microbial activity and biomass along with alterations in the microbial community structure in the soil. These changes are primarily attributed to the disintegration of soil aggregates, deteriorated soil structure, soil nutrient deficiency, salt toxicity, high pH value, as well as the inhibition of soil respiration [11,56,57,58]. Biochar application significantly increased the number of OTUs in bacterial communities from 2332 to 3198.33 under N0 treatment and 2865 to 3304 under N2 treatment, indicating that biochar significantly increased the bacterial abundance of highly saline–alkali paddy soils, especially at high application rates of biochar and conventional levels of nitrogen application (Table 5). This may be attributed to the following mechanisms: (i) the higher presence of carboxyls, lactones, and phenolic groups in biochar, making it a more favorable option for the growth of the soil bacterial community [26]; (ii) biochar possessing a wealth of nutrients and carbon sources contributing to the mitigation of saline–alkali stress, which provides nutrient supply and a suitable condition for bacterial growth (Table 2 and Table 4); (iii) the interaction between biochar and nitrogen fertilizer is more conducive to balancing the soil C/N ratio (Table 4). Additionally, biochar application significantly promoted root development in the presence of salt stress, leading to increased secretion of root exudates. These exudates are beneficial for promoting the growth of rhizosphere bacterial communities [18,26]. This result further indicates the following: (i) the augmented bacterial population following biochar application could enhance the saline–alkali tolerance of rice and (ii) the higher bacterial abundance found in highly saline–alkali paddy soils creates additional possibilities for plants to access soil nutrients. This is because a greater number of soil microbes are actively involved in processes such as soil organic matter decomposition, humus formation, and the transformation and recycling of soil nutrients [59]. This outcome aligns with the research conducted by Hu et al. [60], which demonstrated a substantial correlation between nutrient availability and the composition and diversity of bacteria in soils.
The composition of the soil microbial community structure serves as a vital indicator for assessing soil quality and fertility [6]. A more intricate soil microbial community structure contributes to a more stable soil ecosystem [26]. The Chao1 index demonstrates the bacterial abundance of soil. In the current study, we observed that the combination of biochar application with N fertilizer treatment led to a substantial increase in the Chao1 index, particularly at high biochar application rates, whereas under the N0 treatment, there was no significant difference in the Chao1 among all the biochar treatments (Table 5). The diversity indices of Simpson and Shannon showed no significant difference after biochar application, both with and without N fertilizer, demonstrating that bacterial community diversity was not affected by the addition of biochar in highly saline–alkali paddy soils (Table 5). The findings align with the research conducted by Sun et al. [7], indicating an increase in the relative abundance of the bacterial community in paddy soils under the combined treatment of biochar and N fertilizer. The observed increase in the relative abundance of the bacterial community could be partially attributed to improvements in soil chemical and saline–alkali characteristics induced by biochar (Table 5 and Table 6), especially when biochar is combined with N fertilizer. For example, in our research, the biochar application treatment, particularly biochar combined with N fertilizer treatment, significantly enhanced the content of TN, AN, TP, and SOM and decreased pH, ESP, and ECe in the highly saline–alkali paddy soils (Table 4). This elevation could potentially enhance the relative abundance and distribution of ammonia-nitrifying and phosphate-solubilizing bacteria, such as Nitrospirae (Figure 2), Pseudomonas (Figure 3), and Flavobacterium (Figure 3), in soils of this type. This conclusion is further supported by the results of the correlation analysis (Table 6). Similar findings were also reported in soils subjected to NaCl stress by Huang et al. [26] and Zheng et al. [25]. However, it is noteworthy that prior research has also demonstrated that the co-application of biochar and nitrogen fertilizer diminishes bacterial abundance in non-stressed paddy soil when compared to the use of biochar alone [61,62]. This variation could be attributed to the properties of highly saline–alkali paddy soils in this experiment, characterized by low soil nutrient levels (TN = 0.27 g kg−1; SOM = 0.64%), a high pH value (pH = 10.10), and a salt-laden environment (ESP = 77.11%; SARe = 368.11 (mmolc L−1)1/2), all of which severely inhibit bacterial growth. Additionally, the combined application of biochar and nitrogen more effectively reduced saline–alkali stress (Table 3), enhanced nitrogen retention in the soil (Table 4), and, subsequently, supplied abundant N and carbon sources for bacterial activities.
The top three phyla in terms of bacterial abundance in this study were Proteobacteria, Bacteroidetes, and Chloroflexi, and their abundance varied with distinct biochar application treatments and N fertilizer levels (Figure 2). Proteobacteria are essential microorganisms in the soil carbon cycle, and they flourish in soils rich in carbon and nitrogen content [34]. Here, we found that the relative abundance of Proteobacteria exhibited an increasing trend after biochar addition in highly saline–alkali paddy soils; however, the variations among the different biochar application treatments did not exhibit significant changes (Figure 2). These findings differed from those of Huang et al. [26], who observed a decreasing trend in Proteobacteria after applying biochar to NaCl-stressed soil. It is well known that Proteobacteria are generally considered to prefer nutrient-rich soil. The significant improvements in soil nutrient availability (Table 3) and saline–alkali characteristics (Table 4) after biochar application might explain the increased relative abundance of Proteobacteria in highly saline–alkali paddy fields. On the contrary, the relative abundance of Bacteroidetes and Chloroflexi decreased markedly after biochar application, regardless of N fertilization (Figure 2). Bacteroidetes and Chloroflexi are generally recognized as oligotrophic bacteria that predominate in soils with limited nutrient availability. The correlation analysis also revealed that Bacteroidetes displayed positive correlations with pH, ESP, ECe, and SARe while showing negative correlations with soil CEC, TN, AP, AK, SOM, and C/N ratio (Table 6). This is consistent with the results of Huang et al. [26] and Xu et al. [49].
The above results suggest that the improvement of soil chemical and saline–alkali characteristics, as well as nutrient availability after the addition of biochar in highly saline–alkali paddy soils, can significantly influence the composition and abundance of the bacterial community. This, in turn, can further promote nutrient conversion and improve highly saline–alkali soil’s function. Consequently, the present findings hold value for forthcoming crop production in highly saline–alkali paddy fields and the reclamation of saline–alkali lands. However, Prayogo et al. [63] demonstrated that under long-term field conditions, biochar application can lead to a negative priming effect. Therefore, the long-term effects of biochar return on soil bacterial communities in saline–alkali paddy fields deserve further study.

5. Conclusions

The use of biochar had a substantial impact on mitigating saline–alkali stress and enhancing soil functions in saline–alkali paddy soils. This was achieved through the modification of soil chemical and saline–alkali properties, the improvement of soil nutrient bioavailability, and the regulation of soil bacterial abundance and community structure in this study. The application of biochar, especially when combined with N fertilizer, significantly decreased the soil pH value, ESP, ECe, and SARe while increasing the soil CEC in highly saline–alkali paddy soils. This improvement of soil chemistry and saline–alkali properties was observed to increase with the rate of biochar addition. Additionally, combined biochar with N fertilizer treatment demonstrated advantageous impacts on soil TN, AN, AK, AP, SOM, and C/N ratio, which is particularly beneficial for low-fertility soils like highly saline–alkali paddy soil. Furthermore, biochar application significantly impacted the relative abundance of bacterial communities and modified the bacterial community structure, e.g., Proteobacteria abundance increased and Bacteroidetes and Chloroflexi abundance decreased, regardless of N fertilization; these bacteria are typically categorized as eutrophic bacteria and oligotrophic bacteria, respectively. However, the diversity indices of Simpson and Shannon showed no significant difference after biochar application. Correlation analysis results showed that the improvements in soil chemical and saline–alkali properties and in nutrient bioavailability after biochar application had a positive effect on bacterial communities of highly saline–alkali paddy soils. Considering the potential of biochar to improve soil quality and increase rice yield, 3.0% (w/w) biochar is the most cost-effective application rate. To our knowledge, this is the first report on examining the biochar application reduction of saline-alkali stress by improving soil functions and regulating soil bacterial community diversity and abundance in highly saline-alkali paddy fields. These findings provide a theoretical basis for repairing and improving soil functions and the production ability of highly saline-alkali paddy soils.

Author Contributions

F.J. designed the experiments. Y.Z. and S.M. performed the experiments, collected the samples, measured the index, and wrote the manuscript. Y.S. and X.W. analyzed the raw sequencing data. All authors have read and agreed to the published version of the manuscript.

Funding

This study was funded by the National Natural Science Foundation of China (No. 32071951), the Natural Science Foundation of Jilin Province (No. 20230101258JC), and the Chinese Scholarship Council (No. 202008220050).

Institutional Review Board Statement

Not applicable.

Informed Consent Statement

Not applicable.

Data Availability Statement

The data that support the findings of this study are available from the corresponding author upon reasonable request.

Conflicts of Interest

The authors declare no conflicts of interest.

References

  1. Wang, L.; Seki, K.; Miyazaki, T.; Ishihama, Y. The causes of soil alkalinization in the Songnen Plain of Northeast China. Paddy Water Environ. 2009, 7, 259–270. [Google Scholar] [CrossRef]
  2. Richards, L.A. Diagnosis and Improvement of Saline and Alkali Soils. In USDA Handbook No. 60; USDA: Washington, DC, USA, 1954. [Google Scholar]
  3. Kamran, M.; Wang, D.; Xie, K.Z.; Lu, Y.S.; Shi, C.H.; Sabagh, A.E.L.; Gu, W.J.; Xu, P.Z. Pre-sowing seed treatment with kinetin and calcium mitigates salt induced inhibition of seed germination and seedling growth of choysum. (Brassica rapa var. parachinensis). Ecotoxicol. Environ. Saf. 2021, 227, 112921. [Google Scholar] [CrossRef] [PubMed]
  4. Morsy, S.; Elbasyoni, I.S.; Baenziger, S.; Abdallah, A.M. Gypsum amendment influences performance and mineral absorption in wheat cultivars grown in normal and saline-sodic soils. J. Agron. Crop Sci. 2022, 208, 675–692. [Google Scholar] [CrossRef]
  5. Wang, Y.; Lin, Q.M.; Liu, Z.Z.; Liu, K.S.; Wang, X.; Shang, J.Y. Salt-affected marginal lands: A solution for biochar production. Biochar 2023, 5, 21. [Google Scholar] [CrossRef]
  6. Palansooriya, K.N.; Wong, J.T.F.; Hashimoto, Y.; Huang, L.; Rinklebe, J.; Chang, S.X.; Bolan, N.; Wang, H.; Ok, Y.S. Response of microbial communities to biochar-amended soils: A critical review. Biochar 2019, 1, 3–22. [Google Scholar] [CrossRef]
  7. Sun, J.L.; Li, H.B.; Wang, Y.N.; Du, Z.L.; Rengel, Z.; Zhang, A.P. Biochar and nitrogen fertilizer promote rice yield by altering soil enzyme activity and microbial community structure. GCB Bioenergy 2022, 14, 1266–1280. [Google Scholar] [CrossRef]
  8. Mahajan, G.R.; Manjunath, B.L.; Latare, A.M.; D’Souza, R.; Vishwakarma, S.; Singh, N.P. Spatial and temporal variability in microbial activities of coastal acid saline soils of Goa, India. Solid Earth Discuss 2015, 7, 3087–3115. [Google Scholar]
  9. Wichern, J.; Wichern, F.; Joergensen, R.G. Impact of salinity on soil microbial communities and the decomposition of maize in acidic soils. Geoderma 2006, 137, 100–108. [Google Scholar] [CrossRef]
  10. Yan, N.; Marschner, P. Response of soil respiration and microbial biomass to changing EC in saline soils. Soil Biol. Biochem. 2013, 65, 322–328. [Google Scholar] [CrossRef]
  11. Singh, A.; Panda, S.N. Effect of saline irrigation water on mustard (Brassica juncea) crop yield and soil salinity in a semi-arid area of North India. Exp. Agric. 2012, 48, 99–110. [Google Scholar] [CrossRef]
  12. Singh, A. Soil salinization and waterlogging: A threat to environment and agricultural sustainability. Ecol. Indic. 2015, 57, 128–130. [Google Scholar] [CrossRef]
  13. Joseph, S.; Cowie, A.L.; Van, Z.L.; Bolan, N.; Budai, A.; Buss, W.; Cayuela, M.L.; Graber, E.R.; Ippolito, J.A.; Kuzyakov, Y.; et al. How biochar works and when it doesn’t: A review of mechanisms controlling soil and plant responses to biochar. GCB Bioenergy 2021, 13, 1731–1764. [Google Scholar] [CrossRef]
  14. Saifullah, D.S.; Naeem, A.; Rengel, Z.; Naidu, R. Biochar application for the remediation of salt-affected soils: Challenges and opportunities. Sci. Total Environ. 2018, 625, 320–335. [Google Scholar] [CrossRef] [PubMed]
  15. Gunarathne, V.; Senadeera, A.; Gunarathne, U.; Biswas, J.K.; Almaroai, Y.A.; Vithanage, M. Potential of biochar and organic amendments for reclamation of coastal acidic salt affected soil. Biochar 2020, 2, 107–120. [Google Scholar] [CrossRef]
  16. Ndiaye, I.N.; Qamar, U.Z.; Imade, N.F.; Oyeyemi, A.D.; Abdul, R.; Muhammad, A.; Deborah, G.; Aboubacry, K.; Cai, L.Q.; Fasih, U.H. Soil Amendment with Arbuscular Mycorrhizal Fungi and Biochar Improves Salinity Tolerance, Growth, and Lipid Metabolism of Common Wheat (Triticum aestivum L.). Sustainability 2022, 14, 3210. [Google Scholar] [CrossRef]
  17. Nan, Q.; Fang, C.X.; Cheng, L.Q.; Wang, H.; Wu, W.X. Elevation of NO3-N from biochar amendment facilitates mitigating paddy CH4 emission stably over seven years. Environ. Pollut. 2022, 295, 118707. [Google Scholar] [CrossRef]
  18. Li, X.; Yao, T.X.; Huang, X.X.; Li, X.B.; Li, P.Y.; Du, S.; Wang, W.; Miao, S.H.; Wang, D.; Jin, F.; et al. Biochar increases rice yield by improving root morphological and root physiological functions in heavily saline-sodic paddy soil of northeast China. BioResources 2022, 17, 1421–1456. [Google Scholar] [CrossRef]
  19. Yao, T.X.; Zhang, W.T.; Gulaqa, A.; Cui, Y.F.; Zhou, Y.M.; Weng, W.A.; Wang, X.; Jin, F. Effects of peanut shell biochar on soil nutrients, soil enzyme activity, and rice yield in heavily saline-sodic paddy field. J. Soil Sci. Plant Nutr. 2021, 21, 655–664. [Google Scholar] [CrossRef]
  20. Li, X.B.; Che, W.K.; Piao, J.L.; Li, X.; Jin, F.; Yao, T.X.; Li, P.Y.; Wang, W.; Tan, T.; Shao, X.W. Peanut Shell Biochar’s Effect on Soil Physicochemical Properties and Salt Concentration in Highly Saline-Sodic Paddy Fields in Northeast China. BioResources 2022, 17, 5936–5957. [Google Scholar] [CrossRef]
  21. Piao, J.L.; Che, W.K.; Li, X.; Li, X.B.; Zhang, C.B.; Wang, Q.S.; Hua, S. Application of peanut shell biochar increases rice yield in saline-alkali paddy fields by regulating leaf ion concentrations and photosynthesis rate. Plant Soil 2022, 483, 589–606. [Google Scholar] [CrossRef]
  22. Ran, C.; Gulaqa, A.; Zhu, J.; Wang, W.W.; Zhang, S.Q.; Geng, Y.Q.; Guo, L.Y.; Jin, F.; Shao, X.W. Benefits of biochar for improving ion contents, cell membrane permeability, leaf water status and yield of rice under saline-sodic paddy field condition. J. Plant Growth Regul. 2019, 39, 370–377. [Google Scholar] [CrossRef]
  23. Quilliam, R.S.; Glanville, H.C.; Wade, S.C.; Jones, D.L. Life in the ‘charosphere’–does biochar in agricultural soil provide a significant habitat for microorganisms? Soil Biol. Biochem. 2013, 65, 287–293. [Google Scholar] [CrossRef]
  24. Wang, Z.Y.; Zong, H.Y.; Zheng, H.; Liu, G.C.; Chen, L.; Xing, B.S. Reduced nitrification and abundance of ammonia-oxidizing bacteria in acidic soil amended with biochar. Chemosphere 2015, 138, 576–583. [Google Scholar] [CrossRef] [PubMed]
  25. Zheng, H.; Wang, X.; Chen, L.; Wang, Z.Y.; Xia, Y.; Zhang, Y.P.; Wang, H.F.; Luo, X.X.; Xing, B.S. Enhanced growth of halophyte plants in biochar-amended coastal soil: Roles of nutrient availability and rhizosphere microbial modulation. Plant Cell Environ. 2018, 41, 517–532. [Google Scholar] [CrossRef] [PubMed]
  26. Huang, J.; Zhu, C.Q.; Kong, Y.L.; Cao, X.C.; Zhu, L.F.; Zhang, Y.C.; Ning, Y.W.; Tian, W.H.; Zhang, H.; Yu, Y.J.; et al. Biochar Application Alleviated Rice Salt Stress via Modifying Soil Properties and Regulating Soil Bacterial Abundance and Community Structure. Agronomy 2022, 212, 409. [Google Scholar] [CrossRef]
  27. Jaafar, N.M.; Clode, P.L.; Abbott, L.K. Microscopy observations of habitable space in biochar for colonization by fungal hyphae from soil. J. Integr. Agric. 2014, 13, 483–490. [Google Scholar] [CrossRef]
  28. Brewer, C.E.; Brown, R.C. Biochar. In Comprehensive Renewable Energy; Sayigh, A.A.M., Ed.; Elsevier: Amsterdam, The Netherlands, 2012; pp. 257–384. [Google Scholar]
  29. Norton, J.M.; Firestone, M.K. N dynamics in the rhizosphere of Pinus ponderosa seedlings. Soil Biol. Biochem. 1996, 28, 351–362. [Google Scholar] [CrossRef]
  30. Gul, S.; Whalen, J.K.; Thomas, B.W.; Sachdeva, V.; Deng, H. Physico-chemical properties and microbial responses in biochar-amended soils: Mechanisms and future directions. Agric. Ecosyst. Environ. 2015, 206, 46–59. [Google Scholar] [CrossRef]
  31. Castaldi, S.; Riondino, M.; Baronti, S.; Esposito, F.R.; Marzaioli, R.; Rutigliano, F.A.; Vaccari, F.P.; Miglietta, F. Impact of biochar application to a Mediterranean wheat crop on soil microbial activity and greenhouse gas fluxes. Chemosphere 2011, 85, 1464–1471. [Google Scholar] [CrossRef]
  32. Zavalloni, C.; Alberti, G.; Biasiol, S.; Delle, V.G.; Fornasier, F.; Liu, J.; Peressotti, A. Microbial mineralization of biochar and wheat straw mixture in soil: A short-term study. Appl. Soil Ecol. 2011, 50, 45–51. [Google Scholar] [CrossRef]
  33. Chaganti, V.N.; Crohn, D.M.; Šimůnek, J. Leaching and reclamation of a biochar and compost amended saline–sodic soil with moderate SAR reclaimed water. Agric. Water Manag. 2015, 158, 255–265. [Google Scholar] [CrossRef]
  34. Jing, C.L.; Xu, Z.C.; Zou, P.; Tang, Q.; Li, Y.Q.; You, X.W.; Zhang, C.S. Coastal halophytes alter properties and microbial community structure of the saline soils in the Yellow River Delta China. Appl. Soil Ecol. 2019, 134, 1–7. [Google Scholar] [CrossRef]
  35. Dempster, D.N.; Gleeson, D.B.; Solaiman, Z.I.; Jones, D.L.; Murphy, D.V. Decreased soil microbial biomass and nitrogen mineralisation with eucalyptus biochar addition to a coarse textured soil. Plant Soil 2012, 354, 311–324. [Google Scholar] [CrossRef]
  36. Chi, C.M.; Wang, Z.C. Characterizing salt-affected soils of Songnen Plain using saturated paste and 1:5 soil-to-water extraction methods. Arid Soil Res. Rehabil. 2010, 24, 1–11. [Google Scholar] [CrossRef]
  37. Bao, S.D. Soil Analysis for Agronomy, 3rd ed.; China Agriculture Press: Beijing, China, 2020. [Google Scholar]
  38. Jin, V.L.; Potter, K.N.; Johnson, M.V.V.; Harmel, R.D.; Arnold, J.G. Surface-applied biosolids enhance soil organic carbon and nitrogen stocks but have contrasting effects on soil physical quality. Appl. Environ. Soil Sci. 2015, 2015, 9–11. [Google Scholar] [CrossRef]
  39. Zhou, Z.X.; Li, Z.Y.; Zhang, Z.Q.; You, L.R.; Xu, L.F.; Huang, H.Y.; Wang, X.P.; Gao, Y.; Cui, X.J. Treatment of the saline-alkali soil with acidic corn stalk biochar and its effect on the sorghum yield in western Songnen Plain. Sci. Total Environ. 2021, 797, 149190. [Google Scholar] [CrossRef] [PubMed]
  40. Liu, X.H.; Zhang, X.C. Effect of biochar on pH of alkaline soils in the loess plateau: Results from incubation experiments. Int. J. Agric. Biol. 2012, 14, 745–750. [Google Scholar]
  41. Lashari, M.S.; Ye, Y.; Ji, H.; Li, L.; Kibue, G.W.; Lu, H.; Zheng, J.; Pan, G.X. Biochar–manure compost in conjunction with pyroligneous solution alleviated salt stress and improved leaf bioactivity of maize in a saline soil from central China: A 2-year field experiment. J. Sci. Food Agric. 2015, 95, 1321–1327. [Google Scholar] [CrossRef]
  42. Sun, C.X.; Chen, X.; Cao, M.M.; Li, M.Q.; Zhang, Y.L. Growth and metabolic responses of maize roots to straw biochar application at different rates. Plant Soil 2017, 416, 487–502. [Google Scholar] [CrossRef]
  43. Abrishamkesh, S.; Gorji, M.; Asadi, H.; Bagheri-Marand, G.H.; Pourbabaee, A.A. Effects of rice husk biochar application on the properties of alkaline soil and lentil growth. Plant Soil Environ. 2015, 11, 475–482. [Google Scholar] [CrossRef]
  44. Liu, D.F.; Feng, Z.Y.; Zhu, H.D.; Yu, L.H.; Yang, K.J.; Yu, S.; Zhang, Y.F.; Guo, W. Effects of corn straw biochar application on soybean growth and alkaline soil properties. BioResources 2020, 15, 1463–1481. [Google Scholar] [CrossRef]
  45. Chaganti, V.N.; Crohn, D.M. Evaluating the relative contribution of physiochemical and biological factors in ameliorating a saline-sodic soil amended with composts and biochar and leached with reclaimed water. Geoderma 2015, 259, 45–55. [Google Scholar] [CrossRef]
  46. Downie, H.F.; Adu, M.O.; Schmidt, S.; Otten, W.; Dupuy, L.X.; White, P.J.; Valentine, T.A. Challenges and opportunities for quantifying roots and rhizosphere interactions through imaging and image analysis. Plant Cell Environ. 2015, 38, 1213–1232. [Google Scholar] [CrossRef] [PubMed]
  47. Kim, H.S.; Kim, K.R.; Yang, J.E.; Ok, Y.S.; Owens, G.; Nehls, T.; Wessolek, G.; Kim, K.H. Effect of biochar on reclaimed tidal land soil properties and maize (Zea mays L.) response. Chemosphere 2016, 142, 153–159. [Google Scholar] [CrossRef] [PubMed]
  48. Yue, Y.; Guo, W.N.; Lin, Q.M.; Li, G.T.; Zhao, X.R. Improving salt leaching in a simulated saline soil column by three biochars derived from rice straw (Oryza sativa L.), sunflower straw (Helianthus annuus), and cow manure. J. Soil Water Conserv. 2016, 71, 467–475. [Google Scholar] [CrossRef]
  49. Xu, M.; Ma, J.; Zhang, X.H.; Yang, G.; Long, L.L.; Chen, C.; Song, C.; Wu, J.; Gao, P.; Guan, D.X. Biochar-bacteria partnership based on microbially induced calcite precipitation improves Cd immobilization and soil function. Biohcar 2023, 5, 20. [Google Scholar] [CrossRef]
  50. Reitz, D.N.; Haynes, R.J. Effect of irrigation-induced salinity and sodicity on soil microbial activity. Soil Biol. Biochem. 2003, 35, 845–854. [Google Scholar] [CrossRef]
  51. Lakhdar, A.; Rabhi, M.; Ghnaya, T.; Montemurro, F.; Jedidi, N.; Abdelly, C. Effectiveness of compost use in salt-affected soil. J. Hazard. Mater. 2009, 171, 29–37. [Google Scholar] [CrossRef]
  52. Bohara, H.; Dodla, S.; Wang, J.J.; Darapuneni, M.; Kongchum, M.; Fromme, D.D.; Harrell, D. Impacts of N-stabilizers and biochar on nitrogen losses, nitrogen phytoavailability, and cotton yield in poultry litter-fertilized soils. Agron J. 2018, 110, 2016–2024. [Google Scholar] [CrossRef]
  53. Gong, H.Y.; Li, Y.F.; Li, S.J. Effects of the interaction between biochar and nutrients on soil organic carbon sequestration in soda saline-alkali grassland: A review. Glob. Ecol. Conserv. 2021, 26, e01449. [Google Scholar] [CrossRef]
  54. Rasse, D.P.; Weldon, S.; Joner, E.J.; Kammann, C.I.; Liu, X.Y.; O’Toole, A.; Pan, G.X.; Kocatürk-Schumacher, N.P. Enhancing plant N uptake with biochar-based fertilizers: Limitation of sorption and prospects. Plant Soil 2022, 475, 213–236. [Google Scholar] [CrossRef]
  55. Luo, X.; Wang, L.; Liu, G.; Wang, X.; Wang, Z.; Zheng, H. Effects of biochar on carbon mineralization of coastal wetland soils in the Yellow River Delta, China. Ecol. Eng. 2016, 94, 329–336. [Google Scholar] [CrossRef]
  56. Rath, K.M.; Rousk, J. Salt effects on the soil microbial decomposer community and their role in organic carbon cycling: A review. Soil Biol. Biochem. 2015, 8, 108–123. [Google Scholar] [CrossRef]
  57. Tripathi, S.; Chakraborty, A.; Chakrabarti, K.; Bandyopadhyay, B.K. Enzyme activities and microbial biomass in coastal soils of India. Soil Biol. Biochem. 2007, 39, 2840–2848. [Google Scholar] [CrossRef]
  58. Marina, M.A.C.; Ana, P.C.L.; Angelita, M.O.J.; Ana, K.V.C.; Aurora, M.P.E. Impact of Soil Amendment with Biochar on Greenhouse Gases Emissions, Metals Availability and Microbial Activity: A Meta-Analysis. Sustainability 2022, 14, 15648. [Google Scholar]
  59. Sun, K.; Han, L.F.; Yang, Y.; Xia, X.H.; Yang, Z.F.; Wu, F.C.; Li, F.B.; Feng, Y.F.; Xing, B.S. Application of hydrochar altered soil microbial community composition and the molecular structure of native soil organic carbon in a paddy soil. Environ. Sci. Technol. 2020, 54, 2715–2725. [Google Scholar] [CrossRef] [PubMed]
  60. Hu, X.S.; Liu, X.X.; Qiao, L.K.; Zhang, S.; Su, K.W.; Qiu, Z.L.; Li, X.H.; Zhao, Q.C.; Yu, C.H. Study on the spatial distribution of ureolytic microorganisms in farmland soil around tailings with different heavy metal pollution. Sci. Total Environ. 2021, 775, 144946. [Google Scholar] [CrossRef] [PubMed]
  61. Li, X.; Wang, T.; Chang, S.X.; Jiang, X.; Song, Y. Biochar Increases Soil Microbial Biomass but Has Variable Effects on Microbial Diversity: A Meta-Analysis. Sci. Total Environ. 2020, 749, 141593. [Google Scholar] [CrossRef]
  62. Zhao, Y.M.; Wang, X.J.; Yao, G.W.; Lin, Z.H.; Xu, L.Y.; Jiang, Y.L.; Jin, Z.W.; Ping, L.F. Advances in the Effects of Biochar on Microbial Ecological Function in Soil and Crop Quality. Sustainability 2022, 14, 10411. [Google Scholar] [CrossRef]
  63. Prayogo, C.; Jones, J.E.; Baeyens, J.; Bending, G.D. Impact of biochar on mineralization of C and N from soil and willow litter and its relationship with microbial community biomass and structure. Biol. Fertil. Soils 2014, 50, 695–702. [Google Scholar] [CrossRef]
Figure 1. Effects of biochar application on bacterial community’s beta diversity in highly saline–alkali paddy sols. Principal coordinate analysis (PCo) of bacterial communities (p < 0.001, R2 = 0.556) for C0 (zero biochar), C1 (1.5% biochar, w/w), C2 (3.0% biochar, w/w), and C3 (4.5% biochar, w/w) at no nitrogen application (N0) and conventional nitrogen application level (N2) based on the unweighted UniFradistance of bacterial communities. The first and second principal components of the PCo of the bacterial community explained 24.6% and 9.3% of the communities, respectively. Each treatment had three replicates (n = 3).
Sustainability 16 01001 g001
Figure 2. Relative abundance of bacterial community composition at the phylum level. C0, C1, C2, and C3 indicate biochar levels of 0%, 1.5%, 3%, and 4.5% w/w. N0 and N2 indicate levels with no nitrogen applied and with conventional nitrogen applied, respectively. Error bars represent the standard deviation of the means (n = 3).
Sustainability 16 01001 g002
Figure 3. Relative abundance of bacterial community composition at the genus level. C0, C1, C2, and C3 indicate biochar levels of 0%, 1.5%, 3%, and 4.5% w/w. N0 (a) and N2 (b) indicate levels with no nitrogen applied and with conventional nitrogen applied, respectively. Error bars represent the standard deviation of the means (n = 3).
Sustainability 16 01001 g003
Table 1. The properties of experimental soils (0–20 cm).
PropertiesExperimental Soil
Bulk density (g cm−3)1.61 ± 0.13
ECe (μs m−1)24.08 ± 0.71
pH10.10 ± 0.24
SARe (mmolc L−1)1/2368.11 ± 14.03
ESP (%)77.11 ± 2.17
CEC (cmol kg−1)10.99 ± 0.34
Organic matter (%)0.64 ± 0.04
Total N (g kg−1)0.27 ± 0.01
Alkali-hydrolysable N (mg kg−1)16.30 ± 1.11
Available P (mg kg−1)9.13 ± 0.68
Available K (mg kg−1)107.25 ± 5.68
Notes: ECe: electrical conductivity of soil saturation extract, SARe: sodium adsorption ratio of soil saturation extract, ESP: exchangeable sodium percentage, CEC: cation exchange capacity, N: nitrogen, P: phosphorus, K: potassium. Values are means ± SD.
Table 2. Basic properties of biochar.
pH and Elemental ComponentBiochar
pH7.94 ± 0.32
CEC (cmol kg−1)78.69 ± 11.32
EC (dS m−1)7.88 ± 0.59
SA (m2 g−1)7.41 ± 0.12
C (mg g−1)540.64 ± 26.58
N (mg g−1)15.93 ± 1.01
S (mg g−1)6.85 ± 0.34
P (mg g−1)0.74 ± 0.03
Mg (mg g−1)0.25 ± 0.00
K (mg g−1)12.53 ± 0.51
Ca (mg g−1)2.01 ± 0.02
Na (mg g−1)1.17 ± 0.21
Notes: CEC: cation exchange capacity, EC: electrical conductivity, SA: Surface area, C: carbon, N: nitrogen, S: sulfur, Mg: magnesium, P: phosphorus K: potassium, Ca: calcium, Na: sodium. Values are means ± SD.
Table 3. Effects of biochar application on the soil chemical properties in highly saline–alkali paddy sols.
Nitrogen LevelBiochar TreatmentpHESP
(%)
ECe
(ds m−1)
SARe
(mmolc L−1)1/2
CEC
(cmol kg−1)
N0C09.79 ± 0.03 a40.78 ± 0.23 a22.39 ± 0.20 a317.86 ± 15.42 a11.44 ± 0.50 d
C19.63 ± 0.02 b21.56 ±0.16 b11.47 ± 0.35 b165.02 ± 5.57 b13.32 ± 0.34 c
C29.61 ± 0.02 b16.79 ± 0.46 c8.96 ± 0.07 c150.84 ± 2.59 c15.01 ± 0.20 b
C39.56 ± 0.02 b13.48 ± 0.44 d6.79 ± 0.18 d122.43 ± 3.38 d16.19 ± 0.33 a
N2C09.70 ± 0.02 a36.78 ± 0.76 a20.87 ± 0.61 a300.86 ± 14.13 a11.46 ± 0.49 d
C19.50 ± 0.04 b18.17 ± 0.20 b9.48 ± 0.39 b139.02 ± 5.15 b14.88 ± 0.15 c
C29.41 ± 0.02 b14.09 ± 0.12 c6.97 ± 0.14 c122.84 ± 4.46 bc16.23 ± 0.34 b
C39.41 ± 0.01 b11.55 ± 0.25 d4.46 ± 0.21 d107.43 ± 4.17 c16.97 ± 0.27 a
Source of variation
Biochar treatment (C)**********
Nitrogen level (N)**********
C × N*********
Different letters indicate significant differences between biochar application rates (p < 0.05). * and **, significant at p < 0.05 and p < 0.01, respectively. C0, C1, C2, and C3 indicate biochar levels of 0%, 1.5%, 3%, and 4.5% w/w, respectively. N0 and N2 indicate levels with no nitrogen applied and with conventional nitrogen applied, respectively. ESP: soil exchangeable sodium percentage, ECe: electrical conductivity of soil saturation extract, SARe: sodium adsorption ratio of soil saturation extract, CEC: cation exchange capacity. Values are means ± SD.
Table 4. Effects of biochar application on the soil nutrient status in highly saline–alkali paddy sols.
Nitrogen LevelBiochar TreatmentTN
(g kg−1)
AN
(mg kg−1)
AP
(mg kg−1)
AK
(mg kg−1)
SOM
(%)
C/N Ratio
N0C00.18 ± 0.01 d17.79 ± 0.33 c6.69 ± 0.37 d99.27 ± 1.79 d0.81 ± 0.14 d15.29 ± 1.78 d
C10.31 ± 0.03 c20.71 ± 0.30 b10.76 ± 0.25 c187.54 ± 6.48 c1.15 ± 0.22 c27.57 ± 0.77 c
C20.35 ± 0.01 b23.52 ± 0.43 a14.58 ± 0.40 b349.72 ± 20.52 b1.70 ± 0.24 b34.90 ± 1.78 b
C30.43 ± 0.03 a21.58 ± 0.88 a20.32 ± 0.53 a416.96 ± 11.56 a2.43 ± 0.16 a39.39 ± 0.46 a
N2C00.21 ± 0.03 d28.92 ± 1.08 c8.15 ± 0.25 d105.27 ± 5.37 d0.88 ± 0.05 d18.39 ± 2.56 d
C10.39 ± 0.01 c34.50 ± 0.95 b12.76 ± 0.29 c227.54 ± 8.51 c1.19 ± 0.14 c24.66 ± 1.57 c
C20.48 ± 0.01 b45.33 ± 1.23 a18.58 ± 0.50 b379.76 ±31.65 b1.94 ± 0.28 b27.01 ± 0.72 b
C30.55 ± 0.01 a42.58 ± 1.53 a25.20 ± 0.19 a476.96 ± 23.39 a2.79 ± 0.07 a32.42 ± 1.98 a
Source of variation
Biochar treatment (C)************
Nitrogen level (N)************
C × N***********
Different letters indicate significant differences between biochar application rates (p < 0.05). * and **, significant at p < 0.05 and p < 0.01, respectively. C0, C1, C2, and C3 indicate biochar levels of 0%, 1.5%, 3%, and 4.5% w/w. N0 and N2 indicate levels with no nitrogen applied and with conventional nitrogen applied, respectively. TN: soil total nitrogen content, AN: alkali-hydrolyzable nitrogen content, AP: available phosphorus content, AK: available potassium content, SOM: soil organic matter content, C: carbon, N: nitrogen. Values are means ± SD.
Table 5. Effects of biochar application on the alpha diversity indices of the bacterial communities.
ParametersNitrogen LevelBiochar TreatmentANOVA
C0C1C2C3Biochar Treatment (C)Nitrogen Levels (N)C × N
Chao 1N04056.77 ± 222.60 a3659.24 ± 287.04 a3793.70 ± 432.81 a4361.17 ± 673.99 aNS***
N24162.52 ± 209.58 b4229.02 ± 111.52 b4596.18 ± 206.40 a4616.04 ± 254.24 a
SimpsonN07.99 ± 0.40 b8.10 ± 0.26 b8.00 ± 0.32 b9.40 ± 0.30 a***NS
N29.73 ± 0.19 ab9.61 ± 0.21 ab9.46 ± 0.43 b9.97 ± 0.04 a
ShannonN00.97 ± 0.01 a0.97 ± 0.01 a0.95 ± 0.06 a0.99 ± 0.00 aNS*NS
N21.00 ± 0.00 a1.00 ± 0.00 a0.99 ± 0.01 a1.00 ± 0.00 a
The Number of OTUsN02332.00 ± 292.32 c2543.00 ± 135.70 bc2751.33 ± 118.71 ab3198.33 ± 162.20 a****
N22865.00 ± 75.72 b3093.33 ± 57.74 ab3188.00 ± 113.33 a3304.00 ± 155.96 a
Different letters indicate significant differences between biochar application rates (p < 0.05). NS, not significant; * and **, significant at p < 0.05 and p < 0.01, respectively. C0, C1, C2, and C3 indicate biochar levels of 0%, 1.5%, 3%, and 4.5% w/w. N0 and N2 indicate levels with no nitrogen applied and with conventional nitrogen applied, respectively. Values are means ± SD.
Table 6. Correlations between relative abundance of the bacterial communities and soil environmental factors.
ParameterspHESPECeSAReCECTNANAPAKSOMC/N Ratio
Proteobacteria0.3970.5010.5030.423−0.630−0.531−0.261−0.660−0.767 *−0.723 *−0.614
Bacteroidetes0.847 **0.934 **0.942 **0.911 **−0.985 **−0.942 **−0.507−0.945 **−0.962 **−0.925 **−0.847 **
Chloroflexi−0.389−0.545−0.542−0.4660.6400.5270.2180.6520.776 *0.714 *0.683
Actinobacteria−0.625−0.716 *−0.724 *−0.6570.829 *0.762 *0.3920.858 **0.918 **0.896 **0.751 *
Firmicutes−0.439−0.657−0.656−0.6030.749 *0.6250.0950.757 *0.838 **0.829 *0.829 *
Gemmatimonadetes−0.0170.2420.2320.192−0.273−0.1090.173−0.191−0.384−0.264−0.438
Acidobacteria−0.426−0.374−0.369−0.3650.3670.3370.4750.1960.3190.1250.128
Verrucomicrobia0.6250.6540.6310.673−0.525−0.562−0.381−0.449−0.421−0.384−0.492
Patescibacteria−0.891 **−0.847 **−0.863 **−0.826 *0.934 **0.945 **0.6630.936 **0.891 **0.889 **0.680
Cyanobacteria−0.513−0.559−0.597−0.5120.723 *0.7040.3240.846 **0.838 **0.894 **0.596
Spirochaetes−0.412−0.597−0.589−0.5240.6530.5390.2100.6370.777 *0.6930.718 *
Fibrobacteres−0.728 *−0.725 *−0.738 *−0.6760.845 **0.816 *0.5590.865 **0.901 **0.871 **0.648
Armatimonadetes0.714 *0.5940.5960.602−0.591−0.675−0.571−0.612−0.511−0.548−0.382
Nitrospirae−0.686−0.577−0.621−0.5890.6350.752 *0.5400.756 *0.6040.7040.384
Rokubacteria−0.402−0.285−0.283−0.3460.2480.2770.3310.0810.020−0.041−0.010
*, ** Correlation is significant at the p < 0.05 and 0.01 level, respectively. ESP: soil exchangeable sodium percentage, ECe: electrical conductivity of soil saturation extract, SARe: sodium adsorption ratio of soil saturation extract, CEC: cation exchange capacity, TN: soil total nitrogen content, AN: alkali-hydrolyzable nitrogen content, AP: available phosphorus content, AK: available potassium content, SOM: soil organic matter content, C: carbon, N: nitrogen.
Disclaimer/Publisher’s Note: The statements, opinions and data contained in all publications are solely those of the individual author(s) and contributor(s) and not of MDPI and/or the editor(s). MDPI and/or the editor(s) disclaim responsibility for any injury to people or property resulting from any ideas, methods, instructions or products referred to in the content.

