Article

Study on the Spatio-Temporal Patterns of Survival Dynamic Evolution of Specialized Farmers’ Cooperatives and the Influencing Factors of Underdeveloped Areas in China—Taking Yunnan Province as an Example

School of Economics and Management, Southwest Forestry University, Kunming 650224, China
*
Author to whom correspondence should be addressed.
Sustainability 2024, 16(24), 11256; https://doi.org/10.3390/su162411256
Submission received: 4 December 2024 / Revised: 17 December 2024 / Accepted: 18 December 2024 / Published: 22 December 2024

Abstract

:
Analyzing the survival and development environment, internal dynamics, and development direction of specialized farmers’ cooperatives in underdeveloped areas to enhance the vitality of the development of the agricultural industry is a key strategy for the work of the “Three Rural Issues” in China. Based on the data of 3194 specialized farmers’ cooperatives in Yunnan Province from 2000 to 2023, this paper utilizes the spatial measurement method and survival analysis method to study the spatial distribution of their survival and related influencing factors. The study found the following: (1) Cooperatives show a spatial aggregation trend from “high to high” to “low to high”, and the formation of new sub-core areas is accelerating. (2) The establishment stage of cooperatives shows an obvious annual cycle effect, and cooperatives established in the early stage show stronger survival resilience. (3) The factor of “organizational characteristics and technological innovation” significantly prolongs the survival time of cooperatives, while the factor of “establishment stage” has a negative effect. (4) The influence of a cooperative’s asset size and trademark on its operational durability tends to decrease over time, but the influence of relatedness remains relatively stable. (5) Over time, the survival and development patterns of cooperatives at the provincial level show obvious differentiation, and the clustering phenomenon of “low-high” development gradually appears in minority autonomous counties. The results of this study provide a scientific basis for deepening and strengthening the study of the basic rural business system.

1. Introduction

Specialized farmers’ cooperatives (abbreviated as cooperatives) are economic organizations in which agricultural producers voluntarily join together; they received attention after the promulgation and implementation of the Law of the People’s Republic of China on Farmers’ Specialized Cooperatives in 2006, and the Twentieth National Congress of the Party and the Third Plenary Session of the Twentieth Central Committee of the CPC emphasized their key role and the importance of consolidating and perfecting the basic business system in rural areas. Over the years, cooperatives have increased the degree of organization and bargaining power of farmers and provided impetus for agricultural economic growth. In promoting agricultural modernization and building a strong agricultural country, they have become a new type of platform, injecting momentum into shaping a new agricultural productivity system [1]. Compared to other regions in China, ethnic minority border areas often face harsh natural conditions, significant survival challenges, and weak economic foundations, with relatively fragile market participants [2]. As China’s “gateway” for foreign exchanges, these regions are not only home to many ethnic minority communities but also hold strategic significance for national development. However, rural areas in these regions face slower marketization processes and weaker economic infrastructure, creating significant barriers to development [2]. Therefore, conducting in-depth research on the survival models, development patterns, and evolutionary processes of cooperatives in ethnic minority border areas, while analyzing the factors contributing to regional development differences, holds significant practical importance and provides valuable guidance for policy formulation and implementation. This paper takes specialized farmers’ cooperatives in Yunnan Province as the research object, portrays their spatial pattern, analyzes the influencing factors, and provides cases for the research on rural governance and improvement of the basic rural business system in ethnic border areas.

2. Literature Review

Discussions on the survival and development of business organizations or market players have their roots in the study of industrial evolution. Among them, Barnard pointed out that persistence is a key indicator of business success [3]. At the same time, Schumpeter also put forward new theoretical thinking in the academic world, that is, enterprises, through the introduction of new technologies and the introduction of new products, resulting in disruptive changes called “creative destruction” [4], and enterprises, based on their own technological innovation and resource integration capabilities, making decisions about the entry and exit of the industry [5]. Since then, extensive academic attention has been given to the study of how existing firms extend their survival and how industries evolve [6]. Earlier studies have found that enterprise survival is the result of the interaction between the characteristics of its internal organizational structure and the characteristics of the external industry environment [7], which implies that there exists an innovative perception in the enterprise, which improves the survival probability of continuous operation through the judgment and action of its resource endowment and the competitive situation in the industry and becomes a new impetus for pulling the development of the industry. With the depth of research, scholars at home and abroad generally believe that macroeconomic factors and micro-individual factors work together to influence the sustainable development of industries [8,9,10]. Further, scholars propose that exploring the factors influencing the survival of enterprises is the core link in exploring the evolutionary path of enterprise survival [11,12]. Based on long-term research and experience, two classic facts about the evolution of business survival can be sorted out. First, the survival and development of enterprises are significantly affected by organizational characteristics and the stage of entry. Enterprises rely on the advantages of production factors such as labor, capital, land, technology, management, and other factors of production at their disposal as the organizational characteristics of obtaining to win market competition [13]. In general, for smaller firms, a lack of entrepreneurial talent or weak industry competitiveness will increase the risk of firm failure [14,15]. With different industry cycles [16], predestined enterprises will have different orders of entry; the number of enterprises entering the industry over time shows a “bell”-shaped law, with the initial fact of high “infant mortality”, and most enterprises will, in 5–10 years, experience the “market shuffle out”, followed by a slow exit rate [17]. Secondly, enterprises are strongly influenced by “Schumpeterian technological innovation capability”. Based on the analysis of the external environment, a series of political and economic environments (policy support, the level of economic development, economic cycles, business environment, etc.) [18,19,20,21] have led to significant geographic differences in technological innovations, and technologically innovative firms located in the core cities of a region usually last longer [22,23]. Based on the analysis of the internal environment, there have been many studies that show that innovation ability is the key to maintaining the vitality and long-term competitiveness of enterprises [24,25]. Technological innovation acts on the survival of enterprises by influencing production factors such as labor resources, capital investment, land resources, and management effectiveness [8]. In recent years, the use of theories and methods of economic geography to study the survival of enterprises has received widespread attention. According to Tobler’s first law, everything is related to everything else, except that things that are closer together are more closely related [26]. Things in geography are spatially interrelated and have different distributional characteristics, such as clustering, randomness, and regularity [27]. Many scholars have studied such a functional mechanism from various aspects, such as geospatial (spatial location, clustering, and dispersion status) and organizational characteristics (capital scale, human resources, and R&D investment) [28,29]. Importantly, region-specific environments, especially local environments, play a non-negligible role in the survival and development of cooperatives, and venture capital accelerates the regional layout of start-ups, which plays an important role in their initial growth.
Most studies on cooperatives have concluded that cooperatives can effectively overcome village development bottlenecks and attract capital injection into rural areas, becoming a core force in promoting modern agricultural development, which fits the needs of the era of agricultural transformation [29,30]. However, due to the limited scale of development, low-level and insufficient standardization of operation, or inadequate external monitoring mechanism, cooperatives are prone to close or fall into zombie operation due to market turbulence [31]. Compared to the extensive research on business survival, there is a relative lack of research on the survival and development of cooperatives in the face of market volatility [32]. Currently, the number of legally registered cooperatives in the country has exceeded 2.2 million, and their coverage has reached almost half of the total number of farming households in the country [30]. However, these data only represent the number of cooperatives at a specific point in time and do not reflect their survival status and its changes [8]. Relevant studies have found that the geographical distribution of cooperatives is significantly concentrated in the southern region east of the Hu Huanyong line, forming a high-density agglomeration area with the Huanghuaihai Plain as the core and displaying a circling distribution characteristic that gradually decreases from the core to the periphery [33,34]. At the same time, there is also a significant spatial agglomeration feature, with the Yellow Huaihai Plain and the provinces of Hubei, Hunan, and Zhejiang as the dense area and the northern, western, and southern areas as the cold-spot area, showing a strong geographical difference and polarization trend [27,34].
In summary, the academic community has made significant progress in research on enterprise survival, providing ample methodological guidance for this study. However, research on the survival of cooperatives remains relatively limited, particularly regarding their survival status, spatial distribution characteristics, and influencing factors. Studies on the regional differences and formation mechanisms of cooperatives in ethnic minority border areas are even rarer. Therefore, this study, based on the internal conditions and external environment affecting cooperative survival, constructed a research model with the dimensions of “organizational characteristics—stage evolution—technological innovations”. Using methods from economic geography, such as survival analysis and spatial autocorrelation analysis, the study explored the spatial distribution and influencing factors of cooperatives in ethnic minority border areas. This provides a basis for optimizing the spatial layout of cooperatives and improving the rural basic management system. In addition, the study employed econometric models for quantitative analysis, offering empirical evidence and valuable references for research in the field of cooperatives.

3. Materials and Methods

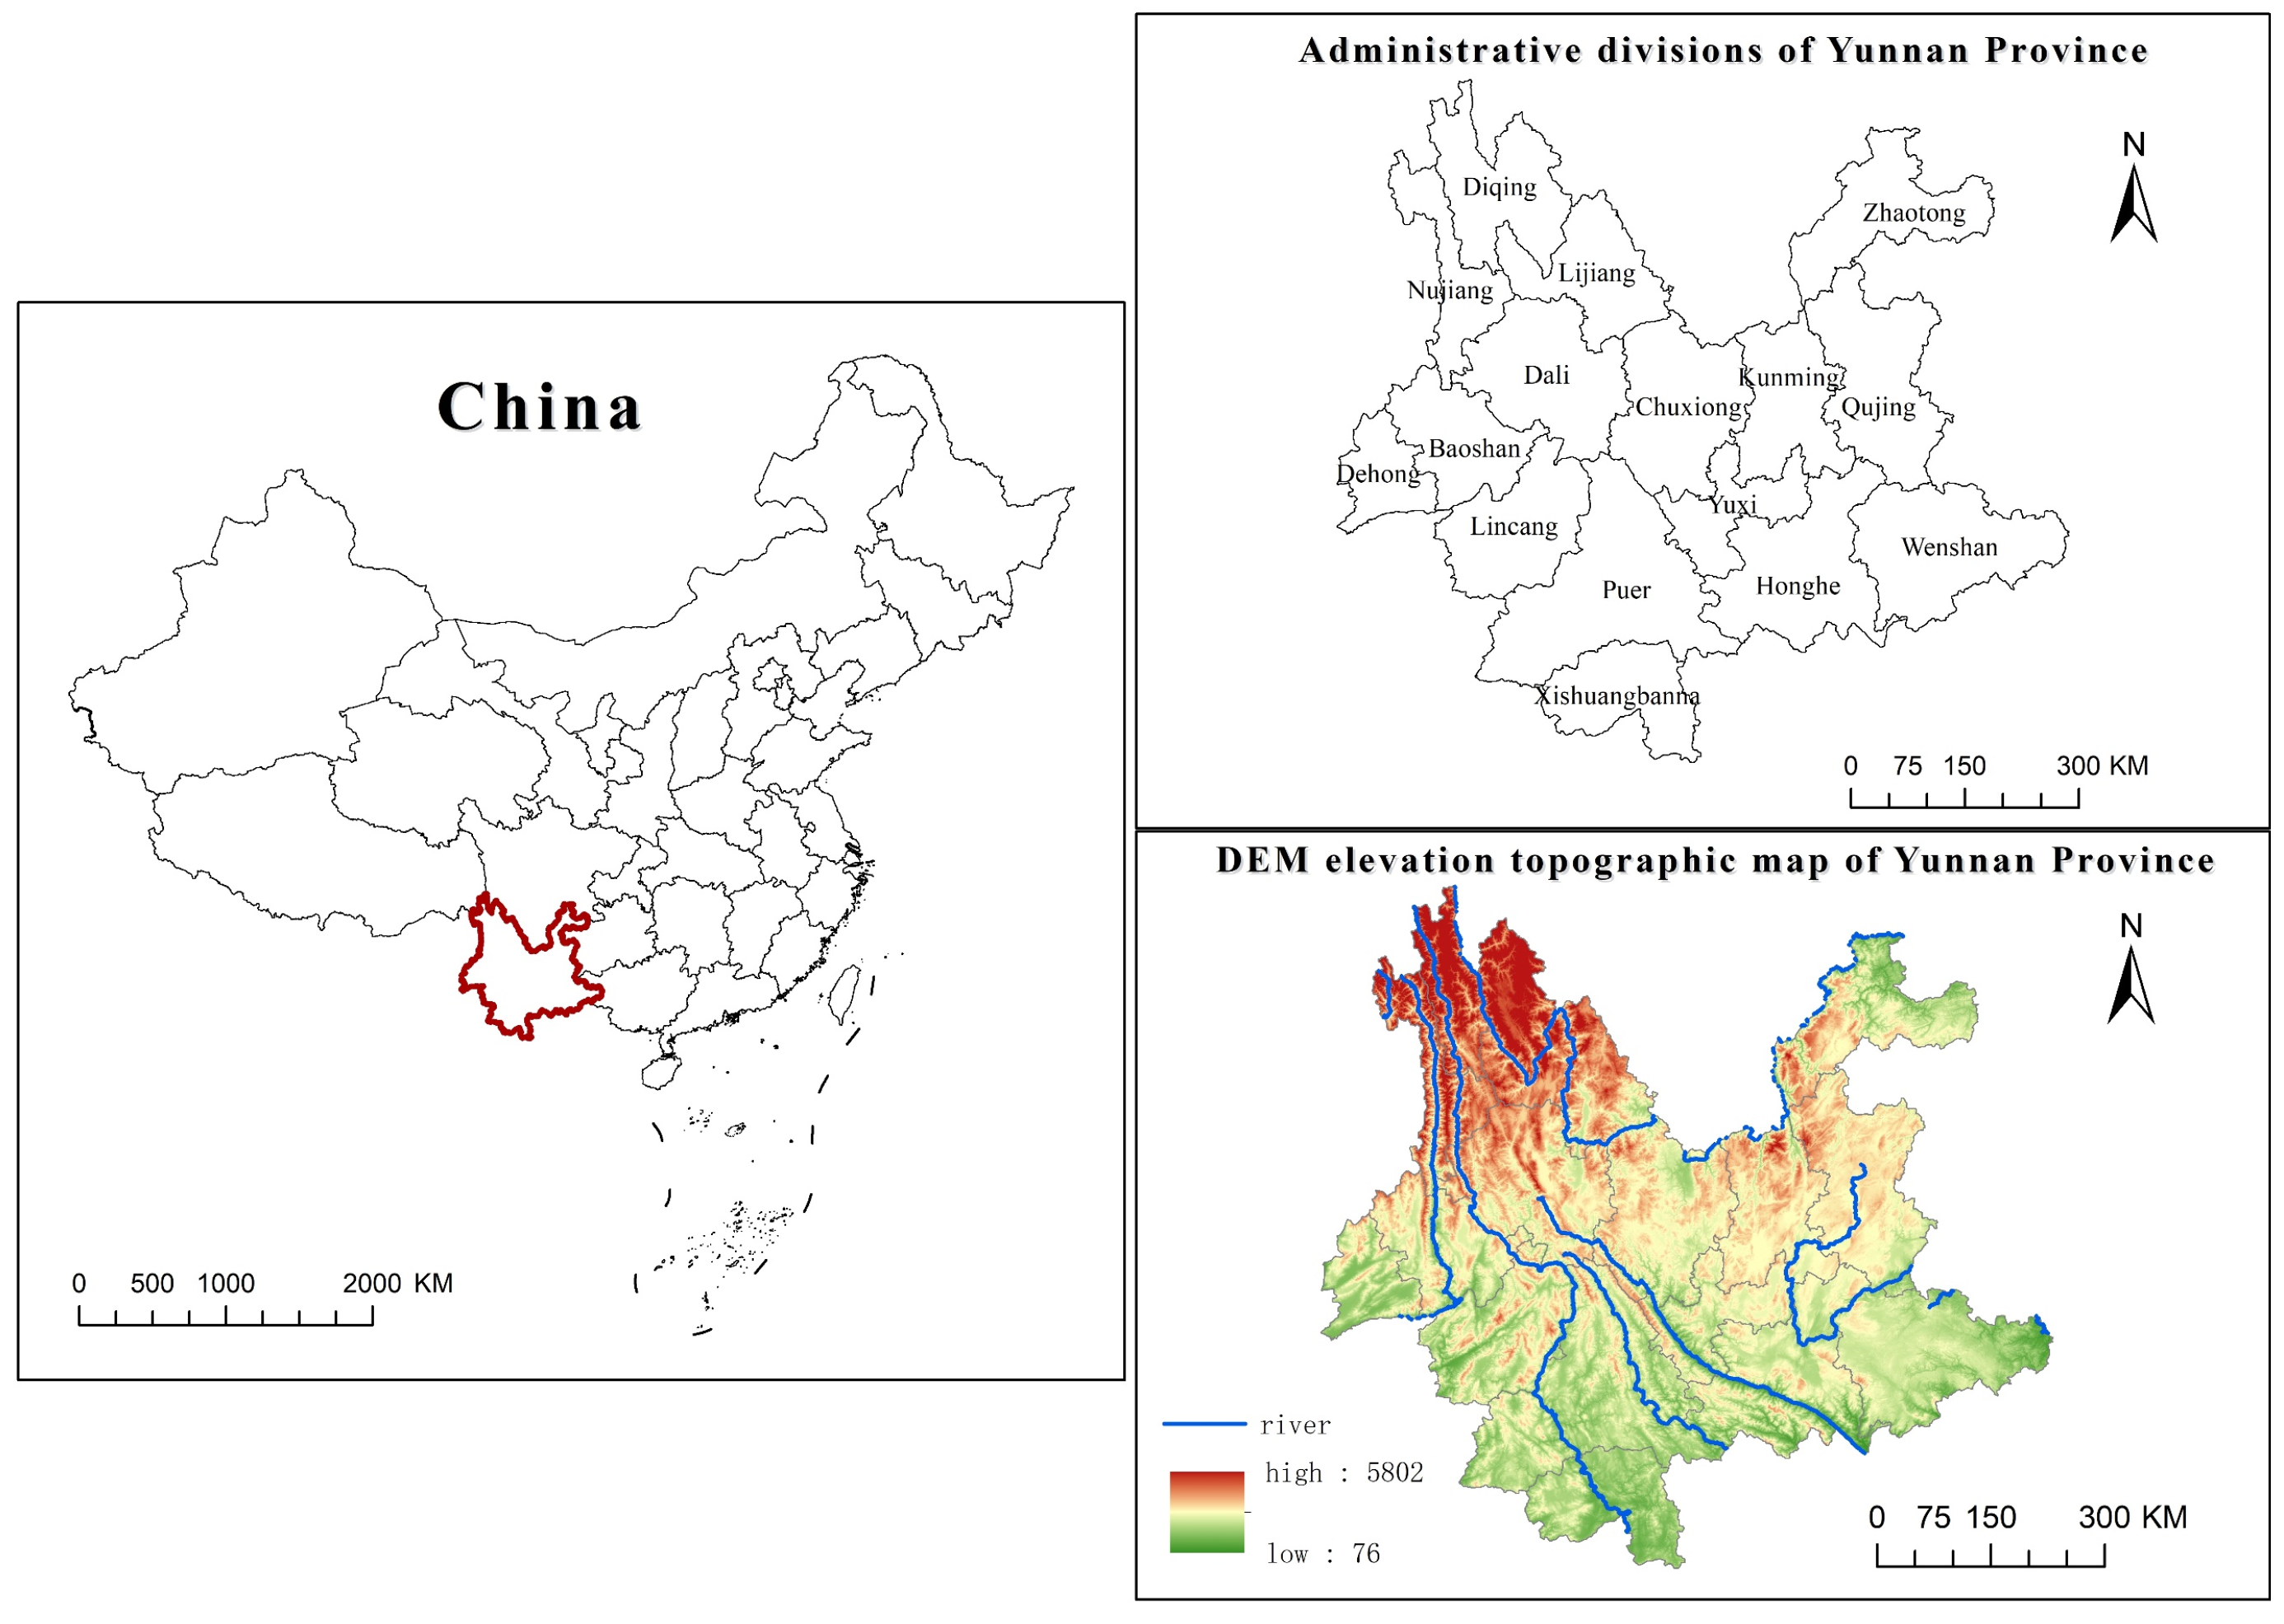
3.1. Overview of the Study Place

Yunnan Province is in the southwest of China (Figure 1), neighboring Myanmar, Laos, and Vietnam. The province spans several geographic and climatic zones, including plateaus, mountains, and basins, and the terrain is generally high in the northwest and low in the southeast, which is known for its complex and varied topography and unique climatic conditions. There are a total of 25 long-term resident ethnic minorities in Yunnan Province, and its ethnic minority population accounts for as high as 33.12%, which is typically representative of the study of frontier ethnic minorities. In recent years, specialized farmers’ cooperatives in Yunnan Province have made a series of new progresses through continuous innovation and development in exploration. According to statistics, in 2023, the operating income of specialized farmers’ cooperatives in the province amounted to 15.9 billion yuan, and a total of 4.402 million households were driven by farmers. Through years of cultivation, the development of specialized farmers’ cooperatives in Yunnan Province has been effective, promoting the deep integration of small farmers and modern agricultural development, playing an important leading role in promoting the process of agricultural modernization, and helping the comprehensive revitalization of the countryside. The agricultural industry chain is constantly being extended, and cooperatives integrating production, processing, and marketing have maintained a growth trend. Therefore, this paper takes Yunnan Province as an example to explore the survival and development of cooperatives in ethnic border areas with typical representativeness.

3.2. Data Sources

Since there is no professional statistical database on specialized farmers’ cooperatives, this study adopted the following methods to collect and organize the data: first, the list of model cooperatives published in Yunnan Province from 2000 to 2023 (2017 was not published) was collected; second, the information of cooperatives in the yellow pages of Chinese agricultural enterprises was referenced; third, the key data of cooperatives were collected through the official websites of “Qi Chacha” and “Tian yiancha” official websites to collect key data on cooperatives; fourth, patent and trademark information was obtained from the Patent Examination Information Query System (PXIS) and Bai Teng Patent Search Platform (BPSP) to measure the innovation capacity; and fifth, the data were screened to exclude samples with asset sizes less than CNY 10,000 and incomplete information. Finally, the detailed data of 3194 cooperatives were obtained for the study sample.

3.3. Research Methodology

3.3.1. Spatial Autocorrelation Analysis

In this study, the global Moran’s I index was used to measure the spatial agglomeration characteristics of cooperatives to assess the overall spatial correlation, and because the overall evaluation may overlook the local specificity, the overall analysis was followed by the introduction of the local Moran’s I index to assess the correlation of the distribution of cooperatives in each state, city, and the surrounding areas of Yunnan Province. A Moran’s I index greater than 0 is a positive spatial correlation, with cooperatives clustering in either high-value or low-value areas; less than 0 is a negative spatial correlation, with cooperatives clustering in a mixture of high-value and low-value areas in areas of large differences in survival.

3.3.2. Survival Analysis

In this study, the application of the Kaplan–Meier methodology and the Cox proportional risk model is based on data on cooperatives that began entering the market in 2000, and the data are presented as right-censored as of 31 December 2023, which is consistent with the premise assumptions of the survival analysis methodology.
  • Kaplan–Meier method
The Kaplan–Meier method is widely used in survival analysis. Its calculation process consists of first calculating the probability that the cooperative will continue to survive to the next period after a certain period, which is called the survival probability, and then multiplying the survival probabilities of each time together to finally obtain the cumulative survival rate of that period. Its calculation formula is as follows:
S ( t ) = i : t i t ( 1 d i n i )
where t denotes the survival time of the cooperative, n i denotes the number of risks to which the cooperative is exposed at the point in time, d i denotes the number of exits from the cooperative at the time point j , and S ( t ) represents the survival function of the cooperative.
2.
Cox proportional risk model
In survival analysis, risk functions are often used to characterize the distribution of survival times. This function specifically expresses the probability of a particular event occurring in a unit of time under the condition that an observed object has survived to that time, and its basic expression is described below:
h ( t ) = lim t 0 P r ( t T t + t T t ) t = lim t 0 1 t P
t denotes the length of survival of the cooperative, t represents a specific time, pt then represents the mortality rate of cooperatives at time t , and h ( t ) is the risk function of the cooperative at moment t , i.e., instantaneous mortality.
The key to the risk function analysis is the dependent variable of the cooperative’s experience time from joining to exiting, but the structure of the survival time data does not match the normal distribution and is not suitable for linear regression. Logistic regression analysis using the dichotomous variable of whether the cooperative exited would not be able to fully utilize the survival time data information. Therefore, the Cox proportional risk model was chosen for this study, which is a semiparametric regression model for survival analysis that can assess the effects of multiple factors on survival time without assuming the characteristics and form of the probability distribution of the time of occurrence of the event so that the survival analysis can cope with the data of different or unknown distribution patterns. The model setting represents the baseline risk function, and the basic form of the model is as follows:
h ( t , X ) = h 0 ( t ) e ( β 1 X 1 + β 2 X 2 + + β ρ X ρ ) = h 0 ( t ) e i = 1 ρ β i X i
h 0 ( t ) is the underlying risk rate of the cooperative at time t , β is the regression coefficient, and X denotes the covariate.
3.
Schoenfeld’s residual robustness test
The Schoenfeld residual robustness test is a diagnostic tool used in survival analysis to test the proportional risk assumption in the Cox proportional risk model. The assumption requires that the effects of covariates on risk remain constant over time. It works by measuring the deviation between the observed covariate values at each event time and the expected value of the model fit. If the proportional risk assumption holds, there should be no systematic correlation between Schoenfeld residuals and time.
The Schoenfeld residual is given as follows:
r j i = X j i E ^ ( X j | t i )
r j i is the i th event under the i th residuals of the j th covariate, X j i is the j th covariate value observed at event moment t i , and E ^ ( X j | t i ) is the expected value of the j th covariate based on risk weights.
The formula for the Schoenfeld’s residual robustness test method is as follows:
r j = α + γ t + ε
r j is the Schoenfeld residual of the j th covariate, t is the time of the event, and γ is the regression coefficient for time, which is used to determine the relationship with time.
If the regression coefficient of γ is significant (p-value < 0.05), it means that the residuals are time-dependent, and the proportional risk hypothesis does not hold. If γ is not significant (p-value > 0.05), the proportional risk hypothesis is true.

3.3.3. Kernel Density Estimate

Kernel density estimation (KDE) is a spatial density analysis method that evaluates the characteristics of the spatial distribution of observations based on the density of data points. KDE calculates the density of observations in a region near a spatial point, and data points close to the study point are given high weights. The estimated density of the study point is determined by the weighted average of the data points in the region, and the weights are assigned according to the decreasing distance. The method does not require strict assumptions about the underlying distribution, is adaptable to a variety of data structures, and provides a powerful tool for understanding spatial patterns. The expression for KDE is as follows:
f x = 1 n × h i = 1 n k ( D i j h )
where f x is the kernel density at any point x in space, k D i j h is the kernel function, h is the distance decay threshold (i.e., bandwidth), D i j denotes the distance from point j to the center point i in range h , and n is the number of point elements in range h .

4. Spatial and Temporal Evolution of the Survival and Development of Cooperatives

4.1. Temporal Evolution of Cooperative Survival and Development

For a long time, agriculture in China has been dominated by small-scale farmers. After the founding of New China, the state guided farmers to mutual aid and cooperation, and the cooperative system went through the stages of corporatization, from mutual aid groups and primary societies to senior societies and then to the people’s commune system. After the reform and opening, farmers’ willingness to cooperate based on family contract management has increased, and there are various ways to do so. The year 2007 saw the introduction of the Law on Farmers’ Specialized Cooperatives, providing legal support for the standardized development of cooperatives, and 2018 saw the implementation of the revised Law on Farmers’ Specialized Cooperatives, which has strengthened the incentives, support, and guidance for the development of cooperatives.
In Yunnan Province, specialized farmers’ cooperatives have been exploring and innovating under the driving force of laws and policies, realizing the integration of small farmers and modern agriculture and becoming an important force in linking farmers, activating rural resources, leading industrial upgrading, and safeguarding farmers’ rights and interests, thus playing a positive role in promoting agricultural modernization and rural revitalization. To analyze the evolutionary trajectory of their survival and development, this study divides the development history of cooperatives in Yunnan Province from 2000 to 2023 into four stages, using the landmark events of government policy documents as the demarcation point (see Table 1).
This paper plots the four stages of survival curves for cooperatives in Yunnan Province using the Kaplan–Meier method (Figure 2), showing significant differences in survival by stage. Cooperatives in the first stage have the longest survival period, far exceeding the other stages. Stage 2 has a declining survival rate and is second only to stage 1. The number of cooperatives in this stage is increasing, but there are problems such as “small, scattered, and weak”, as well as challenges such as capital and the low end of the industrial chain [35]. The survival time of stage 3 and stage 4 is similar, and the survival rate of stage 4 is higher than that of stage 3. In the third stage, the government increased financial support, and scientific research and agricultural technicians were involved, but cooperatives faced market competition and high risks, and most of them transformed into agricultural enterprises, which affected the overall survival rate [36]. Stage 4 cooperatives were established for a short time, and the survival rate stabilized after a survival period of more than five years. Early cooperatives’ brands and business models were mature, and those established later were susceptible to market competition and policy regulatory pressures; there were problems with fundraising, credit, land use, etc., which led to the crowding out of competition and shortened the survival time.
The White Paper on the Status of Human Resource Management in Chinese Small- and Medium-sized Enterprises (SMEs) shows that Chinese SMEs survive for an average of 2.5 years and conglomerates for about 7–8 years [8]. Table 2 shows that the average survival time of cooperatives in Yunnan Province is 9.85 years, with more than ten years accounting for 59.3% of the total, and the long survival time is related to the government’s supportive policies and low barriers to entry in agriculture. The average survival time of exiting cooperatives is 8.01 years, accounting for 64.2% of cooperatives with less than ten years, reflecting their vulnerability to the challenges of market competition and internal management, which may be due to the lack of risk management mechanisms, innovation, or the ability to adapt to changes in the market, resulting in poor management and failure to continue to survive.

4.2. Spatial Evolution of Cooperatives

The spatial layout of cooperatives in Yunnan Province has been characterized by a process of policy-guided agglomeration, law-regulated development, and quality and efficiency enhancement, which is closely related to the evolution of government policies, changes in market demand, the distribution of agricultural resources, and the improvement of the legal environment. Over time, the role of cooperatives in promoting agricultural modernization has been highlighted, and their spatial layout has evolved from point to point and from primary to mature.

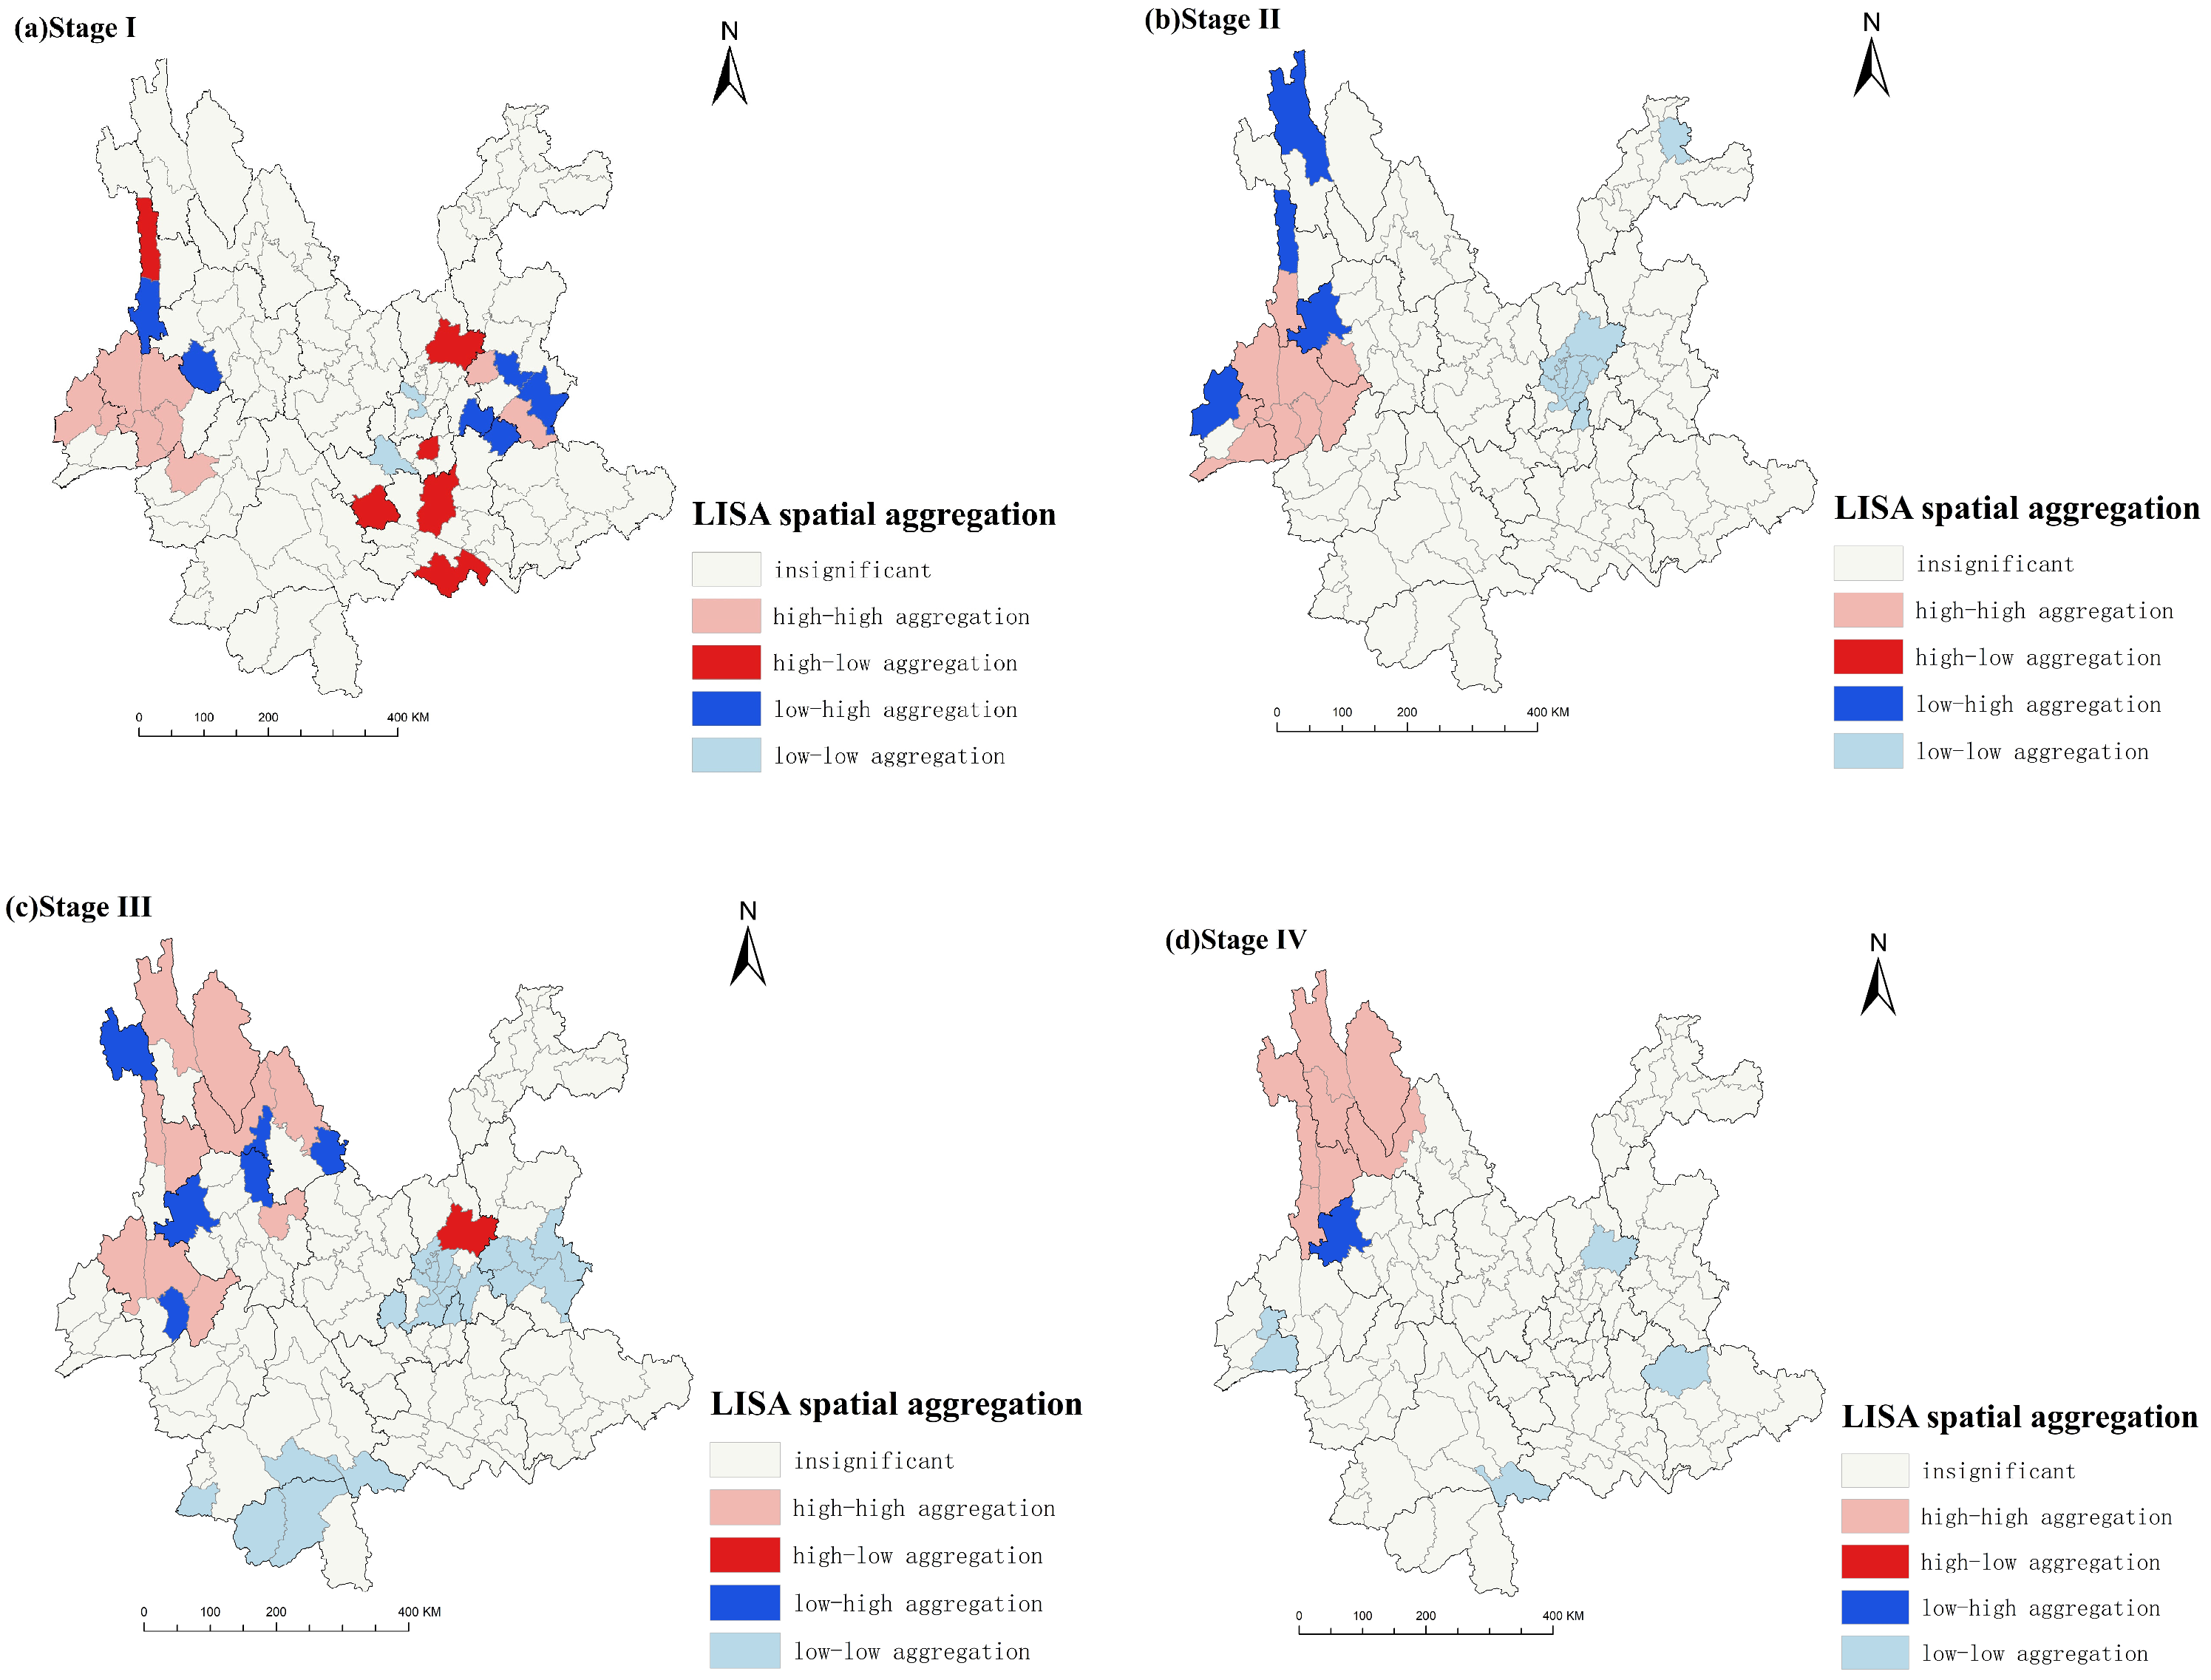
4.2.1. Spatial Autocorrelation Analysis

After analyzing the overall situation of cooperatives’ survival time, we further explored the differences in the survival pattern of cooperatives at different stages of establishment and their geospatial aggregation characteristics. According to the data analysis (Table 3), their development went from random distribution to a significant aggregation process. The stage 1 Moran’s I value was 0.086, spatial autocorrelation was low, and the p-value of 0.061 did not reach the significance level because for the cooperatives started at this stage, the spatial agglomeration characteristics were not fully apparent. The Moran’s I value of stage 2 increased significantly to 0.363, with a strong tendency toward agglomeration, thanks to the Western development strategy and the progression of supportive policies. Stage 3 autocorrelation slightly reduced to 0.264 but was still significant; the policy effect continued to accelerate the aggregation of cooperatives; stage 4 rose to 0.334, reflecting the enhancement of the concentration of a specific region within the province. The autocorrelation of the second stage was the highest, with the rapid development of cooperatives driven by policy and market, with subsequent fluctuation but overall improvement. This phenomenon of agglomeration brings cooperatives economies of scale, resource sharing, and more effective competitive advantages in the marketplace.
Figure 3 illustrates the spatial aggregation characteristics of cooperatives in Yunnan Province. The results show that cooperatives in areas with good infrastructure, policy support, and high market demand, such as Kunming and Dali, are prone to agglomeration, and agriculture with plateau characteristics has also prompted regional agglomeration around specialty agricultural products [37]. As the stages evolve, the spatial distribution changes due to policy, market demand, and competition. In the four stages of development, “high-high” aggregation from the initial concentration of Kunming and other central cities brought the agricultural advantages of the area to Qujing and Yuxi, with other peripheral diffusion; it then covers a wider range of counties and cities to form the characteristics of agricultural products in the industry chain, such as Pu’er Tea, Chuxiong traditional Chinese medicine, etc., with the use of characteristic resources to form the characteristics of the aggregation of the area. The current growth is slowing down, but more emphasis is being placed on quality and efficiency, with a trend towards diversification and specialization. The “high-low” agglomeration emerged from stage 1 in Kunming, Chuxiong, Yuxi, etc. and it continued, with new cooperatives emerging under the demonstration effect and policy support, which may benefit from the learning experience, etc., but their survival time was short, and they needed policy support and market cultivation. The “low-high” agglomeration was mainly in northwestern Yunnan and was mostly accompanied by the “high-high” agglomeration, where the spillover of resources from mature cooperatives helped new cooperatives, and new cooperatives tended to be established in the vicinity of the agglomeration area to take advantage of the agglomeration effect. “Low-low” agglomeration was often accompanied by ‘high-low’ agglomeration, reflecting the multiple challenges faced by new cooperatives. Spatial aggregation evolved significantly at the different stages, from having a single center to being multi-center- and multi-industry-driven, with Kunming as the long-term core and other regions such as Honghe and Xishuangbanna forming new aggregation centers. In the future, Yunnan should guide policies and invest in infrastructure, improve the policy support system, reduce the negative impact of “high-low” aggregation, and promote the development of “low-high” aggregation areas.

4.2.2. Kernel Density Analysis

Figure 4 shows that the spatial development of cooperatives in Yunnan Province has evolved from a single core to a polycentric pattern over more than two decades, in correlation with the implementation of Yunnan’s integrated development strategy, including infrastructure construction. In the initial stage (stage 1), the distribution of cooperatives was concentrated in areas with convenient transportation and developed economies (e.g., Kunming and its surroundings) as well as in areas where ethnic minorities were concentrated, and distinctive industries were evident (e.g., Dehong, Baoshan, Dali, etc.), reflecting not only the economic level but also the policy orientation and geographical advantages of the ethnic characteristics. In stage 2, cooperatives were no longer confined to the initial few main core areas but began to spread to the surrounding areas, probably because the government’s promotion of the cooperative model and the provision of related supportive policies attracted the formation of more cooperatives. In the third stage, the geographical distribution spread further, and remote, resource-rich areas such as Diqing, Nujiang, etc., appeared to take part; these were the “three zones and three states” in the depth of poverty. The state focused on changing for the development of cooperatives to lay the foundation for the characteristics of agricultural resources to enhance the competitiveness of products, promote the local economy, and encourage farmers to increase income. In the fourth stage, cooperatives in northwestern Yunnan were more concentrated in ethnic minority areas such as Diqing and Nujiang, reflecting the role of the Party Central Committee’s strategic decisions, and the government utilized existing cooperatives to implement policies to help farmers increase their incomes and alleviate poverty and to cultivate new cooperatives to complete their projects.

5. Factors Affecting the Survival of Cooperatives

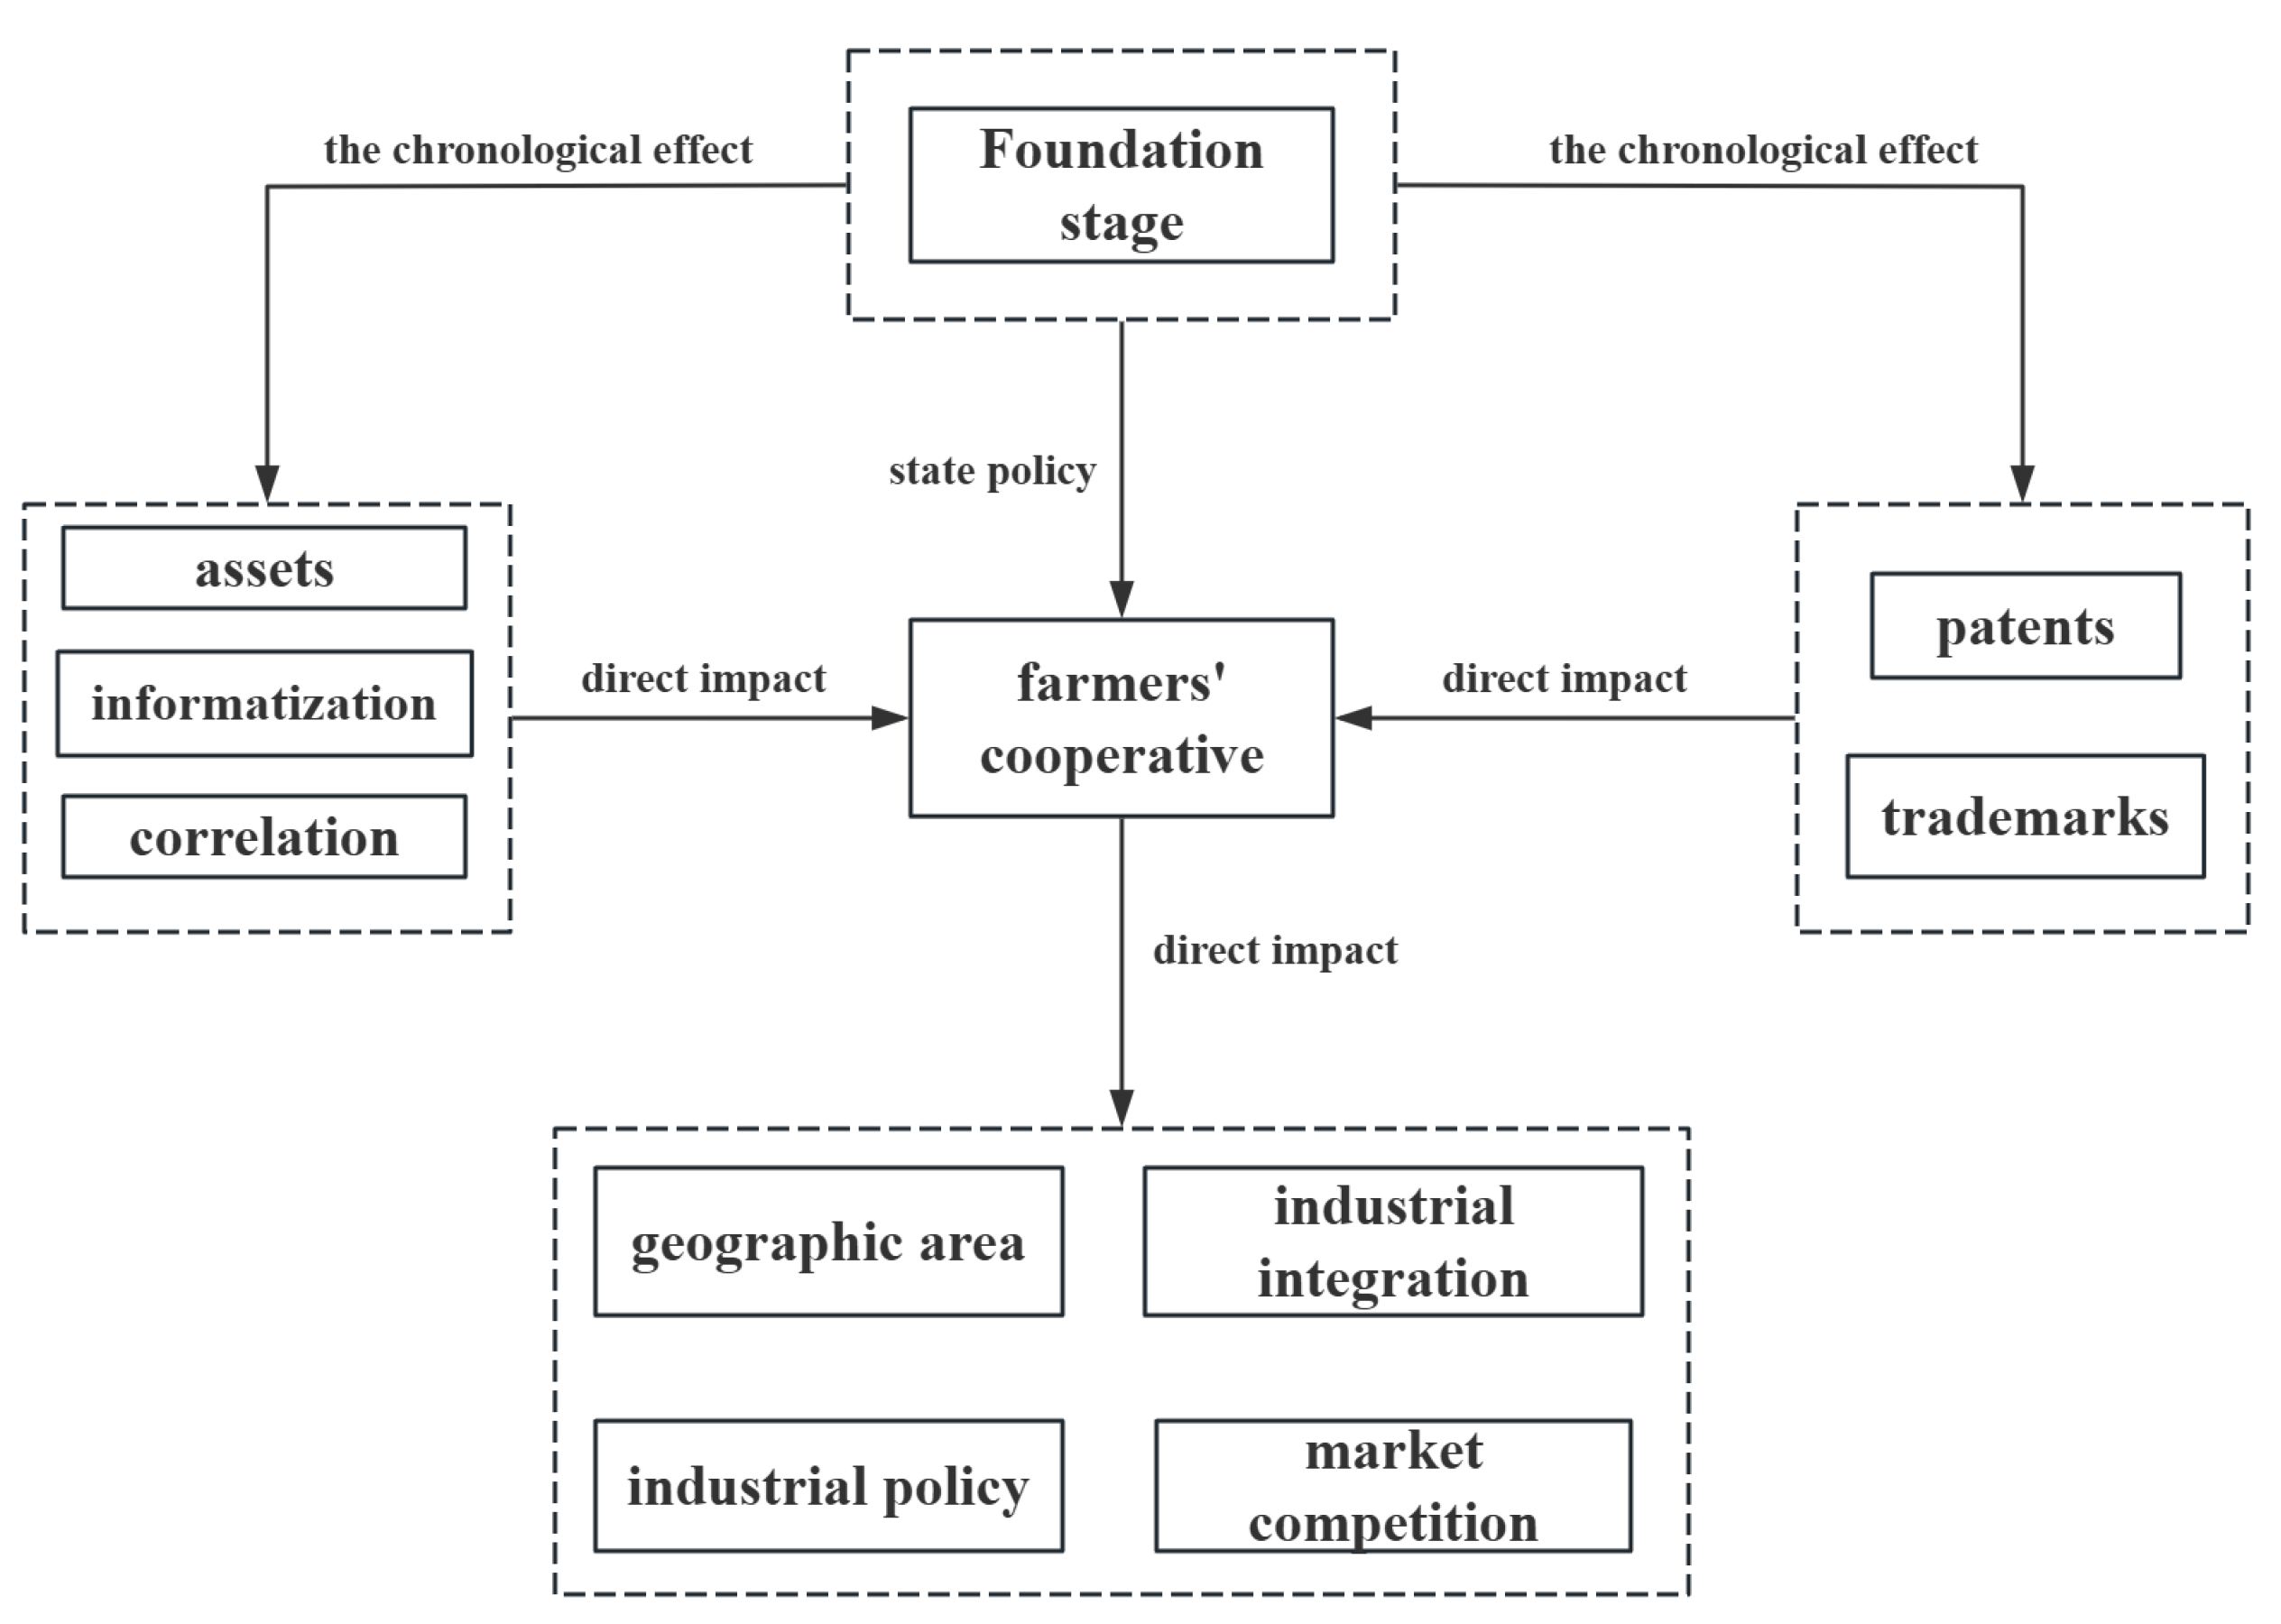
5.1. Variable Selection

The traditional theory of industrial economics says that enterprises are driven by a variety of factors, according to their own endowments and market environment, to make entry and exit decisions [8,34]. Policy support is the key to the development of specialized farmers’ cooperatives; the government’s policy concessions at different times help its development, leading to the “surge phenomenon”, but may also accelerate the disorderly development of cooperatives. As early as the study pointed out, the cooperatives have had “alienation” and other issues, and the backwardness of technological innovation is an important factor in the survival and evolution of cooperatives. The backwardness of technological innovation ability is an important factor in the survival and evolution of cooperatives. To comprehensively analyze the factors influencing the survival and development of cooperatives in Yunnan Province, this study constructed a multi-angle and deep-level analysis framework (see Figure 5).
  • Organizational characteristics. Studies have shown that the organizational characteristics of cooperatives affect their survival and development [38,39]. Asset size affects performance; large-scale cooperatives have more resource funds and are more risk-resistant. Informatization is key, including training in digital technology. Relevance reflects embeddedness; high relevance makes it easy to obtain support for resource sharing. Asset size, relevance, and informatization indicators are selected and expressed in terms of paid-in capital, associated economic organizations, and website construction, respectively;
  • Stage evolution. Related studies show that the establishment time has a chronological effect, and the development trajectory and experience accumulation affect the long-term development [40]. The initial policy intent is to promote rural vitality by relying on the operation of farmers, etc. and the later support goal is to support the large-scale operation of land, etc. Accordingly, this paper is divided into four stages to depict the evolution of cooperatives in Yunnan;
  • Technological innovations. Studies have shown that the survival expectation of enterprises with strong innovative capacity is superior, significantly affecting the duration of survival [41]. Cooperatives that promote the application of technology can improve the quality of agricultural products and yield benefits. Therefore, this study measured the innovation capacity of cooperatives by the number of patents and registered trademarks. (See Table 4 for specific definitions).

5.2. Regression Results

After controlling for factors such as geographic region, organizational characteristics, stage evolution, and technological innovations, all were included in the analysis of models 1 to 4 (see Table 5 for results); these factors were significantly associated with the survival time of cooperatives in Yunnan Province.
Regarding organizational characteristics, the effects of asset size and relatedness are significant, while information technology is not significant. Asset size has a significant positive effect because it can provide resources and stability and enhance competitiveness and risk resistance; the degree of affiliation also has a positive effect, and industrial affiliation can help increase the probability of survival and promote the effective allocation and utilization of resources. Informatization shows a positive trend but fails the test because of its late start and weak infrastructure.
Stage evolution has a significant impact on cooperative survival. Early-stage cooperatives benefited from tilted policies, learning curve effects, and increased survivability; later-stage cooperatives faced competition and high costs, increased survival risks, and more exits from the market.
The ability to innovate is a key factor that increases competitiveness and the probability of survival. Table 5 shows that an increase in the number of patents and trademarks reduces the risk of survival, with each additional patent or trademark reducing the risk by 23.8% and 38.4%, respectively. Given the characteristics of the agricultural industry, technological innovation is important for the survival and development of cooperatives in Yunnan, and cooperatives that continue to innovate and build brands have more advantages.

5.3. Robustness Check

Schoenfeld’s residual robustness test for the cooperative survival model in Yunnan Province shows that geographic region (Table 6), industrial integration, and market competition have significant and robust effects in each stage of the model. Geographic region is important for the difference in the survival rate of cooperatives; industrial integration is robustly positive in the second, third, and fourth stages; and market competition increases or causes the survival rate to decrease. Asset size is robustly positive in model one and inconsistent in other stages. The establishment stage is robust in stages two, three, and four, and the survival risk of cooperatives with different establishment times has different trends over time. After the global test, the p-value of all models is not lower than the p-value of the benchmark model 4, which confirms that the explanatory variables and control variables satisfy the preset conditions of the survival risk model and guarantee the reliability of the conclusions of the empirical analysis.

6. Spatial and Temporal Differences in the Survival of Cooperatives in Different Regions

Table 7 compares how specialized farmers’ cooperatives have developed across four regions in Yunnan. Each region shows distinct patterns of cooperative development influenced by geographic, economic, and policy factors. Central Yunnan has the most favorable economic and transport conditions, supporting early high-density growth. North-eastern and northwestern regions face economic and logistical challenges, requiring more policy intervention. In southern Yunnan, favorable climate conditions and stable policy support have contributed to a consistent development pattern.
Table 8 and Table 9 show that there are differences in the survival of cooperatives in different regions, with central Yunnan surviving the longest on average, followed by northeastern Yunnan, southern Yunnan, and northwestern Yunnan. The proportion of cooperatives surviving for more than ten years is 70.3% in central Yunnan and 55.1% in northwestern Yunnan. For cooperatives in central and eastern Yunnan, asset size has a significant effect on survival evolution, and cooperatives in economically developed regions operate more stably. Affiliation has a positive effect in most regions, and industrial affiliation facilitates the promotion of whole industry chain services and the improvement of the added value of agricultural products. However, the impact of informatization is not significant in all regions, likely due to the lagging infrastructure of agricultural informatization. Industrial integration has a positive effect in some regions, which is related to industrial policy and market demand. Trademarks have a significant positive effect in all regions, verifying the importance of brand building; patents have a non-significant effect, and technological innovation in cooperatives is limited. Industrial policy has a positive effect, and government incentives help cooperatives reduce cost burdens and breakthrough market constraints, which is one of the key factors driving their growth.
In this paper, cities (counties) in Yunnan Province with the name “ethnic minority autonomous counties” (since Yunnan Province is the province with the largest number of ethnic minorities in China, many place names in the province contain the term “XX Ethnic Autonomous County”, so we can determine whether a place belongs to an area inhabited by ethnic minorities by judging whether or not the place name contains this term) are categorized as ethnic autonomous counties, while others are non-ethnic autonomous counties. The regression results are shown in Table 8. The average survival time of cooperatives in non-ethnic autonomous counties is higher than that in ethnic autonomous counties, and cooperatives that have survived for more than 10 years account for 62.8%. Compared with non-ethnic autonomous counties, ethnic autonomous counties have a more significant impact on the survival of cooperatives in terms of asset scale, industrial integration, and market competition, and the impact of information technology is becoming more and more obvious. Due to historical reasons, the economic development of ethnic autonomous counties has lagged, and the cooperatives’ accumulation capacity has been weak, resulting in a small asset scale, slow development of the market, and few subjects, leading to a small degree of competition. However, with the support of national policies, the late-stage advantages of ethnic autonomous counties have become apparent, and the role of various influencing factors on the survival of cooperatives has increased, especially in the integration of industries, which is not a bad performance, and the integration of agriculture and tourism by unique cultures and resources has created a mode of development that has an important impact on the survival of local cooperatives.
Combined with the kernel density analysis of cooperatives (Figure 4), it is evident that cooperatives have gradually become clustered in the ethnic areas of northwestern Yunnan over time and stage of evolution. From the Kaplan–Meier survival curve (Figure 6), the survival rate and average survival time of cooperatives in non-ethnic autonomous counties are higher than those in ethnic autonomous counties. The difference in survival rate reflects that the cooperatives in ethnic autonomous counties have insufficient access to resources and a lack of scientific management and human resources due to remote location and inconvenient transportation, which affects operational efficiency and competitiveness. In addition, the low survival rate of cooperatives in ethnic autonomous counties may be related to the socio-economic environment, as the low level of economic development in these areas and the lower literacy and re-education levels of farmers compared to those in non-ethnic autonomous counties have resulted in a high risk to the survival of local cooperatives.

7. Conclusions

Since the eighteenth CPC National Congress, under the leadership of General Secretary Xi Jinping, the Central Committee of the CPC, based on the new dynamics of China’s regional development and the concept of coordinated development, has introduced supportive policies to promote the high-quality development of specialized farmers’ cooperatives and to improve the survival and development capacity of cooperatives in border and ethnic areas. Coordinated planning and synergistic promotion to strengthen development momentum is the key to consolidating and improving the basic rural business system. This paper takes Yunnan as an object based on the survival data of cooperatives from 2000 to 2023 and uses spatial measurement and survival analysis methods to explore their spatial distribution, agglomeration trend, survival status, and influencing factors. The main findings are as follows:
  • Cooperatives in Yunnan Province have shown an evolutionary trend of spatial agglomeration from “high-high” to “low-high”. Initially, cooperatives in Yunnan Province were mainly located in Kunming, Yuxi, Qujing, and other large cities in central Yunnan, with a single-center structure and a high degree of concentration of functions in the central region, showing a significant siphoning effect. Later, due to economic restructuring, regional policy guidance, infrastructure improvement, and changes in the external economic environment, cooperatives in Yunnan Province have gradually evolved from a single-center development to a multi-center-, multi-industry-driven pattern. This evolutionary trend with multi-center structure to a certain extent integrates the agglomeration advantages of large regions and the dispersal advantages of small regions, in addition to Kunming and its surrounding areas, to enhance the radiation capacity and continue to gather; then, in western Yunnan, Province and southern Yunnan Province, this gradually constitutes a new sub-core area to open up the regional economic development “meridian”; then, in the new core, the new core area is formed into a high-density gathering area for cooperatives;
  • The stage of cooperative establishment in Yunnan Province exhibits a clear year-round effect due to the tilting of cooperative cultivation and development policies. The cooperatives in stage one survived the longest, significantly longer than the cooperatives in the other three stages. The survival rate of cooperatives in stage 2 declined significantly, and the survival time was lower than that of stage 1. The survival time of cooperatives in stage 3 and stage 4 was roughly similar, but the survival rate of cooperatives in stage 4 was significantly higher than that of those in stage 3. This shows that cooperatives established in the early stage have a learning curve effect after their accumulation and then accept the baptism of the market with a strong survival toughness. The cooperatives established at a later stage are constrained in their survival and development due to the lack of talent, shortage of capital, insufficient market development ability, and low brand awareness;
  • The factors of “organizational characteristics and technological innovation” all have a significant positive effect on the survival time of cooperatives in Yunnan Province, while the factor of “stage of establishment” harms it. Among them, increasing investment in fixed assets and enhancing asset size can help improve the risk resistance of cooperatives and significantly increase the survival time of cooperatives. Enhancing the degree of association with other market entities helps to improve the cooperative’s ability to extend the industrial chain, further increasing the probability of survival. Technological innovation has been showing a significant positive correlation with the survival time of cooperatives in Yunnan Province, in which the influence of trademarks is greater than that of patents, which reduces the survival risk in the fierce market competition;
  • The role of organizational characteristics and technological innovations on the survival time of cooperatives in Yunnan Province has changed over time. The learning curve effect persisted relative to cooperatives established at an earlier stage, and cooperatives established at a later stage faced more severe survival conditions. In organizational characteristics, the effect of asset size on the survival time of cooperatives diminished as the establishment stage advanced; however, the effect of relatedness was always maintained at a stable level. In technological innovation, the impact of trademarks on the survival time of cooperatives appears to be weakening, indicating that the survival and development of cooperatives rely more and more on their own accumulation and market resilience performance;
  • The survival and development of cooperatives in Yunnan Province have gradually revealed a differentiated geographical pattern. From the analysis of the overall survival space agglomeration trend, cooperatives with a longer survival period were mainly concentrated in central Yunnan and northeastern Yunnan, while the “high-high” agglomeration area was often adjacent to the “high-low” agglomeration area and showed a trend of gradual expansion to southern Yunnan and northwestern Yunnan. The trend was to expand gradually to southern Yunnan and northwestern Yunnan. Further analysis reveals that cooperatives in Yunnan Province are increasingly clustering in minority autonomous counties and specialty industry zones, and the “low-high” clustering areas are showing good development. The survival time of cooperatives in all cities (states) of Yunnan Province is affected by multiple factors, such as asset size, degree of association, industrial integration, and industrial policies, but the level of informatization and patent status does not have a significant effect on them.

8. Discussion

According to the conclusion of the above research, cooperatives in Yunnan Province have gradually evolved from single-center development to a multi-center-, multi-industry-driven pattern. The “high-high” agglomeration area of a single core area gradually transitioned into a “low-high” agglomeration area of multiple sub-core areas, signaling a shift from quantitative to qualitative development. This transition highlights the need for cooperatives in Yunnan Province to seize opportunities brought by national policy tilts towards border ethnic areas, forge ahead, actively seek change, integrate into and serve the construction of a new domestic development pattern, and comply with the broader global agricultural development trend. Compared to earlier studies that primarily emphasized the localized and small-scale nature of cooperatives, this research underscores a noticeable diversification and scalability of cooperatives, which aligns with global trends toward agricultural modernization and sustainable rural development.
On an international level, Yunnan’s cooperatives play a pivotal role in integrating local agricultural industries with international markets, particularly under the Belt and Road Initiative (BRI). The region’s proximity to Southeast Asia and the China-Laos Railway enhances opportunities for cross-border trade, fostering agricultural export and cooperation with neighboring countries. The southern Yunnan region, in particular, has the potential to develop into a key hub for international agricultural trade, leveraging its superior resource endowments to engage in synergistic development of agricultural industries across borders. Additionally, international experiences show that cooperatives in regions such as Europe and Latin America have successfully improved rural livelihoods and mitigated risks through better policy frameworks, technology adoption, and market integration [42,43]. These insights contrast with earlier research findings that focused mainly on internal development challenges within Yunnan. The current study’s recognition of the multi-center agglomeration and the strategic importance of international trade highlights an evolution in cooperatives’ positioning toward greater global competitiveness.
Regionally, central Yunnan continues to maintain its leadership in cooperative resilience due to its economic maturity and strong market integration, aligning with trends observed in developed regions globally. In contrast, the northeastern Yunnan sub-core area, with its favorable survival foundation, requires targeted support, such as capital injections and operational subsidies, to foster regional synergy. The southern Yunnan region, while resource-rich, needs to prevent cooperative “zombification” (which refers to a situation where cooperatives remain inactive and unproductive, continuing to exist on paper but failing to fulfill their purpose due to poor management, lack of innovation, or disengaged members.) and leverage cross-border economic dynamics to promote a sustainable development model. Meanwhile, northwestern Yunnan, characterized by its ethnic diversity and policy-driven new cooperative entrants since 2016, mirrors similar trends in other developing regions where external policy incentives catalyze cooperative growth.
To further consolidate these advances, precise policy application tailored to each region’s strengths and international integration opportunities will promote the high-quality development of cooperatives. This will not only strengthen the rural management system in border ethnic areas but also solidify Yunnan’s position as a key player in international agricultural cooperation. By aligning with global development frameworks and leveraging regional advantages, cooperatives in Yunnan Province can support rural revitalization, enhance their international competitiveness, and contribute to the global discourse on sustainable agriculture and rural development.

Author Contributions

Conceptualization, R.X.; methodology, R.X.; software, R.X.; formal analysis, R.X.; data curation, R.X.; writing—original draft preparation, R.X.; writing—review and editing, Q.M.; visualization, R.X.; supervision, Q.M.; project administration, Q.M.; funding acquisition, Q.M. All authors have read and agreed to the published version of the manuscript.

Funding

This research was funded by the National Social Science Fund of China, grant number 72363031; and by the Scientific Research Fund Project of Yunnan Provincial Education Department, grant number 2024Y630.

Institutional Review Board Statement

Not applicable.

Informed Consent Statement

Not applicable.

Data Availability Statement

The data presented in this study are available upon request from the corresponding author.

Acknowledgments

This study was embellished and modified by Waseem Ullah. The authors extend great gratitude to the anonymous reviewers and editors for their helpful review and critical comments. We confirm all individuals’ consent.

Conflicts of Interest

The authors declare no conflicts of interest.

References

  1. Hu, Y.; Liu, J.; Zhang, S.; Liu, Y.; Xu, H.; Liu, P. New mechanisms for increasing agricultural total factor productivity: Analysis of the regional effects of the digital economy. Econ. Anal. Policy 2024, 83, 766–785. [Google Scholar] [CrossRef]
  2. Zhao, Y.; Chen, T.; Lu, B. A Study on the Characteristics of Spatio-Temporal Coupling of Agricultural Development and Farmers’ Income in Northwestern Borderland Ethnic Areas—Taking Xinjiang Southern Border as an Example. Chin. J. Agric. Resour. Reg. Plan. 2019, 40, 176–183. [Google Scholar]
  3. Barnard, C.I. The Functions of the Executive; Harvard University Press: Cambridge, MA, USA, 1938. [Google Scholar]
  4. Schumpeter, J.A. Capitalism, Socialism and Democracy; Harper: New York, NY, USA, 1942. [Google Scholar]
  5. Hu, Z.; Sheng, M. Research on technological innovation, heterogeneity and the quality of Post-IPO firms. J. Ind. Technol. Econ. 2020, 39, 4756. [Google Scholar]
  6. Liu, T.; Wang, M.; Zhang, Y.; Wang, F.; Wu, M. Spatiotemporal pattern and determinants of internet firm survival in China. Prog. Geogr. 2021, 40, 410–421. [Google Scholar] [CrossRef]
  7. Wu, L.; Liu, B. Literature Review and Mechanism Analysis of Firm Survival Theory Research. Sci. Technol. Prog. Policy 2012, 29, 156–160. [Google Scholar]
  8. Mai, Q.; Li, L. Spatio-temporal pattern of the dynamic evolution of the survival of new agricultural management subjects and its influencing factors. Prog. Geogr. 2024, 43, 47–62. [Google Scholar] [CrossRef]
  9. Poli, F.; Rossi, S.; Borroni, M. Fall of dwarfs: Micro and macroeconomic determinants of the disappearance of European small banks. J. Int. Financ. Mark. Inst. Money 2024, 96, 102042. [Google Scholar] [CrossRef]
  10. Li, C.; Li, X. Analysis of Spatial Unbalance and Convergence of Agricultural Total Factor Productivity Growth in China—Based on Provincial Spatial Panel Data from 1978 to 2020. Agric. Rural. Stud. 2023, 1, 0010. [Google Scholar] [CrossRef]
  11. Pan, F.H.; Yang, B.F. Financial development and the geographies of startup cities: Evidence from China. Small Bus. Econ. 2019, 52, 743–758. [Google Scholar] [CrossRef]
  12. Duan, L.; Du, D.; Huang, X. Spatial and temporal changes and influencing factors of the location of internet start-ups in Shanghai, China. Prog. Geogr. 2019, 38, 383–394. [Google Scholar]
  13. Peteraf, M.A. The cornerstones of competitive advantage: A resource-based view. Strat. Manag. J. 1993, 14, 179–191. [Google Scholar] [CrossRef]
  14. Lee, J.-W. Analysis of technology-related innovation characteristics affecting the survival period of SMEs: Focused on the manufacturing industry of Korea. Technol. Soc. 2021, 67, 101742. [Google Scholar] [CrossRef]
  15. McCloughan, P.; Stone, I. Life duration of foreign multinational subsidiaries: Evidence from UK northern manufacturing industry 1970–93. Int. J. Ind. Organ. 1998, 16, 719–747. [Google Scholar] [CrossRef]
  16. Agarwal, R.R. Survival of firms over the product life cycle. Southern Econ. J. 1997, 63, 571–584. [Google Scholar] [CrossRef]
  17. He, W. Impact of Industrial Cluster on Firm Start-up Size and Survival: Analysis of SMEs in Liaoning Province. Econ. Geogr. 2019, 39, 112–122. [Google Scholar]
  18. Key, N.; Roberts, M.J. Government payments and farm business survival. Am. J. Agric. Econ. 2006, 88, 382–392. [Google Scholar] [CrossRef]
  19. Suchman, M. Managing legitimacy: Strategic and institutional approaches. Acad. Manag. Rev. 1995, 20, 571–610. [Google Scholar] [CrossRef]
  20. Wang, J.; Li, X.; Han, B. Research on Government Subsidies and Enterprise Survival Based on the Background of Post-Epidemic Era. Econ. Probl. 2022, 11, 58–66. [Google Scholar]
  21. Li, W.; Zheng, W. Digitalization, Specialization Model Transformation and Business Survival Risks. Sci. Decis. Mak. 2023, 5, 64–78. [Google Scholar]
  22. Xiao, X.; Tian, Q.; Mao, H. How the Interaction of Big Data Analytics Capabilities and Digital Platform Capabilities Affects Service Innovation: A Dynamic Capabilities View. IEEE Access 2020, 8, 18778–18796. [Google Scholar] [CrossRef]
  23. Rosenbusch, N.; Brinckmann, J.; Bausch, A. Is innovation always beneficial? A meta-analysis of the relationship between innovation and performance in SMEs. J. Bus. Ventur 2011, 26, 441–457. [Google Scholar] [CrossRef]
  24. Audretsch, D.B.; Mahmood, T. New firm survival: New results using a hazard function. Rev. Econ. Stat. 1995, 77, 97. [Google Scholar] [CrossRef]
  25. Audretsch, D.B. Innovation, growth and survival. Int. J. Ind. Organ. 1995, 13, 441–457. [Google Scholar] [CrossRef]
  26. Klippel, A.; Hardisty, F.; Li, R. Interpreting Spatial Patterns: An Inquiry into Formal and Cognitive Aspects of Tobler’s First Law of Geography. Ann. Assoc. Am. Geogr. 2011, 101, 1011–1031. [Google Scholar] [CrossRef]
  27. Wei, W.; Yin, G.; Xie, S. The Spatio-Temporal Patterns and Influencing Factors of Different New Agricultural Business Entities in China—Based on POI Data from 2012 to 2021. Agriculture 2023, 13, 1512. [Google Scholar] [CrossRef]
  28. Rui, Y.; Yang, Y.; Han, J. Spatial Attribution of the Development of High-Quality Fruit Specialty Cooperatives in County Areas—Based on the Data of Provincial Demonstration Societies in Shaanxi Province. Chin. J. Agric. Resour. Reg. Plan. 2021, 42, 82–92. [Google Scholar]
  29. Li, X.; Luo, Q.; Fan, X. Research on the formation and evolution mechanism of specialized villages in agricultural areas. China Soft Sci. 2009, 71–80. [Google Scholar]
  30. Liu, B.; Tang, C.; Zhou, G. Spatial distribution, influencing factors and innovative development countermeasures of farmer cooperatives in Hunan Province, China. Sci. Rep. 2024, 14, 11308. [Google Scholar]
  31. Liu, Y.; Cao, L.; Wang, Y. Viability, Government Support and the Service Function of Farmer Professional Cooperatives—Evidence from 487 Cooperatives in 13 Cities in Heilongjiang, China. Agriculture 2024, 14, 616. [Google Scholar] [CrossRef]
  32. Iliopoulos, C.; Valentinov, V. Cooperative longevity: Why are so many cooperatives so successful? Sustainability 2018, 10, 3449. [Google Scholar] [CrossRef]
  33. Liu, S.; Guo, Y.; Tian, O. Distribution Characteristics and Reason of Farmers’ Specialized Cooperatives: Taking Example for First Batch of Farmers’ Professional Cooperative Model. Sci. Geogr. Sin. 2014, 34, 316–321. [Google Scholar]
  34. Luo, Q.; Wang, Y.; Zhou, X.; Zhang, T. Spatial pattern of specialized specialized farmers’ cooperatives in China and its influencing factors. Chin. J. Agric. Resour. Reg. Plan. 2024, 45, 155–168. [Google Scholar]
  35. Su, F. Problems and Countermeasures in the Development of New Agricultural Management Subgect in Shanxi. Chin. J. Agric. Resour. Reg. Plan. 2017, 38, 66–71. [Google Scholar]
  36. Liu, Y.; Zhang, C.; Xiong, X.; Ou, M.; Shao, A. Spatial temporal Characteristics and Driving Forces of Farmer Professional Cooperatives in Hilly and Mountainous Areas. Res. Soil Water Conserv. 2023, 30, 312–323. [Google Scholar]
  37. Zhang, P.; Wang, R.; Wu, S.; Zhao, Q.; Li, Y. Strengthening agricultural science and technology innovation to cultivate and grow leading agricultural enterprises. Yunnan Agric. Sci. Technol. 2023, 52, 63–64. [Google Scholar]
  38. Sun, F.; Song, F. Research on credit risk identification and prevention of new agricultural business entities. Econ. Rev. J. 2020, 36, 116–125. [Google Scholar]
  39. Grashuis, J. Agricultural firm survival: The case of farmer cooperatives in the United States. Agribusiness 2020, 36, 79–93. [Google Scholar] [CrossRef]
  40. Zhao, J.; Zhang, J. A Review of 70 Years of Agricultural Business System Reform in New China and Policy Perspectives. Econ. Rev. J. 2019, 35, 32–38. [Google Scholar]
  41. Zhang, H.; Peng, B. Innovative behavior and firm survival: Do innovative environment and employee education matter. Ind. Econ. Res. 2017, 16, 30–40. [Google Scholar]
  42. Nazzaroi, C.; Stanco, M.; Uliano, A.; Lerro, M. Collective smart innovations and corporate governance models in Italian wine cooperatives: The opportunities of the farm-to-fork strategy. Int. Food Agribus. Manag. Rev. 2022, 25, 723–736. [Google Scholar] [CrossRef]
  43. Holgado-Silva, H.C.; Binotto, E. Innovation performance: What is happening in agricultural cooperatives? Braz. Bus. Rev. 2022, 19, 626–641. [Google Scholar] [CrossRef]
Figure 1. Topographic profile map of Yunnan Province.
Sustainability 16 11256 g001
Figure 2. Kaplan–Meier survival curve for cooperatives.
Sustainability 16 11256 g002
Figure 3. Spatial aggregation characteristics of cooperative survival at different stages.
Sustainability 16 11256 g003
Figure 4. Kernel Density Analysis of Cooperative Survival in Yunnan Province at Different Stages.
Sustainability 16 11256 g004
Figure 5. Cox regression analysis research framework.
Sustainability 16 11256 g005
Figure 6. Kaplan–Meier Survival Curve for Cooperatives (Ethnic Autonomous Coun ties vs. Non-Ethnic Autonomous Counties).
Sustainability 16 11256 g006
Table 1. Sorting out the stages of cooperative development.
Basis of DelineationTime NodeMain Features
Policy evolutionStage I (2000–2006)National level: Opinions on Several Policies on Further Strengthening Rural Work and Improving Comprehensive Agricultural Production Capacity; Provincial level: Opinions on Accelerating the Development of Farmers’ Professional Cooperative Organizations
Stage II (2007–2012)National level: Law of the People’s Republic of China on Farmers’ Specialized Cooperatives; Provincial level: Circular on Accelerating the Development of Farmers’ Specialized Cooperatives
Stage III (2013–2017)National level: Opinions on Guiding and Promoting the Standardized Development of Specialized Farmers’ Cooperatives; Provincial level: Opinions of the People’s Government of Yunnan Province on Promoting the Standardized Development of Specialized Farmers’ Cooperatives
Stage IV (2018–2023)National level: Several Opinions on Carrying Out Actions to Standardize and Enhance Specialized Farmers’ Cooperatives; Provincial level: Yunnan Provincial 14th Five-Year Plan for the Development of Quality Enhancement of Specialized Farmers’ Cooperatives (2021–2025)
Table 2. Temporal Distribution of Cooperative Survival.
BrochureAverage Survival Time (Years)Percentage of Survival Time (%)
1–5 Years6–10 Years11–15 Years16–20 YearsMore Than 20 Years
Exit8.0110.853.434.11.50.2
Entry11.162.426.255.913.32.2
All9.855.235.548.59.31.5
Table 3. Global spatial autocorrelation of survival time of cooperatives.
IndexStage IStage IIStage IIIStage IV
Moran’s I0.0860.3630.2640.334
p-value0.0610.0000.0000.000
Z-score1.8727.3365.3086.814
Table 4. Definition of main variables.
IndexesVariablesVariable SymbolsVariable Definitions
Organizational featuresAssetsAssPaid-in capital plus 1 to take the logarithm
CorrelationCorNumber of associated other economic organizations plus 1 to take logarithmic values
InformatizationInfSite established = 1, no site established = 0
Stage evolutionFoundation stageStaStage 1 = 1, stage 2 = 2, stage 3 = 3, stage 4 = 4
Technological innovationsPatentsPatThe number of patents plus 1 to take the logarithm
TrademarksTraLogarithmic number of trademarks plus 1
Control variablesGeographic areaAreCentral Yunnan = 1, northeastern Yunnan = 2, northwestern Yunnan = 3, southern Yunnan = 4
Industrial integrationIntAgricultural business only = 1; agricultural and industrial or agricultural and service business = 2; agricultural, industrial, and service business = 3
Industrial policyPolReceived policy subsidies or honors = 1, no = 0
Market competitionComLogarithm of the number of cooperatives in the region
Table 5. Cox regression results for cooperatives.
(1)(2)(3)(4)(5)
Stage 1
(6)
Stage 2
(7)
Stage 3
(8)
Stage 4
Ass1.080 *** 1.062 ***1.1271.045 **1.0470.951
(0.017) (0.017)(0.095)(0.020)(0.041)(0.120)
Cor0.717 *** 0.751 ***0.6680.728 ***0.850 **0.805
(0.041) (0.041)(0.315)(0.053)(0.074)(0.236)
Inf0.584 0.6701.0000.5960.8400.000
(0.356) (0.356)(.)(0.502)(0.505)(1.8 × 10⁹)
Sta 1.719 *** 1.682 ***
(0.049) (0.049)
Pat 0.238 *0.229 *1.0000.4280.0001.700 × 1023
(0.761)(0.774)(.)(0.719)(4.93 × 10⁷)(1.07 × 10⁹)
Tra 0.384 ***0.396 ***1.3800.352 ***0.527 ***0.000
(0.088)(0.088)(0.671)(0.112)(0.145)(3.15 × 10⁸)
Are1.294 ***1.347 ***1.317 ***1.343 ***1.3031.359 ***1.445 ***0.576 *
(0.032)(0.033)(0.032)(0.033)(0.173)(0.039)(0.071)(0.315)
Int0.9270.855 ***1.0410.9404.284 ***0.9440.647 ***0.312 ***
(0.053)(0.055)(0.052)(0.056)(0.322)(0.071)(0.119)(0.422)
Pol0.162 ***0.136 ***0.191 ***0.174 ***1.0000.182 ***0.198 ***0.000
(0.134)(0.134)(0.134)(0.135)(.)(0.194)(0.190)(3.46 × 10⁸)
Com1.4421.3401.474 *1.3380.9651.3221.1564.05 × 104 **
(0.231)(0.236)(0.232)(0.238)(1.537)(0.271)(0.543)(4.248)
N31943194319431947816941139283
LRchi2576.14603.11671.84851.5556.63491.72271.1287.43
Note: The data above the parentheses in the table indicate the risk ratios (values in parentheses are standard errors); the risk ratios are the opposing values of each coefficient, i.e., the e coefficients, and the survival rate = 1-risk ratios; ***, **, and * denote p < 0.01, p < 0.05, and p < 0.1, respectively; and the sample size is 3194.
Table 6. Schoenfeld proportional risk hypothesis testing.
Indexesρchi2Prob > chi2ρchi2Prob > chi2
Model 1Model 2
Ass0.0010.0000.981
Cor0.0341.8300.176
Inf−0.0392.0100.156
Sta −0.26577.3800.000
Pat
Tra
Are−0.0070.0800.783−0.0432.6900.101
Int0.12517.2400.0000.15530.1000.000
Pol0.0050.0300.8670.0301.2200.279
Com−0.0513.9400.047−0.0422.8300.093
27.3100.000 103.5100.000
Indexesρchi2Prob > chi2ρchi2Prob > chi2
Model 3Model 4
Ass 0.0483.0700.080
Cor 0.0230.7800.377
Inf −0.0392.0000.157
Sta −0.25267.9800.000
Pat0.0010.0000.9780.0030.0200.880
Tra0.0160.4400.5070.0080.1100.745
Are−0.0010.0000.979−0.0351.8200.177
Int0.13720.1700.0000.14827.0500.000
Pol0.0060.0500.8300.0260.9400.332
Com−0.0554.6100.032−0.0412.7200.099
28.580.000 97.1200.000
Indexesρchi2Prob > chi2ρchi2Prob > chi2
Model 5 (Stage 1)Model 6 (Stage 2)
Ass−0.1721.7000.1920.0120.1200.733
Cor0.0420.0600.8030.0623.7600.053
Inf −0.0100.0800.776
Sta
Pat −0.0200.5400.461
Tra−0.0400.1100.7440.0411.5700.210
Are0.0220.0200.884−0.0431.7200.190
Int0.51410.4500.0010.0140.1800.670
Pol 0.0160.2100.644
Com0.1690.7900.373−0.0351.1400.286
11.5100.074 11.1700.264
Indexesρchi2Prob > chi2ρchi2Prob > chi2
Model 7 (Stage 3)Model 8 (Stage 4)
Ass0.1084.7300.0300.0180.0100.925
Cor0.1348.2700.004−0.0180.0200.895
Inf−0.0963.4800.0620.1160.0001.000
Sta
Pat−0.0660.0001.0000.2980.0001.000
Tra0.0040.0100.921−0.2220.0001.000
Are0.0752.5200.1130.1140.3400.558
Int−0.0711.9500.163−0.2901.8400.175
Pol0.0852.8600.091−0.0840.0001.000
Com−0.1117.8600.005−0.1560.9000.343
30.5800.000 2.6600.976
Table 7. Characteristics of the development of specialized farmers’ cooperatives in different regions.
Central YunnanNortheastern YunnanNorthwestern YunnanSouthern Yunnan
Process of spatio-temporal aggregationIn the main core and “high–high” agglomeration areas in the early stages of development, with a gradual decrease in nuclear density Slow increase in nuclear density, extensive low-value areasDiversification of agglomeration characteristics and gradual clustering of core areasChanges in nuclear density have flattened out, and the pattern of development has changed little
Influencing factorsConvenient transportation and well-developed economyComplex natural conditions, low economic level, need for policy supportRich in ethnic specialty agricultural products, poor transportation, weak economy, highly influenced by policiesSuitable climate, influenced by policy
Table 8. Distribution of survival time by region for cooperatives.
BrochureAverage Survival Time (Years)Percentage of Survival Time (%)
1–5 Years6–10 Years11–15 Years16–20 YearsMore Than 20 Years
Central Yunnan10.923.726.055.114.80.4
Northeastern Yunnan10.503.032.951.211.11.8
Northwestern Yunnan9.157.637.347.16.91.1
Southern Yunnan9.884.638.646.18.42.3
Ethnic autonomous counties9.695.537.248.87.70.8
Non-ethnic autonomous counties10.104.832.448.112.02.7
Table 9. Cox regression results of spatial variability in survival of cooperatives.
Central YunnanNortheastern YunnanNorthwestern YunnanSouthern YunnanEthnic Autonomous CountiesNon-Ethnic Autonomous Counties
Ass0.8700.578 ***0.765 ***0.748 ***0.689 ***0.791 ***
(0.132)(0.152)(0.075)(0.057)(0.069)(0.052)
Cor2.0770.0000.0001.4621.2010.473
(0.611)(3.68 × 10⁸)(2.33 × 10⁷)(0.453)(0.519)(0.502)
Inf1.207 ***1.146 *1.0331.0231.117 ***1.025
(0.055)(0.057)(0.033)(0.025)(0.028)(0.023)
Sta1.443 *1.3151.839 ***1.745 ***1.349 ***1.927 ***
(0.202)(0.195)(0.079)(0.079)(0.091)(0.061)
Loc 0.773 **1.344 ***
(0.120)(0.044)
Tra0.245 ***0.202 ***0.358 ***0.447 ***0.378 ***0.417 ***
(0.329)(0.380)(0.186)(0.110)(0.160)(0.105)
Pat2.3700.0000.0000.0000.8890.000
(0.716)(4.27 × 10⁸)(2.04 × 10⁷)(3.29 × 10⁷)(0.753)(5.62 × 10⁶)
Ind0.7391.528 **0.787 **0.9301.405 ***0.725 ***
(0.204)(0.168)(0.114)(0.075)(0.088)(0.073)
Pol0.134 ***0.109 ***0.266 ***0.150 ***0.126 ***0.193 ***
(0.363)(0.595)(0.250)(0.190)(0.244)(0.162)
Com0.000 ***8.87321.585 **1.738 **249.136 ***0.660 *
(2.013)(2.284)(1.400)(0.256)(1.026)(0.252)
N4843561145120919751187
LRchi2110.8796.57230.63373.46565.41370.37
Note: Data outside parentheses in the table indicate risk ratios (values in parentheses are standard errors); ***, **, and * indicate p < 0.01, p < 0.05, and p < 0.1, respectively.
Disclaimer/Publisher’s Note: The statements, opinions and data contained in all publications are solely those of the individual author(s) and contributor(s) and not of MDPI and/or the editor(s). MDPI and/or the editor(s) disclaim responsibility for any injury to people or property resulting from any ideas, methods, instructions or products referred to in the content.

