Article

Towards Sustainable Water Quality Management in the Bohai Sea: A Multivariate Statistical Analysis of Nearshore Pollution

1
Center of Eco-Environmental Monitoring and Scientific Research, Administration of Ecology and Environment of Haihe River Basin and Beihai Sea Area, Ministry of Ecology and Environment of PRC, Tianjin 300211, China
2
Department of Building, Civil and Environmental Engineering, Concordia University, Montreal, QC H3G 1M8, Canada
*
Author to whom correspondence should be addressed.
Sustainability 2024, 16(24), 11187; https://doi.org/10.3390/su162411187
Submission received: 9 November 2024 / Revised: 5 December 2024 / Accepted: 17 December 2024 / Published: 20 December 2024

Abstract

:
The severe water quality pollution of the Bohai Sea impacts both the ecosystem and the economy of the region. This study assesses the water quality of the Bohai Sea using a two-year (2020–2021) dataset to investigate the spatial distribution and sources of contamination. Multivariate statistical analysis methods, including principal component analysis (PCA), cluster analysis (CA), and discriminant analysis, are employed. Thirteen chemical indicators are analyzed through PCA, resulting in the extraction of three principal components that reflect different pollution sources related to domestic, industrial, and agricultural activities. Additionally, the corresponding water quality index (WQI) is calculated to categorize the water quality into three levels using CA. The PCA-based WQI method is feasible and shows similarities to the traditional WQI method. Higher pollution levels are observed in Panjin and Tianjin, while Huludao, Yantai, and Dalian exhibit relatively good water quality. The results indicate complex, multifactorial pollution causes in the Bohai Sea, including eutrophication, heavy metal contamination, and ammonia pollution. These findings can guide region-specific water quality management: Panjin should control heavy metal discharges from industry and transportation, while Tianjin requires improvements in runoff management of ammonia-based fertilizers. Together, these strategies support the ecological and sustainable development of the Bohai Sea.

1. Introduction

The Bohai Sea, China’s only semi-enclosed inland sea, consists of Liaodong Bay, Bohai Bay, Laizhou Bay, and the central Bohai Sea. It connects to the northern Yellow Sea through the Bohai Strait. This region is crucial to China’s marine development and the coordinated management of its coastal and marine resources, playing a key role in both the economic growth and environmental sustainability of nearby coastal areas. The Bohai Sea, with its unique natural and ecological features, is essential to the economic development of the provinces and cities along its coast [1,2].
For decades, the Bohai Sea has received inflows from the Hai, Yellow, and Liao River systems, leading to significant impacts from both land-based and marine pollution sources. The ecological environment of the Bohai Sea has thus faced substantial degradation owing to river discharge, sediment release, industrial waste drainage, and atmospheric sedimentation [3,4,5]. In 2018, the Ministry of Ecology and Environment, the National Development and Reform Commission, and the Ministry of Natural Resources of China jointly issued and released the Action Plan for the Uphill Battles for Bohai Sea Management to curb further environmental deterioration [6]. This plan established four major initiatives: land-based pollution management, marine pollution management, ecological conservation and restoration, and control of environmental risks. As a result, the water quality of the Bohai Sea has shown steady improvement [7]. By 2020, the proportion of excellent water quality (water that meets Grade I or II standards) in the nearshore area of the Bohai Sea reached 82.3%, an increase of 16.9 percentage points compared to 2018. However, in 2021, the Bohai region experienced above-average rainfall during the flood season, with precipitation in the Haihe River Basin averaging 838.5 mm, a 51.8% year-on-year increase [8], while the precipitation along the Shandong Peninsula also experienced a 36.8% increase compared to long-term averages [9]. As a result, land-based pollution due to heavy rainfall during the flood season significantly impacted the water quality of the Bohai nearshore seawaters. The proportion of excellent water quality dropped to 76.8% in 2021, 5.5 percentage points lower than in 2020.
Additionally, the Bohai Sea, being semi-enclosed with an average depth of only 18 m, has limited self-purification capabilities [10]. The water exchange in key areas such as Bohai Bay, Laizhou Bay, and Liaodong Bay is slow, taking anywhere from 2 to 15 years for 50% of the water to be renewed [11]. This further worsens the challenges of pollution dispersion, particularly during the flood season [12,13]. Wu et al. [14] estimated that anthropogenic activities, including terrestrial inputs, maritime transportation, and marine oil exploitation, account for 63.4% of pollution in the Bohai Sea, with atmospheric deposition contributing 28.6% and natural sources only 8.0%. The pollution degrades habitats, threatens biodiversity, and poses public health risks through heavy metal accumulation in seafood.
Previous studies on the Bohai Sea have primarily focused on water quality issues, especially concerning chemical oxygen demand (COD), nutrient pollution, and heavy metals [15,16,17]. Various environmental management policies have reduced nitrogen nutrient and COD fluxes in the past ten years, but they are still among the most severe pollutants [18,19]. Studies also highlight spatial variability, with Bohai Bay experiencing worse pollution than Laizhou and Liaodong Bays, especially during the rainy season [12,14]. Toxic and persistent heavy metals primarily originate from industrial discharges, including manufacturing sectors such as pesticide production, as well as mining and urban transportation. Copper (Cu) and zinc (Zn), while essential nutrients at low concentrations, become toxic at elevated levels, often due to industrial runoff and the use of antifouling paints in maritime activities. Lead (Pb) and mercury (Hg), on the other hand, are typical toxicants primarily associated with fossil fuel combustion and metal processing industries [20,21]. Moreover, water quality index (WQI) has been widely used by regulatory agencies and research organizations to assess estuarine pollution, with efforts made to set regional nutrient criteria and improve the management of inland pollution sources [22,23].
However, studies using comprehensive WQI methods have been relatively few, particularly those linking water quality to urban cities. Additionally, most research has focused on pre-2020 data, and more recent studies are limited owing to data availability delays. Given these circumstances, identifying the primary pollution factors and key polluted areas in the Bohai region, particularly through a scientific and systematic evaluation of summer-season water quality, remains essential for understanding and managing water quality in the nearshore areas of the Bohai Sea.
In this study, we selected a dataset that included 197 monitoring points in the nearshore waters of the Bohai Sea during the summers of 2020 and 2021 using multiple chemical water quality indicators to perform a multivariate statistical analysis. By integrating the results from the principal component analysis (PCA), WQI methods, cluster analysis (CA), and discriminant analysis (DA), the research enhanced the understanding of the true distribution of the environmental pollution and water quality in the nearshore area of the Bohai Sea. The insights can support the development of sustainable management strategies aimed at mitigating pollution, protecting aquatic ecosystems, and promoting long-term ecological and economic resilience in the region.

2. Materials and Methods

2.1. Sampling Area

The sampling area for this study spanned between latitudes 37.1918° N and 40.8399° N and longitudes 117.7021° E and 122.2192° E, covering an area of approximately 78,000 km2 in the Bohai Sea. A total of 197 sampling sites were selected based on the Ministry of Ecology and Environment’s mandatory routine monitoring program. Their precise locations were recorded using the Global Positioning System. The sampling sites were distributed across four administrative regions: Shandong Province (65 sites), Tianjin Municipality (16 sites), Hebei Province (32 sites), and Liaoning Province (84 sites). Because Tianjin is a municipality, it is administered separately from the surrounding provinces, while the remaining 3 provinces consist of 12 cities. The distribution of sampling sites within each province is as follows: Shandong Province: Dongying (30 sites), Yantai (25), Weifang (5), and Binzhou (5); Liaoning Province: Dalian (35 sites), Huludao (21), Yingkou (12), Jinzhou (8) and Panjin (8); Hebei Province: Tangshan (17 sites), Qinhuangdao (10), and Cangzhou (5). Sampling campaigns were conducted in July and August of 2020 and 2021.

2.2. Water Quality Variables and Chemical Analysis

In this study, the dataset was obtained from the mandatory monitoring program of the Ministry of Ecology and Environment for the Bohai Sea. The collection, transportation, and analysis of water samples followed the guidelines outlined in the Technical Specification for Offshore Environmental Monitoring: Part 3—Offshore Seawater Quality Monitoring (HJ 442.3-2020) [24]. For locations with depths of less than 10 m, only surface water samples (0.1–1.0 m) were collected. For depths between 10 and 25 m, both surface and bottom water samples were collected. The water samples were stored in containers made from materials with high chemical stability, such as hard glass or polyethylene plastic, ensuring the integrity of the samples during storage until they were transported to the laboratory and analyzed within 1 week. Water samples were preserved by adding appropriate reagents and stored either by refrigeration or freezing depending on the specific requirements of the analytes. A range of analytical instruments, including continuous flow colorimetry and flow injection analysis, was employed to measure nutrient concentrations, specifically for nitrate and phosphorus anions. In contrast, metals, such as Zn, Pb, and Cu, were analyzed using inductively coupled plasma mass spectrometry. A total of 13 water quality parameters were measured in this study, including total nitrogen (TN), dissolved inorganic nitrogen (DIN), nitrate–nitrogen (NO3-N), total ammonia nitrogen (TAN), unionized ammonia (NH3), soluble reactive phosphorus (SRP/PO43−), COD, total suspended matter (TSM), petroleum, Zn, Cu, Pb, Hg.

2.3. Analysis Method

2.3.1. Principal Component Analysis

The primary objective of PCA is to reduce the dimensionality of multiple variables by combining them into a smaller number of uncorrelated components while retaining as much of the original variability as possible. In this study, PCA was applied to 13 selected water quality indicators, which were normalized through z-scale transformation (standardizing each variable by subtracting its mean and dividing by its standard deviation). This step was necessary to avoid classification errors due to differences in variable scales and units. To improve the interpretability of the principal components (PCs), varimax rotation was employed; this enhances the clarity of the results by maximizing the variance of the squared loadings for each component, thereby making the contribution of each variable to the corresponding component more distinct and easier to interpret. The suitability of the dataset for PCA was evaluated using the Kaiser–Meyer–Olkin (KMO) test and Bartlett’s test of sphericity. A KMO value greater than 0.65 and a significant result (p < 0.05) from Bartlett’s test indicate that the data have sufficient structure for dimensionality reduction. Additionally, components that explained over 60% of the total variance were considered acceptable for further analysis.

2.3.2. Water Quality Index

The WQI is a widely used tool for assessing overall water quality based on multiple parameters [25,26]. It simplifies complex datasets into a single score, which can be used to evaluate and compare water quality across different sites. In this study, the traditional weighted WQI method was not applied, as it relies on preassigned weights for each variable, which might not accurately reflect the contribution of each indicator. Instead, a more data-driven approach was adopted, using PCA to generate an integrated score for WQI calculation. PCA is preferred over other dimensionality reduction methods, such as factor analysis, because it maximizes the variance explained by the components, enabling more objective weighting based solely on data patterns.
Additionally, we utilized the conventional Canadian Council of Ministers of the Environment (CCME) WQI method to obtain two CCME scores, with the distinction being the use of different guideline limitation values.
To compute the PCA-based WQI, a component score coefficient matrix was first generated, representing the contribution (weight) of each original variable to the rotated components. The standardized values of the original variables were then multiplied by their corresponding weights from the matrix. The resulting weighted values for each site were summed to produce a score for each PC. This approach eliminates the need for subjectively preassigned weights and more effectively captures the multi-dimensional nature of water pollution.
Each PC explains a portion of the total variance in the original dataset, with the rotated loadings indicating the importance of each variable in the component, and the percentage of variance reflecting the share of data variability explained by each PC.
For the final WQI_PCA calculation, the score for each site on each PC was multiplied by the corresponding percentage of variance (i.e., the weight) of that component. These weighted scores were then summed across all PCs to produce the overall WQI_PCA score for each site, serving as an integrated measure of the water quality. The equation can be expressed as follows:
P C j = i = 1 n z i × x i j
where P C j is the score on the jth rotated principal component, z i is the standardized value of the ith original variable, and x i j is the weight of the ith original variable on the jth rotated principal component.
W Q I P C A = j = 1 n P C j × W j
where W Q I P C A is the integrated water quality score based on PCA and W j is the percentage of variance (weight) of the j-th PC.
The second WQI method used in this study was developed by the CCME [27]. Widely adopted since 2006 and recommended by the United Nations Environment Programme, it evaluates surface water quality using three key factors [28]. Scope (F1) represents the percentage of parameters that fail to meet the guideline limitation values (“failed parameters”). Frequency (F2) indicates the percentage of individual tests that fail to meet the guideline limitation values (“failed tests”). Amplitude (F3) measures the extent of deviation between failed test values and their corresponding guideline limitation values. These three factors are combined into a composite WQI score, providing an overall water quality assessment. The specific formula and steps for calculating the WQI were well established in the literature and have been consistently applied in water quality studies [28]. In this research, the guideline limitation values were primarily drawn from the Seawater Quality Standard of China (GB 3097-1997) for Grade I and Grade III; water [29]. However, the concentration limits for three indicators, TN, NO3N, and TAN, are not specified in the GB 3097-1997 standard. Therefore, we referred to the relevant literature and standards to estimate the appropriate concentration limits [15,30]. The final selected concentration limits are detailed in Table 1.
Accordingly, the two WQI_CCME scores were labeled WQI_CCME1 and WQI_CCME2, and the calculation method remains the same for both; the difference lies in the guideline value applied.
In summary, three WQIs were generated in this study using different methodologies. The WQI_PCA indicates better water quality with lower scores, while both WQI_CCME scores use a 0–100 scale, with higher values reflecting better water quality. This study focuses on comparing the relative values of these indices rather than interpreting their absolute significance.

2.3.3. Cluster Analysis

To analyze the differences in water quality scores among the 13 nearshore cities in 2020 and 2021, K-means clustering was used to categorize the cities into three quality levels: high, middle, and low. A random seed was set to ensure stability in the clustering results. The K-means algorithm was applied to the two-dimensional dataset based on the WQIs from both years, with the initial cluster centers repeated 25 times to effectively determine the optimal clustering configuration.

2.3.4. Discriminant Analysis

DA is a statistical technique that is used to classify observations into predefined categories based on predictor variables [31,32,33]. In this study, DA was applied to validate and enhance the water quality classifications from CA. Given the limitations of the WQI_PCA method, particularly its reliance on statistical outputs that may overlook individual water quality indicators, DA offers a more precise classification.
The cluster categories of high, middle, and low water quality were used as dependent variables, while the original water quality indicators served as independent variables. This data-driven classification approach provides a more accurate reflection of actual water quality conditions compared to classifications based solely on administrative divisions, such as the four nearshore provinces.

2.3.5. Statistical and Spatial Analysis

Multivariate statistical analyses were performed using SPSS Version 19 (Chicago, IL, USA) and RStudio Version 2023.12.1 (Boston, MA, USA). Spatial interpolations were carried out using ArcGIS 10.0 (ESRI, Redlands, CA, USA), with the base map sourced from OpenStreetMap. Geostatistical analysis of the spatial distribution of water quality parameters was conducted using Empirical Bayesian Kriging interpolation. The K-Bessel model was selected as the semi-variogram, with empirical data transformation applied to improve prediction accuracy.

3. Results and Discussion

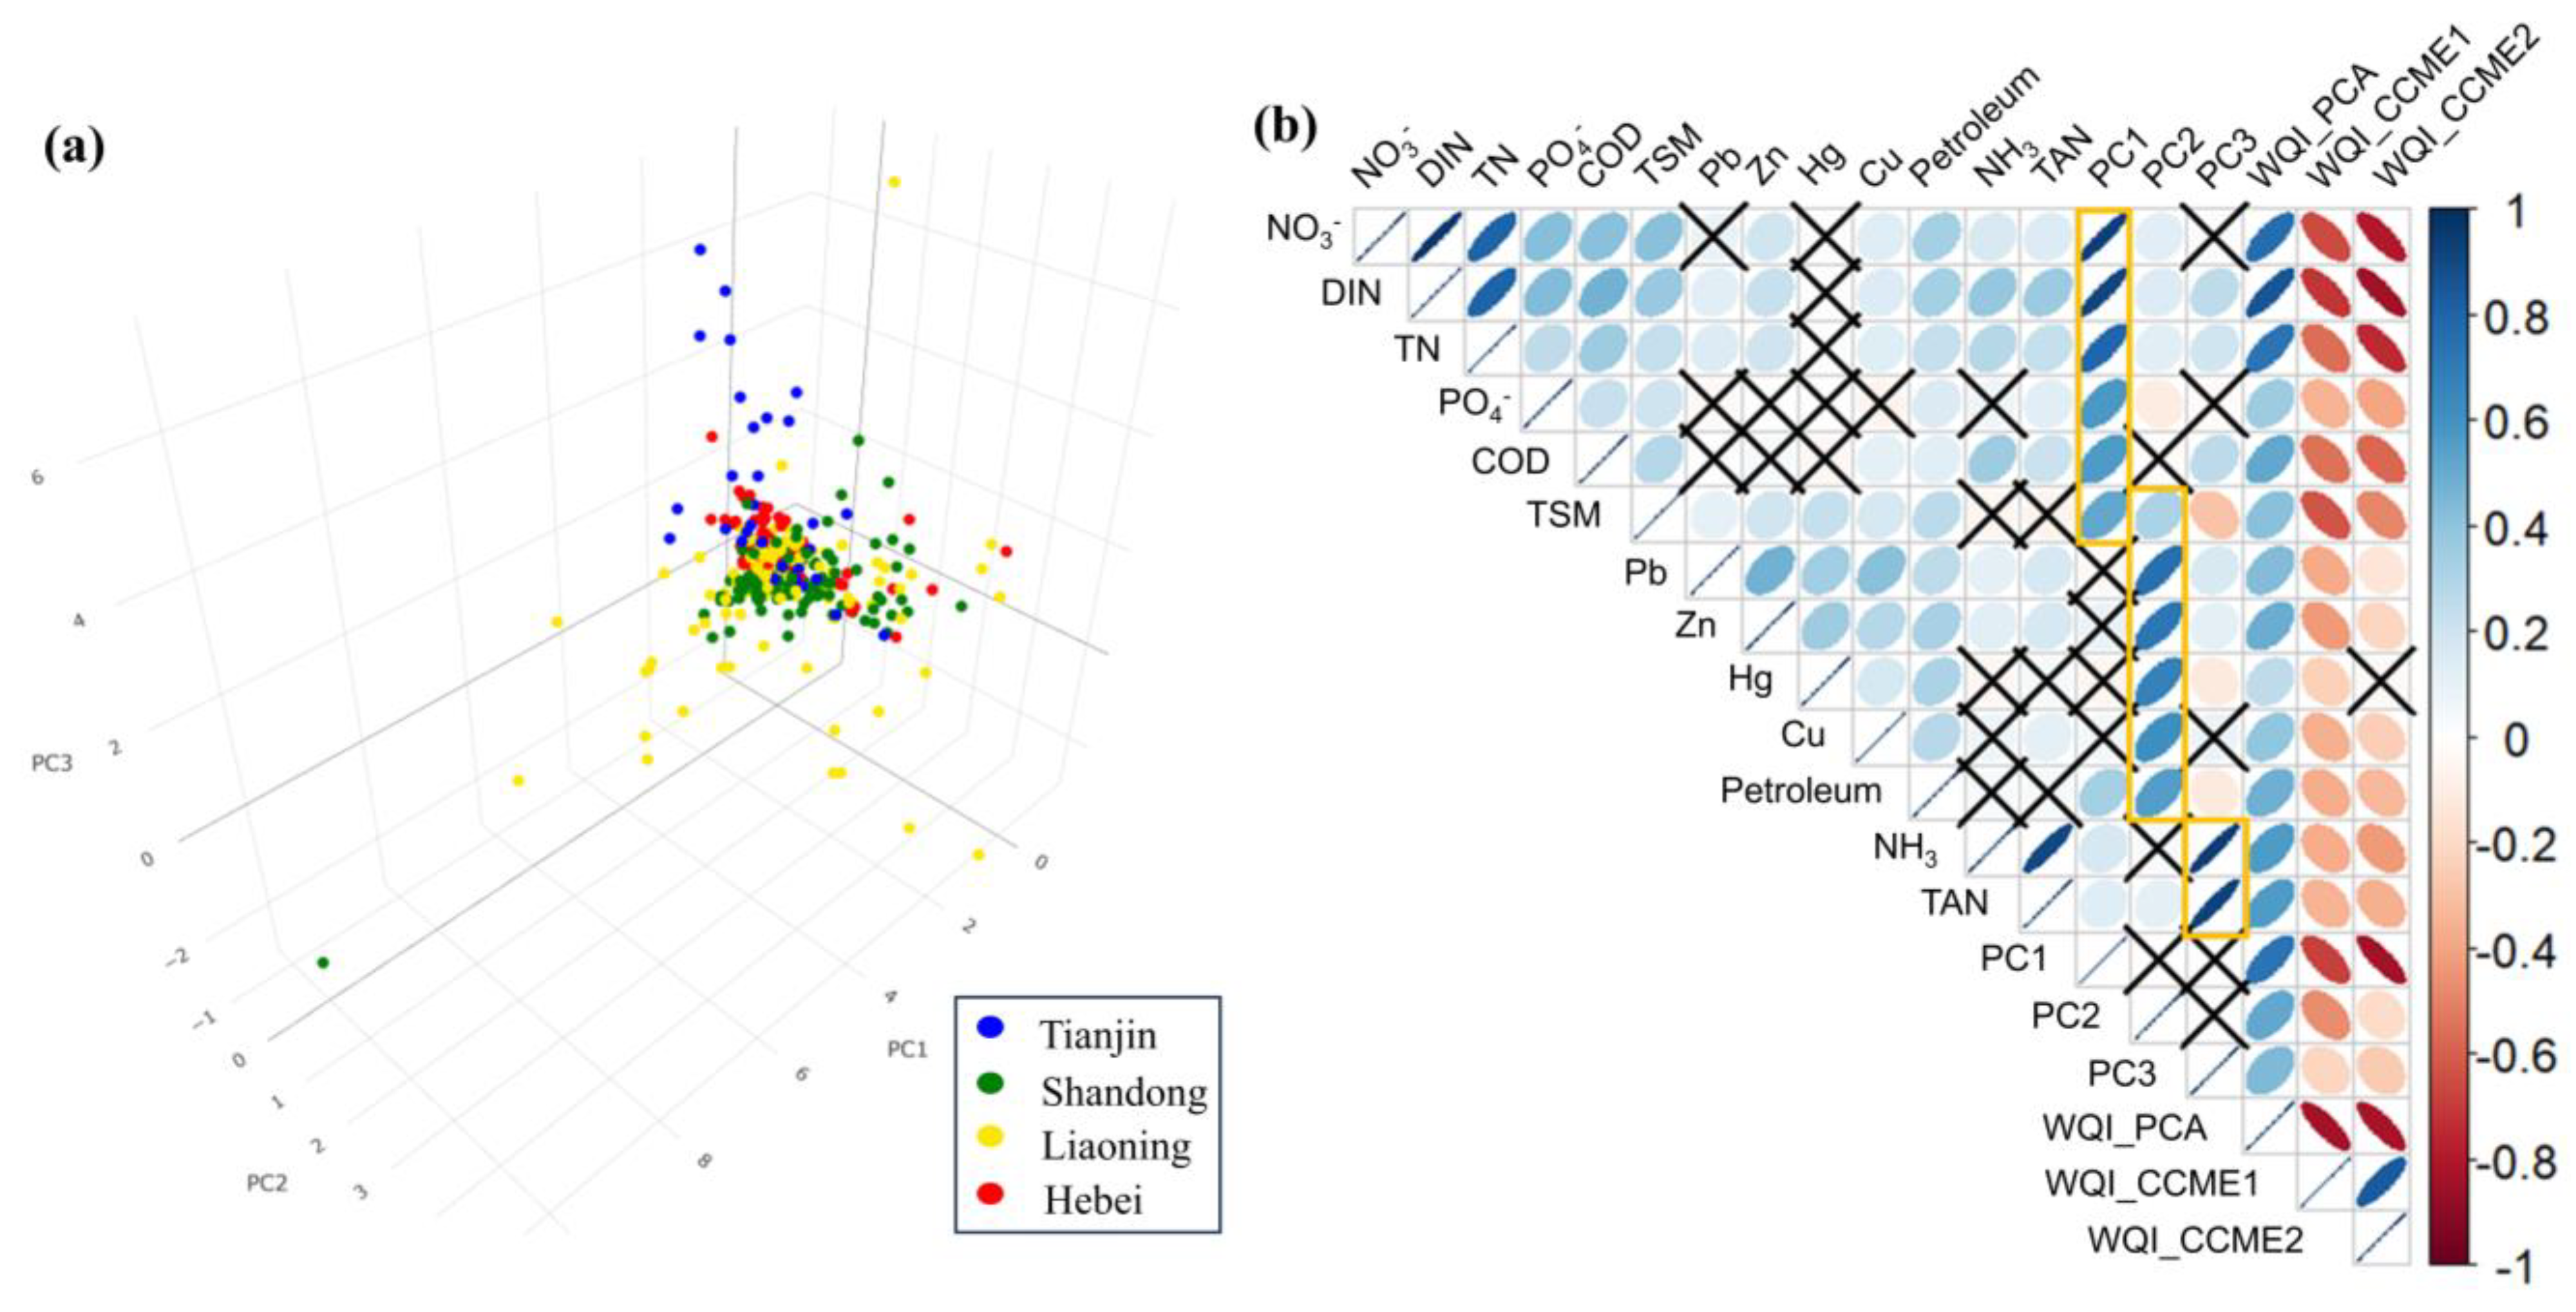
3.1. PCA of Water Quality in the Nearshore Bohai Sea Area

The PCA results identified three key components that explain most of the variance in water quality indicators in the nearshore Bohai Sea area. When the Kaiser normalization method was used, the factor rotation converged after seven iterations, resulting in a KMO value of 0.686, indicating that the data are suitable for further analysis. Bartlett’s test of sphericity was 3815.9 (p < 0.01), which confirms that the correlation matrix is significantly different from an identify matrix. The eigenvalues, variance percentages, and cumulative variance percentages for each PC are summarized in Table 2 (only PCs with eigenvalues >1 were retained). The rotated component matrix, with coefficients below an absolute value of 0.3 excluded, is presented in Table 3.
The PCA transformed the 13 monitoring indicators into three principal components, together explaining 61.02% of the total variance in the dataset. Each component accounts for the variance of different environmental variables. PC1, which explains 26.428% of the total variance, has high loadings on NO3-N (0.939), DIN (0.918), TN (0.792), PO43− (0.575), COD (0.561), and TSM (0.512). The strong associations of PC1 with nitrogenous, phosphorus, and COD suggest that this component primarily reflects eutrophication and organic pollution. The loadings of nitrogen-related indicators (>0.7) indicate that nitrogen plays a dominant role in this component, while the contributions from PO43−, COD, and TSM further underscore the potential interrelationship between eutrophication and physical/organic pollution. Thus, PC1 represents a comprehensive reflection of nutrient loading and pollution. PC2 accounts for 18.602% of the total variance and comprises Pb (0.756), Zn (0.729), Hg (0.671), Cu (0.612), and petroleum (0.558). These loadings suggest that PC2 is strongly associated with heavy metals and petroleum, reflecting industrial pollution in the region. This component highlights the impact of historical industrial wastewater discharge, traffic emissions, and other pollution sources on coastal water quality. PC3 explains 15.99% of the total variance, highlighting nonionic ammonia (NH3) (0.944) and total ammonia nitrogen (TAN, NH3 and NH4+) (0.928). The high loadings for NH3 and TAN indicate that this component is primarily related to ammonia pollution, which is often linked to organic matter decomposition and agricultural runoff. Notably, TAN includes the more toxic nonionic ammonia and the less toxic ammonium ion (NH4+), which could be converted to nonionic ammonia in higher pH environments. In contrast to PC1, which addresses broader nutrient pollution, PC3 focuses specifically on the toxicity of nonionic ammonia and its impact on aquatic organisms.
Figure 1a presents a PCA loading plot with the first three principal components, wherein sampling locations are categorized by province using four distinct colors. Points are slightly concentrated near the origin, indicating that many sampling points share moderate values for the three PCs. However, a few points exhibit extreme values along one or two PCs, reflecting sites that are significantly impacted by specific types of pollution. Liaoning (yellow points) has several points with elevated PC1 and PC2 values, suggesting higher nutrient and heavy metal contamination. Tianjin (blue points) shows points further along PC3, indicating a prevalence of ammonia-related pollution. Hebei (red points) and Shandong (green points) are concentrated near the origin, suggesting moderate pollution levels across all PCs.
Following the methodology outlined in the previous section, three WQIs were calculated. Spearman’s correlations analysis was applied to assess the relationships between water quality variables, PCs, and WQIs (Figure 1b). The color gradient from red to blue indicates the strength and direction of the correlations, with “X” marking insignificant correlations. Both WQI_CCME1 and WQI_CCME2 show strong negative correlations with 13 indicators, while WQI_PCA demonstrates significant positive correlations, indicating the different underlying relationships and methodologies that affect these indices. Figure 2 shows the spatial distribution of the three WQIs in seawater.
Additionally, the WQI_CCME method is based on the Seawater Quality Standard of China (GB 3097-1997) guideline document, which categorizes each water quality indicator into five classes (Grades I–IV and Inferior to Grade IV) based on concentration limits [29]. For the WQI_CCME calculation, we utilized the limitation values from the Grade I and Grade III; categories. However, this guideline can also be applied independently through a univariate assessment method whereby each site is classified according to the most stringent category of any individual indicator.
We created a box plot to compare the WQIs corresponding to this univariate classification across the five categories. The x-axis represents the categories from the univariate assessment, while the y-axis shows the corresponding WQIs for each site. The results reveal a clear gradient: for WQI_PCA, sites classified as Grade I exhibit the lowest WQI_PCA scores, while sites classified as Inferior to Grade IV; have the highest scores. In contrast, for both WQI_CCME indices, Grade I sites have the highest WQI_CCME scores, whereas sites classified as Inferior to Grade IV; have the lowest scores (Figure 3). These findings indicate a strong consistency and correlation between the WQI and the univariate assessment method.

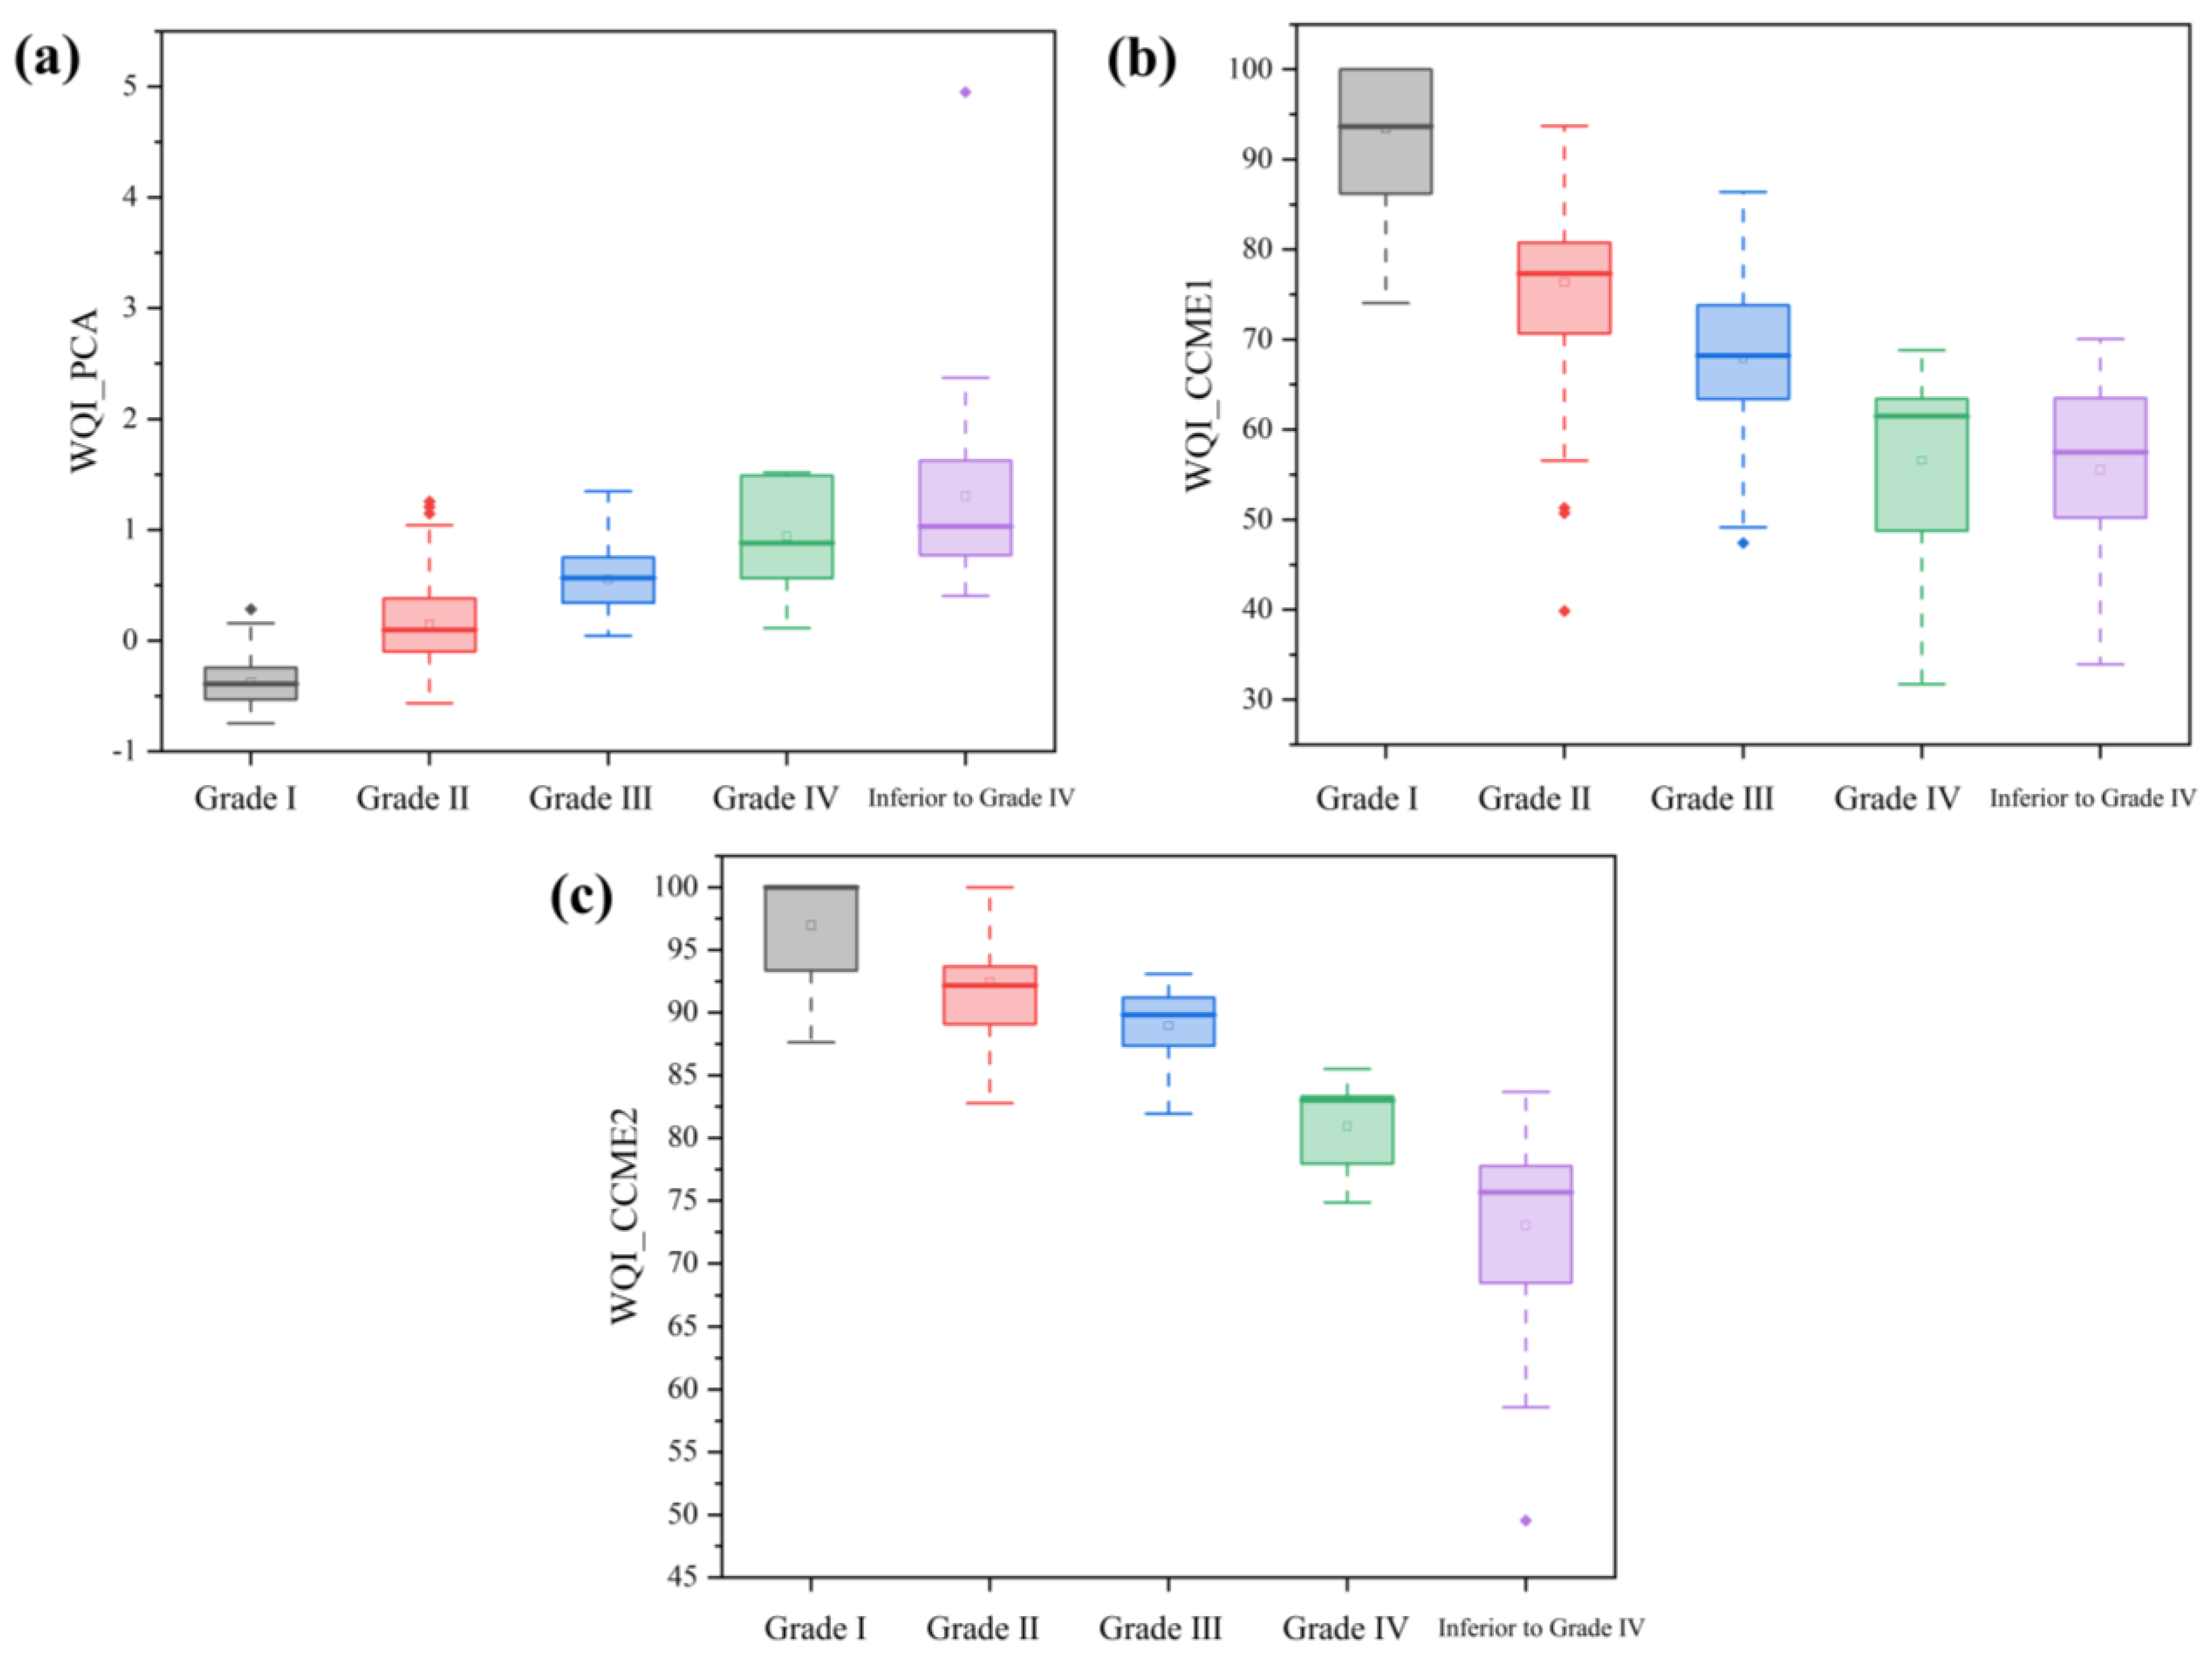
3.2. Cluster Analysis Results of the Three WQI Methods

Figure 1a shows the PCA loading plot for the four provinces. To more accurately represent their spatial distribution, we further categorized the provinces into 13 cities and calculated the average WQIs for each city’s sampling points. Figure 3 displays the WQI scores for 2020 and 2021 across three methods, with cities grouped into three categories based on clustering results: high (green), medium (yellow), and low (red) water quality.
From Figure 4a–c, it was evident that despite the differences in WQI algorithms, the classification trends are similar. Cities such as Dalian, Yantai, and Huludao are classified as having good water quality, while Dongying and Cangzhou fall into the moderate category. In contrast, Panjin and Tianjin are repeatedly categorized in the same group for their poorer water quality. Additionally, among the three cities of Hebei province, water quality in the Qinhuagndao area was better than in the Tangshan and Cangzhou areas, aligning with the results of a study by Liu et al. (based on data from 2006), despite the long-time gap [13]. Overall, the water quality conditions across all cities show minimal fluctuations between the two years.
Figure 4d–f show the CA based on the three PCs from the WQI_PCA method. Panjin continues to exhibit poor water quality in PC1 scores. Notably, Cangzhou is distinguished as a separate category in PC2, indicating that its heavy metal pollution worsened significantly in 2021 compared to 2020. PC3 offers interesting insights regarding ammonia nitrogen and nonionic ammonia. Surprisingly, despite its overall poor WQI, Panjin has the lowest PC3 score among the 13 cities. Given that ammonia nitrogen typically stems from agricultural fertilizers and livestock manure, this suggests that Panjin may have effective management of agricultural non-point source pollution or that its wastewater treatment facilities efficiently reduce nitrogen levels. Moreover, Panjin’s marine ecosystem may have a high self-purification capacity, potentially owing to active algae or microbial activity converting ammonia nitrogen into other nitrogen forms. In contrast, the serious pollution of other chemical indicators in Panjin may be more closely related to industrial discharge or maritime transportation. This observation aligns with Panjin’s role as a major industrial base in the Bohai Sea area. The city’s history of metallurgical mining and offshore oil drilling in the Liaohe Oil Field likely continues to affect the background concentrations of metals.

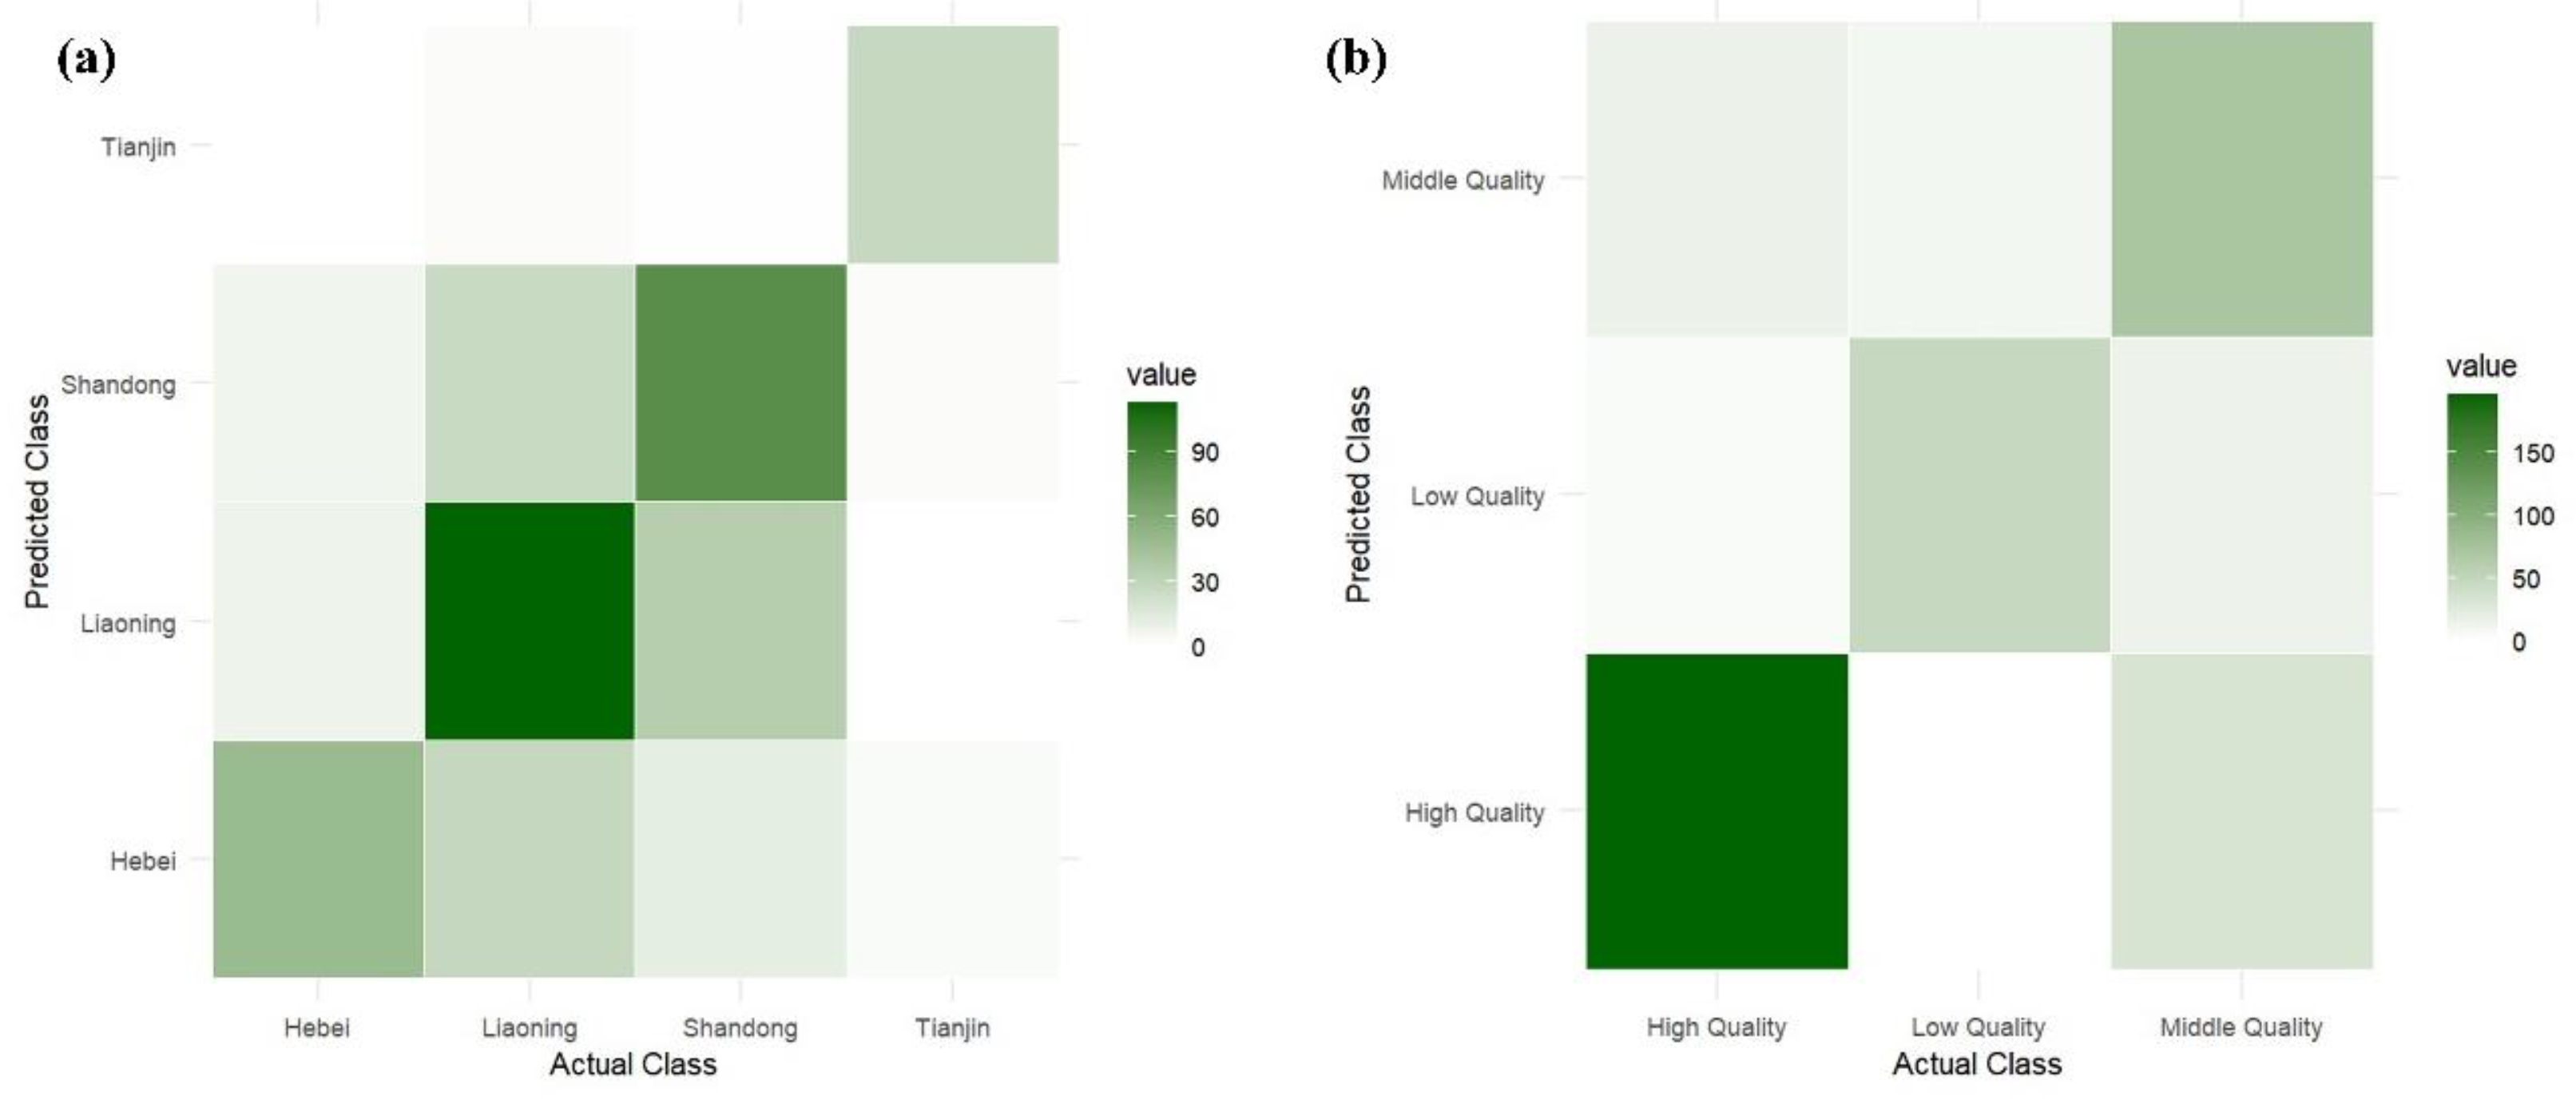
3.3. Discriminant Analysis for Validation of WQI_PCA Classification

To further validate the effectiveness of the WQI_PCA-based classification, DA was applied to compare its results to the traditional classification based on administrative regions (Table 4 and Table 5). The confusion matrix for the WQI_PCA method yielded a cross-validated accuracy of 79.9%, which is significantly higher than the 68.4% accuracy achieved using the administrative region classification. This demonstrates that the method of grouping cities based on the WQI_PCA sites more accurately reflects the actual environmental conditions than the arbitrary boundaries of administrative regions (Figure 5). The findings highlight the robustness of the WQI_PCA approach in capturing water quality differences, reinforcing its suitability for classifying cities into distinct water quality categories.

3.4. Nonlinear Regression Analysis of GDP and WQI Using the Environmental Kuznets Curve (EKC) Model

The EKC typically suggests a nonlinear relationship between environmental degradation and economic growth, represented by either an inverted U- or N-shape. The inverted U-shape indicates that environmental quality worsens with increasing per capita GDP at early stages of economic development but improves after reaching a certain threshold. In contrast, the N-shape suggests that environmental quality may initially deteriorate with economic growth, improve when there are moderate levels of economic development, and then worsen again at higher levels of economic output [34,35]. The EKC is usually expressed as follows:
W Q I = β 0 + β 1 l n ( G D P ) + β 2 ( l n ( G D P ) ) 2 + β 3 l n G D P 3 + ϵ
However, in this study, when WQI_PCA was used as the dependent variable, polynomial models based on per capita GDP—both quadratic and cubic—failed to provide significant or well-fitting results. In contrast, when total GDP was introduced as an independent variable in a cubic polynomial model, a significant and complex N-shaped relationship between total GDP and WQI_PCA was observed (as shown in Table 6, * indicate statistical significance at p < 0.01). This suggests that in the context of this study area, total economic activity, rather than per capita measures, more accurately captures the pressures on water quality.
Further analysis revealed that total economic activity has a significant positive linear relationship with the annual TAN discharge and COD discharge into the surface water system (Figure 6), while no relationship could be established between per capita GDP and these two dependent variables. This finding reinforces the notion that reliance solely on per capita GDP for modeling water quality changes may be misguided.
Consequently, the results imply that within the specific economic and environmental contexts of the Bohai Sea, a general EKC relationship may not exist. Environmental pressures are more likely tied to the scale and nature of overall economic activity. This phenomenon reflects the significant impact of heavy industrial and agricultural activities on water quality in coastal regions, indicating that policymakers should focus on total economic output rather than merely on per-capita indicators in environmental management. Furthermore, the observed N-shaped model suggests the need for adaptive policy measures, such as stricter environmental monitoring and targeted pollution control efforts in economically booming areas [36].

3.5. Management Implications

Targeted pollution control: Through PCA, WQI, and CA, it becomes evident that different cities face distinct pollution challenges, such as industrial emissions, agricultural runoff, or heavy metal contamination. This suggests that water quality management efforts should focus on tailored interventions that target the predominant pollution sources in each region. For example, while Panjin exhibits poor overall water quality, its low ammonia nitrogen levels suggest effective nitrogen management, but further efforts should address industrial pollution. Customized pollution control strategies based on local sources can significantly enhance the effectiveness of environmental policies.
Regional and city-level management: Grouping cities into clusters based on WQI rather than administrative divisions provides a more accurate framework for sustainable regional water management. This supports the idea that environmental policies should consider city-level differences rather than applying “one-size-fits-all” regulations across provinces. Cross-regional collaboration and the sharing of best practices will help optimize resource allocation and improve water quality management in areas with lower performance.
Long-term monitoring and policy adaptation: The study’s comparison of water quality data from 2020 and 2021 demonstrates the need for continuous, long-term monitoring to capture temporal trends and fluctuations. Such data enable policymakers to detect emerging pollution patterns and adjust management strategies accordingly. For instance, the increased heavy metal pollution in Cangzhou in 2021 highlights the importance of dynamic policy adjustments in response to the change in environmental conditions. Additionally, future management considerations should include factors such as runoff volume and total pollution load.

4. Conclusions

The PCA results revealed that eutrophication and organic pollution are possibly the dominant factors affecting water quality in the nearshore areas of the Bohai Sea, followed by metal ions and ammonia nitrogen. The reliability of the PCA-based WQI was validated, showing consistency with both the traditional CCME WQI method and the univariate assessment method. Furthermore, the WQI was applied to the CA of water quality by city, and its validity was supported by DA. Additionally, the study explored the influence of economic activity on WQI values, offering insights into the relationship between regional development and sustainable water quality management.
The spatial distribution of pollutants highlights the complexity of water pollution, indicating the need for targeted management strategies. Eutrophication control should focus on reducing nitrogen and phosphorus emissions from agricultural runoff and domestic wastewater, while heavy metal pollution, primarily from industrial sources, requires stricter management of industrial discharge. Ammonia pollution control should prioritize improvements in wastewater treatment and reductions in emissions from livestock farming. Specifically, strengthening industrial pollution controls in Panjin and improving agricultural and domestic waste management in Tianjin are key recommendations.
However, this study also has limitations, including the lack of consideration for the effects of runoff; flux variations; and specific phenomena, such as submarine groundwater discharge, which may influence the presence of pollutants. Further research should address these factors to provide a more comprehensive understanding of water quality dynamics and inform sustainable management practices for the Bohai Sea.

Author Contributions

Conceptualization, W.G.; methodology, W.G. and P.Z.; software, W.G. and P.Z.; data curation, H.W.; writing—original draft preparation, W.G.; writing—review and editing, H.W. and C.A.; supervision, H.W. and C.A.; funding acquisition, H.W. All authors have read and agreed to the published version of the manuscript.

Funding

This research was funded by the Scientific Research and Development Fund of Administration of Ecology and Environment of Haihe River Basin and Beihai Sea Area (2024-HHBHJ-3).

Institutional Review Board Statement

Not applicable.

Informed Consent Statement

Not applicable.

Data Availability Statement

All data reported here can be made available on request.

Acknowledgments

The support provided by the China Scholarship Council during a visit by Wei Gao to Concordia University is acknowledged.

Conflicts of Interest

The authors declare no conflicts of interest.

References

  1. Meng, W.; Hu, B.; He, M.; Liu, B.; Mo, X.; Li, H.; Wang, Z.; Zhang, Y. Temporal-spatial variations and driving factors analysis of coastal reclamation in China. Estuar. Coast. Shelf Sci. 2017, 191, 39–49. [Google Scholar] [CrossRef]
  2. Gao, X.; Chen, C.T. Heavy metal pollution status in surface sediments of the coastal Bohai Bay. Water Res. 2012, 46, 1901–1911. [Google Scholar] [CrossRef]
  3. Wang, Y.; Li, K.; Li, Y.; Lu, S.; Wang, B.; Wang, X. Assessing the total maximum allocated load of jurisdiction petroleum pollutants in the Bohai Sea. Ocean Coast. Manag. 2018, 151, 150–164. [Google Scholar] [CrossRef]
  4. Zhou, D.; Yu, M.; Yu, J.; Li, Y.; Guan, B.; Wang, X.; Wang, Z.; Lv, Z.; Qu, F.; Yang, J. Impacts of inland pollution input on coastal water quality of the Bohai Sea. Sci. Total Environ. 2021, 765, 142691. [Google Scholar] [CrossRef]
  5. Yu, J.; Zhou, D.; Yu, M.; Yang, J.; Li, Y.; Guan, B.; Wang, X.; Zhan, C.; Wang, Z.; Qu, F. Environmental threats induced heavy ecological burdens on the coastal zone of the Bohai Sea, China. Sci. Total Environ. 2021, 765, 142694. [Google Scholar] [CrossRef] [PubMed]
  6. Ministry of Ecology and Environment, PRC. Action Plan for the Uphill Battles for Integrated Bohai SEA Management. Available online: https://english.mee.gov.cn/News_service/news_release/201812/t20181224_685801.shtml (accessed on 1 October 2024).
  7. Chen, Y.; Ma, Y.; Wang, Y.; Sun, Z.; Han, Y. Impact of China’s marine governance policies on the marine ecological environment—A case study of the Bohai rim. Ocean Coast. Manag. 2023, 246, 106913. [Google Scholar] [CrossRef]
  8. Haihe River Water Conservancy Commission. Haihe River Water Resources Bulletin (Year 2021). Available online: http://www.hwcc.gov.cn/hwcc/static/szygb/gongbao2021/index.html (accessed on 1 October 2024).
  9. Water Resources Department of Shandong Province. Shandong Province Water Resources Bulletin (Year 2022). Available online: http://wr.shandong.gov.cn/zwgk_319/fdzdgknr/tjsj/szygb/202208/P020220905624327687827.pdf (accessed on 1 October 2024).
  10. Chen, Y.; Zhai, F.; Gu, Y.; Cao, J.; Liu, C.; Liu, X.; Liu, Z.; Li, P. Seasonal variability in dissolved oxygen in the Bohai Sea, China. J. Oceanol. Limnol. 2021, 40, 78–92. [Google Scholar] [CrossRef]
  11. Liang, W.; Wang, Y.; Mu, J.; Wu, N.; Wang, J.; Liu, S. Nutrient changes in the Bohai Sea over the past two decades. Sci. Total Environ. 2023, 903, 166696. [Google Scholar] [CrossRef] [PubMed]
  12. Gao, X.; Zhou, F.; Chen, C.T. Pollution status of the Bohai Sea: An overview of the environmental quality assessment related trace metals. Environ. Int. 2014, 62, 12–30. [Google Scholar] [CrossRef] [PubMed]
  13. Liu, S.; Lou, S.; Kuang, C.; Huang, W.; Chen, W.; Zhang, J.; Zhong, G. Water quality assessment by pollution-index method in the coastal waters of Hebei Province in western Bohai Sea, China. Mar. Pollut. Bull. 2011, 62, 2220–2229. [Google Scholar] [CrossRef]
  14. Wu, G.; Li, J.; Luo, W. Spatial distribution, source apportionment, and assessment of marine water quality parameters in the Bohai Sea, China. Mar. Pollut. Bull. 2023, 195, 115526. [Google Scholar] [CrossRef] [PubMed]
  15. Xie, L.; Xu, H.; Xin, M.; Wang, B.; Tu, J.; Wei, Q.; Sun, X. Regime shifts in trophic status and regional nutrient criteria for the Bohai Bay, China. Mar. Pollut. Bull. 2021, 170, 112674. [Google Scholar] [CrossRef] [PubMed]
  16. Yang, Y.; Liang, S.; Li, K.; Li, Y.; Li, J.; Wang, X. Integrated water-quality management indicators from river to sea: A case study of the Bohai Sea, China. Mar. Pollut. Bull. 2022, 185, 114320. [Google Scholar] [CrossRef]
  17. Dong, Z.; Kuang, C.; Gu, J.; Zou, Q.; Zhang, J.; Liu, H.; Zhu, L. Total maximum allocated load of chemical oxygen demand near Qinhuangdao in Bohai Sea: Model and Field Observations. Water 2020, 12, 1141. [Google Scholar] [CrossRef]
  18. Li, Z.; Tian, C.; Sheng, Y. Fluxes of chemical oxygen demand and nutrients in coastal rivers and their influence on water quality evolution in the Bohai Sea. Reg. Stud. Mar. Sci. 2022, 52, 102322. [Google Scholar] [CrossRef]
  19. Wang, Y.; Shi, J.; Tian, X.; Peng, H.; Li, X.; Song, D.; Mao, X.; Lv, X. Study on load allocation of land-based total nitrogen in the Bohai Sea. Sci. Total. Environ. 2024, 923, 171470. [Google Scholar] [CrossRef]
  20. Wang, Z.; Luo, P.; Zha, X.; Xu, C.; Kang, S.; Zhou, M.; Nover, D.; Wang, Y. Overview assessment of risk evaluation and treatment technologies for heavy metal pollution of water and soil. J. Clean. Prod. 2022, 379, 134043. [Google Scholar] [CrossRef]
  21. Ubuoh, E.A.; Nwogu, F.U.; Ofoegbu, C.C.; Chikezie, P.C. Environmental pollution loads on surface water chemistry and potentially ecological risks of inland aquatic ecosystem in South-Eastern State, Nigeria. Environ. Syst. Res. 2023, 12, 22. [Google Scholar] [CrossRef]
  22. Wu, G.; Ye, D.; Luo, W. Water quality analysis and source apportionment in estuaries along the coast of the Bohai Sea, North China. J. Oceanol. Limnol. 2024, 1–17. [Google Scholar] [CrossRef]
  23. Arıman, S.; Soydan-Oksal, N.G.; Beden, N.; Ahmadzai, H. Assessment of groundwater quality through hydrochemistry using principal components analysis (PCA) and water quality index (WQI) in Kızılırmak delta, Turkey. Water 2024, 16, 1570. [Google Scholar] [CrossRef]
  24. Ministry of Ecology and Environment, PRC. Technical Specification for Offshore Environmental Monitoring: Part 3—Offshore Seawater Quality Monitoring; Ministry of Ecology and Environment: Beijing, China, 2020. [Google Scholar]
  25. Ma, Z.; Li, H.; Ye, Z.; Wen, J.; Hu, Y.; Liu, Y. Application of modified water quality index (WQI) in the assessment of coastal water quality in main aquaculture areas of Dalian, China. Mar. Pollut. Bull. 2020, 157, 111285. [Google Scholar] [CrossRef] [PubMed]
  26. Uddin, M.G.; Nash, S.; Olbert, A.I. A review of water quality index models and their use for assessing surface water quality. Ecol. Indic. 2021, 122, 107218. [Google Scholar] [CrossRef]
  27. Canadian Council of Ministers of the Environment. Guidance Manual for Optimizing Water Quality Monitoring Program Design. Available online: https://ccme.ca/en/res/guidancemanualforoptimizingwaterqualitymonitoringprogramdesign_1.0_e.pdf (accessed on 1 October 2024).
  28. Canadian Council of Ministers of the Environment. Canadian Water Quality Guideline for the Protection of Aquatic Life. Available online: https://ccme.ca/en/res/wqimanualen.pdf (accessed on 1 October 2024).
  29. Ministry of Ecology and Environment, PRC. Seawater Quality Standard of China (GB 3097-1997). Available online: https://english.mee.gov.cn/Resources/standards/water_environment/quality_standard/200710/W020061027511546974673.pdf (accessed on 1 October 2024).
  30. Ministry of Ecology and Environment, PRC. Environmental Quality Standard for Surface Water (GB 3838-2002). Available online: https://english.mee.gov.cn/standards_reports/standards/water_environment/quality_standard/200710/t20071024_111792.htm (accessed on 1 October 2024).
  31. Hajigholizadeh, M.; Melesse, A.M. Assortment and spatiotemporal analysis of surface water quality using cluster and discriminant analyses. Catena 2017, 151, 247–258. [Google Scholar] [CrossRef]
  32. Singh, K.P.; Malik, A.; Mohan, D.; Sinha, S. Multivariate statistical techniques for the evaluation of spatial and temporal variations in water quality of Gomti River (India)—A case study. Water Res. 2004, 38, 3980–3992. [Google Scholar] [CrossRef] [PubMed]
  33. Mammeri, A.; Tiri, A.; Belkhiri, L.; Salhi, H.; Brella, D.; Lakouas, E.; Tahraoui, H.; Amrane, A.; Mouni, L. Assessment of surface water quality using water quality index and discriminant analysis method. Water 2023, 15, 680. [Google Scholar] [CrossRef]
  34. Wang, B.; Liu, L.; Huang, G. Retrospective and prospective analysis of water use and point source pollution from an economic perspective-a case study of Urumqi, China. Environ. Sci. Pollut. Res. 2017, 24, 26016–26028. [Google Scholar] [CrossRef] [PubMed]
  35. Wang, Z.; Bu, C.; Li, H.; Wei, W. Seawater environmental Kuznets curve: Evidence from seawater quality in China’s coastal waters. J. Clean. Prod. 2019, 219, 925–935. [Google Scholar] [CrossRef]
  36. Lyu, L.; Bagchi, M.; Markoglou, N.; An, C.; Peng, H.; Bi, H.; Yang, X.; Sun, H. Towards environmentally sustainable management: A review on the generation, degradation, and recycling of polypropylene face mask waste. J. Hazard. Mater. 2024, 461, 132566. [Google Scholar] [CrossRef] [PubMed]
Figure 1. (a) Loading plot of the first three components and (b) Spearman correlations between the 13 water quality indicators, the 3 PCs, and 3 WQIs.
Sustainability 16 11187 g001
Figure 2. Spatial distribution of WQI in seawater: (a) WQI_PCA in 2020, (b) WQI_PCA in 2021, (c) WQI_CCME1 in 2020, (d) WQI_CCME1 in 2021, (e) WQI_CCME2 in 2020, (f) WQI_CCME2 in 2021.
Sustainability 16 11187 g002
Figure 3. Box plot comparing (a) WQI_PCA, (b) WQI_CCME1, and (c) WQI_CCME2 across five water quality classes based on the univariate assessment method.
Sustainability 16 11187 g003
Figure 4. Cluster analysis of (a) WQI_PCA, (b) WQI_CCME1, (c) WQI_CCME2, (d) PC1 score, (e) PC2 score, and (f) PC3 score.
Sustainability 16 11187 g004
Figure 5. Comparison of confusion matrices for water quality classification: (a) by administrative regions and (b) by WQI_PCA categories.
Sustainability 16 11187 g005
Figure 6. The relationship between ln total GDP and annual TAN discharge/COD discharge.
Sustainability 16 11187 g006
Table 1. Water quality guidelines for key chemical indicators in seawater based on Grade I and Grade III limitations (GB 3097-1997).
VariablesGrade I LimitationGrade III Limitation
Unit (mg/L)
COD24
PO43−0.0150.03
NO3-N0.20.4
TN0.20.2
DIN0.20.4
TSM10100
Petroleum0.050.3
Pb0.0010.01
Zn0.020.1
Cu0.0050.01
Hg0.000050.0002
NH30.020.02
TAN0.20.4
Table 2. Rotation sums of squared loadings from PCA.
ComponentTotal% of VarianceCumulative %
PC13.43626.42826.428
PC22.41818.60245.030
PC32.07915.98961.020
Table 3. Rotated component matrix from PCA (rotation converged in 5 iterations).
IndicatorPC1PC2PC3
NO3-N0.939
DIN0.918
TN0.792
PO40.575
COD0.561
TSM0.5120.316
Pb 0.756
Zn 0.729
Hg 0.671
Cu 0.612
Petroleum0.3360.558
NH3 0.944
TAN 0.928
Table 4. Confusion matrix for water quality classification based on WQI_PCA.
Actual/PredictedHigh QualityLow QualityMiddle Quality
High Quality195516
Low Quality04810
Middle Quality331571
Table 5. Confusion matrix for water quality classification based on administrative regions.
Actual/PredictedHebeiLiaoningShandongTianjin
Hebei49870
Liaoning28112262
Shandong1235811
Tianjin30227
Table 6. Regression coefficients for different WQI-GDP models.
PredictorGDP/per CapitaTotal GDP
2nd-Order3rd-Order2nd-Order3rd-Order
Intercept (β0)−80.794−694.5611.118−253.957 **
Linear (β1)14.408179.938−0.16194.928 **
Quadratic (β2)−0.640−15.5060.005−11.727 **
Cubic (β3)NA0.445NA0.479 **
R20.1100.1200.0330.596
Statistical significance is indicated by p-values, with ** denoting p < 0.01.
Disclaimer/Publisher’s Note: The statements, opinions and data contained in all publications are solely those of the individual author(s) and contributor(s) and not of MDPI and/or the editor(s). MDPI and/or the editor(s) disclaim responsibility for any injury to people or property resulting from any ideas, methods, instructions or products referred to in the content.

