Article

Determining Cost and Causes of Overruns in Infrastructure Projects in South Asia

1
Department of Civil Engineering, Design School, Xi’an Jiaotong-Liverpool University, Suzhou 215123, China
2
Department of Financial and Actuarial Mathematics, School of Mathematics and Physics, Xi’an Jiaotong-Liverpool University, Suzhou 215123, China
*
Author to whom correspondence should be addressed.
Sustainability 2024, 16(24), 11159; https://doi.org/10.3390/su162411159
Submission received: 7 November 2024 / Revised: 16 December 2024 / Accepted: 18 December 2024 / Published: 19 December 2024
(This article belongs to the Section Economic and Business Aspects of Sustainability)

Abstract

:
Sustainable development is supported by infrastructure projects that have a long-term impact on economic development, societies, and the environment. In this paper, the aim is to estimate the cost performance, investigate the best-fit function for modeling the correlations between cost overruns and three variables, and identify the root causes of overruns in South Asian infrastructure projects. In the past, linear regression analysis has been utilized to model the correlations between cost overruns and project size, implementation period, and time overruns. Modeling these correlations requires the study and application of other regression functions. A database of 138 infrastructure projects from the South Asian region is established from the collected data. A methodology based on mixed methods for qualitative and quantitative data analysis is developed to achieve the aims of the paper. A mixed method encompasses a probabilistic and statistical approach alongside machine learning as quantitative methods and employs content analysis facilitated by NVivo v. 11 software as a qualitative method. Based on the results, the average cost overrun in infrastructure projects in South Asia is 3.3%. The random forest regression function, a machine learning technique, is tested as the most suitable function for modeling the impact between cost overruns and other variables compared to the linear and quadratic regression functions. The practical application is to support project stakeholders in the process of cost estimation during the decision-making phase of the project, to predict overruns in future infrastructure projects using machine learning techniques such as random forest regression, and to contribute to overall sustainable development.

1. Introduction

Fast-developing societies have a constant demand for large-scale and complex infrastructure projects. Infrastructure projects are key drivers for sustainable development due to their long-term impact on economic growth, societies, and the environment [1]. Critical services including water, transport of people and goods, telecommunication, energy, and waste management are some of the benefits of infrastructures for communities [2,3]. Without them, society would not function. Studies show that infrastructures have major impacts on long-term environmental, economic, and social goals [2,3]. Overall, infrastructure directly or indirectly contributes to achieving 72% of the targets of all the Sustainable Development Goals [2,3].
Due to the lengthy duration of projects and capital investments, large-scale infrastructure is exposed to uncertainty. Uncertainties may lead to risks that can result in delays in project completion and over-budgeting. Overruns are a worldwide phenomenon that occur in different countries and periods [4,5,6]. The term “cost overruns” refers to the percentage by which a project exceeds the initial budget. Various countries have experienced cost overruns in infrastructure projects over a longer period, and there is ample evidence to support this. For example, highway and railway projects in the USA have coped with cost overruns [7,8,9]; transport projects in the Netherlands [10]; railway projects in Australia [11,12,13]; highway and roadway projects in Germany [14,15]; Italian transport projects [16,17]; transport projects in Belgium [18]; transmission lines in Vietnam [19]; road projects in Ghana [20]; transport projects in Nigeria [21]; large-scale hydropower projects in Brazil [22]; viaduct projects in Croatia [23]; etc.
From the literature review, it can be concluded that attention is paid to the cost performance and overruns in infrastructure in the European countries [6,24], the USA [7,8], Australia [11,12], and others. The number of studies on cost overruns in developing countries is insufficient. Since the geographical location of the project influences overruns [4,24], hence the size of cost overruns in European infrastructure projects cannot be valid for projects in the Asian regions [25]. Secondly, the previous research has addressed the dependency of cost overruns on four variables: project type, geographical location, project size, and the length of different project phases (preconstruction and construction). A probabilistic and statistical approach is demonstrated as an efficient tool for defining and estimating the influence of four variables on cost overruns. Linear regression analysis has yielded the results needed to model the correlation between cost overruns, project size, and the length of different project phases.
South Asia is a region with a high population density, consisting of seven countries with a total population of over 1.91 billion by the end of 2023 [26]. India, the most populous nation in the world and situated in South Asia, plays a significant role in the development of South Asia. The Indian construction industry has reported that cost overruns and schedule delays are the key issues for major and mega infrastructure projects that affect project stakeholders, developers, contractors, and end-users for facilities in India [27,28]. The cost performance analysis and overruns of infrastructure projects are significant factors in future infrastructure projects in South Asia. As a result of the fast social and economic development of the region, there is a high demand for transport and energy infrastructure projects, railways, highways, bridges, tunnels, pipelines, gas lines, and others. Many studies have shown the importance of infrastructure development, especially transport infrastructure on sustainable development, regarding the economic pillar including economic growth and opportunities, and social pillar including health welfare, job opportunities, and education [29,30]. From this point of view, the study addresses cost overruns in infrastructure projects, and the preparation and estimation of future endeavors might profit substantially from the lessons gained from prior projects.
To address the above declared, this paper contributes to studies on cost overruns in infrastructure projects as follows: (1) it analyses the characteristics of cost performance and causes of overruns in infrastructure projects in South Asia; (2) it determines the correlation between cost overruns and project size, implementation period, and time overruns; and (3) it examines the different regression functions such as linear regression, quadratic regression, and random forest regression functions to select the most suitable for modeling the correlation between cost overruns and project size, implementation period and time overruns. A dataset of 138 infrastructure projects in South Asia has been collected and a methodology for data analysis has been proposed. A mixed method including a probabilistic and statistical approach [31], machine learning [32] as quantitative methods and a content analysis approach as a qualitative method are combined to carry out data analysis. Quantitative methods are used to estimate cost performances and to investigate different regression functions for modeling the correlation between cost overruns over project size, implementation period, and time overruns. The root causes of cost overruns in South Asian infrastructure projects are identified through a content analysis approach using NVivo software [33]. As a result, the quadratic regression and random forest regression function can be applied to model the correlation between cost overruns and other variables instead of the traditional linear regression function. This is the main contribution to this study. This study’s theoretical contribution involves proposing a random forest regression function for modeling as it is the best-fit function based on the Fisher test (F-test). The practical application is to support project stakeholders in the process of cost estimation during the decision-making phase of the project, to predict overruns in future infrastructure projects using machine learning techniques such as random forest regression, and to contribute to overall sustainable development.
The outline of this paper is as follows: Section 2 outlines the current trends in cost overruns in infrastructure projects. Section 3 describes the methodology for data collection and the different regression models for modeling the relationship between cost overruns and three variables and the findings are provided in Section 4. The causes of overruns in mega infrastructure projects are investigated and described in Section 5. A brief discussion of the results and the comparative study is shown in Section 6. Finally, Section 7 summarizes the conclusion of this study and the steps toward future research.

2. Literature Review

2.1. The Current Research Trends in Cost Overruns of Infrastructure Projects

The current trend in cost overruns from different regions is summarized in Table 1. The collected reference data, as shown in Table 1, consist of authors, the sample size, the region or country of the projects, project types, and the mean cost overruns. From a review in Table 1, it can be concluded that many researchers have investigated cost overruns in infrastructure projects located in developed countries, such as European countries (Portugal, Sweden, Slovenia, Netherlands, Norway, Belgium, Germany, Italy, the UK), Canada, the USA, and Australia. The geographical location of projects is important since there is a difference in cost overruns for the same type of infrastructure projects that are located in different regions or countries. Secondly, the majority of studies were focused on transport infrastructure projects such as roadways, railways, and fixed links. In the Table, there is a lack regarding research on cost overruns in Asian countries or regions. There are no studies regarding the South Asian region.
Moreover, several researchers have studied the factors that contribute to infrastructure project cost overruns. Molinari et al. [18] discovered that site conditions and unfavorable weather are the main reasons for cost overruns of 35 transportation infrastructure projects in Belgium. Similarly, the impact of unfavorable weather and inflation on cost overruns was also identified by Narayanan et al. [53] in their studies. Some of the main reasons for contract changes, after the construction contract has been signed in Dutch transportation infrastructure projects, are scope changes and technical necessities [54]. Park and Papadopoulos [55] have provided an analysis of 35 transport infrastructure projects spanning 12 countries in East, Southeast, and South Asia. Their findings revealed a statistically significant correlation between project cost overruns and the duration of construction by the linear regression analysis. Furthermore, Narayanan et al. [53] observed 30 major infrastructure projects in India completed in the period between 1995 and 2017, discovering a statistically significant association between time overruns and cost overruns by the linear regression analysis. It is distinguished that cost overruns increase with the increase in time overruns. For railway projects in South Korea, the typical causes of overruns were changes in railway tracks, expansion of railway stations, and extensions of railway routes [46]. Moreover, Andrić et al. [50] have identified that cost overruns are linked to increases in the cost of raw materials, equipment, and workers, design changes, and variations in currency exchange rates across Asian infrastructure projects. Al-Hazim et al. [49] pointed out that environmental factors and rising labor costs as the key factors contributing to cost overruns in 40 infrastructure projects in Jordan from 2000 to 2008. Pham et al. [19] identified geological and weather conditions as significant contributors to cost overruns in transmission projects through the analysis of 261 questionnaires in Vietnam. Furthermore, Sovacool et al. [39] explored 401 power supply infrastructure projects and highlighted changes in project requirements, prolonged construction durations, escalating resource costs, and higher interest rates as causes of cost overruns. Throughout the interview process, Melaku et al. [52] exposed that inflation and inaccurate cost estimation were mainly perceived as the principal causes of cost overruns in Ethiopian infrastructure projects. In some studies, the planning fallacy is the root cause of poor project performance [56,57].
The previous studies have shown that the majority of papers are focused on cost overruns in European countries [6,34] and the link between cost overruns and project size, implementation period in construction, and preconstruction phase are determined based on the probabilistic approach using linear regression analysis [5,13,18,25,34,42,45,48,55,58,59]. In general, uncertainties that arise in the cost and time estimation of projects in the previous literature are assessed by qualitative methods or quantitative methods [60]. Qualitative methods for estimating overruns in construction projects are contingency and impact matrix, while the quantitative methods used for overruns estimation are regression modeling, probability distribution, neural network, and Monte Carlo simulation [60]. The main contribution of this study is to investigate the application of nonparametric regression functions using machine learning to study the correlation between cost overruns and project size, implementation period, and time overrun.

2.2. Five Independent Variables for Cost Overruns

From the literature review, five independent variables are noticed to influence cost overruns in infrastructure projects:
  • Type of projects. Cost overruns have been influenced by the different transport infrastructure projects, roadways, railways, bridges, and tunnels [10,25,34]. It can be concluded from Table 1 that cost overruns are influenced by the different types of infrastructure, railways, roadways, tunnels, ports, electrical power projects, and others. The first variable is the project type.
  • Location of projects. Table 1 highlights the importance of project location on cost overrun rates. The different regions and countries have experienced different values of cost overruns. Within this research, geographical location is selected as the second variable that influences cost overruns.
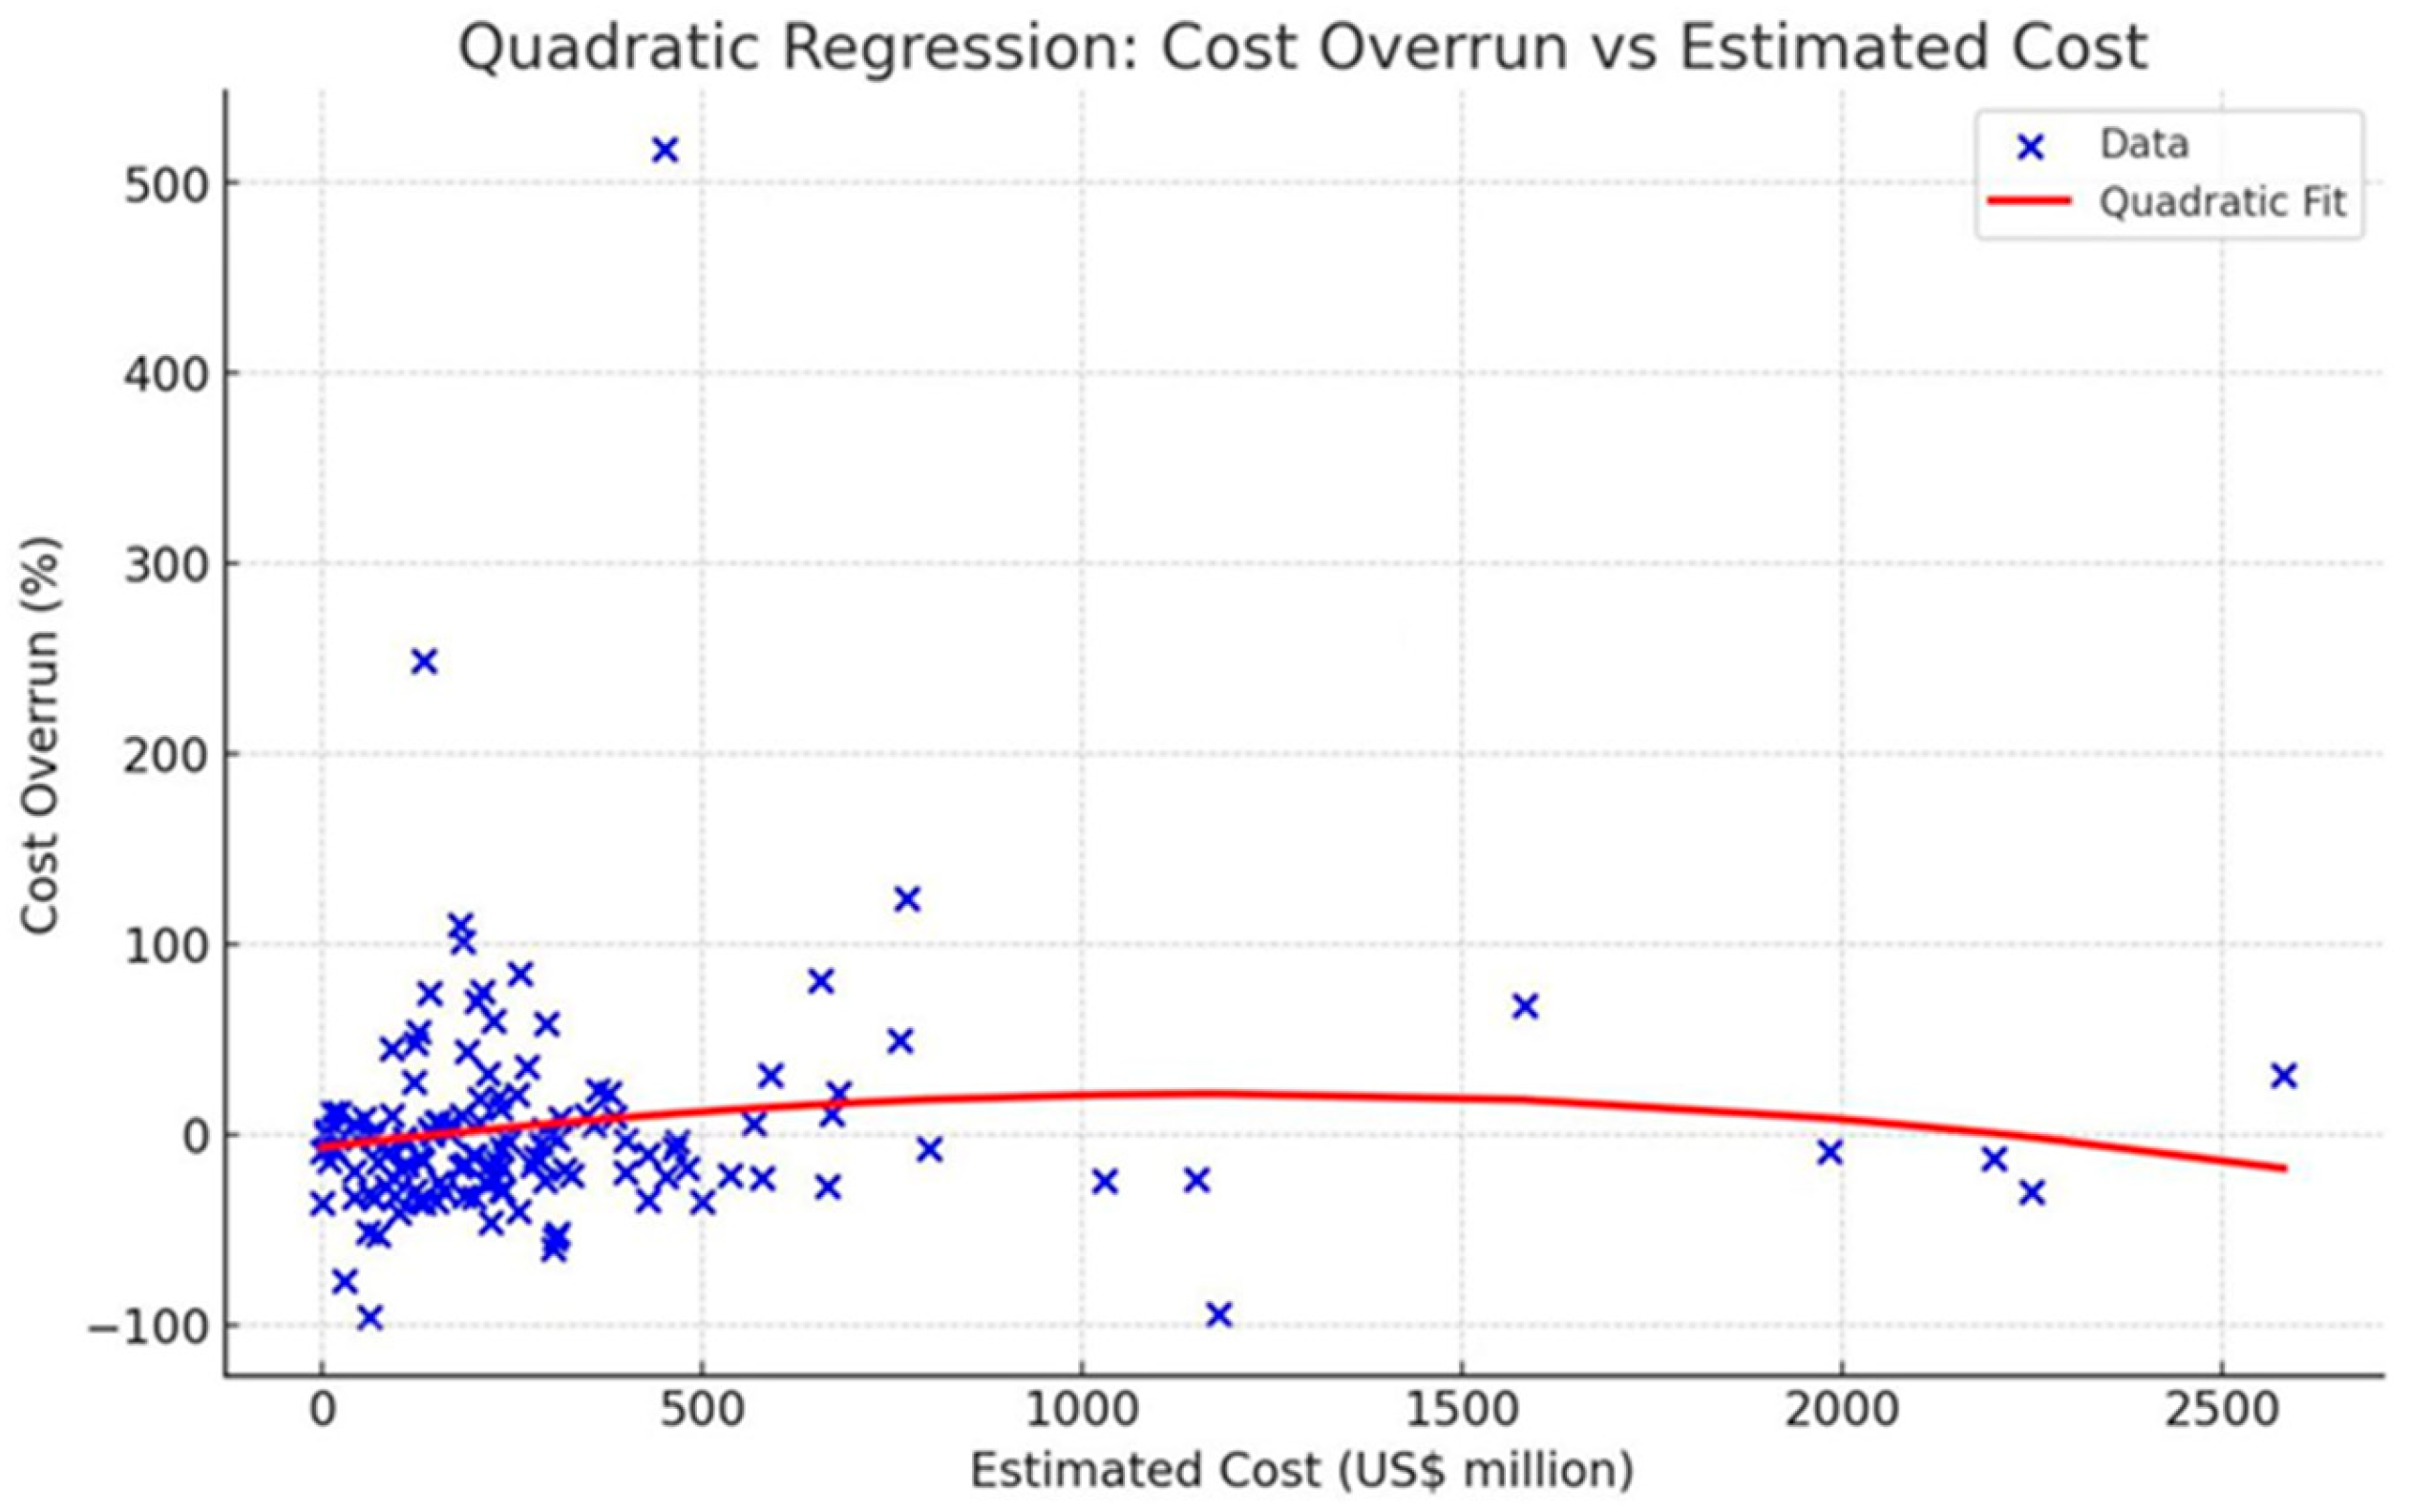
  • Project size. The project size represents the estimated value of the project at the time of the decision to be built. Cost overruns are correlated with the project size according to a large body of research. For example, there is a statistical correlation between the estimated cost and the actual amount of infrastructure projects [35,50,53]. Also, Verweij et al. [54] have concluded that smaller projects tend to have higher cost overruns and larger projects tend to have lower cost overruns. Hence, it is assumed that cost overruns will vary due to project size.
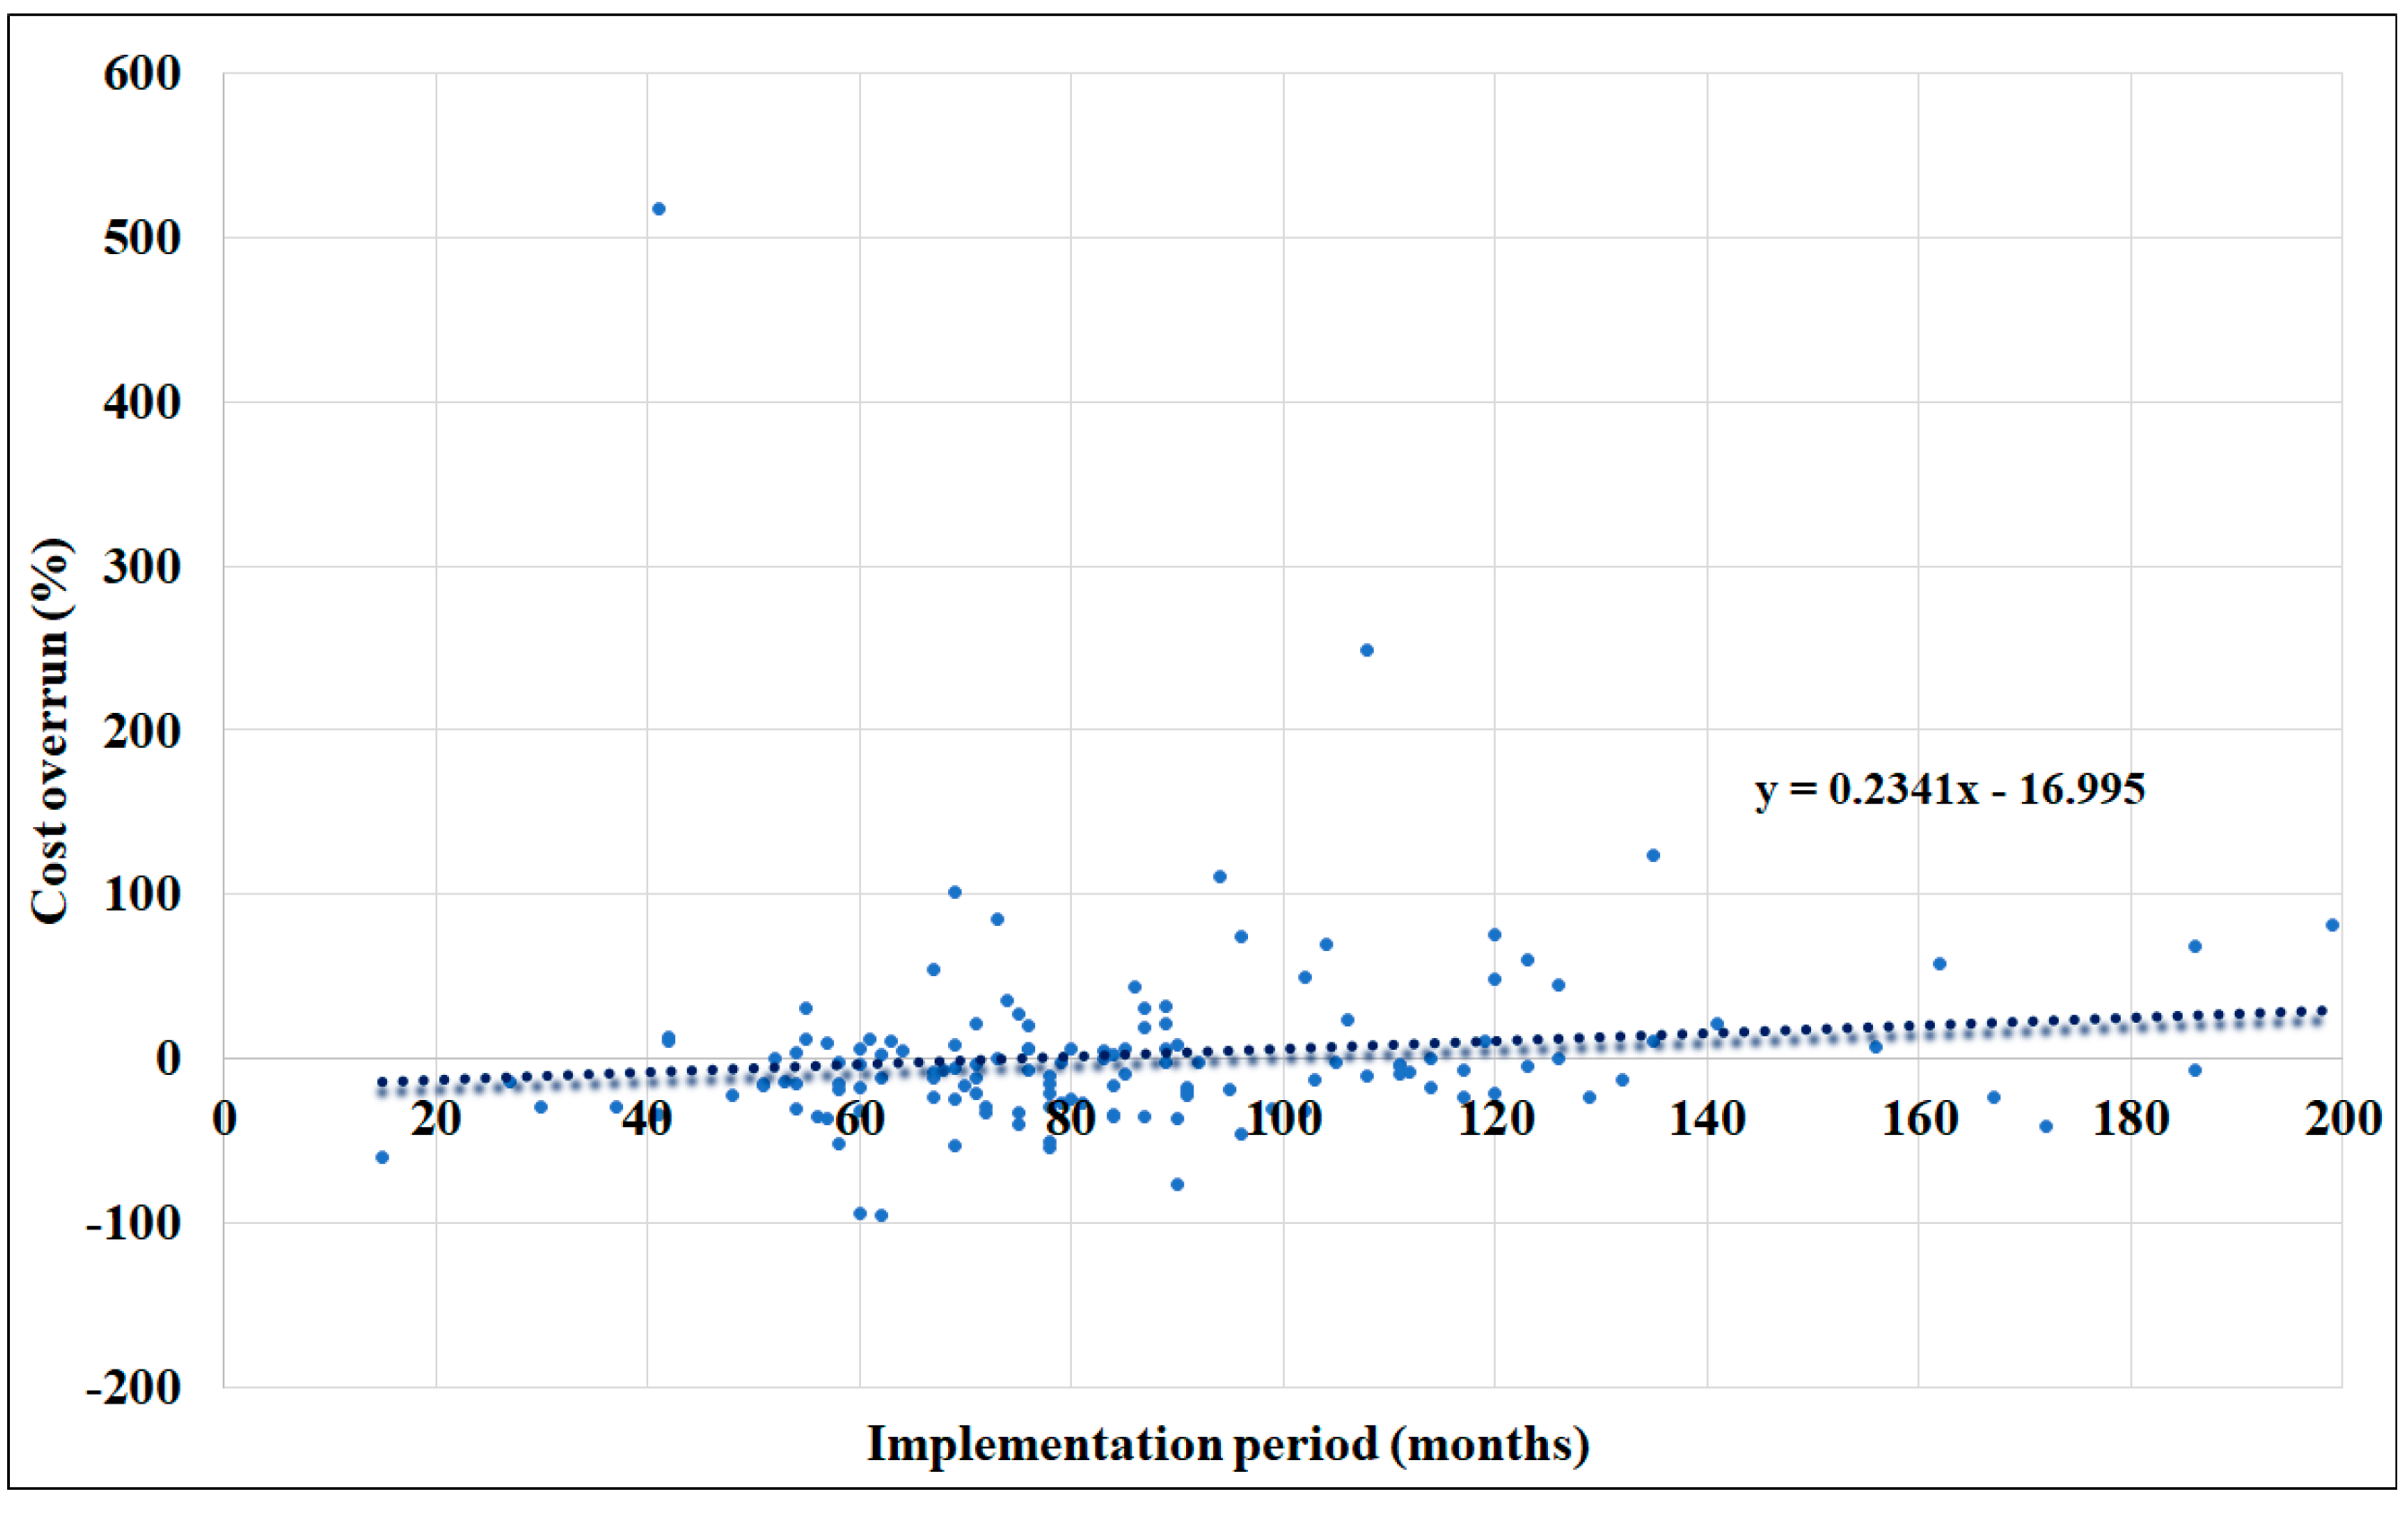
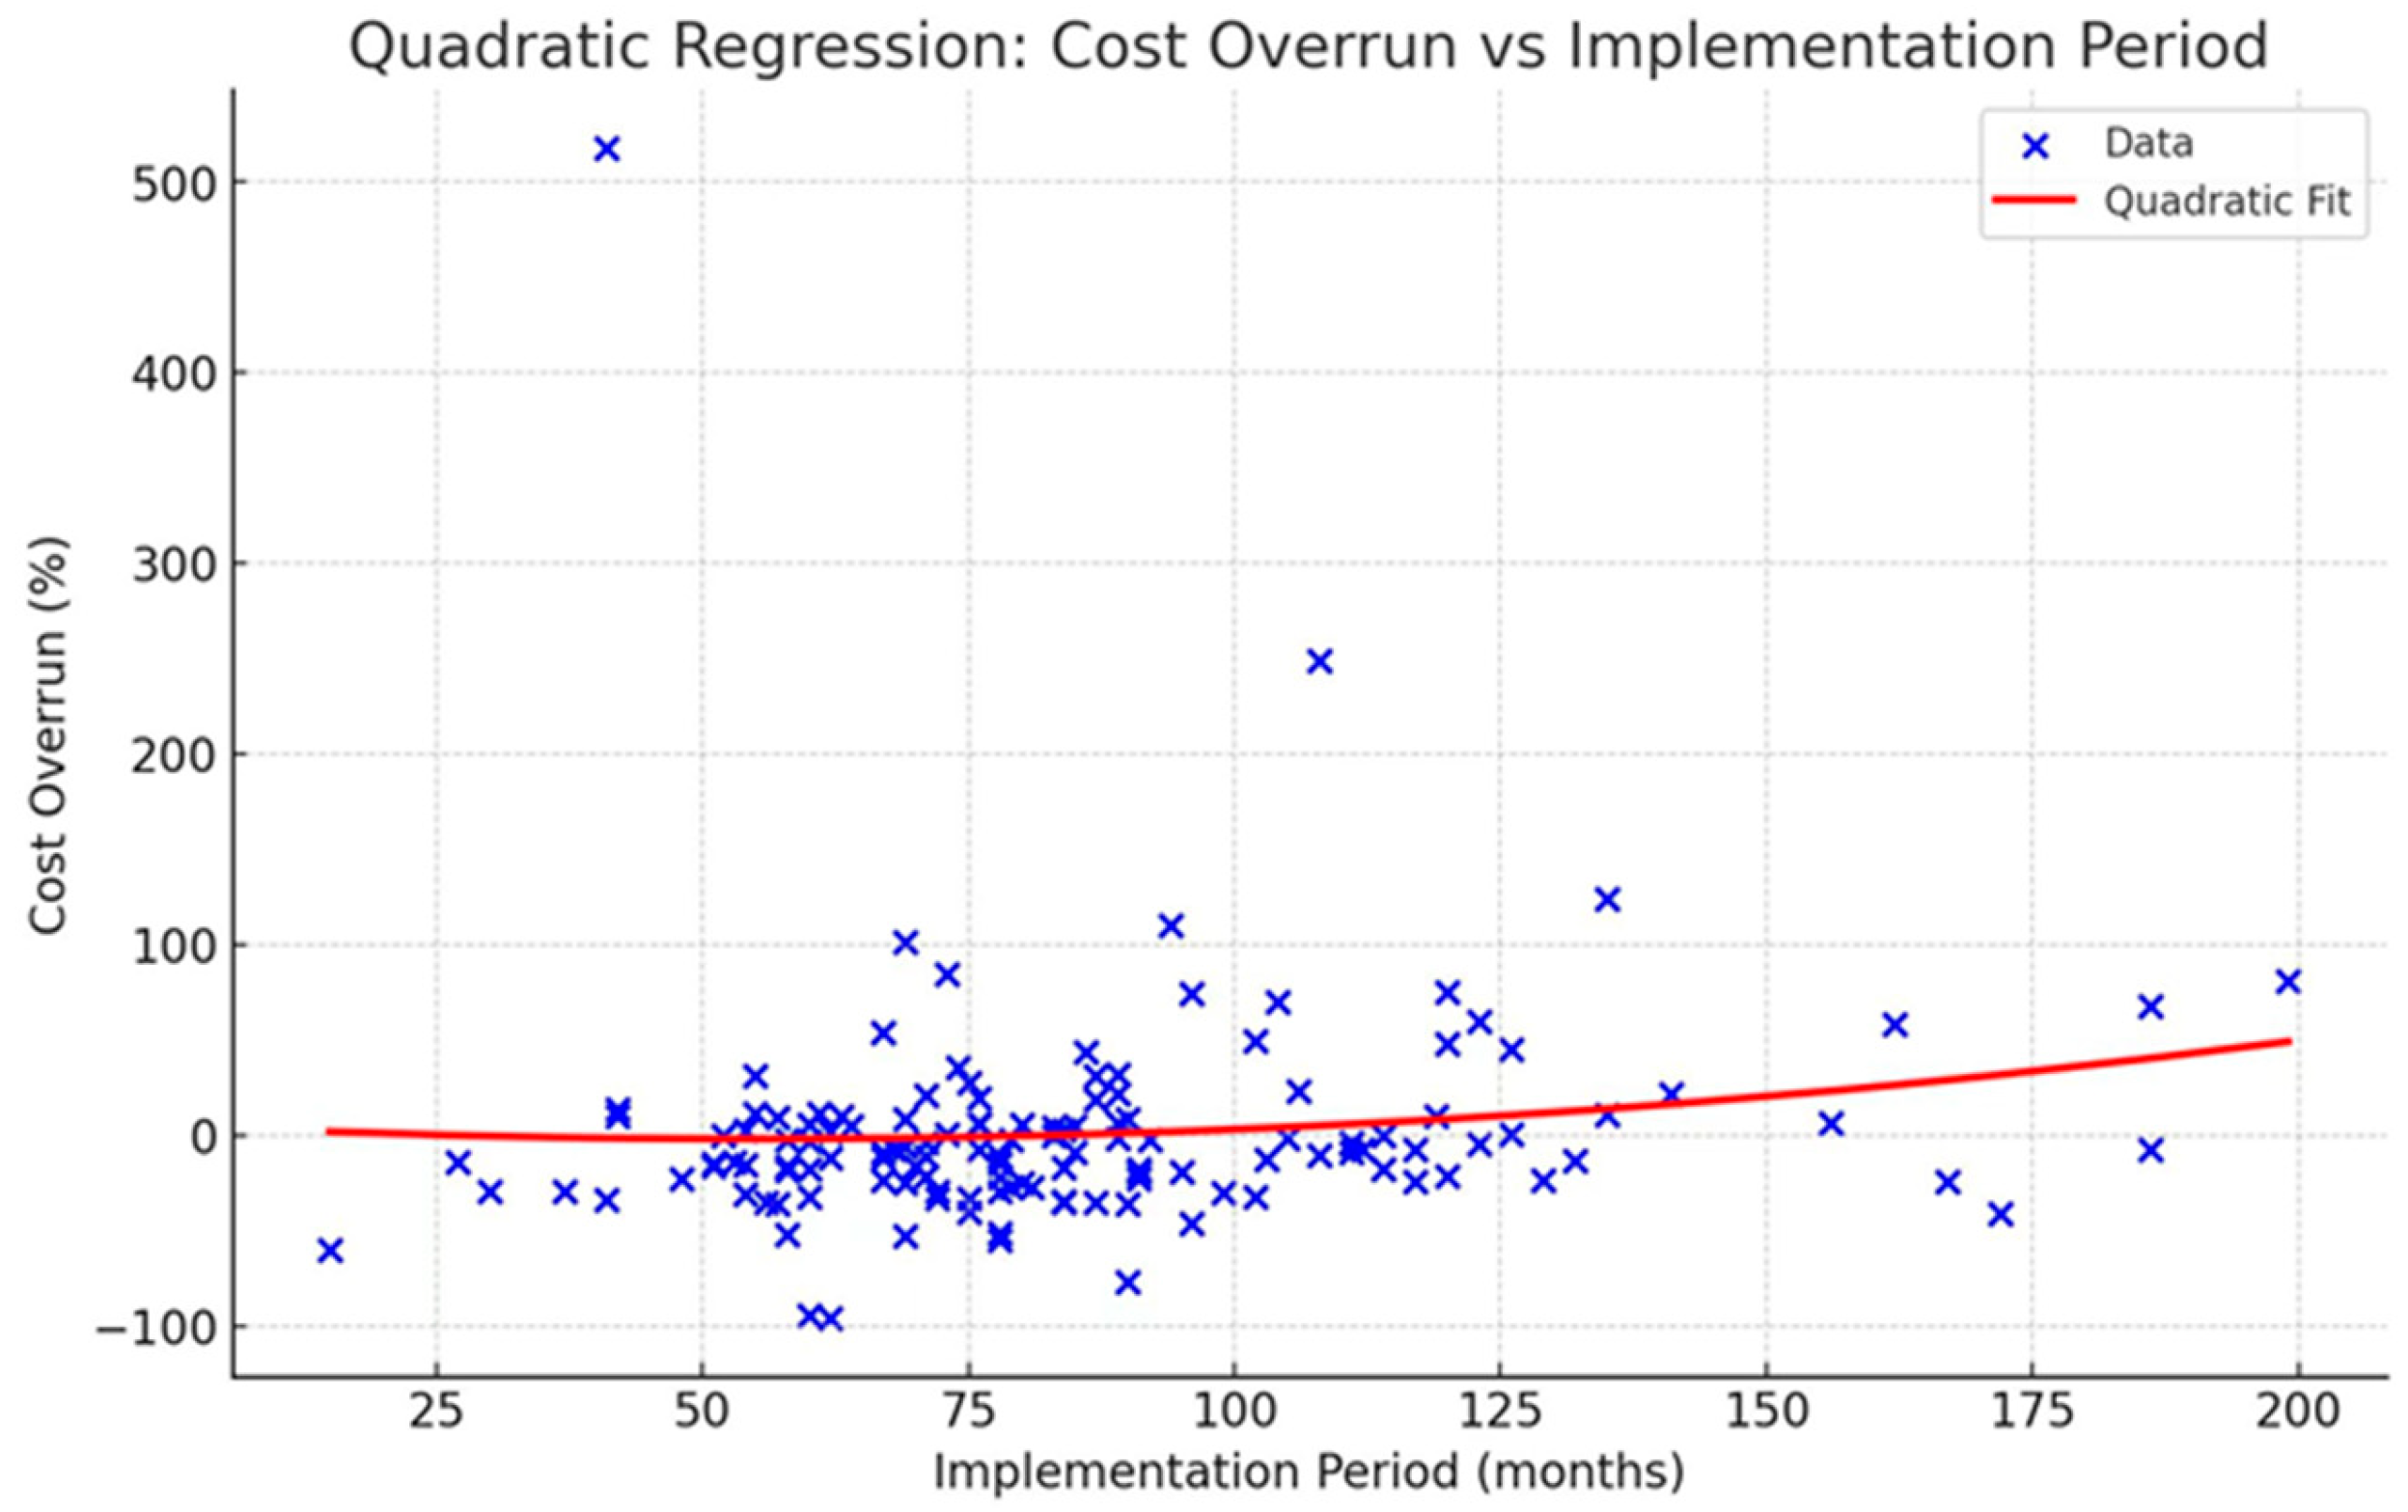
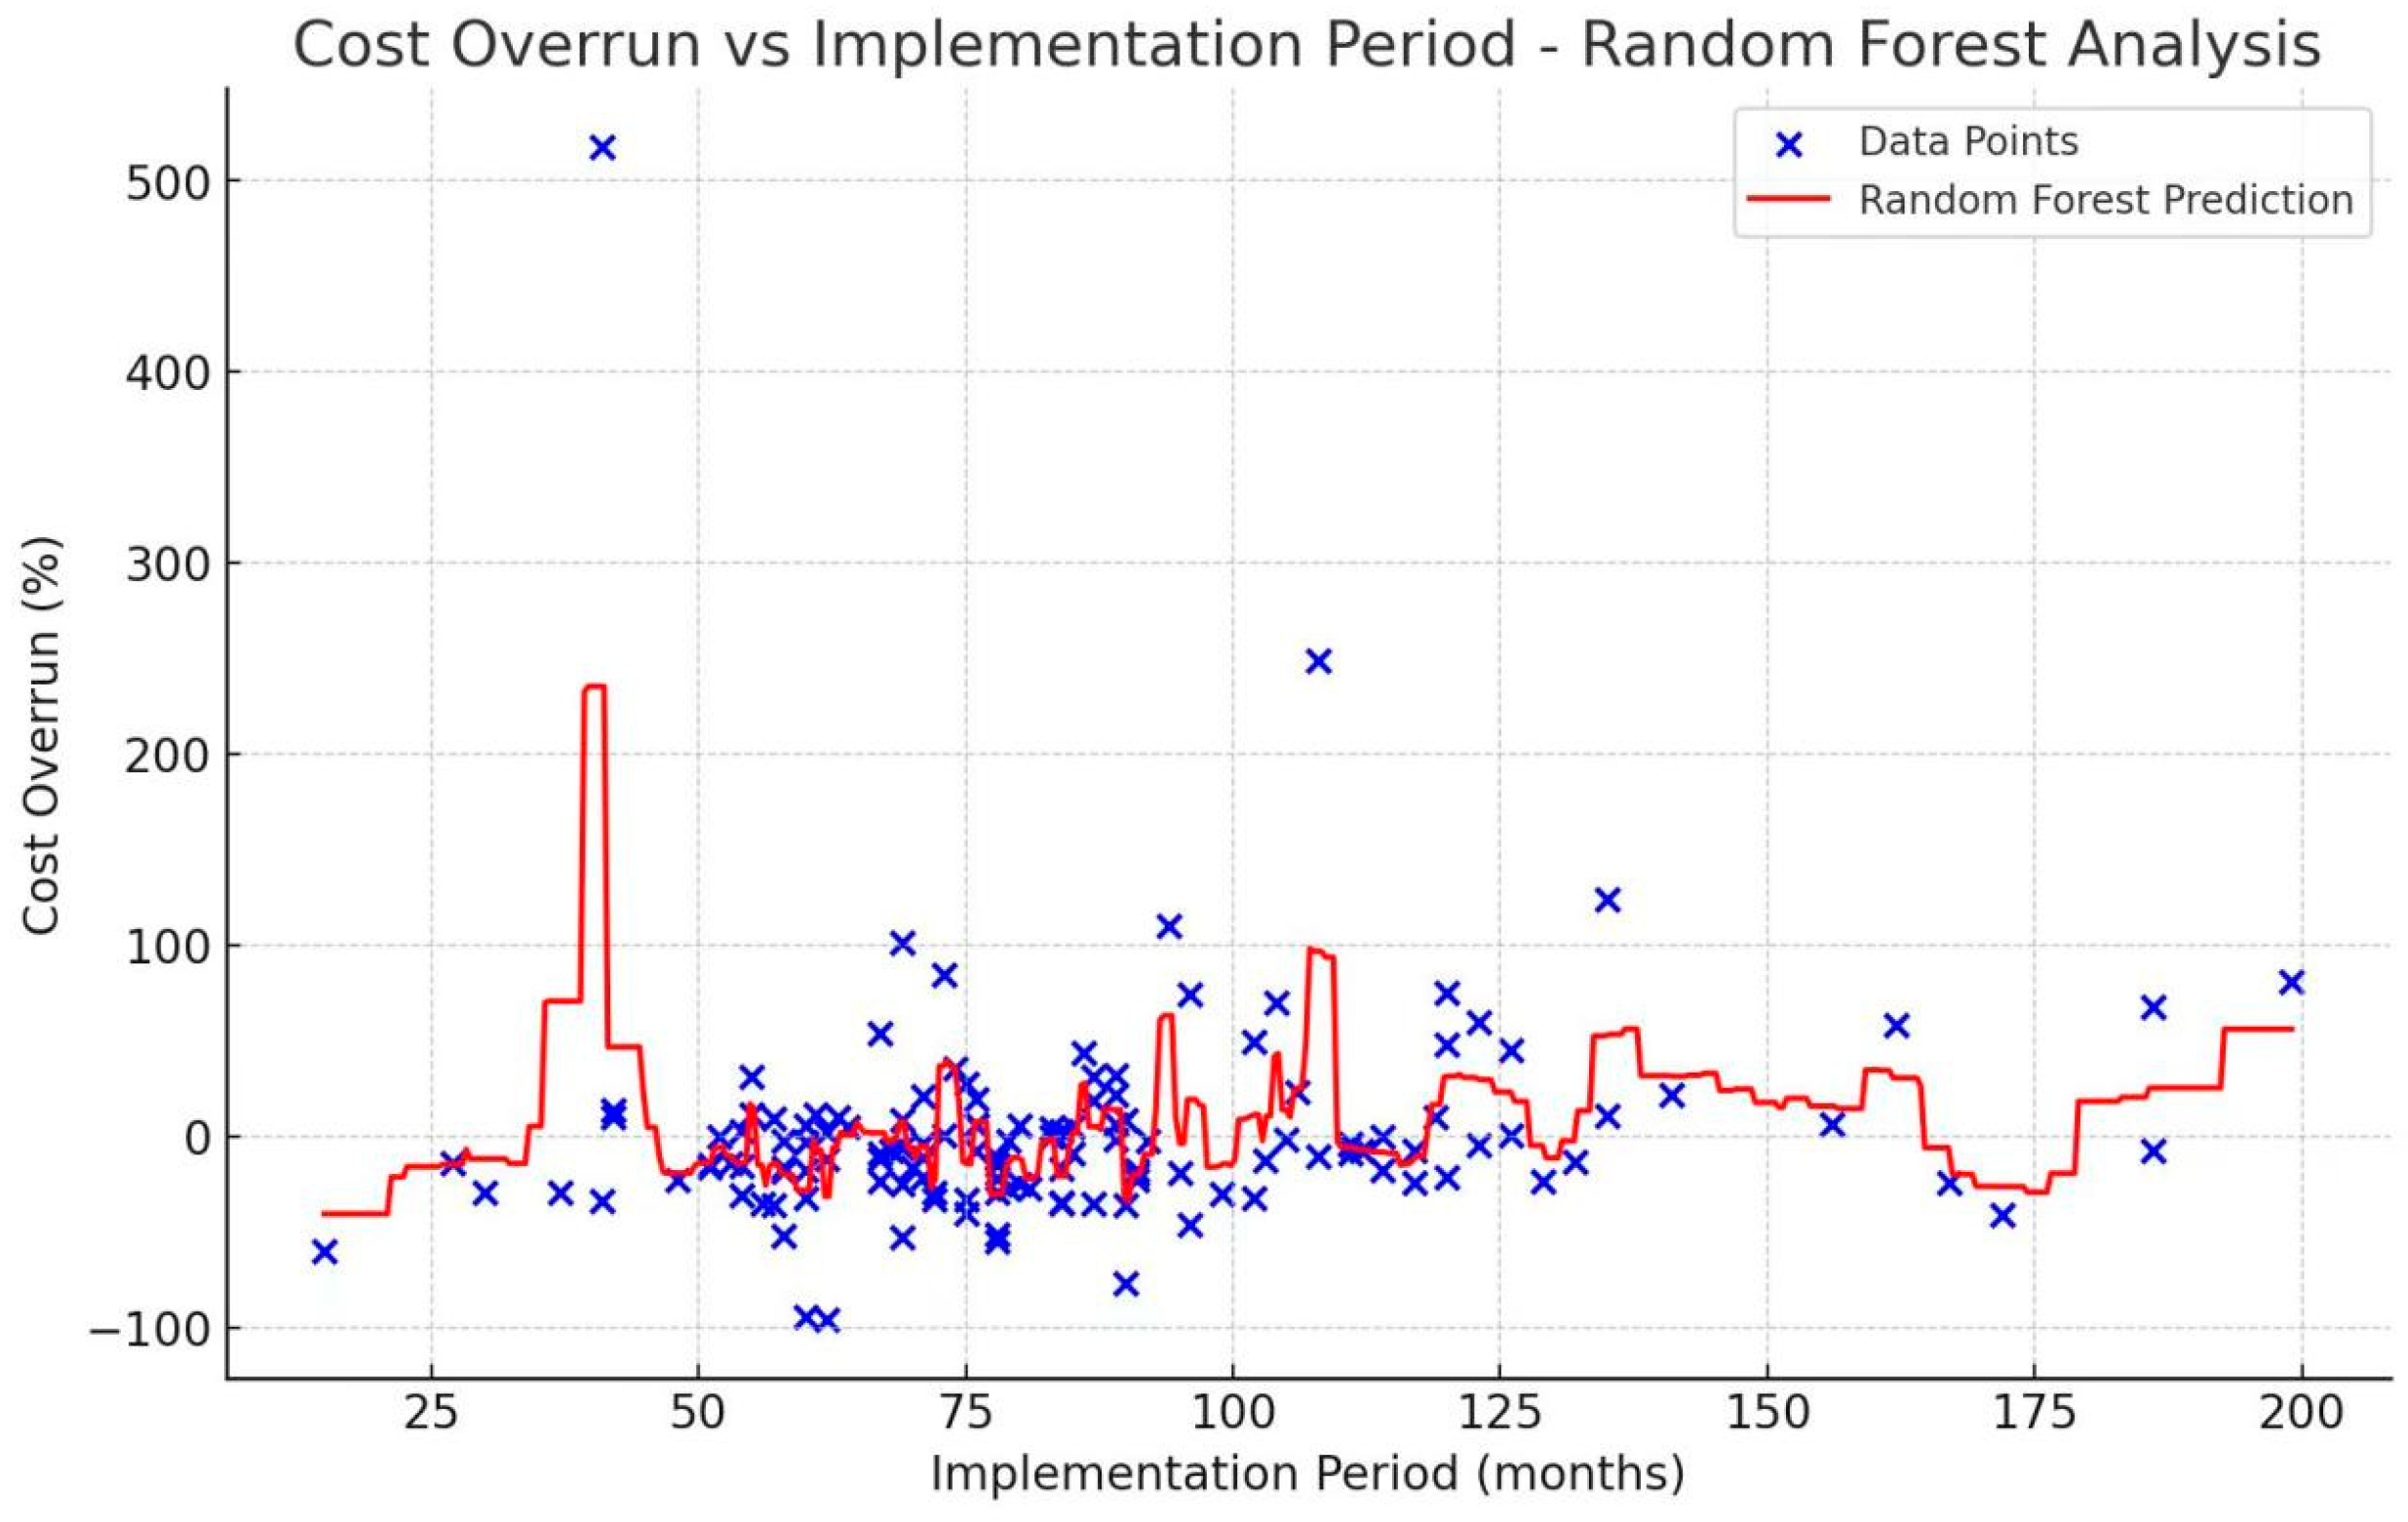
  • Implementation period of projects. The implementation period signifies the duration of the project from the initiation of construction to the ultimate completion. The duration of the project is measured in months. The study conducted by Park and Papadopoulou [55] identified a statistically significant correlation between the duration of construction and cost overruns. In this context, it is assumed that cost overruns are influenced by the duration of the implementation phase.
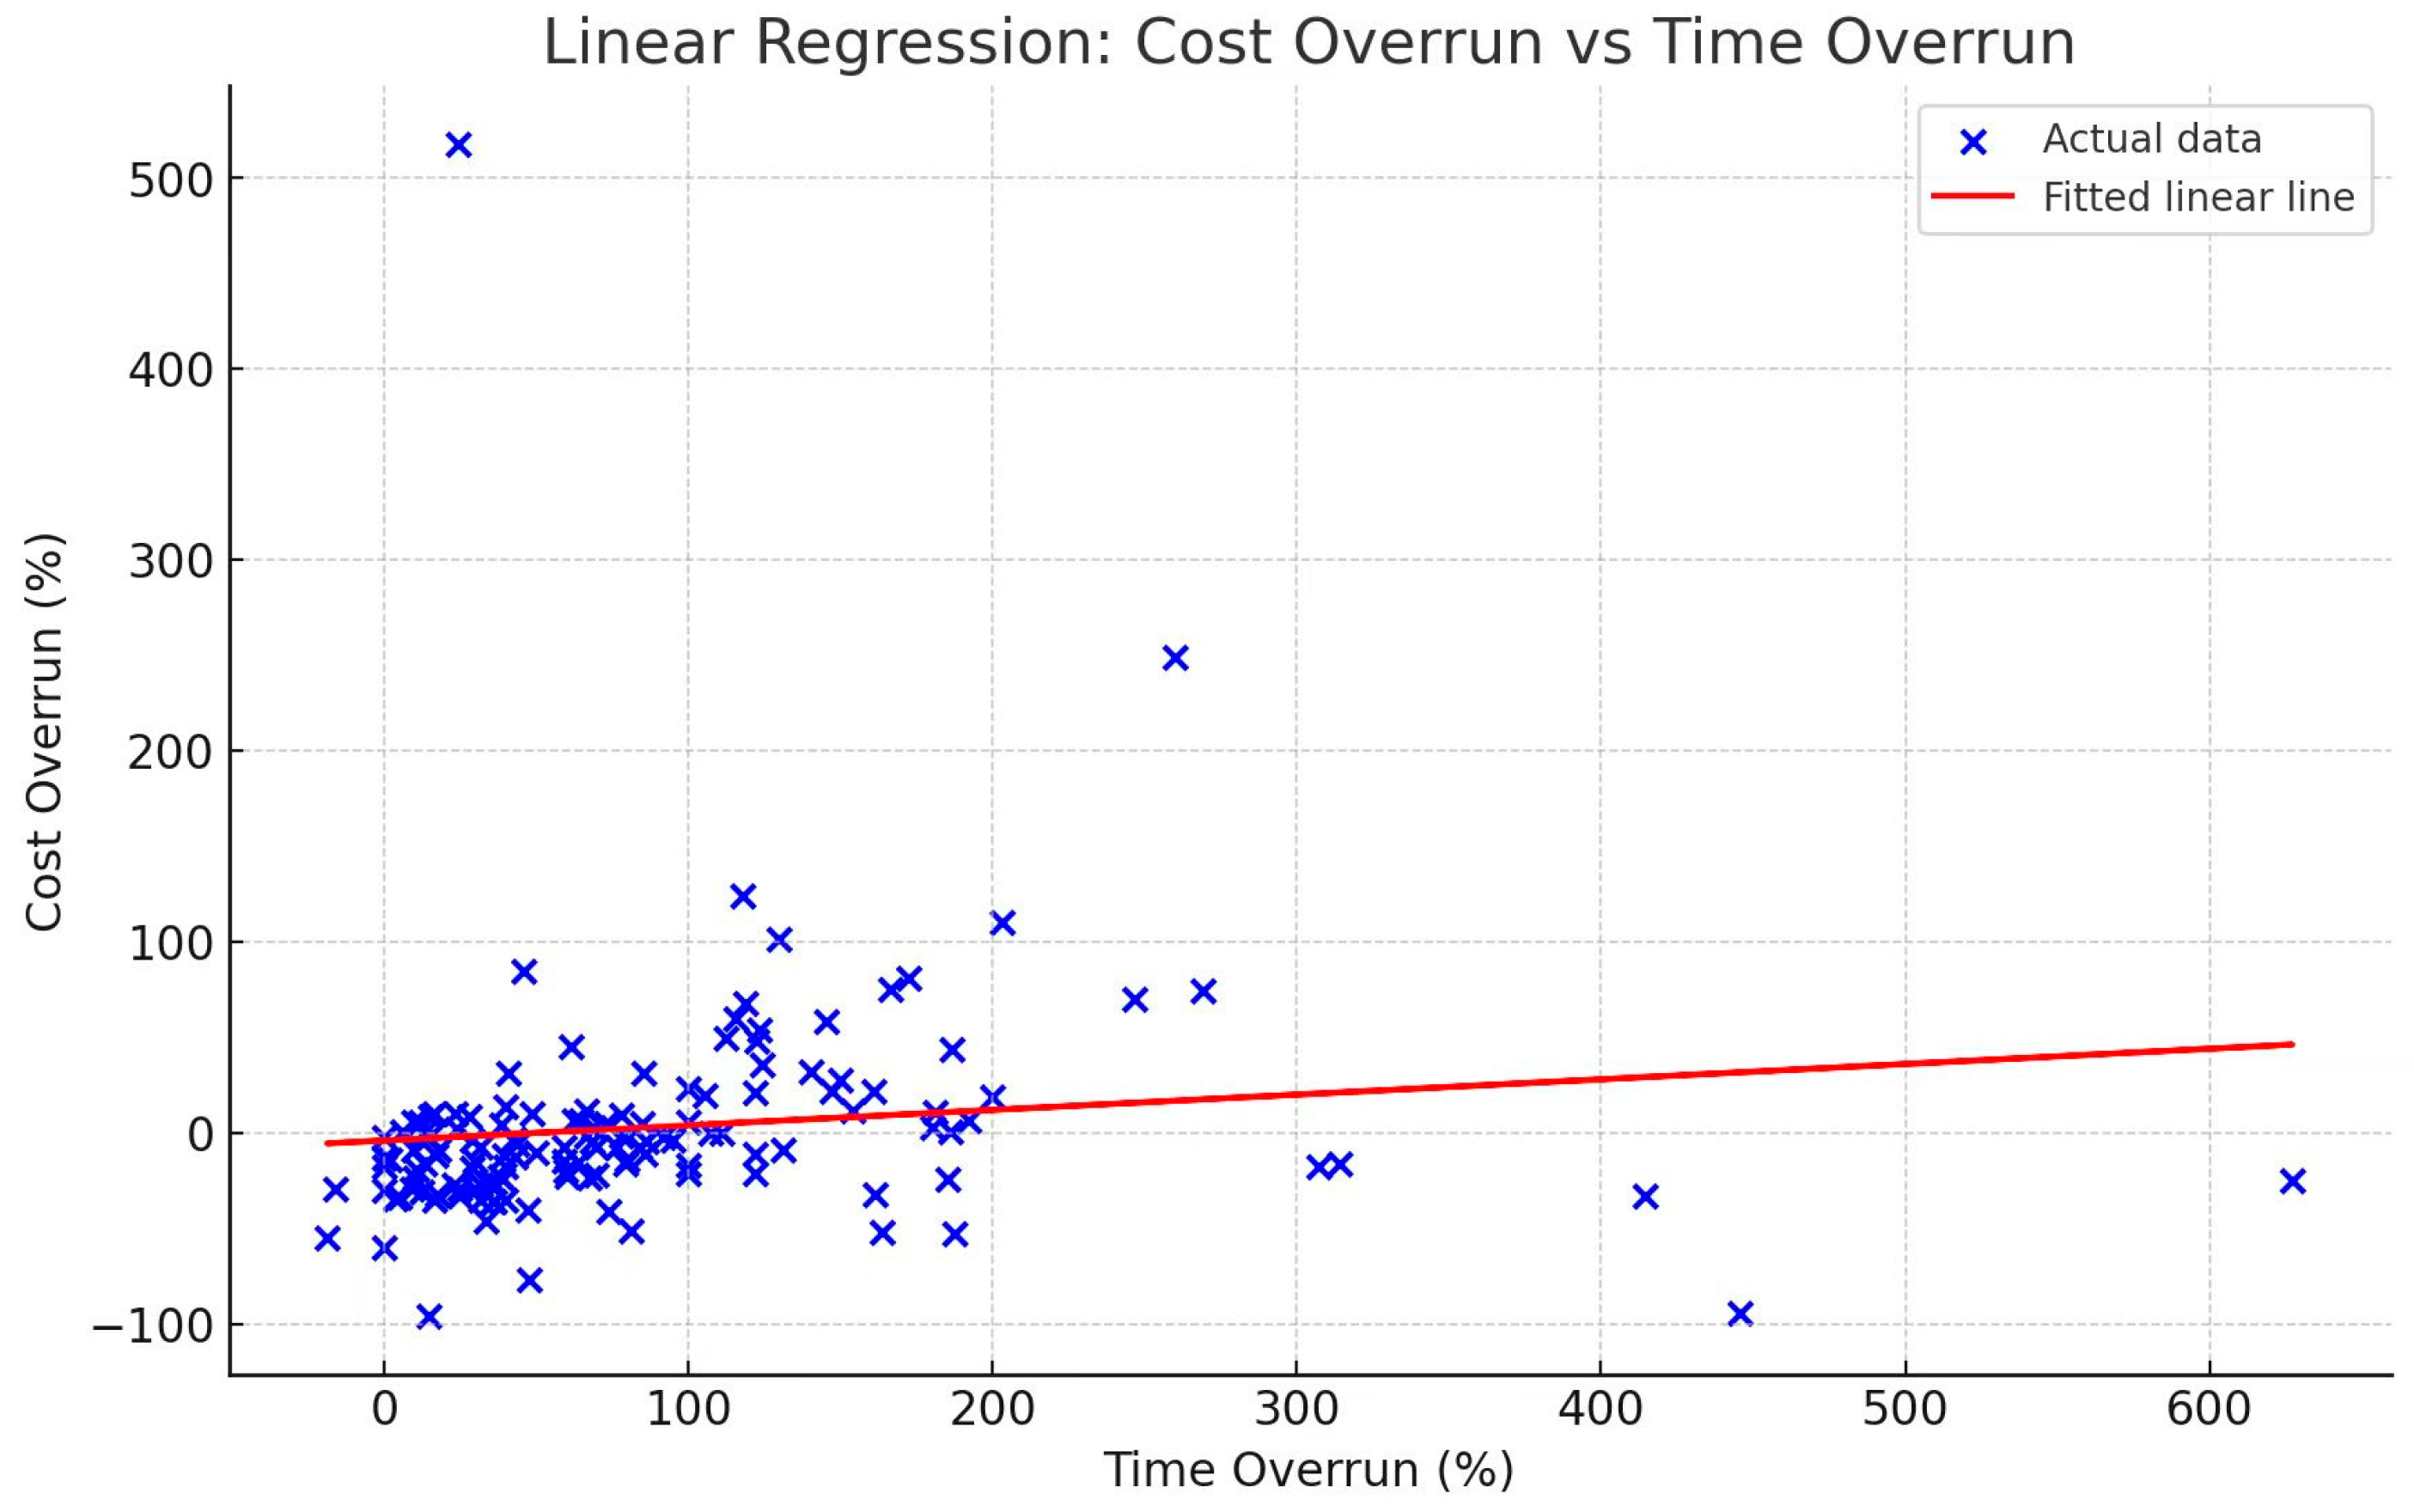
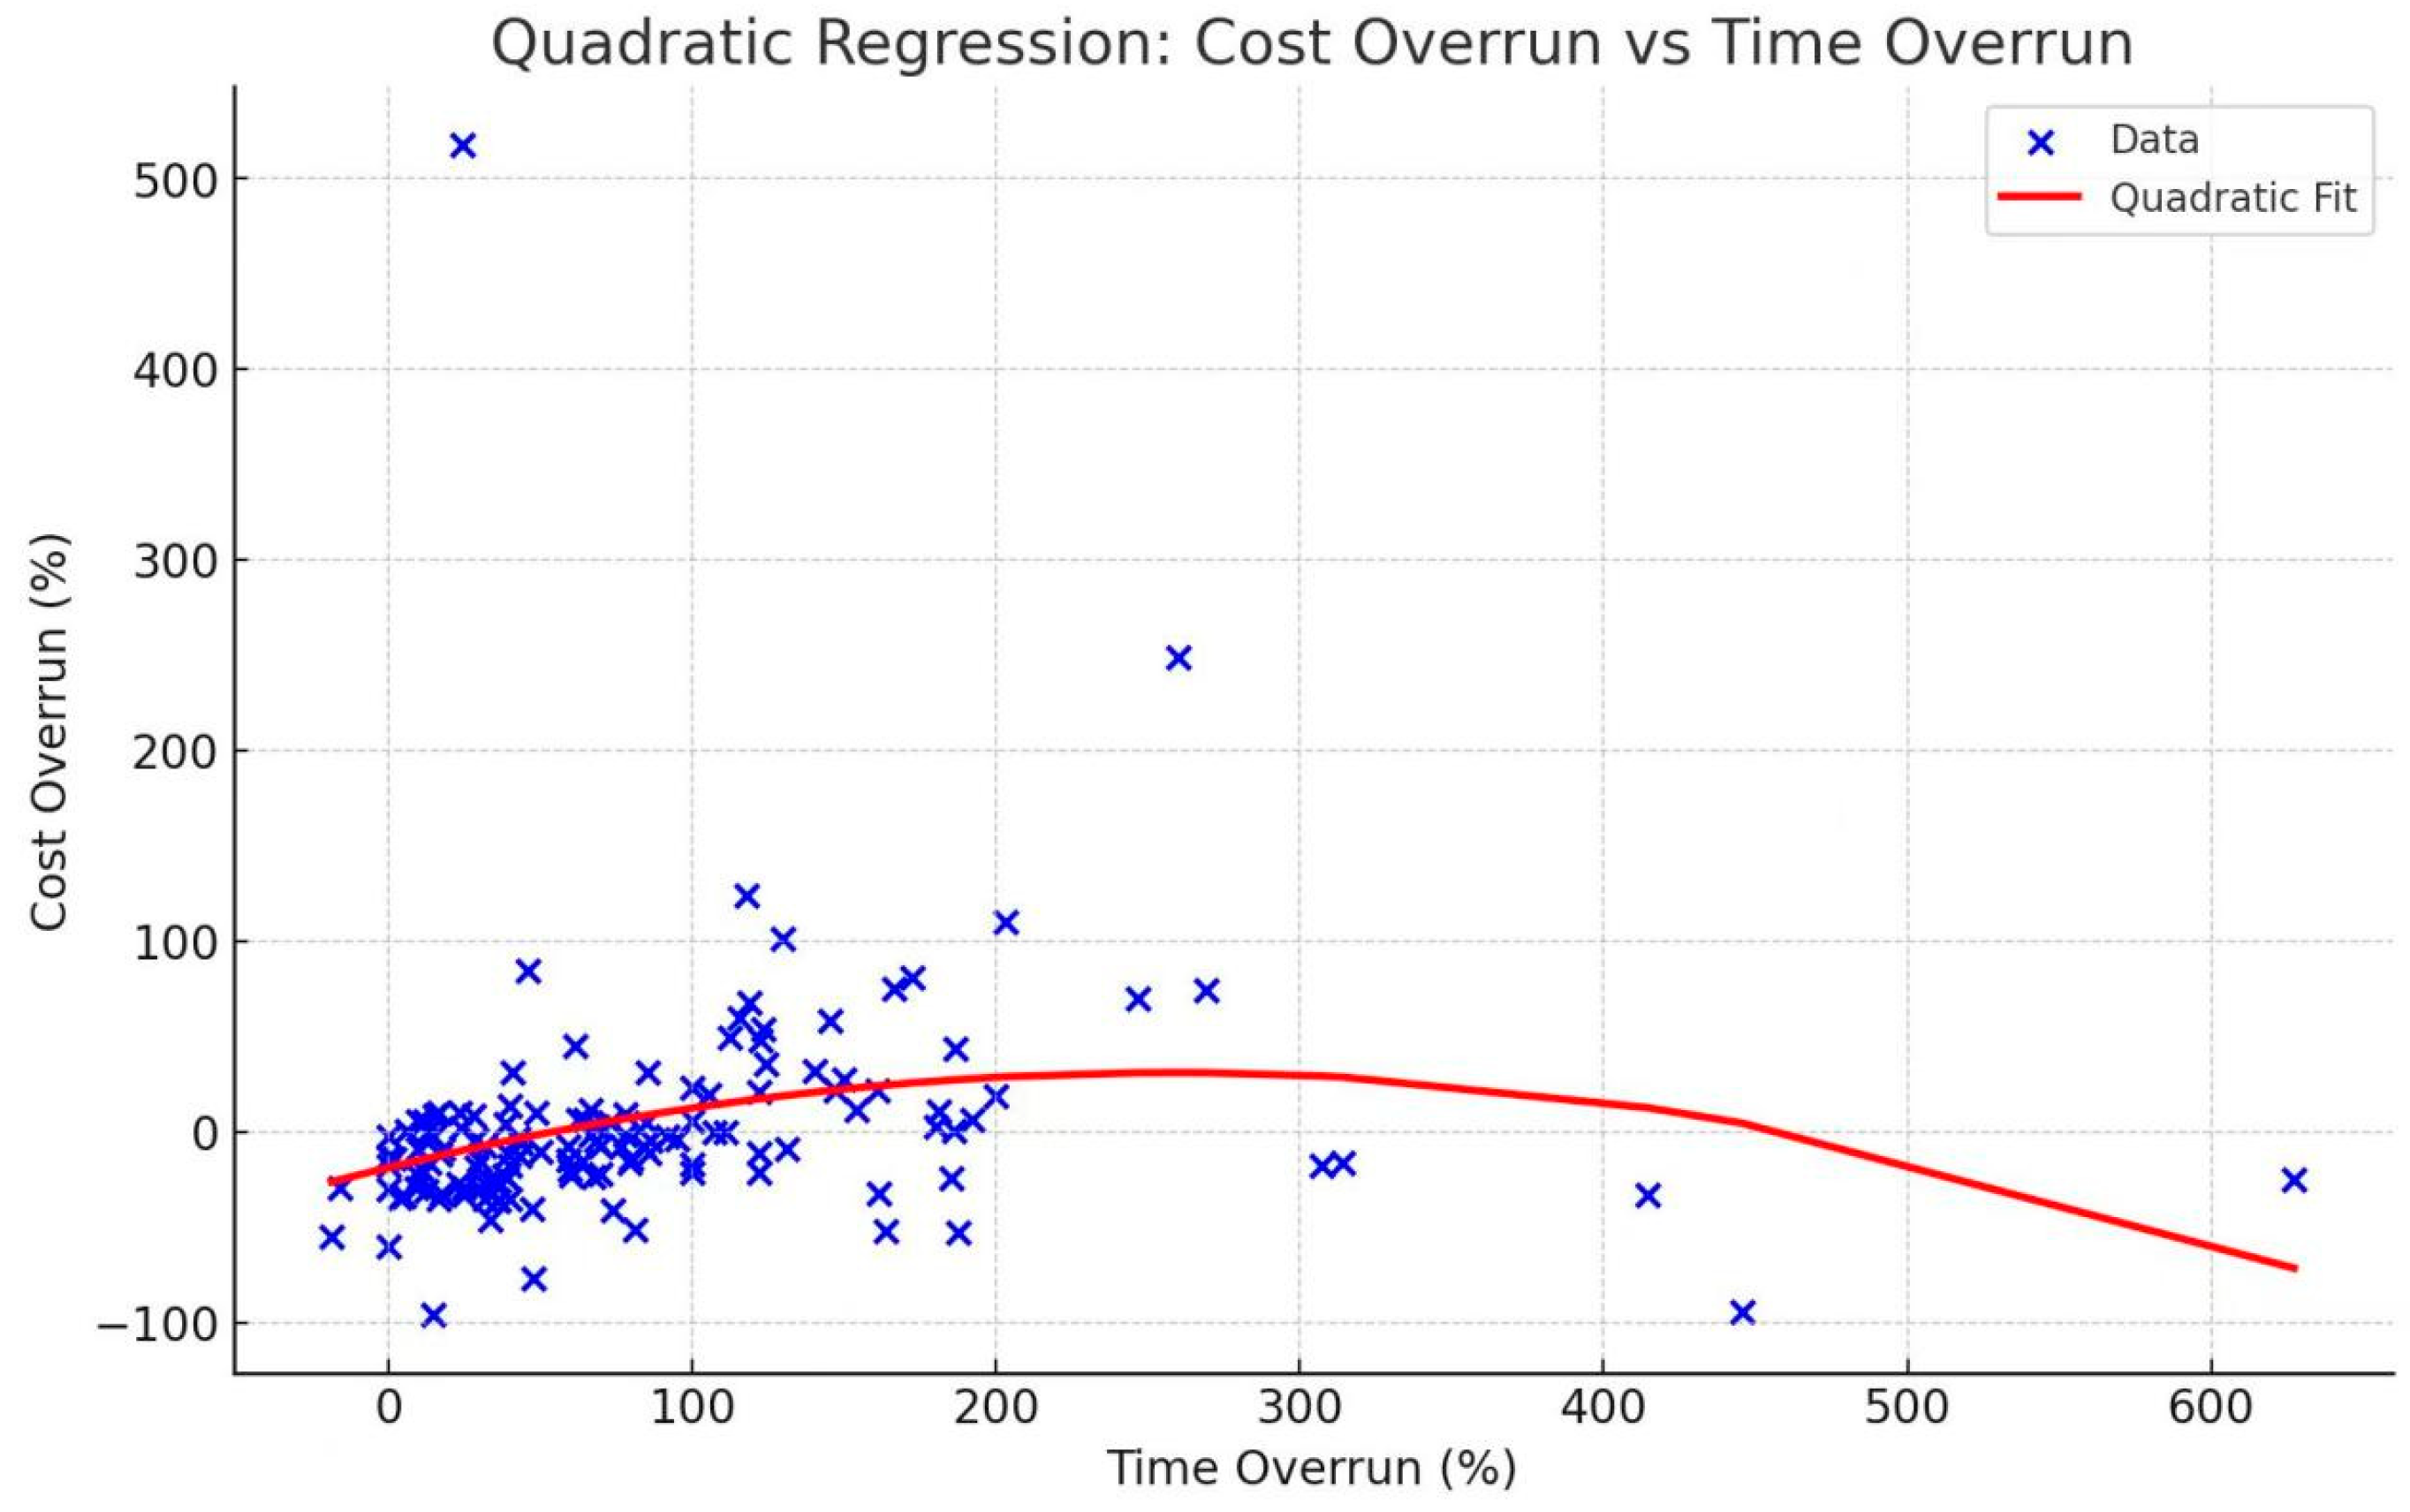
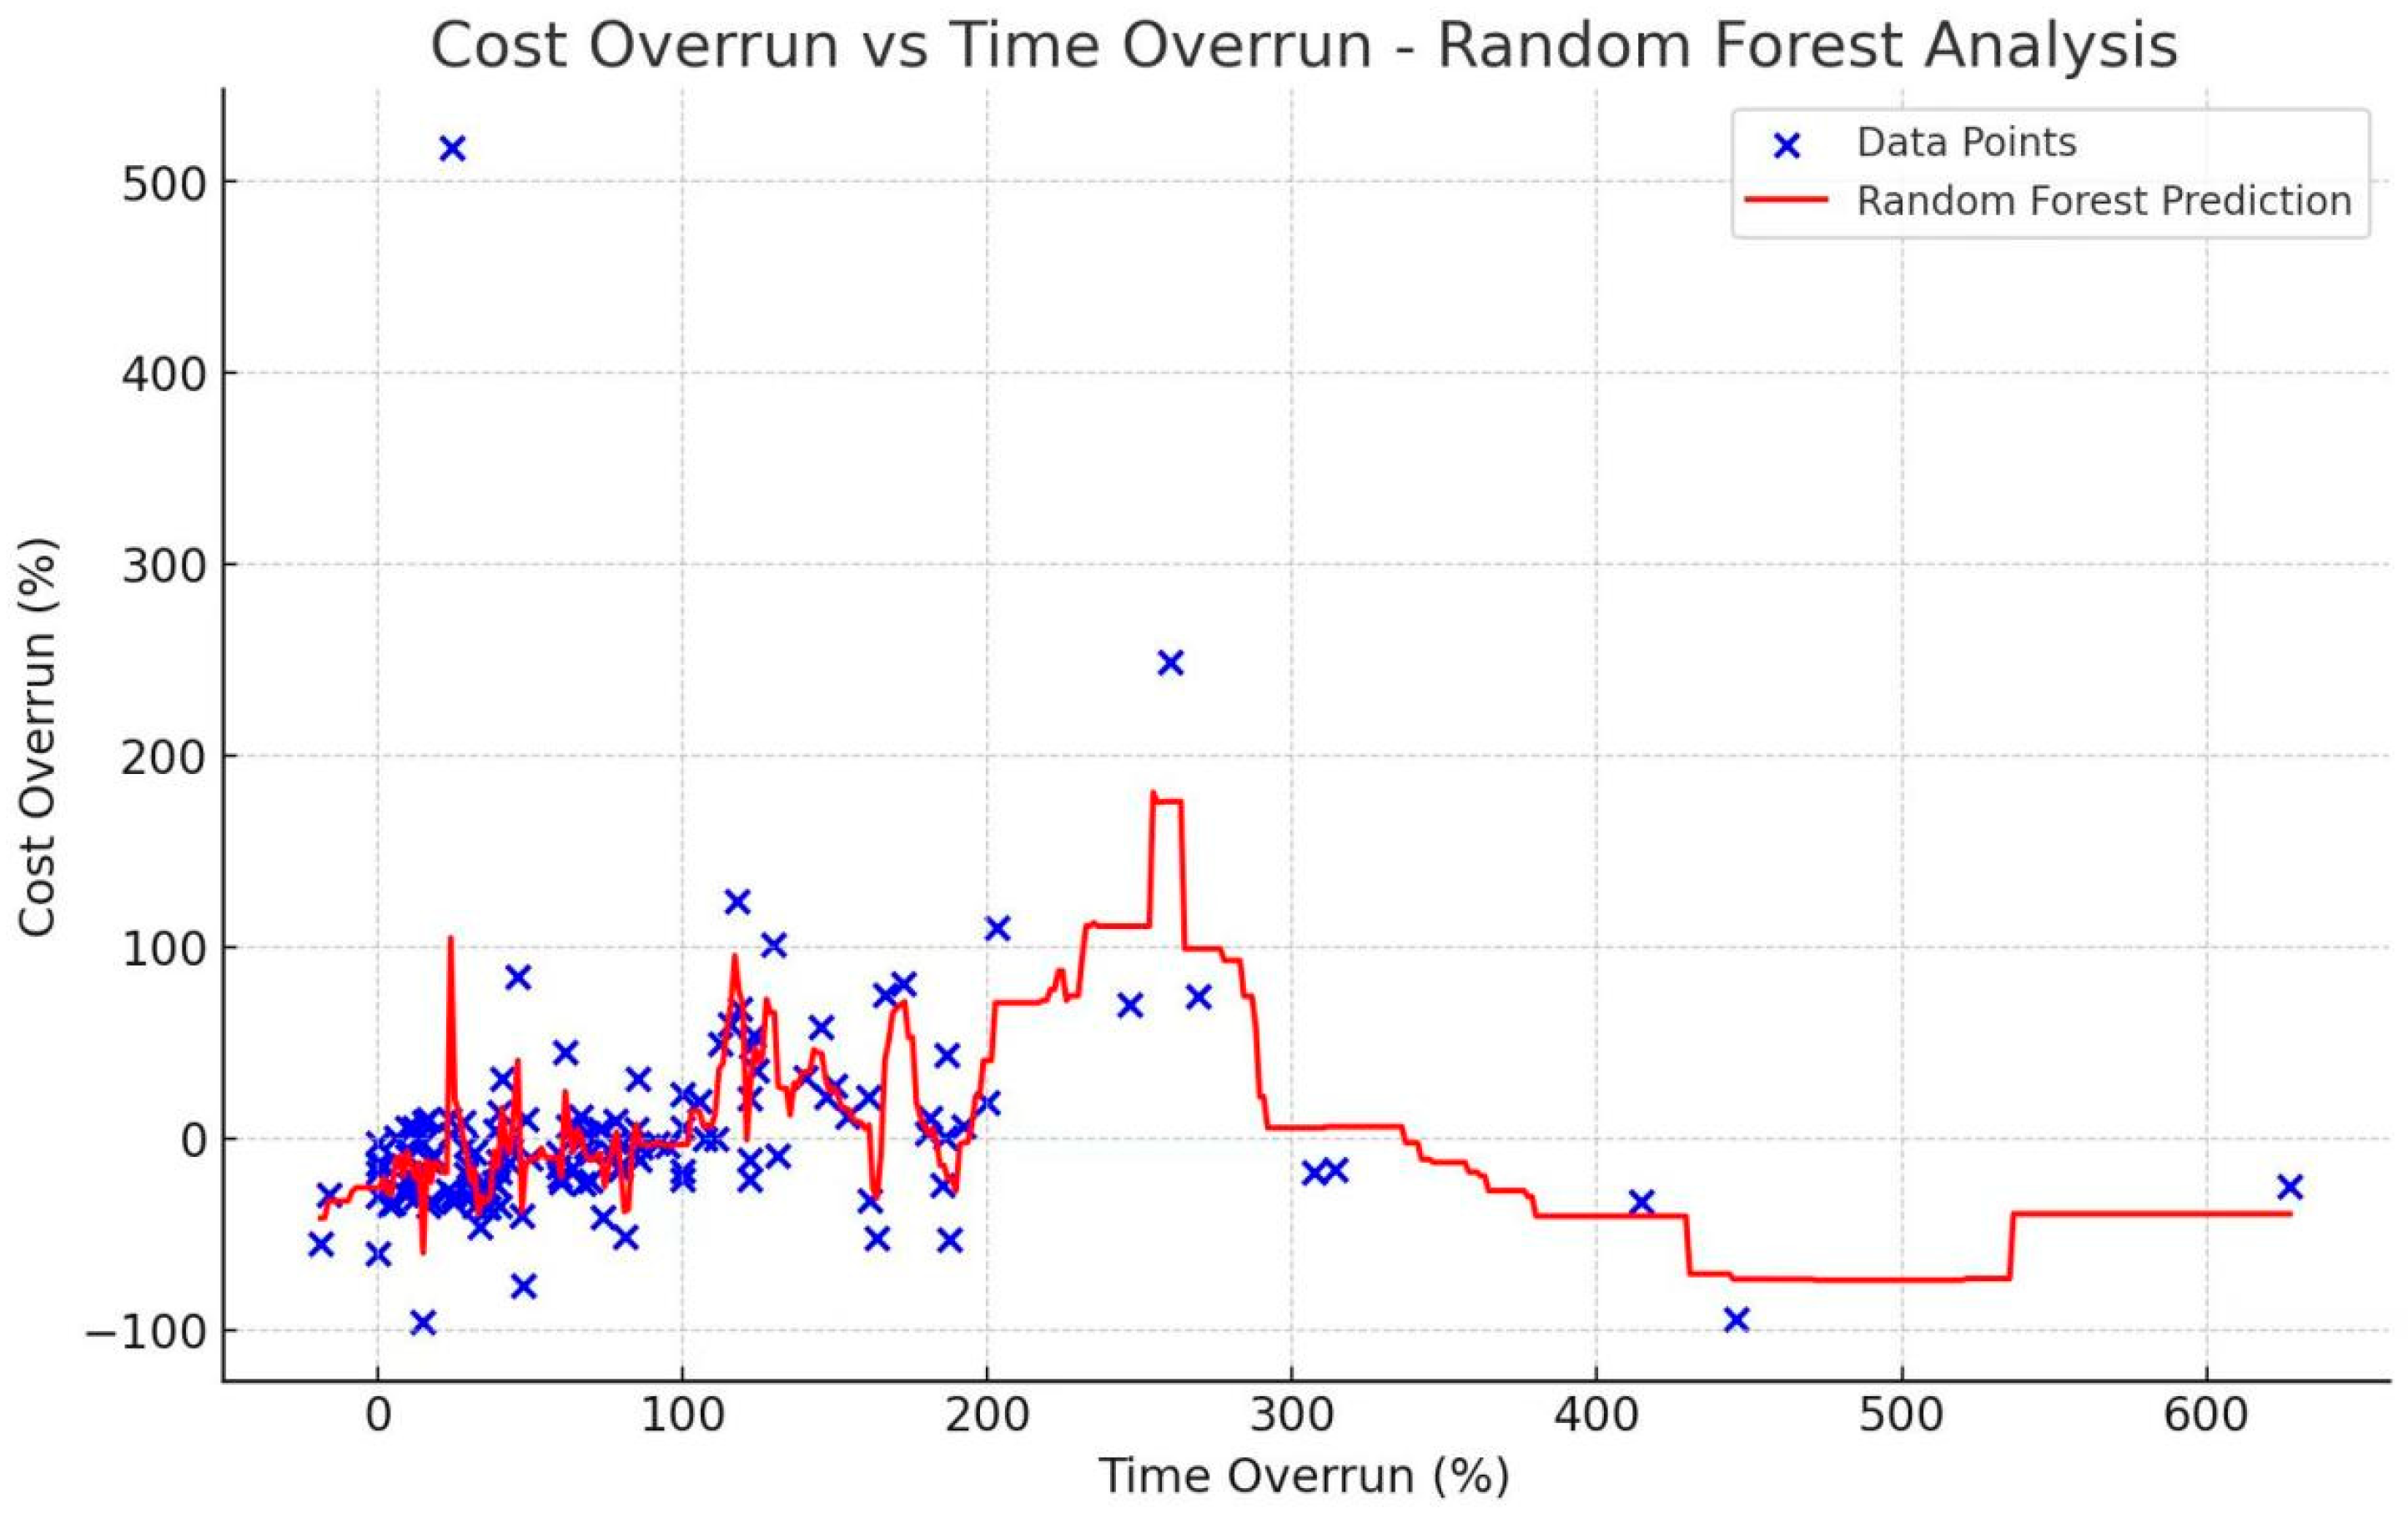
  • Time overruns of projects. There is minor research on the dependency between cost and time overruns. However, there is no evidence that any scholars studying the impact of time overruns as a variable on cost overruns.
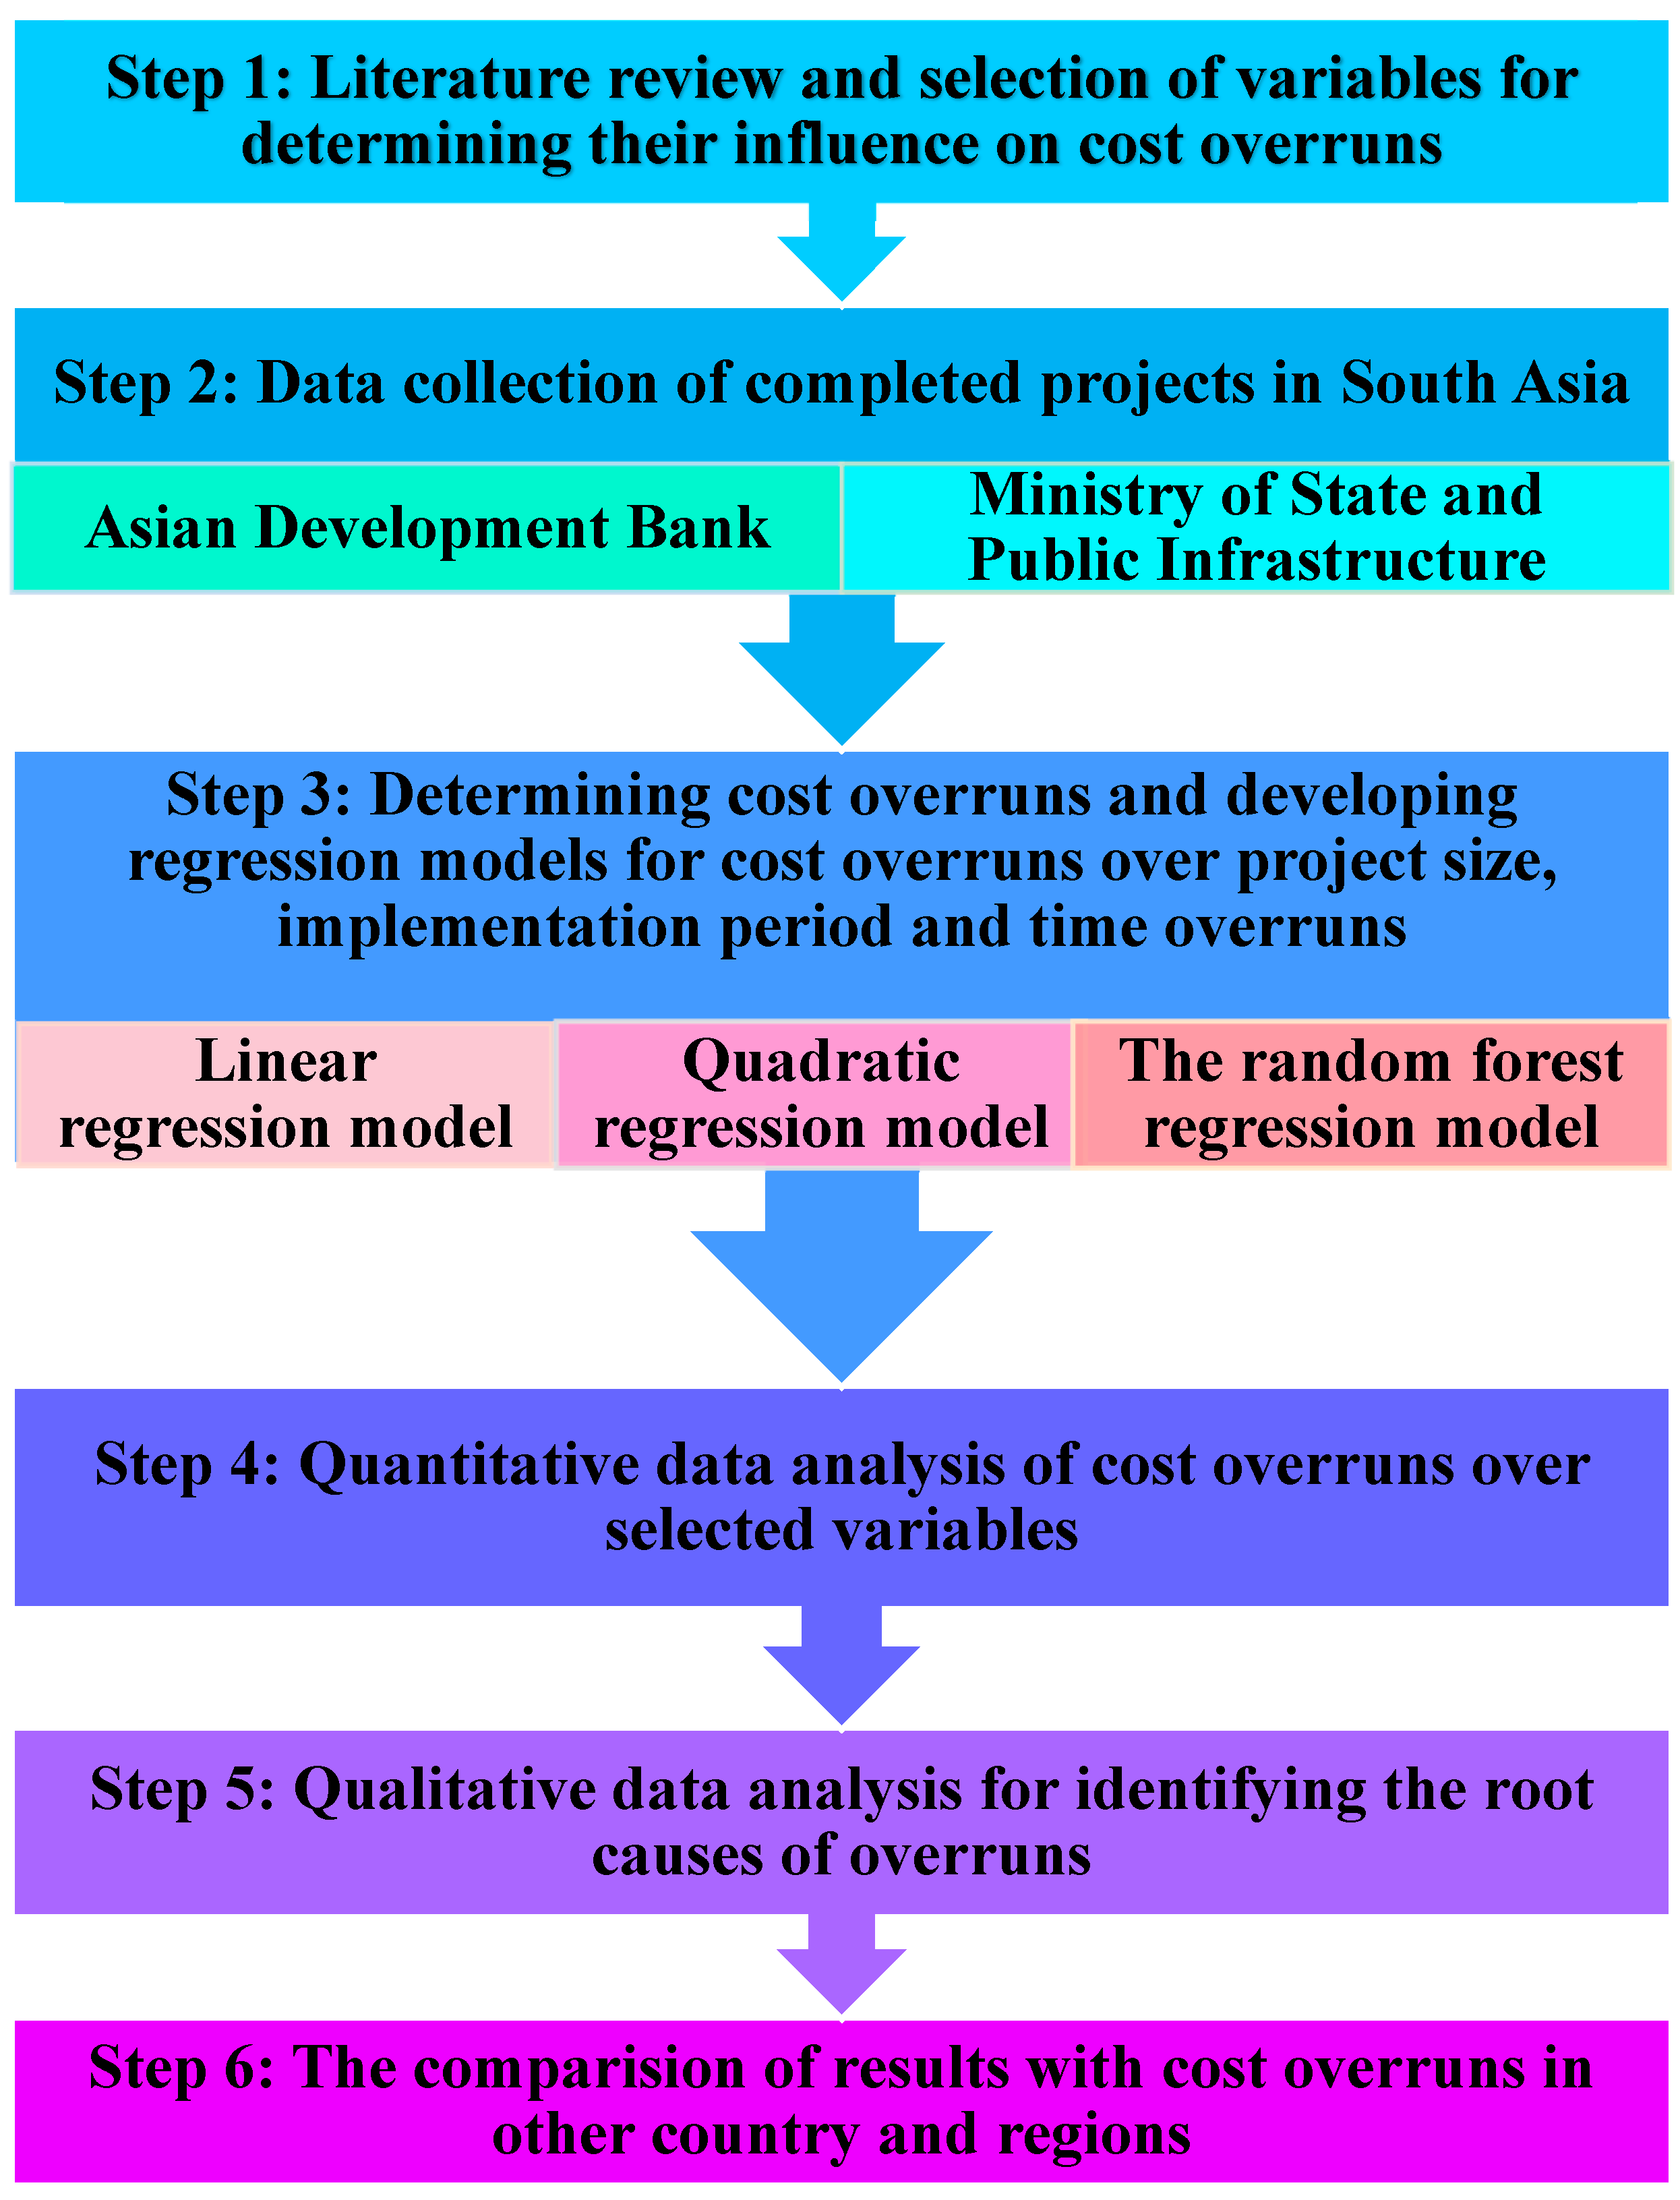
3. Methodology

The methodology for this research consists of six steps as illustrated in Figure 1. The initial step is a comprehensive literature review worldwide regarding cost performance and overruns in different countries and regions to have a better insight into the results of cost overruns and to identify the variables that influence cost overruns. Five potential variables contributing to overruns were identified in the previous study, as stated in the previous paragraph.
The second step is regarding data collection of infrastructure projects from the South Asian region. Completed project reports are found on the website of the Asian Development Bank (ADB). A database is established from the collected projects. For each project, the name of the project, location (country), project type, year of the decision to be built, estimated cost at the beginning of the project, actual cost at the end of a project, the estimated duration of the project, and the implementation period is input in the project database. The further step is to assess the cost performance of infrastructure projects in South Asia and to estimate the percentage of projects, in which cost overruns or underrun occurred using the probabilistic and statistical approach. Further, the cost overruns for different project types and countries are assessed, separately. To examine the variation in cost overruns in different countries in South Asia and for different project types, the probabilistic and statistical approach is applied. Furthermore, different regression models are developed to test and determine the correlation between cost overruns and project size, implementation period, and time overrun. In the previous studies, the focus was on linear regression analysis, only. However, other types of regression functions such as quadratic regression and random forest regression functions are considered in this research. Using the proposed models, quantitative data analysis is conducted, and different regression functions are tested to determine the best-fit function in step 4. This step models and determines the regression functions for the correlation between the cost overruns and three variables, project size, implementation period, and time overrun based on statistical regression analysis (linear and quadratic regression function) and non-parametric algorithmic regression function (random forest regression function). Further, content analysis of completion reports for each project is conducted to identify the root causes of overruns during the project lifecycle as part of step 5. A comparison of the results for cost overruns in the South Asian region to other countries and regions would provide a better insight regarding strategies on how to reduce the overruns and it is implemented in step 6.

3.1. Data Collection

Data are collected from the project completion reports from the website of the Asian Development Bank [61] and the quarterly reports published by the Infrastructure and Project Monitoring Division (IPMD) of the Ministry of State and Public Infrastructure in India (MoSPI) [62]. The completion project reports for each finished project in South Asia can be found on the website of ADB. A database of 138 infrastructure projects is established from the gathered data. In total, 108 projects are pulled out from ADB, and 30 projects are collected from MoS-PI. More than 50% of projects are located in India (83 projects) since it is the largest country in the South Asian region. The location of other infrastructure projects is as follows: Pakistan (16 projects), Bangladesh (12 projects), Sri Lanka (11 projects), Nepal (9 projects), Bhutan (6 projects), and Maldives (1 project). Regarding project types, different infrastructure projects are considered. The distribution of projects according to infrastructure type is as follows: energy sector projects (60 projects), roadways and highways projects (53 projects), rural and urban development projects (17 projects), railways (4 projects), ports (3 projects), and bridge (1 project). In sum, the total cost of completed infrastructure projects in this study is USD 47,029.74 million. The period of project implementation was between 1989 and 2017.

3.2. Methods for Data Analysis

Different statistical tests and regression analysis functions are applied to carry out data analysis. The characteristics of cost performance are shown by histogram and the Bi-nominal test is used for the statistical analysis. A binomial test is a statistical tool that compares if a proportion of a binary variable is equal to some hypothesized value in sampling statistics [63,64]. After the ratio of projects with overruns is assessed, this test is applied to compare whether the projects with cost overruns are equally probable to occur as projects with cost underruns in the South Asian region. In the next step, the influence of two variables, project type and geographical location on cost overruns is examined. For each different project type and each different country, a mean value and standard deviation is assessed. To compare the mean values of cost overruns for different project types and different countries and to point out the differences in the size of cost overruns, one-way ANOVA is applied. One-way ANOVA is a parametric statistical test that compares the means value of several samples to test if the means of one population are significantly different from others [31]. To establish the relation between the cost overruns and the other three variables: the project size, implementation period, and time overruns, three regression analyses are carried out: (1) linear regression analysis, (2) quadratic regression analysis, and (3) random forest regression analysis. Using these three regression analyses, regression functions are developed and tested to find the best-fit function for modeling the correlations between cost overruns and these three variables. Linear regression is a simple statistical method that determines the relation between two variables as a constant and a linear line [65,66]. It is used for analyses of smaller samples. Quadratic regression is also a statistical and parametric method for modeling a relation between two variables that is presented as a parabolic curve [67]. Compared to statistical methods, random forest regression as a nonparametric method that relies on the algorithmic models for simulating data relations is shown as a more efficient tool for interpreting realities [32,68]. Further, the Fisher test (F-test) is applied to select the best fit of regression functions.
Cost overrun is defined as the difference between the cost upon the project’s completion and the estimated cost specified in the project’s initial proposed contract [69]. Mathematically, the computation formula for cost overruns is expressed as follows [70]:
C o s t   o v e r r u n = A c t u a l   c o s t E s t i m a t e d   c o s t E s t i m a t e d   c o s t × 100 %
where actual cost means the total cost at the completion of the project, and estimated cost refers to the initial budget of the project.
If the actual cost of the project is higher than the initially estimated cost, the resulting cost overrun exceeds 0%, signifying that the project has encountered overruns. On the other hand, if the actual cost is lower than the estimated cost, the resultant cost overrun is less than 0%, indicating cost underruns. For example, if the actual cost equals the estimated cost, the cost overrun is equal to 0%.

4. Data Analysis of Cost Overruns in Infrastructure Projects in South Asia

4.1. The Characteristics of Cost Performance

A histogram illustrating the distribution of cost overruns in infrastructure projects across South Asia is depicted in Figure 2. Based on this histogram it is observed that the number of bins between −30% and 0% is the highest compared to other bins. However, it can be noted that there are no other differences between projects in this scope and projects in other scopes in terms of type of project, country, estimated cost, and implementation period. The main characteristics of South Asian infrastructure projects that experience cost overruns:
  • Cost overruns in infrastructure projects in South Asia range from −95.79% to 517.40%;
  • The mean value of cost overruns is 3% (SD = 60.65);
  • In total, 36.96% of projects were affected by cost overruns; while 59.42% of projects were underrun and 3.62% of projects were completed within a budget;
  • The mean value of cost overrun is 46.38% (SD = 80.05) with projects affected by over-runs, while the mean value of cost underruns is −23.80% (SD = 18.79) with projects affected by underruns.
Figure 2. Histogram of cost overrun distribution.
Sustainability 16 11159 g002

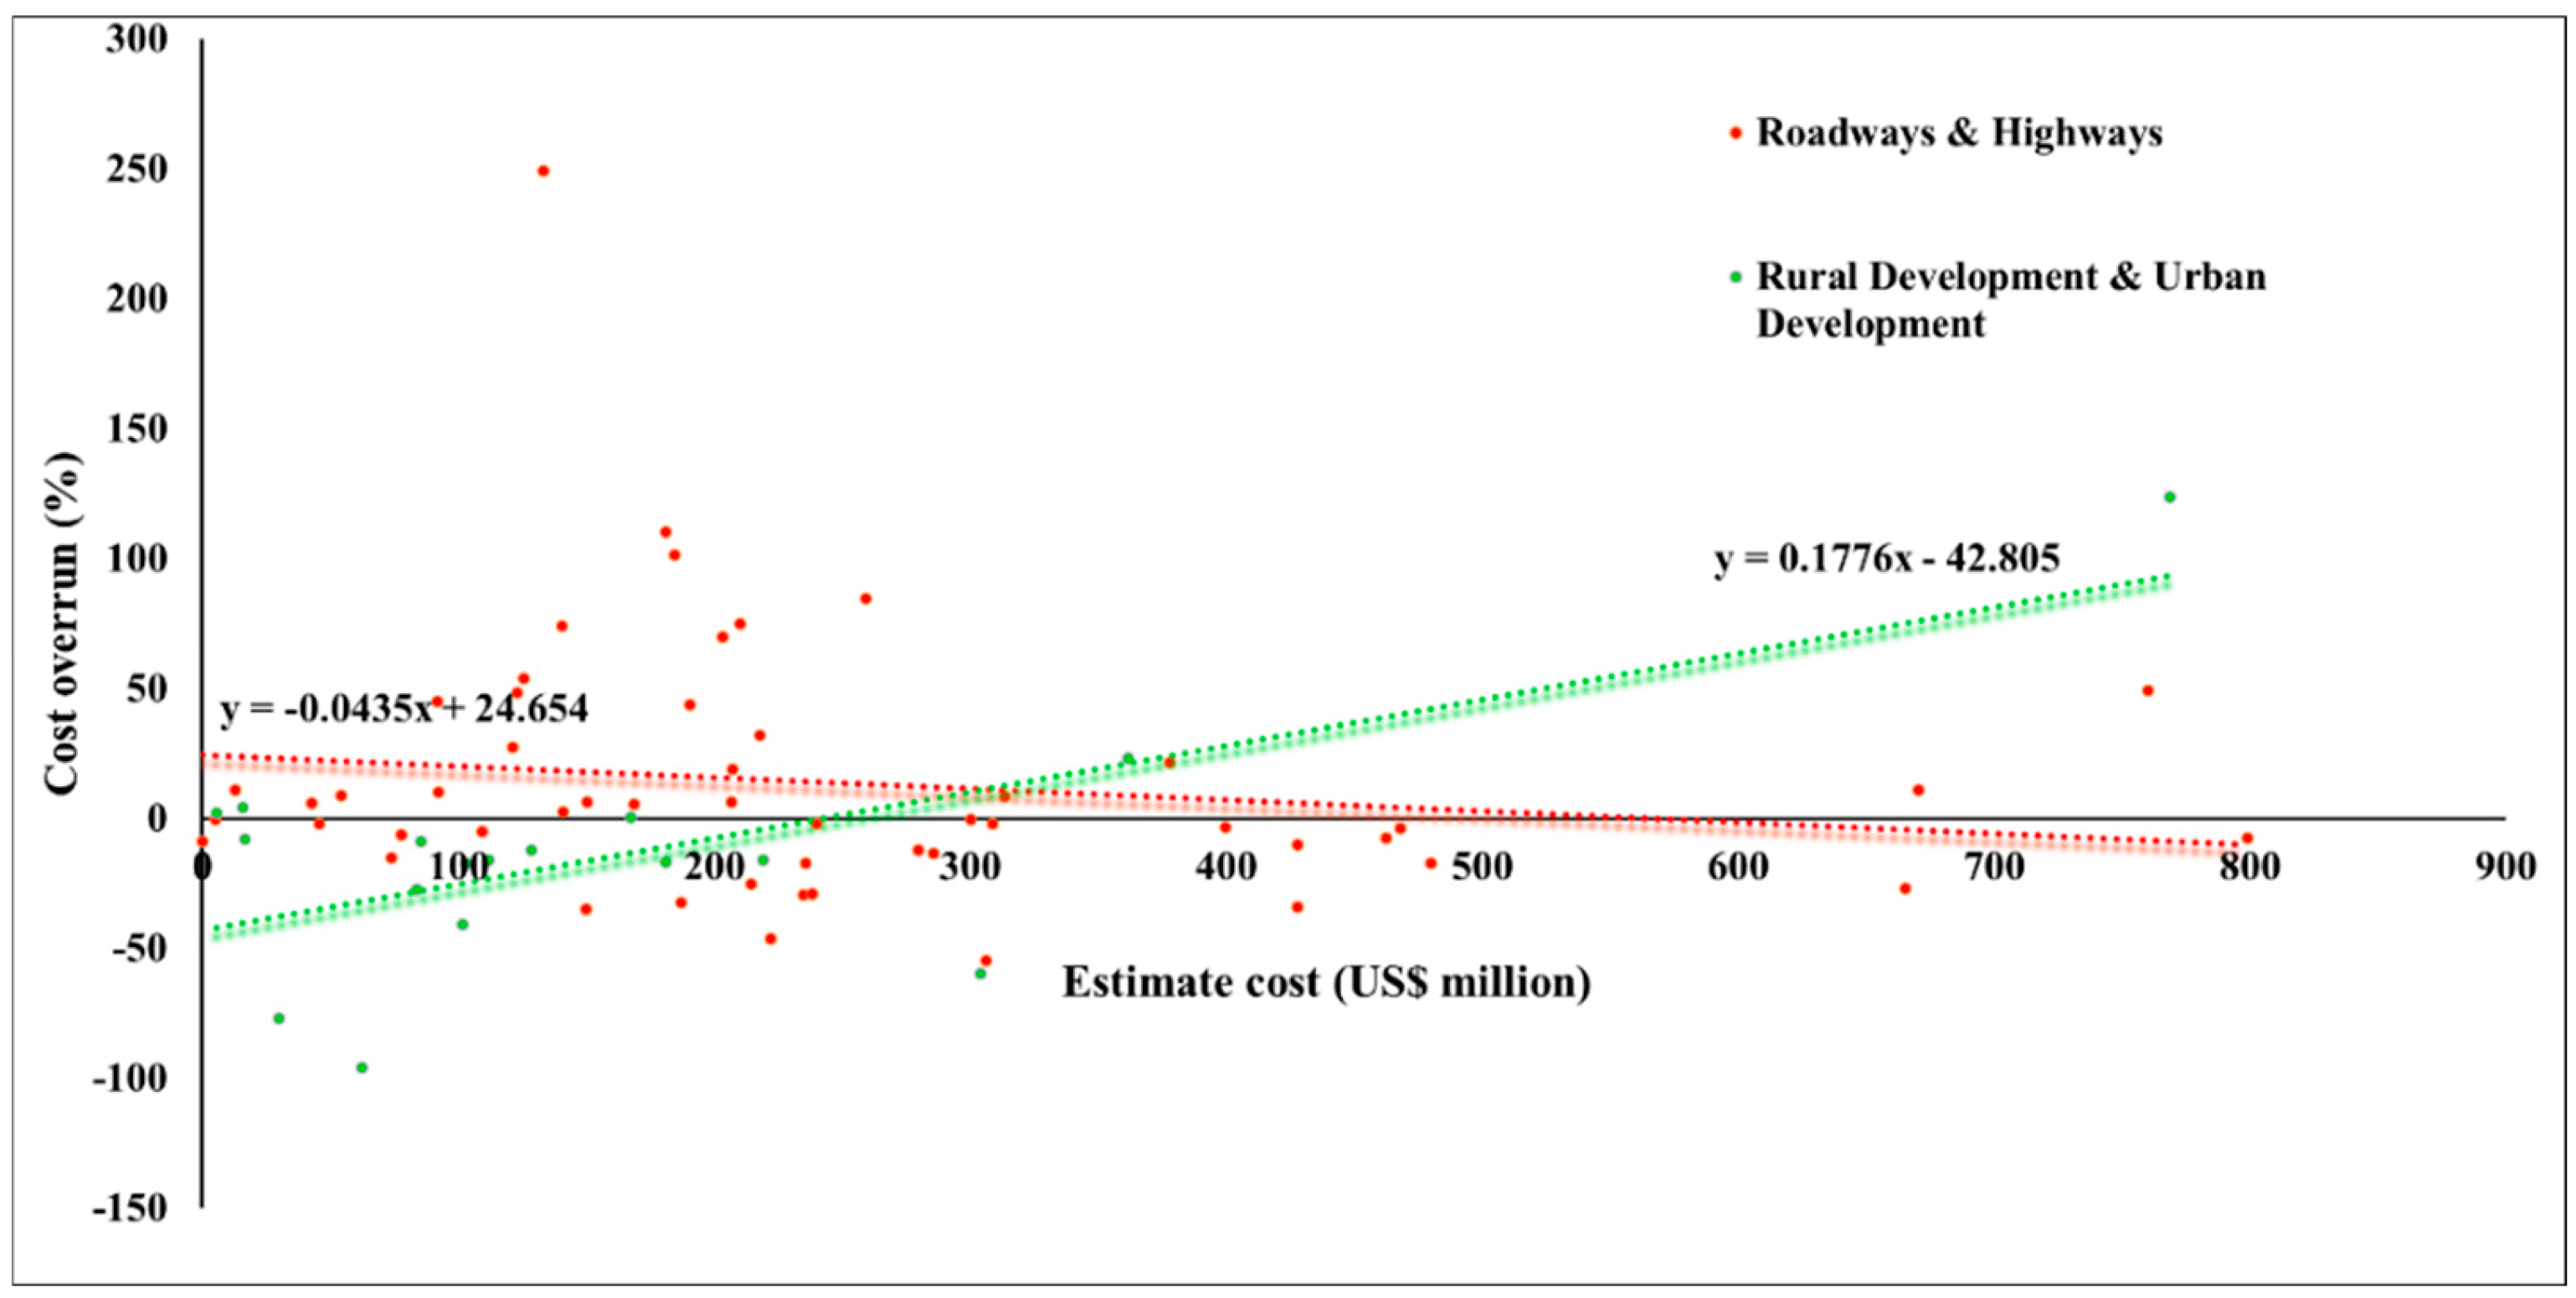
4.2. Cost Overrun over Project Type

It has been noticed in previous studies that different infrastructure projects experience different rates of cost overruns. This study reflects the cost overruns of roadways and highways projects, energy sector projects, and rural and urban development projects since the sample size of other project types is too small to be considered (four railway projects, three port projects, and one bridge project). The results of cost overruns in various types of infrastructure projects show that: the mean value of cost overruns for roadways and highways projects is 13.96% (SD = 49.15); for energy sector projects is −0.80% (SD = 73.88); and for rural and urban development projects is −14.10% (SD = 46.76). Typically, roadways and highway projects have the highest mean value of cost overruns and are greater than zero (One-way ANOVA, F = 1.60175, p = 0.205588). Rural and urban development projects have experienced cost underruns, which is not usually the case for infrastructure projects. Table 2 presents the detailed results of average cost overruns and average cost underruns for each project type.
The key findings which can be extracted from Table 2 are as follows:
  • Infrastructure projects with a cost overrun are as common as projects with cost underrun for energy sector projects (Binominal test, p = 0.0141), for roadways and highways projects (Binominal test, p = 0.5), for rural and urban development projects (Binominal test, p = 0.0728).
  • When it comes to projects that experience cost underruns, the average cost underrun is the lowest for rural and urban sector projects (One-way ANOVA, F = 2.78611, p = 0.068228).

4.3. Cost Overrun over Project Location

There are seven distinct countries in South Asia. The analysis is restricted to Bangladesh, India, Pakistan, and Sri Lanka due to the limited sample size of projects in other countries in South Asia. Less than 10 projects were present in Nepal, Bhutan, and the Maldives. Cost overruns in these countries are not analyzed separately due to the small sample size. The following findings were extracted from an analysis of cost overruns in infrastructure projects in these locations: the mean value of cost overruns for projects in Bangladesh is −1.07% (SD = 29.47), for Indian projects is 13.20% (SD = 73.10), for projects in Pakistan is −33.17% (SD = 31.16), and for projects in Sri Lanka is −3.19% (SD = 21.97). The findings indicate that India’s projects have the highest average cost overruns when compared to other countries (One-way ANOVA, F = 2.51616, p = 0.061606). Cost overruns have been a common problem in projects in Bangladesh, Sri Lanka, and Pakistan. Table 3 displays the additional analysis for the average and standard deviation of cost overruns and cost underruns. Taking into account the various locations for projects, the key conclusions are:
  • There is a significant difference in cost underruns for projects in Pakistan since the average cost underrun is the lowest compared to other countries (One-way ANOVA, F = 3.87546, p = 0.012673).
  • The majority of projects were completed at lower costs than estimated.
  • There are only two projects in Pakistan that have experienced cost overruns.
Table 3. Cost overrun and underrun in different countries.
Location of ProjectsNumber of OverrunMean ValueSDNumber of UnderrunMean ValueSD
Bangladesh623.1121.786−25.265.76
India3559.8793.2948−20.8314.87
Pakistan23.294.4514−38.2729.77
Sri Lanka418.3620.177−15.4910.71
Total:47 75

4.4. Cost Overrun over Project Size

To generate the correlation between the project size and cost overruns for infrastructure projects in South Asia, the regression analysis is conducted for three types of functions, where the F-test is used as a criterion to find the best-fit function. According to the F-test value, there is no linear correlation between the project size and cost overruns in South Asian infrastructure projects (F-test, F = 0.2766, p = 0.5997). This means that the linear regression function is not suitable for modeling this relation. In the case of the quadratic regression analysis, the graph is illustrated in Figure 3. Mathematically, it is determined that there is no correlation for the quadratic regression to model the relation between the project size and cost overruns (F-test, F = 0.888). In contrast to parametric statistical regressions, the random forest regression is shown as a good fit to model the correlation between the project size and cost overruns (F-test, F = 231.52). Figure 4 shows the model based on the random forest regression that is developed in Python. Based on the F-test value, the random forest regression is the most suitable and accurate, while there is no correlation in the case of the linear and quadratic regression analysis.
Moreover, the statistical relationship between project size and cost overruns is examined more thoroughly for various project types. Only three project types are analyzed due to the limited number of some project types. Two types of projects have a statistical relationship between project size and cost overruns, as revealed by the linear regression analysis. Precisely, there is a weak correlation between cost overrun over project size for roadways and highways projects (F-test, F = 1.3753, p = 0.2463), and for rural and urban development projects (F-test, F = 14.6677, p = 0.0016).
On the contrary, there is no statistical relationship observed for energy sector projects (F-test, F = 0.2329, p = 0.6311). Figure 5 presents a chart of the cost overrun over project size for roadways and highways projects and rural and urban development projects. Statistically, the regression line for the roadways and highways projects is as follows:
ΔC = −0.0435 × E + 24.654,
in which, ΔC means cost overrun, and E means the estimated cost of the project (project size).
From the equation, it can be concluded that there is a negative relationship between cost overrun and the size of projects for roadways and highways projects. This means that the smaller projects are prone to higher cost overruns and the larger projects are prone to lower cost overruns.
Subsequently, the mathematical relationship between cost overruns and estimated cost for the rural and urban development projects is:
ΔC = 0.1776 × E − 42.805,
There is a positive relationship between cost overruns and project size in rural and urban development projects. Larger rural and urban development projects are prone to higher cost overruns.
Furthermore, the correlation between project size and cost overruns is particularly considered for India since the sample size for other countries is minor. According to the F-test (F = 0.1712, p = 0.6800), there is no statistical relationship between the projected costs and the actual costs for projects in India.

4.5. Cost Overrun over Project Implementation Period

A linear regression analysis is conducted to investigate the statistical relationship that exists between the duration of the implementation of the project and cost overruns. There is a linear correlation between the implementation period and cost overruns (F-test, F = 2.1131, p = 0.1483). The plot of the statistical relationship between the duration of the project and cost overruns is depicted in Figure 6. From Figure 6, the mathematical regression line equation is given as follows:
ΔC = 0.2341 × T − 16.995,
in which, ΔC means cost overrun, and T is the implementation period of the project given in months.
There is a positive correlation between the implementation period and cost overruns which means that longer projects are more exposed to cost overruns. Further, the quadratic regression analysis model is developed. The results confirm that there is a quadratic correlation between the implementation period and cost overruns (F-test, F = 1.354). Figure 7 illustrates the developed model, and the equation of the model is as follows:
ΔC = 0.0024 × T2 − 0.2668 × T + 5.4510,
Figure 8 highlights the random forest regression analysis function (F-test, F = 50.62). According to the value of the F-test, the random forest regression analysis function is the best fit in this case since all regression analyses can provide a model.
Considering different project types, it is demonstrated that there is no correlation between the duration of project implementation and the probability of budget overruns for energy sector projects (F-test, F = 0.1179, p = 0.7325). However, it is found that there is a correlation between the duration of the project implementation period and cost overruns in roadways and highways projects (F-test, F = 1.3436, p = 0.2517), as well as in the case of rural and urban development initiatives (F-test, F = 2.2651, p = 0.1531). Figure 9 displays a graphical presentation of the dependency between the implementation period and cost overruns for different project types. Mathematically, the regression line equation for the roadways and highways projects is:
ΔC = 0.312 × T − 13.988,
In the case of rural and urban development projects, the regression line equation is given as follows:
ΔC = 0.464 × T − 54.215,
In the next step, a regression analysis on projects across South Asian countries is conducted in order to examine if there is a statistical relationship between the time for project implementation and cost overruns. The analysis was limited to projects in India due to the small number of projects and it reveals no statistically significant relationship (F-test, F = 0.7711, p = 0.3825).

4.6. Cost Overrun over Time Overrun

The purpose of conducting a different regression analysis is to investigate the best-fit model for the relation between cost and time overruns. Based on the findings, it can be concluded that there is a significant statistical correlation between cost overruns and time overruns (F-test, F = 2.0276, p = 0.1567). The scatter plots that illustrate these two variables are shown in Figure 10, which represents the data. The given relationship between time overruns and cost overruns is presented with the regression line as follows:
ΔC = 0.08 × ΔT − 3.9331,
in which, ΔT determines time overruns, and ΔC determines cost overruns.
Regarding the quadratic regression analysis, the model is developed since there is a quadratic correlation between the cost overruns and time overruns (F-test, F = 5.156). According to the F-test value, it can be concluded that a quadratic regression function is more suitable compared to the linear regression function. The graphical representation of the quadratic regression function for the cost overrun over time overrun is given in Figure 11. In addition, the mathematical equation to describe this quadratic regression function is as follows:
ΔC = −0.00075 × ΔT2 + 0.3864 × ΔT − 18.5685,
However, the most suitable regression function is the random forest regression due to the highest value of the F-test (F-test, F = 352.33). Figure 12 depicts the random forest regression for the given two variables.

4.7. Summary of Results

The mean value of cost overruns in South Asia is 3%. The findings show that cost overruns depend on project types and geographical location. Further, the results show that there is no linear and quadratic correlation between project size and cost overruns for infrastructure projects in Asia; nevertheless, the random forest regression analysis has provided the relation between the project size and cost overruns. On the contrary, there is a linear correlation in the case of roadway and highway projects in which cost overruns decrease by 0.04% for the rise in every USD 1 million of the estimated cost of the project, and rural and urban projects, where cost overruns increase of 0.177% with the rise in every USD 1 million.
There is a linear and quadratic correlation between cost overruns and the implementation period. When the F-test is compared in these models, it is concluded that the linear regression model better fits the correlation between cost overrun and implementation period. In the linear regression analysis, cost overruns increase 0.234% for every month during the implementation period for projects in South Asia. However, it is demonstrated that the best-fit regression function is the random forest regression function according to F-test.
Regarding the correlation between cost and time overruns, the model based on linear and quadratic regression analysis is developed and tested. The results show that the quadratic regression model is more suitable than the linear regression model since the value of the F-test is higher. Similarly to the previous variables, the most suitable is the random forest regression function due to the highest value of the F-test.

5. The Causes of Cost Overruns

To investigate the root causes for cost overruns, qualitative data analysis with the aid of NVivo software is carried out. NVivo is a software that carries out data analysis from the imported various forms of qualitative data such as text files, audio, video, images, social media content, and survey data [71,72]. After the qualitative data analysis is carried out, NVivo provides powerful visualization tools such as model plots, word clouds, and matrix analysis to support researchers in intuitively understanding the current trends and correlations of the data and to quantitatively represent it [73].
The completion project report from the ADB website contains a paragraph related to the causes of overruns. Using NVivo software, a content analysis of this paragraph is performed by coding the text and establishing nodes. Nodes are coded from the text and each node is related to one specific cause of overruns. In total, seven nodes are established from the completion project reports, which means seven causes of overruns are identified. According to the frequency of the causes that appear in the project completion reports, a pie chart, and visual tool, are provided to show results in Figure 13. The root causes of cost overruns in large-scale projects in South Asia are visually presented in a pie chart, where effective proportions of each root cause make up a whole chart. The root causes of overruns were: the increase in the cost of resources, the increased cost of the contract price, the increased cost of consulting services, the increased cost of land acquisition and resettlement, the changes in the currency exchange rate, the increased cost of implementation, and loan interest. The most common cause of cost overruns is due to the fluctuation of prices of resources. The increased cost of resources includes the increased cost of materials and equipment and the increased cost of labor. Due to the long duration of infrastructure projects, the fluctuation in prices of materials, equipment, and labor are common. This type of uncertainty should be included in the initial assessment of the budget.

6. Discussions, Limitations, and Comparison of Results in South Asia with Worldwide

Data are gathered from the completion reports from the Asian Development Bank and Infrastructure and Project Monitoring Division. The average cost overrun for infrastructure projects in South Asia is 3.00%. This is lower than the average cost overruns in Belgium with 10.26% [18], the Netherlands with 16.50% [10], China with 22.24% [51], and Ethiopia with 18% [52]. Besides transportation projects, energy sector projects, port projects as well as rural and urban development projects, are included in cost overruns assessment which was the main factor that contributed to the lower value of cost overruns in South Asia. Comparing the average cost overruns across several South Asian countries, the highest average cost overrun of 13.20% occurred in India. This value is similar to the mean value of cost overruns in the Netherlands and Belgium.
When different types of infrastructure projects are considered, road and highway construction projects in South Asia experienced a cost overrun of 13.96%, which is lower than in China with 29% [51], Ethiopia with 18% [52], South Korea with 50% [46], and the Netherlands with 16.8% [10]. Energy sector projects in South Asia experienced an overrun of −0.80%. Compared to other similar projects, it aligns with the Asian context, in which the average cost overrun is 0.75% [50]. The cause of lower cost overruns is influenced by factors such as available resources, the level of economic development, and the quantity of projects within the region’s energy sector.
Based on the analysis of the gathered data, it is shown with confidence that there is no linear or quadratic relationship between project size and cost overrun in South Asian infrastructure projects. This finding is consistent with the previous findings of Park and Papadopoulou [55] since their findings comprehend the absence of a linear statistical relationship between project size and cost overrun. However, a relation between the project size and cost overruns can be established with the random forest regression analysis. Furthermore, the results in the case of different project types show that the linear correlation between the project size and cost overruns appear in roadways and highways projects and rural and urban development projects. Generally, this finding is in alignment with the earlier research conducted by Andrić et al. [50].
Further, there is a linear statistical dependency between the implementation period and cost overruns. This result is in line with the conclusions drawn by Park and Papadopoulou [55], Andrić et al. [50], and Cantarelli et al. [10], who acknowledged a linear statistical link between project implementation period and cost overruns, suggesting that both shorter and longer implementation periods could lead to overruns. Besides the linear regression, quadratic and random forest regression can be established to model the relation between the implementation period and cost overruns.
Finally, the impact of time overruns on the size of cost overruns is investigated. It is found a linear dependency between cost overruns and time overruns in infrastructure projects in South Asia. Projects with higher time overruns contribute to higher cost overruns. This trend is in line with the findings of Narayanan et al. [53]. Moreover, quadratic regression and random forest regression functions are developed between the time and cost overruns.
The main focus of this study is to evaluate cost performance in the South Asian region. As a result, the findings provide valuable insight into trends in overruns for this particular region. This information is significant for stakeholders involved in infrastructure projects in the South Asian countries, including India, Pakistan, Nepal, Bangladesh, Sri Lanka, Bhutan, and the Maldives. The first limitation of this study arises from the number of projects gathered in specific countries. In total, 138 infrastructure projects were collected in South Asia, which is quite a large sample. When examining individual countries, the number of projects from other nations than India is relatively small, and it presents a certain limitation due to the small size of the sample. Secondly, the sample sizes for some infrastructure types like railways, ports, and bridges are restricted because of the small number of these projects. In addition, other types of infrastructure projects such as tunnels, airports, and water supply systems are not included in this study since the relevant information is not found. The third limitation of this study is that some other parameters that can be significant are not considered for the influence on the cost performance and overruns.

7. Conclusions

This study provides a cost performance analysis in South Asian infrastructure projects, examining the influence of five key variables: project type, geographical location, project size, the implementation period, and time overruns on cost overruns. In addition, novel regression functions are applied to model the relations between the variables and cost overruns instead of the traditional approach using the linear regression analysis function. The conclusions drawn from this study are that cost overruns are more common in roadways and highways than in the energy sector projects, and rural and urban development projects. India is the country with the highest cost overruns in South Asia. There is no linear and quadratic statistical correlation between project size and cost overruns in the South Asia region for overall projects. However, there is a linear dependency between project size and cost overruns for the cases of roadways and highways projects and rural and urban development projects, and the complexity between the cost overruns and project size can be presented using the nonparametric approach, the random forest regression function. Concerning the duration of projects, a linear statistical correlation exists between the implementation period and cost overruns for projects in South Asia, highways and roadways projects, and rural and urban development projects. The random forest regression function is the most suitable function to model the correlation between cost overrun over the project size, the implementation period, and time overruns compared to the linear and quadratic regression analysis. In general, this study demonstrates that the nonparametric algorithmic method based on the machine learning concept is more efficient in describing the complexity of the relation between cost overruns over project size, implementation period, and time overruns compared to parametric statistical methods.
It is a piece of valuable information for project stakeholders in terms of the size of cost overruns in South Asia. With this information, project stakeholders can develop a more efficient strategy on how to reduce cost overrun and mitigate the potential risks in the initial phases of projects. To predict the project budget and overruns in future projects, a random forest regression analysis function can be used for this purpose since it provides the most suitable prediction function. From the mathematical perspective, the study demonstrates the advantage of nonparametric functions based on machine learning techniques for modeling the dependency between cost overruns and project size, implementation period, and time overrun compared to the traditional statistical approach.
Regarding future research, there are a few directions. Since this study is based on determining the cost overruns in South Asian infrastructure projects, one of the possibilities for further investigations is to identify the causes that contributed to cost overruns. The other direction is to focus on delays in these infrastructure projects and to determine the size of time overruns and causes in infrastructure projects in South Asia. Besides the South Asian region, there is a potential interest in the magnitude of cost overruns and delays in other fast-developing regions in Asia. When it comes to mathematical models for investigating the correlations between cost overruns and independent variables, a novel approach based on the mixed method functions can be developed and applied in the current research on cost and time overruns.

Author Contributions

The conceptualization of the research and data collection are conducted by J.M.A. and S.L. Methodology is developed by J.M.A. Data analysis is carried out by J.M.A., S.L., Y.C. and B.S. Writing the draft is carried out by J.M.A. The funding is provided by J.M.A. All authors have read and agreed to the published version of the manuscript.

Funding

This research has received the internal funding: XJTLU Research Development Fund, grant number RDF-23-01-003.

Institutional Review Board Statement

Not applicable.

Informed Consent Statement

Not applicable.

Data Availability Statement

Data are available on request from the corresponding author.

Conflicts of Interest

The authors declare no conflicts of interest.

References

  1. UNECE. The Transformative Impact of Infrastructure for Sustainable Development. Available online: https://unece.org/economic-cooperation-and-integration/news/transformative-impact-infrastructure-sustainable (accessed on 22 November 2024).
  2. Thacker, S.; Adshead, D.; Fay, M.; Hallegatte, S.; Harvey, M.; Meller, H.; O’Regan, N.; Rozenberg, J.; Watkins, G.; Hall, J.W. Infrastructure for sustainable development. Nat. Sustain. 2019, 2, 324–331. [Google Scholar] [CrossRef]
  3. Wagner, B.; De Gooyert, V.; Veeneman, W. Sustainable development goals as accountability mechanism? A case study of Dutch infrastructure agencies. J. Responsible Technol. 2023, 14, 100058. [Google Scholar] [CrossRef]
  4. Cantarelli, C.C.; Flyvbjerg, B.; Buhl, S.L. Geographical variation in project cost performance: The Netherlands versus worldwide. J. Transp. Geogr. 2012, 24, 324–331. [Google Scholar] [CrossRef]
  5. Love, P.E.; Sing, C.P.; Wang, X.; Irani, Z.; Thwala, D.W. Overruns in transportation infrastructure projects. Struct. Infrastruct. Eng. 2014, 10, 141–159. [Google Scholar] [CrossRef]
  6. Locatelli, G.; Invernizzi, D.C.; Brookes, N.J. Project characteristics and performance in Europe: An empirical analysis for large transport infrastructure projects. Transp. Res. Part A Policy Pract. 2017, 98, 108–122. [Google Scholar] [CrossRef]
  7. Bhargava, A.; Anastasopoulos, P.C.; Labi, S.; Sinha, K.C.; Mannering, F.L. Three-stage least-squares analysis of time and cost overruns in construction contracts. J. Constr. Eng. Manag. 2010, 136, 1207–1218. [Google Scholar] [CrossRef]
  8. Gao, N.; Touran, A. Cost overruns and formal risk assessment program in US rail transit projects. J. Constr. Eng. Manag. 2020, 146, 05020004. [Google Scholar] [CrossRef]
  9. Dantata, N.A.; Touran, A.; Schneck, D.C. Trends in US Rail Transit Project Cost Overrun; Transport Research Board (TRB): Washington, DC, USA, 2006. [Google Scholar]
  10. Cantarelli, C.C.; Molin, E.J.; van Wee, B.; Flyvbjerg, B. Characteristics of cost overruns for Dutch transport infrastructure projects and the importance of the decision to build and project phases. Transp. Policy 2012, 22, 49–56. [Google Scholar] [CrossRef]
  11. Love, P.E.; Zhou, J.; Edwards, D.J.; Irani, Z.; Sing, C.P. Off the rails: The cost performance of infrastructure rail projects. Transp. Res. Part A Policy Pract. 2017, 99, 14–29. [Google Scholar] [CrossRef]
  12. Terrill, M.; Emslie, O.; Moran, G. The Rise of Megaprojects; Geattan Institute: Carlton, Australia, 2020. [Google Scholar]
  13. Love, P.E.; Ahiaga-Dagbui, D.D.; Irani, Z. Cost overruns in transportation infrastructure projects: Sowing the seeds for a probabilistic theory of causation. Transp. Res. Part A Policy Pract. 2016, 92, 184–194. [Google Scholar] [CrossRef]
  14. Kostka, G.; Anzinger, N. Large infrastructure projects in Germany: A cross-sectoral analysis. In Large Infrastructure Projects in Germany: Between Ambition and Realities; Springer: Berlin/Heidelberg, Germany, 2016; pp. 15–38. [Google Scholar]
  15. Steininger, B.I.; Groth, M.; Weber, B.L. Cost overruns and delays in infrastructure projects: The case of Stuttgart 21. J. Prop. Invest. Financ. 2021, 39, 256–282. [Google Scholar] [CrossRef]
  16. Cavalieri, M.; Cristaudo, R.; Guccio, C. On the magnitude of cost overruns throughout the project life-cycle: An assessment for the Italian transport infrastructure projects. Transp. Policy 2019, 79, 21–36. [Google Scholar] [CrossRef]
  17. Marella, G.; Antoniucci, V. Time Overrun in Public Works—Evidence from North-East Italy. Sustainability 2019, 11, 7057. [Google Scholar] [CrossRef]
  18. Molinari, L.; Haezendonck, E.; Mabillard, V. Cost overruns of Belgian transport infrastructure projects: Analyzing variations over three land transport modes and two project phases. Transp. Policy 2023, 134, 167–179. [Google Scholar] [CrossRef]
  19. Pham, H.; Luu, T.V.; Kim, S.Y.; Vien, D.T. Assessing the impact of cost overrun causes in transmission lines construction projects. KSCE J. Civ. Eng. 2020, 24, 1029–1036. [Google Scholar] [CrossRef]
  20. Akinradewo, O.; Aigbavboa, C.; Oke, A.; Coffie, H.; Ogunbayo, B. Unearthing Causative Factors of Cost Overrun on Ghanaian Road Projects. Balt. J. Road Bridge Eng. 2022, 17, 171–188. [Google Scholar] [CrossRef]
  21. Mahmud, A.T.; Ogunlana, S.O.; Hong, W.T. Understanding the dynamics of cost overrun triggers in highway infrastructure projects in Nigeria: A system thinking modelling approach. J. Financ. Manag. Prop. Constr. 2022, 27, 29–56. [Google Scholar] [CrossRef]
  22. Callegari, C.; Szklo, A.; Schaeffer, R. Cost overruns and delays in energy megaprojects: How big is big enough? Energy Policy 2018, 114, 211–220. [Google Scholar] [CrossRef]
  23. Lovrinčević, M.; Vukomanović, M.; Perić, R. Influence of Technical Reasons on Cost Overruns of Infrastructural Projects: A Sustainable Development Perspective. Sustainability 2024, 16, 9413. [Google Scholar] [CrossRef]
  24. Flyvbjerg, B.; Skamris Holm, M.K.; Buhl, S.L. What causes cost overrun in transport infrastructure projects? Transp. Rev. 2004, 24, 3–18. [Google Scholar] [CrossRef]
  25. Huo, T.; Ren, H.; Cai, W.; Shen, G.Q.; Liu, B.; Zhu, M.; Wu, H. Measurement and dependence analysis of cost overruns in megatransport infrastructure projects: Case study in Hong Kong. J. Constr. Eng. Manag. 2018, 144, 05018001. [Google Scholar] [CrossRef]
  26. Trading Economics, South Asia—Population, Total. Available online: https://tradingeconomics.com/south-asia/population-total-wb-data.html (accessed on 25 November 2024).
  27. MoSPI—Ministry of Statistics and Programme Implementation. Project Implementation Status Report of Central Sector Projects Costing Rs. 150 Crore and Above, Infrastructure and Project Monitoring Division, July–September 2017, Sardar Patel Bhavan, Sansad Marg, New Delhi; Government of India: New Delhi, India, 2017.
  28. Iyer, K.C.; Jha, K.N. Critical factors affecting schedule performance: Evidence from Indian construction projects. J. Constr. Eng. Manag. 2006, 132, 871–881. [Google Scholar] [CrossRef]
  29. Hansen, W.; Johansen, B.G. Regional repercussions of new transport infrastructure investments: An SCGE model analysis of wider economic impacts. Res. Transp. Econ. 2017, 63, 38–49. [Google Scholar] [CrossRef]
  30. Rehman, F.U.; Islam, M.M.; Miao, Q.; Metwally AS, M. Does transport infrastructure make South Asian economies growth more inclusive? An application of a new transportation infrastructure index. Res. Transp. Bus. Manag. 2023, 49, 101013. [Google Scholar] [CrossRef]
  31. Ang AH, S.; Tang, W.H. Probability Concepts in Engineering: Emphasis on Applications in Civil and Environmental Engineering; Wiley: New York, NY, USA, 2007. [Google Scholar]
  32. Breiman, L. Random forests. Mach. Learn. 2001, 45, 5–32. [Google Scholar] [CrossRef]
  33. Phillips, M.; Lu, J. A quick look at NVivo. J. Electron. Resour. Librariansh. 2018, 30, 104–106. [Google Scholar] [CrossRef]
  34. Flyvbjerg, B.; Skamris Holm, M.K.; Buhl, S.L. How common and how large are cost overruns in transport infrastructure projects? Transp. Rev. 2003, 23, 71–88. [Google Scholar] [CrossRef]
  35. Odeck, J. Cost overruns in road construction—What are their sizes and determinants? Transp. Policy 2004, 11, 43–53. [Google Scholar] [CrossRef]
  36. Moura, H.P.; Teixeira, J.C. Dealing with Cost and time in the Portuguese Construction Industry; International Council for Research &Innovation in Building & Construction: Queensland, Australia, 2007. [Google Scholar]
  37. Lundberg, M.; Jenpanitsub, A.; Pyddoke, R. Cost Overruns in Swedish Transport Projects; Centre for Transport Studies: Stockholm, Sweden, 2011. [Google Scholar]
  38. Makovšek, D.; Tominc, P.; Logožar, K. A cost performance analysis of transport infrastructure construction in Slovenia. Transportation 2012, 39, 197–214. [Google Scholar] [CrossRef]
  39. Sovacool, B.K.; Gilbert, A.; Nugent, D. An international comparative assessment of construction cost overruns for electricity infrastructure. Energy Res. Soc. Sci. 2014, 3, 152–160. [Google Scholar] [CrossRef]
  40. Catalão, F.P.; Cruz, C.O.; Sarmento, J.M. Determinants of cost deviations and overruns in UK transport projects. Proc. Inst. Civ. Eng.-Transp. 2021, 176, 312–322. [Google Scholar] [CrossRef]
  41. Catalão, F.P.; Cruz, C.O.; Sarmento, J.M. The determinants of cost deviations and overruns in transport projects, an endogenous models approach. Transp. Policy 2019, 74, 224–238. [Google Scholar] [CrossRef]
  42. De Marco, A.; Narbaev, T. Factors of schedule and cost performance of tunnel construction megaprojects. Open Civ. Eng. J. 2021, 15, 38–49. [Google Scholar] [CrossRef]
  43. Berechman, J.; Wu, Q. Cost Overruns Risk Analysis in Transportation Infrastructure Investments; Phelps Centre for the Study of Government and Business, Sauder School of Business, University of British Columbia: Vancouver, BC, Canada, 2006. [Google Scholar]
  44. Love, P.E.; Ahiaga-Dagbui, D.; Welde, M.; Odeck, J. Light rail transit cost performance: Opportunities for future-proofing. Transp. Res. Part A Policy Pract. 2017, 100, 27–39. [Google Scholar] [CrossRef]
  45. Gao, N.; Touran, A. Cost overruns in US Rail Transit Projects: A statistical analysis. In Construction Research Congress; American Society of Civil Engineers: Reston, VA, USA, 2020; pp. 593–601. [Google Scholar]
  46. Lee, J.K. Cost overrun and cause in Korean social overhead capital projects: Roads, rails, airports, and ports. J. Urban Plan. Dev. 2008, 134, 59–62. [Google Scholar] [CrossRef]
  47. Singh, R. Delays and cost overruns in infrastructure projects: Extent, causes and remedies. Econ. Political Wkly. 2010, 45, 43–54. [Google Scholar]
  48. Senouci, A.; Ismail, A.; Eldin, N. Time delay and cost overrun in Qatari public construction projects. Procedia Eng. 2016, 164, 368–375. [Google Scholar] [CrossRef]
  49. Al-Hazim, N.; Salem, Z.A.; Ahmad, H. Delay and cost overrun in infrastructure projects in Jordan. Procedia Eng. 2017, 182, 18–24. [Google Scholar] [CrossRef]
  50. Andrić, J.M.; Mahamadu, A.M.; Wang, J.; Zou, P.X.; Zhong, R. The cost performance and causes of overruns in infrastructure development projects in Asia. J. Civ. Eng. Manag. 2019, 25, 203–214. [Google Scholar] [CrossRef]
  51. Rabe, W.; Kostka, G.; Habich-Sobiegalla, S. Socio-economic development and infrastructure cost performance in China: Comparing transport and energy sectors. J. Curr. Chin. Aff. 2020, 49, 185–206. [Google Scholar] [CrossRef]
  52. Melaku Belay, S.; Tilahun, S.; Yehualaw, M.; Matos, J.; Sousa, H.; Workneh, E.T. Analysis of cost overrun and schedule delays of infrastructure projects in low-income economies: Case studies in Ethiopia. Adv. Civ. Eng. 2021, 2021, 4991204. [Google Scholar] [CrossRef]
  53. Narayanan, S.; Kure, A.M.; Palaniappan, S. Study on time and cost overruns in mega infrastructure projects in India. J. Inst. Eng. (India) Ser. A 2019, 100, 139–145. [Google Scholar] [CrossRef]
  54. Verweij, S.; van Meerkerk, I.; Korthagen, I.A. Reasons for contract changes in implementing Dutch transportation infrastructure projects: An empirical exploration. Transp. Policy 2015, 37, 195–202. [Google Scholar] [CrossRef]
  55. Park, Y.I.; Papadopoulou, T.C. Causes of cost overruns in transport infrastructure projects in Asia: Their significance and relationship with project size. Built Environ. Proj. Asset Manag. 2012, 2, 195–216. [Google Scholar] [CrossRef]
  56. Flyvbjerg, B.; Holm, M.S.; Buhl, S. Underestimating costs in public works projects: Error or lie? J. Am. Plan. Assoc. 2002, 68, 279–295. [Google Scholar] [CrossRef]
  57. Love, P.E.; Sing, M.C.; Ika, L.A.; Newton, S. The cost performance of transportation projects: The fallacy of the Planning Fallacy account. Transp. Res. Part A Policy Pract. 2019, 122, 1–20. [Google Scholar] [CrossRef]
  58. Cantarelli, C.C.; Van Wee, B.; Molin, E.J.; Flyvbjerg, B. Different cost performance: Different determinants? The case of cost overruns in Dutch transport infrastructure projects. Transp. Policy 2012, 22, 88–95. [Google Scholar] [CrossRef]
  59. Skitmore, R.M.; Ng, S.T. Forecast models for actual construction time and cost. Build. Environ. 2003, 38, 1075–1083. [Google Scholar] [CrossRef]
  60. Moghayedi, A.; Windapo, A. Modelling the uncertainty of cost and time in highway projects. Infrastruct. Asset Manag. 2022, 9, 73–88. [Google Scholar] [CrossRef]
  61. Asian Development Bank. Available online: https://www.adb.org/ (accessed on 27 November 2024).
  62. MoSPI—Ministry of Statistics and Programme Implementation. Project Implementation Status Report of Central Sector Projects, Infrastructure and Project Monitoring Division, Sardar Patel Bhavan, Sansad Marg, New Delhi. 2018. Available online: http://www.cspm.gov.in (accessed on 27 November 2024).
  63. Thrane, C. Applied Regression Analysis: Doing, Interpreting and Reporting; Routledge: London, UK, 2020. [Google Scholar]
  64. García-García, J.I.; Coronado, F.N.A.; Arredondo, E.H.; Rivera, I.A. The binomial distribution: Historical origin and evolution of its problem situations. Mathematics 2022, 10, 2680. [Google Scholar] [CrossRef]
  65. Hope, T.M. Linear regression. In Machine learning; Academic Press: New York, NY, USA, 2020; pp. 67–81. [Google Scholar]
  66. Stanimirović, I. Correlation and Regression Analysis: Applications for Industrial Organizations; Arcler Press: Oakville, ON, Canada, 2020. [Google Scholar]
  67. Yao, F.; Müller, H.G. Functional quadratic regression. Biometrika 2010, 97, 49–64. [Google Scholar] [CrossRef]
  68. Chen, K.; Zhang, Y.; Hu, N.; Ye, C.; Ma, J.; Zheng, T. Cost prediction for water reuse equipment using interpretable machine learning models. J. Water Process Eng. 2024, 63, 105474. [Google Scholar] [CrossRef]
  69. Kavuma, A.; Ock, J.; Jang, H. Factors influencing time and cost overruns on freeform construction projects. KSCE J. Civ. Eng. 2019, 23, 1442–1450. [Google Scholar] [CrossRef]
  70. Flyvbjerg, B.; Ansar, A.; Budzier, A.; Buhl, S.; Cantarelli, C.; Garbuio, M.; Van Wee, B. Five things you should know about cost overrun. Transp. Res. Part A Policy Pract. 2018, 118, 174–190. [Google Scholar] [CrossRef]
  71. Allsop, D.B.; Chelladurai, J.M.; Kimball, E.R.; Marks, L.D.; Hendricks, J.J. Qualitative methods with Nvivo software: A practical guide for analyzing qualitative data. Psych 2022, 4, 142–159. [Google Scholar] [CrossRef]
  72. Azeem, M.; Salfi, N.A.; Dogar, A.H. Usage of NVivo software for qualitative data analysis. Acad. Res. Int. 2012, 2, 262–266. [Google Scholar]
  73. Adu, P. A Step-by-Step Guide to Qualitative Data Coding; Routledge: London, UK, 2019. [Google Scholar]
Figure 1. The proposed methodology for investigating cost overruns.
Sustainability 16 11159 g001
Figure 3. Cost overrun over estimated cost based on quadratic regression function.
Sustainability 16 11159 g003
Figure 4. Cost overrun over estimated cost based on Random Forest regression function.
Sustainability 16 11159 g004
Figure 5. Cost overrun over estimated cost for different project types.
Sustainability 16 11159 g005
Figure 6. Cost overrun over the implementation period based on linear regression function.
Sustainability 16 11159 g006
Figure 7. Cost overrun over the implementation period based on quadratic regression function.
Sustainability 16 11159 g007
Figure 8. Cost overrun over the implementation period based on the Random Forest regression function.
Sustainability 16 11159 g008
Figure 9. Cost overrun over the implementation period for different project types.
Sustainability 16 11159 g009
Figure 10. Cost overrun over time overrun based on linear regression function.
Sustainability 16 11159 g010
Figure 11. Cost overrun over time overrun based on quadratic regression function.
Sustainability 16 11159 g011
Figure 12. Cost overrun over time overrun based on Random Forest regression function.
Sustainability 16 11159 g012
Figure 13. The root causes of delays.
Sustainability 16 11159 g013
Table 1. Previous studies on cost performance and overruns in infrastructure projects.
AuthorsSample SizeRegion/CountryProject TypeMean Cost Overrun
Flyvbjerg et al. [34]258Europe and North AmericaRailways, roadways, and fixed links28%
Odeck [35]620NorwayRoadways 7.88%
Moura and Teixeira [36]26PortugalRoadways 39%
Lundberg et al. [37]167SwedenRailways and roadways15%
Makovšek et al. [38]20SloveniaRoadways 19%
Cantarelli et al. [10]78Netherlands Railways, roadways, and fixed links16.5%
Sovacool et al. [39]113Europe Electrical power projects26.5%
Cavalieri et al. [16]1083ItalyRoadways 26.35%
Kostka and Anzinger [14]50GermanyTransportation projects32%
Catalão et al. [40]175UKTransport projects60%
Catalão et al. [41]1091PortugalTransport projects17.8%
Molinari et al. [18]35BelgiumRailways, roadways, and inland waterways10.26%
De Marco and Narbaev [42]39Worldwide Tunnels27%
Berechman and Wu [43]127VancouverRoadways 5.9%
Love et al. [44]32USALight rails transit42%
Sovacool et al. [39]155North AmericaElectrical power projects115.2%
Gao and Touran [45]83USARailways32.4%
Callegari et al. [22]401Brazil Energy sector64.65%
Love et al. [11]16AustraliaRailways 23%
Lee [46]161South KoreaRailways, roadways, ports and airports 11%
Singh [47]107IndiaPower sector51.94%
Singh [47]122IndiaRailways 94.84%
Singh [47]157IndiaRoadways and highways15.84%
Singh [47]61IndiaShipping and ports−1.35%
Sovacool et al. [39]96Asia-PacificElectrical power projects48.1%
Senouci et al. [48]122QatarRoads, drainage, public buildings54%
Al-Hazim et al. [49]40JordanInfrastructure projects 214%
Huo et al. [25]57Hong KongRailways, roadways, and fixed links39.18%
Andrić et al. [50]120AsiaRoadways, railways, and energy sector projects26.24%
Rabe et al. [51]153ChinaRoadways, railways, and energy sector projects22%
Melaku et al. [52]26EthiopiaRoadways 18%
Table 2. Cost overrun and underrun for different types of projects.
Types of ProjectsNumber of OverrunMean ValueSDNumber of UnderrunMean ValueSD
Energy Sector2149.01112.5639−25.1316.89
Roadways and Highways2645.5551.4927−17.7514.45
Rural and Urban Development538.5350.0612−32.8628.05
Total:52 78
Disclaimer/Publisher’s Note: The statements, opinions and data contained in all publications are solely those of the individual author(s) and contributor(s) and not of MDPI and/or the editor(s). MDPI and/or the editor(s) disclaim responsibility for any injury to people or property resulting from any ideas, methods, instructions or products referred to in the content.

