WQI Improvement Based on XG-BOOST Algorithm and Exploration of Optimal Indicator Set
Abstract
1. Introduction
- (1)
- Recent studies combining machine learning with the WQI evaluation method for water quality assessment have primarily focused on surface water quality in rivers and lakes. Research on groundwater quality using similar approaches is still evolving. This study evaluated the groundwater quality in a portion of the Manas River Basin in Xinjiang using an XG-BOOST improved WQI model, providing a reference for similar groundwater quality assessments.
- (2)
- The weight determination process in the XG-BOOST improved WQI model was replaced by machine algorithms, reducing reliance on experts and experience, and decreasing the likelihood of important indicators being overlooked due to subjective weighting. This improved the objectivity of the evaluation.
- (3)
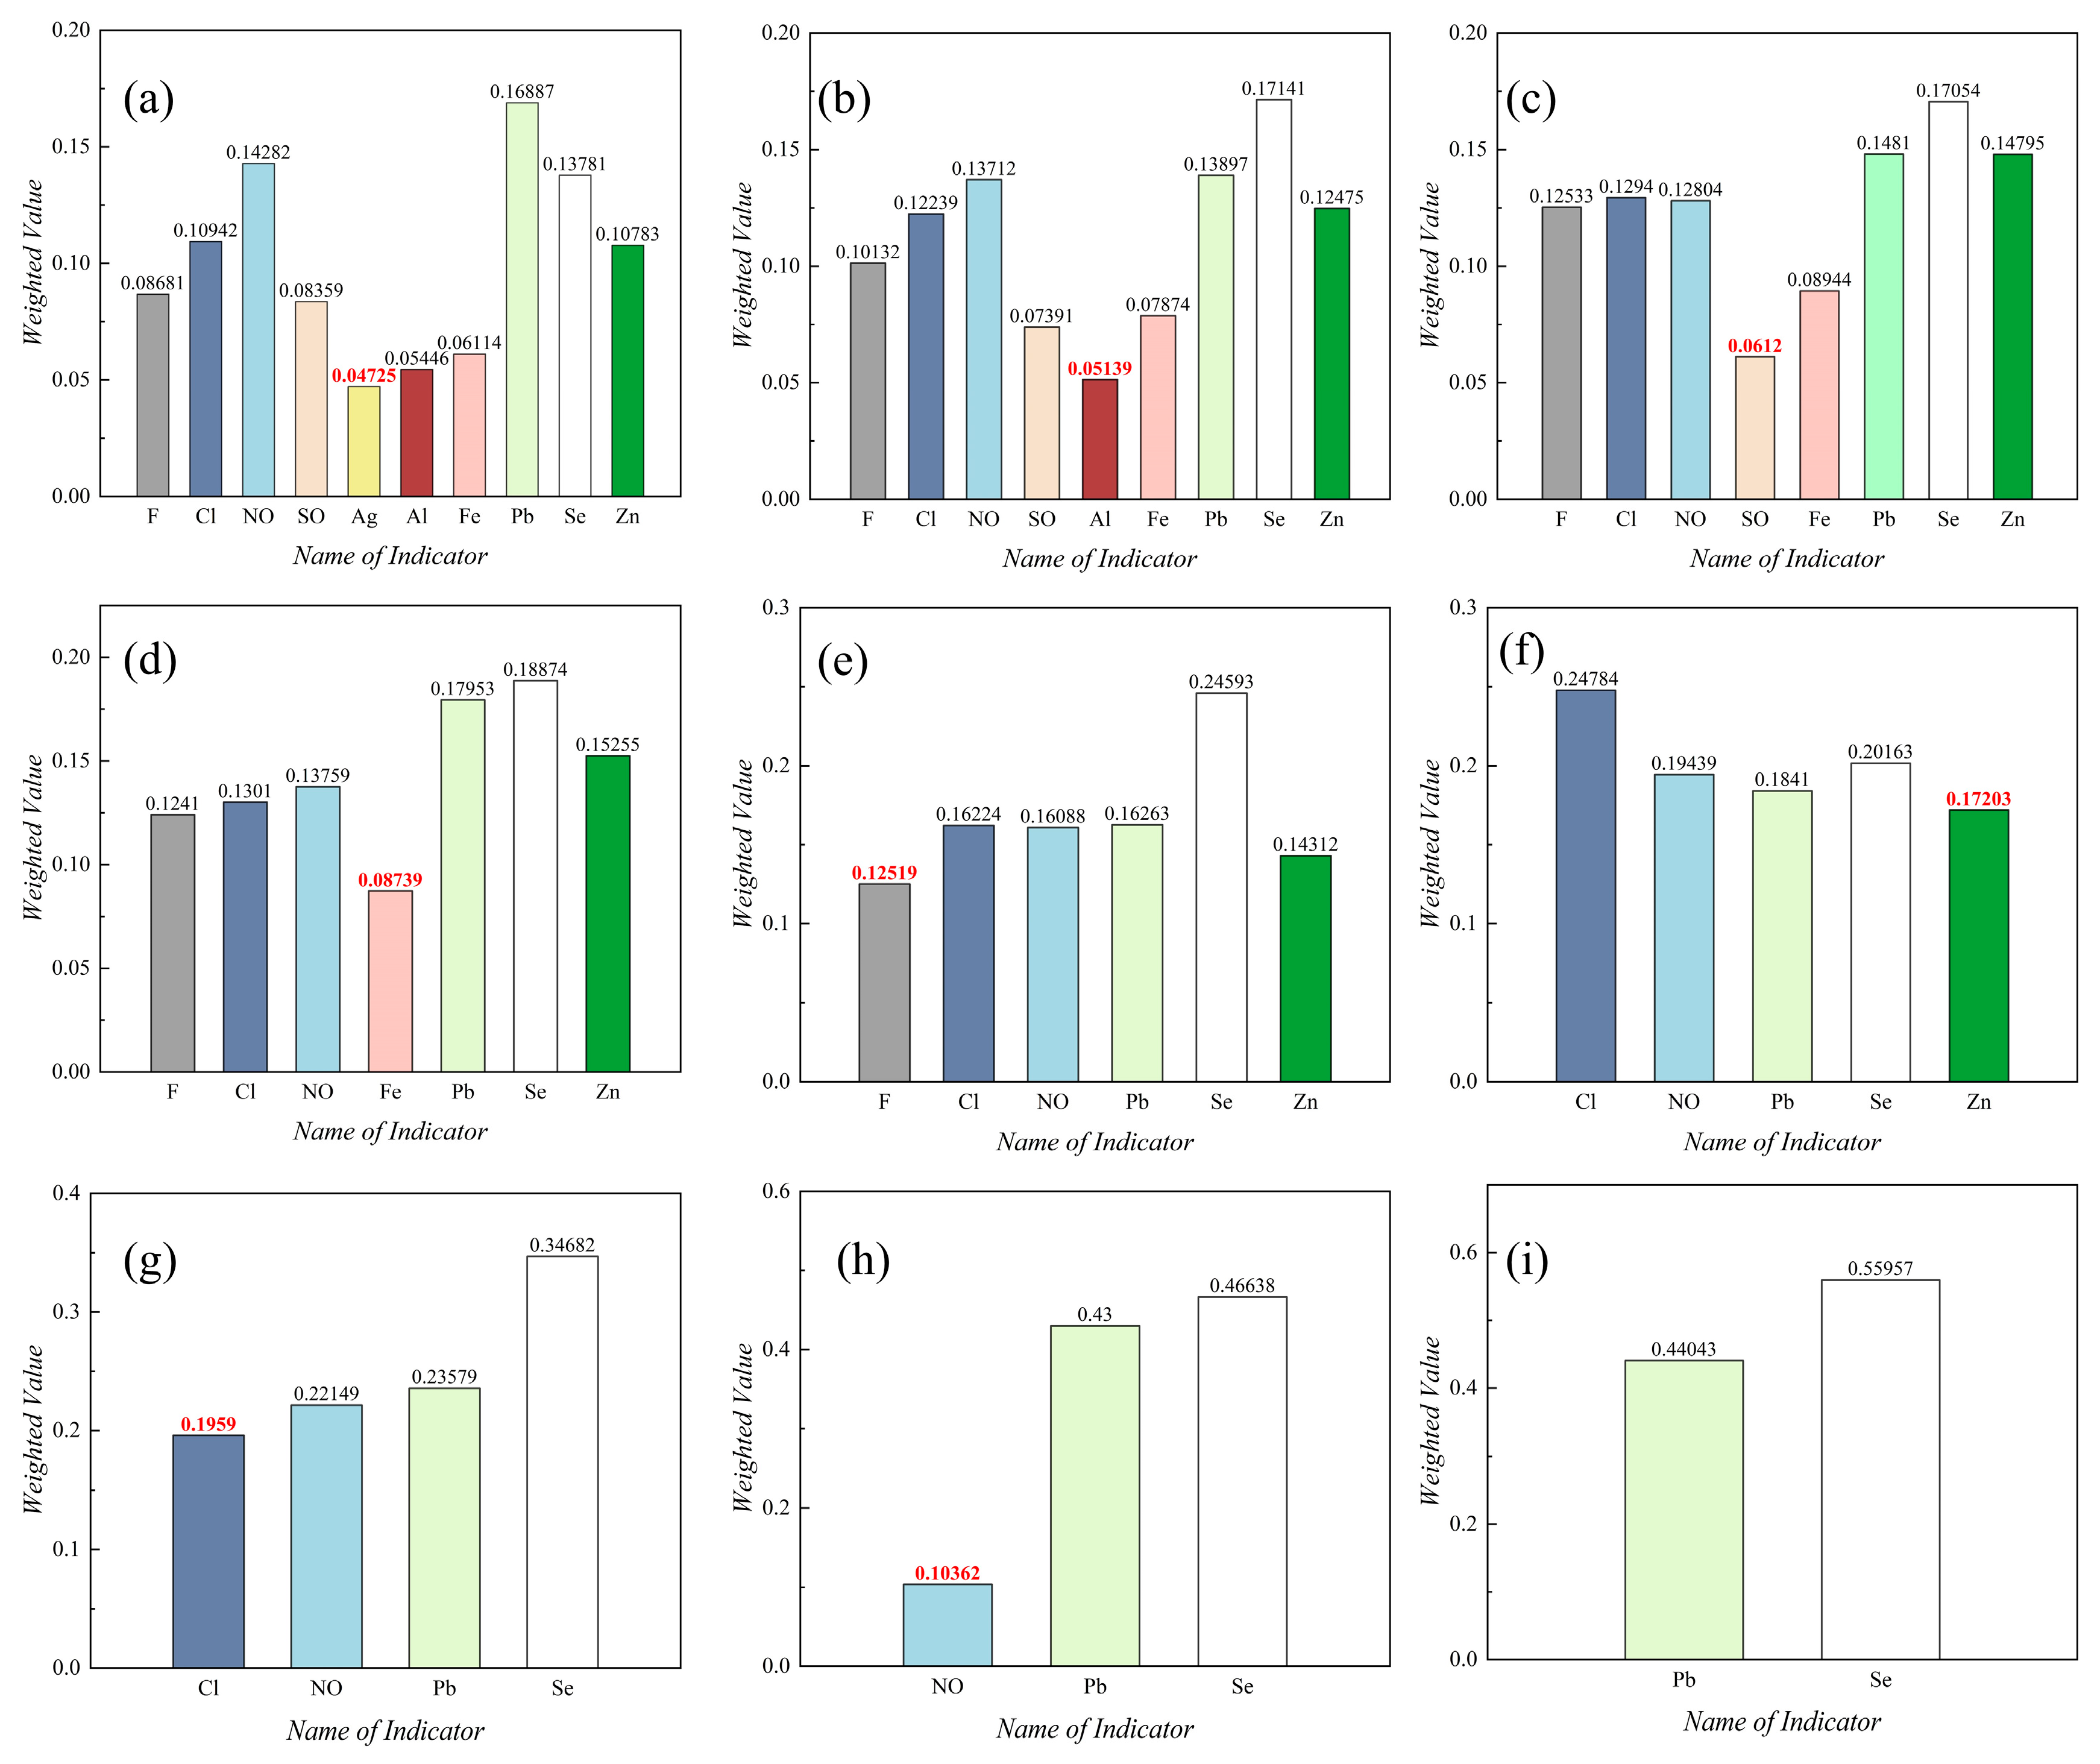
- Using XG-BOOST to screen the ten water quality indicators in the study area, removing the indicator with the lowest weight value in each iteration, and observing its impact on the evaluation results and the prediction model. This process helps identify the optimal indicator dataset that maximizes model performance. This approach can explore the impact of indicator selection on the simulation results of the XG-BOOST model and the water quality evaluation outcomes.
- (4)
- The Manas River Basin is located in the northwest of China, within an arid climate zone. Groundwater is the main water source for daily life, production, and agricultural irrigation in the Xinjiang Manas River Basin. Due to the regional environmental background and long-term human activities, groundwater pollution is severe. Therefore, assessing the groundwater quality in this region is crucial for developing groundwater protection measures and has significant importance for the rational planning, management, and utilization of local groundwater resources.
2. Materials and Methods
2.1. Study Area Description
2.2. Data Sources
2.3. WQI Evaluation Method
2.3.1. Indicator Selection
2.3.2. Sub-Indicator Evaluation
2.3.3. Water Quality Indicator Assignment
2.3.4. Water Quality Indices Aggregation
2.4. XG-BOOST Model
2.4.1. Model Inputs
2.4.2. Model Validation
2.4.3. Model Evaluation Criteria
2.4.4. Determination of Indicator Weights
2.5. Screening of the Optimal Set of Water Quality Indicators
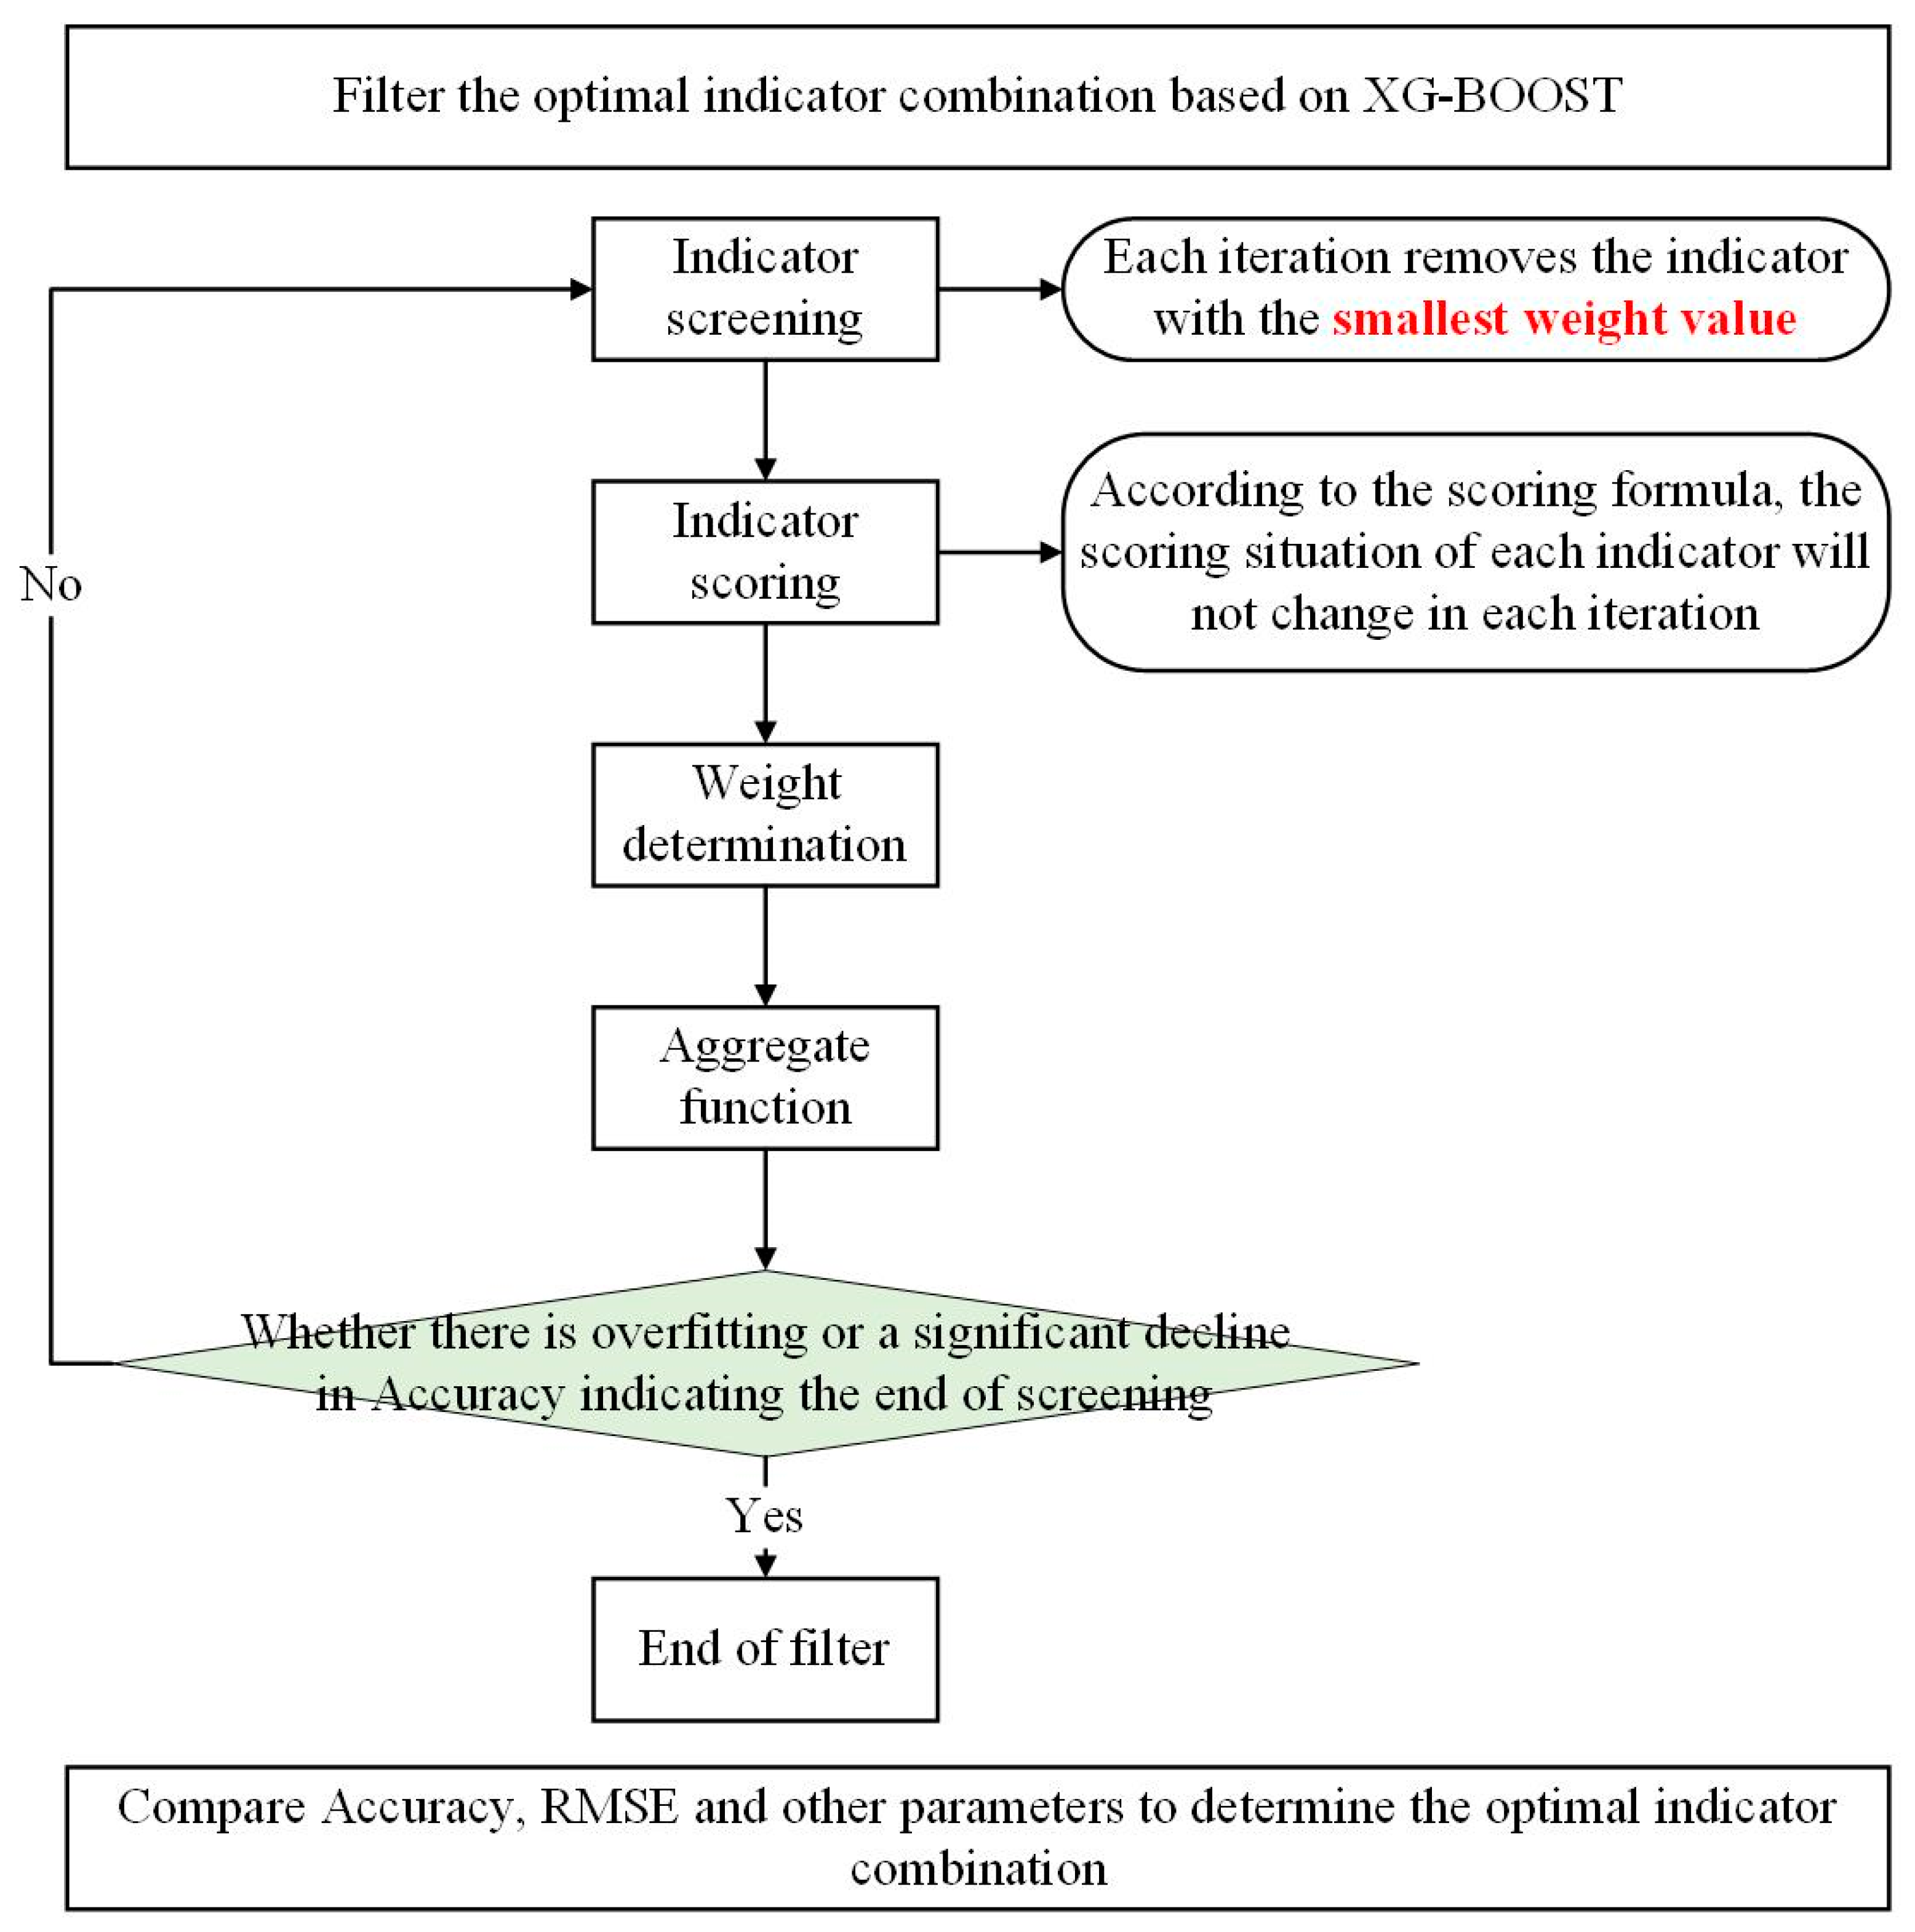
- (1)
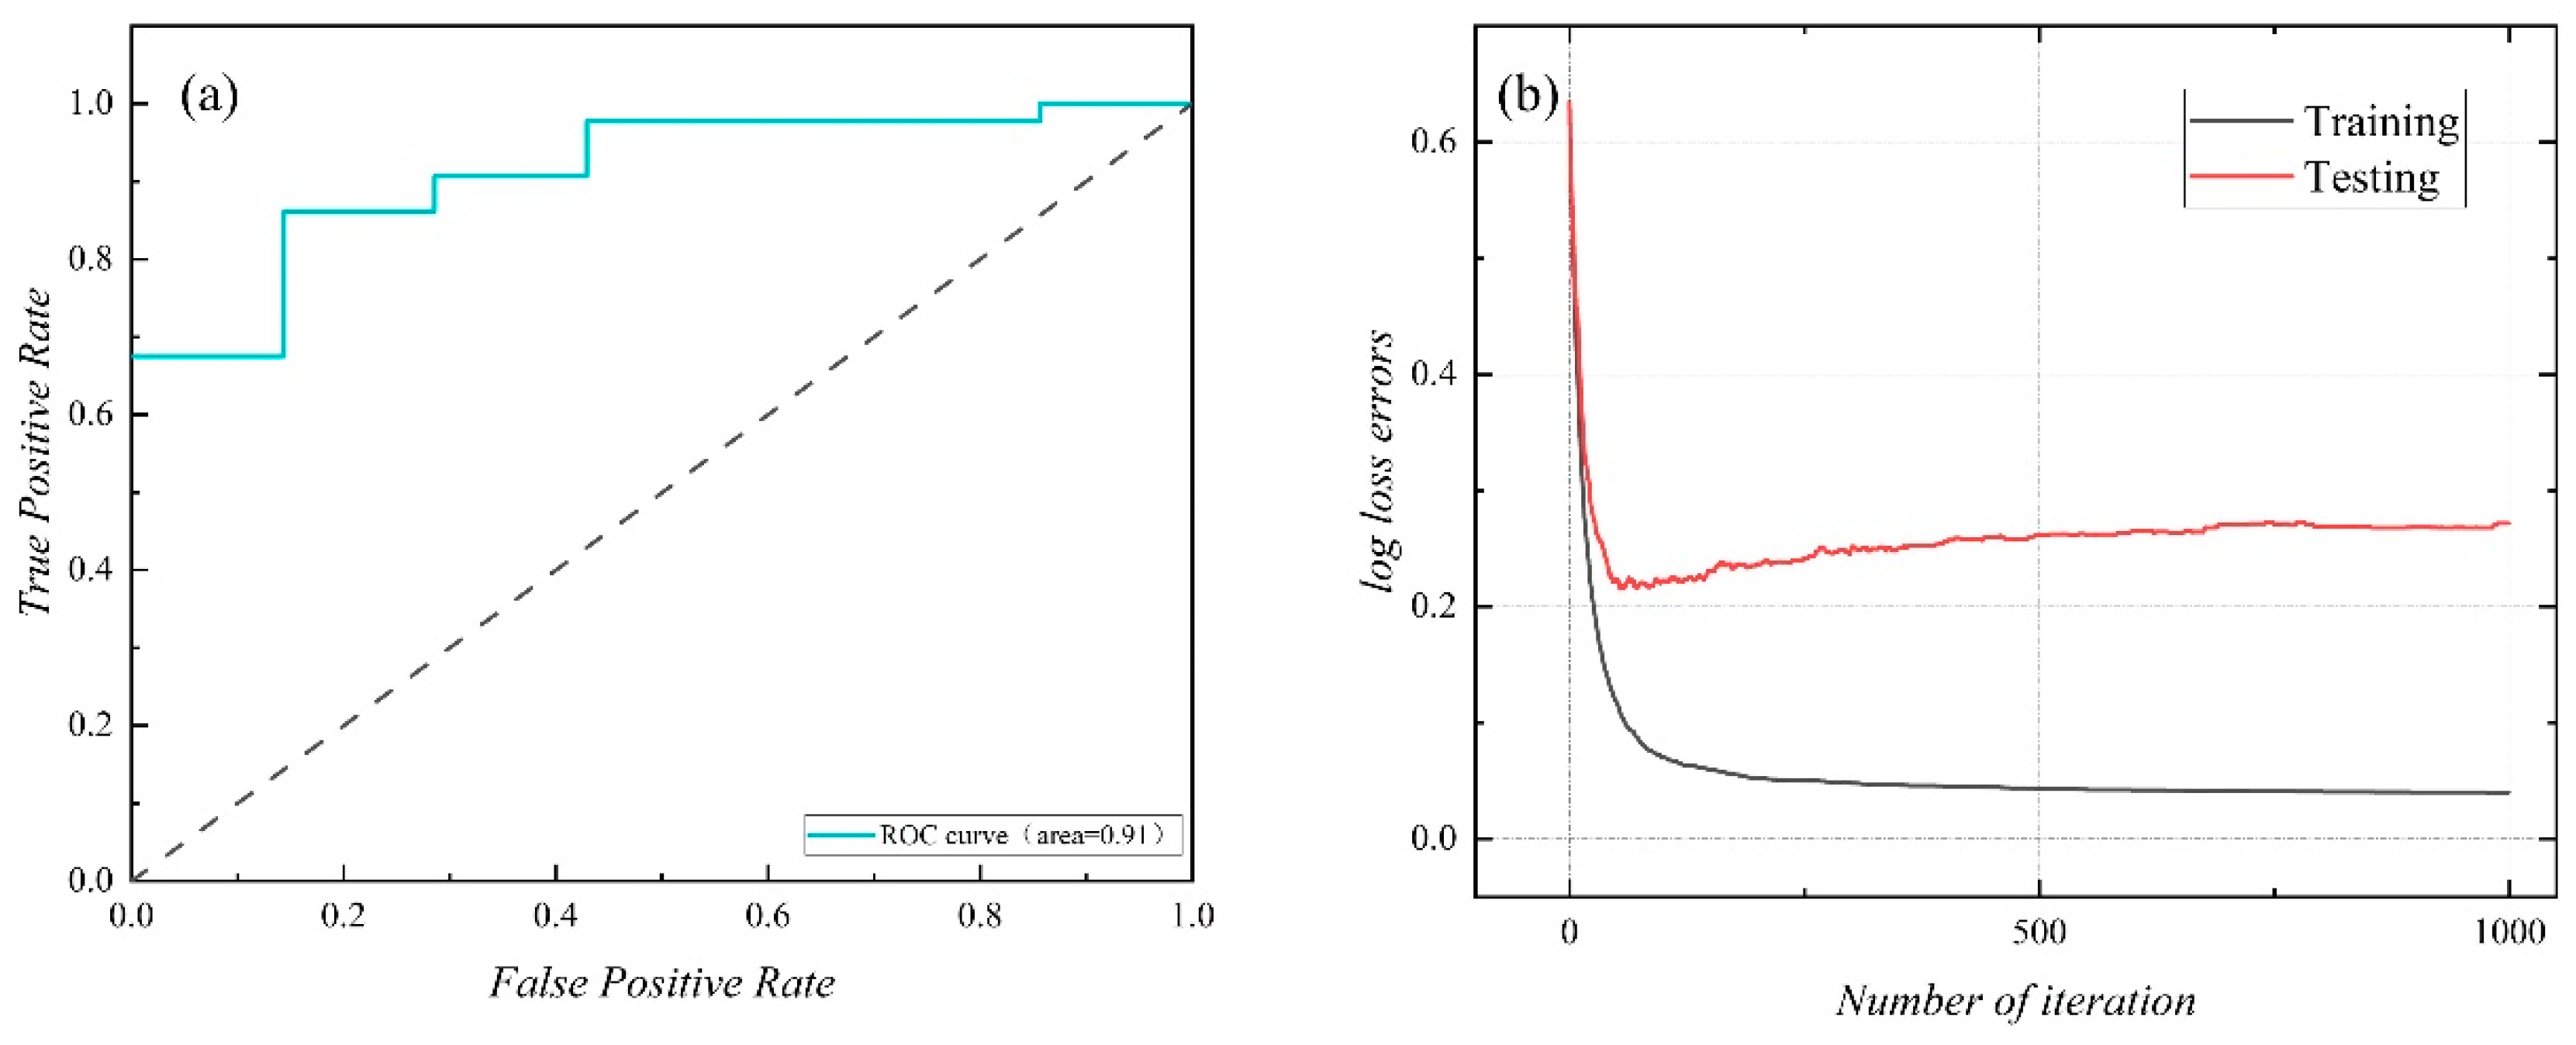
- Input the concentration data of the ten indicators and water quality status into XG-BOOST to obtain the weight values for each indicator, as well as evaluation metrics such as RMSE, R2, and accuracy under the ten-indicator scenario. Additionally, other standard metrics like the AUC-ROC curve will be obtained.
- (2)
- Remove the indicator with the smallest weight and determine whether its removal affects the water quality status. If there is a change in water quality status, modify the input water quality status for the corresponding monitoring point, and recalculate using XG-BOOST.
- (3)
- Continue this process until clear signs of overfitting or other issues arise, at which point the screening ends.
- (4)
- Compare the model evaluation metrics after each round of screening to comprehensively select the optimal indicator dataset.
- (5)
- Create spatial distribution maps of the water quality index for each dataset, and analyze the impact of indicator selection on water quality assessment.
3. Results
3.1. WQI Water Quality Analysis
3.1.1. Sub-Indicator Scoring
3.1.2. Indicator Assignment
3.1.3. Aggregation
3.2. Optimal Dataset Screening
3.2.1. Evaluation Criteria
- Evaluation parameters:
- 2.
- AUC-ROC curve:
- 3.
- LOSS curve:
3.2.2. Comprehensive Evaluation
3.3. Comparative Results of Water Quality Analysis
4. Discussion
- The results of this analysis are based on data from ten water quality indicators and 246 monitoring points. It remains uncertain whether selecting an optimal indicator dataset based on more water quality indicators in the region would yield the same results as this study. However, regardless of whether the same results can be obtained, the method of improving the traditional WQI with XG-BOOST has been proven effective for assessing groundwater quality. In the future, this method can be applied to more datasets to verify whether the results are consistent.
- The selection of the optimal water quality dataset in this study was primarily based on evaluation criteria to determine the final results. Therefore, the causes of any anomalies, such as significant fluctuations in the LOSS curve during each iteration of the selection process, were not thoroughly analyzed, and only possible causes were speculated. Future research could focus on how to effectively analyze and address model overfitting when using XG-BOOST to improve the traditional WQI method for water quality assessment.
- In this study, spatial interpolation was used in the process of investigating the spatial distribution of water quality indices using GISs. However, only an appropriate spatial interpolation method was selected based on the characteristics of the data distribution, without an in-depth exploration of how different spatial interpolation methods impact the results of the spatial distribution of water quality indices. Additionally, this study did not investigate how to choose different interpolation methods based on factors such as the amount of data and the characteristics of their distribution. This could be explored as a research topic in the future for further analysis and validation.
- The main focus of this study is on analyzing the current status of regional groundwater quality. Equally important as the current situation are the potential factors that contribute to the deterioration of water quality. Changes in these factors, such as land-use type, climate change, and changes in pollution sources, will affect the future state of groundwater quality. This could be explored as a future research direction, focusing on predicting groundwater quality under changing conditions.
Supplementary Materials
Author Contributions
Funding
Institutional Review Board Statement
Informed Consent Statement
Data Availability Statement
Acknowledgments
Conflicts of Interest
References
- Li, P.-Y.; Hui, Q.; Wu, J.H. Application of Set Pair Analysis Method Based on Entropy Weight in Groundwater Quality Assessment—A Case Study in Dongsheng City, Northwest China. J. Chem. 2010, 8, 851–858. [Google Scholar] [CrossRef]
- Li, P.; Wu, J.; Qian, H. Groundwater quality assessment based on rough sets attribute reduction and TOPSIS method in a semi-arid area, China. Environ. Monit. Assess. 2011, 184, 4841–4854. [Google Scholar] [CrossRef]
- Liyan, Y.; Xiaoyan, L. Application of Single-Factor Evaluation Method and Canadian Water Quality Index Method in Water Source Quality Evaluation—Taking the “Thousand Tons for Ten Thousand People” Drinking Water Source of Jiuquan City as an Example. China Resour. Compr. Util. 2021, 39, 48–51. [Google Scholar]
- Weina, G.; Lin, L.; Qin, H.; Tao, L. Exploration and Application of Single-Factor Index Method in Drinking Water Quality Evaluation. Water Supply Drain. 2016, 52, 150–154. [Google Scholar]
- Su, K.; Wang, Q.; Li, L.; Cao, R.; Xi, Y.; Li, G. Water quality assessment based on Nemerow pollution index method: A case study of Heilongtan reservoir in central Sichuan province, China. PLoS ONE 2022, 17, e0273305. [Google Scholar] [CrossRef] [PubMed]
- Zhang, Q.; Feng, M.; Hao, X. Application of Nemerow Index Method and Integrated Water Quality Index Method in Water Quality Assessment of Zhangze Reservoir. IOP Conf. Ser. Earth Environ. Sci. 2018, 128, 012160. [Google Scholar] [CrossRef]
- Zhang, X.F.; Xiao, C.L.; Li, Y.Q.; Song, D.F. Water Environmental Quality Assessment and Protection Strategies of the Xinlicheng Reservoir, China. Appl. Mech. Mater. 2014, 501–504, 1863–1867. [Google Scholar] [CrossRef]
- Zhao, K. Set Pair Analysis and Its Preliminary Application. Exploration of Nature 1994. Available online: https://kns.cnki.net/KCMS/detail/detail.aspx?dbcode=CJFN&dbname=CJFDN7904&filename=DZRT401.011 (accessed on 11 February 2024).
- Wang, H.L.; Zhang, J.F.; Lei, H.Y.; Lv, L.L.; Fu, T.T.; Li, H.F. Evaluation of Groundwater Resource Utilization in Mining Subsidence Areas in Henan Based on AHP-Set Pair Analysis Method. People’s Yellow River 2024, 46, 72–77+89. [Google Scholar]
- Fan, Z.J.; Wei, X.; Li, J.W.; Zhou, Y.L. Research Progress on Groundwater Drinking Water and Irrigation Water Quality Evaluation Methods. Groundwater 2022, 44, 10–15. [Google Scholar]
- Piyathilake, I.D.U.H.; Ranaweera, L.V.; Udayakumara, E.P.N.; Gunatilake, S.K.; Dissanayake, C.B. Assessing groundwater quality using the Water Quality Index (WQI) and GIS in the Uva Province, Sri Lanka. Appl. Water Sci. 2022, 12, 72. [Google Scholar] [CrossRef]
- Ababakr, F.A. Spatio-temporal variations of groundwater quality index using geostatistical methods and GIS. Appl. Water Sci. 2023, 13, 206. [Google Scholar] [CrossRef]
- Mahmud, A. Assessment of groundwater quality in Khulna city of Bangladesh in terms of water quality index for drinking purpose. Appl. Water Sci. 2020, 10, 1–14. [Google Scholar] [CrossRef]
- Rahman, M.M. Investigation of groundwater and its seasonal variation in a rural region in Natore, Bangladesh. Heliyon 2024, 10, e32991. [Google Scholar] [CrossRef]
- Gabr, M.E. Groundwater quality evaluation for drinking and irrigation uses in Dayrout city Upper Egypt. Ain Shams Eng. J. 2020, 12, 327–340. [Google Scholar] [CrossRef]
- Krishan, G. Integrated approach for the investigation of groundwater quality through hydrochemistry and water quality index (WQI). Urban Clim. 2022, 47, 101383. [Google Scholar] [CrossRef]
- Uddin, M.G.; Rana, M.M.S.P.; Diganta, M.T.M.; Bamal, A.; Sajib, A.M.; Abioui, M.; Shaibur, M.R.; Ashekuzzaman, S.; Nikoo, M.R.; Rahman, A.; et al. Enhancing groundwater quality assessment in coastal area: A hybrid modeling approach. Heliyon 2024, 10, e33082. [Google Scholar] [CrossRef] [PubMed]
- Seifi, A.; Dehghani, M.; Singh, V.P. Uncertainty analysis of water quality index (WQI) for groundwater quality evaluation_ Application of Monte-Carlo method for weight allocation. Ecol. Indic. 2020, 117, 106653. [Google Scholar] [CrossRef]
- El-Magd, S.A.A. Integrated machine learning–based model and WQI for groundwater quality assessment: ML, geospatial, and hydro-index approaches. Environ. Sci. Pollut. Res. 2023, 30, 53862. [Google Scholar]
- Huang, Y.; Wang, C.; Wang, Y.; Lyu, G.; Lin, S.; Liu, W.; Niu, H.; Hu, Q. Application of machine learning models in groundwater quality assessment and prediction: Progress and challenges. Front. Environ. Sci. Eng. 2024, 18, 29. [Google Scholar] [CrossRef]
- Zegaar, A.; Ounoki, S.; Telli, A. Machine Learning for Groundwater Quality Classification: A Step Towards Economic and Sustainable Groundwater Quality Assessment Process. Water Resour. Manag. 2024, 38, 621–637. [Google Scholar] [CrossRef]
- Singha, S.S.; Singha, S.; Pasupuleti, S.; Venkatesh, A.S. Knowledge-driven and machine learning decision tree-based approach for assessment of geospatial variation of groundwater quality around coal mining regions, Korba district, Central India. Environ. Earth Sci. 2022, 81, 36. [Google Scholar] [CrossRef]
- Wang, X.; Tian, Y.; Liu, C. Assessment of groundwater quality in a highly urbanized coastal city using water quality index model and bayesian model averaging. Front. Environ. Sci. 2023, 11, 1086300. [Google Scholar] [CrossRef]
- Vijay, S. Prediction of Water Quality Index in Drinking Water Distribution System Using Activation Functions Based Ann. Water Resour. Manag. 2021, 35, 535–553. [Google Scholar] [CrossRef]
- Gibrilla, A.; Bam, E.K.P.; Adomako, D.; Ganyaglo, S.; Osae, S.; Akiti, T.T.; Kebede, S.; Achoribo, E.; Ahialey, E.; Ayanu, G.; et al. Application of Water Quality Index (WQI) and Multivariate Analysis for Groundwater Quality Assessment of the Birimian and Cape Coast Granitoid Complex: Densu River Basin of Ghana. Water Qual. Expo. Health 2011, 3, 63–78. [Google Scholar] [CrossRef]
- Kang, W.H.; Zhou, Y.Z.; Lei, M.; Han, S.B.; Zhou, J.L. Distribution and Co-Enrichment Mechanism of Arsenic, Fluoride, and Iodine in Groundwater in the Manas River Basin, Xinjiang. China Environ. Sci. 2024, 44, 3832–3842. [Google Scholar]
- Kang, W.; Zhou, Y.; Zhou, J.; Jiang, F.; Han, S.; Remy; Liu, J. Distribution Characteristics, Source Analysis, and Health Risk Assessment of Inorganic Components in Groundwater in the Plain Area of the Manas River Basin, Xinjiang. Environ. Sci. 2024, 1–16. [Google Scholar] [CrossRef]
- Krishnamoorthy, N.; Thirumalai, R.; Sundar, M.L.; Anusuya, M.; Kumar, P.M.; Hemalatha, E.; Prasad, M.M.; Munjal, N. Assessment of underground water quality and water quality index across the Noyyal River basin of Tirupur District in South India. Urban Clim. 2023, 49, 101436. [Google Scholar] [CrossRef]
- GB 5749-2022; Standards for Drinking Water Quality. Jingtai County People’s Government: Baiyin, China, 2022. Available online: https://www.jingtai.gov.cn/zfxxgk/bmhxzxxgk/xzfzcbmzsjgml/xwsjkj/fdzdgknr/jzsshyysszjc/art/2024/art_927619b8e82b48689300d36232d739c1.html (accessed on 1 December 2024).
- Uddin, M.G.; Nash, S.; Rahman, A.; Olbert, A.I. A comprehensive method for improvement of water quality index (WQI) models for coastal water quality assessment. Water Res. 2022, 219, 118532. [Google Scholar] [CrossRef] [PubMed]
- Liu, Q.; Wang, Z.; Xu, H.; Lian, W.; Chen, Y. PM2.5 Concentration Inversion Based on Particle Swarm Optimized XG-Boost Model. Environ. Sci. 2024, 49, 1–16. [Google Scholar] [CrossRef]


| Indicator Number | Name of Indicator | Maximum Allowable Concentration (Standard) |
|---|---|---|
| 1 | F | 1 |
| 2 | Cl | 250 |
| 3 | NO | 10 |
| 4 | SO | 250 |
| 5 | Ag | 0.05 |
| 6 | Al | 0.2 |
| 7 | Fe | 0.3 |
| 8 | Pb | 0.01 |
| 9 | Se | 0.01 |
| 10 | Zn | 1 |
| Serial Number | Water Quality Index Interval | Rank |
|---|---|---|
| 1 | <50 | EXCELLENT |
| 2 | 50–100 | GOOD |
| 3 | 101–200 | POOR |
| 4 | 201–300 | VERY POOR |
| 5 | >300 | UNFIT |
| Serial Number | Name of Indicator | Weighted Value |
|---|---|---|
| 1 | F | 0.08680517 |
| 2 | Cl | 0.10941678 |
| 3 | NO | 0.14282118 |
| 4 | SO | 0.08359309 |
| 5 | Ag | 0.04725126 |
| 6 | Al | 0.05445521 |
| 7 | Fe | 0.06113945 |
| 8 | Pb | 0.16887292 |
| 9 | Se | 0.13781276 |
| 10 | Zn | 0.10783219 |
| Exclusion Metrics and Number of Iterations | Accuracy | RMSE | R2 | AUC |
|---|---|---|---|---|
| (1) | 0.92 | 0.2828 | 0.3355 | 0.91 |
| Ag (2) | 0.74 | 0.5099 | 0.5152 | 0.81 |
| Al (3) | 0.82 | 0.4243 | 0.0644 | 0.93 |
| SO (4) | 0.96 | 0.2 | 0.6678 | 0.97 |
| Fe (5) | 0.92 | 0.2828 | 0.458 | 0.96 |
| F (6) | 0.98 | 0.1414 | 0.9081 | 0.97 |
| Zn (7) | 0.9 | 0.3162 | 0.5404 | 0.96 |
| Cl (8) | 0.96 | 0.2 | 0.8217 | 0.98 |
| NO (9) | 1 | 0 | 1 | 1 |
Disclaimer/Publisher’s Note: The statements, opinions and data contained in all publications are solely those of the individual author(s) and contributor(s) and not of MDPI and/or the editor(s). MDPI and/or the editor(s) disclaim responsibility for any injury to people or property resulting from any ideas, methods, instructions or products referred to in the content. |
© 2024 by the authors. Licensee MDPI, Basel, Switzerland. This article is an open access article distributed under the terms and conditions of the Creative Commons Attribution (CC BY) license (https://creativecommons.org/licenses/by/4.0/).
Share and Cite
Liu, J.; Chu, Q.; Yuan, W.; Zhang, D.; Yue, W. WQI Improvement Based on XG-BOOST Algorithm and Exploration of Optimal Indicator Set. Sustainability 2024, 16, 10991. https://doi.org/10.3390/su162410991
Liu J, Chu Q, Yuan W, Zhang D, Yue W. WQI Improvement Based on XG-BOOST Algorithm and Exploration of Optimal Indicator Set. Sustainability. 2024; 16(24):10991. https://doi.org/10.3390/su162410991
Chicago/Turabian StyleLiu, Jing, Qi Chu, Wenchao Yuan, Dasheng Zhang, and Weifeng Yue. 2024. "WQI Improvement Based on XG-BOOST Algorithm and Exploration of Optimal Indicator Set" Sustainability 16, no. 24: 10991. https://doi.org/10.3390/su162410991
APA StyleLiu, J., Chu, Q., Yuan, W., Zhang, D., & Yue, W. (2024). WQI Improvement Based on XG-BOOST Algorithm and Exploration of Optimal Indicator Set. Sustainability, 16(24), 10991. https://doi.org/10.3390/su162410991


