1. Introduction
Globalization has played a pivotal role in driving economic growth while contributing to environmental degradation through increased industrial activity, trade, and resource exploitation [
1,
2]. This process often leads to rising carbon dioxide (CO
2) emissions, which are major contributors to global warming and pose significant threats to public health and ecosystems [
3,
4]. Major economies such as China, the United States, and Europe account for 28%, 19%, and 14% of global CO
2 emissions, respectively [
5,
6]. Although Africa’s emissions are lower in comparison, they are steadily rising, with countries like Algeria, Egypt, and South Africa contributing millions of metric tons of CO
2 annually [
6]. These trends illustrate the growing environmental challenges associated with globalization and economic development.
In Tanzania, CO
2 emissions have increased significantly, from 1.6 million metric tons in 1970 to 13.3 million metric tons in 2019 [
6,
7]. Per capita emissions rose from 0.07 tons in 1994 to 0.22 tons in 2019, driven by expanding industrial processes, agriculture, and energy production [
8]. Despite policy efforts such as the Environmental Management Act (2004) and the National Climate Change Strategy (2012), mitigating environmental degradation remains a challenge [
9]. The limited success of these initiatives underscores the need for a deeper understanding of the factors driving emissions and their relationship with globalization and economic growth [
10,
11].
While research on globalization, economic growth, and environmental degradation is extensive in developed and emerging economies, it remains limited in developing countries like Tanzania [
12,
13]. Additionally, existing studies often focus on individual relationships, such as the impact of foreign direct investment (FDI) or economic growth on CO
2 emissions, without examining their interconnected effects [
12,
13,
14]. This study aims to fill this gap by analyzing the interrelationships between GDP per capita, FDI, trade openness, and CO
2 emissions in Tanzania. By providing an integrated analysis, this research offers novel insights into the unique dynamics affecting Tanzania and presents actionable policy recommendations to balance economic growth with environmental sustainability.
2. Theoretical Review
In assessing the relationship between globalization, economic growth, and environmental quality, there is a need to provide exposition on the subject matter from a theoretical point of view. The following sections outline the links between the subjects discussed:
- (i)
Economic growth and environmental degradation
This study is guided by the environmental Kuznets curve (EKC) theory, established by Kuznets in 1955, which explains the connection between economic growth and environmental quality [
15]. The theory explains that, during the main phase of growth, ecological debasement rises as income per capita rises; however, it starts to diminish once rising income per capita surpasses a defining moment. This means that when a certain degree of national economic is achieved, the nation and its people begin to take notice of the tradeoff between environmental quality and its utilization. As countries achieve more and more economic growth, they tend to invest in advanced technologies and put more effort into recovering the degraded environment [
16]. Kuznets thus elucidated the relationship between environmental degradation and economic growth through the environmental Kuznets curve (EKC). The theory suggests an inverted U-shaped correlation between per capita economic output and environmental quality. As GDP per capita increases, environmental degradation also intensifies [
17]. However, once a certain threshold of GDP per capita is surpassed, further economic growth results in a reduction in environmental harm. This study extends the literature by examining the validity of the EKC hypothesis in the context of Tanzania, using GDP per capita and carbon dioxide emissions as variables.
- (ii)
Globalization and environmental degradation
The relationship between globalization and environmental degradation can be explained using two theoretical propositions: the pollution haven theory and the pollution halo hypothesis. The pollution haven theory suggests that industries tend to relocate to countries with less stringent environmental regulations to take advantage of lower costs and less strict pollution control measures [
18]. This hypothesis implies that countries with weaker environmental standards may experience an increase in pollution because they attract these industries. However, the validity and extent of this hypothesis are still debated, which necessitates the need for further exploration [
19].
Meanwhile, the pollution halo hypothesis suggests that industries in countries with stricter environmental regulations may have a positive effect on the environment. This hypothesis proposes that companies operating in countries with higher environmental standards are more likely to invest in cleaner technologies and practices, leading to reduced pollution levels [
20]. The idea is that these industries create a “halo” effect by promoting sustainable practices and influencing other industries to adopt similar environmentally friendly approaches. However, the pollution halo hypothesis is still a subject of debate and ongoing research in the field of environmental economics as there is evidence of it in the empirical literature [
21,
22].
The pollution haven theory suggests that globalization, through the expansion of trade and foreign investment, creates opportunities pollution-intensive production to shift to other countries. On the other hand, the pollution halo theory posits that globalization facilitates the transfer of technology between developed and developing nations. The central argument here is that developing countries stand to benefit from acquiring technological expertise from developed nations, which could lead to enhanced environmental quality and decreased degradation [
3,
20]. Therefore, based on these theories, it is evident that there is still ongoing debate in the empirical literature regarding the interplay between globalization, environmental degradation, and economic performance because some of the theories show that globalization impacts both environment and economy positively, while some suggest it has the opposite impact on one or both of these components.
3. Empirical Review
The existing body of literature provides extensive insights into the relationships between globalization, economic growth, and environmental degradation, often measured via CO2 emissions. However, a critical evaluation of these studies reveals discrepancies, particularly regarding the roles of foreign direct investment (FDI) and trade openness. While these dynamics have been well-explored in developed and emerging economies, there remains a need for more focused research in developing countries, particularly in Africa. This study addresses these gaps by examining Tanzania’s unique context, while integrating the interconnected effects of globalization, economic growth, and environmental degradation.
Several studies have demonstrated a positive relationship between economic growth and environmental degradation, supporting the environmental Kuznets curve (EKC) hypothesis. For instance, research on Sub-Saharan Africa suggests that while economic development initially worsens environmental quality, a turning point may occur where further growth leads to improved sustainability [
23,
24]. In Tunisia, an empirical analysis revealed that pollutant emissions rise with economic growth up to a threshold, after which emissions decline [
25]. However, the extent to which the EKC hypothesis applies varies significantly across Africa due to differences in institutional capacity, energy infrastructure, and economic complexity [
26,
27]. These findings underscore the importance of context-specific factors in understanding the relationship between economic growth and environmental degradation.
The impact of globalization on environmental outcomes also shows regional variation. In Sudan, globalization and financial development have been found to contribute positively to economic growth, but with considerable environmental costs [
28]. Similarly, a study on Nigeria highlights the interconnectedness between globalization and economic development, emphasizing the dual challenge of promoting growth while mitigating ecological damage [
29]. These studies suggest that globalization’s benefits can be undermined by environmental degradation if sustainable practices are not adopted. In Sub-Saharan Africa, trade openness often exacerbates CO
2 emissions due to the region’s dependence on resource-intensive exports and limited environmental regulations [
23,
26]. This pattern highlights the need for policies that integrate sustainable trade practices and stricter regulatory frameworks to mitigate adverse environmental impacts.
The role of FDI in environmental degradation remains a contentious topic, with conflicting findings across different African regions. In some cases, FDI has been shown to increase CO
2 emissions, aligning with the pollution haven hypothesis, where lax environmental standards attract pollution-intensive industries [
11,
13]. Conversely, FDI can promote sustainability by facilitating cleaner technologies and enhancing institutional quality, as evidenced by studies in select African economies [
30,
31]. The divergent effects of FDI underscore the importance of sectoral composition, regulatory frameworks, and institutional capacity in determining environmental outcomes [
32,
33]. For instance, research on West African countries suggests that while FDI can drive growth, its environmental impact varies based on how effectively globalization factors are managed [
27,
34]. Additionally, the interplay between urbanization, poverty, and environmental degradation has been extensively studied in Africa [
35]. Urbanization and poverty have been shown to exacerbate environmental issues in Sub-Saharan Africa due to increased pressure on natural resources and inadequate infrastructure [
36,
37]. The adverse effects of climate change on economic growth also vary across Africa’s heterogeneous climate regions, complicating efforts to achieve sustainability [
38,
39]. These studies highlight the need for region-specific strategies that address the unique challenges posed by poverty, urbanization, and climate variability.
Despite these valuable insights, the existing literature has tended to examine globalization, economic growth, and environmental degradation in isolation, missing their interconnected dynamics. For example, studies focusing on the EKC hypothesis in West Africa neglect the influence of globalization factors like FDI and trade openness [
27]. Moreover, much of the literature centers on developed and emerging economies, leaving significant gaps in understanding regarding how these dynamics manifest in low-income, resource-dependent countries like Tanzania. This study aims to address these unresolved issues by integrating GDP per capita, FDI, trade openness, and CO
2 emissions into a single analytical framework. By focusing on Tanzania’s specific context, this research provides a holistic understanding of how globalization and economic growth interact with environmental degradation. The conceptual framework acknowledges the complex, reciprocal relationships between these factors, where globalization fosters economic expansion and technology transfer but can also drive emissions if environmental regulations are ineffective. Given Tanzania’s evolving institutional capacity and reliance on traditional energy sources, this study contributes to the broader discourse by offering policy-relevant insights to help balance economic growth with environmental sustainability in developing countries.
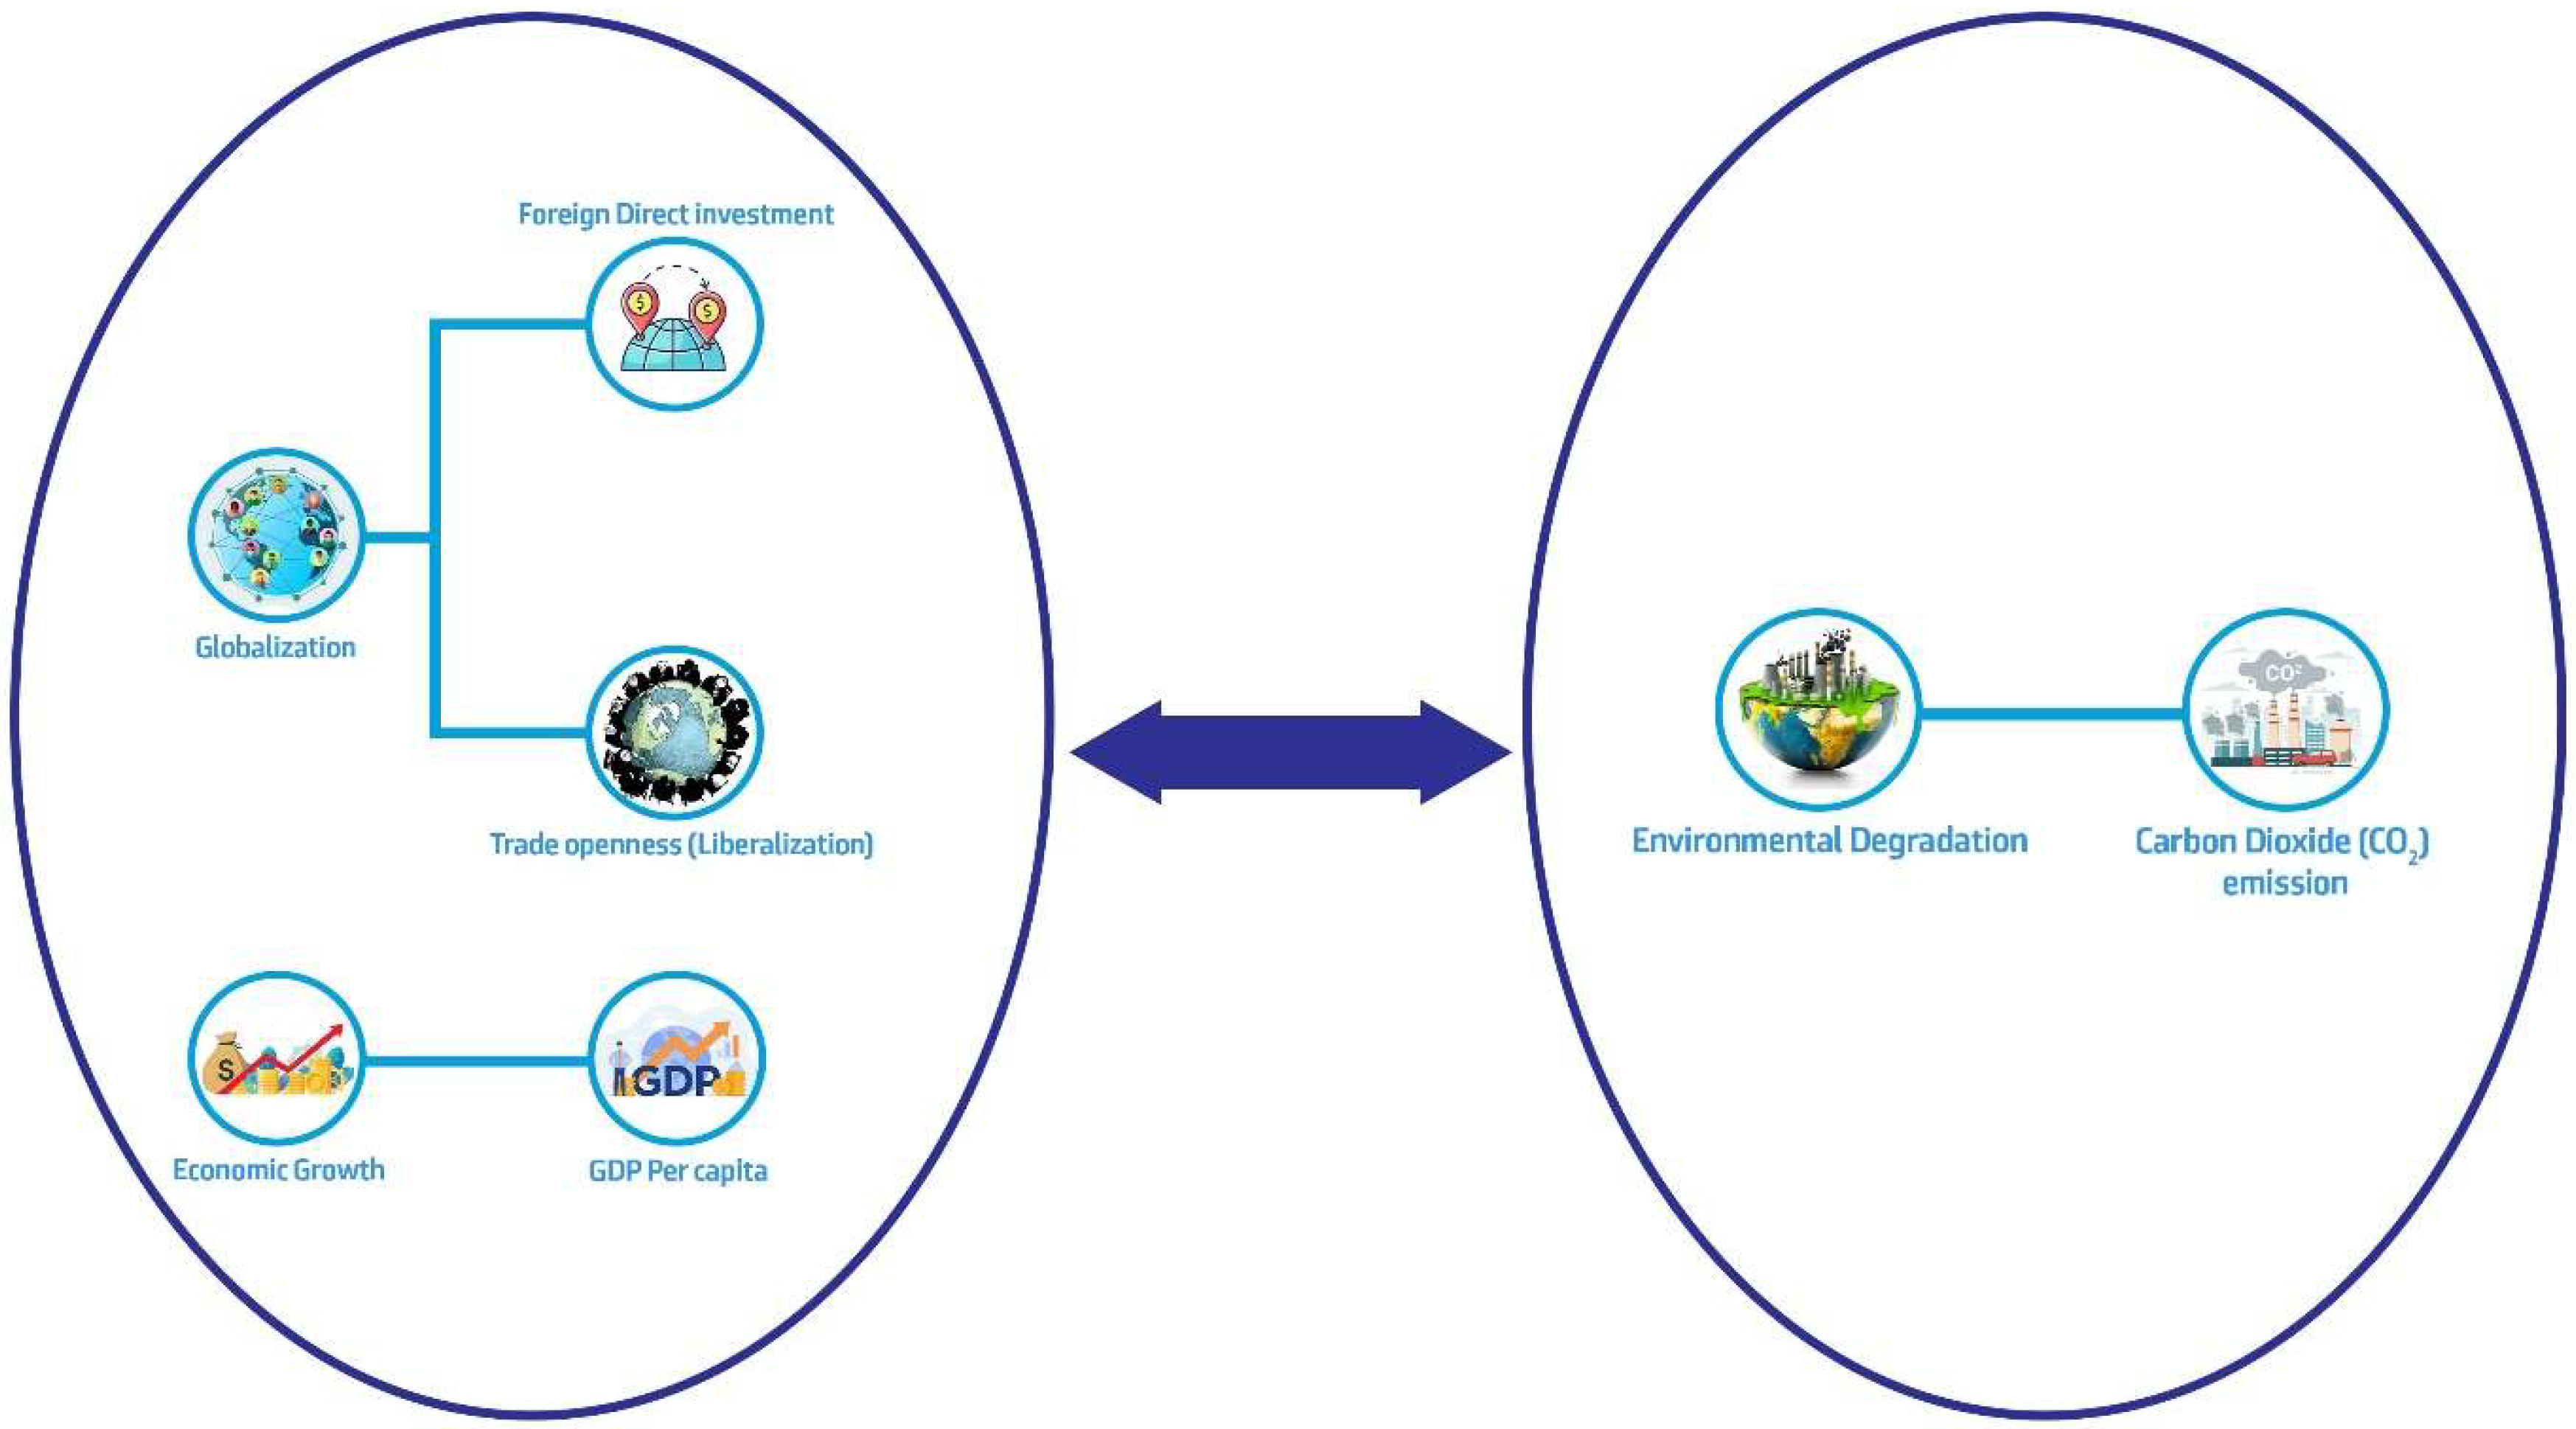
Moreover, the conceptual framework in
Figure 1 illustrates the relationship between globalization, economic growth, and environmental degradation, with carbon dioxide (CO
2) emissions serving as a key indicator of environmental impact. On the left, globalization is represented by foreign direct investment (FDI) and trade openness (liberalization), which are shown to influence economic growth, measured through GDP per capita. The framework suggests that economic activities driven by globalization contribute to environmental degradation, with CO
2 emissions as the primary outcome. The bidirectional arrow indicates a feedback loop, suggesting that environmental degradation may also influence economic and globalization-related factors, emphasizing the dynamic interplay between these variables. This framework highlights the need for balancing economic development with environmental sustainability.
4. Methodology
This study employed a time series research design to analyze the interplay between globalization, economic growth, and environmental degradation in Tanzania. The study used data from the World Bank (WB) dated from 1970 to 2022, with the aim of understanding the long-term effects of the considered parameters and enhancing the development of understanding on how developing countries’ quest for growth can affect environmental sustainability and conservation initiatives. Thus, to achieve this greater understanding, macroeconomic components such as trade openness (OT) and FDI were sourced from the WB repository (see
Table 1). The decision to use these macroeconomic components was based on the fact that they are useful in explaining a country’s economic prosperity and trade liberalization.
Moreover, given that environmental degradation is broad and multifaceted, this study focused on carbon dioxide (CO2) emissions as the primary indicator due to its universal relevance and direct link to globalization and economic growth. CO2 emissions, as the leading driver of climate change, transcend national boundaries and provide a clear, measurable basis for analyzing environmental impacts. Their strong association with key economic activities such as industrialization, energy use, and trade makes them a critical metric for understanding the environmental consequences of globalization, especially in developing countries like Tanzania. While acknowledging that environmental degradation encompasses issues such as deforestation and water pollution, CO2 emissions offer a consistent and universally recognized starting point for examining the intersection of globalization, economic activity, and environmental quality, laying the foundation for future research to incorporate broader dimensions of degradation.
4.1. Econometric Model
In the analysis, the study employed the autoregressive distributed lag (ARDL) bound test to examine the causal relationship among CO
2 emissions, FDI, GDP per capita, and trade openness [
43]. The time series analysis included univariate analysis, the augmented Dickey–Fuller test for unit root testing, and the estimation of the ARDL model [
43]. The ARDL model, chosen for its advantages over other cointegration tests, was particularly suitable for investigating the existence of cointegration in the variables. Firstly, the ARDL approach can be applied to variables with different orders of integration, whether they are stationary at level or at first difference [
44]. Secondly, the ARDL model is appropriate for studies with small or limited time series observations [
43,
44].
4.2. Estimating Bound Test for Cointegration
The study employs a bound test for cointegration to examine the long-term association among the variables, assessed and interpreted via the F-statistic (Wald test). The decision criteria stipulate that if the F-statistic surpasses the critical value, it indicates the existence of a long-term relationship. The generalized autoregressive distributed lag model can be defined as:
Here, denotes a vector encompassing the study variables (GDP per capita, FDI, CO2, and OT), and represents variables, whether purely I(0), I(1), or cointegrated. β and δ signify coefficients, γ remains constant, takes values from 1 to , and denote optimal lag orders, and denotes an error term vector with a non-observable zero-mean white noise vector process (independently or uncorrelated serially). The dependent variable is modeled as a function of its lagged values, current values, and the lagged values of other exogenous variables. Notably, the lag lengths and may not necessarily be the same, with typically applied to dependent variables and to exogenous variables.
While the ARDL model does not mandate unit root pre-testing, it is crucial that the explanatory variables are not integrated of order 2 (I(2)). Therefore, conducting unit root tests becomes essential to confirm that the variables in question do not exhibit integration of order 2. The generalized ARDL model can be expressed as illustrated in Equation (2).
In this context, where k represents the optimal slack request, d signifies the maximum request for the inclusion of factors, and Δ represents the first-difference operator, CO
2, GDP, FDI, and OT are all presented in natural logarithms. The first part of the equation, featuring coefficients β, φ, δ, Φ, and θ, outlines the dynamics of the short-run model. Meanwhile, the second part, with coefficients
,
,
,
, and
, articulates the dynamic relationships in the long run. Hypotheses for the empirical testing of the long-run relationship can be derived from Equation (2), such that:
If the null hypothesis is rejected, it signifies the presence of a long-term relationship. Within the bound testing methodology, if the calculated F-statistics fall below the lower-bound critical value, the null hypothesis cannot be dismissed. Conversely, if the computed F-statistics exceed the upper-bound significance level, the null hypothesis can be rejected, indicating the existence of a long-term relationship between the variables.
To address missing data, this study employed growth-rate-based imputation, a method that estimates missing values using the average annual growth rate of the variable in question [
45,
46,
47]. This approach was chosen to maintain the consistency and continuity of the time series data while preserving the underlying trend. However, this method assumes stable growth patterns, which may introduce biases if the actual growth rates exhibit significant volatility or structural breaks. Such biases could potentially affect the accuracy of the estimated values and, consequently, the robustness of the results. To mitigate these limitations, the imputed data were carefully validated against available observations, and sensitivity analyses were conducted to assess the impact of the imputed values on the overall findings. Additionally, imputation was restricted to a small portion of the dataset, minimizing the risk of substantial distortions. Despite these precautions, it is acknowledged that growth-rate-based imputation may not fully capture abrupt changes or anomalies in the data [
48,
49,
50,
51].
5. Findings
5.1. Stationarity Test Results
The results presented in
Table 2 indicate that the variables under study—lnFDI, lnCO
2, lnOpen Trade, and lnGDP per Capita—were tested for stationarity using a unit root test at both levels and first differences. In their level forms, none of the variables exhibited evidence of stationarity, as their test statistics exceeded the critical values, indicating the presence of a unit root and confirming non-stationarity. However, upon applying the test to the first-differenced forms of the variables, the test statistics fell significantly below the critical value of −3.648 at the 1% significance level, with all variables demonstrating strong statistical significance. This shift from non-stationarity in level form to stationarity at in first-difference form suggests that the variables are integrated of order 1, denoted as I(1). Consequently, since the variables are integrated of order 1, the bound cointegration test and the ARDL are deemed appropriate for examining potential long-term causal relationships.
5.2. Bound Test for Cointegration Relationship
The results in
Table 3 provide evidence from the bound testing approach regarding the presence of a cointegration relationship among the variables. The computed F-test statistic of 6.837 is substantially higher than the upper-bound critical values (I(1)) at all conventional significance levels: 5.06 at 1%, 4.49 at 2.5%, 4.01 at 5%, and 3.52 at 10%. This indicates that the null hypothesis of no cointegration can be confidently rejected across all levels of significance. Furthermore, the F-test statistic not only exceeds the upper bound but is also well above the lower-bound critical values (I(0)) at each significance level, which further strengthens the conclusion. These findings confirm the existence of a long-term cointegration relationship among the variables, implying that despite short-term fluctuations, the variables move together over time in a stable equilibrium relationship. This result justifies proceeding with further long-term causal analysis using appropriate econometric models such as the ARDL framework.
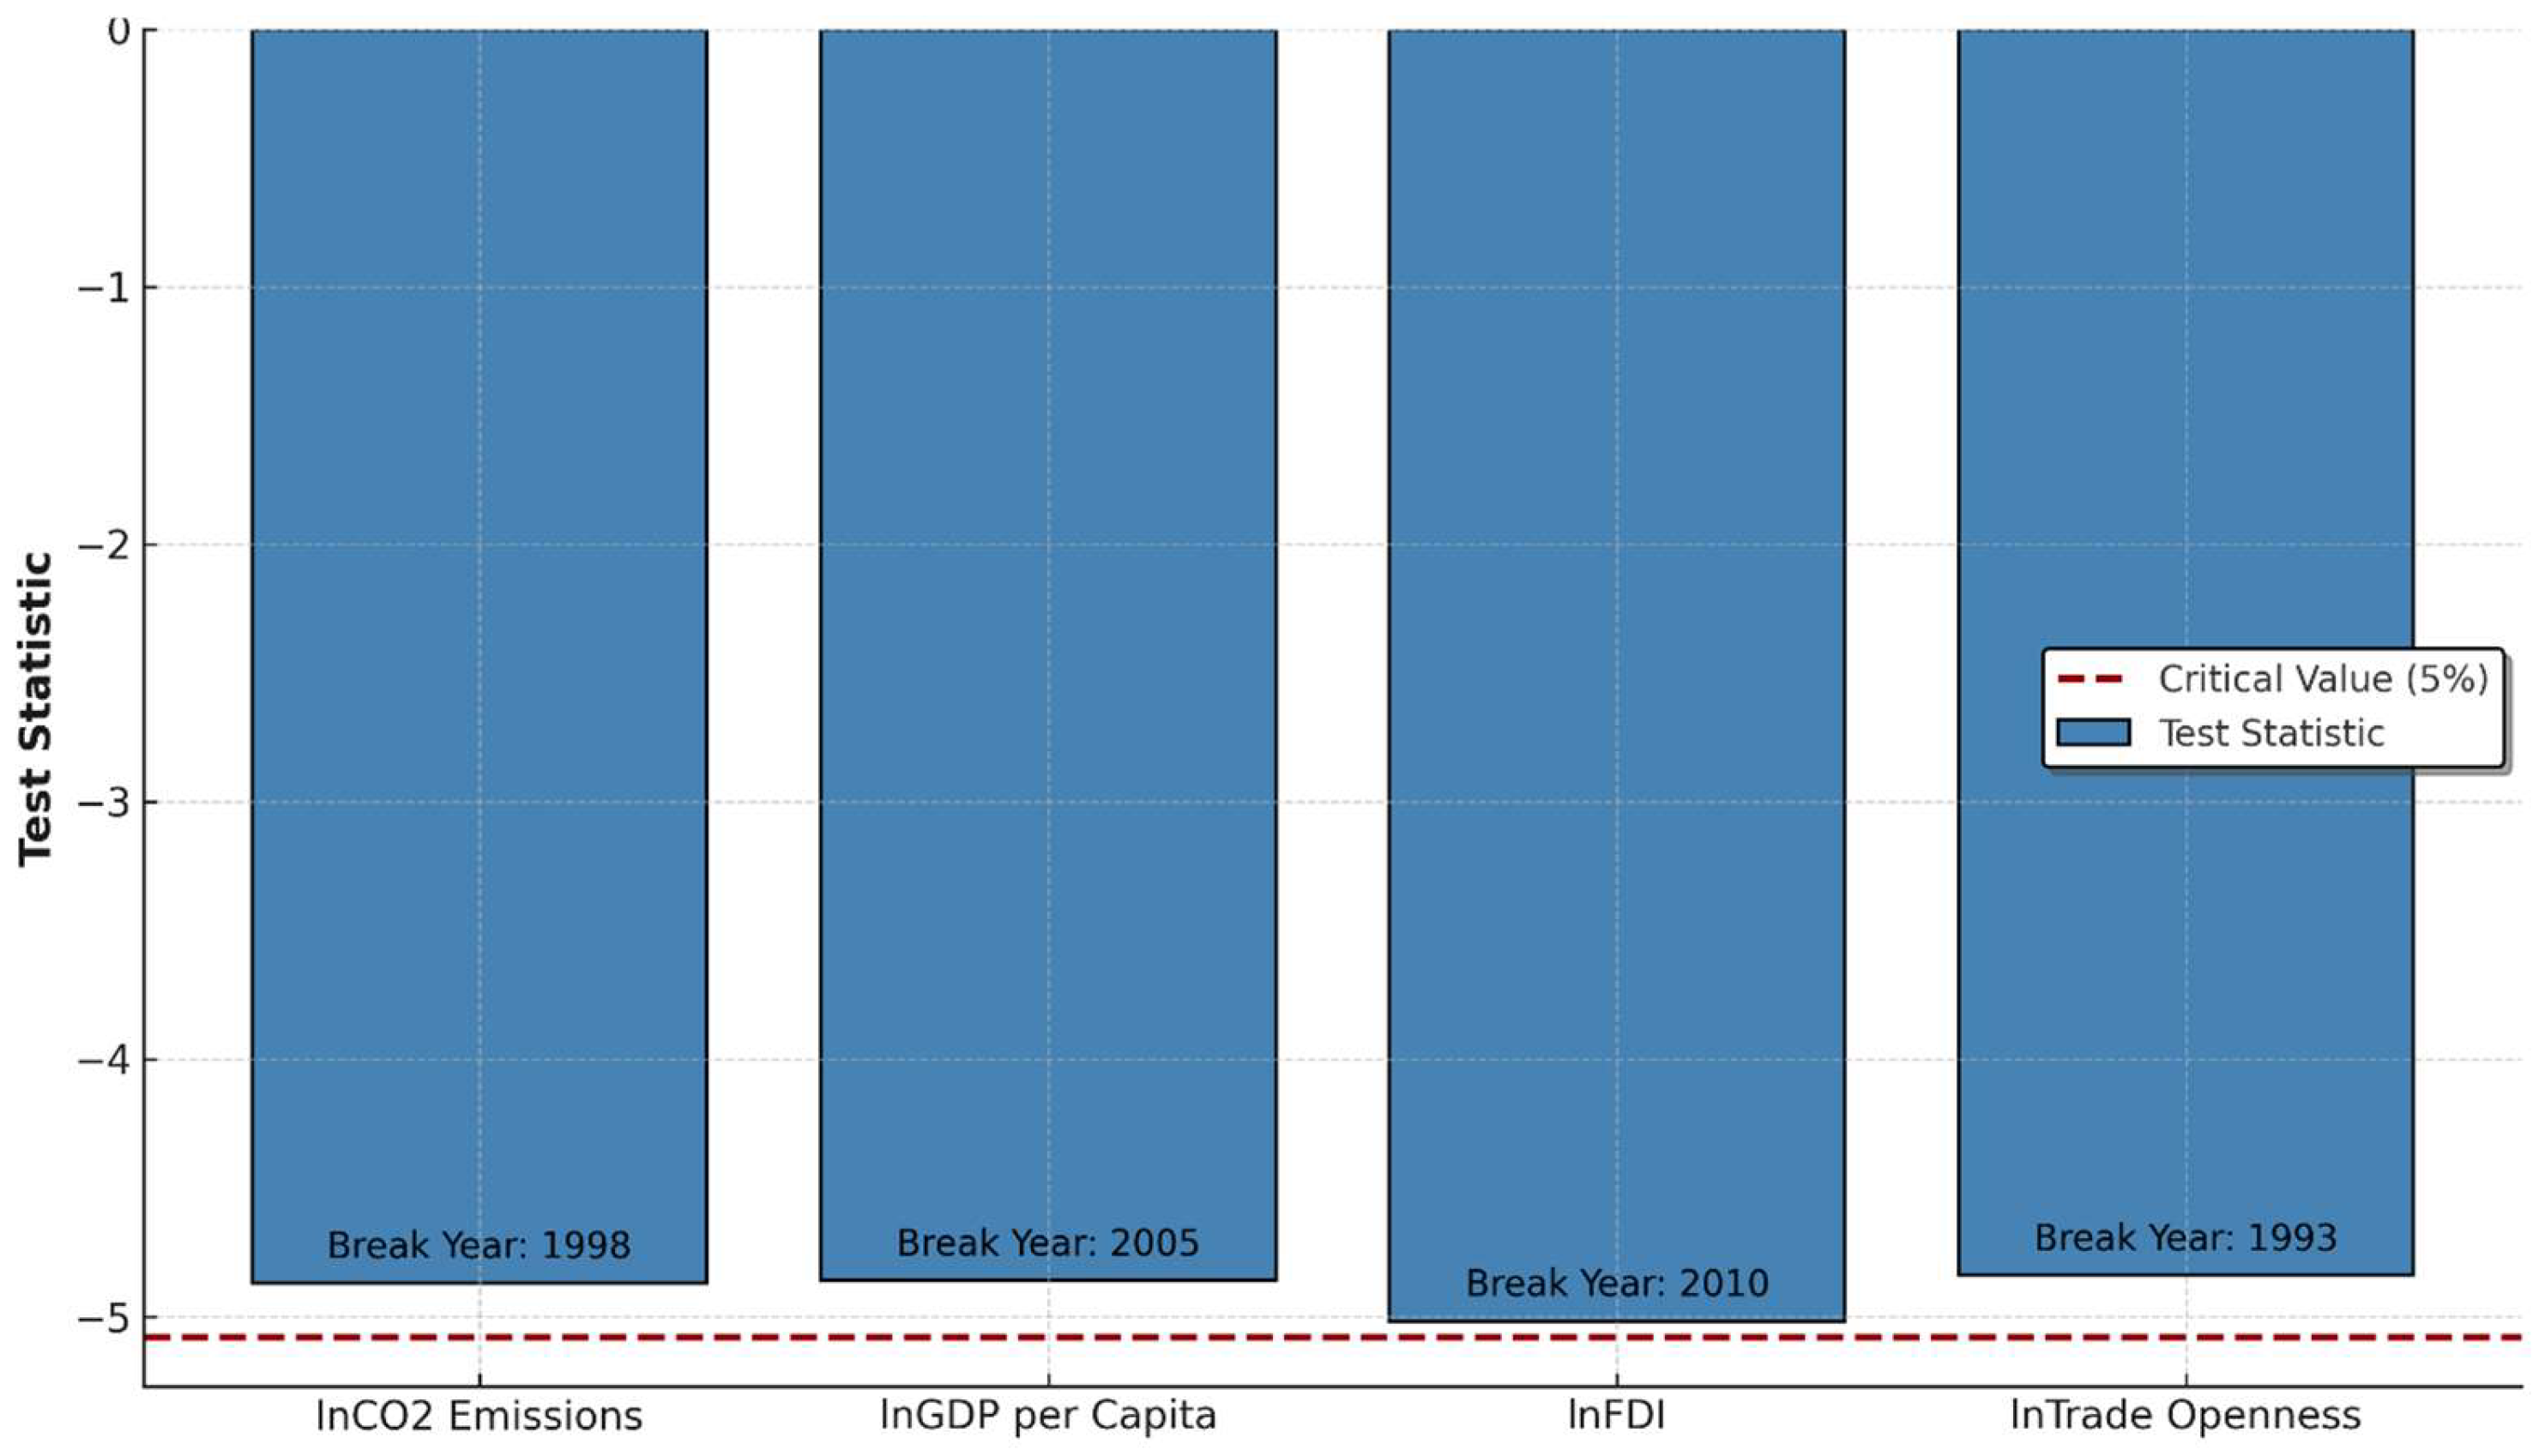
Structural Break Test
The Zivot–Andrews structural break test results shown in
Table 4 indicate no statistically significant structural breaks in lnCO
2 emissions, lnGDP per capita, or lnFDI over the period 1970–2022, as their test statistics (−4.87, −4.86, and −5.02, respectively) are higher than the critical value of −5.08 at the 5% significance level. This suggests that these variables followed gradual and consistent trends over time without abrupt disruptions. For CO
2 emissions, the identified potential break year of 1998 coincides with international environmental efforts, such as the Kyoto Protocol, yet the absence of a significant break implies steady emission patterns tied to Tanzania’s industrial growth. Similarly, the potential break year of 2005 for GDP per capita reflects steady economic growth during a period of reforms, indicating that changes in economic performance were incremental rather than sudden. The potential break in FDI in 2010 aligns with increasing globalization and resource-based investments but lacks statistical significance, suggesting that FDI inflows evolved gradually.
Moreover, the Zivot–Andrews structural break test results for lnFDI and lnTrade Openness indicate no statistically significant structural breaks during the study period spanning from 1970 to 2022, as their test statistics (−5.02 for lnFDI and −4.84 for lnTrade Openness) are higher than the critical value of −5.08 at the 5% significance level. For lnFDI, the potential break year identified is 2010, in a period associated with increasing globalization and resource-driven investments in Tanzania. However, the lack of statistical significance suggests that FDI inflows grew steadily without abrupt shifts, possibly reflecting a gradual response to global market trends and domestic economic policies. Similarly, the potential break year for lnTrade Openness in 1993 corresponds to Tanzania’s trade liberalization efforts, including reductions in trade barriers and alignment with global trade practices. Despite these reforms, the absence of a significant structural break implies that changes in trade openness were implemented progressively, avoiding abrupt disruptions. These findings confirm the stability of these variables, supporting their suitability for econometric analysis and emphasizing the consistent trajectory of Tanzania’s economic integration and globalization efforts. For further information on this, see
Figure 2.
5.3. Interconnection Between Globalization, Economic Performance, and Environmental Degradation in Tanzania
The results in
Table 5 present the ARDL model findings on long-run, short-run, and error correction coefficients, which are divided into short-run and long-run components to analyze both the immediate and sustained impacts of economic variables on CO
2 emissions.
5.3.1. Short-Run Results
In the short run, the coefficient for the first difference of lnGDP per Capita is −0.174826, with a p-value of 0.082, indicating a weakly significant negative relationship with CO2 emissions at the 10% significance level. This suggests that a 1% increase in GDP per capita is associated with a 0.17% decrease in CO2 emissions, potentially reflecting short-term efficiency gains or temporary shifts in economic structure. However, the squared term of GDP per capita is not statistically significant, as indicated by its p-value of 0.135, suggesting no observable short-run nonlinear effects of economic growth on emissions.
The short-run coefficient for lnFDI is 0.0044352, with a p-value of 0.660, indicating no significant impact of foreign direct investment on CO2 emissions in the short run. This can be attributed to structural and policy factors specific to Tanzania, such as delays in the implementation of mega development projects and changes in the country’s economic policies as a result of change in the political regime, which have postponed the environmental effects of FDI. Additionally, Tanzania’s focus on attracting FDI in sectors like agriculture, tourism, and services—industries with lower carbon intensity—limits immediate impacts on emissions. The Environmental Management Act of 2004 and related policies ensure environmental assessments for new investments, potentially mitigating short-term emission increases. Furthermore, slow adoption of advanced technologies and bureaucratic inefficiencies in project approvals can further delay the realization of FDI-related industrial emissions. These factors suggest that while FDI may not affect emissions in the short term, its long-term impact may become more apparent as projects mature and operations scale up. Similarly, trade openness (lnOT) does not have a short-run coefficient listed in the table, implying that its immediate impacts might be minimal or not modeled in this context. Overall, the short-run dynamics suggest that these variables have limited and primarily insignificant effects on CO2 emissions, except for the weakly significant impact of GDP per capita.
5.3.2. Long-Run Results
In the long run, the relationship between GDP per capita and CO2 emissions is strongly positive, with a coefficient of 0.8158919 and a highly significant p-value of 0.000. This indicates that a 1% increase in GDP per capita leads to an approximately 0.82% increase in CO2 emissions, underscoring the long-term environmental costs associated with economic growth. The squared term of GDP per capita is not statistically significant, as its p-value of 0.195 suggests no evidence of a nonlinear relationship, such as that which the environmental Kuznets curve proposes, within the observed data.
The coefficient for foreign direct investment (lnFDI) in the long run is −0.0202299, but it is not statistically significant, with a p-value of 0.281. This implies that FDI does not have a discernible long-term impact on CO2 emissions in this model. In contrast, trade openness (lnOT) exhibits a strong positive relationship with CO2 emissions, with a coefficient of 0.5038924 and a p-value of 0.000. This suggests that increased trade openness is associated with a significant 0.50% rise in CO2 emissions for every 1% increase in trade activity, likely reflecting the environmental consequences of heightened industrial and economic activity tied to trade. Additionally, the adjustment coefficient (error correction term) of −0.4684451 is highly significant, indicating that approximately 46.8% of any deviation from the long-run equilibrium is corrected annually. This confirms the presence of a long-term cointegration relationship among the variables, ensuring that the system reverts to its equilibrium over time.
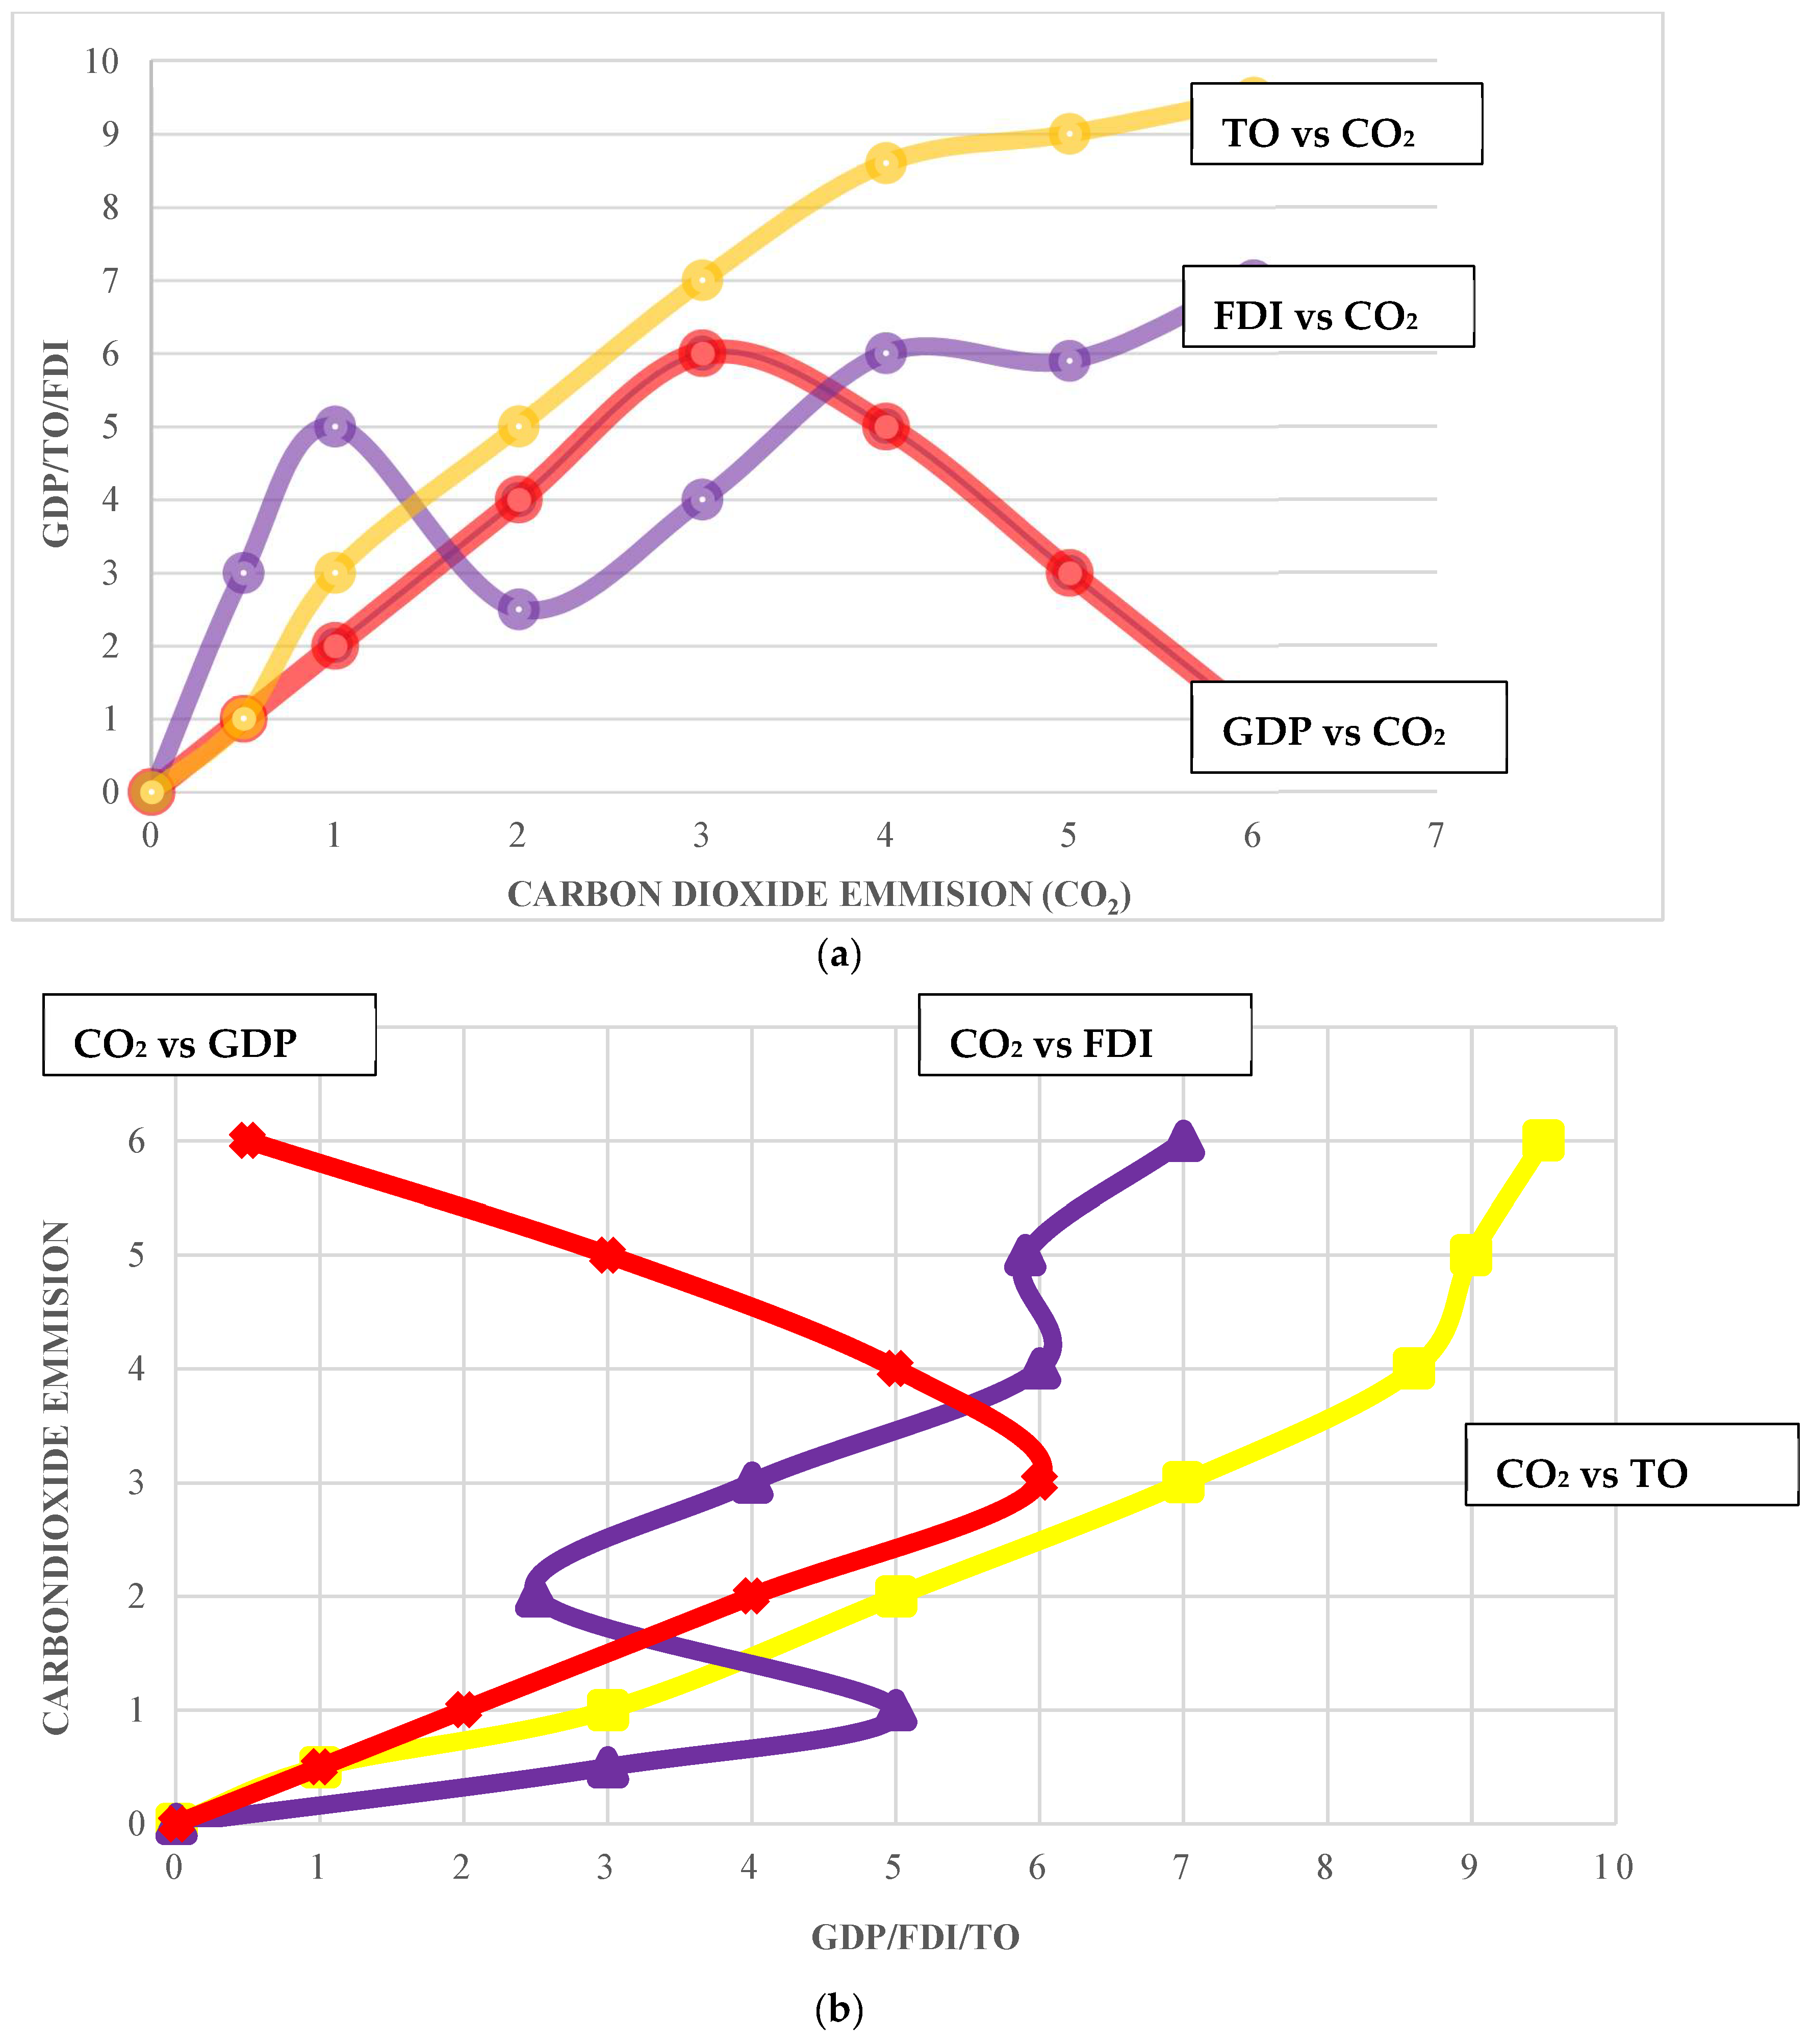
Figure 3a,b illustrate the trends in economic growth, foreign direct investment (FDI), and trade openness and their impact on environmental degradation, as measured by carbon dioxide emissions, over the period from 1970 to 2022. The results reveal a steady increase in economic growth, FDI, and trade openness over the years, though with some fluctuations. Economic growth, represented by GDP, demonstrates a consistent upward trend, beginning at a value of 1 in 1970 and peaking at 6 by 2000, before declining to 3 in 2020 and further to 1 by 2022. FDI displays a more variable pattern, starting at 3 in 1970, reaching a peak of 7 in 2000, and stabilizing around 6 in later years. Trade openness shows a steady rise, beginning at 1 in 1970 and increasing to 9 by 2020, with a marginal decrease to 9.5 by 2022. These patterns suggest that while economic activity and openness to trade have generally grown, the trajectories have not been uniform, with potential implications for their impact on environmental degradation.
Furthermore, the results in
Figure 3a,b indicate distinct relationships between carbon dioxide (CO
2) emissions and GDP per capita. The relationship between GDP per capita and CO
2 emissions follows an inverted-U shape, consistent with the environmental Kuznets curve (EKC) hypothesis. Specifically, when CO
2 emissions reached 3 metric tons per capita, GDP per capita peaked at USD 1200 (TSH 3,120,000). Beyond this point, further increases in CO
2 emissions were associated with a decline in GDP per capita, suggesting that excessive production and industrial activity degrade the environment to a degree that negatively impacts economic growth. This decline highlights the diminishing returns of unchecked industrialization on economic well-being.
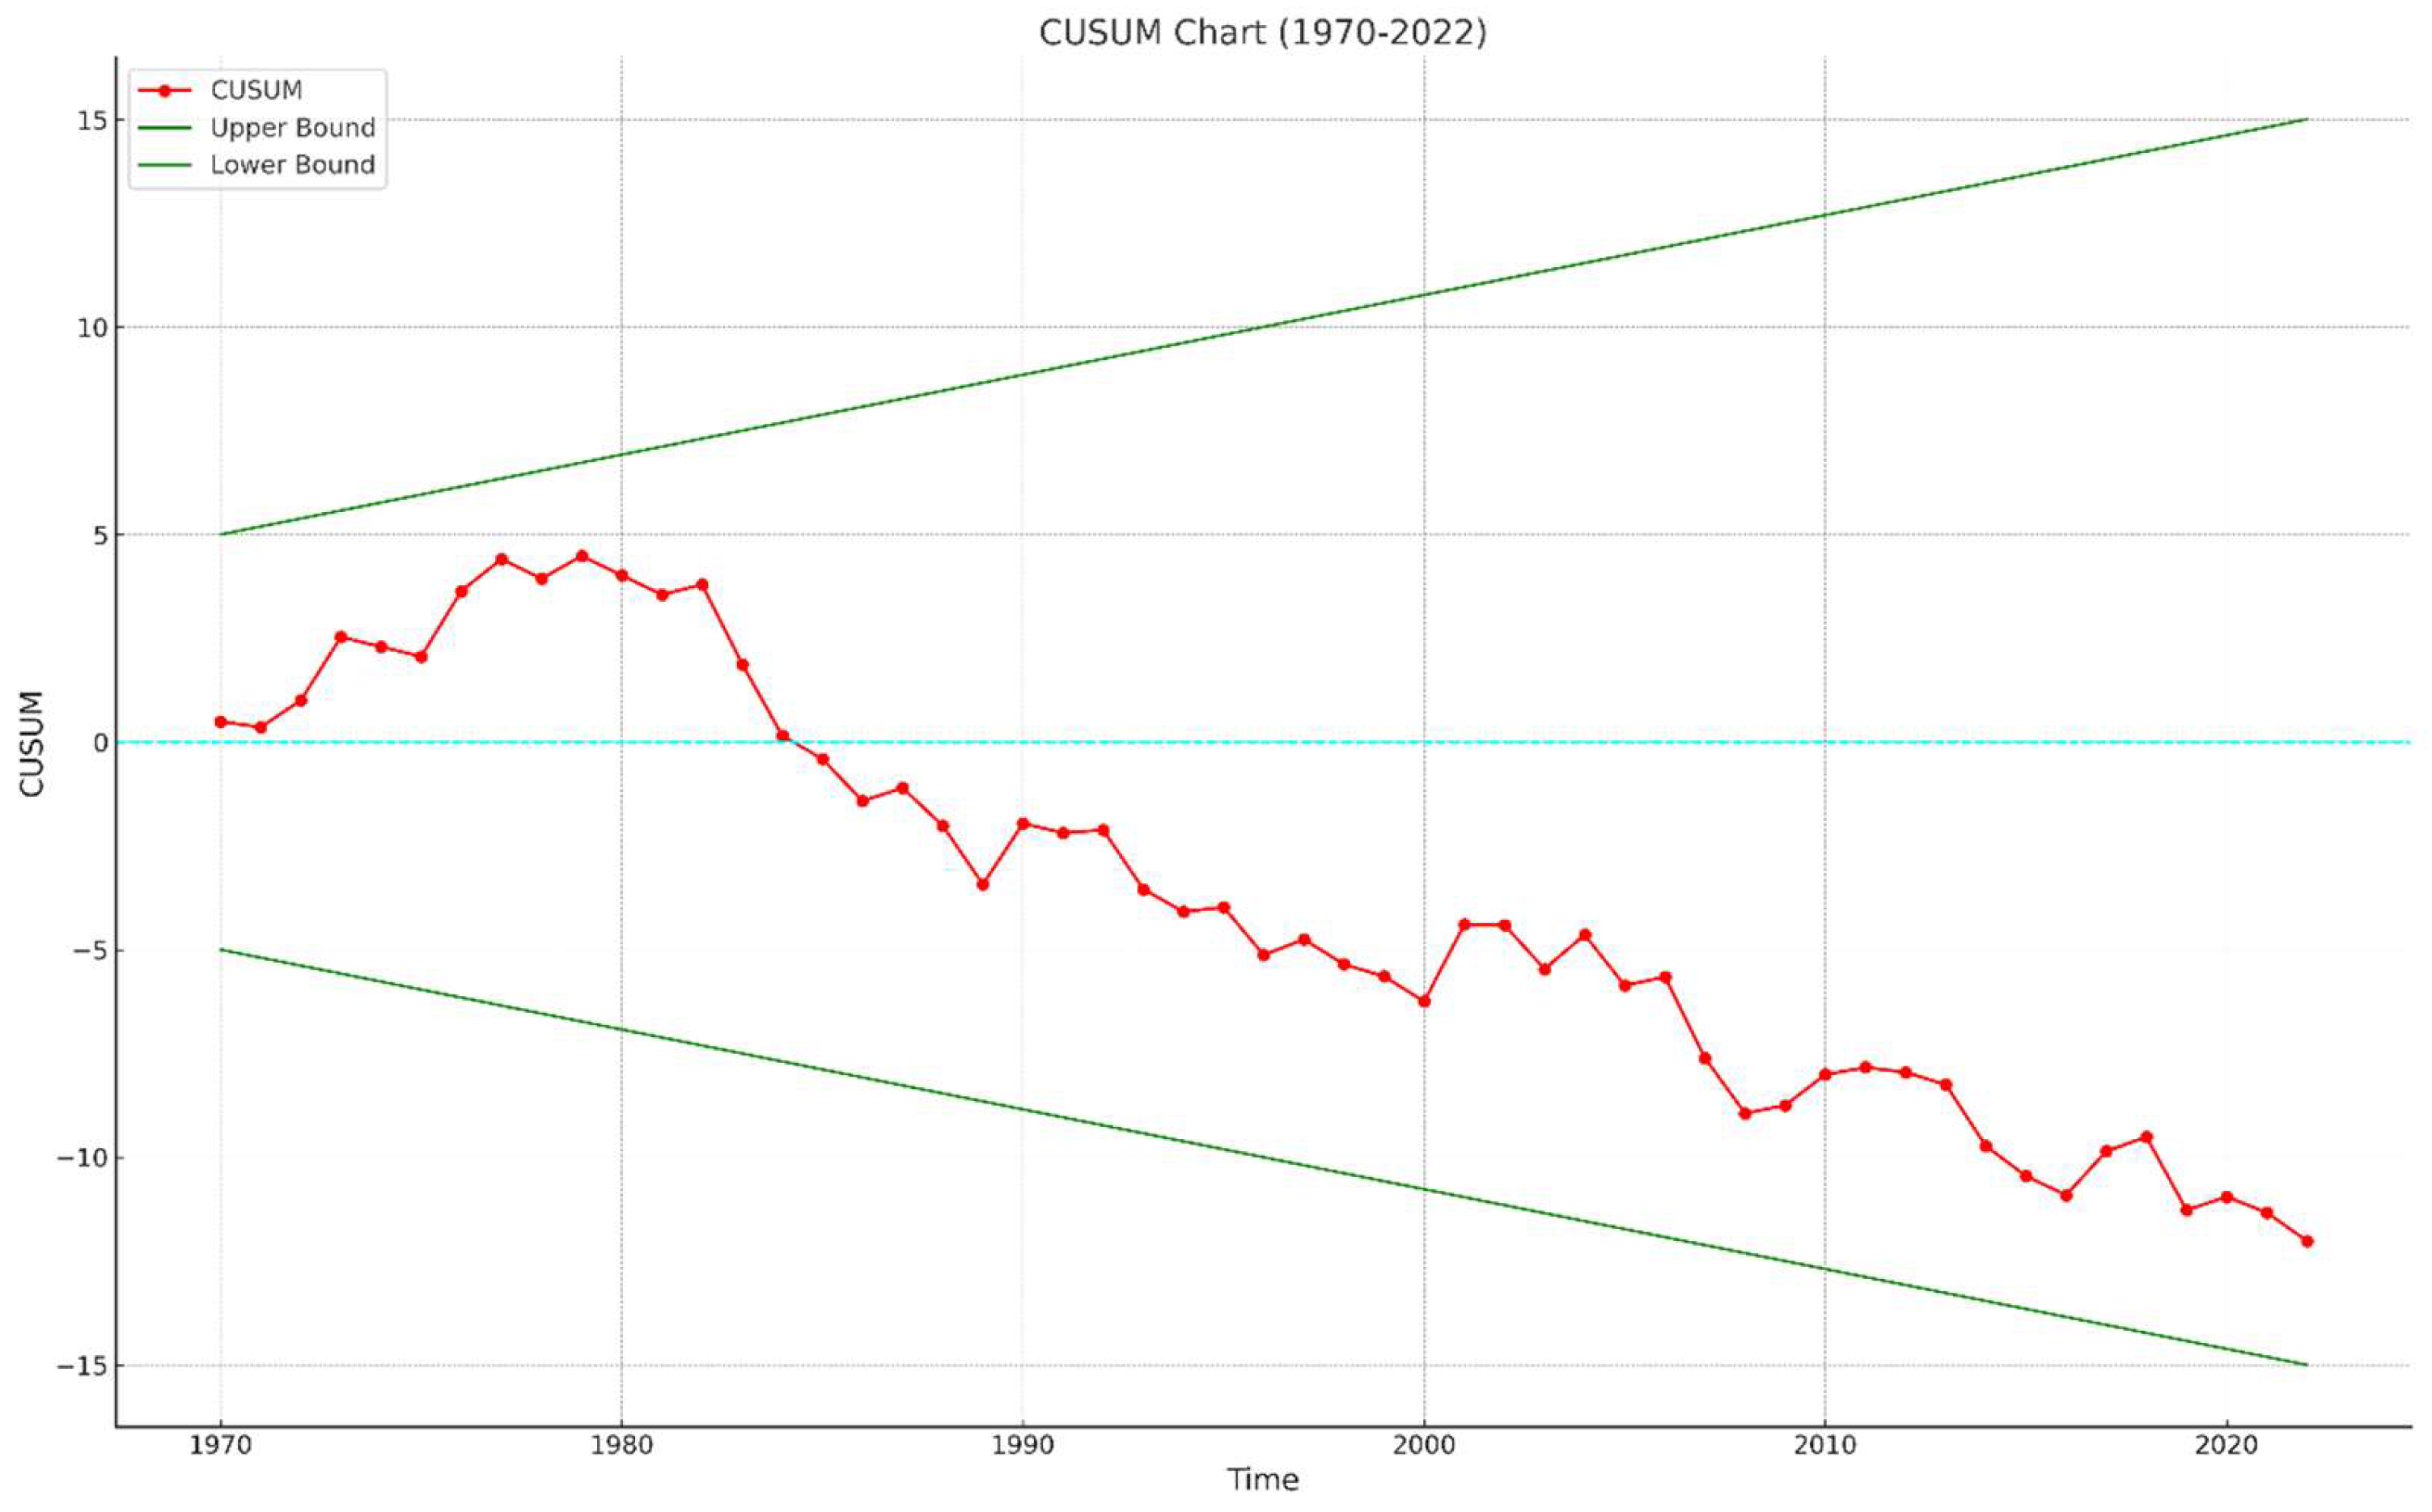
5.4. Model Stability Test
The CUSUM chart in
Figure 4 evaluates the stability of the regression coefficients over time for the period from 1970 to 2022. The red line represents the cumulative sum of recursive residuals (CUSUM), while the green lines denote the upper and lower bounds of the 5% significance level. The CUSUM line remains within these bounds throughout the sample period, indicating the stability of the model’s coefficients. Specifically, although the CUSUM shows some fluctuations, particularly an upward trend in the early years and a steady decline after the 1980s, it does not cross the critical bounds at any point. This suggests that the model is dynamically stable and that the estimated parameters are consistent and reliable over time. Such stability is crucial for the validity of long-term inferences drawn from the model.
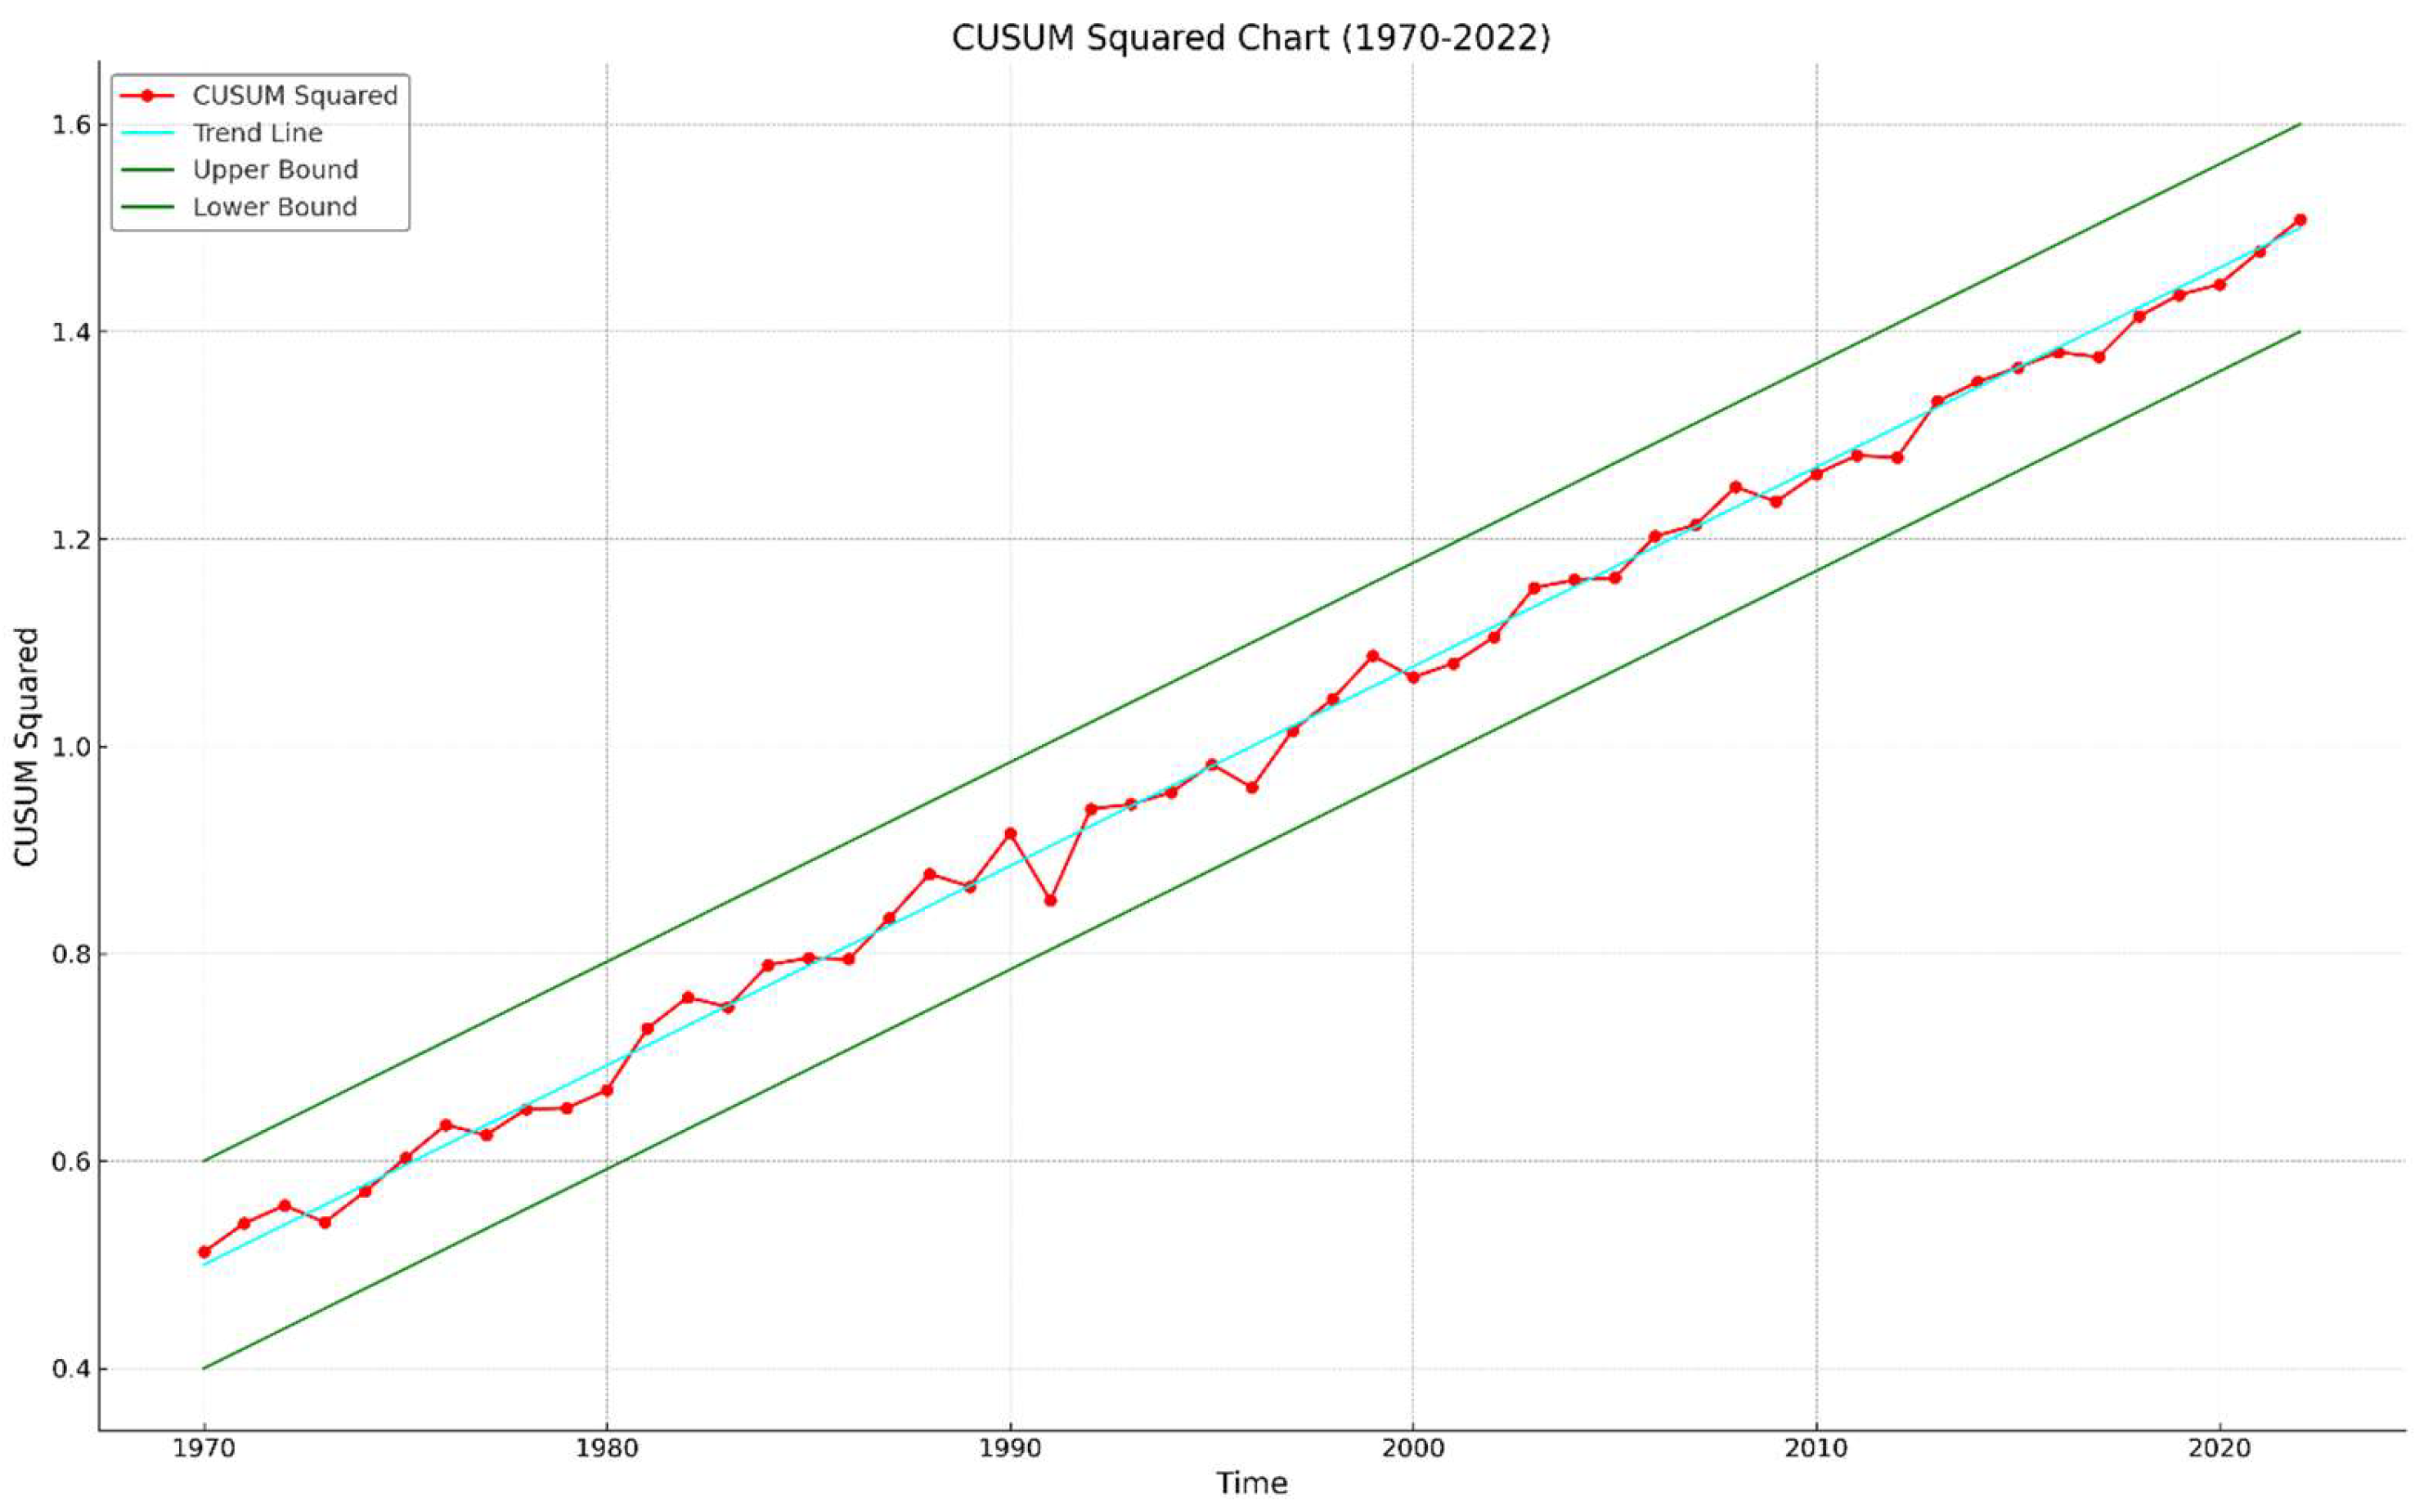
The CUSUM Squared chart in
Figure 5 evaluates the cumulative sum of squared recursive residuals over the period from 1970 to 2022, with the aim of assessing the stability of the regression model over time. The red line represents the CUSUM Squared values, while the green lines indicate the upper and lower critical bounds at the 5% significance level. The CUSUM Squared line remains entirely within the critical bounds throughout the observation period, which confirms the stability of the variance in the model’s residuals. This implies that the model does not suffer from structural instability or significant parameter changes during the sample period. The gradual upward trend in the CUSUM Squared line reflects cumulative increases in variability over time but does not indicate any instability, as it stays well within the critical bounds. These results validate the robustness and reliability of the regression model for making inferences over the examined period.
5.5. Diagnostic Test
The diagnostic test results in
Table 6 indicate that the regression model satisfies key assumptions required for reliability. The Durbin–Watson test and the Breusch–Godfrey LM test both yield results indicating no serial correlation, as their respective probabilities (
p = 1.621733 for Durbin–Watson and
p = 0.2093 for Breusch–Godfrey) exceed conventional significance levels. Additionally, Cameron and Trivedi’s decomposition of the IM test confirms the presence of homoskedasticity, with a
p-value of 0.3075, suggesting that the variance of the residuals is constant across observations. Overall, these diagnostic results support the validity of the model, demonstrating that it is free from issues of autocorrelation and heteroskedasticity, ensuring robust and unbiased parameter estimates.
6. Discussion
In the short run, the weakly significant negative relationship between GDP per capita and CO
2 emissions suggests that economic growth may temporarily reduce emissions, potentially due to the adoption of cleaner production technologies or improved energy efficiency during growth phases [
52,
53]. However, the absence of a significant effect for the squared GDP term indicates that the nonlinear relationship proposed by the environmental Kuznets curve (EKC) hypothesis is not yet observable in Tanzania. This can be attributed to Tanzania’s early stage of industrialization, where structural transformations and significant investments in environmental management are still limited [
54,
55,
56]. Comparative studies in countries like Kenya and Ethiopia show that similar early-stage growth patterns do not lead to immediate reductions in emissions due to the slow adoption of green technologies and limited infrastructure development [
24,
37].
The short-run insignificance of FDI and trade openness can be explained by Tanzania’s structural and policy-specific barriers. FDI inflows are often directed toward agriculture, tourism, and services rather than heavy industry, delaying the observable environmental impact. This trend is consistent with findings from Uganda and Rwanda, where FDI contributions to emissions are limited due to investments in non-pollution-intensive sectors [
28,
39]. Additionally, bureaucratic delays, slow technology transfer, and infrastructure challenges hinder the immediate environmental consequences of FDI. These results emphasize the importance of addressing structural barriers through streamlined investment policies and incentives for green technology adoption to enhance the environmental benefits of FDI.
In the long run, the strong positive relationship between GDP per capita and CO
2 emissions reflects Tanzania’s current stage of development, where growth is associated with environmental degradation. Unlike emerging economies such as China and Brazil, where EKC turning points have been identified at GDP per capita levels between USD 7000 and USD 10,000 [
11,
57], Tanzania’s GDP per capita of approximately USD 1200 (TSH 3,120,000) remains significantly below these thresholds [
32,
33,
35]. This highlights contextual differences in institutional quality, technological capacity, and environmental regulations. For instance, South Africa has made strides in balancing growth and sustainability through investments in renewable energy and stronger regulatory enforcement [
26,
27], an approach that Tanzania could emulate to accelerate its EKC progression.
The significant positive impact of trade openness on CO
2 emissions supports the pollution haven hypothesis, suggesting that Tanzania’s integration into global markets amplifies environmental pressures. This trend is consistent with findings in Nigeria and Sudan, where resource-intensive exports contribute to rising emissions due to weak environmental controls [
28,
29]. In contrast, countries like Vietnam and Malaysia have successfully implemented trade policies that incorporate environmental safeguards and encourage sustainable practices [
25,
58]. Tanzania could adopt similar strategies by integrating emission standards into trade agreements and promoting green export sectors.
The long-run insignificance of FDI may reflect the composition of FDI inflows, which are not heavily concentrated in pollution-intensive sectors. This aligns with studies in Ghana and Mozambique, where FDI has had minimal environmental impact due to a focus on low-emission industries [
24,
30]. To leverage FDI for sustainable growth, Tanzania could implement policies that incentivize green investments through tax breaks, public–private partnerships, and targeted support for renewable energy projects. Examples from Malaysia and Vietnam show that such policies can effectively attract environmentally sustainable FDI while supporting economic growth [
58,
59,
60].
These findings have critical policy implications for balancing growth and sustainability in Tanzania. Trade policies should incorporate environmental safeguards, such as stricter emission standards for exporting industries and incentives for cleaner technologies [
14,
61]. Learning from China’s success in decoupling emissions from growth through targeted trade policies could guide Tanzania’s strategy [
4,
62,
63]. Additionally, strengthening environmental regulations and improving institutional quality will be key. Countries like South Africa and Tunisia have demonstrated the effectiveness of robust regulatory frameworks in mitigating the environmental impacts of globalization [
25,
27].
Contextual differences between Tanzania and other developing countries, such as those in Sub-Saharan Africa and the BRICS economies, underscore the need for tailored approaches. Factors like industrial structure, energy mix, and institutional quality shape the relationships between growth, FDI, trade openness, and emissions [
23,
64,
65]. Tanzania’s reliance on agriculture and extractive industries sets it apart from more diversified economies like South Africa and China, necessitating policies that align with its unique developmental context. By addressing these structural and policy challenges, Tanzania can better balance economic growth with environmental sustainability.
7. Conclusions
This study reveals a strong long-run positive relationship between GDP per capita and CO2 emissions in Tanzania, suggesting that the country is still in the early stages of the environmental Kuznets curve (EKC). The lack of a turning point where emissions decline indicates that Tanzania has not yet achieved the economic and technological thresholds needed to decouple economic growth from environmental degradation. Additionally, the significant positive impact of trade openness on emissions highlights the environmental costs of globalization, particularly given Tanzania’s reliance on resource extraction and export-driven industries. The short-run insignificance of FDI suggests that structural and policy-related barriers delay the environmental impact of investments, limiting their immediate effect on emissions.
Moreover, this study recommends a range of strategies to help Tanzania achieve its goal of balancing economic growth with environmental sustainability, particularly as the country approaches the end of Tanzania Development Vision 2025 (TDV 2025). Our findings highlight the need for specific interventions to address the environmental impacts associated with economic activities, trade openness, and foreign direct investment (FDI).
In the energy sector, Tanzania should prioritize investments in renewable energy sources such as solar, wind, and hydropower to reduce reliance on fossil fuels. Promoting decentralized energy systems, like off-grid solar solutions for rural areas, can expand energy access while minimizing emissions. The government could offer subsidies, low-interest loans, and tax incentives for businesses and households investing in clean energy technologies. Additionally, enhancing energy efficiency in key industries through regulations and mandatory energy audits can help manage emissions alongside economic growth.
In the agriculture sector, adopting climate-smart agricultural practices such as agroforestry, crop diversification, and efficient irrigation systems is essential for reducing environmental degradation and increasing productivity. Providing training programs, technical support, and financial incentives for farmers to adopt sustainable practices can facilitate this transition. Initiatives like public–private partnerships (PPPs) for promoting green agriculture and offering grants or subsidies for eco-friendly farming inputs can further support these efforts.
For extractive industries, strengthening environmental impact assessments (EIAs), enforcing strict regulations, and mandating the rehabilitation of mining sites are critical steps to mitigate environmental damage. Encouraging value-added processing within the country, rather than exporting raw materials, can reduce carbon footprint while generating higher economic returns. The government should also provide incentives for adopting green mining technologies and establish certification programs for sustainable extraction practices.
To promote green growth through trade openness, Tanzania should integrate environmental safeguards into trade agreements by setting emissions standards for exporting industries and ensuring compliance with international environmental norms. Encouraging the export of eco-friendly products, such as sustainably produced agricultural goods or low-carbon manufacturing outputs, can enhance the country’s competitiveness. Establishing green certification programs and facilitating access to international eco-labeling schemes can help Tanzanian products meet global sustainability standards. Leveraging frameworks like the African Continental Free Trade Area (AfCFTA) to push for region-wide environmental standards can ensure that trade growth does not compromise environmental integrity.
Attracting sustainable FDI is crucial for supporting green growth. Tanzania should offer tax incentives and financial support for investments in renewable energy, clean manufacturing, and sustainable infrastructure. Streamlining the public–private partnership (PPP) process by reducing bureaucratic delays and increasing transparency can attract environmentally responsible investors. Establishing dedicated green investment zones and developing clear guidelines for environmentally friendly investments will further enhance Tanzania’s appeal. Additionally, strengthening collaboration with international organizations can provide technical assistance, funding opportunities, and best practices for sustainable development. By implementing these strategies, Tanzania can leverage economic growth to achieve environmental sustainability, aligning with the goals of TDV 2025 and paving the way for long-term resilience and inclusive development.
However, this study has certain limitations that should be acknowledged. The reliance on secondary data may introduce inaccuracies or biases inherent in the data sources. Furthermore, the use of CO2 emissions as the sole indicator of environmental degradation does not capture the full spectrum of environmental impacts, such as biodiversity loss, water pollution, or deforestation, which are particularly relevant in Tanzania. Future research should incorporate a broader range of environmental indicators and explore the multidimensional effects of economic activities on the environment. Also, given the limitation of the growth-rate-based imputation, future studies could explore alternative imputation techniques, such as machine learning or multiple imputation methods, to further enhance data reliability and reduce potential biases. Additionally, analyzing disaggregated data at the sectoral level could provide deeper insights into the industries driving emissions and help design more-targeted policies. These efforts would provide a more comprehensive understanding of the trade-offs between economic growth and environmental sustainability in Tanzania and beyond.
Author Contributions
Conceptualization, F.A.K., J.K.S., O.F.A., A.O.I., T.O.O. and N.Z.K.; Methodology, J.K.S., A.O.I., T.O.O., C.U.E., N.Z.K. and K.M.E.; Validation, J.K.S.; Formal analysis, F.A.K.; Resources, O.F.A., A.O.I., T.O.O., C.U.E., H.S.K. and K.M.E.; Data curation, N.Z.K.; Writing—original draft, F.A.K.; Writing—review & editing, J.K.S., O.F.A., A.O.I., T.O.O., C.U.E., N.Z.K., H.S.K. and K.M.E.; Visualization, F.A.K.; Supervision, C.U.E. and H.S.K.; Funding acquisition, H.S.K. and K.M.E. All authors have read and agreed to the published version of the manuscript.
Funding
This research was supported by The Researchers Supporting Project number (RSPD2024R952), King Saud University, Riyadh, Saudi Arabia.
Institutional Review Board Statement
Not applicable.
Informed Consent Statement
Not applicable.
Data Availability Statement
Data will be made available upon reasonable request.
Conflicts of Interest
The authors declare no conflicts of interest.
References
- Akadiri, S.S.; Adebayo, T.S.; Nakorji, M.; Mwakapwa, W.; Inusa, E.M.; Izuchukwu, O.O. Impacts of globalization and energy consumption on environmental degradation: What is the way forward to achieving environmental sustainability targets in Nigeria? Environ. Sci. Pollut. Res. 2022, 29, 60426–60439. [Google Scholar] [CrossRef] [PubMed]
- Copeland, B.R.; Shapiro, J.S.; Taylor, M.S. Globalization and the Environment. NBER Working Paper 28797. 2022. Available online: https://www.nber.org/papers/w28797 (accessed on 4 May 2024).
- Tawiah, V.; Zakari, A.; Adedoyin, F.F. Determinants of green growth in developed and developing countries. Environ. Sci. Pollut. Res. 2021, 28, 39227–39242. [Google Scholar] [CrossRef] [PubMed]
- Blocher, J.M.; Hoffmann, R.; Weisz, H. The effects of environmental and non-environmental shocks on livelihoods and migration in Tanzania. Popul. Environ. 2024, 46, 7. [Google Scholar] [CrossRef]
- Wang, Q.; Zhang, F. The effects of trade openness on decoupling carbon emissions from economic growth—Evidence from 182 countries. J. Clean. Prod. 2021, 279, 123838. [Google Scholar] [CrossRef]
- Issa, S.S.; Tabash, M.I.; Ahmed, A.; Riyadh, H.A.; Alnahhal, M.; Varma, M. Investigating the relationship between energy consumption and environmental degradation with the moderating influence of technological innovation. J. Risk Financ. Manag. 2024, 17, 419. [Google Scholar] [CrossRef]
- Byaro, M.; Mafwolo, G.; Mayaya, H. Keeping an eye on environmental quality in Tanzania as trade, industrialization, income, and urbanization continue to grow. Environ. Sci. Pollut. Res. 2022, 29, 59002–59012. [Google Scholar] [CrossRef]
- Chowdhury, T.S.; Mawa, M.; Islam, R.U.; Uddin, I.; Rahman, H. Nature and cause of CO2 emission in Eastern Africa: Role of tourism and afforestation towards reducing CO2 emission. Soc. Sci. Humanit. Open 2024, 10, 101051. [Google Scholar] [CrossRef]
- Pauline, N.M.; Lema, G.A. Consideration of climate change on environmental impact assessment in Tanzania: Challenges and prospects. Environ. Manag. 2024, 74, 350–364. [Google Scholar] [CrossRef]
- Chou, C.-H.; Ngo, S.L.; Tran, P.P. Renewable energy integration for sustainable economic growth: Insights and challenges via bibliometric analysis. Sustainability 2023, 15, 15030. [Google Scholar] [CrossRef]
- Hoang, T.A.; Thi-Thieu, H.D.; Nguyen, M.H.; Hong, V.D. The impact of foreign direct investment on environment degradation: Evidence from emerging markets in Asia. Int. J. Environ. Res. Public Health 2019, 16, 1636. [Google Scholar] [CrossRef]
- Hunjra, A.I.; Bouri, E.; Azam, M.; Azam, R.I.; Dai, J. Economic growth and environmental sustainability in developing economies. Res. Int. Bus. Financ. 2024, 70, 102341. [Google Scholar] [CrossRef]
- Huang, Y.; Chen, X.; Zhu, H.; Huang, C.; Tian, Z. The heterogeneous effects of FDI and foreign trade on CO2 emissions: Evidence from China. Math. Probl. Eng. 2019, 2019, 9612492. [Google Scholar] [CrossRef]
- Shahbaz, M.; Solarin, S.A.; Ozturk, I. Environmental Kuznets curve hypothesis and the role of globalization in selected African countries. Ecol. Indic. 2016, 67, 623–636. [Google Scholar] [CrossRef]
- Kuznets, S. Economic growth and income inequality. Am. Econ. Rev. 1955, 49, 1–28. Available online: https://assets.aeaweb.org/asset-server/files/9438.pdf (accessed on 17 November 2023).
- Fraser, N.; Pettifor, A. Understanding capitalism. IPPR Prog. Rev. 2018, 25, 154–165. [Google Scholar] [CrossRef]
- Campano, F.; Salvatore, D. Economic development, income inequality and Kuznets’ U-shaped hypothesis. J. Policy Model. 1988, 10, 265–280. [Google Scholar] [CrossRef]
- Grossman, G.; Krueger, A. Environmental impacts of a North American Free Trade Agreement. Natl. Bur. Econ. Res. Work. Pap. 1991, 3194. [Google Scholar] [CrossRef]
- Aladejare, S.A. Natural resource rents, globalization and environmental degradation: New insight from 5 richest African economies. Resour. Policy 2022, 78, 102909. [Google Scholar] [CrossRef]
- Birdsall, N.; Wheeler, D. Trade policy and industrial pollution in Latin America: Where are the pollution havens? J. Environ. Dev. 1993, 2, 137–149. [Google Scholar] [CrossRef]
- Destek, M.A.; Okumus, I. Does pollution haven hypothesis hold in newly industrialized countries? Evidence from ecological footprint. Environ. Sci. Pollut. Res. 2019, 26, 23689–23695. [Google Scholar] [CrossRef]
- Ahmad, M.; Jabeen, G.; Wu, Y. Heterogeneity of pollution haven/halo hypothesis and environmental Kuznets curve hypothesis across development levels of Chinese provinces. J. Clean. Prod. 2021, 285, 124898. [Google Scholar] [CrossRef]
- Sun, H.; Enna, L.; Monney, A.; Tran, D.K.; Rasoulinezhad, E.; Taghizadeh-Hesary, F. The long-run effects of trade openness on carbon emissions in Sub-Saharan African countries. Energies 2020, 13, 5295. [Google Scholar] [CrossRef]
- Tenaw, D.; Beyene, A.D. Environmental sustainability and economic development in Sub-Saharan Africa: A modified EKC hypothesis. Renew. Sustain. Energy Rev. 2021, 143, 110897. [Google Scholar] [CrossRef]
- Fodha, M.; Zaghdoud, O. Economic growth and pollutant emissions in Tunisia: An empirical analysis of the environmental Kuznets curve. Energy Policy 2010, 38, 1150–1156. [Google Scholar] [CrossRef]
- Kelly, A.M.; Nembot Ndeffo, L. Understanding the nexus: Economic complexity and environmental degradation in Sub-Saharan Africa. Clean Technol. Environ. Policy 2024, 26. [Google Scholar] [CrossRef]
- Jian, L.; Chuimin, K.; Jijian, Z.; Yusheng, K.; Ntarmah, A.H. The relationship between economic growth and environmental degradation: Could West African countries benefit from EKC hypothesis? Environ. Sci. Pollut. Res. 2022, 29, 73052–73070. [Google Scholar] [CrossRef]
- Elfaki, K.E.; Ahmed, E.M. Globalization and financial development contributions toward economic growth in Sudan. Res. Glob. 2024, 9, 100246. [Google Scholar] [CrossRef]
- Popoola, J. Globalization and Nigeria’s economic development—A study of the interconnectedness. Open J. Political Sci. 2020, 10, 460–480. [Google Scholar] [CrossRef]
- Demena, B.A.; Afesorgbor, S.K. The effect of FDI on environmental emissions: Evidence from a meta-analysis. Energy Policy 2020, 138, 111192. [Google Scholar] [CrossRef]
- Ajide, F.M.; Soyemi, K.A.; Oladipupo, S.A. Business climate and environmental degradation: Evidence from Africa. Environ. Dev. Sustain. 2024, 26, 4753–4779. [Google Scholar] [CrossRef]
- Sharif, A.; Mehmood, U.; Tariq, S.; Haq, Z.U. The role of financial inclusion and globalization toward a sustainable economy in ASEAN countries: Evidence from advanced panel estimations. Environ. Dev. Sustain. 2023, 26, 10243–10260. [Google Scholar] [CrossRef]
- Phong, L.H. Globalization, financial development, and environmental degradation in the presence of environmental Kuznets curve: Evidence from ASEAN-5 countries. Int. J. Energy Econ. Policy 2019, 9, 40–50. [Google Scholar] [CrossRef]
- Çetin, M.; Sarıgül, S.S.; Topcu, B.A.; Alvarado, R.; Karataser, B. Does globalization mitigate environmental degradation in selected emerging economies? Environ. Sci. Pollut. Res. 2023, 30, 100340–100359. [Google Scholar] [CrossRef] [PubMed]
- Yang, B.; Jahanger, A.; Usman, M.; Khan, M.A. The dynamic linkage between globalization, financial development, energy utilization, and environmental sustainability in GCC countries. Environ. Sci. Pollut. Res. 2021, 28, 16568–16588. [Google Scholar] [CrossRef]
- Okereke, C. Degrowth, green growth, and climate justice for Africa. Rev. Int. Stud. 2024, 50, 910–920. [Google Scholar] [CrossRef]
- Rakshit, B.; Jain, P.; Sharma, R.; Bardhan, S. An empirical investigation of the effects of poverty and urbanization on environmental degradation: The case of Sub-Saharan Africa. Environ. Sci. Pollut. Res. 2023, 30, 51887–51905. [Google Scholar] [CrossRef]
- Huang, Y.; Chen, F.; Wei, H.; Xiang, J.; Xu, Z.; Akram, R. The impacts of FDI inflows on carbon emissions: Economic development and regulatory quality as moderators. Front. Energy Res. 2021, 9, 820596. [Google Scholar] [CrossRef]
- Zhao, Y.; Liu, S. Effects of climate change on economic growth: A perspective of the heterogeneous climate regions in Africa. Sustainability 2023, 15, 7136. [Google Scholar] [CrossRef]
- Ssekibaala, D.S.; Ariffin, M.I.; Duasa, J. Economic growth, international trade, and environmental degradation in Sub-Saharan Africa. J. Econ. Dev. 2022, 24, 293–308. [Google Scholar] [CrossRef]
- Martín Cervantes, P.A.; Rueda López, N.; Cruz Rambaud, S. The effect of globalization on economic development indicators: An inter-regional approach. Sustainability 2020, 12, 1942. [Google Scholar] [CrossRef]
- Kyatikila, W.A.; Shitundu, J.; Kahyarara, G. Economic growth and environmental pollution in Tanzania: An environmental Kuznets curve analysis. Tanzan. J. Popul. Stud. Dev. 2023, 30, 56–77. [Google Scholar] [CrossRef]
- Pesaran, M.H.; Shin, Y.; Smith, R.J. Bounds testing approaches to the analysis of level relationships. J. Appl. Econ. 2001, 16, 289–326. [Google Scholar] [CrossRef]
- Natsiopoulos, K.; Tzeremes, N.G. ARDL bounds test for cointegration: Replicating the Pesaran et al. (2001) results for the UK earnings equation using R. J. Appl. Econ. 2022, 37, 1079–1090. [Google Scholar] [CrossRef]
- He, K.; Ramzan, M.; Awosusi, A.A.; Ahmed, Z.; Ahmad, M.; Altuntaş, M. Does globalization moderate the effect of economic complexity on CO2 emissions? Evidence from the top 10 energy transition economies. Front. Environ. Sci. 2021, 9, 778088. [Google Scholar] [CrossRef]
- Shahbaz, M.; Khan, S.; Ali, A.; Bhattacharya, M. The impact of globalization on CO2 emissions in China. Singap. Econ. Rev. 2017, 62, 929–957. [Google Scholar] [CrossRef]
- Alvarado, R.; Toledo, E. Environmental degradation and economic growth: Evidence for a developing country. Environ. Dev. Sustain. 2017, 19, 1205–1218. [Google Scholar] [CrossRef]
- Acheampong, A.O.; Opoku, E.E.O. Environmental degradation and economic growth: Investigating linkages and potential pathways. Energy Econ. 2023, 123, 106734. [Google Scholar] [CrossRef]
- Sani, Y.S.; Abubakar, I.Y.; Adam, S.B.; Dharwal, M.; Singh, P.; Sharma, P. Economic growth and environmental degradation in the developing world: Evidence from Nigeria (1981–2019). Mater. Today Proc. 2020, 49, 3177–3180. [Google Scholar] [CrossRef]
- Uddin, M.M.; Sharif, T.; Islam, A.R.M.; Abedin, M.Z. Moderating impact of FDI on the growth-environment nexus in the pre-COVID-19 eras. Res. Int. Bus. Financ. 2024, 67, 102114. [Google Scholar] [CrossRef]
- Li, R.; Jiang, H.; Sotnyk, I.; Kubatko, O.; Almashaqbeh, Y.A.I. The CO2 emissions drivers of post-communist economies in Eastern Europe and Central Asia. Atmosphere 2020, 11, 1019. [Google Scholar] [CrossRef]
- Yameogo, C.E.W.; Dauda, R.O.S. The effect of income inequality and economic growth on environmental quality: A comparative analysis between Burkina Faso and Nigeria. J. Public Aff. 2022, 22, e2566. [Google Scholar] [CrossRef]
- Dong, H.; Cai, Y.; Shi, X. Does globalization promote economic output in Sub-Saharan Africa? Evidence from bootstrap ARDL model. J. Asian Afr. Stud. 2021, 56, 1795–1818. [Google Scholar] [CrossRef]
- Anderson, D.; Cavendish, W. Dynamic simulation and environmental policy analysis: Beyond comparative statics and the environmental Kuznets curve. Oxf. Econ. Pap. 2001, 53, 721–746. [Google Scholar] [CrossRef]
- Joo, B.A.; Shawl, S. Understanding the relationship between foreign direct investment and economic growth in BRICS: Panel ARDL approach. Vikalpa 2023, 48, 100–113. [Google Scholar] [CrossRef]
- Mlambo, C. Financial development and economic growth: Evidence from low-income nations in the SADC region. Int. J. Financ. Stud. 2024, 12, 62. [Google Scholar] [CrossRef]
- Freire, F.S.; da Silva, N.O.; de Oliveira, V.R.F. Economic growth and greenhouse gases in Brazilian states: Is the environmental Kuznets curve applicable hypothesis? Environ. Sci. Pollut. Res. 2023, 30, 44928–44942. [Google Scholar] [CrossRef]
- Uddin, M.M.M. Revisiting the impacts of economic growth on environmental degradation: New evidence from 115 countries. Environ. Ecol. Stat. 2021, 28, 153–185. [Google Scholar] [CrossRef]
- Sajeev, A.; Kaur, S. Environmental sustainability, trade and economic growth in India: Implications for public policy. Int. Trade Polit. Dev. 2020, 4, 141–160. [Google Scholar] [CrossRef]
- Kung, C.-C.; Lee, T.-J.; Chen, L.-J. Economic growth and environmental sustainability from renewable energy applications. Energy Explor. Exploit. 2021, 39, 531–535. [Google Scholar] [CrossRef]
- Obiora, S.C.; Zeng, Y.; Li, Q.; Asiedu-Ayeh, E.; Nneji, G.U.; Bamisile, O. The economic growth and environmental sustainability nexus: A meta-analysis of three economic types. J. Environ. Plan. Manag. 2021, 65, 2556–2586. [Google Scholar] [CrossRef]
- Cai, J.; Chen, Q.; Zhang, Z. Balancing environmental sustainability and economic development: Perspectives from new structural economics. Sustainability 2024, 16, 1124. [Google Scholar] [CrossRef]
- Jiang, Y.; Zheng, J. Economic growth or environmental sustainability? Drivers of pollution in the Yangtze River Delta urban agglomeration in China. Emerg. Mark. Financ. Trade 2017, 53, 2625–2643. [Google Scholar] [CrossRef]
- Hirai, T. A balancing act between economic growth and sustainable development: Historical trajectory through the lens of development indicators. Sustain. Dev. 2022, 30, 1900–1910. [Google Scholar] [CrossRef]
- Lu, F.; Ma, F.; Feng, L. Carbon dioxide emissions and economic growth: New evidence from GDP forecasting. Technol. Forecast. Soc. Chang. 2024, 205, 123464. [Google Scholar] [CrossRef]
| Disclaimer/Publisher’s Note: The statements, opinions and data contained in all publications are solely those of the individual author(s) and contributor(s) and not of MDPI and/or the editor(s). MDPI and/or the editor(s) disclaim responsibility for any injury to people or property resulting from any ideas, methods, instructions or products referred to in the content. |
© 2024 by the authors. Licensee MDPI, Basel, Switzerland. This article is an open access article distributed under the terms and conditions of the Creative Commons Attribution (CC BY) license (https://creativecommons.org/licenses/by/4.0/).


 ,
, 
