Review

Sustainability of Nuclear Energy—A Critical Review from a UK Perspective

1
Central Laboratory, National Nuclear Laboratory, Seascale, Sellafield CA20 1PG, UK
2
Faculty of Science and Engineering, The University of Manchester, Manchester M13 9PL, UK
3
Chadwick House, National Nuclear Laboratory, Risley, Warrington WA3 6AE, UK
*
Authors to whom correspondence should be addressed.
Sustainability 2024, 16(24), 10952; https://doi.org/10.3390/su162410952
Submission received: 29 October 2024 / Revised: 29 November 2024 / Accepted: 9 December 2024 / Published: 13 December 2024
(This article belongs to the Section Energy Sustainability)

Abstract

:
Many countries, including the United Kingdom, have committed to reaching “net zero” emissions by 2050. To meet this challenge requires urgent deployment of low-carbon energy-generating technologies, not just for electricity generation but also other sectors, including transportation and heating. However, this will only be successful if the other two pillars of sustainability (social and economic impacts) are balanced with the environmental drivers. All energy-generation technologies have benefits and drawbacks, and these must be objectively and fairly assessed using a “level playing field” approach. Nuclear energy has benefits that are complementary to renewables and thus can play a valuable role in delivering large amounts of low-carbon energy globally. However, critics of nuclear energy raise concerns related to safety (and security), radioactive waste management, and economics that have challenged its acceptance as a sustainable energy source in some quarters. Nevertheless, objective consideration of sustainability in global energy needs and the different generating technologies clearly indicate a valuable role for nuclear energy in a sustainable and low-carbon future. It is concluded that nuclear energy should be recognised as “sustainable”, and the analysis shows that energy portfolios incorporating nuclear provide the most sustainable system overall.

1. Introduction

The concepts of “sustainability” and “sustainable development” have become central to everyday discussions on most aspects of modern-day life. These are particularly important in the context of our energy supply since the emission of greenhouse gases from burning fossil fuels to generate electricity and heat is a major driver of anthropogenic climate change (i.e., the change in climate due to emissions of greenhouse gases from human activities, e.g., energy production, vehicles, and agriculture, as opposed to natural climate changes due to solar radiation, emissions from volcanic activity, etc.) [1]. A transition to low-carbon energy is, therefore, an essential step in limiting the extent of global warming. The effects of climate change mean that decarbonisation is basically seen as a pre-requisite for a more sustainable future, although, as discussed later, achieving sustainability requires a broader perspective.
Nuclear energy is a low-carbon energy source (Figure 1 in [2]), but arguments remain about whether it can be classed as sustainable and what role it should play in the future energy mix alongside renewable energies. This is in part due to differing interpretations of sustainability as well as the varying standards and expectations by which nuclear energy is assessed by a range of stakeholders. The discussion is further complicated by the range of established and advanced nuclear technologies that are proposed by the industry and the fact that the nuclear reactor which produces energy requires a supporting infrastructure to produce the nuclear fuels for the reactor and to deal with the used fuel and radioactive wastes generated (the nuclear fuel cycle). Again, there are variations in nuclear fuel cycles that could be implemented for each reactor type.
This critical review provides evidence that nuclear energy, when analysed using a “level playing field” approach, compares well with renewables against a variety of key metrics and thus supports arguments that nuclear energy should be classed as sustainable. Furthermore, the evidence indicates that nuclear power can play important, even essential, complementary roles to renewable energies in efforts to sustainably transition energy systems in the UK and globally towards “net zero” carbon emissions. (The impacts of the supporting nuclear fuel cycle, specifically the management of spent nuclear fuels in either “once-through” or “recycle” scenarios, is outside the scope of this paper but will be the subject of a future publication. This paper assumes the open fuel cycle as a bounding case since any degree of materials recycling is likely to increase the sustainability of the overall system).
This paper aims to critically examine the application of sustainability concepts to energy sources, particularly nuclear fission. Specifically, this paper compares nuclear energy with other technologies over the full life cycle using a “level playing field approach”, enabling potential roles for nuclear as part of a sustainable future energy system to be evaluated. Section 2 explores concepts of sustainability and provides some examples on how intergovernmental organisations attempt to understand it. Section 3 focuses on sustainability in relation to energy provision and considers renewable energy and Carbon Capture and Storage (CCS) before a detailed description of nuclear energy in Section 4. Whilst this paper reflects the global challenge of decarbonisation and the role of nuclear energy in this, a specific focus is placed on the situation in the United Kingdom (UK), where new nuclear energy is now a stated policy ambition [3]. Section 5 then collates the findings from this review in a series of key points linked to the body of the paper and also presents an initial summary assessment of energy technologies based on the results of the review.

2. Sustainability

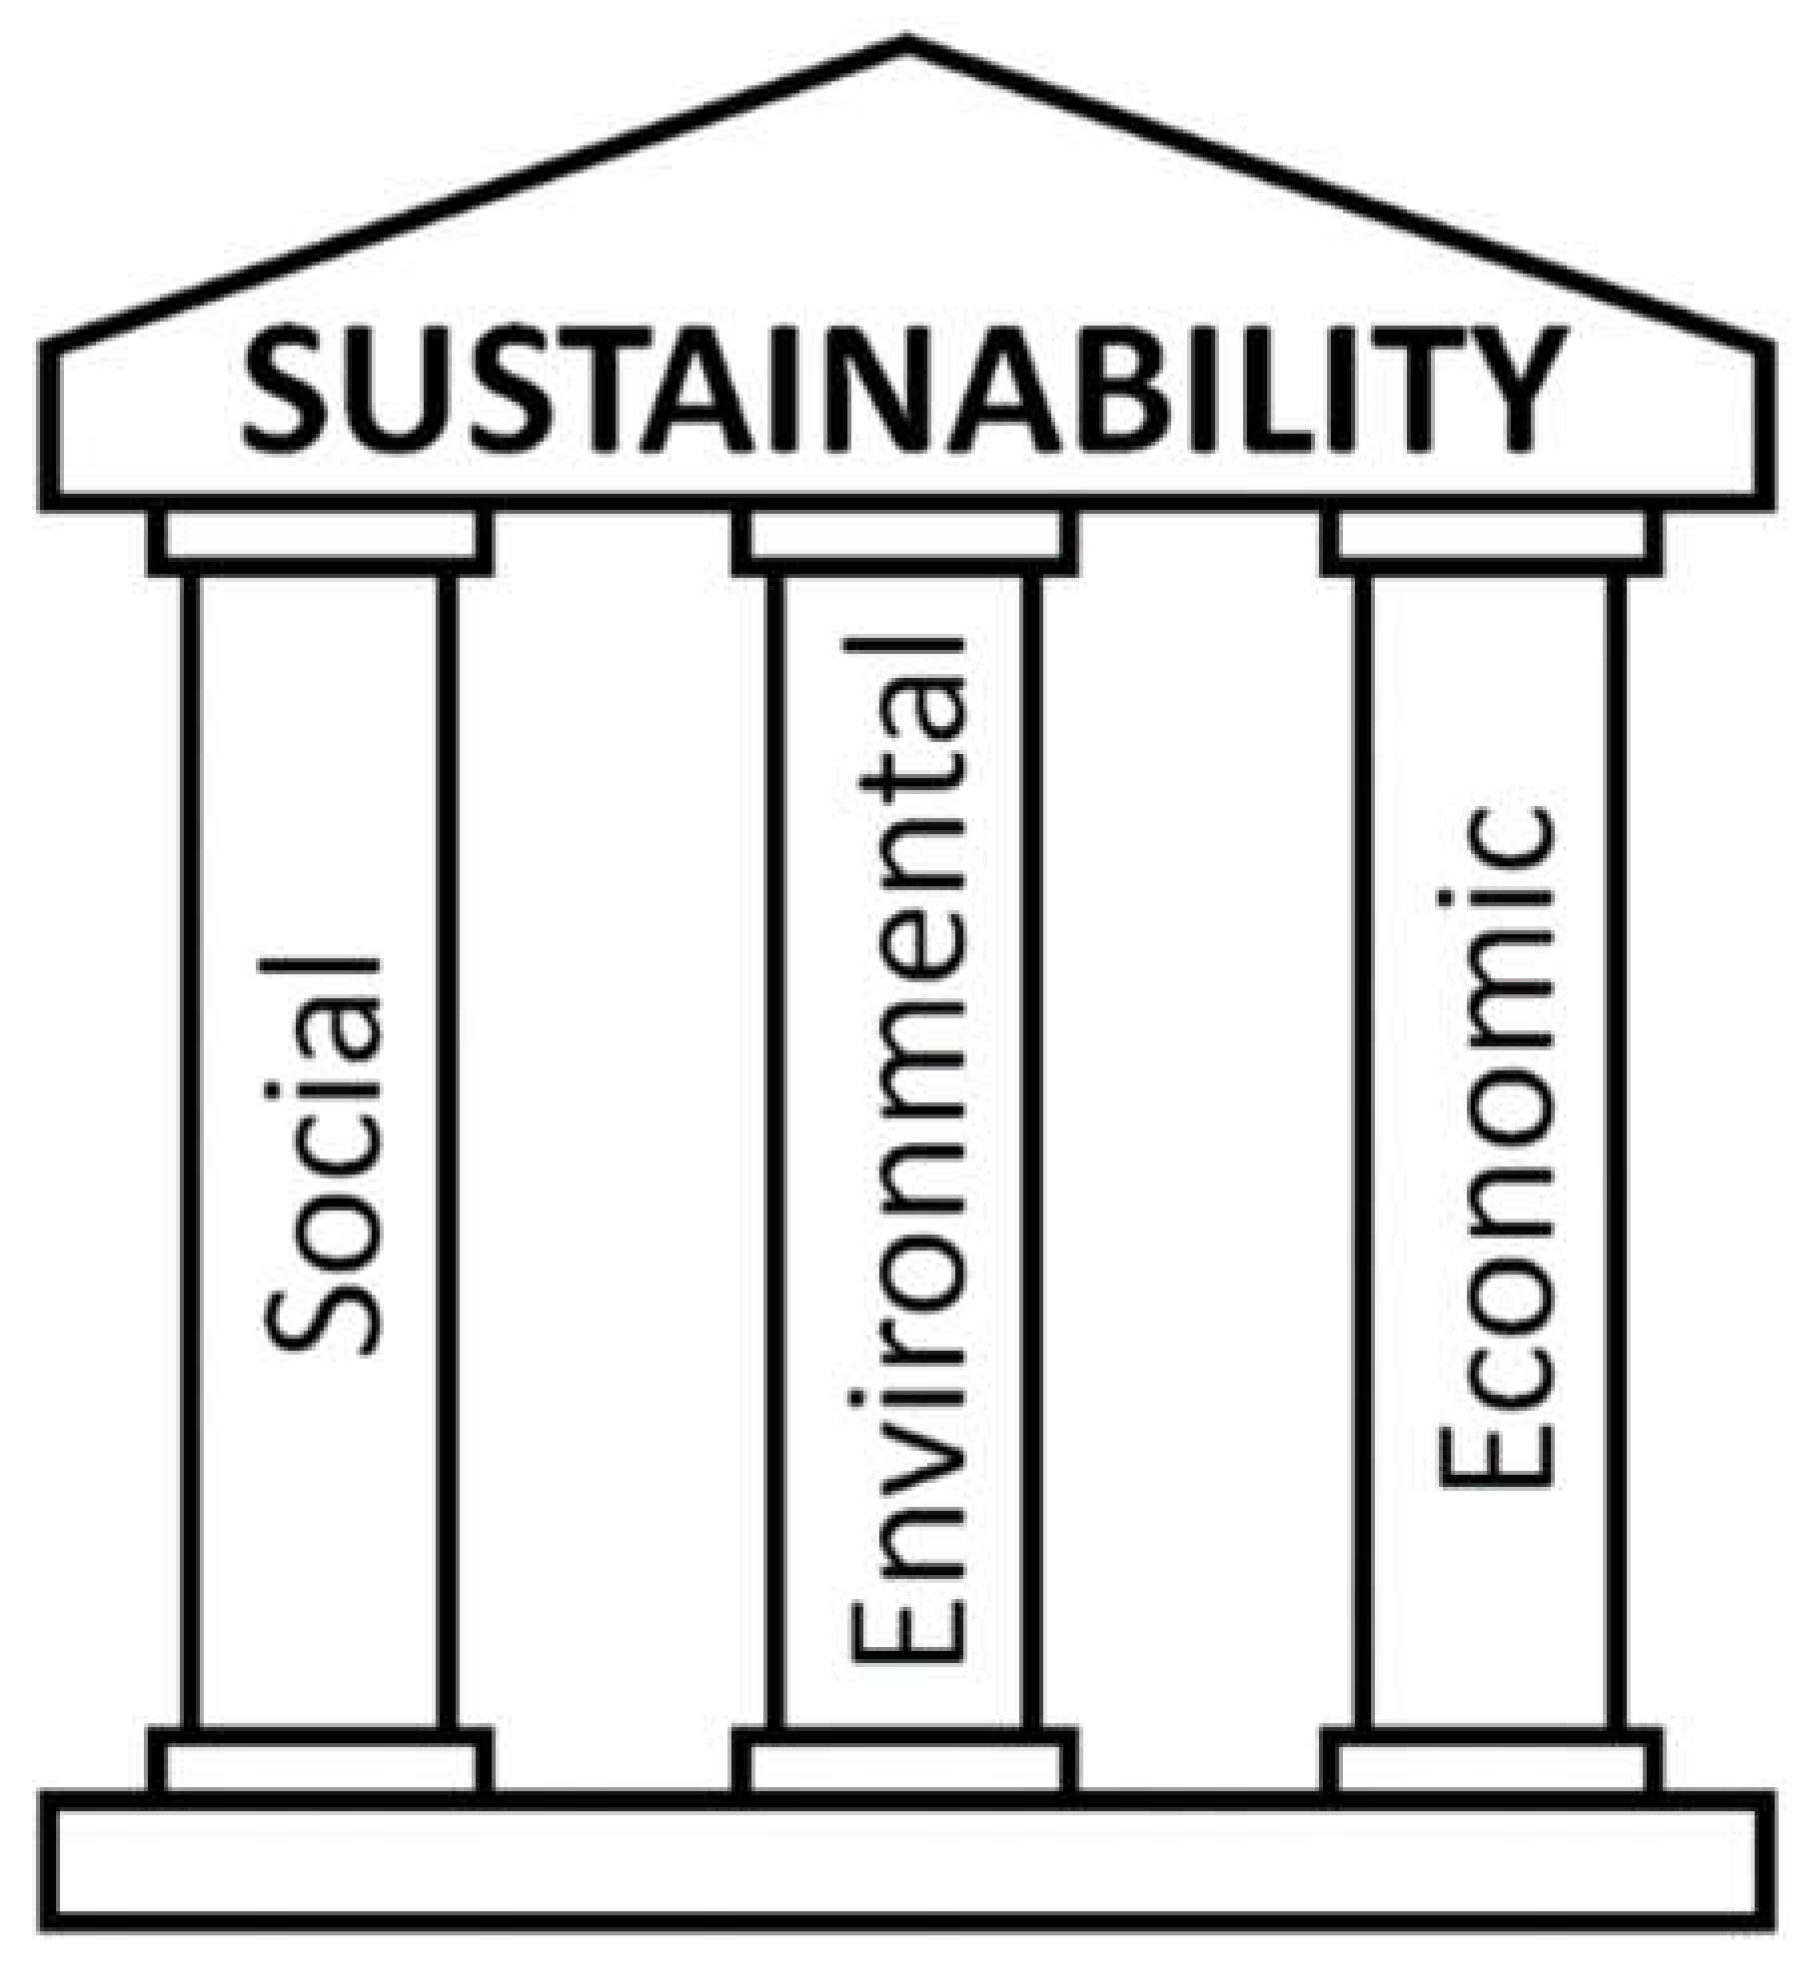
2.1. Defining Sustainability

Before progress can be made on any discussion of sustainability, it is essential to define what is meant by the term. An appropriate Oxford English Dictionary definition of “sustainable” is:
“Capable of being maintained or continued at a certain rate or level.”
…which, if applied to humanity’s existence, would appear to be a sensible starting point. A concept related to sustainability is “sustainable development”, which could be considered as “the means to achieve sustainability”. The United Nations (UN) Brundtland Report from 1987 describes sustainable development as (Para. 27 in [4]):
[Development which] meets the needs of the present without compromising the ability of future generations to meet their own needs.”
This was the first time “sustainable development” was widely considered and is still perhaps the most recognised and applied definition of the concept. The report does not shy away from moral judgement, describing poverty as an “evil”. It spends considerable effort discussing the importance of social organisation and the impacts of societies on finite environmental resources (Section 3 in [4]), thus setting the scene for the common contemporary approach, which considers sustainability as comprising three “pillars”: “social”, “environmental”, and “economic”, all supporting the architrave of “sustainability”. A schematic is illustrated in Figure 1. To be deemed sustainable, an endeavour must be measured, assessed, and found to be satisfactory across all three of these supporting pillars, i.e., sustainability is not solely an environmental issue, and “green” is not necessarily sustainable. Policy makers should ensure balanced judgements are made (see Section 6, Key conclusion 1).
While the above definition seems the most commonly understood, several hundreds of modified definitions of sustainability have been devised [5], with the consequences of both confusing the discussion and enabling enterprises which do not meet the 1987 definition to label themselves as sustainable. Given the myriad definitions of sustainability which exist, and their varying usefulness to a broad consideration of the matter, we opt to adhere to the 1987 definition in this paper, which succinctly conveys the essential nature of sustainability.
Figure 1. A typical representation of sustainability as three “pillars” [6].
Sustainability 16 10952 g001

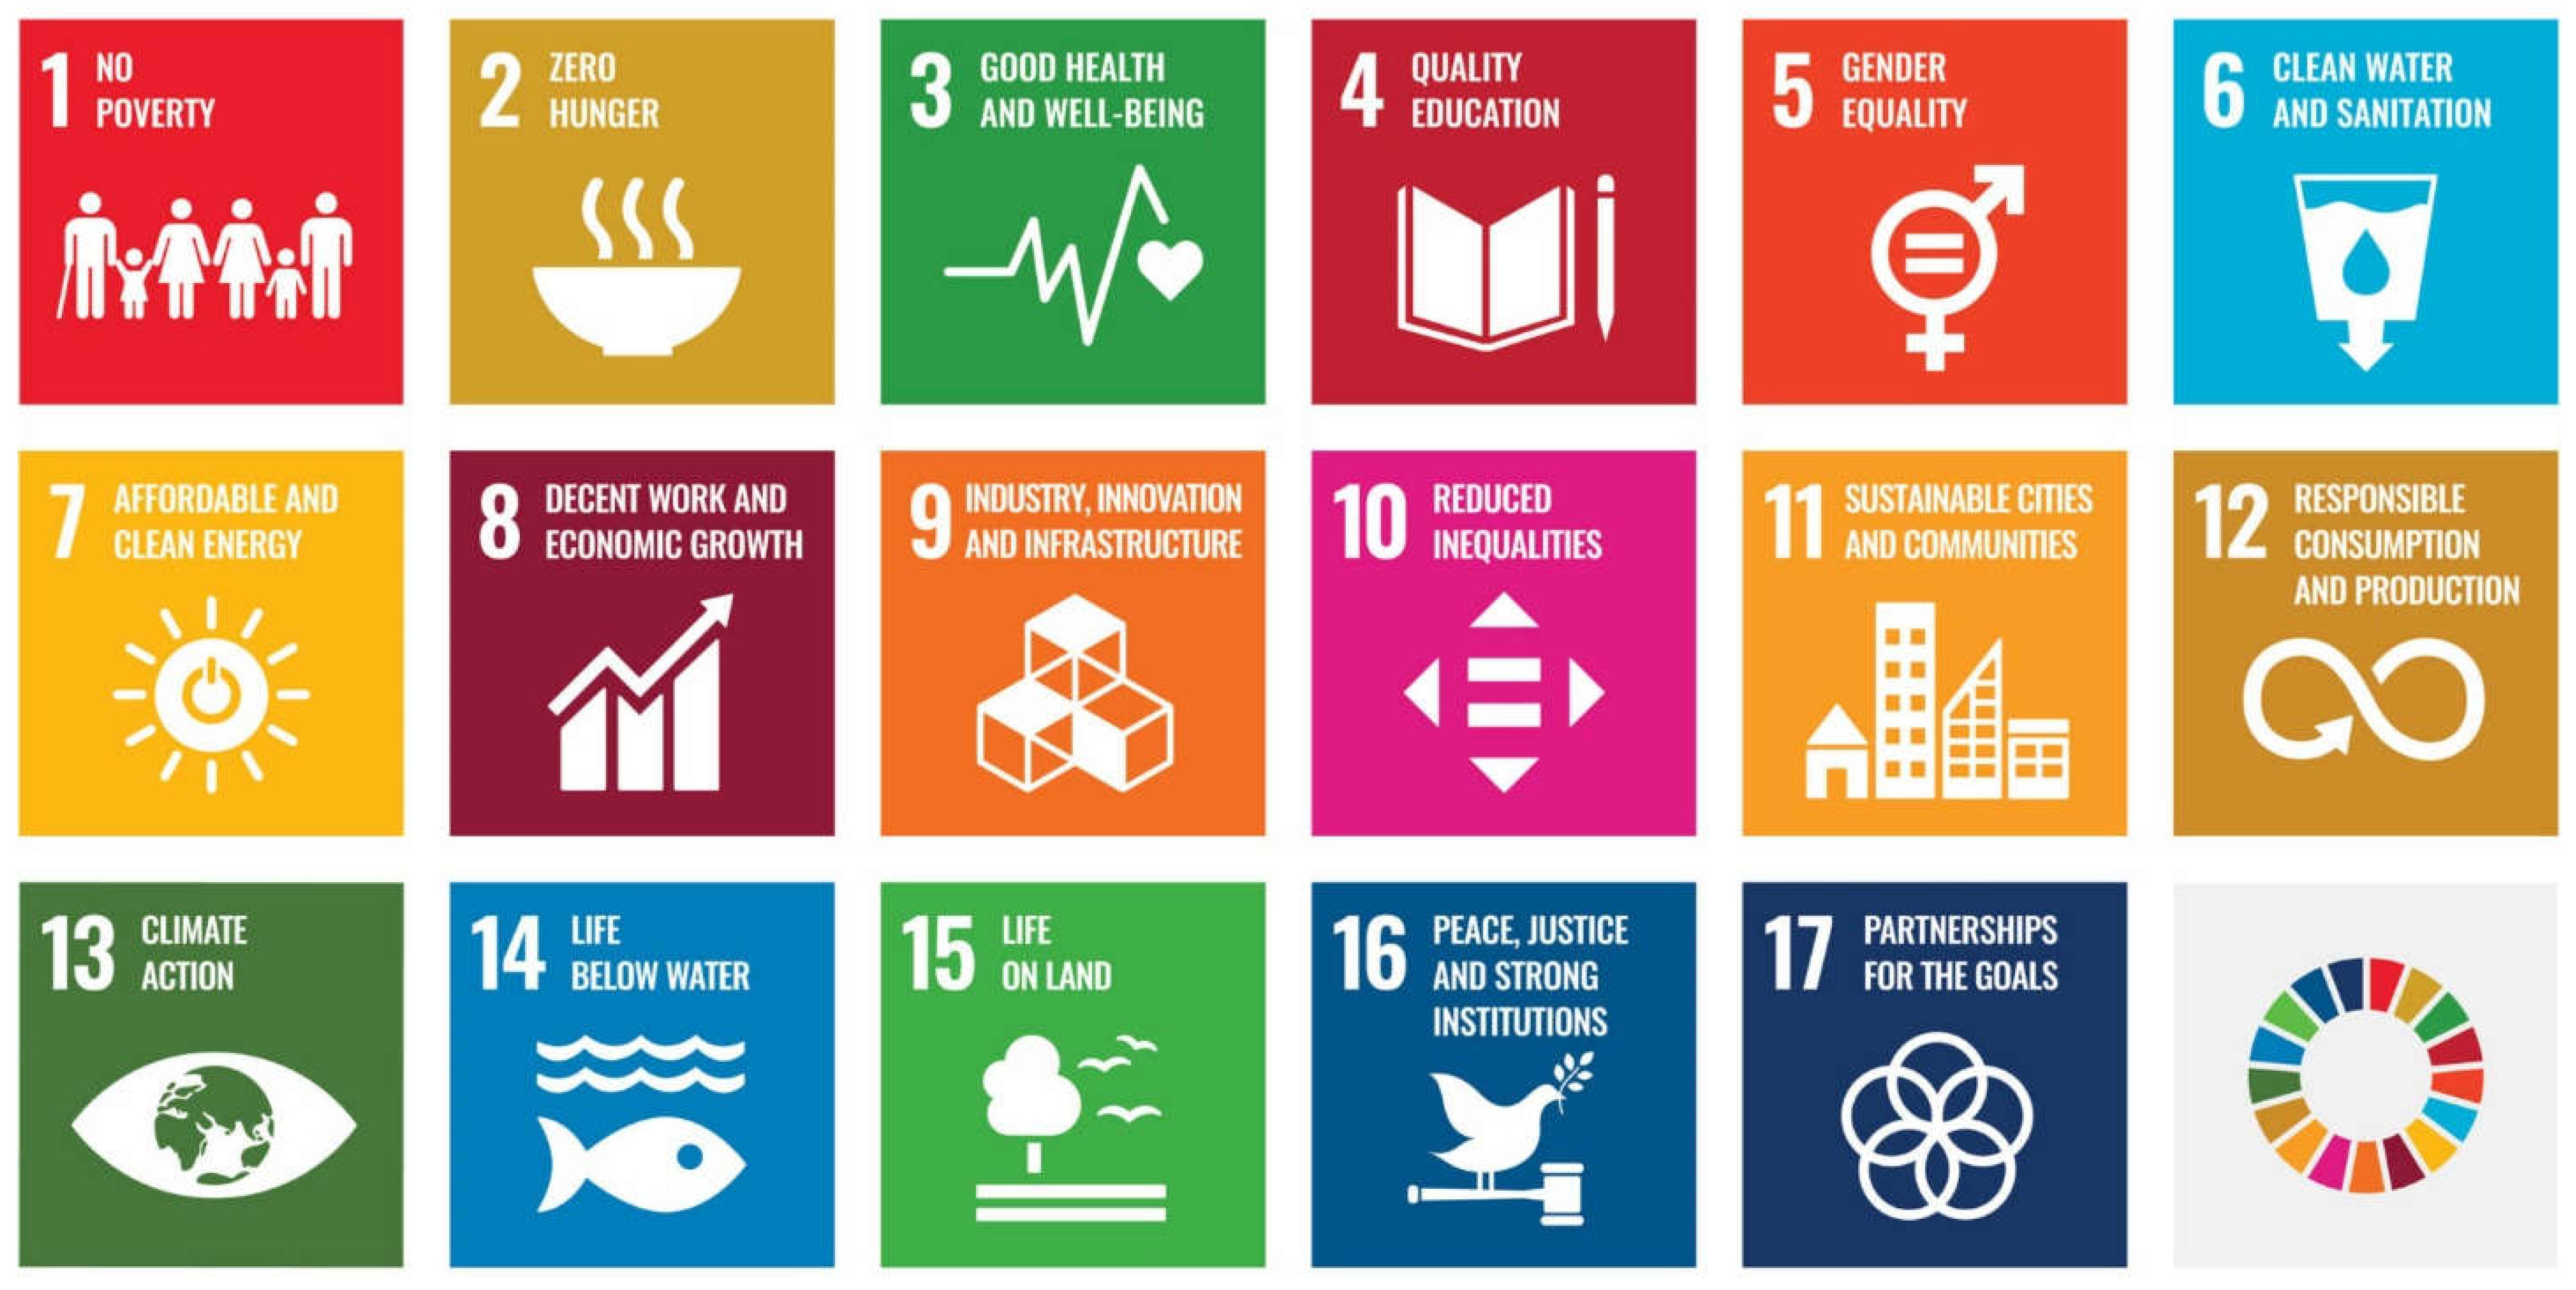
2.2. United Nations Goals

There have been multiple efforts to translate the concepts of sustainability into practical application and to measure progress. The most universally recognised efforts in cataloguing development have come from the UN, including the eight Millennium Development Goals (MDGs), which in 2000 all UN member states committed to try and achieve by 2015 [7]. The MDGs covered basic human needs related to poverty, education, equality, health, and development as well as environmental sustainability.
Progress towards the goals was measured through 21 targets (originally 18). With the breadth of the eight high-level goals, it was the targets which contained the tangible metrics, though these varied in specificity.
The world has made tremendous progress on the very ambitious targets laid out under the MDGs, for example, exceeding the target for reducing the number of people in extreme poverty by 50% (actually reducing to 840 million from 1.9 billion) ([7], p. 15). Even in goals where targets were sorely missed, positive strides were still made (e.g., seeing a 45% reduction in the maternal mortality rate, despite a target of 75% ([7], p. 38)). The extent to which the MDGs bear responsibility for the improvements is unclear; however, focusing the international community on these laudable goals and providing internationally recognised targets was probably useful in making and recording tangible progress towards them.
To succeed the MDGs, in 2015, the UN adopted 17 Sustainable Development Goals (SDGs, summarised in Figure 2) as part of its “Agenda 2030”, and in 2017, the associated list of 169 targets and 232 indicators was identified [8]. The indicators are classified into two tiers depending not on the actual status within countries but only on whether data meeting the internationally established methodology are collected by at least 50 relevant countries (Tier 1) or are not (Tier 2) [9].
As with the previous MDGs, no strategy for achieving the targets has been put forward; however, the most common criticism of the SDGs is the large number of targets compared to the MDGs [10]. The Organisation for Economic Co-operation and Development (OECD) estimates on the costs of meeting all the SDG targets are USD 3.3–4.5 trillion/year—for context, around USD 130 billion/year is spent on overseas development ([11], p. 7). By having too many targets (while also not ranking goals in order of importance), ambitions could be spread too thinly and potentially many priority targets not met in practice. Despite this, however, it must be remembered that the UN’s ambitions are global, and, therefore, cover a broad range of areas where development is judged to be needed and cover a broad range of affluence.

2.2.1. Sustainable Development Goals in the UK

The greatest potential for improvements across the UN’s SDGs resides in the developing world, where issues such as hunger; absolute poverty; and lack of education, sanitation, and clean water are among those that must be addressed. In the developed world, many of the social and economic indicators across the 17 goals have far less urgency than in the developing world (Figure 2.3 in [12,13]), so it is understandable that efforts on sustainability there have generally evolved to focus on the specifically environmental targets (i.e., clean energy, climate action, and marine and terrestrial ecosystems). While understandable, such a narrow focus is unhelpful, and without attention to the broader definition of sustainability, risks sacrificing social and economic development to some extent in pursuit of an environmental agenda. Such a sacrifice would inevitably result in disillusionment with environmental efforts from the populace if living standards were to decrease substantially and a decreasing ability to pay for such efforts if the economic base is negatively impacted. Indeed, disagreements over the costs and necessity to reach net zero are already evident (e.g., [14,15]). It is, therefore, crucial that sustainability analyses consider all three “pillars” together and not any one in isolation, even when considering how to pursue the environmental goals.
In 2019, the UK government published a Voluntary National Review [16] reporting on national progress towards the 17 SDGs in which it declared that the Office for National Statistics (ONS) had reported data on 180 of the 244 (74%) indicators ([16], p. 5).

2.2.2. Energy-Related Sustainable Development Goals

While the development of energy provision impacts many of the SDGs, two are closely related to energy: Goal 7, titled “affordable and clean energy”, is explicitly so, while Goal 13 concerns “climate change”, the anthropogenic component of which is for the most part due to energy use. Since the primary concern of this paper is the sustainability or otherwise of nuclear energy, these two goals warrant consideration. Furthermore, access to energy is such a crucial part of human development that reliable energy provision easily feeds into several other goals, for example:
  • Goal 2: Zero hunger.
While hunger is a complex problem with many contributing factors, absolute food production is clearly important and very energy intensive. Modern agricultural techniques, such as those employed by the Netherlands to make it (despite its limited farmland) into the world’s second largest agricultural exporter [17], offer solutions to regions with climate and land quality and quantity unsuitable for conventional farming. Such solutions require abundant energy to function effectively.
  • Goal 6: Clean water and sanitation.
In 2016, desalination provided 0.7% of water needs worldwide while using 5% of global electricity ([18], p. 24). Electricity only provides 15% of the energy for desalination, however, with the rest of the energy coming from fossil fuels. With the risk of water scarcity increasing due to population and climate change, demand for desalination is likely to grow. Beyond desalination, wastewater treatment is also highly energy intensive (Figure 4 in [18]). Making progress towards Goal 6, therefore, requires a detailed energy strategy to do so sustainably.
  • Goals 8, 9, and 11: Economic growth, industry, infrastructure, and cities.
Development in these areas is undoubtedly dependent on reliable energy provision and is discussed in broader terms in Section 3 and Section 4.
The five goals above require a reliable energy supply. Sustainable energy strategies must balance the demands for progress in the goals above while limiting the detrimental effects which arise from energy production (i.e., emissions, waste, pollution, risks to health). With such consideration, Goals 3, 14, and 15 (concerning human, aquatic, and terrestrial life, respectively) become relevant, and the need for clean sources of energy to prevent environmental damage becomes apparent. In addition, Goal 12 is important in the context of this paper, as nuclear energy has important potential to contribute significantly to Goal 12 (in the field of clean energy production).
  • Goal 12: Responsible consumption and production.
Briefly, current nuclear energy only utilises a very small part of the uranium fuel in a reactor, and that fuel only utilises a small part of the uranium mined. This is exemplified by data from the French fuel cycle, whereby ~9200 tonnes of uranium in ores (uranium ores vary from very high grade Canadian ores of ~20% to low grade ores of ~0.1% [19]) are needed to make enriched uranium oxide fuel for the French fleet of LWRs [20]. This fuel contains 1170 tU initially and 1112 tU in the SNF after irradiation; 58 tU (44 t235U + 14 t238U) are used in the reactor, either fissioned for energy production or transmuted to transuranic actinides (mainly isotopes of plutonium, a portion of which also contribute in situ to the fission process and energy production). This is equivalent to using <0.7% of the natural uranium across the full fuel cycle. Even with higher enrichments and burn ups, this value does not increase much. Mono-recycling of the reprocessed uranium and plutonium in thermal reactors (LWRs) can increase the efficiency to ~1%, whereas multi-recycling in fast reactors enables depleted uranium to be used and massively increases the efficiency of the system and longevity of available uranium resources [21]. Fuel is formed from natural uranium mined from ores and then “enriched” in the useful component (the “fissile” uranium-235 isotope). This leaves a lot of “depleted” uranium that cannot be used in current (“thermal”) reactors. Furthermore, the used fuel, after irradiation in the reactor, still contains ~95% of potential fuel materials (unused uranium and plutonium). Most nuclear energy at present uses a “once-through” nuclear fuel cycle where the used fuel will be disposed of as waste. Clearly, alternative approaches that recycled either the depleted uranium stocks and/or the used nuclear fuels would reduce the need for (environmentally damaging) mining and the use of natural resources as well as the final waste volumes. This would be consistent with Goal 12 and the drive towards more sustainable circular economies. These issues are outside the scope of this paper but will be addressed in a future publication (see also [21,22,23]).
The remainder of this section and the next focus on Goals 7 and 13. Table 1 shows in full the five targets and six indicators for Goal 7. The indicators are the metrics by which progress towards the targets of the SDGs are measured (UK data for all indicators are available in [24]). Each indicator is briefly considered, with a focus on the UK situation.
  • 7.1.1: Access to electricity and 7.1.2: Clean fuels and technology for cooking
These indicators measure the proportion of the UK population with access to electricity and clean fuels for cooking. Both metrics are 100% across the UK and, therefore, there is no scope for national improvement with these metrics.
  • 7.2.1: Renewable energy share and 7.b.1: Installed renewable generating capacity
The full descriptor for Goal 7 is “Ensure access to affordable, reliable, sustainable and modern energy for all”. The indicators, however, concern themselves solely with renewable energy with no appreciation for whether the energy is sustainable “in the round” by their own definition (i.e., affordable, reliable, modern).
Indicator 7.b.1 is of particular concern, since installed renewable capacity offers no guarantee as to the amount of energy which results from their installation. As is further discussed in Section 3, weighing up the suitable energy options available to the UK is not straightforward, and pursuit of truly sustainable energy provision should be the ultimate focus when deciding which to implement. These indicators offer no such motivation.
As is commonly the case with discussions concerning sustainability, renewable energy is often presented as a “silver bullet”; however, renewable technologies still suffer (as do non-renewables) from affordability issues, finite source materials, and waste, but often with the added complication of intermittency (discussed in Section 3). Renewable energy should not be considered as the ultimate goal for its own sake, but instead, its role within an affordable, reliable, and sustainable energy future should be intelligently considered along with other non-renewable but low-carbon options. Indeed, if reducing carbon emissions is the overarching goal, as it should be, then, as shown later, a focus solely on renewables is unhelpful. This necessitates a “level playing field” approach to energy, which is discussed in more detail in Section 3.
  • 7.3.1: Energy intensity measured in terms of primary energy and GDP
While this is an admirable metric for consideration globally, domestically (i.e., in the UK), it can be skewed by displacement of energy- (and carbon-)intensive industries to other nations, negating real progress towards decarbonisation on the global scale.
  • 7.a.1: International financial flows to developing countries in support of clean energy
This is a measure of how much financial contribution the UK has made to assist developing countries and has no bearing on the sustainability of domestic energy and meeting net zero targets in the UK. Nonetheless, as seen later, it is the global reduction in carbon emissions that is important and must be addressed as nations develop. Thus, this is a laudable aspiration but outside the scope of this paper.
The other goal with the most relevance to the energy sector is Goal 13: “Take urgent action to combat climate change and its impacts”. This goal has eight indicators concerning national disasters, the extent to which “global citizenship” and “sustainable development” education are present in national education policies, contributions to the “Green Climate Fund”, and “total greenhouse gas emissions per year” (Indicator 13.2.2) (pp. 24–26, [9]). With its commitment to achieving net zero emissions by 2050 (Para. 1 in [25]), Indicator 13.2.2 is the UK’s most relevant indicator from this SDG and is reflected in the 2008 Climate Change Act (the target was amended in 2019 to 100% emissions reduction) [25] (See Section 6, Key Point 2).

2.3. Taxonomies for Sustainable Activities

The European Green Deal initiatives were approved by the European Commission in 2020 with the goal of reaching net zero emissions in the EU by 2050. Sustainable finance is a core element of the Green Deal, and the EU Taxonomy for Sustainable Activities forms part of the drive to encourage sustainable investment. It thus has substantial impacts worthy of some examination, particularly since the UK is now developing its own version of the taxonomy. A Technical Expert Group (TEG) comprising institutions mostly from the finance sector ([26], p. 64) was established by the European Commission to develop the EU Taxonomy, a system for classifying whether investments are sustainable. To qualify for inclusion within the EU Taxonomy, endeavours must ([26], p. 2):
  • Make a substantive contribution to one of six environmental objectives:
    (1)
    Climate change mitigation.
    (2)
    Climate change adaptation.
    (3)
    Sustainable [use] and protection of water and marine resources.
    (4)
    Transition to a circular economy.
    (5)
    Pollution prevention and control.
    (6)
    Protection and restoration of biodiversity and ecosystems.
  • Do no significant harm to any of the other five objectives.
  • Meet a set of minimum safeguards.
In March 2020, the TEG, in its final report [26], excluded nuclear power from the taxonomy on the basis that ([27], p. 211):
“Given [limitations regarding waste], it was not possible for TEG, nor its members, to conclude that the nuclear energy value chain does not cause significant harm to other environmental objectives on the time scales in question.”
Since nuclear energy is one of the very few firm, low-carbon-generation options available to assist in the enormous ambition of reaching net zero targets, careful consideration is needed in analysing its sustainability. Due to the large proportion of the costs of nuclear deriving from financing, excluding nuclear energy from the taxonomy on the basis of uncertainty over the resulting wastes could have the consequence of making it economically unaffordable and making net zero targets harder to meet. While nuclear waste was correctly identified as a challenge by the TEG, solutions for radioactive waste management are available [28]. Therefore, it is not clear that this should have been grounds for nuclear’s exclusion from the taxonomy given the far greater impacts of failing to meet GHG emissions targets.
Similarly, the report was inconsistent between generating technologies ([27], p. 205):
“To aid the transition to a net-zero economy, certain technologies, such as solar, wind and tidal energy are derogated from the requirement to conduct PCFs [Product Carbon Footprints] assessments on the basis that these technologies currently perform significantly below the emissions intensity threshold (For power generation this is set as the average emissions over the plant’s physical lifetime or 40 years (whichever is shorter) to be lower than 100 gCO2eq/kWh).”
As also illustrated in Section 2.2.2, it appears that renewable technologies are assumed as the ultimate solution, whereas the original goal, which justified the metrics, is the need to reduce carbon emissions. i.e., in this case, the EU’s Green Deal goal of carbon neutrality. Judging sustainability should be a fair, objective exercise in evaluating technologies that deliver this goal.
The position of nuclear in the report is unclear, but it was excluded from the EU Taxonomy, with the note that ([27], p. 211):
“TEG recommends that more extensive technical work is undertaken on the do-no-significant-harm aspects of nuclear energy in future and by a group with in-depth technical expertise on nuclear life cycle technologies and the existing and potential environmental impacts across all objectives.”
The decision to include or exclude nuclear from the EU Taxonomy was much debated during the negotiations. Shortly afterwards, the European Commission’s science and technology service, the Joint Research Centre (JRC), was asked to conduct the “more extensive technical work” recommended in the TEG report. The 2021 report on the assessment [29] is extensive, listing as one of its conclusions ([29], p. 7):
“The analyses did not reveal any science-based evidence that nuclear energy does more harm to human health or to the environment than other electricity production technologies already included in the Taxonomy as activities supporting climate change mitigation.”
In early 2022, the third delegated act was approved, which included energy from nuclear fission and natural gas within the EU Taxonomy as “transitional” activities. A single delegated act carried both technologies, with the consequence that member states and parliament could only accept or reject the technologies together.
This was an unnecessarily long and arduous process, the result of which satisfies few: nuclear advocates are unhappy with the “transition” status, opponents of nuclear dislike that nuclear is included in any form, and many who are serious about reducing carbon emissions find inclusion of natural gas combustion unacceptable. The UK is no longer part of the EU and is in the process of developing its own sustainability taxonomy (Section 3); the UK would thus be wise to learn the lessons of the difficulties in the development of the EU’s Taxonomy to avoid similar delays and inconsistencies. It is encouraging that the government has stated an expectation that ([30], p. 48):
“…nuclear—as a key technology within our pathways to reach Net Zero—will be included within the UK’s Green Taxonomy, subject to consultation.”
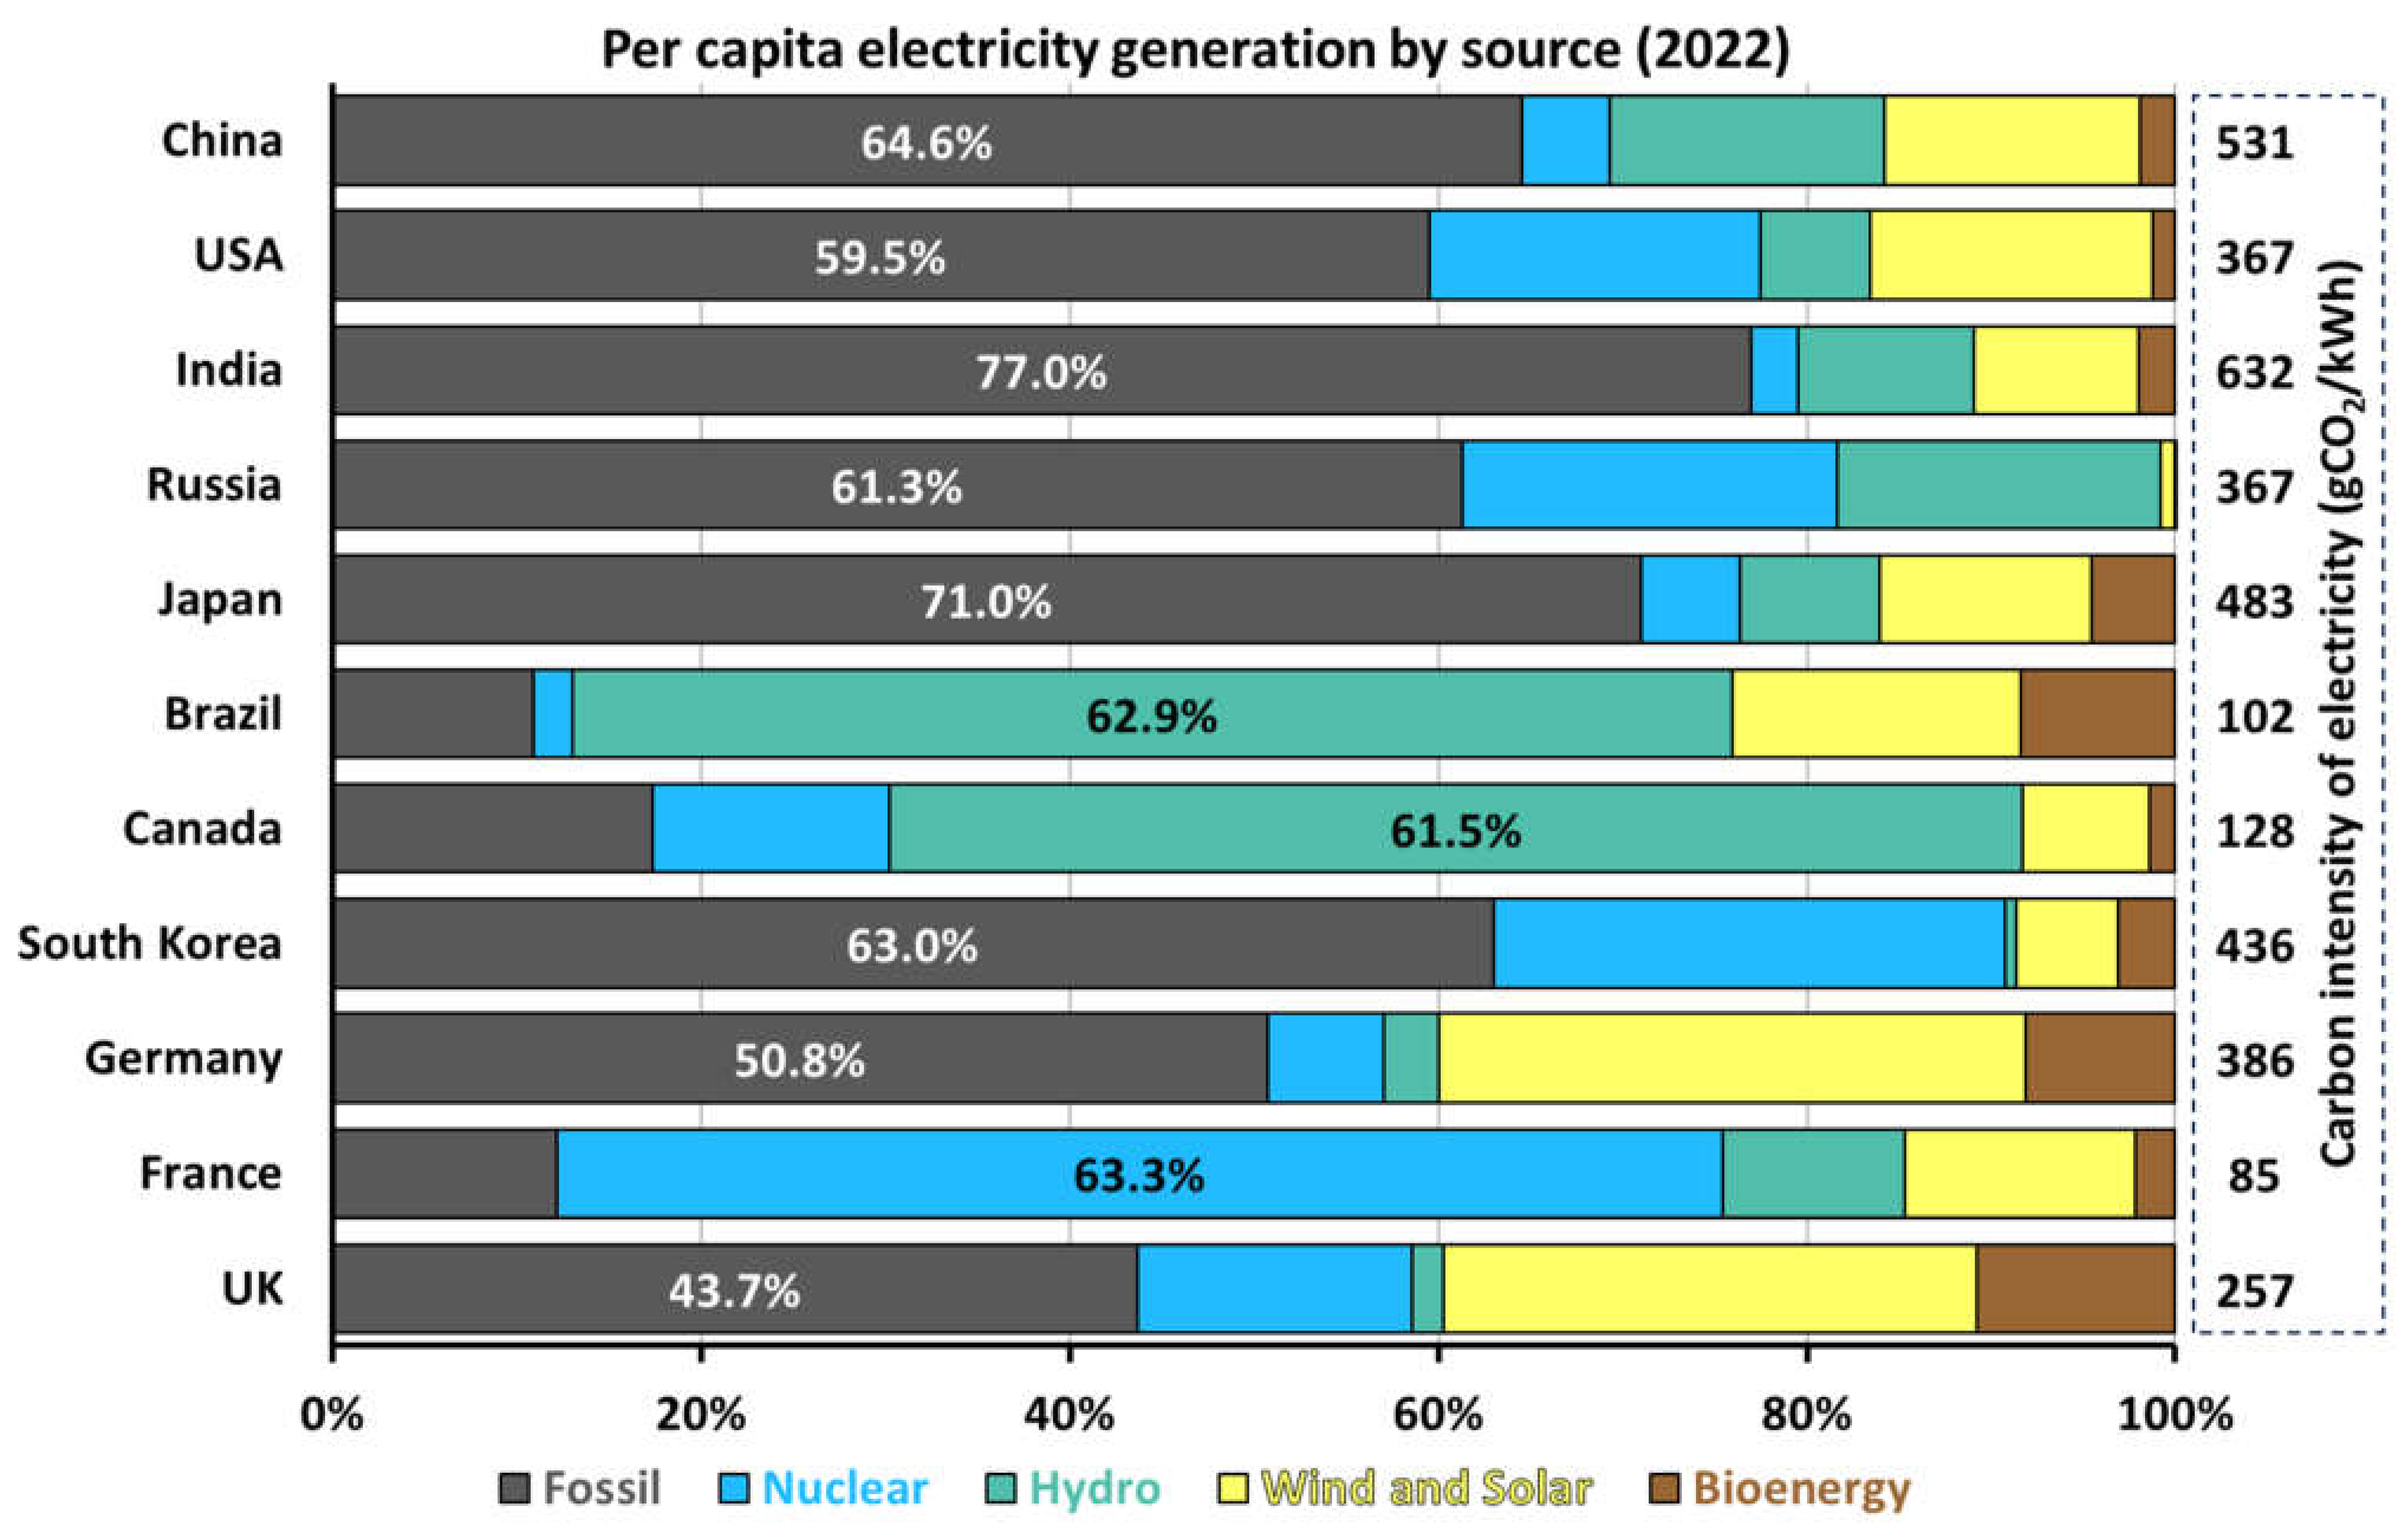
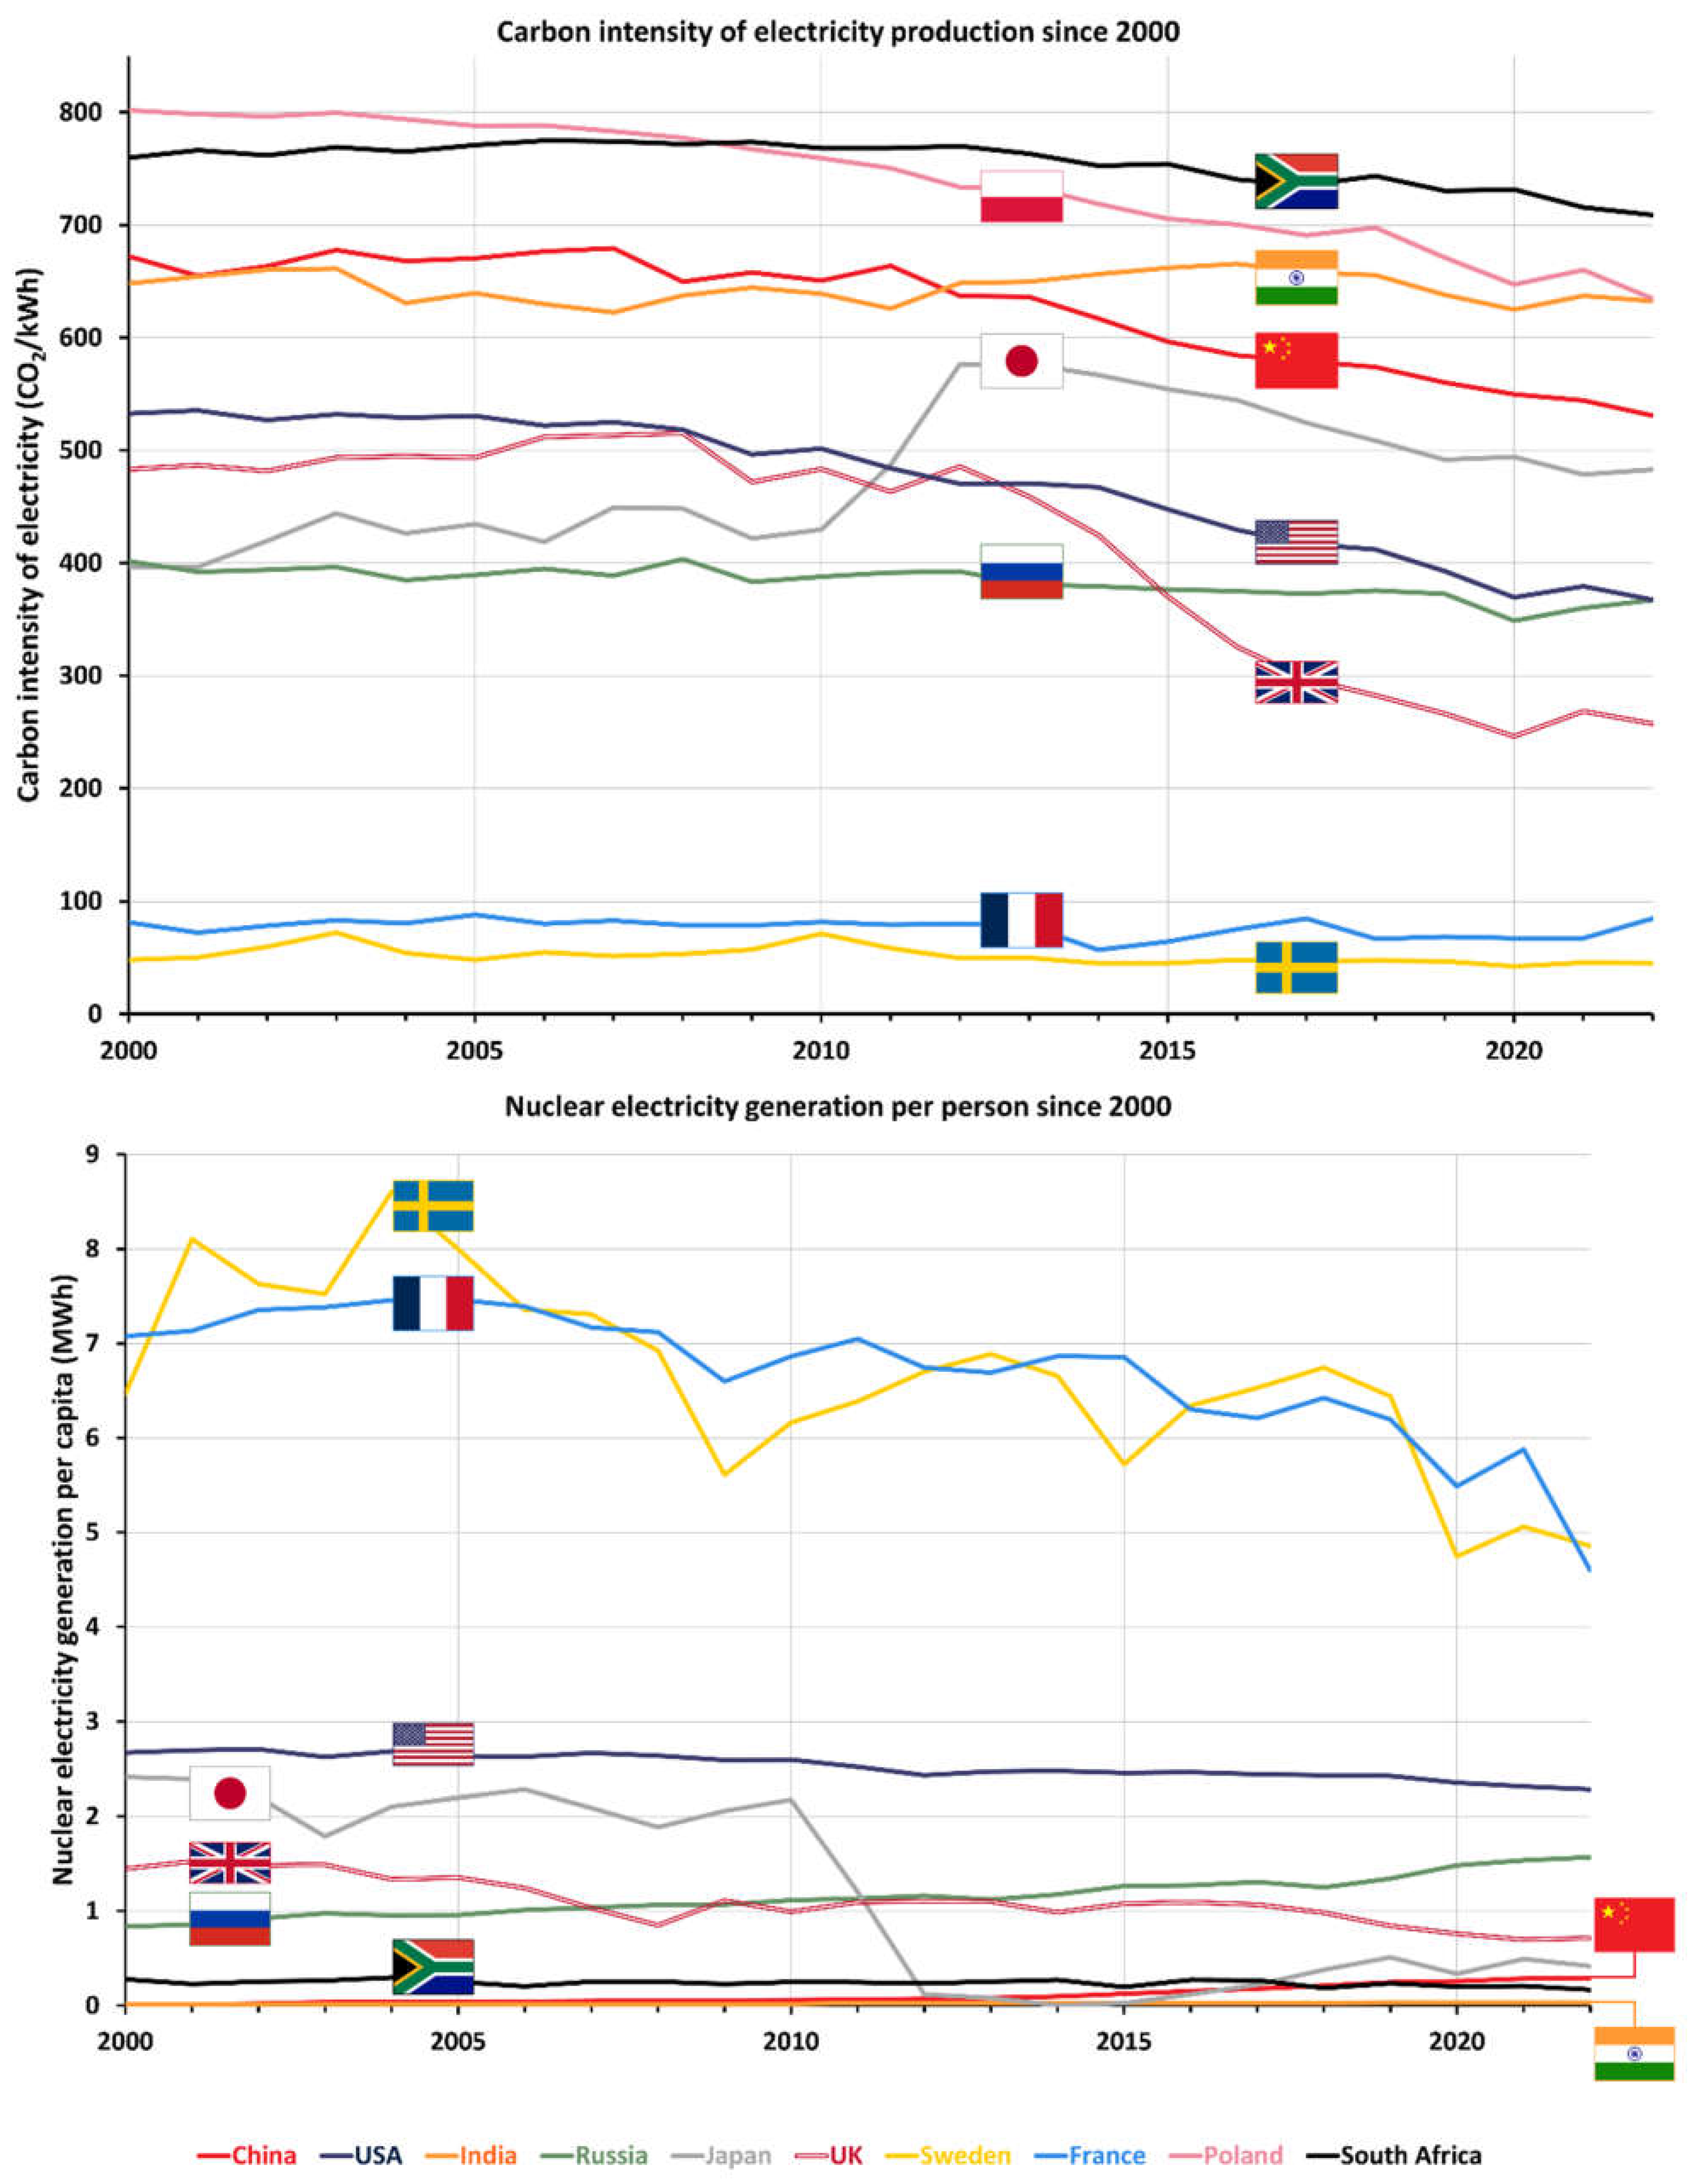
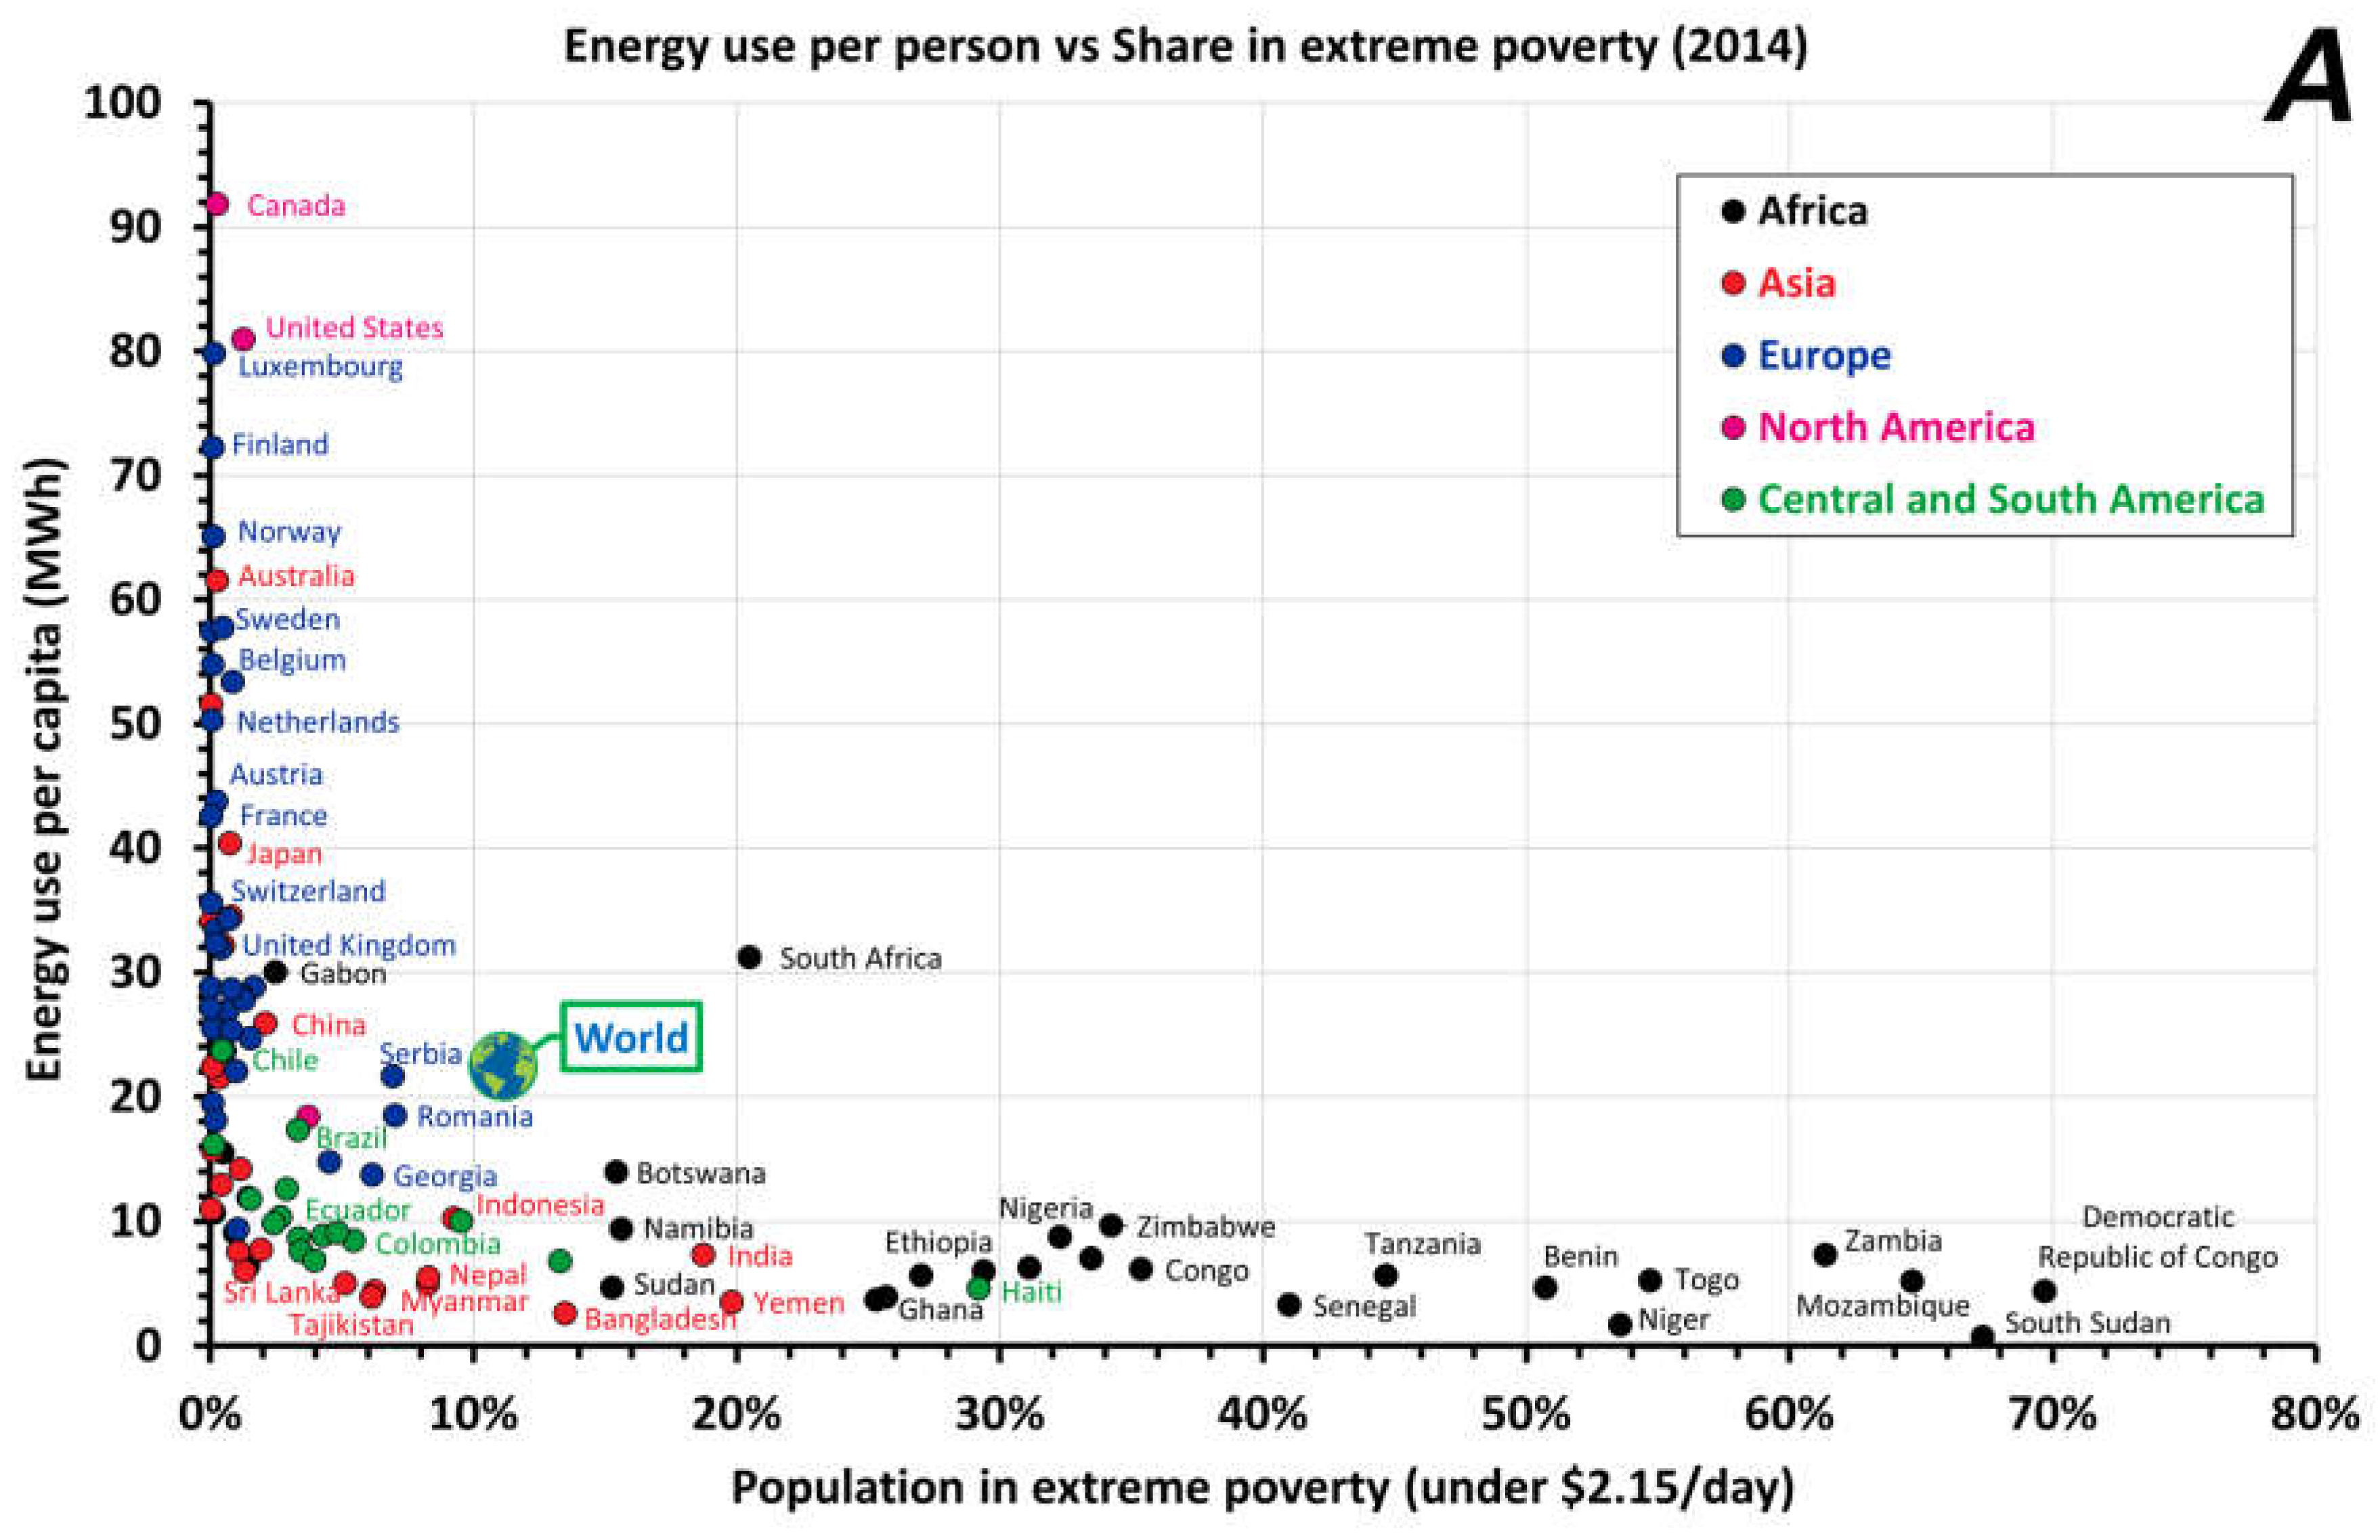
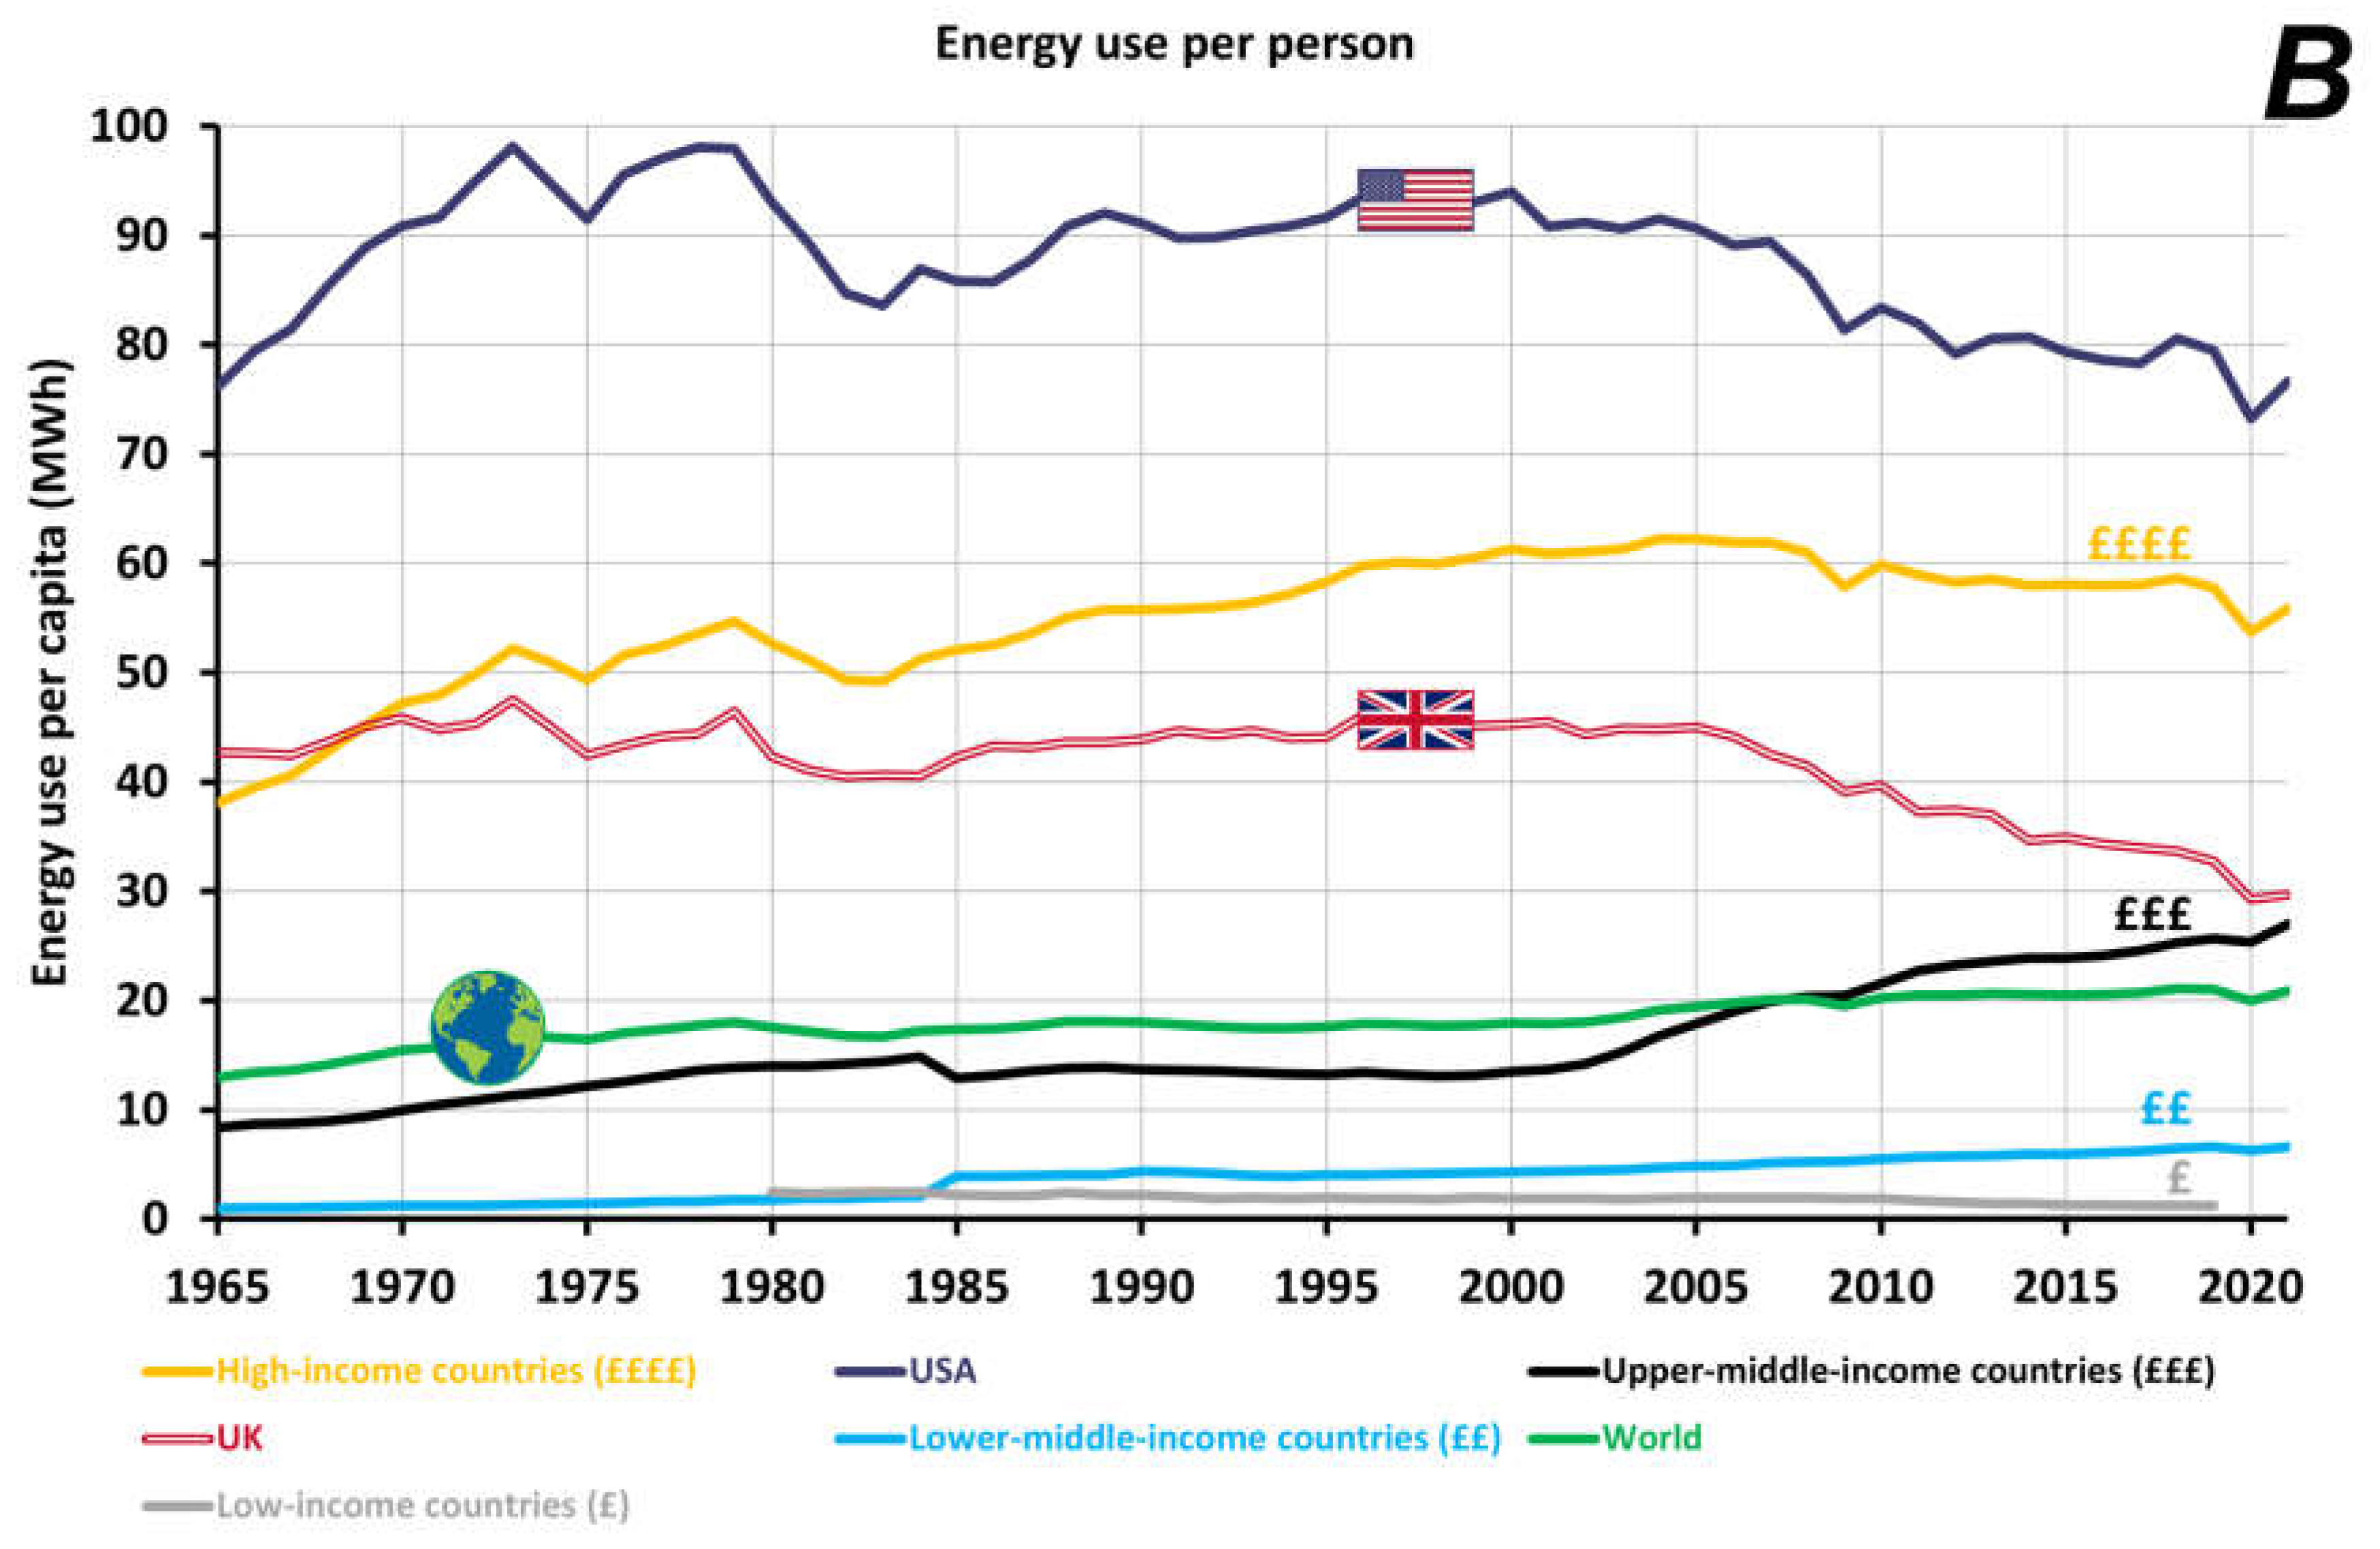
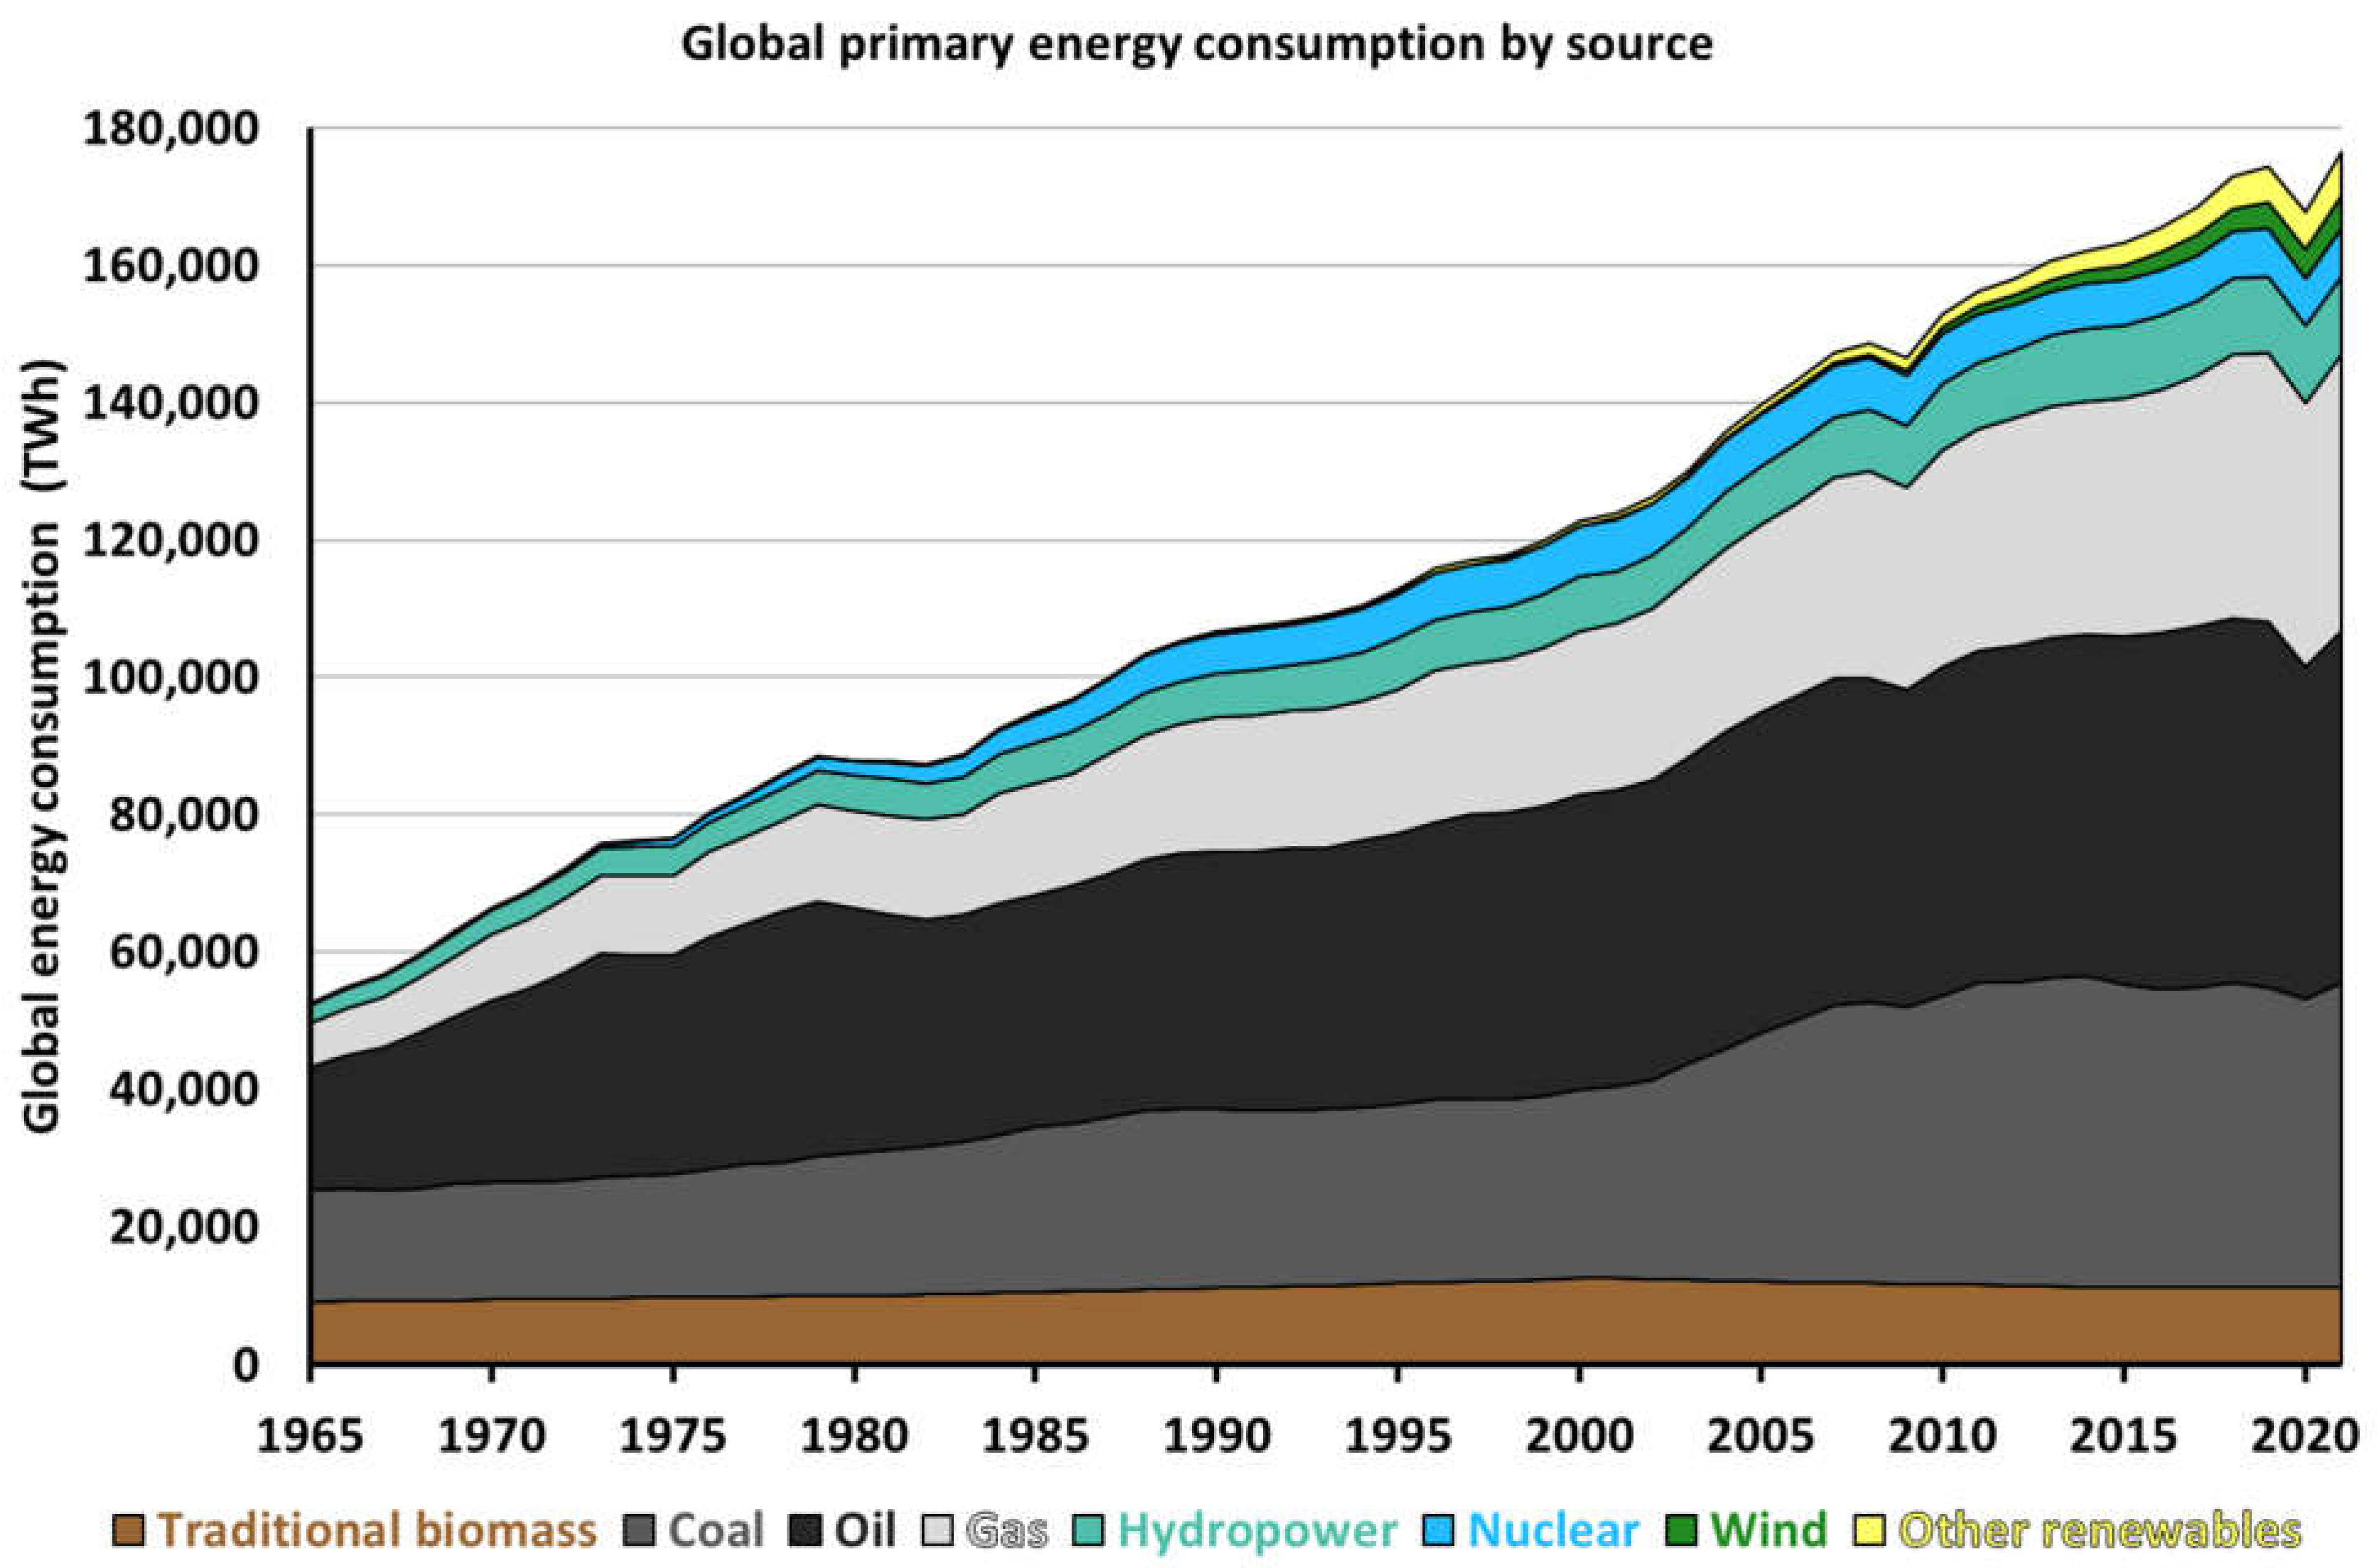
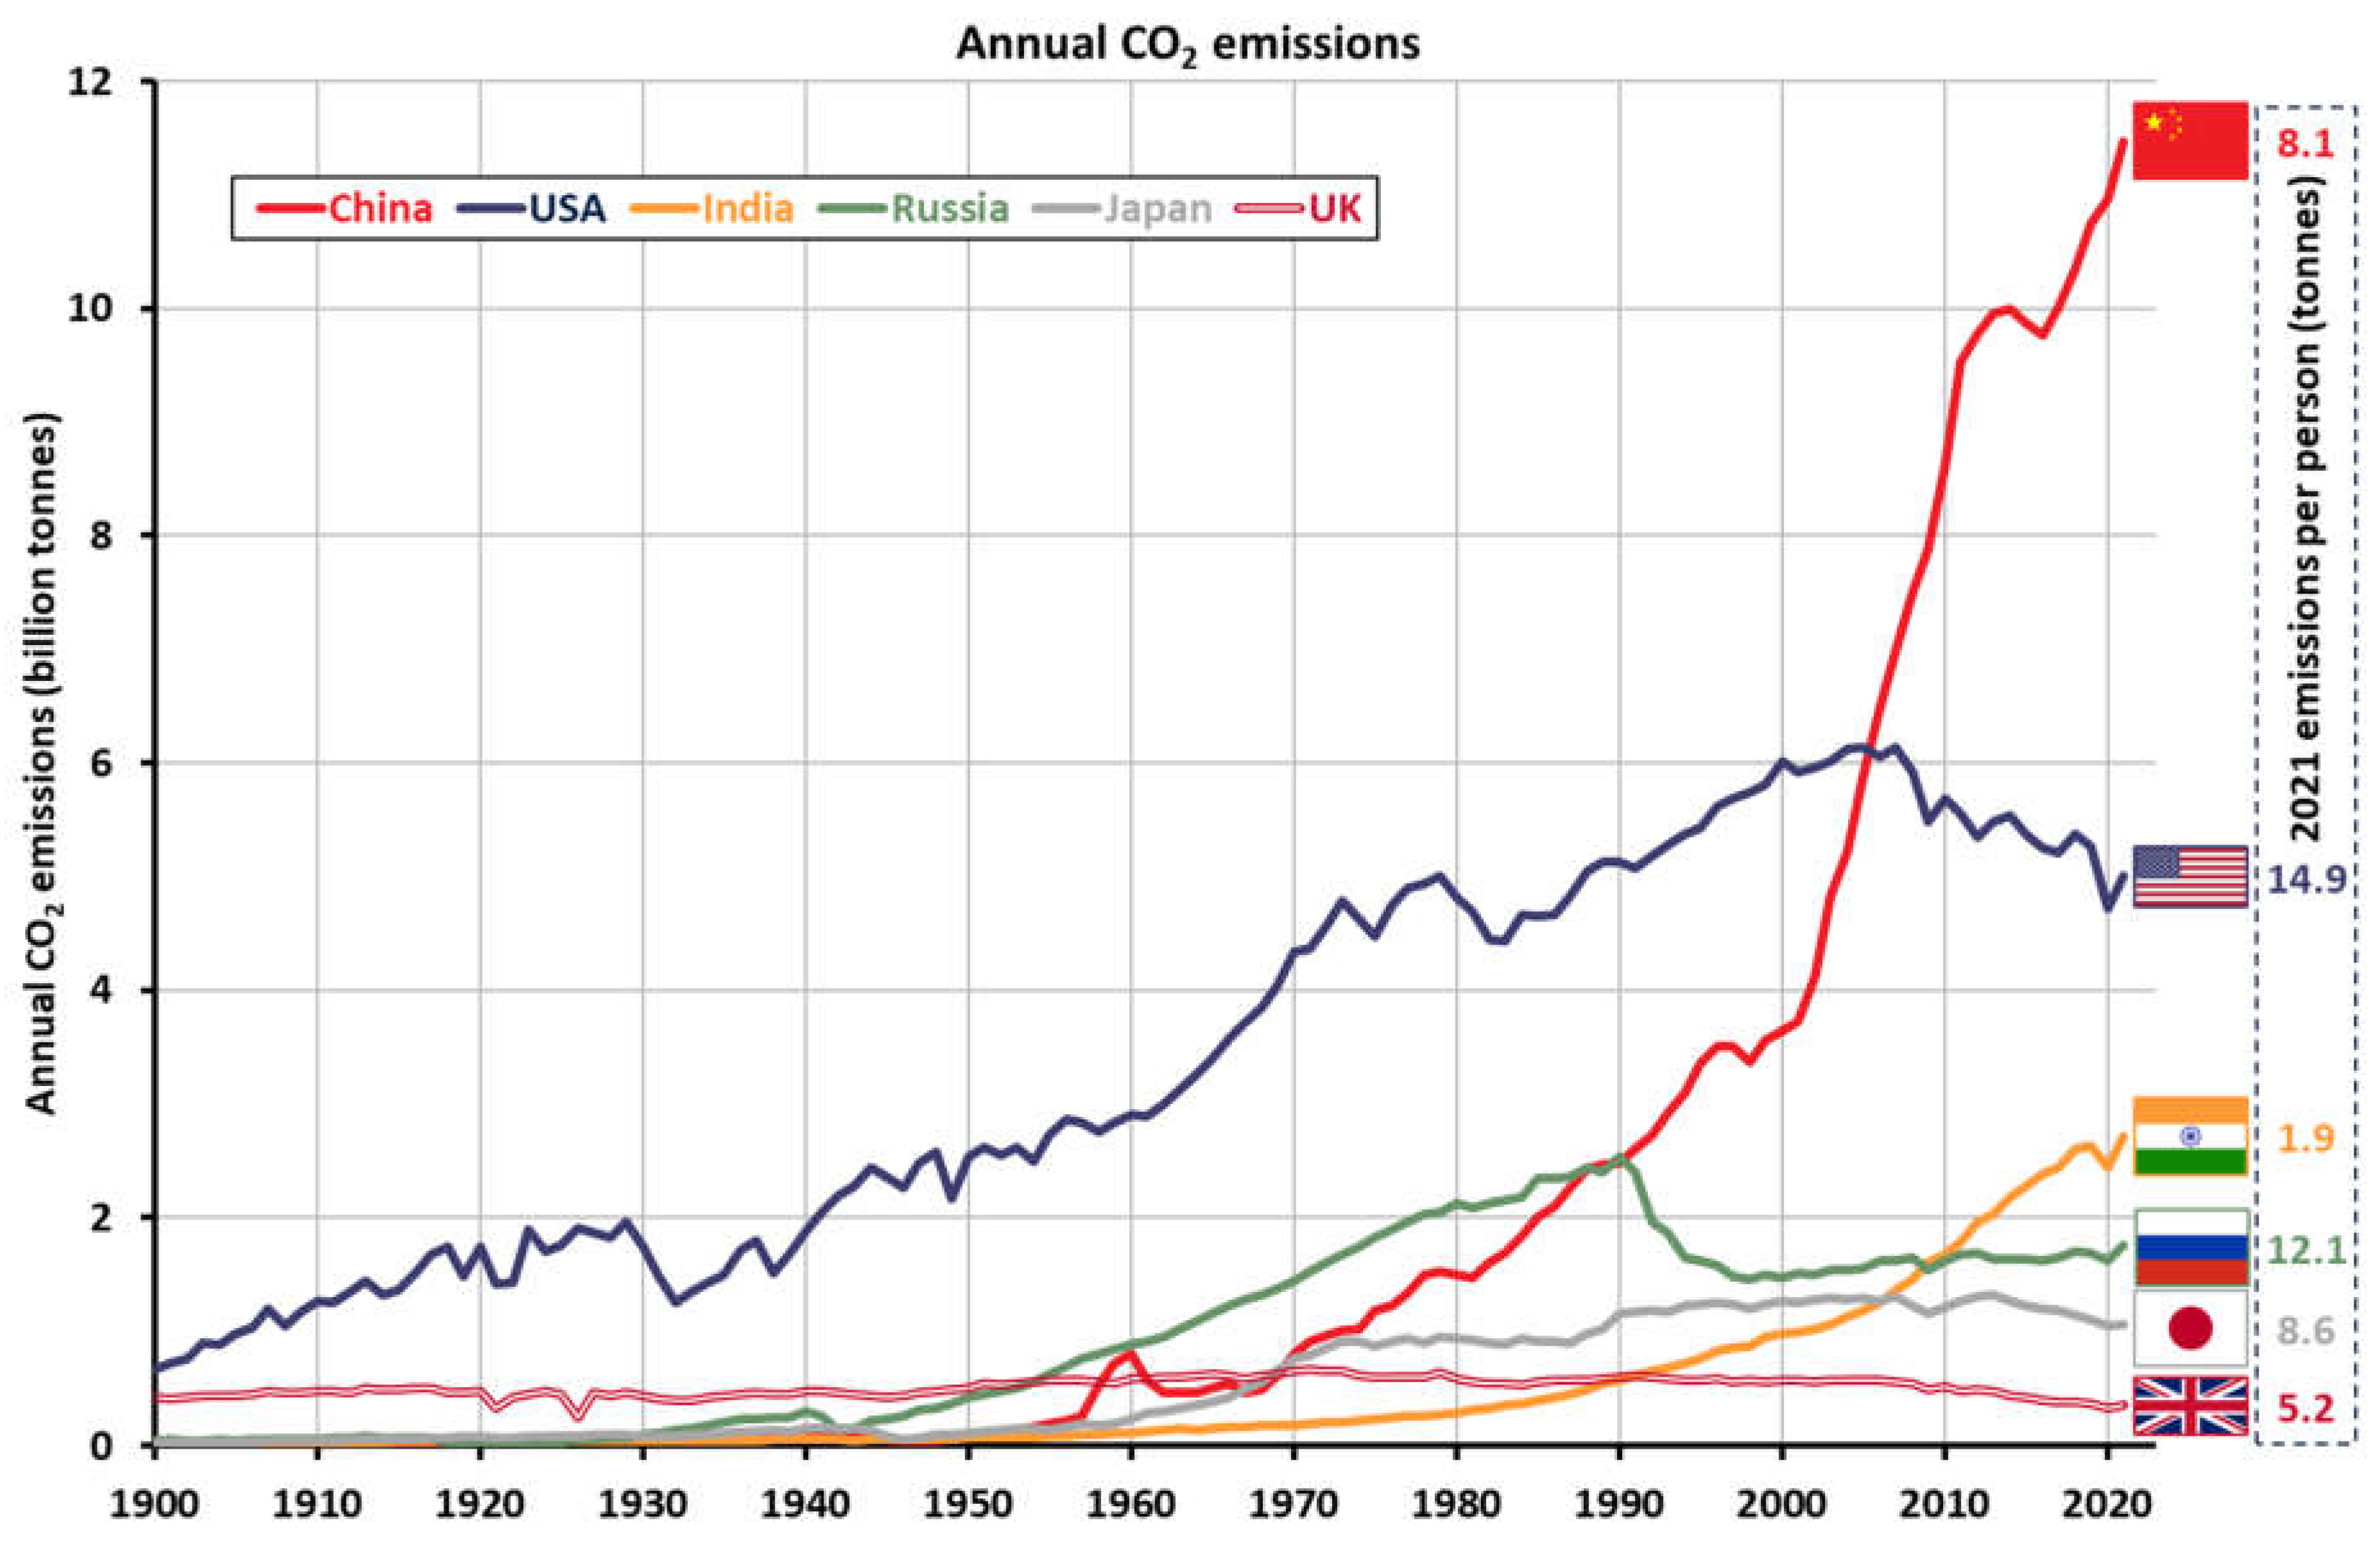
2.4. Energy Trends

There is a detailed discussion of nuclear energy and its place in a sustainable future in Section 4. Prior to this, there are some comments on the broader energy situation in which the UK and world currently finds itself.
The figures below display independently derived data which are openly and conveniently available for readers to visit and explore for themselves. They are based on reference [31] but have been replotted for clarity. These data highlight the scale of the challenge faced in transitioning towards sustainable energy systems with massive reductions in carbon emissions.
Figure 3A,B illustrate the extent to which living standards and energy use are correlated. Countries with high levels of extreme poverty consume less energy per capita, with similar metrics such as energy use per capita versus the Human Development Index showing similar stark trends [20]. As countries and their citizens become wealthier, energy consumption rises sharply.
Over time, countries on average tend to become richer, and the energy consumption rises accordingly (as seen in Figure 3). Figure 4 shows the breakdown of where this increasing energy use derives. Three quarters of global primary energy consumption derives from fossil fuel combustion, which is responsible for the majority of greenhouse gas emissions worldwide.
Figure 5 is a stark reminder of just how big the international challenge of decarbonisation is; in absolute terms, the UK currently emits less than 5% of the CO2 of China (while absolute amounts of CO2 emitted is the discussion here, it should be noted that the UK’s population is slightly less than 5% that of China, so national emissions per person are similar). Based on their current strategy of continued expansion of coal capacity [35] and the trajectory in Figure 5, this is unlikely to reduce emissions in the near future. On the other hand, China’s rapid industrialisation has taken place alongside a considerable investment in nuclear energy, and almost 40% of all reactors being constructed worldwide are in China, compared with only four (7%) in Europe and the USA (Figure 6). China is also merely the frontrunner of many countries around the world that are rapidly developing, and emissions from other countries will inevitably follow suit. India’s emissions are also shown in Figure 5 and display a similar rate of increase to that demonstrated by China merely a couple of decades ago; India and China both have populations of 1.4 billion people, and it is realistic to assume India will aspire to similar industrial output to China in the years to come. Whilst China has pledged to achieve carbon neutrality by 2060 and India by 2070 (both countries also have 2030 targets: China to produce 50% of its electricity from non-fossil sources and India to have achieved peak CO2 emissions), the curves in Figure 5 exemplify the importance of deploying any and all technologies that can flatten or decrease total annual carbon emissions whilst still enabling economic growth in developing countries.
While many sustainability challenges are local, some are global. Mitigating climate change is the most obvious example of a global challenge and must be handled as such. Developing countries generally aspire to the standards of living which are enjoyed in the developed world, and as their economies grow, energy consumption increases. Due to this, and the focus on efficiency in developed nations, the growth in energy demand in developing nations over the coming decades will be more substantial than in the UK [38]. Since mitigating the effects of climate change is the aim, decarbonisation solutions must be found that enable global GHG (greenhouse gas) emissions to be reduced and can be economically installed in the developing world as well as the developed world. The latest Intergovernmental Panel on Climate Change (IPCC) reports suggest the world is not on track to limit global warming to 1.5 °C [39], so faster GHG reductions are needed. This reinforces the primary need to replace fossil fuels by efficiently deploying all available low-carbon energy technologies.
In this regard, it should be acknowledged that the considerable infrastructure and capability requirements needed for a nuclear energy programme will take time to establish in developing countries. These requirements compound the usual difficulties of building nuclear capacity, and so, the longer nuclear energy programmes are delayed before they start, the harder it will be to meet emissions targets globally. Resource management is also key, e.g., if batteries do indeed become the energy storage medium to facilitate renewables-led decarbonisation, enough resources must be extractable worldwide to deliver long-term battery technology across the globe, not just in the developed world. Concerns over secure economic supplies of critical materials are discussed further in Section 3.3.4.
Beyond the rapid industrialisation of large parts of the world, the UK has some energy trends which are worth considering. Firstly, electricity demand will increase in the UK in the coming decades. While electricity use has reduced in recent years, national decarbonisation efforts will soon require increased electrification of sectors which currently make heavy use of fossil fuels (primarily heating and the vehicle fleet). While decarbonisation is currently the driving ambition, this must be balanced with the other sustainability pillars (social and economic impacts) that drive the need for access to affordable and reliable electricity, heating and transport that are essential for supporting a modern economy, and energy for sustaining the quality of life of the population. To exacerbate the challenges faced, a large part of the low-carbon electricity generation of the UK will cease to generate in the next five years. At a time when a focus on low-carbon electricity has been at the forefront of national policy, much of the UK’s existing firm, low-carbon generation—most of it nuclear in the form of the existing Advanced Gas-cooled Reactor (AGR) fleet—is coming offline, with all except the Sizewell B PWR to cease operation by 2028.
With a focus on low-carbon electricity, it is easy to forget that the decarbonisation challenge extends beyond electricity, which only accounts for 21% of final UK energy consumption. Some energy applications are more difficult to electrify than others, and shifting these from current fossil fuel solutions will require attention to other energy vectors, specifically heat, hydrogen, and synthetic fuels. Nuclear energy has a potential role to play in this, which is explored in Section 4.5.
Clearly urgent action is needed to not just replace but expand the provision of firm low-carbon energy to meet net zero targets (in the UK and globally). This is discussed further in Section 3.

3. Sustainable Energy

3.1. Life Cycle Assessment of Energy Technologies and Need for a Level Playing Field

Given that a proper assessment of sustainable development must combine environmental, economic, and social impacts of human activities, there are a range of methodologies that can be applied to assess these impacts. Perhaps the most recognised method is the Life Cycle Assessment (LCA). LCA is a now well-established technique for examining the environmental impacts of industrial products, processes, operations, and plants from “cradle to grave”, from obtaining the raw materials through to use or operations and eventual disposal or end of life treatment. It is used as a tool to identify potential improvements to products and processes that reduce the overall environmental impacts through a so-called “hotspot analysis” and can be an influential tool that often underpins decision making regarding the relative sustainability of technologies. More recently, LCA has been extended to cover social and techno-economic factors as a broader Life Cycle Sustainability Assessment (LCSA).
LCA commonly generates estimations of the environmental footprint for a range of key indicators based on greenhouse gas emissions, land and water usage, pollution, and toxicity. LCSA adds further indicators based on impacts such as operability, levelised cost of electricity (LCOE), employment, and accident risk.

3.1.1. Level Playing Field

Energy sources must be fairly compared on a level playing field against a robust and self-consistent set of metrics if any meaningful progress is to be made in assessing sustainability. Previous studies as well as potential metrics that can be analysed and the methodologies available are summarised in this section. Much further work is needed to thoroughly underpin energy choices and rationally address questions of sustainability. This was outside the scope of the current work, but it is our view that such objective and fair analyses will be vital to enable the global drive towards sustainable energy choices.

3.1.2. Life Cycle Comparisons of Energy Technologies

LCA is the generally accepted means to understand the impacts of processes or technologies on the environment, including energy systems [40]. It is, therefore, a key tool in promoting sustainable development, although, like all other models, the results depend on the input data, boundary conditions, and resolution of the model. While there are international standards now for how LCA should be performed (International Organisation for Standardisation (ISO) standards: ISO 14040 and 14044 [41,42]), they commonly analyse systems against a fairly standard set of environmental indicators that cover air, land, and water pollution; depletion of natural resources; waste creation; and increases in toxicity to ecosystems [22]. Whilst each of the environmental indicators is not necessarily of equal importance, GHG emissions must be a primary driver for sustainability, particularly for energy technologies. Example data in Table 2 clearly show that nuclear is similar to wind and hydro power; other reviews have come to similar conclusions [29,43,44,45,46]. Nuclear energy is even lower if low-carbon energy (such as from a nuclear power plant) is used for the enrichment of uranium fuels (e.g., in France, ~5 gCO2eq/kWhe) [47]. LCAs of different energy technologies are compared in Figure 7. Based on this analysis, Stamford and Azapagic, in their LCA of UK energy options in 2012, concluded: “Environmentally, nuclear is one of the best two options (the other one being wind) according to eight of the 11 indicators” [48].
There are relatively few life cycle studies that cover nuclear energy (e.g., [47,48,50]) but they were recently and comprehensively reviewed by the European JRC [29] as one of the key pieces of evidence to decide whether nuclear energy could be classed as sustainable under the EU Green Taxonomy [26]. Here, sustainability was assessed on the basis of making a “substantial contribution” to climate change mitigation or adaptation as well as doing “no significant harm” to the other environmental objectives:
  • Sustainable use and protection of water and marine resources;
  • Transition to a circular economy, waste prevention, and recycling;
  • Pollution prevention and control;
  • Protection of healthy ecosystems (protection and restoration of biodiversity and ecosystems)
It is notable that “aspects related to the long-term management of high-level radioactive waste and spent nuclear fuel” were explicitly identified in the requirement to do no significant harm. The methodology was based on defining a range of “technical screening criteria” as suitable environmental indicators for these objectives based on outcomes from typical life cycle studies. These non-radiological indicators were:
  • GHG emissions;
  • Atmospheric pollution (SOx and NOx);
  • Water pollution;
  • Land use;
  • Water consumption and withdrawal
  • Production of technological waste;
  • Acidification and eutrophication potentials;
  • Photochemical ozone formation potential;
  • Eco-toxicity and human toxicity;
  • Resource use;
  • Particulate matter emissions.
Additionally, nuclear-specific (radiological) indicators were used to account for the impacts of gaseous and liquid radioactive releases and solid radioactive waste production. The detailed inter-comparison made by the JRC is not repeated here, but their key conclusions were ([29], p. 7):
“The comparison of impacts of various electricity generation technologies (e.g., oil, gas, renewables and nuclear energy) on human health and the environment, based on recent LCAs shows that the impacts of nuclear energy are mostly comparable with hydropower and the renewables, with regard to non-radiological effects.”
“For nuclear energy, its impact on water consumption and potential thermal pollution of water bodies must be appropriately addressed during the site selection, facility design and plant operation phases.”
With regards to life cycle emissions and environmental impacts, therefore, scientific evidence supports the conclusion that nuclear energy is a low-carbon energy source with a low-environmental footprint similar to wind and hydro power. Furthermore, this is the case even if the once-through cycle is used with no recycling of spent nuclear fuel (SNF). However, detailed life cycle studies show that the majority of the environmental impacts are from mining and refining fuels, and so, as will be discussed in a future paper, nuclear fuel cycles that reduce mining and front-end fuel cycle activities will decrease the environmental footprint even further. With regards to radioactive wastes, which are rightly a specific concern when considering the sustainability of nuclear energy, all the life cycle studies conclude that these can be managed safely and thus are not an impediment to nuclear energy being classed as a sustainable energy source, even in the once-through mode. The options for recycling and re-use of materials from radioactive wastes are discussed in many references, e.g., [51,52,53], and how this can enhance the sustainability of nuclear energy will be the basis of a future paper.

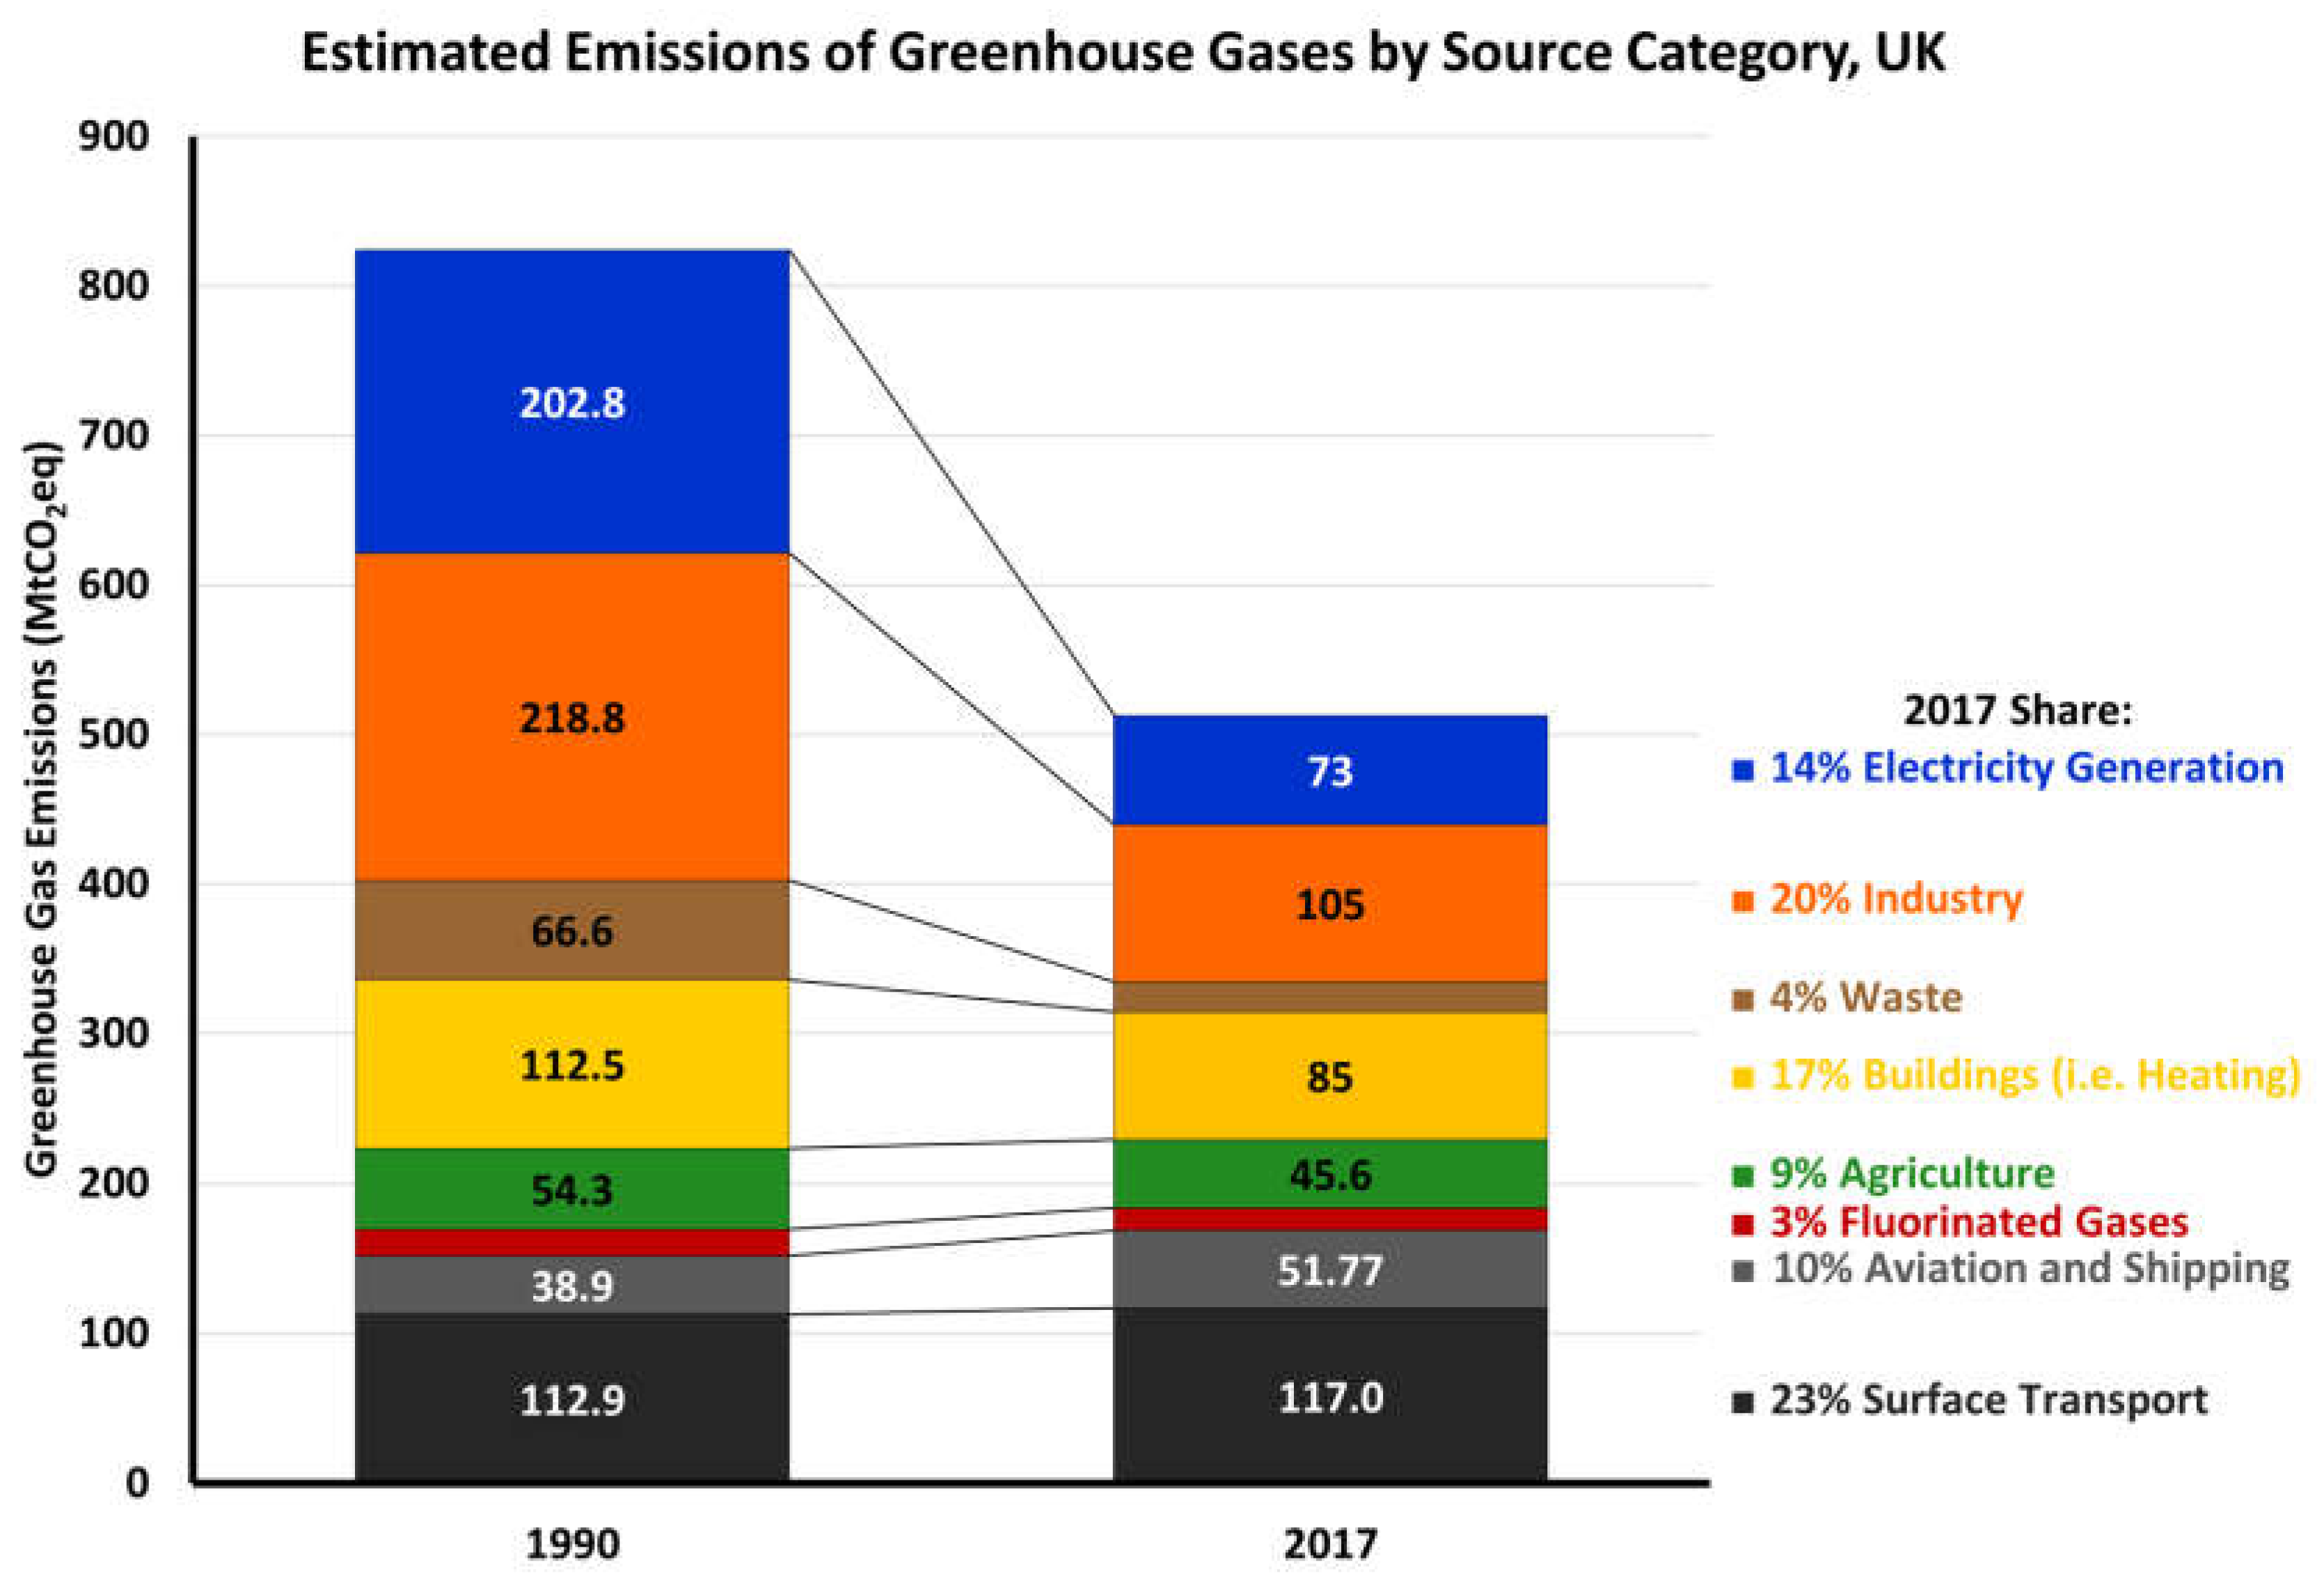
3.2. UK Targets for Greenhouse Gas Emissions

The focus in this section is on the ambitions of the UK in meeting GHG emissions targets, although the discussion is applicable to many developed economies worldwide. As mentioned in Section 2.2.1, much of the focus of sustainability in the UK concerns environmental impacts. For the next few decades at least, the greatest environmental challenge will be the reduction of greenhouse gas emissions to alleviate climate change.
The Climate Change Act 2008 lays out the UK’s ambition to achieve net zero greenhouse gas emissions by 2050. Originally, the target reduction was 80% of 1990 emissions by 2050, but in 2019, this was amended to a 100% reduction. A series of “carbon budgets”, which quantify targets for the total amount of greenhouse gas emissions the UK can emit over successive five-year periods, have been drawn up for the years to 2050. The UK made good progress in hitting its first two carbon budgets (Figure 2.3 in [54]), largely a fortuitous result of the privatisation of UK energy industries, the availability of North Sea gas, and developments in combined cycle gas turbine (CCGT) technology, all prompting the “dash for gas” immediately after the baseline year of 1990, and motivated largely by economics rather than ambitions around carbon reductions. Emissions-heavy coal generation was replaced with much cleaner [55] natural gas over the period, as illustrated in Figure 8 (i.e., up to 2022, as the coronavirus pandemic (declared in January 2020) led to atypically large reductions in emissions due to reduced economic activity and restrictions). Meeting carbon budgets has become increasingly more difficult for the UK following the coal-to-gas transition, as further progress towards the goals requires large structural changes away from fossil fuels beyond power generation. A clear shortfall is anticipated for budget six (2033–2037), where national emissions are projected to be twice as high as the levels specified in the carbon budget (Figure 2.2 in [56]). Such a dramatic and rapid change in the economy away from the status quo for environmental reasons will require (and continue to require) government interventions, as this will not occur organically if left to market forces [57,58]. Progress towards net zero in the UK, and how much still needs to be done, is amply illustrated by Figure 9.
A large barrier to continued decarbonisation becomes clear when the distinction between electricity and energy is considered. Almost all emissions reductions have thus far occurred in electricity generation; however, electricity consumption comprises only one-fifth of the energy consumption in the UK (Figure 10). Decarbonising transport and heating (for buildings and industrial processes) will require massive efforts to achieve, and comparatively little has been achieved in these areas since 1990 (Figure 11).
Available low-carbon energy-generation options can be broadly summarised as thus:
  • Renewables (i.e., wind, solar, hydro, and biomass);
  • Nuclear.
From a sustainability perspective, each has potential contributions and drawbacks. The more difficult sectors (i.e., transport, heating, and industry) will likely require a clean secondary energy source to decarbonise, most likely electricity or hydrogen; however, with proper planning, heat from thermal-generating plants can be used directly by energy end-users. Data on direct and lifecycle emissions from different energy sources, taken from the IPCC, are shown in Table 2.

Carbon Capture and Storage

Fossil fuel combustion with CCS offers the potential to reduce the lifecycle emissions of fossil fuel use. It remains to be seen whether the technique is viable in practice, and the technology is far from proven at scale for electricity generation [61,62]. Questions also exist on just how much CO2 can be captured and successfully stored. The UK target to hit net zero emissions might prove to detract from the potential of CCS. That is, because reliable figures on how efficient CCS can be are still to be determined, a 99% efficient CO2 capture process may be compatible with achieving net zero emissions, whilst an 80% efficient process may not. IPCC median emissions figures for some pre-commercial CCS technologies range from 160 to 220 kg CO2eq/MWh for coal ([49], p. 1335). How these technologies ultimately deliver on reducing emissions, however, remains to be seen, and it is stressed that a life cycle approach to analysing their impacts should be taken, including any releases of methane across the full life cycle from extraction to use [63,64,65,66].

3.3. Renewables

This section gives an overview of some of the applications and issues associated with renewable energy sources. It is emphasised upfront that these technologies are of primary importance to delivering the sustainable low-carbon energy needed in the UK and globally. There are limitations, however, and it is in addressing these limitations that there is a potential role for nuclear energy; this is the aim of the paper and is discussed in Section 4.

3.3.1. Hydroelectricity

Hydroelectricity utilises the flow of water to generate electricity. Generating methods exist in four broad forms:
  • Tidal stations use daily tides to drive turbines. Existing plant capacities are mostly in the order of megawatts, with the Sihwa Lake and Rance stations (in South Korea and France, respectively) as the two exceptions, at around 250 MW each. GW-scale plants do not yet exist but have been proposed at several sites, such as the Severn estuary.
  • Run-of-the-river stations utilise flows of rivers to generate power. These plants typically incorporate many small turbines, and many GW-scale plants are in operation, such as the 2.6 GW Chief Joseph Dam over the Colorado river in the USA.
  • “Conventional” hydro plants require the construction of a dam to create a reservoir, the water from which can then be passed through a turbine to generate electricity. Examples include the Hoover Dam in the USA. Most hydroelectric power derives from this method, with over 200 GW-scale plants in operation or under construction worldwide.
  • Pumped-storage facilities, such as Dinorwig, pump water up into reservoirs to release later when needed. This is not a source of energy but rather a storage method. Many plants with generating capacity over 1 GW exist worldwide, with storage capacity in the tens of GWh at the largest plants.
Hydroelectricity is an extremely desirable energy source, as it is one of a few options which is both renewable and dispatchable. In terms of the total installed capacity and energy generated, it is the most utilised renewable energy method worldwide. Pumped storage offers a potential energy storage method for other renewable generation. Dinorwig is the only facility with an installed capacity exceeding 1 GW in Great Britain (1.8 GW), with a maximum storage capacity of 9.1 GWh. (For reference, total annual electricity consumption in the UK was 346 TWh in 2019 ([67], p. 77), on average, 948 GWh per day. Annual peak power demand is ~50 GW). The costs of pumped storage facilities may be such that they cannot be cost-effective for supporting intermittent renewable energy supply, even when accounting for arbitrage within the electricity market [68], but facilities such as Dinorwig have an important role in responding to shortages and emergency frequency regulation.
The downsides of hydroelectric power generation can be summarised as:
  • Geography dependence;
  • Safety;
  • Environmental and social impacts.
Taking these issues in turn:
Geography Dependence—Hydroelectric plants have specific geographic requirements, which restrict the potential for deployment. Run-of-river plants obviously need a river to function, with size and flow rate critical considerations for deployment. Opportunities for large tidal installations are limited further, with high tidal ranges preferred. Conventional hydroelectric dams are most suited to regions where large rivers flow through canyons or gorges. Conventional hydroelectric opportunities have largely been exploited to their maximum potential ([69], p. 18) in the UK, and while further expansion may be pursued with run-of-the-river hydroelectricity, options are still ultimately limited.
Safety—Safety concerns from large hydroelectric schemes are significant. This is most applicable to conventional large-dam generation, where dam failures can lead to considerable loss of life. Safety of energy technologies, which is of course highly pertinent to the acceptance of nuclear energy, is discussed in more detail in Section 4.1.
Environmental Impact—Large infrastructure projects inevitably have environmental impacts, and for most other generation methods, the impacts of extraction of critical materials or fuel are also sizeable. Large hydroelectric projects often have consequences in the form of population displacement (over 1 million in the case of the Three Gorges Dam), loss of agricultural land and woodland, and impacts on wildlife and ecosystems up and downstream of the plant.

3.3.2. Wind and Solar

Wind and solar are popular options for installed generation capacity because they require no fuel to operate, rely on natural sources, and are relatively cheap and simple to install. It is, therefore, very desirable (and expected) that they form a large component of our future low-carbon energy supplies. In the UK, in 2013, when the average wholesale price of electricity was GBP 52 [70], levelised costs of offshore and onshore wind were GBP 150/MWh and GBP 100/MWh, respectively (2012 prices; note that it was around this time that the strike price for Hinkley Point C was set at the relatively competitive rate of GBP 89.50/MWh (down from GBP 92.50/MWh if Sizewell C was also delivered) (Figure 2.3 in [71]). Since then, auctions for Contracts For Difference (CFDs) have driven prices of wind and solar projects down substantially; in 2022, wind and solar projects of various sizes were allocated with strike prices of GBP 37–46/MWh [72]. Short project build times mean that investors begin receiving returns on their investment far sooner than is the case with a CFD for delivery of a conventional (large-scale) nuclear power plant [73], which makes short-build projects much more attractive from an investment point of view, despite the fact that the construction time per unit energy is fairly similar for offshore wind and nuclear. A crude comparison can be made between two UK projects which began at similar times: the Hornsea 1 offshore wind farm and the Hinkley Point C nuclear plant (still under construction). Hinkley Point C, rated at 3.2 GW, assuming a 90% load factor and 11.5 years of construction time, equates to around 4 years per “effective” GW. UK offshore wind capacity factors are 38.6% on average ([74], p. 5). Exact generation of individual plants can be difficult to find, but Hornsea 1 (1.2 GW capacity) is likely higher than average, with a capacity factor of 46.6% quoted [75]. With a 2-year construction time, this equates to 3.5 years per “effective” GW.
The low CapEx costs of new wind and solar projects are of obvious benefit, but other factors must be considered as wind and solar begin to provide a greater proportion of a grid’s electricity, specifically:
  • Intermittency;
  • Low-capacity factor;
  • Grid instability;
  • Need for grid infrastructure expansion;
  • Effect on the price of supporting power infrastructure;
  • Lifecycle emissions.
Wind in particular forms a large part of the UK’s future energy strategy, and so these factors warrant attention. Each is briefly considered below.

Intermittency

Wind and solar are reliant on weather conditions, which are variable. Solar is by its nature diurnal but is also affected by cloud cover, and at high latitudes, intensity varies through the year. Average monthly capacity factors for solar range from 20% at the height of summer to 3% in winter, when the UK needs energy the most (in 2022, national solar photovoltaic installed capacity was 14.7 GW, delivering 13.3 GWh of generation [76], equating to a 10.3% capacity factor over the year). Wind speeds are variable through the course of a day and over periods of weeks, leading to periods of high and low wind output. There is also an important interannual aspect, with a variation of around 5% between high- and low-wind years, with the industry standard being to assume 6% for offshore wind [77]. Intermittency of supply is a serious concern for wind and solar energy supply. A modern electricity grid needs dispatchable power and needs either firm (“firm” energy sources are those which are available on demand) sources of energy or significant energy storage to do so. As mentioned in Section 3.3.1, the pumped storage facility Dinorwig stores 9 GWh of energy, which is enough to power Great Britain for less than 15 min at average demand. Low wind periods regularly last up to two weeks, so the amount of storage that would be needed to accommodate these low-generation periods would be considerable. Such storage is expensive, and at the scales needed to support large parts of the country during low wind, financially implausible. At present, energy storage is not priced into the cost of intermittent renewables as they can currently rely on other generators at times of low output; however, storage costs would be passed on to consumers in the event of it becoming essential.
The energy storage requirement is also not factored into many Life Cycle Assessment (LCA) studies. For a level playing field comparison of LCA between energy technologies, this should ideally work on a balanced system basis including the cost of storage. This presents problems as, under a 100% renewable system, someone would need to carry the burden of the necessary installed storage capacity to facilitate uninterrupted demand from a variable supply. From a whole system approach, delivering a portfolio including firm technologies such as nuclear would alleviate the need for extensive storage and bring the overall cost of the system down. To illustrate the issue, Figure 12 shows a month’s power demand for Great Britain in early winter 2020 along with generation from wind, solar, gas, and nuclear. At this point in time, installed wind capacity was 24 GW. Wind generation fluctuated over time and was near zero for days at a time, including at times when energy demand was greatest. Gas combustion made up the shortfall, as is evident from the figure. Decarbonising the grid entirely would preclude (non-CCS) gas combustion, creating challenges in designing and financing a system that meets demand with large deployment of intermittent renewables.

Low-Capacity Factors

Capacity factors for offshore wind are typically 32–43%, whereas onshore is lower (Scout Moor, the largest onshore wind farm in England, is 26%) ([79], p. 14). Low-capacity factors are a particular problem if an energy strategy relying on renewable generation plus storage to handle intermittency is desired. As the capacity factor is reduced, the amount of excess capacity (and energy storage) needed to maintain a functioning grid increases, and with the need to decarbonise sectors which are not currently supported by the electricity grid, the amount of installed capacity that would be needed becomes very large indeed. The low power density of a technology such as onshore wind would also require enormous land area to meet such capacity.
In 2021, the total installed capacity of wind generation in the UK and EU was 236 GW, yet peak output was 103 GW (44%), achieved on one day in March (Figure 1 in [80]). This is an indicator that installed capacity, while often quoted as a headline figure, is of little use without appreciation of the capacity factor.
The capacity factor of photovoltaic solar in the UK is around 10%. This, combined with its need for some critical elements (discussed in Section 3.3.4), makes solar less useful than wind in the UK at delivering low-carbon energy. While solar has useful applications in locations with more reliable sun (e.g., Spain, North Africa, or California), where its output is often correlated to need (i.e., for air conditioning), and small-scale or localised applications in the UK, it is unlikely to deliver large-scale solutions for the UK’s net zero energy challenge. Due to its low cost, solar will have some role to play in a cost-effective route to net zero in the UK, but even at significant quantities, its role would still be relatively modest compared to other solutions as a result of its low capacity factors.

Grid Instability

Grid stability refers to the ability of an electrical power system to maintain constant frequency and voltage within acceptable limits. This ensures supply matches demand and prevents disruptions and blackouts. A high proportion of renewables has consequences for the reliability of the electricity grid. Thermal power plants rely on producing heat to rotate generators (by burning fossil fuels or nuclear fission, for instance) and provide a stabilising effect on system frequency (“thermal” power plants produce high temperatures and use a heat engine to generate useful mechanical/electrical energy and should not be confused with “thermal” nuclear reactors, which refer to the “thermal” neutrons used in the fission of uranium-235). Wind and solar are asynchronous and do not provide such a benefit. As more power proportionally comes from wind and solar, fewer options to stabilise frequency are available. The existence of thermal generation alongside future renewables is, therefore, of utility. However, Britain’s National Grid has ambitions to lessen this effect on the grid to accommodate larger proportions of renewable electricity [81].

Need for Grid Infrastructure Expansion

Thermal plants have been built with good connections to the grid to facilitate delivery of power to where it is needed. Wind farms by their nature are best located in more remote regions and are less able to make use of existing grid infrastructure at retired fossil fuel and nuclear sites. Future expansion of the grid towards the more remote sites for wind generation is not currently factored into calculations of renewables’ LCOE. However, this will become more significant as the proportion of renewable installed capacity increases and thus should be fed into lifecycle cost calculations.

Effect on the Price of Supporting Power Infrastructure

Wind generation accounted for a quarter of electricity generation in 2020, with gas generating the most at 38.4% ([82], p. 1). Wind generation has been increasing annually since the early 2000s, with prices per kWh reducing over the same period. This has had a beneficial effect on electricity prices generally; however, this trend will reverse once intermittent renewables grow beyond a certain point.
At high levels of intermittent renewable generation capacity (such as wind), the lack of suitable storage means that at points where generation is higher than demand, power must be dumped. This wasted power increases the price per unit of the generation, and such diminishing returns will continue to be a characteristic of high renewable grids until a storage option is achieved [83]. Developing a storage solution using batteries would substantially increase demand for already critical materials, as discussed further in Section 3.3.4.
As shown in Figure 12, gas is presently used to balance out the intermittency in renewable generation. Thus, a high proportion of wind capacity has additional consequences for the price of this supporting gas-powered generation. With increasing power coming from wind, the capacity factor of gas would be reduced, and so its cost per unit of electricity would increase. The intermittent nature of wind power is such that a high level of complementary baseload gas generation must be on standby, ready for periods of low wind generation. A net increase in electricity price results, albeit not manifested as an increase in the unit price of wind energy directly, but as a whole system cost. Alternatively, the standby gas becomes too uneconomic to maintain. It is likely, therefore, that wind has a natural plateau of effectiveness before becoming counter-productive to the overall system and that another (low carbon) means for dealing with the intermittency is needed. Essentially, this means that the overall cost of the generation method must clearly include full system costs, as they are critical when making comparisons between technologies.

Lifecycle Emissions

Lifecycle emissions should be considered for all energy generation methods. However, it is often the case that lifecycle emissions for wind and solar are overlooked, as demonstrated explicitly in the choice to derogate wind and solar from the need to provide assessments for the EU Taxonomy (Section 2.3), which does not reflect a level playing field. Table 2 summarises IPCC data on GHG emissions from energy technologies. Similar data have been reported elsewhere [29,47]. These show that whilst direct emissions are zero, life cycle emissions are low for all renewables except biomass but with some variability; wind power performs best. Other emissions that contribute to the overall environmental footprint, however, should also be considered, e.g., nitrogen oxides, sulphur dioxide, particulates, heavy metals, etc. LCA is the usual tool for these assessments, and data are generally normalised to electricity generation (per kWh) to enable comparison. As wind and solar rely on various critical materials to operate, which must be mined and refined (see Section 3.3.4), and many small units (e.g., turbines) to generate power, all of which must be manufactured, installed, and decommissioned at end of life—generating wastes for disposal—it is important that the full life cycle is analysed.

3.3.3. Biomass

Biomass is a thermal renewable source and provides a sizeable amount of the UK’s renewable electricity. Biomass has the benefit of being a firm energy source but requires attention to the sourcing of its fuel due to the sustainability concerns arising from active deforestation and loss of potential carbon sinks. Britain’s biomass fuel is primarily imported wood pellets from North America, with carbon emissions from transportation that must also be considered when determining the lifecycle emissions of the fuel. For biomass fuel to qualify as “renewable” under the Renewable Obligation prior to 2020, the biomass lifecycle greenhouse gas emission intensity must be below 285 kg CO2eq/MWh ([84], p. 26) for electricity (reducing in stages to 180 kg CO2eq/MWh for facilities beyond 2025). For context, natural gas combustion yields 181 kg CO2/MWh thermal (116.64 lb CO2/MBtu from [55]), with median CCGT emissions around twice that ([49], p. 1335). Clearly, this is above the energy intensity threshold set by the EU, which was average emissions over the plant’s physical lifetime or 40 years (whichever is shorter) to be lower than 100 gCO2e/kWh.
Establishing domestic sources of biomass often requires a trade-off between using agricultural land to produce food and biomass for energy; however, a “food-first” approach could make use of more marginal quality land for biomass, which would reduce this impact. This is particularly relevant given recent trends in food prices (food inflation of 19.2% [85] versus CPIH rate of 8.8% [86] in early 2023), where increases impact quality of life particularly among the least financially well off. Germany, for example, dedicates 14% of its agricultural land to energy crops (versus 22% for food) ([87], p. 2). Agricultural greenhouse gas emissions are among the most difficult to reduce (see Figure 11), so attempts to displace carbon dioxide emissions from fossil fuels must be weighed against equivalent greenhouse gas emissions deriving from biomass.
Notwithstanding the concerns above about land usage and deforestation, coupling CCS with biomass does offer an interesting opportunity to generate energy that delivers overall negative carbon emissions. This could help offset other sectors where full decarbonisation will be very difficult to achieve. With proper attention paid to sustainability, the UK’s Committee on Climate Change (CCC) believes up to 15% of the UK’s primary energy demand can potentially be met with biomass ([88], p. 10).

3.3.4. Critical Materials

There is a growing recognition that many modern technologies rely on critical materials, and demand for these is rising globally [89]. Of the elements identified to be critical resources, the rare earth elements (i.e., the lanthanoides plus scandium and yttrium) are a leading example [90,91]. They are important for a range of technologies and goods, including mobile phones, televisions, LED light bulbs, military applications, electric vehicles, wind turbines for renewable energy generation [92], and more. The value of the goods that critically need rare earth elements is estimated at USD 7 trillion or nearly 10% of the global economy, even though the market for rare earths themselves is only around USD 9 billion [93]. Also, there are geopolitical concerns around the security of supply since China is the dominant supplier (about 80% of the market in 2016), with other significant supplies from Australia, Russia, India, and Brazil.
Whilst rare earths are not particularly rare in the earth’s crust, economic reserves for mining are scarce. The environmental and social impacts of rare earth mining and processing, particularly in China, have been highlighted in a number of articles [94], some of which report alarming impacts on the health of local people as well as extensive environmental damage. As well as the physical damage to the environment caused by mining, hazardous wastes containing acids, organic solvents, and heavy metals are generated and often not treated or contained due to lax environmental standards as well as illegal mining. These hazards are exacerbated by the fact that thorium or uranium are often found alongside rare earths, meaning wastes can have low levels of naturally occurring radioactivity.
Despite the growing focus on technological wastes, fewer than 1% of rare earths were recycled in 2019 [95,96]. The global move towards renewable energies and electric cars will substantially drive up the demand and cost of rare earths with consequent environmental impacts that are often excluded in the discussion about their green credentials. Instability, or at least unpredictability, in prices (and availability) of rare earths appears likely in the future given the rising demands, supply chain security, and increasing awareness of the environmental impacts leading to more socially responsible mining and processing. Substitution and recycling must also grow to ensure sustainable access to these critical materials. As prices rise due to demand, previously uneconomic resources will become economically viable reserves.
This issue was highlighted in the EU’s Taxonomy Technical Report as a recommendation, stating that ([27], p. 158):
“…the scope of the manufacturing section of the Taxonomy should be extended to cover more manufacturing activities. Care must continue to be taken to review the context in which the Taxonomy is applied to ensure that it does not identify activities as green which have perverse incentives or a negative impact on other environmental objectives.”
Manufacturing and mining sectors are recommended to be included in the future, with mining being:
“…an important sector both in terms of avoiding bottlenecks in the deployment of low-carbon technologies by providing the critical materials needed for low-carbon technologies, as well as the value chain link with energy-intensive manufacturing sectors.”
…and that:
“…the platform [should] analyse the role [mining] plays in terms of enhancing availability of the critical materials needed for current and future technologies to create a climate neutral, circular and resource efficient economy, while sourcing raw materials in a sustainable and responsible way, with a view to consider the enabling potential of the sector. The platform is recommended to ensure that a life cycle approach is applied when assessing the different phases of the value chain for mining is applied. The rationale for applying life cycle analysis is that many metals are essential for low-carbon technologies. For example, Aluminium for lightweight cars; Copper for electrics and motors in electric vehicles, solar panels and wind turbines; Battery metals (Cobalt, Lead, Lithium, Manganese, and Nickel) for clean mobility and grid storage batteries; Zinc and Cobalt for protecting off-shore wind turbines; Silicon in solar panels; Precious metals for clean mobility and solar panels.”
The importance of critical materials, while raised as a recommendation, did not factor into the decision over whether a technology was ultimately defined as sustainable.

4. Nuclear Energy

The previous sections have mentioned some of the difficulties in securing an environmentally conscious and reliable electricity grid. Renewable energy generation suffers from problems such as intermittency (wind and solar), geographical restrictions (hydroelectricity), and the sustainability challenges over agricultural land use and deforestation (biomass). Fossil fuels suffer none of these problems but release unsustainable CO2 emissions and can be subject to volatile fuel costs. Given the various shortfalls of differing technologies, the challenge of building a sustainable future grid is extremely difficult.
Nuclear energy has a range of positive aspects that complement other low-carbon technologies and can improve the prospects for delivering a sustainable future energy supply [97]. However, as with all other potential generating options, nuclear energy has its downsides, which should be considered rationally and proportionately along with the alternatives. A level playing field approach whereby all options are considered against the same criteria allows the best choice for a sustainable future for the UK and the world. The potential downsides associated with nuclear energy are widely discussed and can be summarised as the challenges surrounding:
  • Safety (including proliferation risks);
  • Radioactive waste;
  • Economics (including limited global uranium supply).
Each is discussed below. In addition, the benefits of nuclear technology are often overlooked. These are also deserving of consideration and include:
  • The role within the electricity grid;
  • Secondary fuel (e.g., hydrogen) production;
  • Industrial heat provision.

4.1. Safety

Any discussion of nuclear energy must address the issues and perceptions around its safety. The risk of severe accidents is a major concern in nuclear energy’s reputation and its public acceptance. The focus of modern media and the public’s general difficulty with objectively assessing levels of risk mean that evaluating the safety of any industrial activity is a challenge, and nuclear energy particularly so.

4.1.1. Considerations

With reliable enough data, deaths and injuries are the easiest metrics to compare. As with many other industries, energy generation has many potential hazards which could lead to direct injury or death, and there are many stages beyond plant operation to consider, such as extraction of raw materials for fuelling or manufacturing, logistics, or the various chemical and physical processes which are needed for preparing fuels.
More difficult to compare are the indirect health impacts. Respiratory conditions from inhalation of particulates during mining or from fossil-fuel-powered vehicles or power plants are sizeable and can be difficult to distinguish from those which occur in populations due to other reasons. Health impacts from radioactivity are similarly difficult to measure and are not the sole preserve of nuclear energy given the radioactivity content of ash from coal plants or the co-extraction of Naturally Occurring Radioactive Material (NORM) during oil and gas extraction, for example. Waste streams which include toxic materials appear in many places, and all have potential health implications. Further complications arise when accidents which impact workers are viewed differently from those which impact populations more broadly. A unique challenge for the nuclear industry is that of proliferation, where materials and technologies involved in the sector could potentially be repurposed for military applications.

4.1.2. Deaths

Perhaps the most instructive metric in assessing the safety of various generation technologies is the number of deaths which result from production per unit of electricity generated. Figure 13 shows the deaths per TWh of electricity generated for different generation methods.
Mining and heavy industry are dangerous environments generally, but a clear observation from the data is the very low numbers associated with wind, solar, and nuclear generation compared with those from fossil fuel use. The dangers involved in coal mining and oil and gas extraction and refining are well documented, but the loss of life due to air pollution from fossil fuels is also substantial: fossil fuel pollution causes an estimated 7 million deaths per year worldwide ([45,101,102,103], p. 7).
Hydroelectric dam failures are thankfully very rare but potentially devastating nonetheless (for example, the estimated fatalities from the 1975 Banqiao Dam failure range between 171,000 and 230,000 ([104], p. 118)). However, as seen in the figure, when averaged over electricity generation, the value for hydro-power is far lower than all fossil-fuel-based energies and indicative of a good safety record overall.
Nuclear incidents and accidents are also very rare, and human consequences are usually localised when they do occur, affecting the workforce most. Only three accidents at civil nuclear power plants have had significant off-site consequences (as classified by the International Nuclear and radiological Event Scale (INES) to be Level 5 or above; Three Mile Island, Chernobyl, and Fukushima Daichi), with relatively few fatalities compared to accidents in other heavy industries. Taking the latest of these “severe accidents”, Fukushima, to be most relevant to current nuclear power and noting the impact this has had on confidence in nuclear power in Japan and elsewhere, the confirmed direct death toll has been reported as one worker from lung cancer in 2018. An indirect 2313 deaths have been estimated as a consequence of physical and mental stresses of the response to the accident and evacuation. It should be remembered that Fukushima was caused by external events (the Great East Japan Earthquake and consequent tsunami), in which nearly 20,000 people were directly killed by the earthquake and tsunami (Sec. Attachment 1, [105], p. 7) and many more displaced. The low number of deaths from even the most severe reactor accidents combined with the large amount of energy produced from nuclear fission, more than 18,000 cumulative reactor years of operation, thus delivers a low level by this metric, comparable to the safest forms of renewable energy and significantly lower than hydro-power.
A specific risk of nuclear incidents is the release of radioactive materials, potentially exposing the public to radiation doses hazardous to health. Many comparisons on doses received due to the nuclear industry compared with natural radiation, radiation from other industrial activities (such as burning fossil fuels), and medical use of radiation have been made to put the risks in context. Further analysis of this is beyond the scope of this paper, but again, a level playing field is needed here.
Returning to the Fukushima incident, as a suitable example, and as described above, since 2011 only one workforce death has been directly linked to the subsequent effects of incident (in 2018). The measurement of indirect deaths from the stresses of the evacuations coupled with low risks to the public of low levels of radiation has led to some studies to call for a re-examination of the emergency response to minimise the overall impacts of any future accidents [106].

4.1.3. Ionising Radiation

Radiation safety is a key concern for nuclear energy generation. Nuclear fuels are radioactive and vary in hazard depending on the specific fuel; however, the greatest radiological hazard is from the spent fuel due to the abundance of highly radioactive fission products therein. Not all radiation is the same, and given the complicated nature of radioactivity, the media often has difficulty in relaying the risks of radiation to the public, particularly when low levels of ionising radiation are concerned and in distinguishing between levels of radioactivity (measured in becquerels) and its effects (adsorbed dose measured in grays and equivalent dose measured in sieverts). Ionising radiation is radiation which has sufficient energy to ionise target atoms or molecules. Visible light, microwaves, and radio waves are examples of non-ionising radiation. Gamma rays; X-rays; and particle radiation such as alpha particles, beta particles, and neutrons are examples of ionising radiation.
Populations are continually exposed to radiation from a wide variety of sources. Occupational exposure is a factor for groups working with radiological materials (e.g., nuclear industry workers, radiographers, miners, laboratory researchers) and should be minimised. However, airline crews are the most exposed group due to their repeated exposure to cosmic rays, which also affect airline passengers. The public more broadly receives a continual dose from natural background sources in addition to medical procedures and the likes of fuels, tobacco, and flying. The exposure resulting from routine operation of the nuclear fuel cycle is small in comparison. Dose charts, such as [107], which compare doses from various sources, are useful to quantify the risks to which populations are regularly exposed. Clearly, the risks to the public of radiation from nuclear power (including the nuclear fuel cycle) from normal operations are extremely low compared to the risks of other industries and everyday activities we take for granted. However, accident scenarios present a different level of concern.

4.1.4. Summary

Judged qualitatively and in isolation, it would be easy to consider nuclear as unsafe; however, rational comparisons on a level playing field relative to alternative generation methods establish that this is not the case. It should also be noted that, unlike other energy technologies, all aspects of nuclear energy production across the full life cycle are very heavily regulated, controlled, and audited by independent bodies such as the Office for Nuclear Regulation (ONR) in the UK as well as international organisations such as the World Association of Nuclear Operators (WANO) and the International Atomic Energy Agency (IAEA). It is clear that the commitment to nuclear safety remains of paramount importance in ensuring its social and political acceptability, and the reality is that a single accident anywhere in the world will negatively affect the entire industry [108]. Nevertheless, based on an analysis of facts, nuclear energy is indeed a safe solution to the global need for low-carbon energy.

4.2. Radioactive Waste
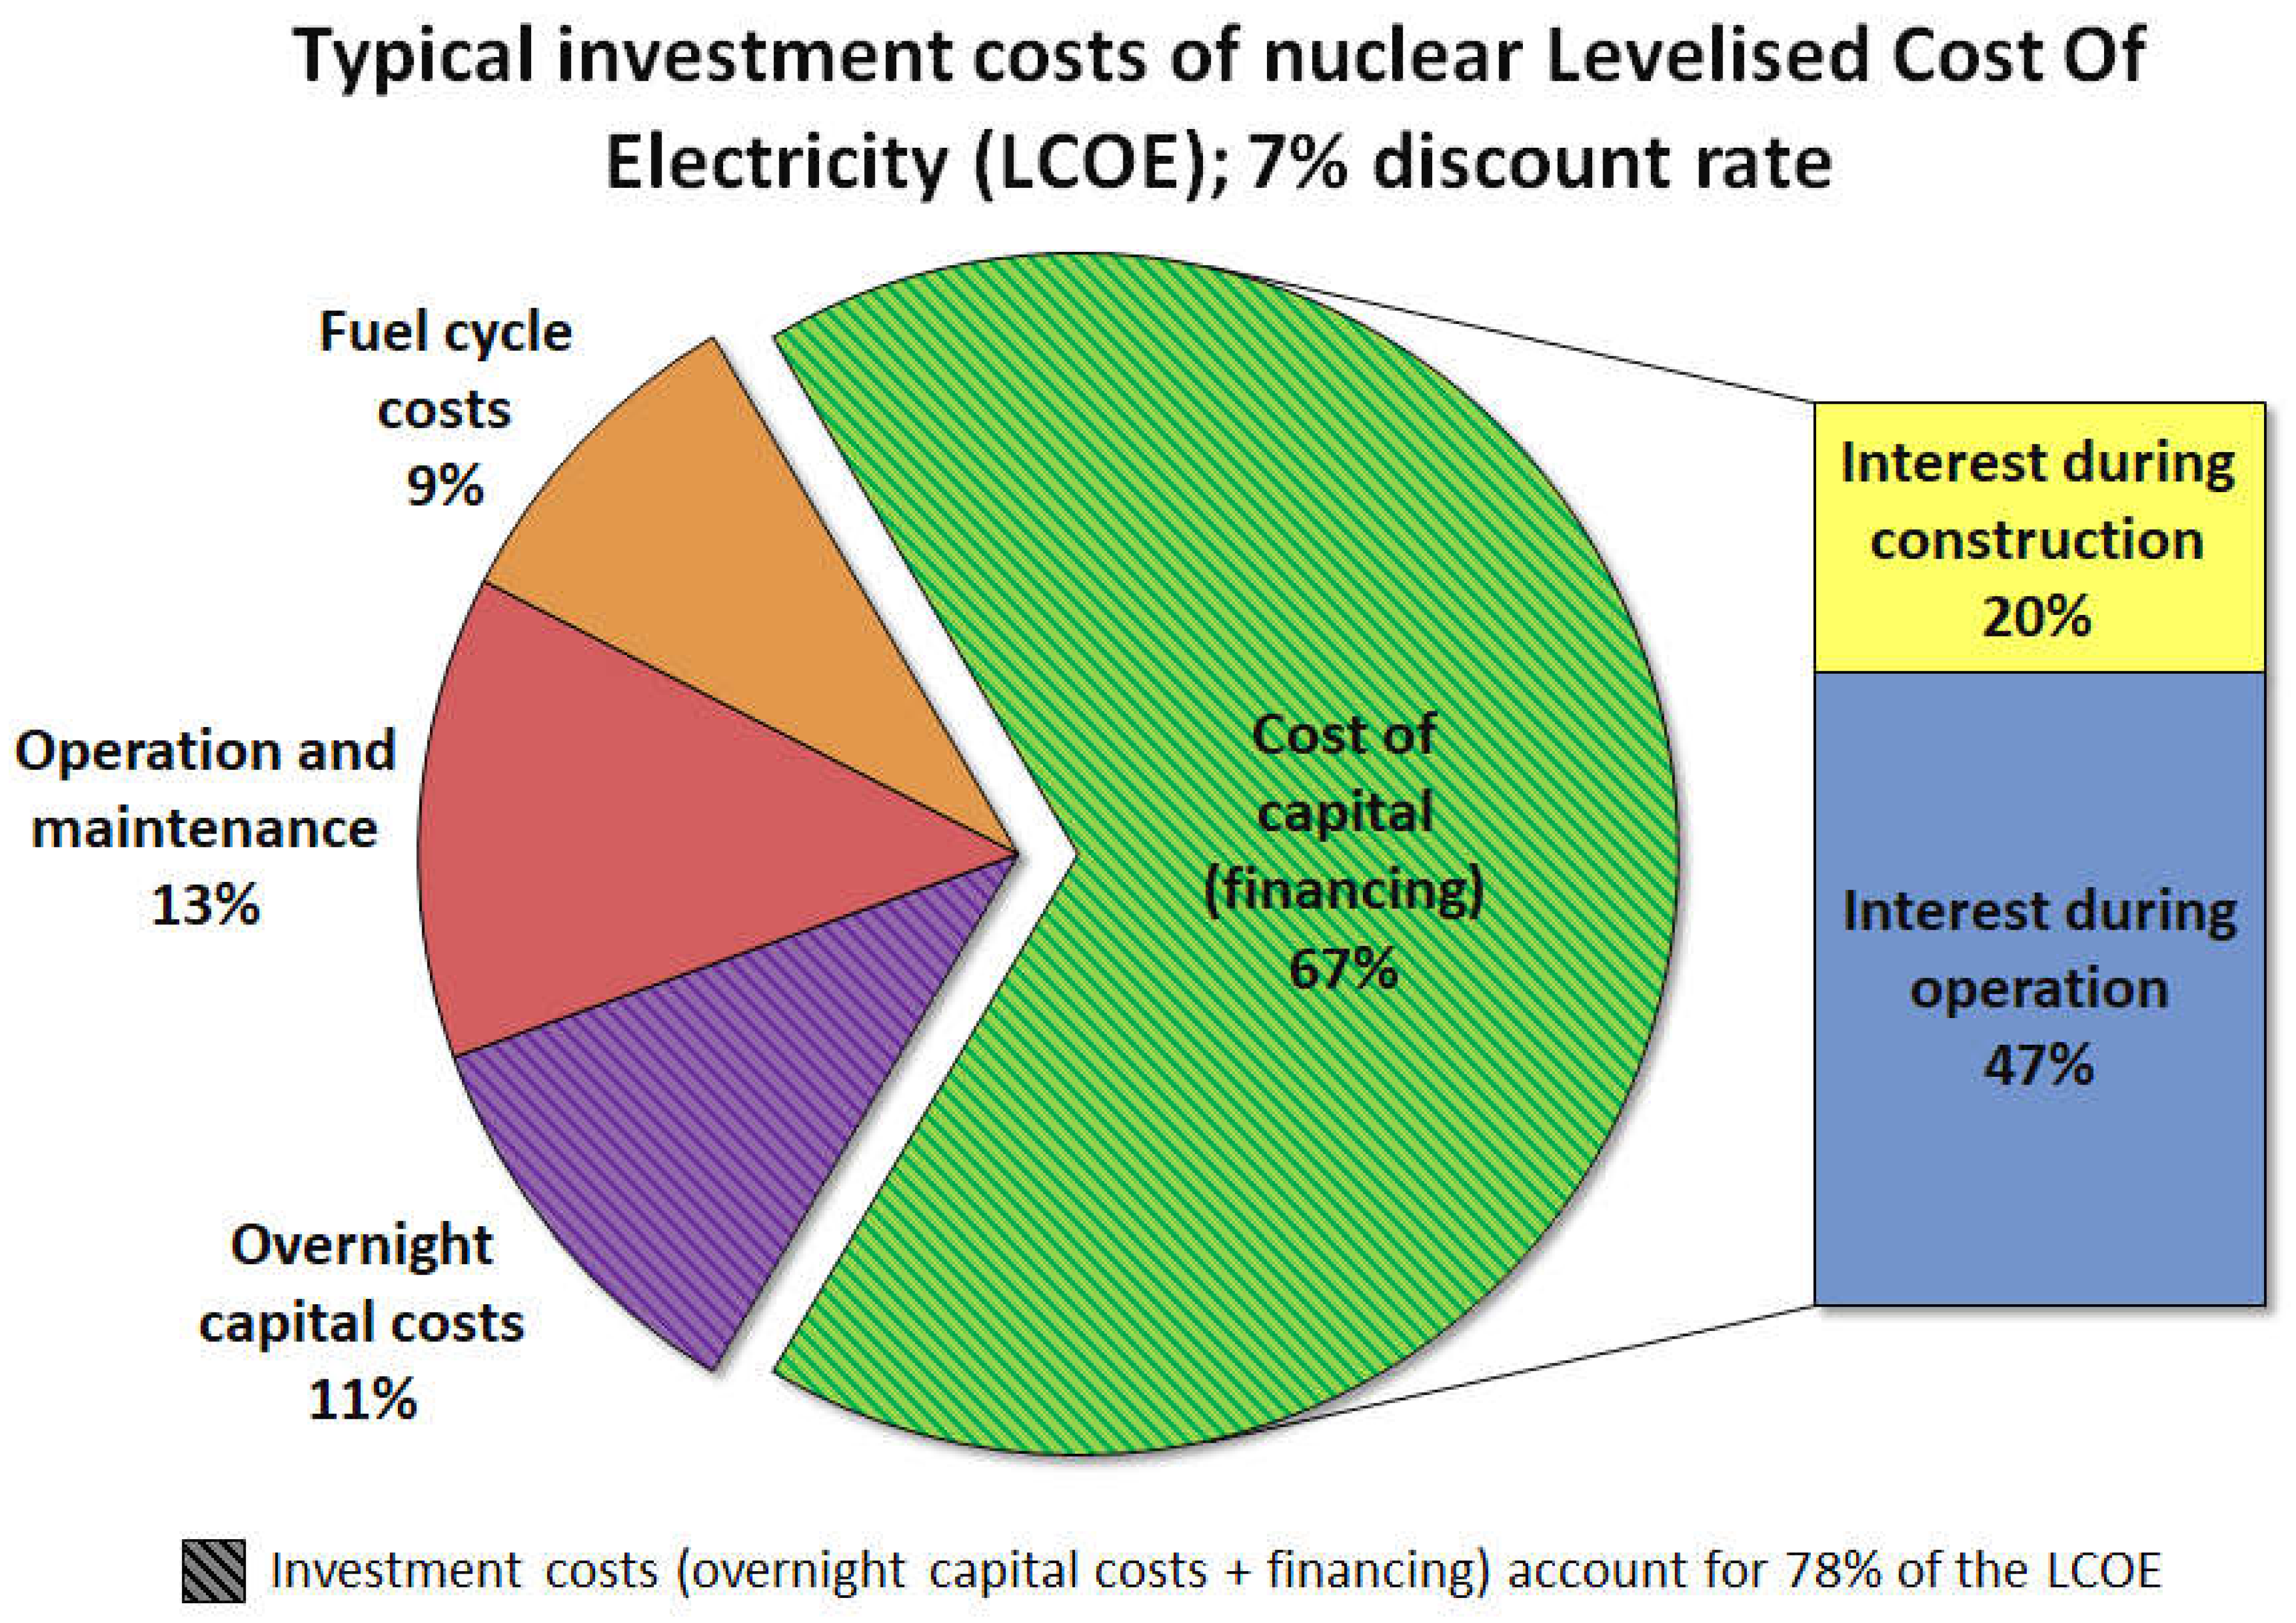
All energy generators produce waste in various forms, but the nuclear industry has a far greater responsibility than other producers for containing its waste and disposing of it safely in specialised facilities and in near perpetuity. Over and above the usual disruption issues associated with large infrastructure projects, there are further concerns around nuclear waste due to its radioactivity and the longevity of the radiological hazards. Various effective solutions exist for dealing with nuclear waste, and it may be that the greatest challenge regarding waste is navigating the decision-making process [109,110].
Nuclear waste and how it is handled forms the “back end” of the nuclear fuel cycle [22]. There is a basic choice at the back end of the fuel cycle between direct disposal of SNF (the once-through or open fuel cycle) and some degree of reusing materials from SNF in closed fuel cycles [28]. From an environmental perspective, recycling and reusing materials offers clear benefits in reducing both wastes for disposal and the use of natural resources [22]. However, to recycle materials from SNF requires some degree of separation (nuclear fuel reprocessing [52]), and this increases the technological complexity and political concerns over security and proliferation risks from separated nuclear materials (primarily plutonium).
However, policy in the UK and many other countries, at present, favours the once-through cycle. This is based on a period of interim storage followed by packaging the spent fuel into canisters for geological disposal. Geological disposal of spent fuel has not yet been implemented anywhere in the world, although Finland and Sweden will have operating GDFs in the 2030s with respective capacities of 5500 and 12,000 tHM. Disposal of SNF in the UK is unlikely to start until towards the end of this century, and the UK already has ~7500 tHM of SNF from its legacy fuels, existing AGR and Sizewell B nuclear power plants (note that, unlike Finland and Sweden, the UK has reprocessed around 65,000 tonnes of SNF from past nuclear power generation; otherwise, this figure would be much larger), plus another ~3600 t SNF from lifetime operations of Hinkley Point C before any additional nuclear new build is considered.
In summary, safe, robust technological solutions exist for the management of radioactive wastes and, specifically, the highly radioactive SNF. The simplest solution is direct disposal (the once-through cycle), and the first geological disposal facilities that will prove it can be done for SNF will be operating in the 2030s. The biggest issue in developing a GDF in the UK is probably the public acceptability and is being progressed through a consent-based engagement process [110,111]. A future publication will review the choice between open and closed cycles from the perspective of sustainability, but, given that the technology exists for both options, the management of radioactive wastes should not be a barrier to nuclear energy, even with the open cycle being considered sustainable.

4.3. Economics

Reiterating the earlier remarks that achieving sustainability requires addressing the combination of environmental, economic, and societal impacts, arguably the biggest challenge facing new nuclear in the West is that of economics. The UK’s 2008 White Paper raised the potential of the first new nuclear plants in the UK since the mid-1990s but made it clear that new nuclear investment would not come from the government but only from the private sector ([112], p. 10). As of March 2023, only one nuclear development has started construction in the UK (Hinkley Point C), with other projects at Moorside and Wylfa failing due to financing issues. Subsequently, in 2023, the UK government became a majority shareholder in the second large-scale reactor project at Sizewell C to help address this issue [113].
The cost of nuclear energy is a paradox. Nuclear has small marginal costs, which makes nuclear power plants competitive on price over the length of their operation (Figure 3.4 in [114]), but this is only possible once the large capital costs are expended over a lengthy build period during which no return on investment can be realised. During this construction period, the project financing costs grow to such a large extent that they come to make up two-thirds of the total cost per unit of electricity (see Figure 14).
Previously, CFDs of GBP 37–46 for new wind power were mentioned (Section 3.3.2), which have proved a successful method of financing because of the short and inexpensive construction period. The CFD strike price for Hinkley Point C was set at GBP 89.50 (2012 prices, assuming delivery of Sizewell C) for 35 years following completion in exchange for the operator EDF shouldering the risks of project delivery and funding eventual decommissioning. While at the time this was competitive relative to new wind projects, the wholesale price of electricity was under GBP 50/MWh. Despite the large difference between the wholesale price and the strike price, sufficient private investment was not forthcoming, and state-backed investment from the French and Chinese governments was needed [116].
The CFD method has been demonstrated as not suitable for financing large nuclear plants, and alternative methods of financing must be found if nuclear is to have any future in the UK [117]. The alternative financing method being pursued in the UK is the Regulated Asset Base (RAB), which aims to make the process cheaper by levying charges on consumers while a plant is under construction [108].
The previous UK government stated an intent to explore a further large-scale reactor project by 2025 (i.e., within the present parliament) subject to a final investment decision on Sizewell C. The aim is to secure investment for delivery of 3–7 GW every five years from 2030 to 2044 to reach up to 24 GW of nuclear power by 2050 [3].
If the RAB is successful in bringing down costs, its benefit could be supplemented by the successful development of Small Modular Reactors (SMRs). Equally, other means of reducing the impacts of financing on the overall costs of new reactors can be sought.
SMRs are scaled-down versions of large reactors such as those being built at Hinkley Point C. (In the UK, SMR is used to describe smaller scale, factory built, oxide-fuelled Light Water Reactors (LWRs), and Advanced Modular Reactors (AMRs) are considered to be smaller scale, factory-built reactors that are not LWRs, e.g., High-Temperature Gas-cooled Reactors (HTGRs) or fast reactors. This convention is adopted in this paper, but elsewhere, SMR is often used to cover both types of modular reactor.) By reducing the physical size of the reactor and associated components, plants can be manufactured in factories and delivered to their site as modules for assembly. Factory build leads to cost savings, and the modular assembly on site reduces the construction time, removing a large contributing factor to the high financing costs [118]. With SMRs, the economic case is essentially based on the cost savings from producing many units of factory-manufactured small reactors outweighing the economy of scale which comes from increasing the size of commercial reactors. No modern SMRs have been deployed commercially to date, so these claims remain to be proven. However, companies are planning their deployment in the UK, such as recent announcements by Westinghouse and Community Nuclear Power to build four AP300 SMRs in Teesside, UK [119].
A further potential benefit of SMRs if they successfully reach the market is the potential for export. As well as delivering economic benefit to the vendor, SMRs produced on a large scale would enable developing countries to purchase and deploy nuclear technology to support their economic growth and decarbonisation without the intermediate step of developing the full nuclear fuel cycle and range of capabilities needed to deploy large-scale nuclear. Additionally, different types of SMRs can be used in other applications (e.g., heat generation, see below) or remote locations.

4.4. The Role Within the Electricity Grid

Figure 15 shows the per capita electricity generation by source for the 10 nations with the most electricity generation worldwide and the UK. The extent of wind, solar, and biomass generation varies considerably between these nations, but all have the characteristic of relying on firm sources for most of their electricity generation: hydroelectricity, fossil fuels, nuclear, or a mix of the three. Most countries have little to no scope to expand hydroelectric generation, and if ambitions to reduce carbon emissions are genuine, nuclear seems the only firm option available. It is estimated that almost 60 Gt of CO2 emissions have been avoided due to the use of nuclear power since 1971 ([45], p. 8); clearly, this could have been much greater if new nuclear deployments had not stalled since the 1990s.
Figure 16 shows two other charts which together are instructive as to the role of nuclear energy in reducing emissions. Data for ten nations from the top 25 electricity producers are plotted, including the UK, the top five electricity producers, and the two nations with the highest and two with the lowest carbon intensity electricity. The first thing which is apparent is the near inverse order of the nations in the two charts. France and Sweden have the lowest carbon intensity and the most nuclear generation per person, both by a considerable margin. The four nations with the least nuclear generation per person (Poland, India, South Africa, and China) have the highest carbon intensity. The UK, with its increasing reliance on electricity from wind since the 2010s, is lower than most in terms of electricity carbon intensity but still a long way from reaching the low levels of nuclear-heavy Sweden and France. Of the others who fill the middle of the rankings for both metrics, Japan is of particular interest. Japan suspended operation of its nuclear plants following the incident at Fukushima following the Tōhoku earthquake and tsunami and has been slow to restart [120]. The decline in nuclear generation is matched by an associated increase in electricity emissions per kWh.
Figure 15. Per capita electricity generation by source for the world’s ten largest electricity-generating nations (China highest to France 10th) and the UK (14th) in 2022. Data from Ember’s Yearly Electricity Data, Ember’s European Electricity Review, Energy Institute Statistical Review of World Energy; available from [121].
Sustainability 16 10952 g015
Figure 16. Plots showing data for the five countries with the largest electricity generation, the UK, and the two highest and two lowest carbon intensity producers from the top 25 electricity generators. Poland is omitted from the bottom chart as it has had no nuclear generation over the period. Data from Ember’s Yearly Electricity Data, Ember’s European Electricity Review, Energy Institute Statistical Review of World Energy; available from [122,123].
Sustainability 16 10952 g016

4.5. Beyond Electricity

Figure 10 demonstrated that electricity generation is responsible for only one-fifth of the energy consumption for the UK. Decarbonisation progress has largely taken place in this fifth as coal generation has reduced and renewable generation has increased. Energy use in non-electricity-generating sectors will prove more difficult to decarbonise. These sectors include, but are not limited to, powering vehicles, commercial and residential heating, and providing heat for industry. This paper cannot address these huge issues in detail. However, this section briefly considers vehicles as an example of the issues we face in decarbonising these sectors before discussing the production of hydrogen as an alternative to fossil fuels. This leads to the potential role for future nuclear systems in assisting with decarbonisation of these sectors.

4.5.1. Vehicles

Until recently, vehicle fleets worldwide have been powered almost exclusively using fossil fuels. This has changed of late as electric-powered vehicles have become more advanced, with electric vehicle ownership increasing in developed countries, but despite this, they still make up a minority of total vehicles compared with those powered by Internal Combustion Engines (ICEs) fuelled by oil derivatives. Electric vehicle use will continue to rise, and innovation in the sector will undoubtedly continue at pace. A benefit of an electric vehicle fleet is that, while increasing electricity demand overall, widespread electric car ownership would also have the effect of flattening the electricity demand curve as users charge vehicles overnight, typically the time of least demand. Despite the benefits, it should be acknowledged that challenges for large-scale electric vehicle adoption lie ahead, not least including upgrading the electricity grid to handle the increased electricity load and increased demands on critical materials needed for use within batteries. Furthermore, powering heavy goods vehicles, aviation, and shipping are additional needs that require solutions. Briefly, some of the sustainability challenges around electric vehicles include:
  • Upgrading the electricity grid to handle the increased electricity load.
  • Increased demands on critical materials needed for use within batteries may make large-scale uptake worldwide difficult and expensive (see Section 3.3.4).
  • Social impacts on the users, such as slow charging times compared to the time necessary to refuel an ICE.
  • Delivery of charging infrastructure which is suitable for electric vehicle usage nationally. Many households are poorly placed to accommodate charging infrastructure for an electric vehicle.
  • Current lack of suitability for powering heavy goods vehicles, aviation, and shipping.
  • High taxation rates on ICE vehicles, particularly their fuel, make them artificially more expensive to run. As these vehicles are displaced, the erosion of the tax base which results will likely require that the tax will be collected by other means.
Whilst the transition away from the fossil-fuelled ICE is needed, large-scale reduction in car ownership is unlikely to be a viable (or popular) strategy for a sustainable future. Therefore, greater electricity provision through non-fossil fuel sources or the wide-scale deployment of an alternative fuel are likely required.
At present, the most serious alternative to electricity for powering vehicles is hydrogen. While Honda and Toyota developed government-certified commercial hydrogen fuel cell vehicles in 2002, the technology has not been successful on the market to date. However, the need to transition away from ICE vehicles to meet emissions targets may lead to an alternative market for hydrogen-fuelled vehicles developing.
The role of nuclear in generating low-carbon electricity for future electric vehicles is self-evident. What is less well understood is the considerable potential for nuclear in hydrogen generation. The following sub-sections address this opportunity.

4.5.2. Hydrogen

Hydrogen is already present in several parts of the economy, with most of the existing market contributing to oil refining and the production of ammonia and methanol. Of this hydrogen, almost all is produced from methane and releases CO2 during production. Both are GHGs, although the Global Warming Potential (GWP) for methane (over a 100-year timescale) is estimated as 28–36 times that of CO2 (the GWP is 84–87 times greater than CO2 over a 20-year timeframe) [124].
Hydrogen is often suggested as a potential solution to decarbonising parts of the economy which cannot be easily done with electrification, primarily long-distance haulage (as discussed above), and to replace fossil fuels in industries with high-temperature demands such as cement, steel, and glass manufacture. Success in developing hydrogen solutions for these sectors may lead to the technology being developed further for broader use in areas such as residential heating and personal vehicles.
Replacing direct fossil fuel use with hydrogen presents clear benefits, but there are also potential problems which must be solved before it can be widely relied upon as a secondary fuel within the future energy mix. These include:
  • Storage;
  • Delivery;
  • Safety;
  • Generation methods;
  • Efficiency.
Storage: Finding a suitable storage state for use in small-scale applications is difficult, with conventional storage options unsuitable because of its low energy density by volume (despite high energy density by mass). Storage under pressure or as a liquid are two potential solutions, both of which have difficulties in development and may prove impractical at smaller scales.
Delivery: Due to its small molecular size, hydrogen has a propensity to diffuse through materials and escape. Existing delivery networks designed for other fluids may need adaptation for the large-scale transfer of hydrogen [125]. If hydrogen were to be deployed at scale within the economy, leakages could reduce the benefits gained given hydrogen’s role as an indirect greenhouse gas. (Hydrogen is an indirect greenhouse gas due to its interactions with atmospheric hydroxyl radicals that extend the lifetime of methane and can increase the generation of ozone; both of which are GHGs. The GWP of hydrogen over a 100-year period (GWP100) was recently reported to be higher than previously thought at 11.6 ± 2.8 [126]).
Safety: Few gases have the explosion potential of hydrogen. This poses a potential challenge for application within domestic boilers or personal vehicles.
The three hurdles above may inhibit initial development of hydrogen solutions for domestic applications. However, they are less likely to prove prohibitive for industrial applications given that a not insignificant hydrogen market, and therefore the associated safety and logistics experience, already exists. The final two challenges from the list are those of most interest to energy providers and most relevant to the discussion about the future use of nuclear energy in hydrogen production and are addressed in more detail below.
Thus, whilst there are undoubtedly some challenges to be addressed in the delivery of a future hydrogen economy, the potential benefits it could bring to the decarbonisation of non-electric energy vectors are substantial. Technologies to produce hydrogen should, therefore, be developed.

4.5.3. Hydrogen Production and Nuclear Cogeneration

The different hydrogen generating methods are often denoted by different colours. For example, “grey” hydrogen derives from steam reformation of methane—if the CO2 released from this process is captured and stored, such hydrogen is dubbed “blue”. However, lifecycle emissions from this process, including methane losses to the environment, must be understood before it can be considered a low-carbon method of generating hydrogen. A range of alternative potential production methods exists, three of which are worth consideration here. The importance of considering the full lifecycle, including the supply chain footprint, of the various methods of hydrogen production must again be emphasised.
Simple electrolysis provides the most straightforward method of producing hydrogen, requiring electricity to split water into hydrogen and oxygen. The electricity needed for electrolysis can come from any source. However, without generating it from low-carbon sources such as renewables or nuclear energy, using hydrogen as a secondary fuel fails in the aim of a net reduction in emissions. With room-temperature electrolysis, questions arise around efficiency, as significant energy losses are encountered during the electrolysis, transportation, and utilisation steps. For example, when used in vehicles, reference [127] estimated 28% efficiency of electrolytically generated hydrogen versus 68% for electrically powered vehicles. Alternative methods of hydrogen generation promise greater efficiency but require access to high temperatures to be able to do so.
Beyond this, nuclear has a unique potential to facilitate hydrogen production when combined with methods currently in development due to the high temperatures involved in nuclear energy. Thermochemical cycles produce fuels (e.g., hydrogen) from heat and abundant inputs (e.g., water). The sulfur-iodine cycle is one such thermochemical process which has generated much interest for some time [128]. However, two large disadvantages have prevented development to higher TRL. Firstly, very high temperatures are required for the process (>850 °C), which makes heat from Pressurised Water Reactors (PWRs, by far the most common reactor in use today) unsuitable for the process. Secondly, the cycle makes use of several highly corrosive reagents that demand materials development in order to deliver the necessary apparatus. These, combined with the recent development of electric solutions to decarbonise end-users (e.g., domestic vehicles and heating) have reduced the drive to develop the process. Other thermochemical processes such as copper-chlorine have been reported to have greater efficacy than the sulfur-iodine process [129], largely due to lower temperature requirements.
The final generation method to consider is high-temperature steam electrolysis. Solid oxide electrolyser cells use a ceramic electrolyte at high temperatures to produce hydrogen from water. This could be achieved using LWRs [130,131], although high conversion efficiencies are optimised with higher temperatures (albeit below those required by the sulfur-iodine cycle) in excess of 750 °C (some developers claim to be developing lower temperature systems which operate efficiently in excess of 600 °C). These temperatures, while high, fall within the range of temperatures expected from high-temperature reactors.
If hydrogen is to become a necessary part of the future energy network, successful high-temperature electrolysis technology will be needed to achieve the efficiencies required to make hydrogen cheap enough to effectively displace fossil fuels without being prohibitively expensive to consumers. A target of under GBP 2/kg for hydrogen is believed to be achievable with high-temperature reactors and high-temperature electrolysis; which is around the same price for steam methane reformation with CCS with a natural gas price of GBP 20/MWh.
Nuclear cogeneration is the utilisation of heat from a thermal power station in addition to electricity, and the demand for heat opens the possibility for nuclear cogeneration to make a sizeable contribution to future energy needs. The low-grade heat remaining after electricity generation is usually wasted but has potential utility to be used in industrial processes or district heating. A separate, distinct opportunity for cogeneration arises with the advent of reactors which operate at higher temperatures than current water reactors (i.e., in excess of 700 °C versus ~300 °C). As mentioned in Section 4.5.2, many industrial processes rely on high temperatures, and these industries could make direct use of high-temperature heat to decarbonise their processes. Proper implementation of nuclear cogeneration, however, has the potential to address several energy challenges simultaneously.
As mentioned, high-grade heat has utility for hydrogen production and industrial application. Future high-temperature reactors can be scaled and dedicated to deliver heat according to specific heat requirements—this would not require said reactors to generate electricity. However, equipping future nuclear stations to deliver both electricity and heat (i.e., cogeneration) provides a very useful technique for more effective decarbonisation.
Cogeneration means that nuclear plants with the primary role of delivering heat for producing secondary fuels and industrial processes can divert their energy to produce electricity when electricity demand outstrips supply. This enables nuclear to become effectively flexible at delivering to the grid, as the technical and economic challenges which arise when reactors are operated at low levels do not manifest because the reactor is operating continuously. This removes one of the biggest flaws with nuclear power as currently operated (i.e., the lack of flexible operation).
Nuclear cogeneration also addresses the biggest challenge faced by variable renewable generation technologies (e.g., wind and solar), namely, intermittency. Intermittent renewables, if relied upon to deliver a large proportion of a nation’s electricity supply, require equally large amounts of standby dispatchable power to be available for periods of low renewable output. The standby capacity (typically natural gas stations) would have a very low-capacity factor as a result, which makes the power they generate expensive. A large capacity of nuclear cogeneration can provide the role of dispatchable support generation without idling when not being used for electricity generation. A recent investigation into nuclear cogeneration’s potential role in supporting a renewable-heavy grid is available in [132]. Obviously, there is some trade-off between generating electricity and hydrogen, even with high-temperature electrolysis options.
Realising this would require a considerable degree of coordination. In common with other nuclear countries, the UK government has acknowledged the potential importance of high-temperature nuclear to hydrogen production, and the AMR Research, Development and Demonstration (RD&D) programme is dedicated to delivering hydrogen generation potential and a high-temperature reactor demonstrator to support it [3].
Hydrogen is mentioned in several government reports from recent years. The 2020 Ten Point Plan laid out commitments to GBP 170 M for RD&D into AMRs operating at high temperatures for the production of hydrogen and synthetic fuels, with an aim to build a demonstrator by the early 2030s ([133], p. 12). The Energy White Paper from the same year mentions nuclear’s potential role in electrolytic hydrogen production, but with no mention of high-temperature nuclear being advantageous ([134], p. 128):
“A variety of production technologies will be required to satisfy the level of anticipated demand for clean hydrogen in 2050. This is likely to include methane reformation with CCUS, biomass gasification with CCUS and electrolytic hydrogen using renewable or nuclear generated electricity.”
A similar sentiment (i.e., that nuclear has a future role in hydrogen generation, but without mentioning high-temperature nuclear specifically) is expressed in the Net Zero Strategy from 2021 ([135], p. 115). The British Energy Security Strategy discusses hydrogen colours, describing “pink hydrogen” as being derived from “electrolysis, but using energy from a nuclear power plant” ([136], p. 22); it is unclear if this is low- or high-temperature nuclear.
The AMR RD&D programme outline, however, is explicit in its aim ([137], p. 5):
“The aim of the Programme is to demonstrate that HTGRs can produce high temperature heat which could be used for low-carbon hydrogen production, process heat for industrial and domestic use and cost-competitive electricity generation, in time for any potential commercial AMRs to support Net Zero by 2050.”
However, the new Nuclear Roadmap [3] explicitly notes the potential for HTGRs to provide capabilities beyond power provision, including high-grade steam/heat and hydrogen production. It states the aim to develop options for an AMR demonstrator in the 2030s.
The UK government has, therefore, been making substantial efforts to address the matter; however, inconsistencies between reports as to how nuclear energy will deliver hydrogen remain. There is clearly significant time pressure on the AMR RD&D programme if it is to deliver an HTGR demonstrator in the 2030s. It is thus crucial that the programme remains focused on HTGR technology if this tight deadline is to be met.
The role of energy independence and security for the UK was placed at the forefront of government policy with the publication of the British Energy Security Strategy in 2022 [136]. Whilst the risks of relying on imports of fossil fuels have been known for many years, they have been brought into sharper political focus by the war in Ukraine as well as increased demand globally as economies recover post-COVID pandemic. A range of measures were outlined, including “investing massively in nuclear power”, specifically, to make a final investment decision on the development of a second gigawatt-scale reactor and support for SMRs against an overall ambition to deliver “up to 24 GW” by 2050 ([136], p. 21). However, on AMRs, there was little detail despite the known interest in development of the HTGR for heat and hydrogen production (so-called “pink” hydrogen derived from nuclear energy). An ambition to generate 10 GW from hydrogen by 2030, with at least half coming from electrolysis, was stated.
Thus, whilst the geopolitical risks to energy supplies have been known for over 20 years, it has now become clearer how quickly these can arise, and the potential economic and societal impacts have become apparent. However, building the energy infrastructure that gives nations resilience to such events takes much longer. In this respect, the goals of energy security and independence are complementary to those of addressing climate change—by reducing our reliance on fossil fuels and increasing low-carbon domestic energy supplies (renewables and nuclear).

4.6. Nuclear Systems
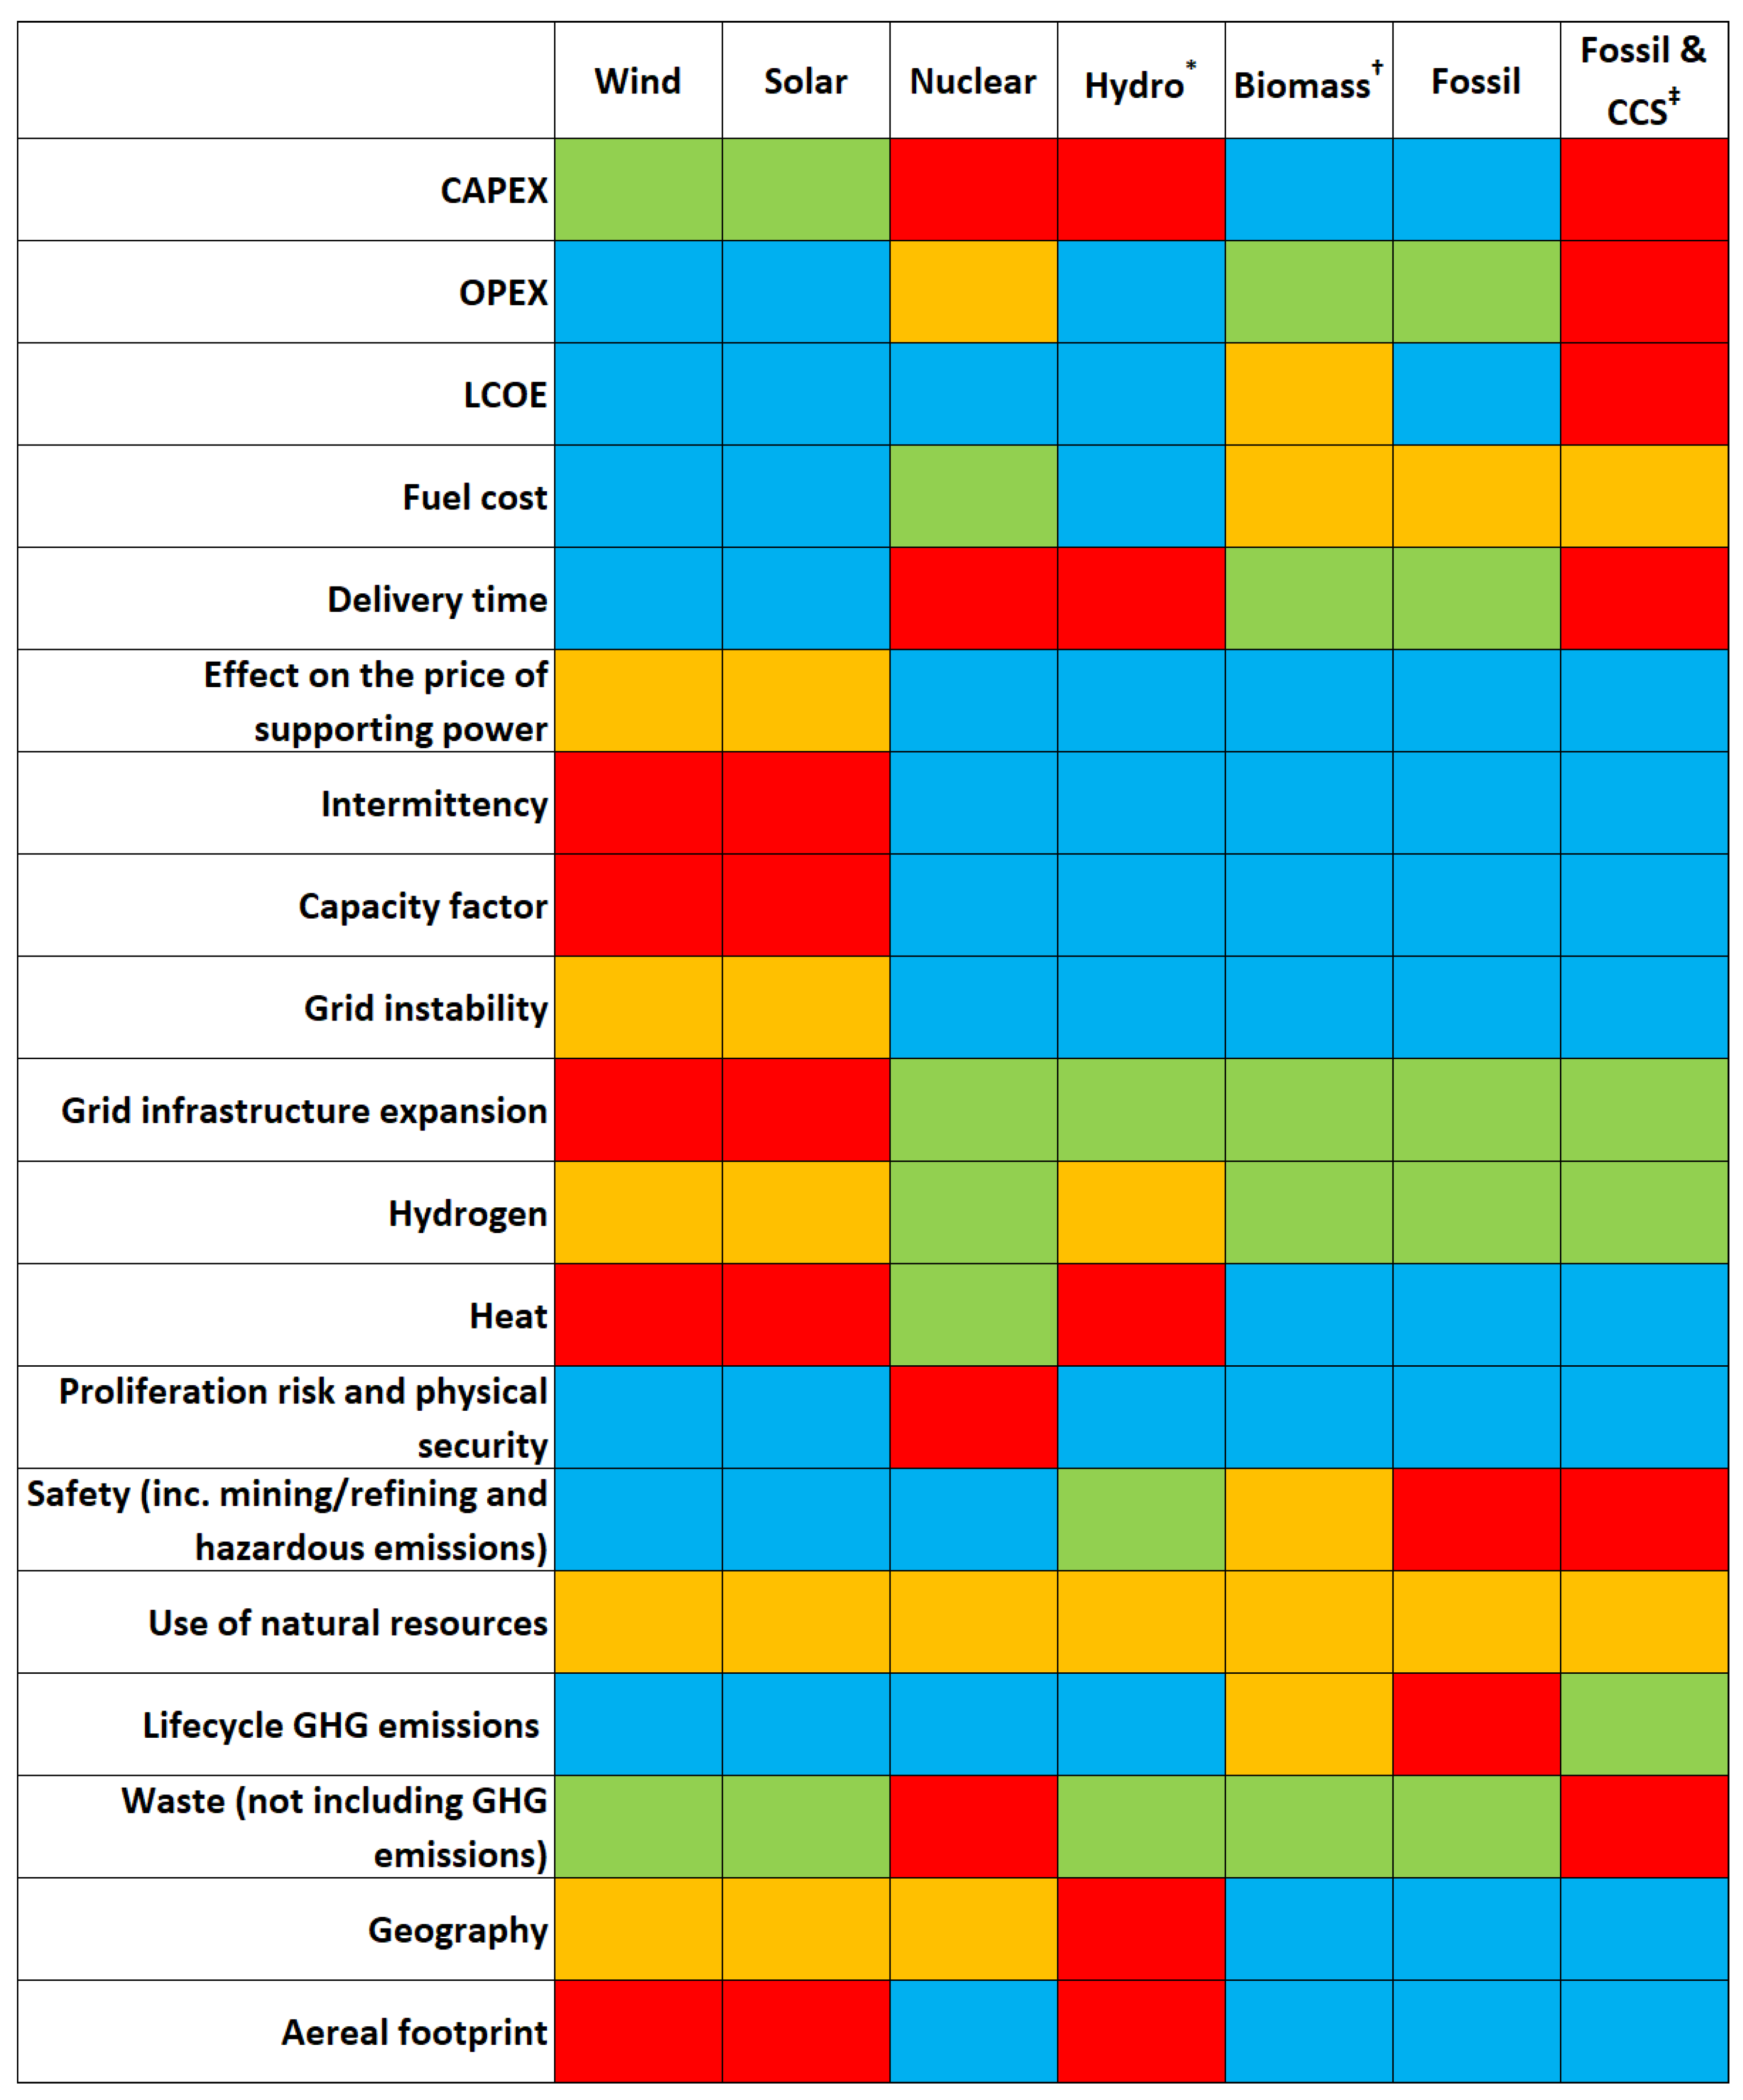
Section 4 has discussed the role nuclear energy can play in decarbonising our energy system as well as the benefits and challenges that are associated with the deployment of nuclear to meet net zero goals (see Section 6, Points 6 and 7). However, it is important to understand that nuclear energy is not a single technology. Many proponents and opponents of nuclear energy are guilty of claiming the benefits or detriments of specific technologies apply to all nuclear energy systems. This can be avoided by better understanding of the different options, enabling a more rational evaluation of the use of nuclear to be made. For instance, there are various types of nuclear reactors that differ in scale, generating capacity, applications, outlet temperatures, fuels, and other factors. The type of fuel used and the management of the irradiated fuel after it has been used in the reactor (i.e., the nuclear fuel cycle) are also important to the successful deployment of nuclear energy, and again, there are various options which have their own advantages and disadvantages. This includes, for example, the degree of enrichment needed, the behaviour of the fuel in severe accident scenarios, and the amount of highly radioactive wastes that need geological disposal. The complexity of the nuclear fuel cycle and its importance to the sustainability arguments around nuclear is such that it warrants a dedicated analysis which is beyond the scope of this paper. It is our intention to report a similar review focused on the nuclear fuel cycle in the near future.

5. Perspective

The drive to decarbonise global energy generation to reduce GHG emissions will only be successful if the other two pillars of sustainability—social and economic impacts—are balanced with the environmental drivers. It is clear, however, that all energy-generation technologies have benefits and drawbacks when assessed under the framework of sustainability as defined by the United Nations and used in our analysis. Therefore, when comparing energy-generation technologies to understand what is sustainable, it is critical to objectively assess the options based on a “level playing field” underpinned by scientific evidence. This is, of course, a simplification given the dynamic nature of changing energy scenarios and demands which can be subject to a wide variety of influences. Nevertheless, it is necessary to attempt such an analysis in order to guide policy decisions. Much further work, using tools such as LCA, is needed to fully explore the issues, but this critical review has set out some of the key issues to consider.
The specific focus of the review was to discuss whether nuclear energy should be considered sustainable and could play a valuable role in a low-carbon future. This is a question of considerable importance presently, as it can guide investment decisions and political or social acceptance of nuclear energy [26,27,29]. The global background has been presented showing the scale of the problem and the role for nuclear; this has been described in greater detail in the context of the United Kingdom, where a new nuclear build is being pursued again after a 30-year hiatus. With regards to nuclear energy, the low-carbon credentials are clear, but there are other challenges, primarily related to safety (and security), radioactive wastes, and economics, that must be addressed. The evidence is that these challenges are in some cases based on perception (e.g., safety) and/or can be overcome by technical or engineering solutions (e.g., waste management) or innovation (e.g., economics). However, nuclear energy has real benefits in terms of the role it can play within the electricity grid, secondary fuel (e.g., hydrogen) production, and industrial heat provision. Based on the results of this critical review, and to illustrate potential approaches towards assessments based on a level playing field, we have generated an initial qualitative overview, which is shown in Figure 17 as a guide to the main issues. Generic Feasibility Assessment (GFA) is a tool to compare the relative strengths and weaknesses of different nuclear systems and is discussed in detail in [138]. Our experience with GFA has informed the level playing field analysis in Figure 17. The ideal endpoint for GFA would be to expand its applicability to also cover other energy technologies to better underpin the preliminary analysis made in producing Figure 17, but this was beyond the scope of the present study. Whilst this is a rather crude assessment and requires further analysis to refine the judgements, it does enable a few basic conclusions to be proposed:
  • All energy technologies have positive and negative aspects.
  • The attractiveness of renewable energies is clear, as they perform well on low-carbon credentials and cost.
  • Nuclear energy performs well on criteria where renewables do not and hence is a valuable and complementary low-carbon energy technology.
  • Nuclear energy has challenges with cost, waste, and security (including nuclear proliferation) that need to be addressed to enable it to fill a role alongside renewables in future energy systems.
Consequently, it is concluded that nuclear energy should be considered sustainable and can play an important role alongside renewables in delivering low-carbon, secure, safe, and affordable energy systems. The mix of energy technologies in any particular country will depend on a wide range of factors and will obviously differ. It was not the purpose of this review to recommend any specific mix of energy technologies—that requires detailed research. However, it is our general opinion that to achieve decarbonisation, a mix of low-carbon energy generation technologies is needed with a high element of renewables (wind, solar, and hydro) supported by a significant contribution from nuclear energy for electricity generation. The percentage of nuclear in the total energy mix could be substantially higher if SMRs and AMRs are introduced commercially to meet new applications, including cogeneration, hydrogen production, or other emerging needs.
Internationally, many valuable studies address individual aspects of the sustainability of nuclear energy; a few examples are wastes and environmental impacts [2,22,23,47,96,140,141,142], energy mix [48,132,143,144,145], economics [118,146,147,148,149], proliferation and security concerns [140,150,151,152], scenario analysis [40,138,153,154], country-specific fuel cycle strategies [155,156,157,158], social acceptance [106,159], etc. However, to our knowledge, a broad-based review of nuclear sustainability (covering environmental, social, and economic impacts) based on the level playing field approach has not been presented before in the peer-reviewed literature. (The report by the JRC on whether nuclear did “no significant harm” to support its inclusion in the EU Taxonomy [29] is relevant as one of the very few studies to consider the question of nuclear sustainability overall.) We have concentrated on the present UK context but suggest this approach, which is based on accumulating and objectively assessing scientific evidence, is broadly applicable to the UK and international scenarios.

6. Conclusions

This paper has reviewed questions around the sustainability of nuclear energy in future energy systems. Starting with a definition of sustainability based on the three pillars of environmental, economic, and social impacts to frame the discussion and consideration of the United Nations Sustainable Development Goals, it is clear that energy is vital to global development, and ensuring it is low-carbon, clean, secure, and affordable requires considerable effort. It is also clear that the transition from fossil fuels to low-carbon energy is a huge global challenge that will require every tool available to reduce carbon emissions. The challenge is even greater when considering decarbonisation of energy more broadly rather than just electricity. This review has focused more closely on the UK situation, which has legally binding targets to reach net zero carbon emissions by 2050.
It is clear from the LCA that nuclear energy is a low-carbon energy source with environmental impacts similar to those of renewable energies. It is also clear that nuclear energy can provide secure, dispatchable electricity to balance out the intermittency challenges of a grid with a high component of renewable energy. Nuclear energy has generally been focused towards electricity generation but, particularly with new reactor types, co-generation of heat and electricity is a real opportunity. All energy technologies have advantages and disadvantages, and these need to be assessed on a “level playing field” basis underpinned by scientific evidence. The challenges with nuclear energy are well known and relate to economics, waste management, and safety, but overall, the evidence presented in this review supports the conclusion that nuclear energy is sustainable and has a valuable role to play in future low-carbon energy systems.
Key conclusions, summarising our findings, based on the information reviewed in the paper are proposed below:
  • An assessment of sustainability should comprise social, economic, and environmental impacts and, when used in decision making, sustainability analyses should be based on scientific evidence.
  • “Affordable and clean energy” is one of the UN’s most relevant Sustainable Development Goals. However, the metrics used should be defined such that they measure real progress towards their respective sustainability goals.
  • For progress to be made towards the “Climate Action” Sustainable Development Goal, all effective tools for global decarbonisation should be deployed with no further delay. Nuclear energy is one such effective tool.
  • Different energy sources have different advantages and drawbacks that must be evaluated to understand their sustainability. A portfolio of complementary energy sources will be needed.
  • Energy technologies should be assessed based on a “level playing field” when developing an energy strategy.
  • Evidence shows that nuclear energy is sustainable and should, therefore, be recognised as such. The analysis shows that energy portfolios incorporating nuclear provide the most sustainable overall system.
  • High-temperature applications of nuclear energy for reaching hard-to-decarbonise areas of society should be better understood, developed, and, where useful, deployed. High-Temperature Gas-cooled Reactor development and demonstration should, therefore, be a near-term priority action for governments.
Lastly, it is noted that the nuclear reactors which generate energy rely on a surrounding infrastructure, i.e., the nuclear fuel cycle. As shown herein, nuclear energy is sustainable even assuming the simplest fuel cycle (i.e., once-through use of the fuel). However, there are alternative fuel cycle options which can increase the sustainability of the overall system by recovering and reusing materials. These options were beyond the scope of the current work but will be discussed in a future publication (noting that environmental and economic impacts of once-through and closed fuel cycles have been previously reviewed in references [22,146]).

Author Contributions

Conceptualization, R.T., W.B. and A.B.; methodology, R.T. and W.B.; formal analysis, R.T., W.B., A.B. and G.B.; investigation, R.T. and W.B.; data curation, R.T. and W.B.; writing—original draft preparation, R.T. and W.B.; writing—review and editing, R.T., W.B., A.B., G.B. and F.L.; visualization, R.T. and W.B.; supervision, R.T. and G.B.; project administration, R.T.; funding acquisition, R.T. All authors have read and agreed to the published version of the manuscript.

Funding

This research was funded by NNL’s Corporate Science and Technology Strategic Research programme.

Acknowledgments

The authors acknowledge D. Kochanski for helpful discussion on hydrogen and electric vehicles and the contributions of P. Nevitt and L. O’Brien (NNL) in reviewing and checking the report this work was based upon and their contributions to discussions in the preparation of this paper.

Conflicts of Interest

The funders had no role in the design of the study; in the collection, analyses, or interpretation of data; in the writing of the manuscript; or in the decision to publish the results.

References

  1. Pörtner, H.-O.; Roberts, D.; Tignor, M.; Poloczanska, E.; Mintenbeck, K.; Alegría, A.; Craig, M.; Langsdorf, S.; Löschke, S.; Möller, V.; et al. Climate Change 2022: Impacts, Adaptation, and Vulnerability; Working Group II Contribution to the Sixth Assessment Report of the Intergovernmental Panel on Climate Change; Cambridge University Press: Cambridge, UK, 2022. [Google Scholar] [CrossRef]
  2. Gibon, T.; Menacho, Á.H.; Guiton, M. Carbon Neutrality in the UNECE Region: Integrated Life-Cycle Assessment of Electricity Sources. 2022. Available online: https://unece.org/sites/default/files/2022-04/LCA_3_FINALMarch2022.pdf (accessed on 8 December 2024).
  3. Civil Nuclear: Roadmap to 2050. 2024. Available online: https://assets.publishing.service.gov.uk/media/65aa96bc82fee9000d6f5f91/6.8610_DESNZ_Civil_Nuclear_Roadmap_report.pdf (accessed on 8 December 2024).
  4. Brundtland Commission. Our Common Future; Brundtland Commission: Abingdon, UK, 1987. [Google Scholar]
  5. Johnston, P.; Everard, M.; Santillo, D.; Robèrt, K. Reclaiming the Definition of Sustainability. Environ. Sci. Pollut. Res. 2007, 14, 60–66. [Google Scholar] [CrossRef]
  6. Purvis, B.; Mao, Y.; Robinson, D. Three pillars of sustainability: In search of conceptual origins. Sustain. Sci. 2019, 14, 681–695. [Google Scholar] [CrossRef]
  7. The Millennium Development Goals Report. 2015. Available online: https://www.un.org/millenniumgoals/2015_MDG_Report/pdf/MDG%202015%20rev%20(July%201).pdf (accessed on 8 December 2024).
  8. Work of the Statistical Commission Pertaining to the 2030 Agenda for Sustainable Development. 2017. Available online: https://ggim.un.org/documents/a_res_71_313.pdf (accessed on 8 December 2024).
  9. Tier Classification for Global SDG Indicators. 2022. Available online: https://unstats.un.org/sdgs/files/Tier%20Classification%20of%20SDG%20Indicators_30%20Nov%202022_web.pdf (accessed on 8 December 2024).
  10. The 169 Commandments. Economist. 26 March 2015. 8931. Available online: https://www.economist.com/leaders/2015/03/26/the-169-commandments (accessed on 8 December 2024).
  11. Lomborg, B. (Ed.) Prioritizing Development: A Cost Benefit Analysis of the United Nations’ Sustainable Development Goals; Cambridge University Press: Cambridge, UK, 2018. [Google Scholar]
  12. Sachs, J.D.; Lafortune, G.; Fuller, G.; Drumm, E. Sustainable Development Report 2023: Implementing the SDG Stimulus; Dublin University Press: Dublin, Ireland, 2023. [Google Scholar] [CrossRef]
  13. Gruber, M.; Andino, R. Sustainable Development Report Country Profiles; SDG Transformation Center: Paris, France, 2024; Available online: https://dashboards.sdgindex.org/profiles (accessed on 8 December 2024).
  14. Analysis: Record Opposition to Climate Action by UK’s Right-Leaning Newspapers in 2023. Carbon Brief. Available online: https://www.carbonbrief.org/analysis-record-opposition-to-climate-action-by-uks-right-leaning-newspapers-in-2023/ (accessed on 8 December 2024).
  15. Dunne, P. Correspondence: P. Dunne to R. Suank. 2023. Available online: https://committees.parliament.uk/publications/41599/documents/205404/default/ (accessed on 8 December 2024).
  16. Voluntary National Review of Progress Towards the Sustainable Development Goals. 2019. Available online: https://assets.publishing.service.gov.uk/government/uploads/system/uploads/attachment_data/file/818212/UKVNR-web-accessible1.pdf (accessed on 8 December 2024).
  17. Jukema, G.D.; Ramaekers, P.; Berkhout, P. De Nederlandse Agrarische Sector in Internationaal Verband; Wageningen University & Research: Wageningen, The Netherlands, 2001. [Google Scholar] [CrossRef]
  18. Alix, A.; Bellet, L.; Trommsdorff, C.; Audureau, I. Reducing the Greenhouse Gas Emissions of Water Reducing and Sanitation Services; IWA Publishing: London, UK, 2022. [Google Scholar] [CrossRef]
  19. World Nuclear Association. Nuclear Fuel Cycle: Supply of Uranium. Available online: https://world-nuclear.org/information-library/nuclear-fuel-cycle/uranium-resources/supply-of-uranium (accessed on 8 December 2024).
  20. Poinssot, C.; Boullis, B.; Bourg, S. Role of Recycling in Advanced Nuclear Fuel Cycles; Elsevier Ltd.: Amsterdam, The Netherlands, 2015. [Google Scholar]
  21. Eynde, G.V.D.; Pedoux, S.; Trtilek, R.; Fritz, L.; Evans, C.; Mathonnière, G.; Werf, J.V.; Lucibello, P.; Suzuki, K.; Sano, T.; et al. Strategies and Considerations for the Back End of the Fuel Cycle. 2021. Available online: https://www.oecd-nea.org/jcms/pl_55928/strategies-and-considerations-for-the-back-end-of-the-fuel-cycle (accessed on 8 December 2024).
  22. Taylor, R.; Bodel, W.; Stamford, L.; Butler, G. A Review of Environmental and Economic Implications of Closing the Nuclear Fuel Cycle—Part One: Wastes and Environmental Impacts. Energies 2022, 15, 1433. [Google Scholar] [CrossRef]
  23. Serp, J.; Poinssot, C.; Bourg, S. Assessment of the anticipated environmental footprint of future nuclear energy systems. Evidence of the beneficial effect of extensive recycling. Energies 2017, 10, 1445. [Google Scholar] [CrossRef]
  24. UK Data for the Sustainable Development Goals, UK Sustainability Development Goals. Available online: https://sdgdata.gov.uk/ (accessed on 8 December 2024).
  25. Climate Change Act 2008. 2008. Available online: https://www.legislation.gov.uk/ukpga/2008/27 (accessed on 8 December 2024).
  26. Taxonomy: Final Report of the Technical Expert Group on Sustainable Finance. 2020. Available online: https://ec.europa.eu/info/sites/default/files/business_economy_euro/banking_and_finance/documents/200309-sustainable-finance-teg-final-report-taxonomy_en.pdf (accessed on 8 December 2024).
  27. Taxonomy Report: Technical Annex. 2020. Available online: https://ec.europa.eu/info/sites/default/files/business_economy_euro/banking_and_finance/documents/200309-sustainable-finance-teg-final-report-taxonomy-annexes_en.pdf (accessed on 8 December 2024).
  28. Management of Spent Nuclear Fuel and Its Waste; Publications Office of the European Union: Luxembourg, 2014. [CrossRef]
  29. Technical Assessment of Nuclear Energy with Respect to the ‘Do NO Significant Harm’ Criteria of Regulation (EU) 2020/852 (‘Taxonomy Regulation’). 2021. Available online: https://ec.europa.eu/info/sites/default/files/business_economy_euro/banking_and_finance/documents/210329-jrc-report-nuclear-energy-assessment_en.pdf (accessed on 8 December 2024).
  30. UK Government. Mobilising Green Investment—2023 Green Finance Strategy; UK Government: London, UK, 2023.
  31. Our World in Data, Global Change Data Lab. Available online: https://ourworldindata.org/ (accessed on 8 December 2024).
  32. Energy Use per Capita vs. Share in Extreme Poverty, Our World in Data. Available online: https://ourworldindata.org/grapher/energy-use-per-capita-vs-share-of-population-in-extreme-poverty (accessed on 8 December 2024).
  33. Our World in Data. Energy Use per Person. Available online: https://ourworldindata.org/grapher/per-capita-energy-use (accessed on 8 December 2024).
  34. Our World in Data. Energy Consumption by Source. Available online: https://ourworldindata.org/grapher/energy-consumption-by-source-and-country?stackMode=absolute (accessed on 8 December 2024).
  35. China’s New Coal Power Spree Continues as More Provinces Jump on the Bandwagon Key Findings. 2023. Available online: https://energyandcleanair.org/wp/wp-content/uploads/2023/08/CREA_GEM_China-coal-power-briefing-2023H1_08.2023.pdf (accessed on 8 December 2024).
  36. Our World in Data. Annual CO2 Emissions. Available online: https://ourworldindata.org/grapher/annual-co2-emissions-per-country (accessed on 8 December 2024).
  37. IAEA (International Atomic Energy Agency). Reactors Under Construction by Country. 2023. Available online: https://pris.iaea.org/pris/worldstatistics/underconstructionreactorsbycountry.aspx (accessed on 8 December 2024).
  38. World Energy Outlook 2022. 2022. Available online: https://iea.blob.core.windows.net/assets/830fe099-5530-48f2-a7c1-11f35d510983/WorldEnergyOutlook2022.pdf (accessed on 8 December 2024).
  39. Global Warming of 1.5 °C. 2019. Available online: https://www.ipcc.ch/sr15/ (accessed on 8 December 2024).
  40. UNECE. Use of Nuclear Fuel Resources for Sustainable Development—Entry Pathways, 2021; pp. 1–155. Available online: https://unece.org/sites/default/files/2021-03/UNECEUseofnuclearfuelresourcesforsustainabledevelopment_Final_0.pdf (accessed on 8 December 2024).
  41. ISO 14040; Environmental Management—Life Cycle Assessment—Principles and Framework. International Organisation for Standardisation: Geneva, Switzerland, 2006.
  42. ISO 14044; Environmental Management—Life Cycle Assessment—Requirements and Guidelines. International Organisation for Standardisation: Geneva, Switzerland, 2006.
  43. Sovacool, B.K. Valuing the greenhouse gas emissions from nuclear power: A critical survey. Energy Policy 2008, 36, 2950–2963. [Google Scholar] [CrossRef]
  44. Lenzen, M. Life cycle energy and greenhouse gas emissions of nuclear energy: A review. Energy Convers. Manag. 2008, 49, 2178–2199. [Google Scholar] [CrossRef]
  45. Nuclear Energy: Combating Climate Change. 2015. Available online: https://www.oecd-nea.org/upload/docs/application/pdf/2019-12/7208-climate-change-2015.pdf (accessed on 8 December 2024).
  46. Warner, E.; Heath, G. Life Cycle Greenhouse Gas Emissions of Nuclear Electricity Generation. J. Ind. Ecol. 2012, 16, S73–S92. [Google Scholar] [CrossRef]
  47. Poinssot, C.; Bourg, S.; Ouvrier, N.; Combernoux, N.; Rostaing, C.; Vargas-Gonzalez, M.; Bruno, J. Assessment of the environmental footprint of nuclear energy systems. Comparison between closed and open fuel cycles. Energy 2014, 69, 199–211. [Google Scholar] [CrossRef]
  48. Stamford, L.; Azapagic, A. Life cycle sustainability assessment of electricity options for the UK. Int. J. Energy Res. 2012, 36, 1263–1290. [Google Scholar] [CrossRef]
  49. Schlömer, S.; Bruckner, T.; Fulton, L.; Hertwich, E.; McKinnon, A.; Perczyk, D.; Roy, J.; Schaeffer, R.; Sims, R.; Smith, P.; et al. Annex III: Technology-specific Cost and Performance Parameters. In Climate Change 2014: Mitigation of Climate Change; Contribution of Working Group III to the Fifth Assessment Report of the Intergovernmental Panel on Climate Change; Intergovernmental Panel on Climate Change: Geneva, Switzerland, 2014; pp. 1329–1356. [Google Scholar]
  50. Treyer, K.; Bauer, C. The environmental footprint of UAE’s electricity sector: Combining life cycle assessment and scenario modeling. Renew. Sustain. Energy Rev. 2016, 55, 1234–1247. [Google Scholar] [CrossRef]
  51. Collins, E.D.; DelCul, G.D.; Spencer, B.B.; Jubin, R.T.; Maher, C.; Kim, I.T.; Lee, H.; Federov, Y.S.; Saprykin, V.F.; Beznosyuk, V.I.; et al. State-of-the-Art Report on the Progress of Nuclear Fuel Cycle Chemistry. 2018. Available online: https://www.oecd-nea.org/jcms/pl_14970/state-of-the-art-report-on-the-progress-of-nuclear-fuel-cycle-chemistry?details=true (accessed on 8 December 2024).
  52. Taylor, R. (Ed.) Reprocessing and Recycling of Spent Nuclear Fuel; Woodhead Publishing Limited: Sawston, UK, 2015. [Google Scholar]
  53. Nash, K.; Lumetta, G. (Eds.) Advanced Separation Techniques for Nuclear Fuel Reprocessing and Radioactive Waste Treatment; Woodhead Publishing Limited: Sawston, UK, 2011. [Google Scholar]
  54. Updated Energy and Emissions Projections 2018. 2019. Available online: https://assets.publishing.service.gov.uk/government/uploads/system/uploads/attachment_data/file/794590/updated-energy-and-emissions-projections-2018.pdf (accessed on 8 December 2024).
  55. EIA (US Energy Information Administration). Carbon Dioxide Emissions Coefficients by Fuel. 2022. Available online: https://www.eia.gov/environment/emissions/co2_vol_mass.php (accessed on 27 March 2023).
  56. Updated Energy and Emissions Projections 2021 to 2040. 2022. Available online: https://assets.publishing.service.gov.uk/government/uploads/system/uploads/attachment_data/file/1111625/updated-energy-and-emissions-projections-2021-2040.pdf (accessed on 8 December 2024).
  57. Kraan, O.; Kramer, G.J.; Nikolic, I.; Chappin, E.; Koning, V. Why fully liberalised electricity markets will fail to meet deep decarbonisation targets even with strong carbon pricing. Energy Policy 2019, 131, 99–110. [Google Scholar] [CrossRef]
  58. Markkanen, S.; Sheikh, A.Y.; Ali, M.; Devlin, A.; Cornaby, B. Market Driven Decarbonisation: The Role of Demand-Led Innovation in Supporting Emission Reductions in Foundation Industries. 2023. Available online: https://www.cisl.cam.ac.uk/files/innovate_uk_policy_briefing_market_driven_decarbonisation_2023_june.pdf (accessed on 8 December 2024).
  59. Digest of UK Energy Statistics (DUKES) 2023: Supporting Data Tables. Available online: https://www.gov.uk/government/statistics/digest-of-uk-energy-statistics-dukes-2023 (accessed on 8 December 2024).
  60. ONS (Office for National Statistics). Net Zero and the Different Official Measures of the UK’s Greenhouse Gas Emissions. 2019. Available online: https://www.ons.gov.uk/economy/environmentalaccounts/articles/netzeroandthedifferentofficialmeasuresoftheuksgreenhousegasemissions/2019-07-24 (accessed on 8 December 2024).
  61. Hong, W.Y. A techno-economic review on carbon capture, utilisation and storage systems for achieving a net-zero CO2 emissions future. Carbon Capture Sci. Technol. 2022, 3, 100044. [Google Scholar] [CrossRef]
  62. Kearns, D.; Liu, H.; Consoli, C. Technology Readiness and Costs of CCS. 2021. Available online: https://www.globalccsinstitute.com/wp-content/uploads/2021/03/Technology-Readiness-and-Costs-for-CCS-2021-1.pdf (accessed on 8 December 2024).
  63. Sherwin, E.D.; Rutherford, J.S.; Zhang, Z.; Chen, Y.; Wetherley, E.B.; Yakovlev, P.V.; Berman, E.S.F.; Jones, B.B.; Cusworth, D.H.; Thorpe, A.K.; et al. US oil and gas system emissions from nearly one million aerial site measurements. Nature 2024, 627, 328–334. [Google Scholar] [CrossRef] [PubMed]
  64. How Secretive Methane Leaks Are Driving Climate Change, UN Environment Programme. 2022. Available online: https://www.unep.org/news-and-stories/story/how-secretive-methane-leaks-are-driving-climate-change (accessed on 8 December 2024).
  65. Silva, M.; Palumbo, D.; Rivault, E. Kazakhstan: Methane Mega-Leak Went on for Months. BBC (British Broadcasting Corporation). 2024. Available online: https://www.bbc.co.uk/news/world-asia-68166298 (accessed on 8 December 2024).
  66. Crownhart, C.; Methane Leaks in the US Are Worse Than We Thought. MIT Technology Review. 2024. Available online: https://www.technologyreview.com/2024/03/13/1089725/methane-leaks-oil-gas/ (accessed on 8 December 2024).
  67. Digest of United Kingdom Energy Statistics 2020. 2020. Available online: https://assets.publishing.service.gov.uk/government/uploads/system/uploads/attachment_data/file/924591/DUKES_2020_MASTER.pdf (accessed on 8 December 2024).
  68. Barbour, E.; Wilson, I.A.G.; Radcliffe, J.; Ding, Y.; Li, Y. A review of pumped hydro energy storage development in significant international electricity markets. Renew. Sustain. Energy Rev. 2016, 61, 421–432. [Google Scholar] [CrossRef]
  69. England and Wales Hydropower Resource Assessment. 2010. Available online: https://assets.publishing.service.gov.uk/government/uploads/system/uploads/attachment_data/file/47950/753-england-wales-hydropower-resource-assess.pdf (accessed on 8 December 2024).
  70. ICE (Institution of Civil Engineers). The Changing Price of Wholesale UK Electricity over More Than a Decade. 2017. Available online: https://www.ice.org.uk/media/kd2janz0/wholesale_electricity_daily_prices_11_march_2003_31_december_2016_recd_17th_may.xlsx (accessed on 8 December 2024).
  71. Fourth Carbon Budget Review—Technical Report. 2013. Available online: https://www.theccc.org.uk/wp-content/uploads/2013/12/1785b-CCC_TechRep_Singles_Book_1.pdf (accessed on 8 December 2024).
  72. Contracts for Difference Allocation Round 4 Results. 2022. Available online: https://assets.publishing.service.gov.uk/government/uploads/system/uploads/attachment_data/file/1103022/contracts-for-difference-allocation-round-4-results.pdf (accessed on 8 December 2024).
  73. Sung, S.; Jung, W. Economic competitiveness evaluation of the energy sources: Comparison between a financial model and levelized cost of electricity analysis. Energies 2019, 12, 4101. [Google Scholar] [CrossRef]
  74. Spry, W. Regional Renewable Electricity in 2022. 2023. Available online: https://assets.publishing.service.gov.uk/government/uploads/system/uploads/attachment_data/file/1187280/Regional_Renewables_2022.pdf (accessed on 8 December 2024).
  75. Energy Numbers. Smith, A.Z.P. UK Offshore Wind Capacity Factors. 2023. Available online: https://energynumbers.info/uk-offshore-wind-capacity-factors (accessed on 8 December 2024).
  76. Spry, W. DUKES 6.2: Capacity of, Generation from Renewable Sources and Shares of Total Generation. DESNZ (Department for Energy Security & Net Zero). 2023. Available online: https://www.gov.uk/government/statistics/renewable-sources-of-energy-chapter-6-digest-of-united-kingdom-energy-statistics-dukes (accessed on 8 December 2024).
  77. Daron, G. Study on UK Offshore Wind Variability. 2016. Available online: https://www.thecrownestate.co.uk/media/1772/uk-offshore-wind-variability.pdf (accessed on 8 December 2024).
  78. Smith, L. Gridwatch, Templar Consultancy. Available online: https://www.gridwatch.templar.co.uk/ (accessed on 8 December 2024).
  79. Woolcock, J. Report to the Secretary of State for Transport and the Secretary of State for Communities and Local Government: Scout Moor Wind Farm Expansion. 2017. Available online: https://assets.publishing.service.gov.uk/government/uploads/system/uploads/attachment_data/file/625860/17-04-03_IR_Scout_Moor_Wind_Farm__Rochdale.pdf (accessed on 8 December 2024).
  80. Allison, W. The Inadequacy of Wind Power. 2023. Available online: https://www.thegwpf.org/content/uploads/2023/03/Allison-Wind-energy.pdf (accessed on 8 December 2024).
  81. National Grid ESO. Future Energy Scenarios. 2023. Available online: https://www.nationalgrideso.com/document/283101/download (accessed on 8 December 2024).
  82. Energy Trends: UK, October to December 2022 and 2022. 2023. Available online: https://assets.publishing.service.gov.uk/government/uploads/system/uploads/attachment_data/file/1147249/Energy_Trends_March_2023.pdf (accessed on 8 December 2024).
  83. Sani, L. Gone with the Wind? Grid Congestion and Wind Integration in GB. 2023. Available online: https://carbontracker.org/reports/gone-with-the-wind/ (accessed on 8 December 2024).
  84. Life Cycle Impacts of Biomass Electricity in 2020. 2014. Available online: https://assets.publishing.service.gov.uk/government/uploads/system/uploads/attachment_data/file/349024/BEAC_Report_290814.pdf#page=26 (accessed on 8 December 2024).
  85. ONS (Office for National Statistics). Inflation Rate for Food and Non-Alcoholic Beverages. 2023. Available online: https://www.ons.gov.uk/visualisations/dvc2389/tiles/datadownloads/food.xlsx (accessed on 8 December 2024).
  86. Payne, C.; Consumer Price Inflation. UK: January 2023. 2023. Available online: https://www.ons.gov.uk/economy/inflationandpriceindices/bulletins/consumerpriceinflation/january2023/pdf (accessed on 8 December 2024).
  87. Biobased Products Facts and Figures 2021. 2020. Available online: https://www.fnr.de/fileadmin/Projekte/2020/Mediathek/Basisdaten-biobasierte_Produkte_2020_en_Web.pdf (accessed on 8 December 2024).
  88. Biomass in a Low-Carbon Economy. 2018. Available online: https://www.theccc.org.uk/wp-content/uploads/2018/11/Biomass-in-a-low-carbon-economy-CCC-2018.pdf (accessed on 8 December 2024).
  89. The Role of Critical Minerals in Clean Energy Transitions; International Energy Agency: Paris, France, 2021. [CrossRef]
  90. Report on Critical Raw Materials for the EU. 2015. Available online: https://ec.europa.eu/docsroom/documents/10010/attachments/1/translations/en/renditions/pdf (accessed on 8 December 2024).
  91. Draft List of Critical Minerals. 2018. Available online: https://www.govinfo.gov/content/pkg/FR-2018-02-16/pdf/2018-03219.pdf (accessed on 8 December 2024).
  92. Natrajan, L.; Langford Paden, M. F-block Elements Recovery. In Element Recovery and Sustainability; Hunt, A., Ed.; RSC Publishing: Cambridge, UK, 2013; pp. 140–184. [Google Scholar]
  93. Ganguli, R.; Cook, D.R. Rare earths: A review of the landscape. MRS Energy Sustain. 2018, 5, 1–16. [Google Scholar] [CrossRef]
  94. Bai, J.; Xu, X.; Duan, Y.; Zhang, G.; Wang, Z.; Wang, L.; Zheng, C. Evaluation of resource and environmental carrying capacity in rare earth mining areas in China. Sci. Rep. 2022, 12, 1–13. [Google Scholar] [CrossRef] [PubMed]
  95. Hodgson, B.J.; Turner, J.R.; Holdsworth, A.F. A Review of Opportunities and Methods for Recovery of Rhodium from Spent Nuclear Fuel during Reprocessing. J. Nucl. Eng. 2023, 4, 484–534. [Google Scholar] [CrossRef]
  96. Holdsworth, A.F.; Eccles, H.; Sharrad, C.A.; George, K. Spent Nuclear Fuel—Waste or Resource? The Potential of Strategic Materials Recovery during Recycle for Sustainability and Advanced Waste Management. Waste 2023, 1, 249–263. [Google Scholar] [CrossRef]
  97. Holdsworth, A.F.; Ireland, E. Navigating the Path of Least Resistance to Sustainable, Widespread Adoption of Nuclear Power. Sustainability 2024, 16, 2141. [Google Scholar] [CrossRef]
  98. Sovacool, B.K.; Andersen, R.; Sorensen, S.; Sorensen, K.; Tienda, V.; Vainorius, A.; Schirach, O.M.; Bjørn-Thygesen, F. Balancing safety with sustainability: Assessing the risk of accidents for modern low-carbon energy systems. J. Clean. Prod. 2016, 112, 3952–3965. [Google Scholar] [CrossRef]
  99. Markandya, A.; Wilkinson, P. Electricity generation and health. Lancet 2007, 370, 979–990. [Google Scholar] [CrossRef]
  100. Death Rates per Unit of Electricity Production, Our World in Data. Available online: https://ourworldindata.org/grapher/death-rates-from-energy-production-per-twh (accessed on 8 December 2024).
  101. Roser, M. Data Review: How Many People Die from Air Pollution? Our World in Data. 2021. Available online: https://ourworldindata.org/data-review-air-pollution-deaths (accessed on 8 December 2024).
  102. Lelieveld, J.; Haines, A.; Burnett, R.; Tonne, C.; Klingmüller, K.; Münzel, T.; Pozzer, A. Air pollution deaths attributable to fossil fuels: Observational and modelling study. BMJ 2023, 383, e077784. [Google Scholar] [CrossRef] [PubMed]
  103. Vohra, K.; Vodonos, A.; Schwartz, J.; Marais, E.A.; Sulprizio, M.P.; Mickley, L.J. Global mortality from outdoor fine particle pollution generated by fossil fuel combustion: Results from GEOS-Chem. Environ. Res. 2021, 195, 110754. [Google Scholar] [CrossRef] [PubMed]
  104. Dam Failure and Flood Event Case History Compilation. 2015. Available online: https://www.usbr.gov/ssle/damsafety/documents/RCEM-CaseHistories2015.pdf (accessed on 8 December 2024).
  105. Report 2011 Tohoku Pacific Coast Earthquake. 2020. Available online: https://www.fdma.go.jp/disaster/higashinihon/items/162.pdf (accessed on 8 December 2024).
  106. Watson, D. Should we be worried about nuclear? Nuclear Future 2020, 23–27. [Google Scholar]
  107. Munroe, R. Radiation Dose Chart. XKCD. 2011. Available online: https://xkcd.com/radiation/ (accessed on 8 December 2024).
  108. Science Innovation and Technology Committee, Delivering Nuclear Power: Eighth Report of Session 2022–23. 2023. Available online: https://committees.parliament.uk/publications/41092/documents/200324/default/ (accessed on 8 December 2024).
  109. Clark, R. Chapter One—Site Evaluation: Examining the Proposed Site to Ensure That It Has Adequate Wind and Space. Small Wind 2014, 11–27. [Google Scholar] [CrossRef]
  110. Community Guidance. Available online: https://assets.publishing.service.gov.uk/media/6256b1f8d3bf7f6006f846e5/Community_Guidance_England.pdf (accessed on 8 December 2024).
  111. GDF Report 2023. 2023. Available online: https://assets.publishing.service.gov.uk/media/64ac62b5e1aab2001303acb9/NWS_GDF_Report2023_O15_SWAP.pdf (accessed on 8 December 2024).
  112. Meeting the Energy Challege: A White Paper on Nuclear Power. 2008. Available online: https://assets.publishing.service.gov.uk/government/uploads/system/uploads/attachment_data/file/228944/7296.pdf (accessed on 8 December 2024).
  113. Further Steps to Prepare Sizewell C for Construction, HM Government. 2024. Available online: https://www.gov.uk/government/news/further-steps-to-prepare-sizewell-c-for-construction (accessed on 8 December 2024).
  114. Lorenczik, S.; Keppler, J.H. Projected Costs of Generating Electricity. 2020. Available online: https://iea.blob.core.windows.net/assets/ae17da3d-e8a5-4163-a3ec-2e6fb0b5677d/Projected-Costs-of-Generating-Electricity-2020.pdf (accessed on 8 December 2024).
  115. Berthélemy, M.; Soler, A.V.; Middleton, M.; León, S.B.Y. Unlocking Reductions in the Construction Costs of Nuclear: A Practical Guide for Stakeholders; Nuclear Energy Agency: Paris, France, 2020. [Google Scholar] [CrossRef]
  116. Hinkley Point Nuclear Agreement Reached, BBC. 2015. Available online: https://www.bbc.co.uk/news/business-34587650 (accessed on 8 December 2024).
  117. Newbery, D.; Pollitt, M.; Reiner, D.; Taylor, S. Financing Low-Carbon Generation in the UK: The Hybrid RAB Model. 2019. Available online: https://www.jbs.cam.ac.uk/wp-content/uploads/2023/12/eprg-wp1926.pdf (accessed on 8 December 2024).
  118. Mignacca, B.; Locatelli, G. Economics and finance of Small Modular Reactors: A systematic review and research agenda. Renew. Sustain. Energy Rev. 2020, 118, 109519. [Google Scholar] [CrossRef]
  119. Westinghouse and UK’s Community Nuclear Power Collaborate to Deploy Fleet of AP300 Small Modular Reactors, Westinghouse. 2024. Available online: https://info.westinghousenuclear.com/news/westinghouse-and-uks-community-nuclear-power-collaborate-to-deploy-fleet-of-ap300-small-modular-reactors (accessed on 8 December 2024).
  120. WNA (World Nuclear Association). Nuclear Power in Japan. 2023. Available online: https://world-nuclear.org/information-library/country-profiles/countries-g-n/japan-nuclear-power.aspx (accessed on 8 December 2024).
  121. Our World in Data. Per Capita Electricity Generation by Source. Available online: https://ourworldindata.org/grapher/per-capita-electricity-source-stacked?stackMode=relative (accessed on 8 December 2024).
  122. Our World in Data. Carbon Intensity of Electricity. Available online: https://ourworldindata.org/grapher/carbon-intensity-electricity (accessed on 8 December 2024).
  123. Our World in Data. Per Capita Electricity Generation from Nuclear. Available online: https://ourworldindata.org/grapher/nuclear-electricity-per-capita (accessed on 8 December 2024).
  124. IEA (International Energy Agency). Methane Tracker. 2021. Available online: https://www.iea.org/reports/methane-tracker-2021/methane-and-climate-change (accessed on 8 December 2024).
  125. UK Hydrogen Strategy. 2021. Available online: https://assets.publishing.service.gov.uk/government/uploads/system/uploads/attachment_data/file/1175494/UK-Hydrogen-Strategy_web.pdf (accessed on 8 December 2024).
  126. Sand, M.; Skeie, R.B.; Sandstad, M.; Krishnan, S.; Myhre, G.; Bryant, H.; Derwent, R.; Hauglustaine, D.; Paulot, F.; Prather, M.; et al. A multi-model assessment of the Global Warming Potential of hydrogen. Commun. Earth Environ. 2023, 4, 1. [Google Scholar] [CrossRef]
  127. Transport in Transition. 2023. Available online: https://www.dnv.com/Publications/transport-in-transition-242808 (accessed on 8 December 2024).
  128. Norman, J.; Besenbruch, G.; O’Keefe, D. Thermochemical Water-Splitting for Hydrogen Production. 1981. Available online: https://www.osti.gov/servlets/purl/6743133 (accessed on 8 December 2024).
  129. Wang, Z.L.; Naterer, G.F.; Gabriel, K.S.; Gravelsins, R.; Daggupati, V.N. Comparison of sulfur-iodine and copper-chlorine thermochemical hydrogen production cycles. Int. J. Hydrog. Energy 2010, 35, 4820–4830. [Google Scholar] [CrossRef]
  130. EDF Energy R&D UK Centre. Hydrogen Supply Programme: H2H Feasibility Report. 2019. Available online: https://assets.publishing.service.gov.uk/media/5e4ab9beed915d4ff62d1d55/Phase_1_-_EDF_-_Hydrogen_to_Heysham.pdf (accessed on 8 December 2024).
  131. Frick, K.; Wendt, D.; Talbot, P.; Rabiti, C.; Boardman, R. Technoeconomic assessment of hydrogen cogeneration via high temperature steam electrolysis with a light-water reactor. Appl. Energy 2022, 306, 118044. [Google Scholar] [CrossRef]
  132. Matthews, J.; Bodel, W.; Butler, G. The Road to Net Zero: Renewables and Nuclear Working Together. 2024. Available online: https://documents.manchester.ac.uk/display.aspx?DocID=74463 (accessed on 8 December 2024).
  133. The Ten Point Plan for a Green Industrial Revolution. 2020. Available online: https://assets.publishing.service.gov.uk/government/uploads/system/uploads/attachment_data/file/936567/10_POINT_PLAN_BOOKLET.pdf (accessed on 8 December 2024).
  134. Energy White Paper: Powering Our Net Zero Future. 2020. Available online: https://assets.publishing.service.gov.uk/government/uploads/system/uploads/attachment_data/file/945899/201216_BEIS_EWP_Command_Paper_Accessible.pdf (accessed on 8 December 2024).
  135. Net Zero Strategy: Build Back Greener. 2021. Available online: https://assets.publishing.service.gov.uk/government/uploads/system/uploads/attachment_data/file/1033990/net-zero-strategy-beis.pdf (accessed on 8 December 2024).
  136. British Energy Security Strategy. 2022. Available online: https://assets.publishing.service.gov.uk/government/uploads/system/uploads/attachment_data/file/1069969/british-energy-security-strategy-web-accessible.pdf (accessed on 8 December 2024).
  137. Advanced Modular Reactor Research, Development & Demonstration Programme: Indicative Programme Outline. 2022. Available online: https://www.nirab.org.uk/cdn/uploads/attachments/amr-demo-programme-indicative-outline.pdf (accessed on 8 December 2024).
  138. Bodel, W.; Hesketh, K.; McGlynn, G.; Matthews, J.; Butler, G. Generic feasibility assessment: Helping to choose the nuclear piece of the net zero jigsaw. Energies 2021, 14, 1229. [Google Scholar] [CrossRef]
  139. Assurance Assessment Toolkit: A White Paper. 2012. Available online: https://www.apm.org.uk/v2/media/qejjzb50/assurance-assessment-toolkit.pdf (accessed on 8 December 2024).
  140. National Academies of Sciences, Engineering, and Medicine. Merits and Viability of Different Nuclear Fuel Cycles and Technology Options and the Waste Aspects of Advanced Nuclear Reactors; National Academies Press: Washington, DC, USA, 2023. [Google Scholar]
  141. Kim, T.; Boing, L.; Halsey, W.; Dixon, B. Nuclear Waste Attributes of SMRs Scheduled for Near-Term Deployment. 2022. Available online: https://fuelcycleoptions.inl.gov/SiteAssets/SitePages/Home/SMR_Waste_Attributes_Report_Final.pdf (accessed on 8 December 2024).
  142. Krall, L.M.; Macfarlane, A.; Ewing, R. Nuclear waste from small modular reactors. Proc. Natl. Acad. Sci. USA 2022, 119, 1–12. [Google Scholar] [CrossRef]
  143. Greenhalgh, C.; Azapagic, A. Review of drivers and barriers for nuclear power in the UK, Environ. Sci. Policy 2009, 12, 1052–1067. [Google Scholar] [CrossRef]
  144. Nuclear For Net Zero: A UK Whole Energy System Appraisal. 2020. Available online: https://es.catapult.org.uk/report/nuclear-for-net-zero/ (accessed on 8 December 2024).
  145. Santoyo-Castelazo, E.; Azapagic, A. Sustainability assessment of energy systems: Integrating environmental, economic and social aspects. J. Clean. Prod. 2014, 80, 119–138. [Google Scholar] [CrossRef]
  146. Taylor, R.; Bodel, W.; Butler, G. A Review of Environmental and Economic Implications of Closing the Nuclear Fuel Cycle—Part Two: Economic Impacts. Energies 2022, 15, 2472. [Google Scholar] [CrossRef]
  147. Shropshire, D.E.; Williams, K.A.; Boore, W.B.; Smith, J.D.; Dixon, B.W.; Dunzik-Gougar, M.; Adams, R.D.; Gombert, D.; Schneider, E. Advanced Fuel Cycle Cost Basis. 2008. Available online: https://core.ac.uk/download/pdf/71325086.pdf (accessed on 8 December 2024).
  148. Choi, S.; Lee, H.J.; Ko, W.I. Dynamic analysis of once-through and closed fuel cycle economics using Monte Carlo simulation. Nucl. Eng. Des. 2014, 277, 234–247. [Google Scholar] [CrossRef]
  149. Zhou, C.; Liu, X.; Gu, Z.; Wang, Y. Economic analysis of two nuclear fuel cycle options. Ann. Nucl. Energy 2014, 71, 230–236. [Google Scholar] [CrossRef]
  150. Cashmore, R.; Koppelman, B. Proliferation resistance, used fuel and multinational approaches to the provision of fuel cycle services. In Reprocessing and Recycling of Spent Nuclear Fuel; Taylor, R., Ed.; Elsevier Ltd.: Amsterdam, The Netherlands, 2015; pp. 579–601. [Google Scholar]
  151. Cashmore, R.; Billowes, J.; Bowen, W.; Brown, C.; Grimes, R.; Howsley, R.; Livens, F.; Simpson, J.; Styles, P. Fuel Cycle Stewardship in a Nuclear Renaissance. 2011. Available online: https://royalsociety.org/~/media/Royal_Society_Content/policy/projects/nuclear-non-proliferation/FuelCycleStewardshipNuclearRenaissance.pdf (accessed on 8 December 2024).
  152. Williams, L.G. Safety and security issues in the reprocessing and recycling of spent nuclear fuels for advanced fuel cycles. In Reprocessing and Recycling of Spent Nuclear Fuel; Taylor, R., Ed.; Elsevier Ltd.: Amsterdam, The Netherlands, 2015; pp. 63–90. [Google Scholar]
  153. McCarthy, K.A.; Dixon, B.; Choi, Y.J.; Boucher, L.; Ono, K.; Alvarez-Velarde, F.; Gonzalez, E.M.; Hyland, B. Benchmark Study on Nuclear Fuel Cycle Transition Scenarios Analysis Codes. 2012. Available online: https://inis.iaea.org/collection/NCLCollectionStore/_Public/44/089/44089401.pdf (accessed on 8 December 2024).
  154. Noh, H.; Choi, S.; Hwang, I.S. Multinational planning of nuclear energy systems in Asia. Energy Sources Part B Econ. Plan. Policy 2017, 12, 289–295. [Google Scholar] [CrossRef]
  155. Tsai, T.L.; Chiou, Y.F.; Tsai, S.C. Overview of the nuclear fuel cycle strategies and the spent nuclear fuel management technologies in Taiwan. Energies 2020, 13, 2996. [Google Scholar] [CrossRef]
  156. Taylor, R.; Bodel, W.; Stamford, L.; Butler, G. Nuclear Fuel Cycle Evaluation and Screening—Final Report. 2014. Available online: https://fuelcycleevaluation.inl.gov/Shared%20Documents/ES%20Main%20Report.pdf (accessed on 8 December 2024).
  157. Wattal, P.K. Back end of Indian nuclear fuel cycle—A road to sustainability. Prog. Nucl. Energy 2017, 101, 133–145. [Google Scholar] [CrossRef]
  158. Chen, Y.; Martin, G.; Chabert, C.; Eschbach, R.; He, H.; Ye, G.A. Prospects in China for nuclear development up to 2050. Prog. Nucl. Energy 2018, 103, 81–90. [Google Scholar] [CrossRef]
  159. Stamford, L.; Azapagic, A. Sustainability indicators for the assessment of nuclear power. Energy 2011, 36, 6037–6057. [Google Scholar] [CrossRef]
Figure 2. The UN’s 17 SDGs. The 17 SDGs are accompanied by 169 targets, most of which are to be achieved by 2030.
Sustainability 16 10952 g002
Figure 3. Two charts plotting energy use per capita to illustrate the extent of energy consumption with wealth: country energy use per capita vs. proportion of the population in poverty (A); energy use per capita for income-grouped countries (B). Data from International Energy Agency (via World Bank), World Bank Poverty and Inequality Platform, U.S. Energy Information Administration; Energy Institute Statistical Review of World Energy; available from [32,33].
Sustainability 16 10952 g003aSustainability 16 10952 g003b
Figure 4. World energy consumption by energy source. Data from: Energy Institute Statistical Review of World Energy; available from [34].
Sustainability 16 10952 g004
Figure 5. Annual CO2 emissions for the UK and other selected countries. Data from Global Carbon Budget; available from [36].
Sustainability 16 10952 g005
Figure 6. All reactors currently under construction worldwide, by country. Data from [37].
Sustainability 16 10952 g006
Figure 7. Variant of Stamford’s figure of environmental sustainability indicators, normalising for each indicator (y-axis are normalised values). Note that a value of 1.0 indicates the most detrimental technology except for “recyclability”, where 1.0 is most beneficial. Data from ([48], p. 1285).
Sustainability 16 10952 g007
Figure 8. The change in UK electricity supply by source since 1990 (the benchmark year for emissions reductions) has been defined by the transition from coal combustion to gas. Data: Digest of UK Energy Statistics (DUKES) [59].
Sustainability 16 10952 g008
Figure 9. Net greenhouse gas emissions in the UK (on a Climate Change Act basis) 1990–2017 [60].
Sustainability 16 10952 g009
Figure 10. Charts showing energy consumption by sector and electricity supply by source (2022). Electricity makes up around one-fifth of energy consumption. Data: DUKES [59].
Sustainability 16 10952 g010
Figure 11. The most progress in greenhouse gas emissions reduction has been seen in power generation, while other sectors have seen little to no decrease over the same period. Data: DUKES [59].
Sustainability 16 10952 g011
Figure 12. British power for one winter month in 2020 along with generation from wind, solar, gas, and nuclear. Gas made up the shortfall in generation when wind output was low. Solar was ineffectual for most of the time, and nuclear output was consistent across the period. Data from [78].
Sustainability 16 10952 g012
Figure 13. Death rates per TWh of electricity generated for various generation methods [98,99]. Data from United Nations Scientific Committee on the Effects of Atomic Radiation; available from [100].
Sustainability 16 10952 g013
Figure 14. Breakdown of the nuclear levelised cost of electricity assuming a 7% discount rate. Reproduced from ([115], p. 30).
Sustainability 16 10952 g014
Figure 17. A preliminary level playing field table which attempts to summarise at a glance how various energy-generation methods perform using an RAGB (Red Amber Green Blue) colour scheme (Section 4.3 in [139]) based on the discussion in this paper. The worst performance against the metrics is highlighted in red, amber still has issues that need addressing, green is good but has some scope for improvement, and blue is excellent. Note that this is a crude assessment for the purpose of identifying the strengths and challenges of each method, and further work is needed to underpin the data if this is to have wider application. * Based on large dam hydro. † Based on importing of biomass from North America. Biomass has the potential for improved measures if managed sustainably. ‡ Based on the current low Technology Readiness Level (TRL) status of CCS technology. Has the potential to improve against these metrics if the technology matures accordingly.
Sustainability 16 10952 g017
Table 1. All SDG indicators for Goal 7: “Ensure access to affordable, reliable, sustainable and modern energy for all” ([9], pp. 14–15).
TargetIndicatorCustodian AgenciesPartner Agencies
7.1: By 2030, ensure universal access to affordable, reliable, and modern energy services7.1.1: Proportion of population with access to electricityWorld BankIEA, UN-Energy
7.1.2: Proportion of population with primary reliance on clean fuels and technologyWHOUN-Energy
7.2: By 2030, increase substantially the share of renewable energy in the global energy mix7.2.1: Renewable energy share in the total final energy consumptionUNSD, IEA, IRENAWorld Bank, UN-Energy
7.3: By 2030, double the global rate of improvement in energy efficiency7.3.1: Energy intensity measured in terms of primary energy and GDPUNSD, IEAWorld Bank, UN-Energy
7.a: By 2030, enhance international cooperation to facilitate access to clean energy research and technology, including renewable energy, energy efficiency, and advanced and cleaner fossil-fuel technology, and promote investment in energy infrastructure and clean energy technology7.a.1: International financial flows to developing countries in support of clean energy research and development and renewable energy production, including in hybrid systemsOECD, IRENAIEA, UN-Energy, UNEP
7.b: By 2030, expand infrastructure and upgrade technology for supplying modern and sustainable energy services for all in developing countries, in particular least developed countries, small island developing states, and landlocked developing countries, in accordance with their respective programmes of support7.b.1: Installed renewable energy-generating capacity in developing countries (W/capita)IRENA
Table 2. Emissions of selected commercially available electricity supply technologies, sorted by median lifecycle emissions. Adapted from ([49], p. 1335).
TargetDirect EmissionsLifecycle Emissions
(Including Albedo Effect)
Min/Median/Max
kgCO2eq/MWh
Min/Median/Max
kgCO2eq/MWh
Pulverised coal670/760/870740/820/910
Biomass—co-firingn/a *620/740/890 †
Gas—combined cycle350/370/490410/490/650
Biomass—dedicated cyclen/a *130/230/420 ‡
Solar—utility photovoltaic018/48/180
Solar—rooftop photovoltaic026/41/60
Geothermal06.0/38/79
Concentrated power08.8/27/63
Hydropower01.0/24/2200
Nuclear03.7/12/110
Wind—offshore08.0/12/35
Wind—onshore07.0/11/56
* Direct emissions from biomass combustion at the plant are positive but should be seen in connection with the CO2 absorbed by growing plants. They can be derived from the chemical carbon content of biomass and the power plant efficiency. † Indirect emissions for co-firing are based on relative fuel shares of biomass from dedicated energy crops and residues (5–20%) and coal (80–95%). ‡ Lifecycle emissions from biomass are for dedicated energy crops and crop residues.
Disclaimer/Publisher’s Note: The statements, opinions and data contained in all publications are solely those of the individual author(s) and contributor(s) and not of MDPI and/or the editor(s). MDPI and/or the editor(s) disclaim responsibility for any injury to people or property resulting from any ideas, methods, instructions or products referred to in the content.

