Article

Multi-Scenario Simulation of Future Land Use in the Beijiang River Basin Under Multidimensional Ecological Constraints

1
School of Water Resources and Hydropower Engineering, North China Electric Power University, Beijing 102206, China
2
National-Regional Joint Engineering Research Center for Soil Pollution Control and Remediation in South China, Guangdong Key Laboratory of Integrated Agro-Environmental Pollution Control and Management, Institute of Eco-Environmental and Soil Sciences, Guangdong Academy of Sciences, Guangzhou 510650, China
3
State Key Laboratory for Managing Biotic and Chemical Threats to the Quality and Safety of Agro-Products, School of Civil & Environmental Engineering and Geography Science, Ningbo University, Ningbo 315211, China
*
Author to whom correspondence should be addressed.
Sustainability 2024, 16(24), 10910; https://doi.org/10.3390/su162410910
Submission received: 24 October 2024 / Revised: 7 December 2024 / Accepted: 10 December 2024 / Published: 12 December 2024

Abstract

:
This study takes the Beijiang River Basin in Guangdong Province as an example, examining the changes in land usage throughout time and space between 1980 and 2020. Using multidimensional ecosystem service functions and the loop theory, this study constructs ecological constraints (ES) for the Beijiang River Basin. Based on these ecological constraints, an ES-PLUS model is developed to simulate future land cover changes under multiple scenarios in the Beijiang River Basin by 2050. The results indicate the following: (1) Currently, the major land use types in the Beijiang River Basin are forest, cropland, and grassland, accounting for over 95% of the area. Significant changes in land use were observed between 1980 and 2020, including the severe degradation of forests and grasslands, a notable expansion of construction land, intense human–land conflicts, and the highest single land use dynamic degree for unused land at 5.67%, with a comprehensive land use dynamic degree of 0.18%. (2) In the four development scenarios of the Beijiang River Basin in 2050, construction land increased by 32.97%, 74.75%, 26.01%, and 45.50%, respectively, suggesting that ecological constraints as flexible constraint spaces can effectively control the disorderly expansion of construction land. Therefore, formulating ecological protection policies, optimizing the land use structure in the Beijiang River Basin, and constructing ecological sources and corridors in line with the distribution of urban areas, roads, and railroads in the basin may offer direction for the best use of land resources, the preservation of the environment, and sustainable growth in the Beijiang River Basin.

1. Introduction

Land use management in river basins is characterized by ecological constraints, which are determined by the comprehensive development capacity of ecosystems and the sustainability of land use. These limitations have the potential to safeguard the river basin’s natural ecology and advance sustainable development through scientific management and planning. Currently, ecological constraints generally consist of natural protection areas and ecological red line areas, serving as core regions for ecosystem services in the basin. In future basin planning, changes in land use types within these regions are prohibited [1,2,3]. However, the ecological constraints formed by these regions are isolated and fixed landscape structures that do not adjust or change under different future development scenarios [4,5,6]. Ecological sources and ecological channels make up the ecological restrictions suggested in this study, which together create the basin’s entire ecological security network [7,8,9,10]. The selection of ecological sources considers the various ecosystem service functions within the basin, and the MCR model serves as the primary foundation for the ecological-corridor-extraction process. However, the MCR model cannot calculate the width and length of ecological corridors in a watershed by accumulating the watershed thresholds, thus it cannot be part of the ecological constraints [11,12,13]. The loop theory model is an important ecological tool that effectively predicts the length and extent of ecological corridors. This model evaluates the efficacy of ecological corridors by simulating various configurations, enabling the identification of designs that most effectively connect core ecological areas. Such connections facilitate species migration and gene flow and optimize ecological flow. Based on the model’s outputs, researchers can adjust the ecological flow between different core areas. This process includes identifying and enhancing key connection points to improve ecological flow, thereby supporting biodiversity and ecosystem stability [14,15,16,17]. Therefore, based on future multi-objective development scenarios, different levels of ecological corridors can be constructed to adapt to the ecological constraints [18,19,20]. For instance, Wang Qin et al. constructed ecological constraints in Anhui Province based on the loop theory, determining important regions for ecological restoration and conservation and implementing protective measures based on their distribution characteristics and land use types [21]. Similarly, using urban big data sites of interest, He Xiaxuan et al. [22] made significant improvements to the traditional ecological source identification methods, aiming to enhance the accuracy and practicality of ecological source recognition. Building on this foundation, they applied the loop theory to successfully identify ecological corridors and critical junctions in Dongguan City. This research not only deepens our understanding of ecological network structures, but also provides a scientific basis for regional ecological planning. The improvements introduced by He and colleagues likely include the incorporation of additional ecological factors and data sources in order to more comprehensively reflect the complexity of ecosystems. Furthermore, they employed diversified model analysis techniques, enhancing their ability to analyze the interactions between ecological sources and corridors. By applying the loop theory, the research team effectively delineated the distribution and characteristics of the ecological corridors within Dongguan City, identifying key junctions that play crucial roles in the ecological network. The findings not only offer specific guidance for ecological protection and restoration in Dongguan, but also provide valuable insights for other cities in the planning and management of ecological corridors, providing a scientific basis for future regional spatial planning [22]. To effectively preserve the area’s biodiversity, Zhao Zhiqiang et al. assessed the habitat conditions of the Songhua River ecological corridor, identified ecological sources based on habitat suitability for various species, and constructed a habitat network utilizing a coupled loop theory model [23]. However, the majority of biological restrictions stated above are permanent landscape regions that are not modifiable according to various simulation situations. A complete ecological constraint network consists of an ecological core area and a multi-threshold watershed ecological corridor, both of which can maintain the health and stability of the ecosystem, playing an essential role in enhancing ecological security and preserving the basin’s ecological land.
Future land use simulation in river basins is a crucial means for exploring and addressing ecological security issues and optimizing land use [24,25]. Land use simulation models primarily include system dynamics models, logistic regression models, FLUS (future land use simulation) models, and Markov models [26,27,28,29]. To address the limitations of individual models, it is necessary to integrate two or more models, thereby facilitating comprehensive studies of the research area [30,31,32]. This approach was used to study and predict the dynamic processes of land use change. This model can effectively capture the complexity and spatiotemporal evolution characteristics of land use by simulating the state changes in surface units (cells), referred to as PLUS, which has been developed for this purpose. In addition to combining the competitive interactions between the basin’s various land types with future land use needs, this model also achieves high accuracy in future multi-scenario simulation results [33,34,35,36]. Using the PLUS-SWAT model, Yang Zhiyong et al. examined runoff responses under various land cover scenarios and discovered that ecological land restricted runoff; however, the rapid expansion of construction land encroached on ecological land, resulting in an increase in surface runoff during rainstorms, providing reliable evidence for the allocation of the basin’s soil reserves [37,38]. This study used a multidimensional ecological constraint network in combination with the PLUS model. In future land use simulations, ecological constraints are treated as flexible constraint spaces, allowing for the simultaneous consideration of ecological preservation and economic growth, thereby achieving a balance and optimization of multiple objectives.
The Beijiang River Basin, located in the northern part of Guangdong Province, not only provides abundant natural resources for local economic development, but also plays a crucial role in ecological protection [39,40]. The basin is rich in water resources, which supply essential water for agriculture, industry, and urban development, while facing multiple pressures from rapid urbanization, agricultural expansion, and climate change [41]. These factors have led to significant changes in land use within the Beijiang River Basin, profoundly impacting the health of its ecosystems. As urbanization accelerates, agricultural land is being converted into urban development areas, resulting in a reduction in ecological lands such as forests [42]. With population growth and economic development speeding up, the challenge of rational land use and ecological protection has become urgent. Current research related to the Beijiang River Basin mainly focuses on using remote sensing technology and Geographic Information Systems (GIS) to monitor and analyze land use changes. Researchers, such as Li Jianqing and colleagues, have investigated hydrological responses under different extreme land use allocation scenarios in the Beijiang Basin, but have not considered the multiple impacts of human and natural factors on land use changes [43]. Li Ming employed a CA–Markov model to simulate future land use changes in the Beijiang River Basin, yet did not account for the effects of multidimensional ecological constraints on future simulations [44]. These studies typically examine the spatial distribution of land use changes and their driving factors, particularly in the context of urbanization and agricultural expansion, as well as the environmental impacts of land use type conversions. However, there are deficiencies in this field, especially regarding the construction of ecological constraints and the exploration of future land use simulations [45]. The existing research has revealed the diversity and complexity of land use changes, but studies on watershed ecological constraints remain weak. Additionally, research specifically focused on land use simulation in the Beijiang River Basin is relatively scarce, making systematic multi-scenario land use analysis crucial for regional ecological protection [46]. Therefore, future studies should pay more attention to ecological constraints in the basin, developing integrated ecological models that combine remote sensing and GIS technologies for systematic land use simulations. This approach can help us to identify the potential risks associated with land use changes and provide scientific decision-making support for sustainable development within the basin [47]. Furthermore, a comprehensive assessment of the watershed ecosystem, clarifying ecological constraints, will provide a stronger foundation for land use policy formulation, ensuring a balance between economic development and ecological protection [48]. This study takes the Beijiang River Basin in Guangdong Province as an example, using high-precision geographical data combined with ecological constraints to simulate the future land cover situation in the basin for 2050. It explores the spatiotemporal changes and development trends of ecological land use, proposing relevant measures and scientific methods for ecological environmental protection in the Beijiang River Basin.

2. Materials and Methods

2.1. Research Area

The Beijiang River, which rises near Shijie in Xinfeng County, Jiangxi Province, is a component of the Pearl River system. The northern region of Guangdong Province is home to the Beijiang River Basin and its sub-basins, as shown in Figure 1. It flows between the Nanling Mountains and the Pearl River Delta Plain. The main stream above Sixianjiao is 468 km long, with a basin area of 46,710 km2. The majority of the basin consists of mountainous and hilly regions, with the north having higher terrain and the south having lower terrain. The river’s middle sections are rather straight, and, after exiting Feilaixia, the terrain gradually flattens, eventually connecting with the Pearl River Delta Plain. The total elevation drop is 305 m, and the average channel gradient is 0.26%. The Beijiang River Basin is significantly influenced by the monsoon, resulting in a warm and humid climate. The region has ample sunshine and abundant solar thermal resources, making it very suitable for agricultural and ecological development. The suitable temperature in the watershed provides favorable conditions for plant growth and ecosystem stability. In terms of water resources, the primary source of runoff in the Beijiang River Basin is precipitation, with a long-term average annual rainfall of 1800 mm. This level of rainfall is crucial for maintaining the water supply in the basin, supporting agricultural irrigation, industrial water use, and the needs of the residents. This water reduction not only meets the needs of the local ecosystem, but also provides important guarantees for agricultural irrigation and water resource management. The rainfall gradually decreases from south to north, ranging from 1300 to 2400 mm. The variation range of land surface evaporation is between 600 and 800 mm, with less evaporation in the northwest and more evaporation in the southeast.

2.2. Data Sources

This study mainly utilized the datasets shown in Table 1. The DEM data come from geographic spatial data clouds (https://www.gscloud.cn/) (accessed on 10 June 2024). The soil data, meteorological data, and land use data were retrieved through the National Geographic Condition Monitoring Cloud Platform(http://www.resdc.cn/) (accessed on 12 June 2024) and were newly classified into six types of land use. The traffic data (roads, railways, etc.) are provided by OpenStreetMap (https://www.openstreetmap.org/) (accessed on 20 June 2024).

2.3. Research Methodology

2.3.1. Spatiotemporal Pattern Analysis of Land Use/Cover Change

(1) The land use transition matrix quantifies the changes and shifts among various land use categories over a specified study period for a given region. The formula for calculating this matrix is as follows:
S i j = S 11 S 12 S 1 n S 21 S 22 S 2 n S n 1 S n 2 S n n
In the formula, n stands for the number of land use types. The symbols i, j, and (j = 1, 2, ∙∙∙, n) denote the initial and last land use categories throughout the study period, respectively. S i j represents the area of land that was moved from category i to category j.
(2) The dynamic degree of land use quantitatively reflects the amount and rate of change in various land use categories. It is used to look at the overall changes and structural trends of various land use types. The dynamic degree of a single land use category may be found using the following formula:
K = U b U a U a × 1 T × 100 %
In the formula, K represents the dynamic degree of a certain land use type in the research area over the study period, whereas U a and U b represent the land cover type’s areas at the beginning and end of the study period, respectively. T represents the study time, which in this study is 10 or 40 years. While T = 40 is utilized for the long-term research from 1980 to 2020, T = 10 is used for studies with several segments. The following is a thorough formulation for the dynamic degree of land use:
S = i = 1 n U b i U a i 2 × i = 1 n U a i × 1 T × 100 %
The area of the i-th land use type at the beginning and end times is denoted by U a i and U b i in the formula, respectively; and S is the degree of dynamic change in particular land use types throughout the course of the study. The study period is denoted by T, which in this study is 10 or 40 years. T = 10 is used for multiple short-term studies, while T = 40 is used for the long-term study from 1980 to 2020.

2.3.2. Construction of Ecological Constraints (ES)

This study explores the modeling of land use change from the perspective of watershed ecological protection and introduces a model related to ecological constraints called the ES-PLUS model. The specific research process is shown in Figure 2. Firstly, a comprehensive assessment of ecosystem services was conducted to establish the concept of ecological constraints. This assessment considers various services provided by ecosystems, such as water resource conservation, biodiversity conservation, and carbon storage, while analyzing the significance of these services in the context of land use change. In order to deepen our understanding of ecosystem structure and function, we employed circuit theory and morphological spatial pattern analysis (MSPA) methods, while integrating various cumulative resistance thresholds to generate three different levels of ecological constraints. These constraints not only reflect the diversity of the ecological environment, but also its complexity and dynamic changes. Subsequently, this study combined these ecological constraints with corresponding simulation scenarios to establish four different land use simulation scenarios for the future.
Ecological sources and ecological corridors constitute ecological constraints. This study used a combination of importance assessment, landscape connectivity analysis, and morphological spatial pattern analysis (MSPA) to conduct a detailed evaluation of four key ecosystem service functions. These functions include habitat quality (HQ), water resource conservation (WC), carbon storage (CS), and soil conservation (SC). Subsequently, these selected services are stacked and assigned equal weights to ensure that each service contributed equally to the overall assessment. Next, the comprehensive ecosystem service functions of the watershed were divided into five different levels (1–5). Secondly, the fourth and fifth level regions were analyzed using the Guidos toolkit for MSPA. Conefor 2.6 imports core patches discovered by MSPA to determine connectivity. Finally, patches with dpc > 1 were selected as ecological sources [49]. The following are the procedures used to calculate each ecosystem service function:
  • Habitat Quality
The objective of this study is to utilize the habitat quality module of the InVEST model to create a detailed habitat quality map for the Beijiang River Basin. This module has powerful analytical capabilities, allowing for an in-depth assessment of current land use and cover conditions, thereby revealing the specific impacts of different land types on habitat quality. Through this analysis, we can identify areas with high ecological value, as well as those that may face ecological threats. Furthermore, the resulting habitat quality map will serve as an intuitive reference tool for decision makers and managers, thereby providing in-depth insights into habitat quality [50]. Specifically, the research first collects and organizes relevant data, vegetation cover, and potential ecological threats, such as urban expansion and agricultural activities. This model generates a spatial distribution map that reflects habitat quality by considering multiple influencing factors. This visualization not only helps us to identify the current health status of the habitats, but also reveals potential ecological risks. The following is the specific formula used to assess habitat quality:
Q x j = H j 1 D x j 2 D x j 2 + K z
The habitat quality index for land use grid x is defined as Q x j . The calculation of this index relies on the habitat quality H j for type j, indicating the degree of suitability for organisms in that habitat. In the model, the normalization constant z is typically set to 2, while K is generally set to half of the maximum habitat decline value. The correct selection of these parameters is crucial for accurately calculating habitat quality. When performing the model calculations, the primary data required by this module cover various aspects, including land use and cover types, key risk factors, and influence distances. Additionally, sensitivity parameters of land use/cover to different habitat quality threat sources are important inputs. The accuracy and comprehensiveness of these data directly determine the reliability of the calculated habitat quality index. To ensure the rationality and effectiveness of the selected parameters, this study draws on the earlier related research findings to make detailed adjustments and optimizations to the parameters. The parameter settings are presented in Table 2 and Table 3, aimed at helping readers to better understand the operational mechanisms of the model and the sources of data. The following is the formula used to calculate habitat degradation:
D x j = r = 1 R y = 1 y r W r r = 1 R W r r y i r x y β x S j r
i r x y = 1 d x y d r m a x
i r x y = e x p 2.99 d x y d r m a x
In this study, multiple variables are utilized to assess habitat degradation and its relationship with threat factors. Specifically, D x j represents the habitat degradation index calculated for a specific land use grid x, reflecting the health status of the habitat within that grid. Additionally, the geographical influence of threats and the distance between habitats and threat sources are represented by i r x y . This indicator helps us to quantify the spatial distribution and impact of threats. Under different conservation strategies, the variable β x serves as a key factor aimed at reducing the impact of threats on habitats. Specifically, the degree of legal protection affects the value of this coefficient, as follows: within legally protected areas, β x is set to 0, while in other areas, it is set to 1, indicating the effectiveness of the protective measures. The sensitivity of habitat type j to threat factor r is represented by S j r , which reveals the vulnerability of different habitat types to specific threats. By integrating these calculated indicators, a comprehensive score can be calculated.
2.
Water Source Conservation
The water yield module is a water-balance-based estimating technique that may take into account regional water yield in a variety of circumstances [51]. The following is the precise formula:
R e = 1 T I × min 1 ,   T r a v T i m e 25 × min 1 , K s a t 300 × Y x j
Re is the water conservation amount (mm) in the formula, and Ksat is the soil saturation hydraulic conductivity (mm/d), which is determined by the characteristics of the soil texture; Y x j is the water yield, computed using Formula (9); and TravTime refers to the time it takes for runoff to travel a specific distance, measured in minutes. This time is calculated by dividing the slope length by the flow velocity coefficient. Specifically, the slope length represents the distance that water travels downhill, while the flow velocity coefficient reflects how quickly the water moves across that slope. The dimensionless topographic index, or TI, is determined using Formula (10).
Z x j = 1 A E T x j P x j × P x j
T I = lg D r a i n a g e a r e a S s o i l D e p t h × P r e c e n t S l o p e
In this study, D r a i n a g e a r e a refers to the dimensionless indicator of the watershed grid, used to represent the water flow collection capacity of a specific area. This indicator is crucial for understanding hydrological processes and their impact on the environment. S s o i l D e p t h indicates soil depth, measured in millimeters (mm), and is an important parameter for assessing soil characteristics and moisture retention capacity. Soil depth directly affects the growth of plant roots and the infiltration of water, thereby influencing the health and productivity of ecosystems. Additionally, P r e c e n t S l o p e represents the slope as a percentage, which is a key indicator for measuring terrain steepness. Changes in slope can affect the speed and direction of water flow, which in turn impacts soil conservation and the degree of erosion. Understanding these three parameters is essential for hydrological modeling and the development of effective land management strategies, these indicators collectively influence the water cycle and land use planning.
3.
Storage of Carbon
The process by which plants transform inorganic carbon through photosynthesis is known as carbon storage, and it may be roughly measured using net primary productivity (NPP). NPP is computed using the CASA model, and the formula is as follows:
N P P x , t = A P A R x , t × ε x , t
In the formula, N P P x , t represents the net primary production capacity of surface plants at grid x during time period t (gC m−2 a−1); A P A R x , t is the absorbed photosynthetically active radiation by vegetation at grid x during time period t; and ε x , t is the light-use efficiency of vegetation at grid x during time period t.
4.
Soil Retention
The calculation of soil conservation in the Beijiang River Basin adopts the InVEST model, which fully accounts for how vegetation can reduce surface runoff erosion and capture upslope silt [52]. It posits that the soil retention amount of a given raster cell is the sum of erosion reduction and soil retention [53].
Scientifically extracting potential ecological corridors and nodes requires the construction of a sufficiently detailed resistance surface [54]. The various obstacles encountered by species during migration are reflected on the ecological resistance surface. High resistance values indicate greater difficulty in moving into the area. This study selected the following five indicators to construct the resistance surface: NDVI, slope, altitude, land cover type, and distance from the river [55,56]. The Analytic Hierarchy Process (AHP) is used to calculate the weights of each different factor, and consistency tests are used to confirm the division of resistance values, which refers to pertinent research. Table 4 displays the weights and resistance values for each component. The comprehensive resistance surface of the Beijiang River Basin is ultimately obtained through weighted summation.
Ecological corridors are strip-shaped areas with specific widths that facilitate the flow of species, energy, and information within ecosystems [57]. They enhance the connectivity and stability between natural habitat patches, serving as the primary pathway for species migration and a key component of ecological constraints [58]. Linkage Mapper software is based on circuit theory principles and is used to calculate ecological corridors, ecological nodes, and barriers to construct regional ecological constraints. By analyzing ecological corridors and identifying obstacles, the potential threats posed by human activities or natural factors to species migration can be revealed.

2.3.3. Establishment of ES-PLUS Model Based on Ecological Constraints

The ES-PLUS model consists of the following three core components: an improved cellular automata (CA) model for spatial distribution, a land cover quantity prediction module based on the Markov chain model, and ecological constraints. This model is designed to comprehensively consider the dynamic changes in land cover and the limitations imposed by the ecological environment, aiming to achieve more accurate predictions and planning for land use. For the land use quantity prediction module, this study combines existing land use type data with a Markov chain model to predict the future quantity of land use types under different development scenarios. By conducting an in-depth analysis of historical land use data from 1980 to 2020, the model is able to identify patterns and trends in land use conversion. This identification helps us to understand past land use changes and provides valuable insights for future planning. Specifically, the model effectively captures the dynamic characteristics of land use changes by considering the transition probabilities between different land use states at various time points. Through the analysis of historical data, the model can not only reveal the growth or decline of specific land use types, but also identify the main driving factors influencing land use transitions. At the same time, the spatial distribution simulation module employs a random forest classification algorithm to analyze the reasons for the expansion of land use types in different periods. This process generates probability distribution for the future development of different land use types, reflecting potential trends in land cover change. Finally, the CARS module conducts a comprehensive simulation analysis by integrating the land cover cost matrix, neighborhood weights, current land use conditions, and various development scenarios along with ecological constraints. These results provide decision makers with visual information, supporting the development of more sensible land use regulations and ecological protection strategies, thereby promoting economic development while safeguarding the ecological environment.

2.3.4. Multi-Scenario Simulation of Future Land Use Based on ES-PLUS Model

This study has created four land use change simulation scenarios in order to accomplish the coordinated development of ecological preservation, urbanization, and economic growth, as well as to create a model of peaceful cohabitation between humans and the environment. The model validation adopts the Kappa coefficient and overall accuracy. To project land use demands for 2050, this study employs a Markov model to analyze historical land use changes, forecast future trends, and assess the effects of various policies and development technologies. This methodology underpins scientific land management and conservation efforts, enhancing decision-making processes for sustainable development. In the Natural Development Scenario (NDS), conversion probabilities across different land types remain constant. Conversely, the Economic Development Scenario (EDS) prioritizes urban expansion, thereby increasing the conversion of ecological land for construction purposes. Between 2010 and 2020, farmland emerged as the predominant source for construction land, with conversion probabilities for farmland, forests, and grasslands rising by 60%, 40%, and 30%, respectively. The Ecological Maintenance Scenario (EPS) focuses on ecological conservation, resulting in a 40% reduction in the conversion of ecological land to construction, while simultaneously increasing the likelihood of converting built-up land into other land types by 20%. The Comprehensive Development Scenario (CDS) seeks to reconcile ecological preservation with economic growth by adjusting conversion probabilities across various land types. Overall, the CDS framework fosters economic development while safeguarding ecological functions, facilitating a more balanced approach to land use planning that aligns with the principles of sustainable development.

3. Results

3.1. Spatiotemporal Analysis of Land Cover Change in the Beijiang River Basin from 1980 to 2020

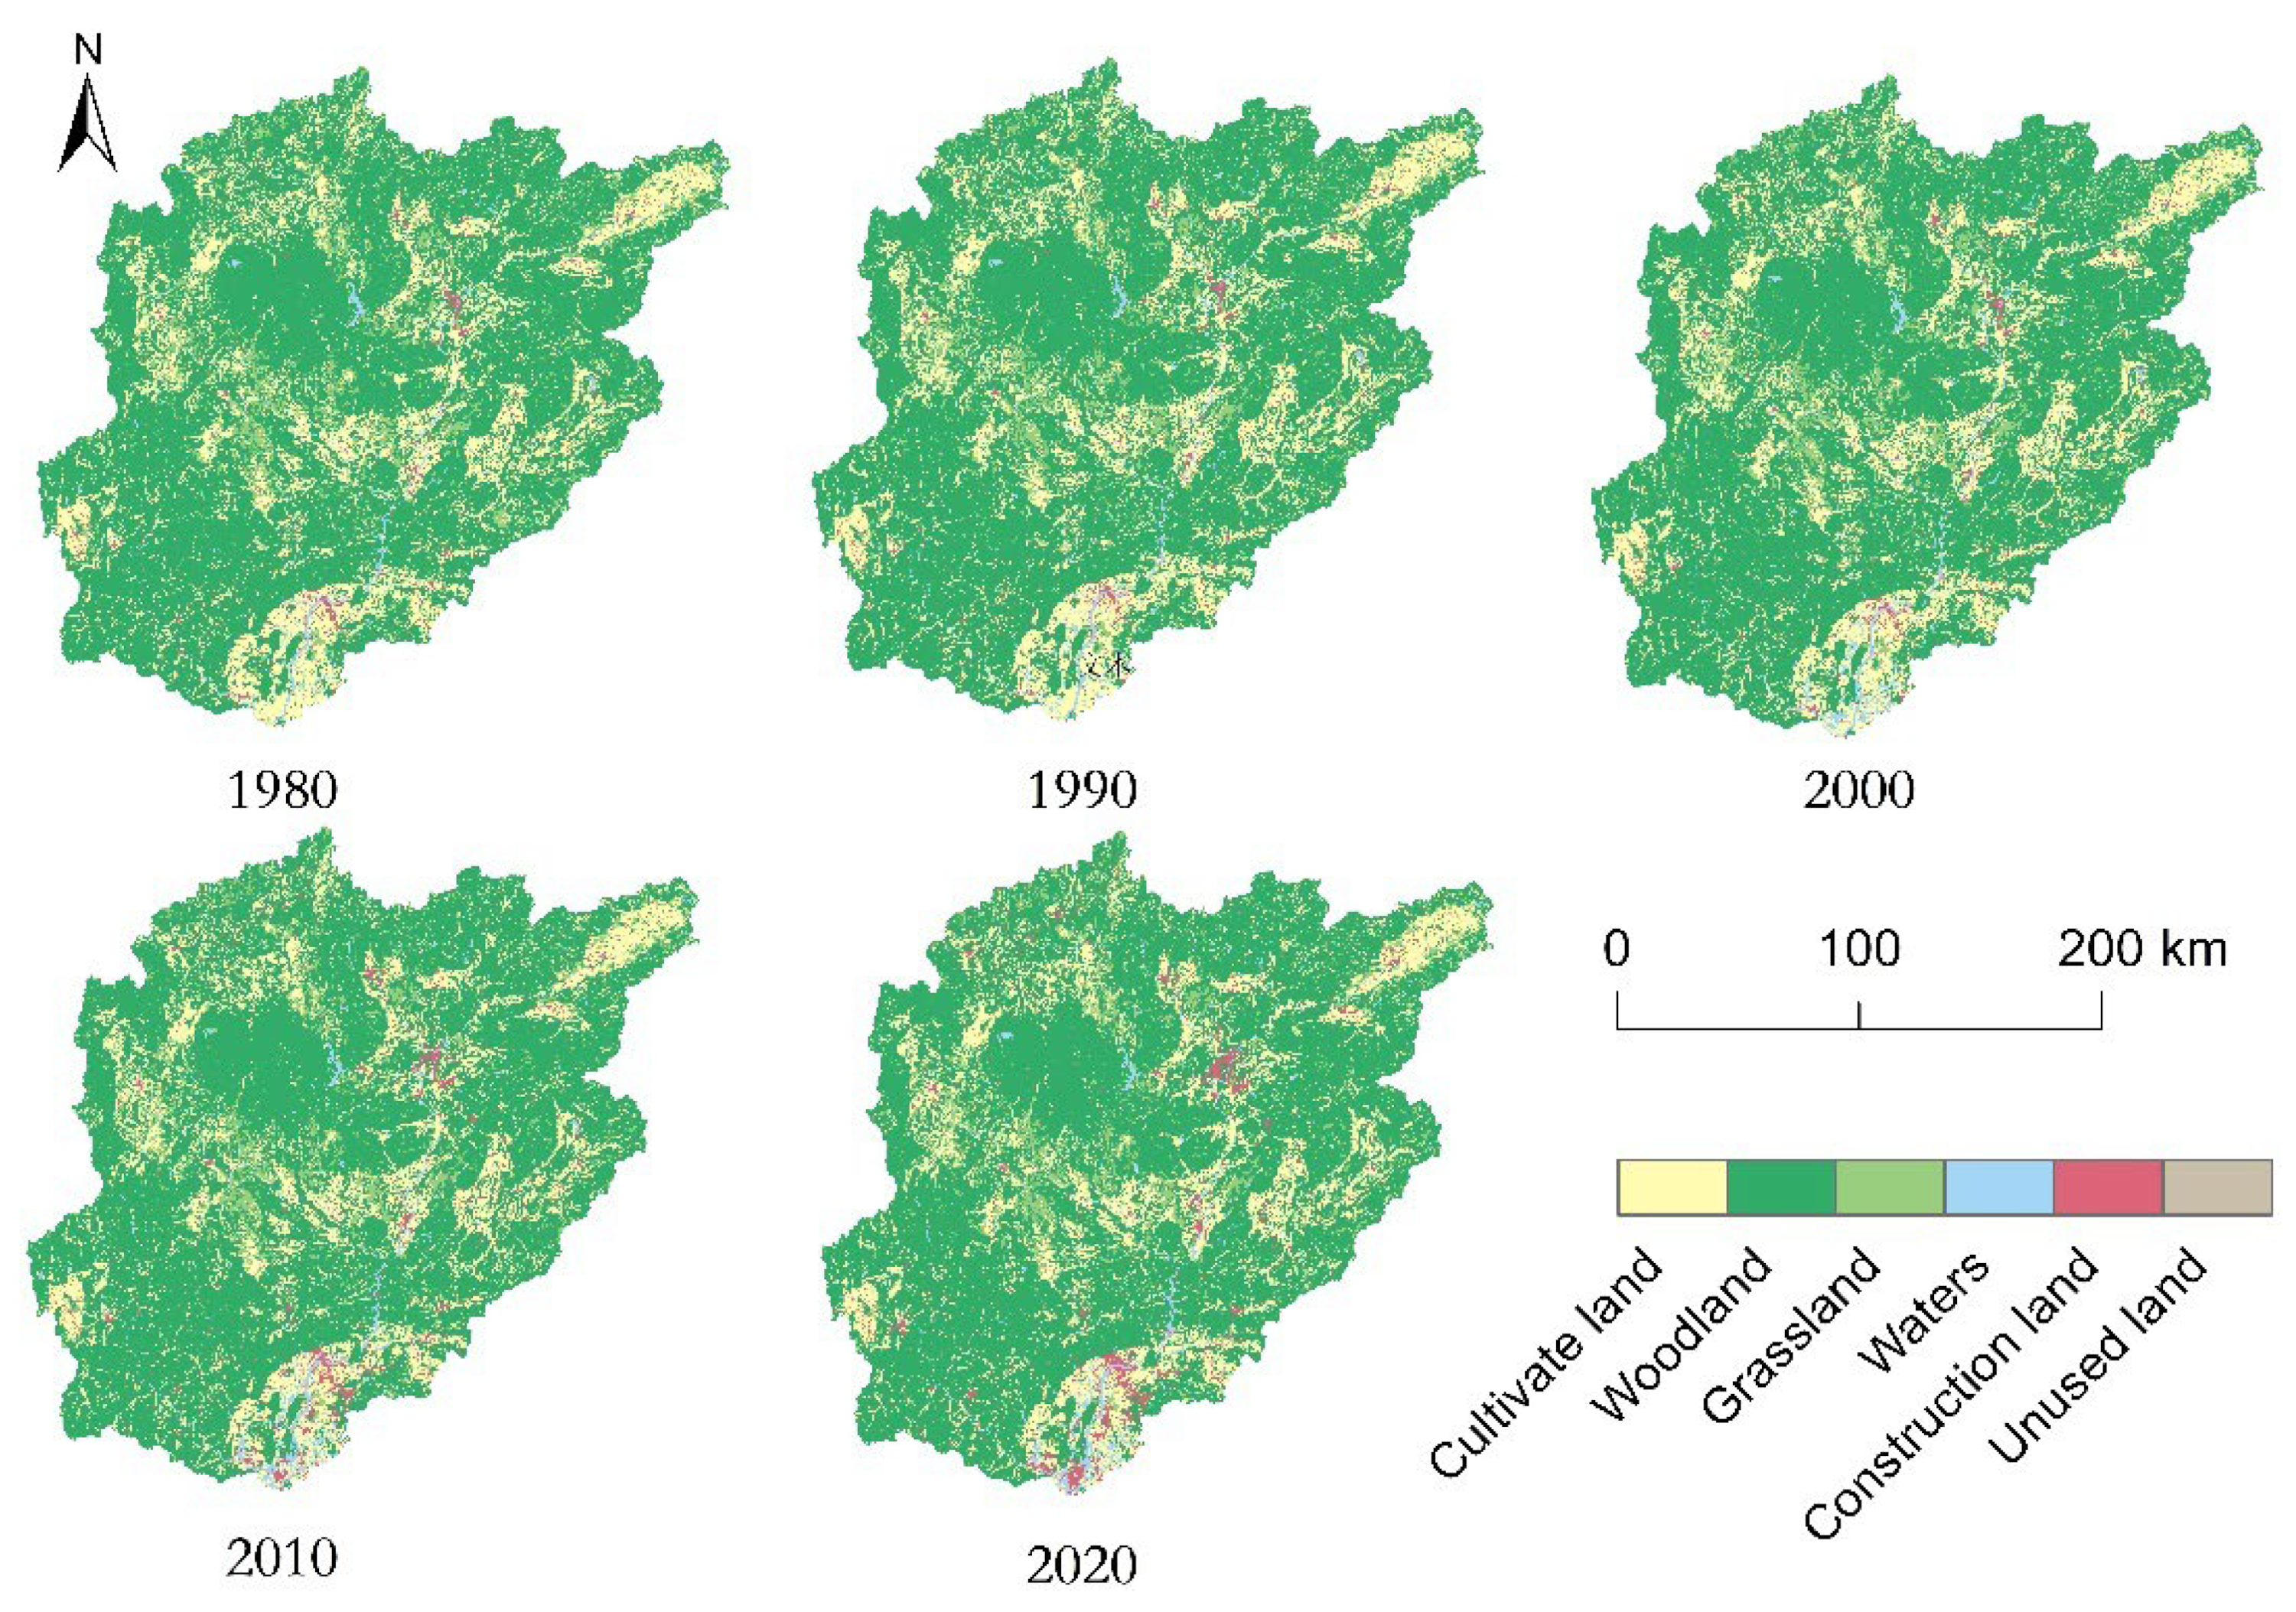
3.1.1. Spatiotemporal Distribution Characteristics of Land Use

The land use data of the Beijiang River Basin from 1980 to 2020 (see Figure 3 and Table 5) indicate that forest land has the highest proportion, mainly distributed in high-altitude mountainous areas. In contrast, the areas of water bodies, construction land, and unused land are relatively small. Cultivated land is primarily concentrated in the eastern part of the basin, such as in Nanxiong, Shixing, Wengyuan of Shaoguan City, and Yingde of Qingyuan City, showing a patchy distribution. Grassland is mainly located in the central and northwestern parts, such as Yizhang and Linwu counties in Chenzhou City, Hunan Province. From 1980 to 2020, the distribution of grassland became more concentrated, with reduced patchiness, while construction land mostly appeared in small areas along riverbanks. Overall, cultivated land, forest land, and grassland are the main types of land use, with water bodies and wetlands distributed along the main and tributary streams of the Beijiang River, and bare land is minimal. The extensive distribution of forest land helps in forming ecological sources and maintaining the connectivity of ecological corridors. However, the expansion of construction land leads to the fragmentation of natural ecosystems, threatening the integrity of ecological sources and reducing the connectivity of ecological corridors.

3.1.2. Dynamic Analysis of Land Use

As shown in Table 6, the overall comprehensive land use dynamic degree in the Beijiang River Basin from 1980 to 2020 was relatively low, at 0.18%, showing a trend of first increasing and then decreasing. From 1980 to 2000, the comprehensive land use dynamic degree slowly rose to 0.09%, and, from 2010 to 2020, it began to decrease to 0.05%. During the period from 1980 to 2020, cultivated land, forest land, and grassland decreased by 547.978 km2, 86.2992 km2, and 191.967 km2, respectively, with single dynamic degrees of −0.6%, −0.03%, and −0.74%, respectivley. In contrast, water bodies, construction land, and unused land increased by 240.92 km2, 581.90 km2, and 2.82 km2, respectively, with single dynamic degrees of 2.58%, 4.5%, and 5.67%, respectivley. Among these, unused land had the highest single land use dynamic degree.

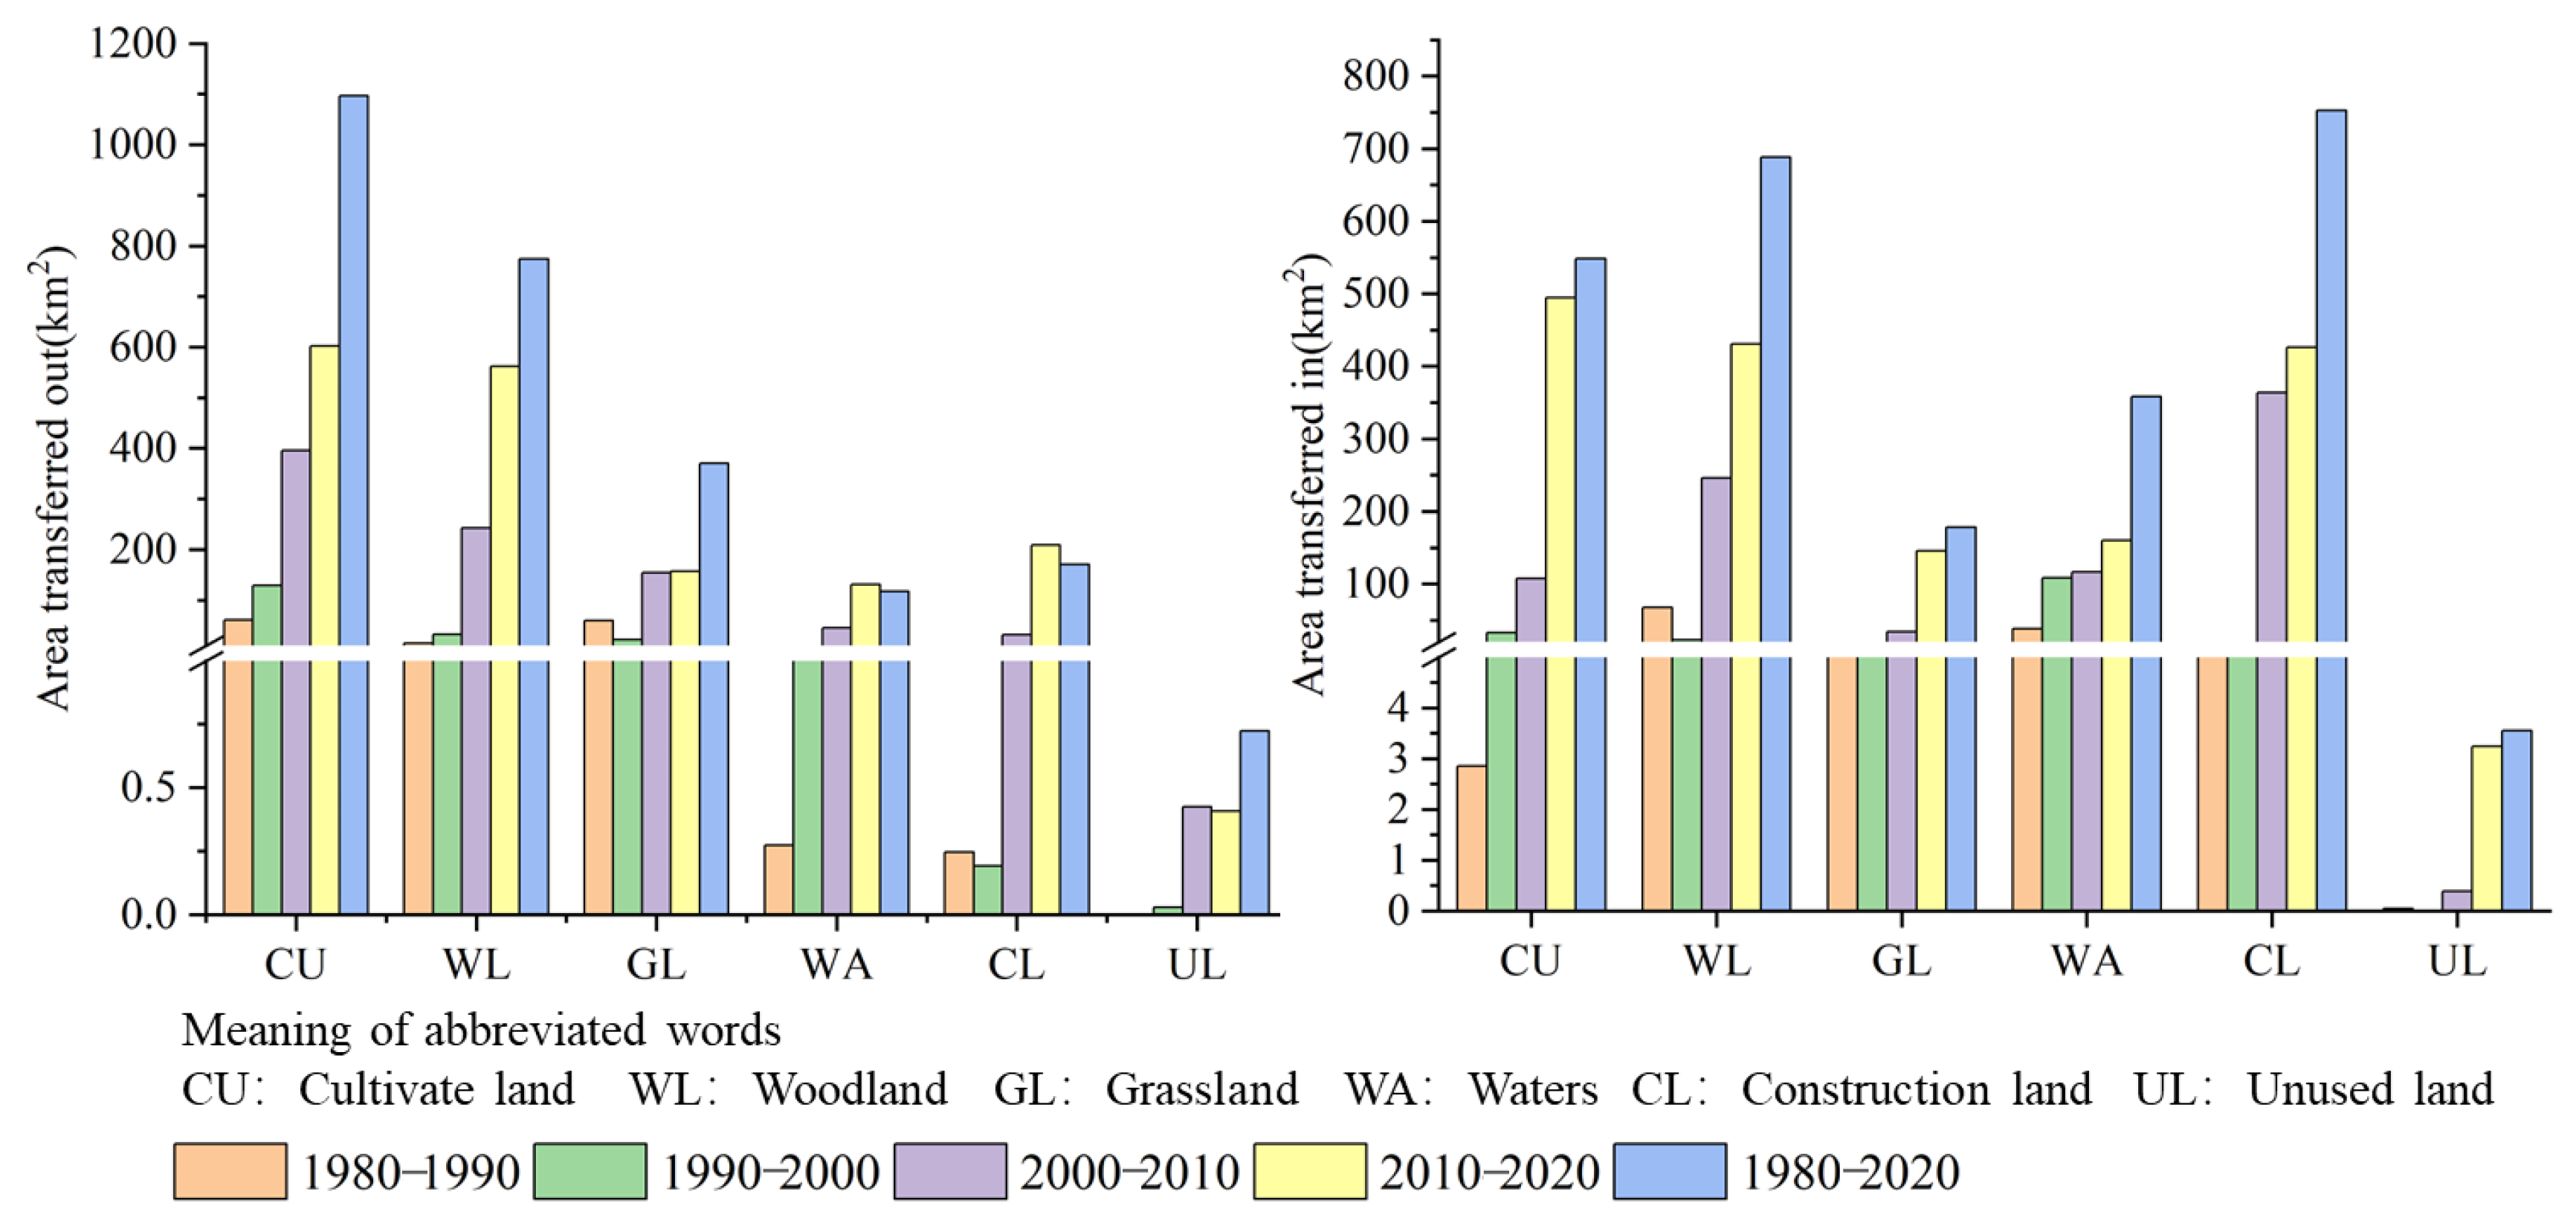
3.1.3. Analysis of Land Use Transition

As indicated in Table 7, the primary land use types that were transferred out in the Beijiang River Basin between 1980 and 2020 were grassland, forest land, and cultivated land, with transfer-out areas of 1096.38 km2, 773.79 km2, and 370.13 km2, accounting for 43.35%, 30.60%, and 14.64% of the total transfer-out area, respectively. The main land use types transferred in were construction land, forest land, cultivated land, and water bodies, with transfer-in area proportions of 29.77%, 27.20%, 21.68%, and 14.15%, respectively. Of the construction land transfer-in area, 57.67% came from cultivated land, 31.94% from forest land, 6.69% from grassland, and 3.67% from water bodies. Construction land, forest land, and water made up 39.59%, 34.18%, and 22.62% of the transfer-out area of the cultivated land, respectively, reflecting the impact of reforestation and urban development on cultivated land use. Figure 4 displays the land use type transfer areas for each of the 1980–2020 time periods. There were notable variations in the transfer volumes of different land categories by 2010. The Beijiang River Basin’s urbanization trend quickened at this time, with continuous increases in construction land and decreases in ecological land. Therefore, it is necessary to find scientific land optimization measures, such as establishing varying degrees of ecological constraints as development background conditions, to explore strategies for protecting ecological land amid rapid economic development in the future.

3.2. Analysis of Ecological Constraint Construction Results

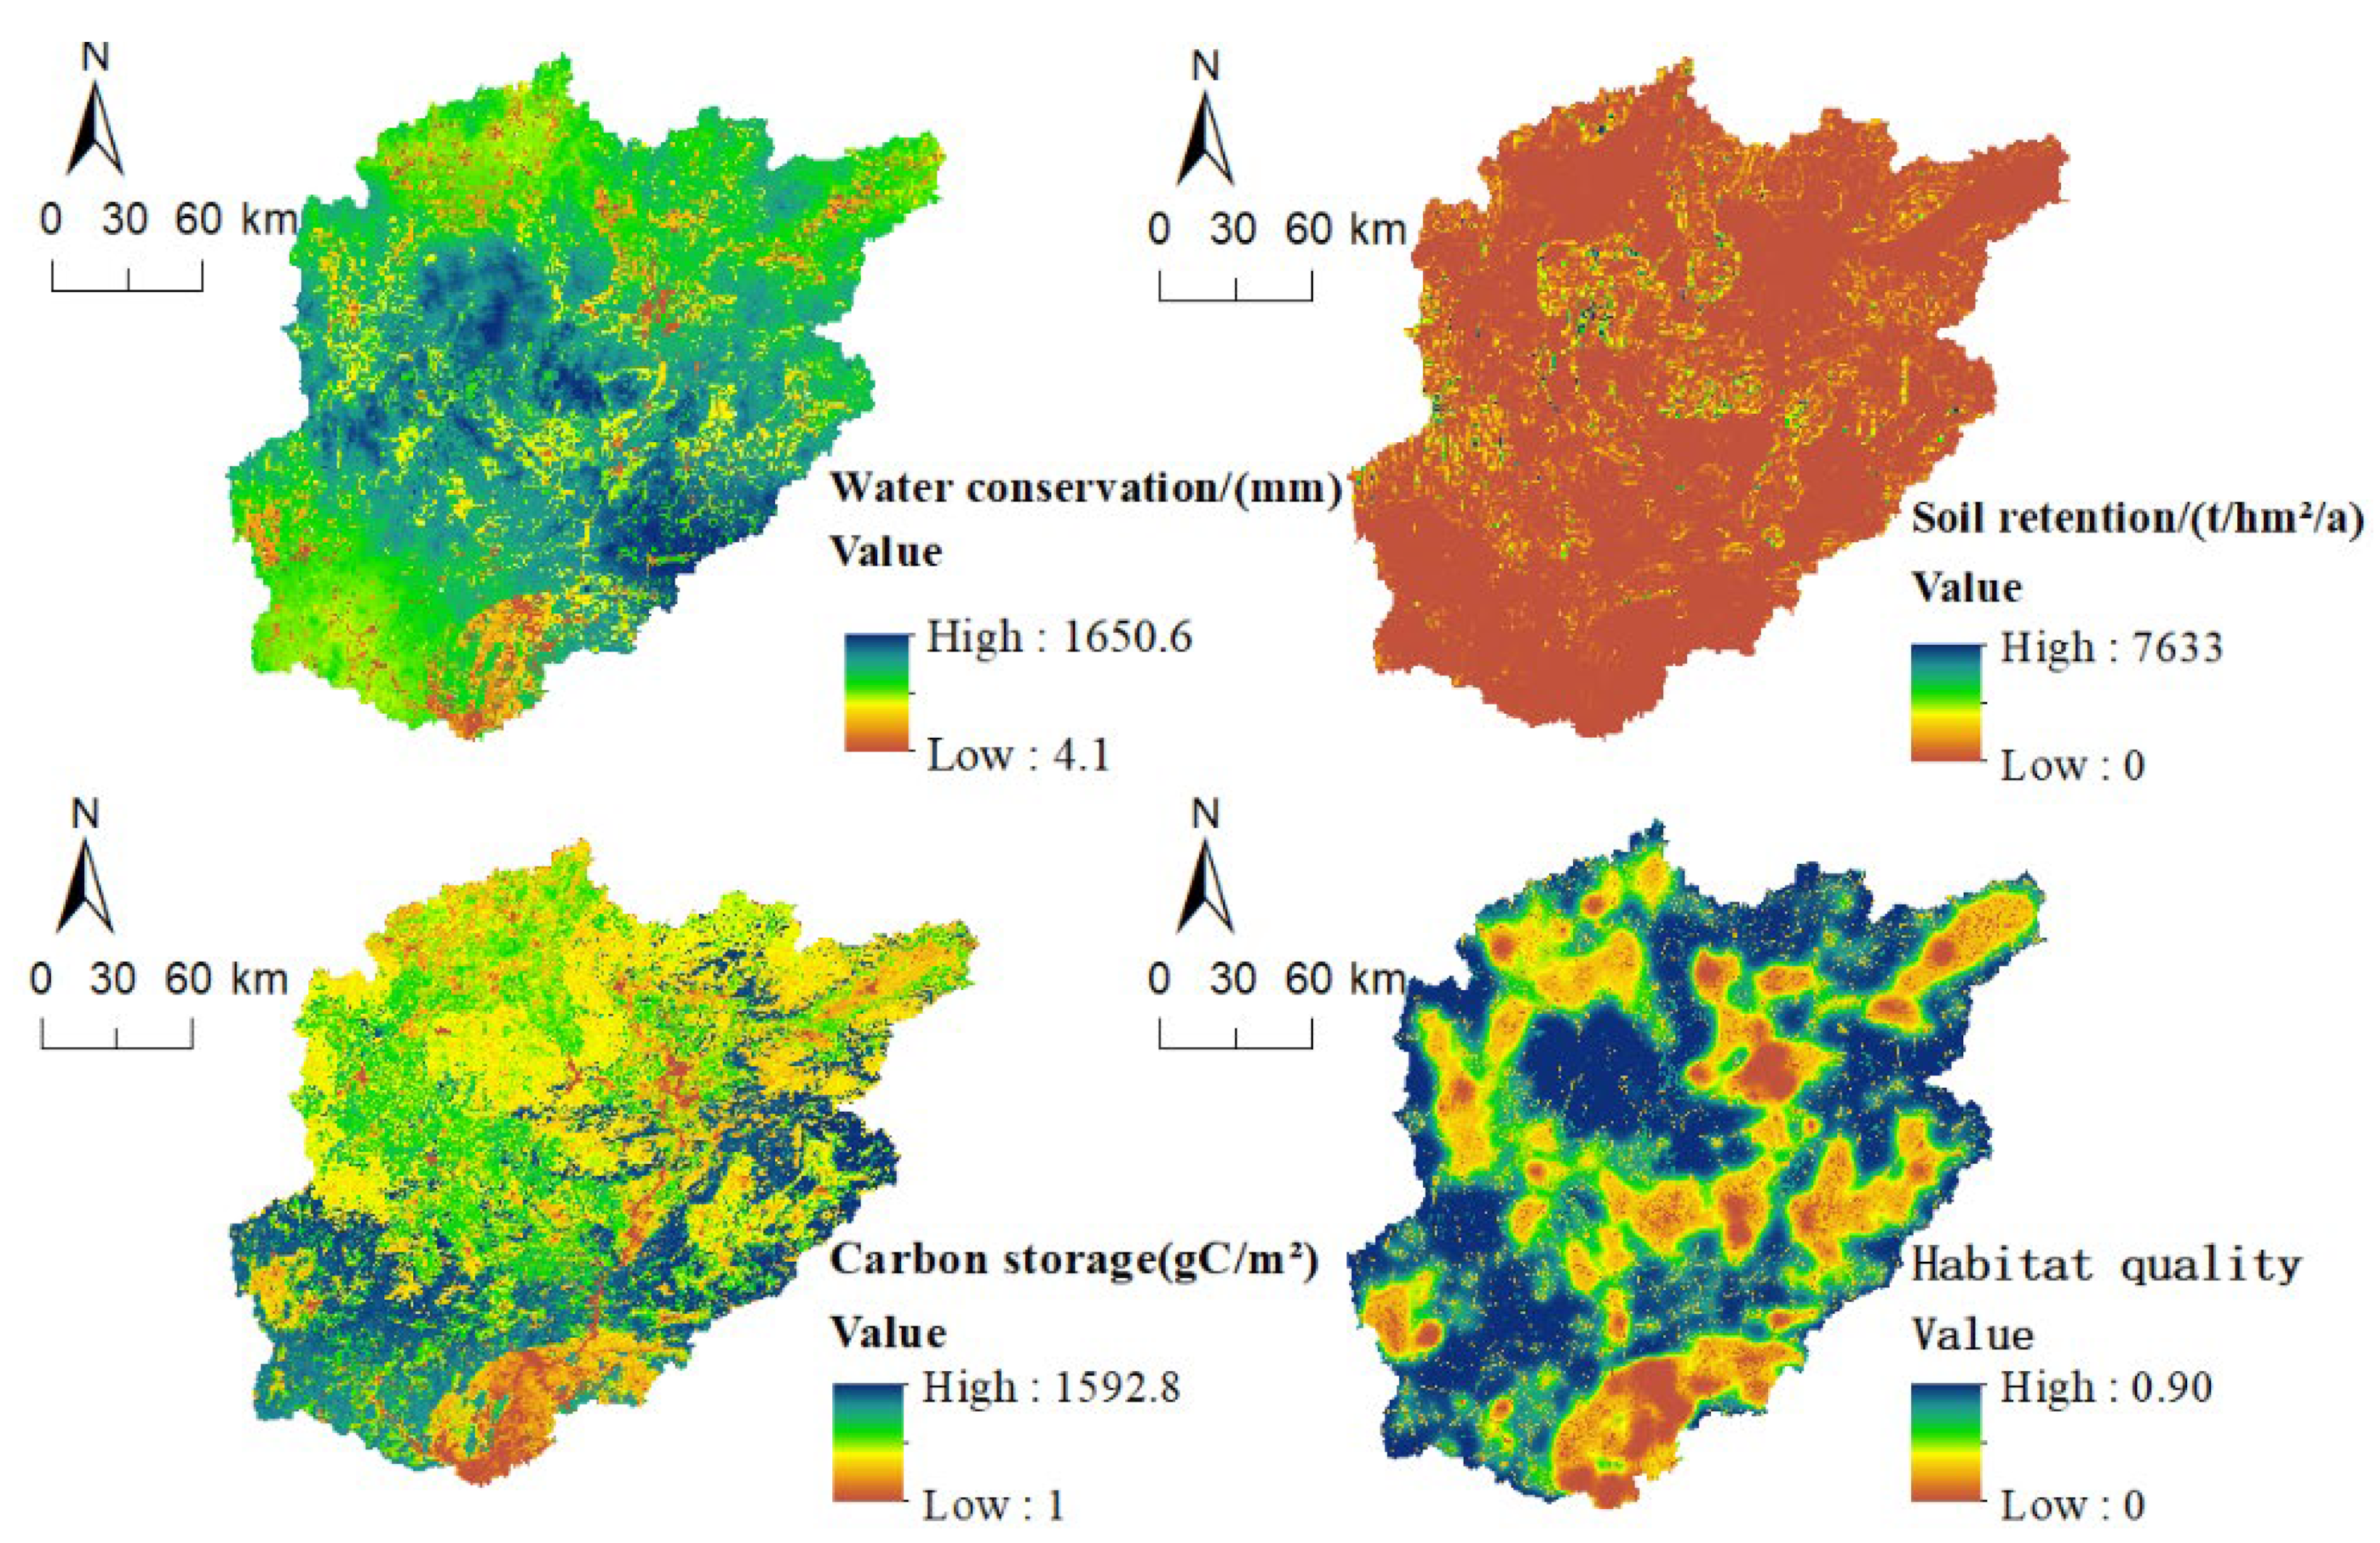
3.2.1. Spatial Patterns of Ecosystem Services and Ecological Sources

The spatial distribution of different ecosystem services in the Beijiang River Basin demonstrates the impact of different biological processes on regional ecological security (see Figure 5). The northern regions of the Jinjiang, Suijiang, and Lianjiang River Basins are areas with high habitat quality, and human activities have little impact on these areas. Areas with high water-saving value have emerged in the northeast of the Lianjiang Basin and the southwest of the Wenjiang Basin, characterized by high altitude, limited arable land, and dense natural forests, effectively intercepting precipitation losses. The low-value areas are mainly concentrated in the southwest of the Suijiang Basin, with extensive distribution of construction land and cultivated land. The low-value area is located in the western part of the Zhenjiang Basin and the southern part of the main stream of the Beijiang River, and is greatly affected by human activities, while the high-value area is located in the southern part of the Wujing Basin and the northern mountainous area of the Suijiang Basin, with extremely high vegetation coverage. The overall carbon storage is relatively high, with high-value areas located in the northwest of the basin, abundant rainfall, and lush vegetation, while low-value areas are located in the south and along the sub-basin. The total area of core ecological source patches is 13,149.96 km2, accounting for 28.46% of the study area.

3.2.2. Construction of Ecological Constraints Under Three Cumulative Resistance Thresholds

This study establishes different degrees of ecological constraints as background conditions for future land use development in the Beijiang River Basin. The cost of ecosystem service flow in the Beijiang River Basin is represented by a comprehensive resistance surface created by weighted superposition. The southern part of the watershed is the area with the highest concentration of high resistance values and active socio-economic development. The low-resistance areas are distributed in sparsely populated forest areas. This study successfully generated 78 lowest cost paths connecting the ecological core area using the LinkageMapper tool, with a total length of 878.9 km. These low-cost pathways represent the optimal paths for species migration and gene flow, while considering ecological resistance factors, effectively enhancing the connectivity of the ecosystem. Based on the minimum width required for bird conservation (BES), enriched landscape structure (SES), and animal habitat (IES), the thresholds were adjusted to 1000, 2400, and 3200, respectively, and buffer zones were set to 100 m, 300 m, and 600 m, respectively, resulting in three different types of ecological constraints (see Figure 6). The research results indicate that, as the cumulative threshold increases, the spatial distribution of ecological corridors does not change significantly, but the width and area of the corridors greatly increase, improving the stability of the ecological boundaries. We should esnure that the buffer zone area of the ecological source does not exceed 20% of the original ecological core area. Table 8 shows the area information of different levels of ecological sources and corridors. These three ecological constraints will serve as limiting factors, combined with four development scenarios in the Beijiang River Basin, to simulate future land cover changes.

3.3. Land Use Analysis of the Beijiang River Basin Under Multiple Scenarios

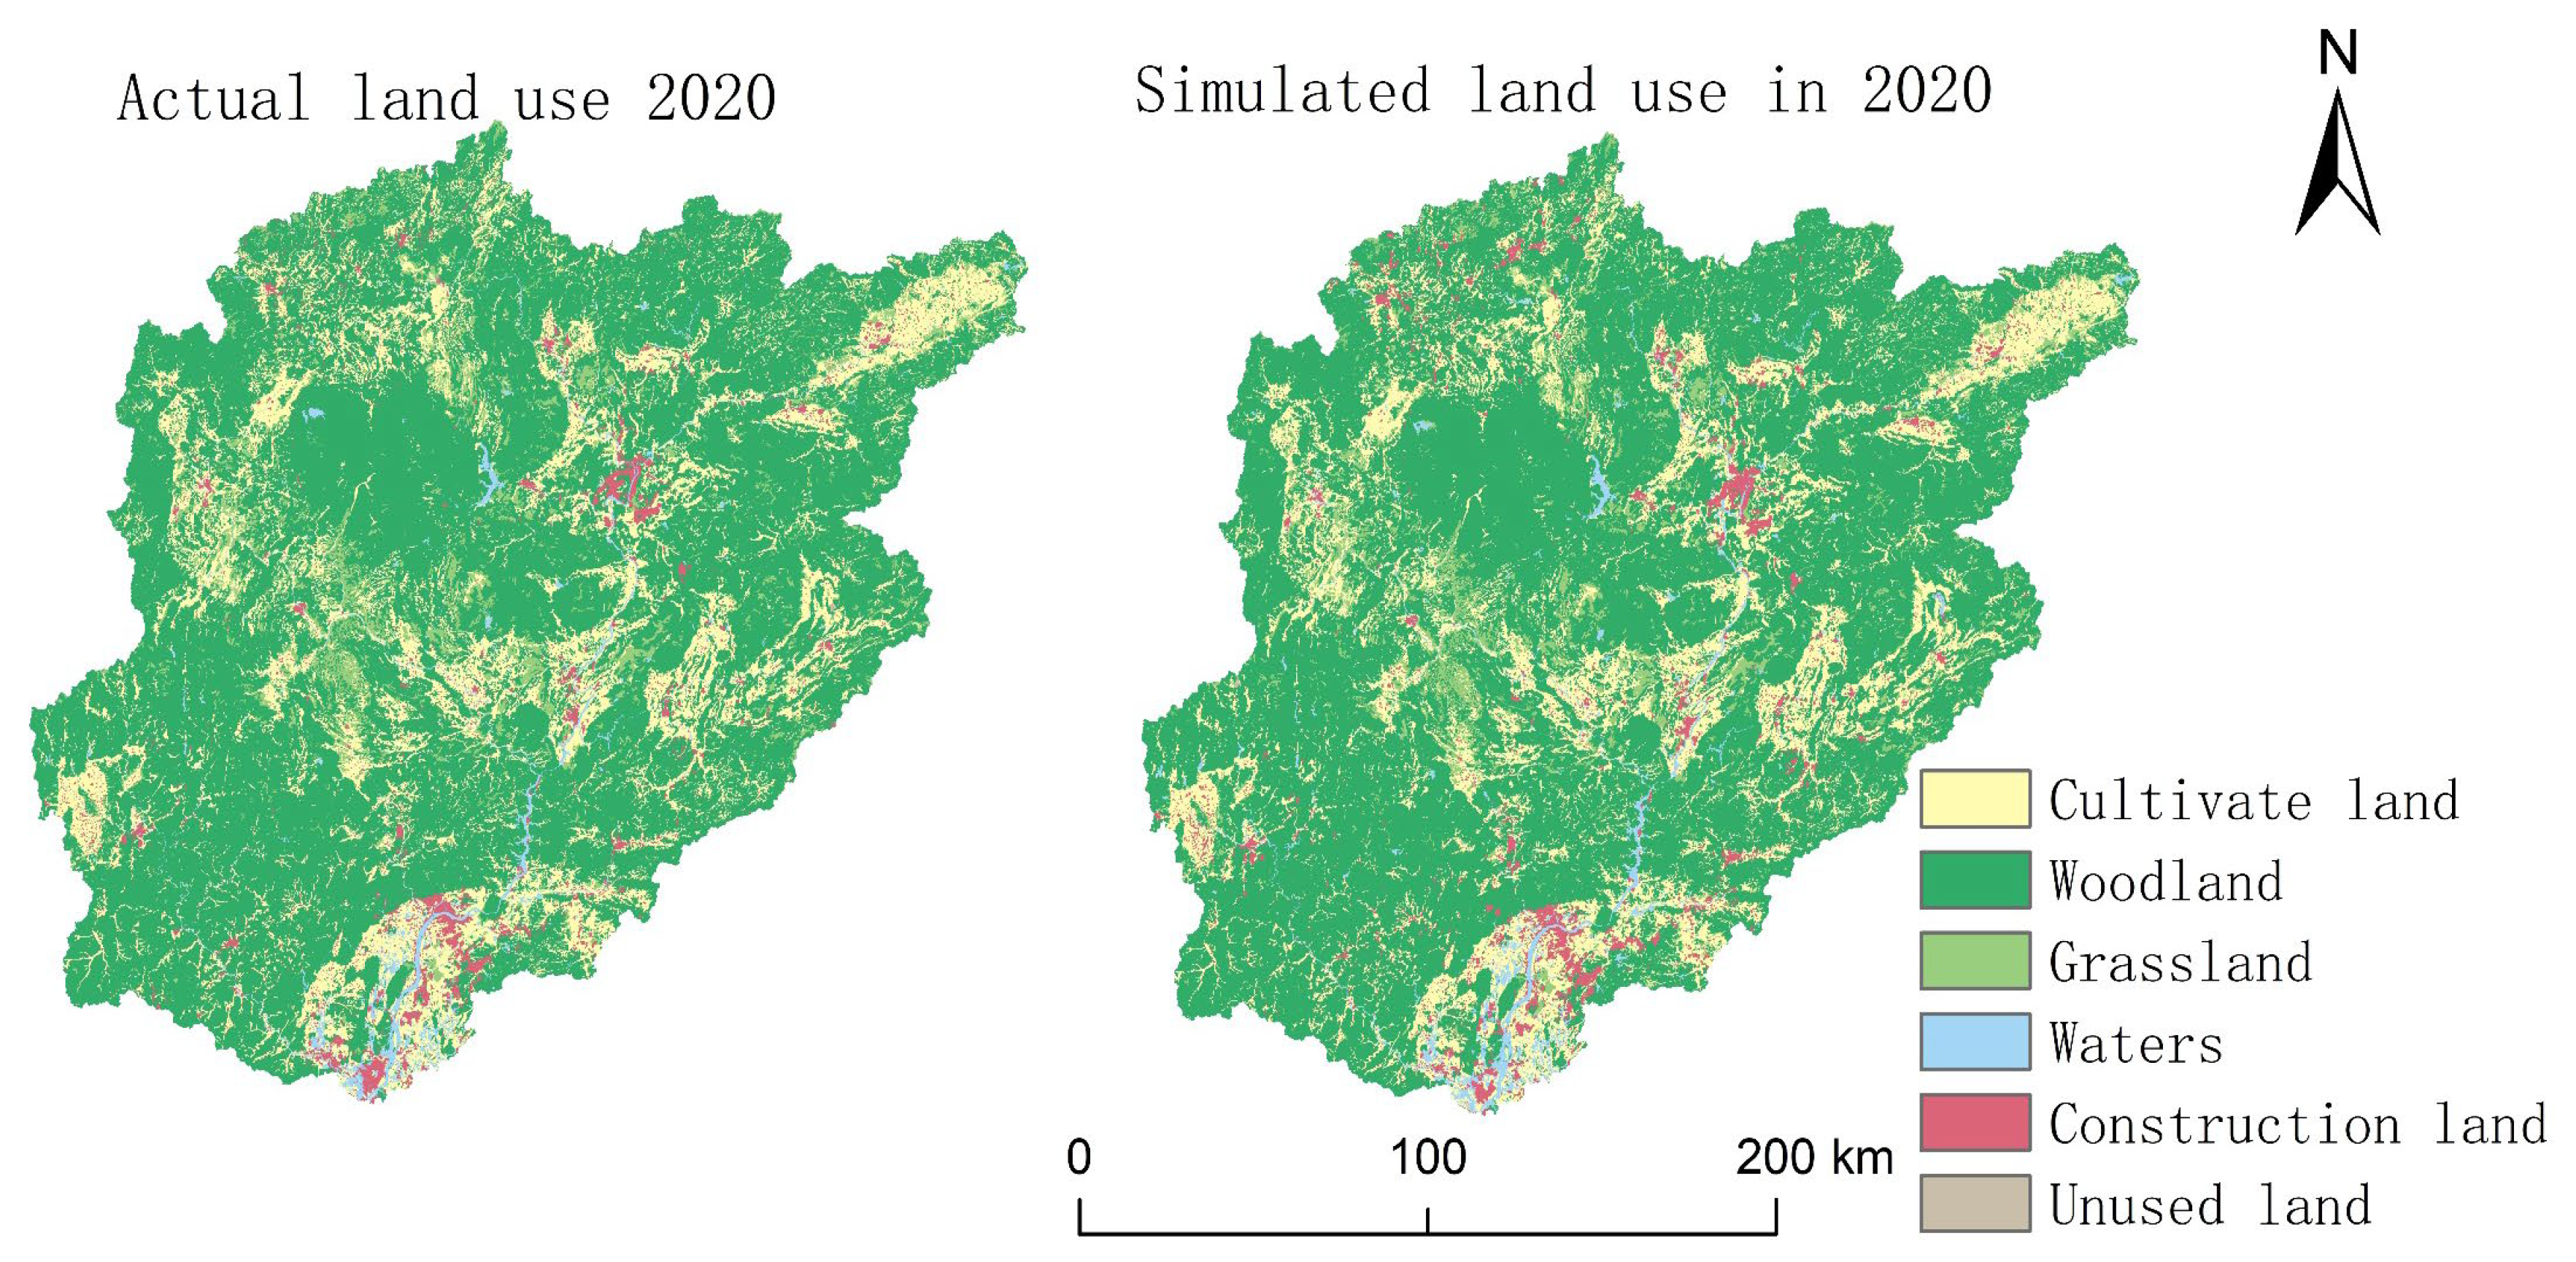
3.3.1. Model Accuracy Verification

This study successfully simulated the land use conditions of 2020 by conducting an in-depth analysis of land expansion data from 2010 to 2020 and the development potential of various land use types. This simulation not only provides a dynamic perspective for understanding land changes, but also lays a foundation for future land use planning. To verify the reliability of the simulation results, we employed the accuracy validation module within the PLUS model to systematically compare the actual 2020 land use map with the simulated map, as shown in Figure 7. This process is a crucial step in assessing the model’s performance, ensuring the correlation between the simulated results and the actual conditions. During the comparison, we calculated a Kappa coefficient of 0.93, with an overall accuracy of 0.96. These high values indicate a strong consistency between the simulated results and the actual observational data, further validating the accuracy and effectiveness of the model. This exceptional accuracy not only enhances the credibility of the research findings, but also provides a solid basis for subsequent land use management and planning. However, compared with the actual land use distribution, the simulated land use distribution in 2020 showed increased dispersion, and isolated patches appeared among different land use types.

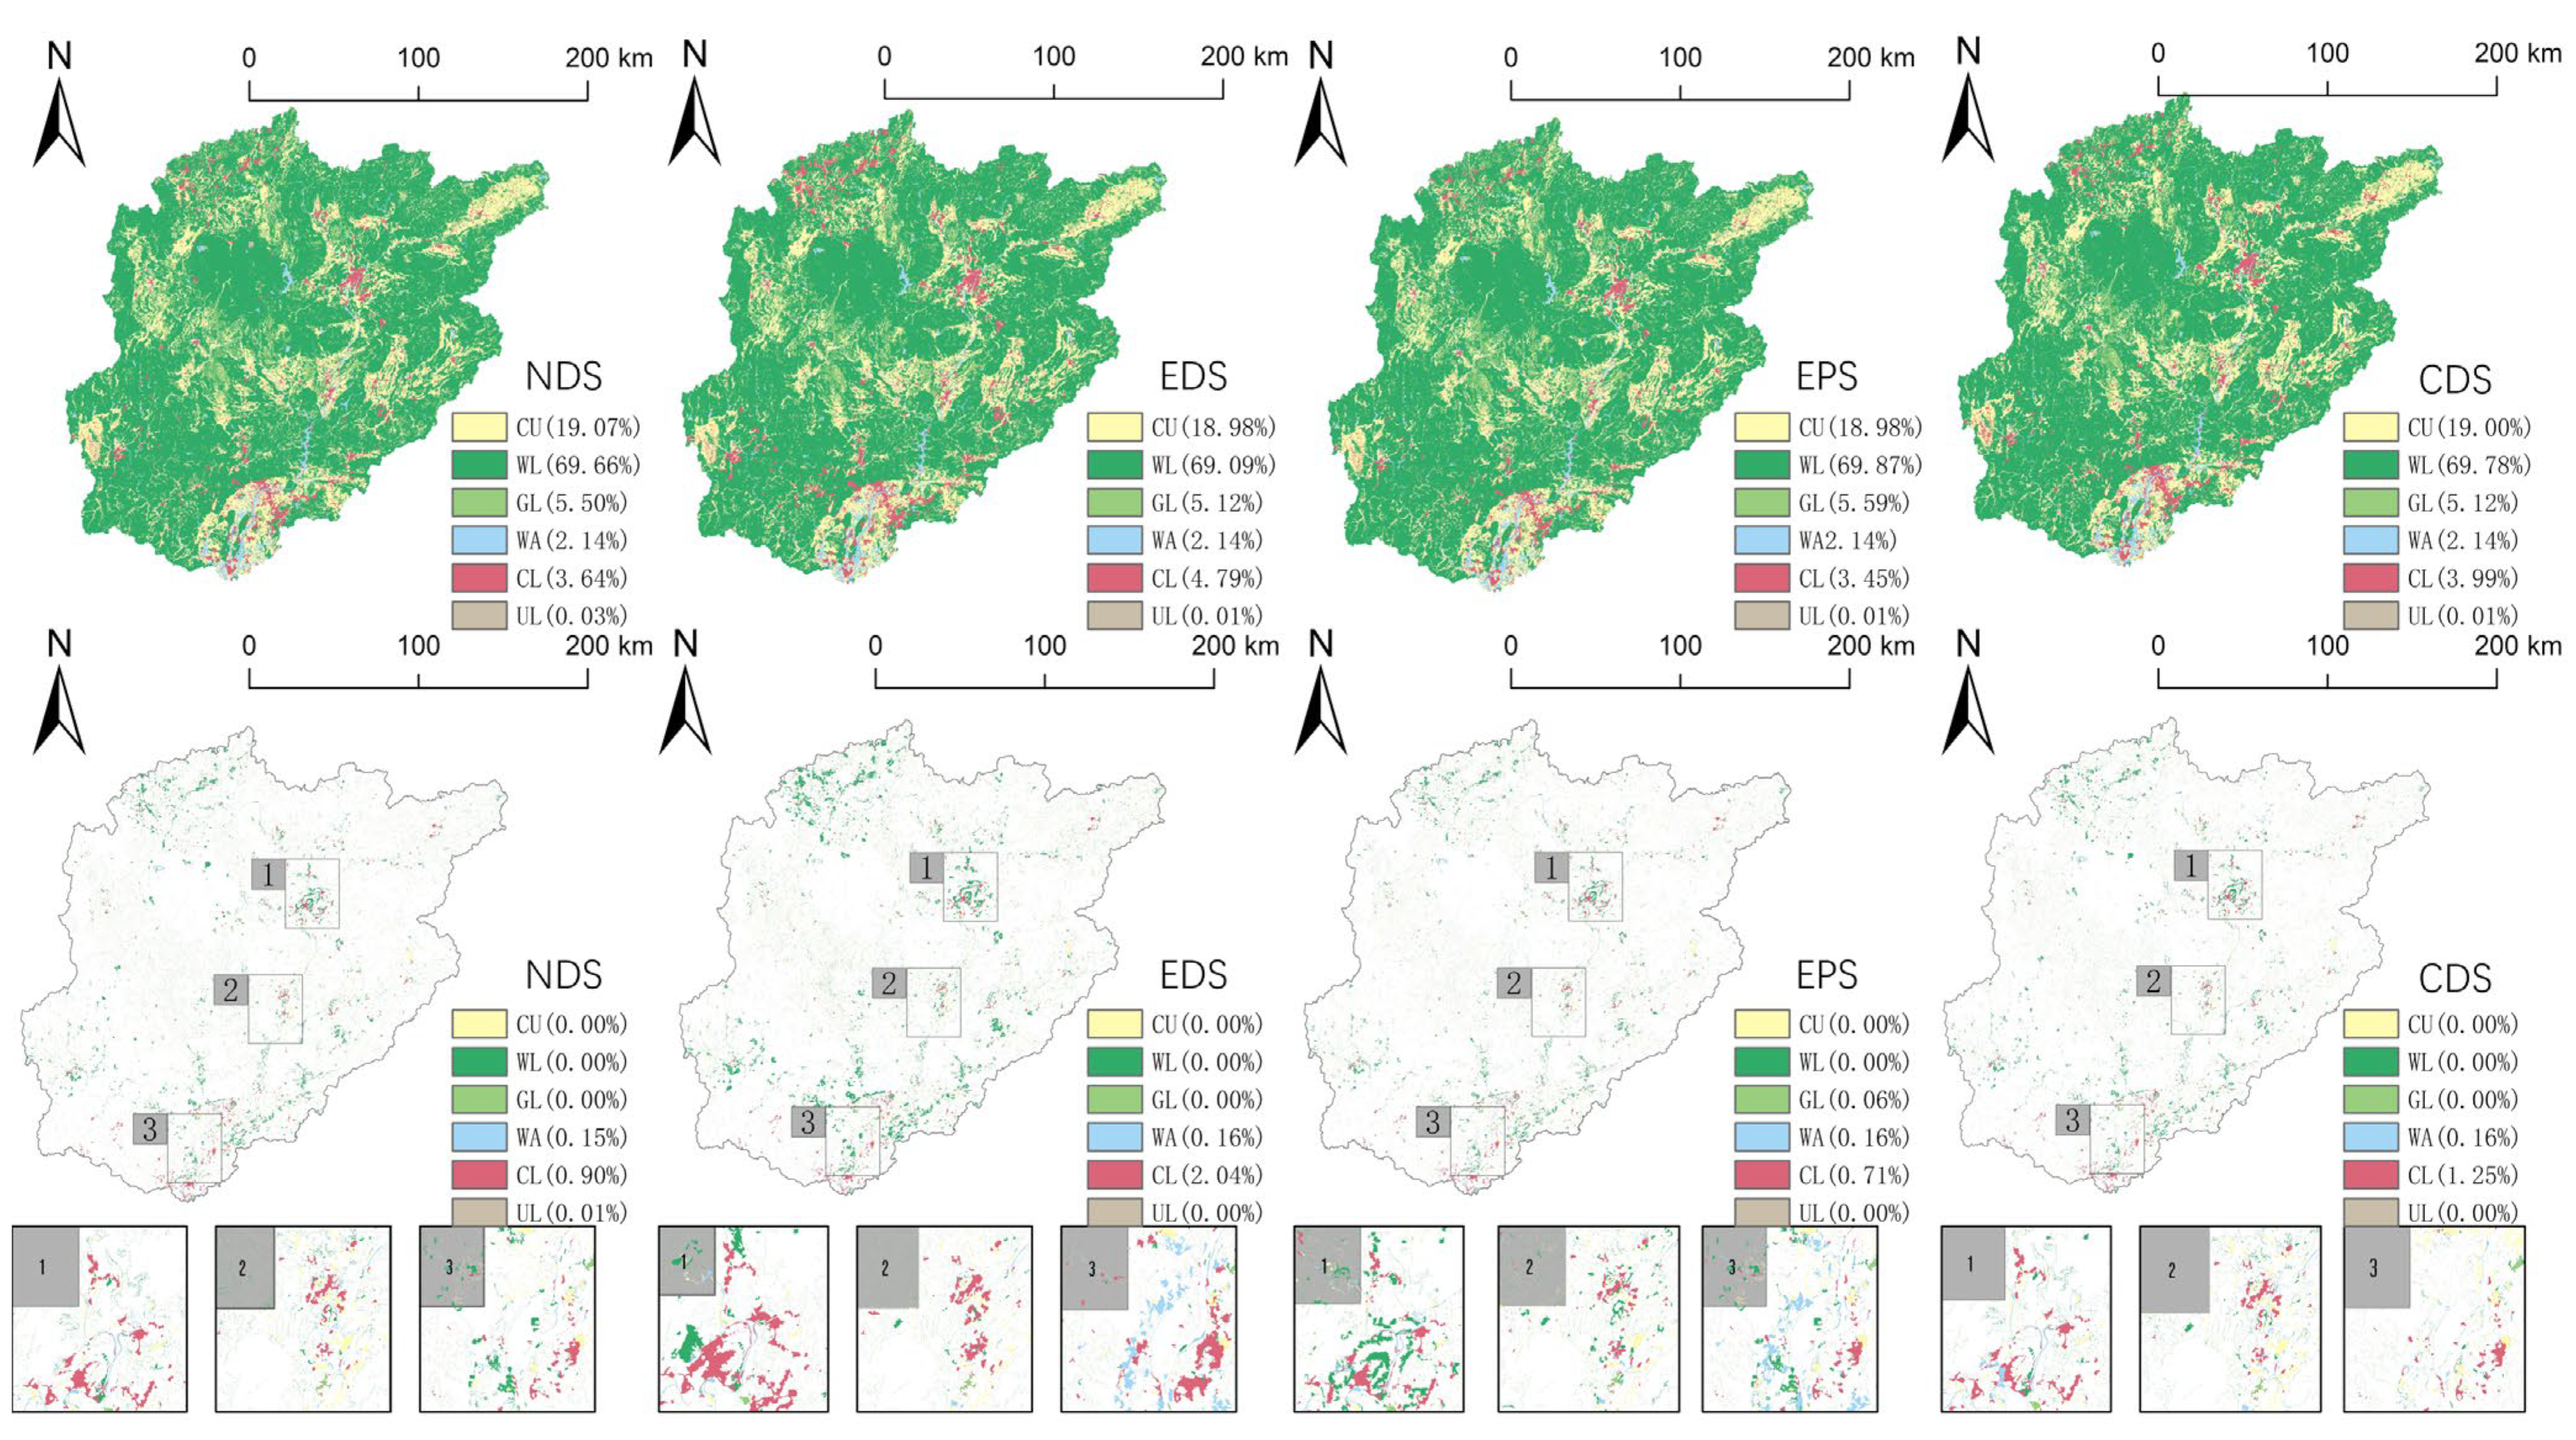
3.3.2. Examination of the Outcomes of the Multi-Scenario Land Use Simulation in the Beijiang River Basin for the Year 2050

Based on the simulation results from the ES-PLUS model, this study analyzes the spatial distribution of land use in the Beijiang River Basin under four different development scenarios for the year 2050. To more accurately assess the expansion potential of land use types in each scenario, we conducted a comprehensive calculation of the expansion of various land use types from 2020 to 2050. Additionally, a detailed analysis of the area and changes in the proportion of land use types under each development scenario was performed, as shown in Table 9. Moreover, based on the expansion of construction land, three sample sites—Shaoguan, Qingyuan, and Foshan—were selected for comparison (see Figure 8). Under these four development scenarios, regional land use is stable, as seen by the comparatively low change rates of farmland, woodlands, and unused land between 2020 and 2050. The particular outcomes are outlined below.
(1)
Natural Development Scenario (NDS)
The trajectory of land use change is reflected in the Natural Development Scenario (NDS), representing land use changes continuing to develop naturally according to past trends and human activities without significant policy interventions. Compared to 2020, this scenario shows that cultivated land and grassland areas will decrease by 137.72 km2 and 333.92 km2, respectively. In contrast, construction land is expected to expand significantly by 32.97%. This trend suggests that, without policy interventions, such disorderly urban expansion could jeopardize the ecological integrity and food security of the basin, encroaching on grasslands, farmlands, and forest areas, leading to habitat loss and reduced agricultural productivity.
(2)
Economic Development Scenario (EDS)
The EDS emphasizes growth driven by economic activities, particularly urbanization and infrastructure expansion. In this scenario, metropolitan area expansion brought on by economic and population growth will primarily result in a significant increase in water bodies, construction land, and underutilized land. On the other hand, significant land categories like grassland, forest land, and farmed land would all see significant declines, with respective decreases of 227.72 km2, 599.67 km2, and 195.84 km2. This imbalance highlights the potential risks of prioritizing economic growth at the expense of environmental sustainability, as the reduction in these key land types could undermine ecological health and biodiversity.
(3)
Ecological Protection Scenario (EPS)
The EPS focuses on conserving natural resources and ecosystems, emphasizing the protection of ecological land. In this scenario, the grassland area increases by 1.12%, water bodies increase by 8.06%, while construction land grows by 26.01%. Meanwhile, cultivated land is expected to decrease by 2.0%, and forest land will slightly decrease by 0.71%. This scenario demonstrates the complex trade-offs faced in ecological protection efforts, where growth in construction land can still occur alongside regional ecological conservation.
(4)
Comprehensive Development Scenario (CDS)
The Comprehensive Development Scenario (CDS) seeks to integrate economic development with ecological protection, aiming to balance land use by ensuring that urban expansion does not excessively hinder natural habitats. This approach aims to incorporate ecological protection into the planning process, achieving sustainable development while safeguarding ecological resources during high-quality social development. By making it more difficult to turn grassland, woodland, and water bodies into building land, the scenario seeks to slow the growth of new construction land. The spatial change trends of this scenario are more similar to those of the ecological protection scenario, with results showing reductions in farmland, woodland, and grassland by 173.72 km2, 274.84 km2, and 116.52 km2, respectively, while construction land expands by 588.15 km2, highlighting the irreversible nature of urbanization in the basin.
In summary, considering changes in spatial distribution, the ecological protection simulation results in the Beijiang mainstream and surrounding urban areas are more similar to those of the EDS, but the EPS has a relatively larger distribution range of ecological space. In reality, the Beijiang River Basin serves as an important ecological barrier for Guangdong Province, with its extensive cultivated land, forests, and grasslands. However, over the past forty years, production and construction activities have severely impacted the integrity and function of the region’s ecosystems. The EPS set in this study’s ecological constraints effectively reduces forest land loss and limits the encroachment of construction land. Furthermore, the growth rate of construction land under the Comprehensive Development Scenario is significantly lower than that observed under the Economic Development Scenario, helping to protect ecological areas, such as water bodies and forests, and mitigating the rapid encroachment of construction land on these critical resources.

4. Discussion

4.1. Evaluation of Multi-Scenario Simulation Results of Land Use in the Beijiang River Basin and Its Ecological Significance

Land use simulation is crucial for watershed ecological protection. Researchers such as Yu Hao have used the CA–Markov model to simulate future land use in the Urumqi River Basin [59,60], while Xu Shanshan and colleagues have simulated land use in the Beibu Gulf River Basin for 2030 and conducted scenario analysis [61]. Luo Yi and others employed the PLUS model to simulate the spatial distribution of future land use in the Dawen River Basin to promote high-quality regional development [62]. Compared to traditional land use simulation studies, simulations based on multidimensional ecological constraints can consider various factors, including ecological, economic, and social aspects, ensuring a comprehensive and scientific approach to land use decision making. This integrative method helps us to more accurately reflect the actual conditions [63]. By incorporating ecological constraints into the simulation, important ecological function areas, such as wetlands, forests, and biodiversity hotspots, can be effectively protected, reducing negative impacts on the environment. Multidimensional ecological constraints can help us to identify and minimize conflicts between different land use types, optimizing resource allocation for more efficient land use [64]. Considering ecological constraints in land use simulation is more likely to promote sustainable development, ensuring a balance between economic growth and ecological protection and avoiding ecological damage caused by short-term interests. In the face of uncertainties such as climate change and environmental shifts, multidimensional ecological constraints can provide more resilient and adaptable land use solutions [65,66]. The ecological implications of the four simulation scenarios are as follows: the NDS simulation results indicate significant reductions in arable land and grasslands, alongside a substantial increase in construction land. This scenario reflects uncontrolled urbanization and development driven by human activities. The sharp expansion of construction land in the EDS highlights the relationship between economic growth and land use change, indicating that rapid urban expansion often comes at the expense of natural ecosystems. In contrast, the EPS aims to protect ecological lands such as forests and grasslands. However, the continued decline of arable land and forests signifies a trade-off between ecological protection and agricultural productivity. The ecological significance of this scenario lies in recognizing that protecting ecosystems is vital for maintaining biodiversity and enhancing ecosystem resilience. The challenges identified in the EPS emphasize the need for effective conservation strategies that align agricultural demands with ecological goals, promoting sustainable coexistence. The Comprehensive Development Scenario (CDS) aims to integrate economic development with ecological protection to create a more sustainable land use pattern. This scenario seeks to maintain ecological integrity while accommodating essential economic growth. The differences in outcomes among the four development scenarios highlight the complex interactions between human activities and ecosystems. Each scenario illustrates varying degrees of land use change and the impact on ecological health, as follows: both the NDS and the EDS emphasize the risks of prioritizing development without considering ecological factors, leading to significant habitat loss and the degradation of ecosystem services. The EPS demonstrates the necessity of ecological protection while also highlighting the challenges of balancing conservation efforts with agricultural production. The CDS represents a sustainable approach that acknowledges the interdependence of economic development and ecological health. Overall, the findings from these scenarios provide valuable insights into the importance of incorporating ecological considerations into land use planning and decision making. They indicate that sustainable development requires a multifaceted approach that recognizes the value of ecosystems while meeting human needs, thereby maximizing long-term ecological resilience and stability.

4.2. Key Policy Implications for Sustainable Land Use and Ecological Protection in the Beijiang River Basin

To effectively implement ecological constraint policies such as riparian corridors and ecological sources at the policy level for the rational planning of watershed land resources, several strategies can be adopted. First and foremost, a thorough policy framework that addresses economic development, land use, and ecological preservation must be established. This framework should clearly define the objectives and strategies for riparian corridors and ecological sources, keeping in mind the requirements of different stakeholders in order to guarantee a harmonic balance between economic expansion and ecological preservation. Second, while natural corridors are being planned and built, remote sensing technology and GIS analysis should be utilized to identify critical ecological areas and biodiversity hotspots within the watershed. This identification will help us to determine the optimal locations for the ecological corridors. Based on ecological functions and species migration requirements, a network of ecological corridors should be designed to ensure connectivity among different ecosystems, facilitating the normal functioning of ecological processes. Additionally, assessing the ecological sources within the watershed—such as key water sources, wetlands, and other significant ecological areas—will make it possible to create measures for repair and protection. Relevant protective policies, including restrictions on development activities and the implementation of environmental rehabilitation initiatives, should be enacted to improve the functionality and stability of these ecological sources. In future land use planning for the Beijiang River Basin, ecological constraints must be integrated to limit construction and development activities in ecologically sensitive areas while prioritizing the protection of riparian corridors and ecological sources. Encouraging multi-functional land use practices, such as ecological agriculture and sustainable tourism, can help to balance economic development with ecological conservation. Simultaneously, public awareness should be raised through outreach and educational initiatives to enhance the understanding of the importance of riparian corridors and ecological sources. Community involvement in ecological protection efforts should be encouraged, and mechanisms for stakeholder participation established to ensure that local governments, communities, NGOs, and businesses actively engage in policy formulation and implementation. By adopting these measures, it is possible to effectively enforce ecological constraint policies related to riparian corridors and ecological sources, thereby achieving rational planning and sustainable management of watershed land resources.

4.3. Innovation and Future Research Directions of Land Use Simulation

The innovation of this study lies in proposing a land use change simulation model with ecological constraints (the ES-PLUS model) from the perspective of watershed ecological protection, which is applied to the analysis and evaluation of watershed ecological patterns. Typically, land use change simulation models considering ecological constraints are used for urban or small-scale land use change analysis. However, watersheds encompass more spatial patterns and ecological functions, making them more complex. This study establishes such a model by integrating ecosystem service evaluation, morphological spatial pattern analysis (MSPA), and circuit theory to construct ecological constraints (ES). Three different levels of ecological constraints are generated based on varying cumulative resistance thresholds. By comprehensively evaluating the services provided by ecosystems, key ecological functional areas are identified. Four different land use scenarios are formed by combining different ecological constraints with corresponding simulation scenarios. By simulating land use changes under different scenarios, this study evaluates the impact of various development scenarios on the ecological environment of the Beijiang River Basin. Through the innovative ES-PLUS model, this study not only provides a new perspective and method for studying land use changes in the Beijiang River Basin, but also emphasizes the importance of ecological constraints in land management. The findings of this study contribute to promoting the sustainable development of watersheds, effectively combining ecological protection with economic development, and have significant scientific and practical value. The ability of the ES-PLUS model to concurrently constrain the amount and spatial distribution of future land use is its distinct advantage in land use modeling. This flexibility makes the model more adaptable in planning and management processes, helping to address the rapidly changing environmental and economic conditions. Unlike traditional fixed ecological constraint methods, the ES-PLUS model integrates various ecosystem services (ES), eliminating the limitations associated with a single constraint. This approach not only considers the diversity and complexity of ecosystems, but also allows for dynamic adjustments to land use strategies based on different scenarios and needs, thereby achieving more comprehensive and sustainable land management [67]. It can be applied to other spatial constraints such as geological disaster protection and ecological sensitivity assessment in the basin. However, the limitations and uncertainties of the model mainly manifest in several areas. First, the subjectivity in parameter settings may lead to biases in the simulation results. Researchers, when selecting and adjusting the parameters, may be influenced by their personal experiences and judgments, which can affect the reliability of the model outputs. Additionally, the model has limited capacity to explain the reasons behind land use changes. Although it considers various driving factors, the complexity and interactions among these factors make it challenging to provide a comprehensive explanation of land use changes. This may result in an insufficient understanding of the dynamics of land cover [68,69]. Land use changes under ecological constraints are still difficult to fully simulate. The model’s improvement direction can further study the simulation situation under different pixel scales and land use classifications and explore the use of watershed functional zoning to improve simulation realism. Additionally, combining it with the GMOP model and incorporating more driving factors can enhance the model [70,71,72]. In summary, the ES-PLUS model has certain advantages, but also has uncertainties and limitations, requiring further improvement and refinement in parameter settings, driving factor selection, and simulation accuracy.

5. Conclusions

This study systematically analyzed the land use changes in the Beijiang River Basin from 1980 to 2020 and their potential driving factors. By constructing the ES-PLUS model and integrating ecological constraints with multi-scenario coupling limitations, this study simulated future land use development scenarios under different constraints for 2050. The findings indicate the following:
(1)
Over the past 40 years, 95% of the land use in the Beijiang River Basin comprised forests, cultivated land, and grassland. While cultivated land and grassland have continuously decreased, water bodies and construction land have increased. Unused land exhibited the highest single dynamic degree of change, reaching 5.67%.
(2)
By applying circuit theory and setting multidimensional ecological constraints based on four ecosystem services (habitat quality, water conservation, carbon storage, and soil retention) to drive the ES-PLUS model for simulating future land use changes, the results showed a Kappa coefficient of 0.93 and an overall accuracy of 0.96. By 2050, the simulation results indicated significant differences in change trends across the four development scenarios. Notably, the growth rate of construction land under the Comprehensive Development Scenario was significantly lower than that observed under the Economic Development Scenario, which could protect ecological areas such as water bodies and forests, mitigating the encroachment and impact of human activities and economic development on critical ecological resources.
(3)
The model effectively alleviated the negative ecological impacts caused by regional economic development and slowed the disorderly expansion of urban areas into ecological land. It promoted the coordination of economic development and ecological protection goals in the basin, providing a solid scientific foundation for formulating sustainable land management strategies in the future.

Author Contributions

Conceptualization, J.W., Y.W., J.D. and S.Z.; methodology, J.W., B.H. (Bin He) and S.Z.; formal analysis, J.W.; investigation, J.W. and B.H. (Bin He); data curation, Y.W.; supervision, J.W.; writing—original draft preparation, J.W. and B.H. (Beibei Hao); writing—review and editing, J.W., Y.W. and S.Z. All authors have read and agreed to the published version of the manuscript.

Funding

This research was funded by the National Natural Science Foundation of China (42177065), funder: Bin He; the Guangdong Basic and Applied Basic Research Foundation (2024A1515012435), funder: S.Z; the National Key Research and Development Project (2023YFC3205701), funder: Bin He; GDAS’ Project of Science and Technology Development (2023GDASZH-2023010103), funder: Beibei Hao; and the Guangdong Foundation for Program of Science and Technology Research (2023B0202030001, 2023B1212060044). funder: Bin He.

Institutional Review Board Statement

Not applicable.

Informed Consent Statement

Not applicable.

Data Availability Statement

The original results of this study have been detailed in the article, including the research methodology, experimental results, and discussion sections. These results provide new insights and references for related fields. If you have any questions about the specific details of this study or further exploration, please feel free to contact the corresponding author, and we will be happy to provide more information and support.

Acknowledgments

I would like to express my sincere gratitude to all of those who supported and helped me in this study. I offer special thanks to my supervisor, as your guidance and encouragement have helped me to progress in my research. Also, thanks to my colleagues in the laboratory, as your collaboration and discussions greatly enriched my research ideas. Thanks also to the funding agencies for their support, which made this study possible. Finally, I would like to thank my family, as your understanding and support are the motivation for me to keep moving forward.

Conflicts of Interest

The authors declare no conflicts of interest.

References

  1. Gao, J.; Zou, C.; Zhang, K.; Xu, M.; Wang, Y. The establishment of Chinese ecological conservation redline and insights into improving international protected areas. J. Environ. Manag. 2020, 264, 110505. [Google Scholar] [CrossRef] [PubMed]
  2. Wang, C.; Yu, C.; Chen, T.; Feng, Z.; Hu, Y.; Wu, K. Can the establishment of ecological security patterns improve ecological protection? An example of Nanchang, China. Sci. Total Environ. 2020, 740, 140051. [Google Scholar] [CrossRef] [PubMed]
  3. del Carmen Sabatini, M.; Verdiell, A.; Iglesias, R.M.R.; Vidal, M. A quantitative method for zoning of protected areas and its spatial ecological implications. J. Environ. Manag. 2007, 83, 198–206. [Google Scholar] [CrossRef] [PubMed]
  4. Hu, S.; Chen, L.; Li, L.; Zhang, T.; Yuan, L.; Cheng, L.; Wang, J.; Wen, M. Simulation of land use change and ecosystem service value dynamics under ecological constraints in Anhui Province, China. Int. J. Environ. Res. Public Health 2020, 17, 4228. [Google Scholar] [CrossRef] [PubMed]
  5. Nie, W.; Xu, B.; Ma, S.; Yang, F.; Shi, Y.; Liu, B.; Hao, N.; Wu, R.; Lin, W.; Bao, Z. Coupling an Ecological Network with Multi-Scenario Land Use Simulation: An Ecological Spatial Constraint Approach. Remote Sens. 2022, 14, 6099. [Google Scholar] [CrossRef]
  6. Samways, M.J.; Bazelet, C.S.; Pryke, J.S. Provision of ecosystem services by large scale corridors and ecological networks. Biodivers. Conserv. 2010, 19, 2949–2962. [Google Scholar] [CrossRef]
  7. Liu, H.; Wang, Z.; Zhang, L.; Tang, F.; Wang, G.; Li, M. Construction of an ecological security network in the Fenhe River Basin and its temporal and spatial evolution characteristics. J. Clean. Prod. 2023, 417, 137961. [Google Scholar] [CrossRef]
  8. Xu, X.; Wang, S.; Yan, G.; He, X. Ecological Security Assessment Based on the “Importance–Sensitivity–Connectivity” Index and Pattern Construction: A Case Study of Xiliu Ditch in the Yellow River Basin, China. Land 2023, 12, 1296. [Google Scholar] [CrossRef]
  9. Wang, Y.; Long, Z.; Song, Y. Study on the construction of the ecological security pattern of the lancang river basin (Yunnan section) based on inVEST-MSPA-circuit theory. Sustainability 2022, 15, 477. [Google Scholar] [CrossRef]
  10. Wang, X.; Xie, X.; Wang, Z.; Lin, H.; Liu, Y.; Xie, H.; Liu, X. Construction and Optimization of an Ecological Security Pattern Based on the MCR Model: A Case Study of the Minjiang River Basin in Eastern China. Int. J. Environ. Res. Public Health 2022, 19, 8370. [Google Scholar] [CrossRef]
  11. Zhou, S.; Song, Y.; Li, Y.; Wang, J.; Zhang, L. Construction of ecological security pattern for plateau lake based on MSPA–MCR model: A case study of Dianchi lake area. Sustainability 2022, 14, 14532. [Google Scholar] [CrossRef]
  12. Chen, W.; Huimin, L.; Wang, X. Construction and optimization of regional ecological security patterns based on MSPA-MCR-GA Model: A case study of Dongting Lake Basin in China. Ecol. Indic. 2024, 165, 112169. [Google Scholar] [CrossRef]
  13. Pan, X.; Yimin, W.; Zhang, Z. Identification and Optimization of Ecological Network in Arid Inland River Basin Using MSPA and Spatial Syntax: A Case Study of Shule River Basin, NW China. Land 2023, 12, 292. [Google Scholar] [CrossRef]
  14. Yang, L.; Suo, M.; Gao, S.; Jiao, H. Construction of an ecological network based on an integrated approach and circuit theory: A case study of Panzhou in Guizhou Province. Sustainability 2022, 14, 9136. [Google Scholar] [CrossRef]
  15. Peng, J.; Yang, Y.; Liu, Y.; Du, Y.; Meersmans, J.; Qiu, S. Linking ecosystem services and circuit theory to identify ecological security patterns. Sci. Total Environ. 2018, 644, 781–790. [Google Scholar] [CrossRef]
  16. Li, J.; Xu, J.; Chu, X. The construction of a regional ecological security pattern based on circuit theory. Sustainability 2019, 11, 6343. [Google Scholar] [CrossRef]
  17. Xu, J.; Fan, F.; Liu, Y.; Dong, J.; Chen, J. Construction of ecological security patterns in nature reserves based on ecosystem services and circuit theory: A case study in Wenchuan, China. Int. J. Environ. Res. Public Health 2019, 16, 3220. [Google Scholar] [CrossRef] [PubMed]
  18. Li, L.; Huang, X.; Wu, D.; Yang, H. Construction of ecological security pattern adapting to future land use change in Pearl River Delta, China. Appl. Geogr. 2023, 154, 102946. [Google Scholar] [CrossRef]
  19. Ferretti, V.; Pomarico, S. An integrated approach for studying the land suitability for ecological corridors through spatial multicriteria evaluations. Environ. Dev. Sustain. 2013, 15, 859–885. [Google Scholar] [CrossRef]
  20. Prokopová, M.; Salvati, L.; Egidi, G.; Cudlín, O.; Včeláková, R.; Plch, R.; Cudlín, P. Envisioning present and future land-use change under varying ecological regimes and their influence on landscape stability. Sustainability 2019, 11, 4654. [Google Scholar] [CrossRef]
  21. Wang, H.-H.; LI, H.-T.; Xie, M.-M.; Xu, M.; Li, S.-L.; Bai, Z.-K. Construction of ecological security pattern for systematic restoration of industrial and mining land in resource-based cities. J. Nat. Resour. 2020, 35, 162–173. [Google Scholar]
  22. He, X.; Yuan, Q.; Zeng, Y.; Li, G. Construction and Evaluation of an Ecological Network for Dongguan City Based on Urban Big Data POIs and Circuit Theory. Bull. Soil Water Conserv. 2023, 43, 237–247. [Google Scholar] [CrossRef]
  23. Zhao, Z.; Fang, H.; Yuan, Q.; Wu, Y. Research on the construction of ecological corridor habitat network in Songhua River. J. Nanjing For. Univ. (Nat. Sci. Ed.) 2024, 48, 261–270. [Google Scholar] [CrossRef]
  24. Zhou, L.; Dang, X.; Sun, Q.; Wang, S. Multi-scenario simulation of urban land change in Shanghai by random forest and CA-Markov model. Sustain. Cities Soc. 2020, 55, 102045. [Google Scholar] [CrossRef]
  25. Li, F.; Wang, L.; Chen, Z.; Clarke, K.C.; Li, M.; Jiang, P. Extending the SLEUTH model to integrate habitat quality into urban growth simulation. J. Environ. Manag. 2018, 217, 486–498. [Google Scholar] [CrossRef]
  26. Wang, Z.; Li, X.; Mao, Y.; Li, L.; Wang, X.; Lin, Q. Dynamic simulation of land use change and assessment of carbon storage based on climate change scenarios at the city level: A case study of Bortala, China. Ecol. Indic. 2022, 134, 108499. [Google Scholar] [CrossRef]
  27. Zhang, S.; Yang, P.; Xia, J.; Wang, W.; Cai, W.; Chen, N.; Hu, S.; Luo, X.; Li, J.; Zhan, C. Land use/land cover prediction and analysis of the middle reaches of the Yangtze River under different scenarios. Sci. Total Environ. 2022, 833, 155238. [Google Scholar] [CrossRef] [PubMed]
  28. Lu, C.; Qi, X.; Zheng, Z.; Jia, K. PLUS-model based multi-scenario land space simulation of the Lower Yellow River Region and its ecological effects. Sustainability 2022, 14, 6942. [Google Scholar] [CrossRef]
  29. Lin, X.; Fu, H. Multi-scenario simulation analysis of cultivated land based on PLUS model—A case study of Haikou, China. Front. Ecol. Evol. 2023, 11, 1197419. [Google Scholar] [CrossRef]
  30. Hao, W.; Cao, Z.; Ou, S.; Qin, Y.; Wang, Z.; Yang, S.; Tiando, D.S.; Fan, X. A Simulation Analysis of Land Use Changes in the Yarlung Zangbo River and Its Two Tributaries of Tibet Using the Markov–PLUS Model. Sustainability 2023, 15, 1376. [Google Scholar] [CrossRef]
  31. Mo, J.; Sun, P.; Shen, D.; Li, N.; Zhang, J.; Wang, K. Simulation Analysis of Land-Use Spatial Conflict in a Geopark Based on the GMOP–Markov–PLUS Model: A Case Study of Yimengshan Geopark, China. Land 2023, 12, 1291. [Google Scholar] [CrossRef]
  32. Liu, X.; Liu, Y.; Wang, Y.; Liu, Z. Evaluating potential impacts of land use changes on water supply–demand under multiple development scenarios in dryland region. J. Hydrol. 2022, 610, 127811. [Google Scholar] [CrossRef]
  33. Sohl, T.L.; Sleeter, B.M.; Zhu, Z.; Sayler, K.L.; Bennett, S.; Bouchard, M.; Reker, R.; Hawbaker, T.; Wein, A. A land-use and land-cover modeling strategy to support a national assessment of carbon stocks and fluxes. Appl. Geogr. 2012, 34, 111–124. [Google Scholar] [CrossRef]
  34. Zhang, Y.; Naerkezi, N.; Zhang, Y.; Wang, B. Multi-Scenario Land Use/Cover Change and Its Impact on Carbon Storage Based on the Coupled GMOP-PLUS-InVEST Model in the Hexi Corridor, China. Sustainability 2024, 16, 1402. [Google Scholar] [CrossRef]
  35. Yin, J.; He, F.; Xiong, Y.J.; Qiu, G.Y. Effects of land use/land cover and climate changes on surface runoff in a semi-humid and semi-arid transition zone in northwest China. Hydrol. Earth Syst. Sci. 2017, 21, 183–196. [Google Scholar] [CrossRef]
  36. Xu, A.; Hu, M.; Shi, J.; Meng, X.; Bai, Q.; Guo, J.; Zhang, S. Temporal and spatial changes of carbon storage in the Shiyang River Basin ecosystem and multi-scenario simulation. China Environ. Sci. 2024, 6, 3365–3375. [Google Scholar] [CrossRef]
  37. Yang, Z.; Niu, J.; Fan, D.; Zhang, Z.; Du, Z.; Zhao, C. Response and prediction of runoff to land use changes in the Kuye River Basin based on SWAT and PLUS models. J. Soil Water Conserv. 2024, 38, 289–299. [Google Scholar]
  38. Jiang, X.; Duan, H.; Liao, J.; Song, X.; Xue, X. Land use study in the midstream of the Heihe River Basin based on the PLUS-SD coupled model. Arid. Zone Res. 2022, 39, 1246–1258. [Google Scholar]
  39. Chen, S.; Huang, B.; Shi, F.; Qiu, J.; She, D. Spatiotemporal Changes and Probabilistic Statistical Characteristics of Extreme Precipitation in the Beijiang River Basin from 1956 to 2016. China Rural. Water Hydropower 2019, 10, 47–53. [Google Scholar]
  40. Li, H.; Zhang, Q.; Gu, X.; Sun, P.; Kong, D. Spatiotemporal Characteristics and Influencing Factors of Flood Magnitude, Frequency, and Peak Occurrence Time in the Beijiang River Basin. J. Wuhan Univ. 2016, 62, 389–400. [Google Scholar] [CrossRef]
  41. Zhao, Z.; Chen, S.; Yu, G.; Li, D.; Jia, K.; Zhao, C.; Li, J.; Qin, B. Remote Sensing Method for Forest Deforestation in the Beijiang River Basin Based on Recent Intensive Satellite Data. Trop. Geogr. 2024, 44, 2091–2103. [Google Scholar] [CrossRef]
  42. Deng, J.; Yu, F.; Sun, D.; Deng, Z.; Kang, J.; Ding, X. Study on the Spatial Distribution Characteristics of Soil Phosphorus in the Beijiang River Basin. For. Environ. Sci. 2022, 38, 60–64. [Google Scholar]
  43. Li, J.; Luo, X.; Zhu, S.; Zhang, W.; Xu, Z.; Huo, Z.; Tian, Z.; Huo, G. Study on the Impact of Land Use/Cover Change on Hydrological Processes in the Beijiang River Basin. Yangtze River 2020, 51, 89–94. [Google Scholar] [CrossRef]
  44. Li, M. Hydrological Response Simulation of Land Cover and Meteorological Conditions Changes in the Beijiang River Basin Based on SWAT. Master’s Thesis, Graduate School of Chinese Academy of Sciences (Guangzhou Institute of Geochemistry), Guangzhou, China, 2015. [Google Scholar]
  45. Li, Y. Multi-Scenario Simulation of Land Use in Fengxin County Under the Constraint of Ecological Risk. Master’s Thesis, Jiangxi Agricultural University, Nanchang, China, 2022. [Google Scholar] [CrossRef]
  46. Wang, F.; Li, J.; Wang, J.; Xiang, S.; Chen, X.; Yi, X.; Huang, T. Multi-scenario simulation of land use change in the Chengdu-Chongqing Economic Zone and its impact on carbon storage. Environ. Sci. 2024, 1–17. [Google Scholar] [CrossRef]
  47. Yang, J.; Wang, Z.; Yang, J.; Li, F.; Li, D. Land Use and Ecological Risk Analysis in Wanzhou District, Chongqing from 1992 to 2022. J. Northwest For. Univ. 2024, 39, 241–251+262. [Google Scholar]
  48. Li, G.; Li, H.; Wang, L.; Jiang, F.; Feng, Z. Analysis of Land Use Change and Its Socio-Economic Driving Factors in Qinghai Province. Grassl. Sci. 2022, 39, 2604–2616. [Google Scholar]
  49. Qian, Y.; Dong, Z.; Yan, Y.; Tang, L. Ecological risk assessment models for simulating impacts of land use and landscape pattern on ecosystem services. Sci. Total Environ. 2022, 833, 155218. [Google Scholar] [CrossRef] [PubMed]
  50. Hu, W.; Li, G.; Gao, Z.; Jia, G.; Wang, Z.; Li, Y. Assessment of the impact of the Poplar Ecological Retreat Project on water conservation in the Dongting Lake wetland region using the InVEST model. Sci. Total Environ. 2020, 733, 139423. [Google Scholar] [CrossRef] [PubMed]
  51. Hou, Y.; Li, B.; Müller, F.; Chen, W. Ecosystem services of human-dominated watersheds and land use influences: A case study from the Dianchi Lake watershed in China. Environ. Monit. Assess. 2016, 188, 1–19. [Google Scholar] [CrossRef] [PubMed]
  52. Zhang, F.; Chen, Y.; Wang, W.; Jim, C.Y.; Zhang, Z.; Tan, M.L.; Liu, C.; Chan, N.W.; Wang, D.; Wang, Z.; et al. Impact of land-use/land-cover and landscape pattern on seasonal in-stream water quality in small watersheds. J. Clean. Prod. 2022, 357, 131907. [Google Scholar] [CrossRef]
  53. Chen, J.; Kasimu, A.; Reheman, R.; Wei, B.; Han, F.; Zhang, Y. Temporal and spatial variation and prediction of water yield and water conservation in the Bosten Lake Basin based on the PLUS-InVEST model. J. Arid Land 2024, 16, 852–874. [Google Scholar] [CrossRef]
  54. Liang, J.; Li, S.; Li, X.; Li, X.; Liu, Q.; Meng, Q.; Lin, A.; Li, J. Trade-off analyses and optimization of water-related ecosystem services (WRESs) based on land use change in a typical agricultural watershed, southern China. J. Clean. Prod. 2021, 279, 123851. [Google Scholar] [CrossRef]
  55. Yang, X.; Xiao, H.; Wang, Y. Ecological network construction, optimisation and synergistic governance of city clusters in the middle reaches of the Yangtze River. J. Soil Water Conserv. 2024, 38, 300–309+318. [Google Scholar] [CrossRef]
  56. Sun, H.; Liu, C.; Wei, J. Identifying Key Sites of Green Infrastructure to Support Ecological Restoration in the Urban Agglomeration. Land 2021, 10, 1196. [Google Scholar] [CrossRef]
  57. Zhai, T.; Huang, L. Linking MSPA and circuit theory to identify the spatial range of ecological networks and its priority areas for conservation and restoration in urban agglomeration. Front. Ecol. Evol. 2022, 10, 828979. [Google Scholar] [CrossRef]
  58. Wu, D.; Zheng, L.; Wang, Y.; Gong, J.; Li, J.; Chen, Q. Dynamics in construction land patterns and its impact on water-related ecosystem services in Chengdu-Chongqing urban agglomeration, China: A multi-scale study. J. Clean. Prod. 2024, 469, 143022. [Google Scholar] [CrossRef]
  59. Yang, X.; Chen, Z.; Cheng, Y. Spatial influence of ecological networks on land use intensity. Sci. Total Environ. 2020, 717, 137151. [Google Scholar] [CrossRef] [PubMed]
  60. Yu, H.; Liu, J. Dynamic Simulation of Land Use in the Urumqi River Basin under Different Scenarios. Res. Land Nat. Resour. 2024, 3, 15–18. [Google Scholar] [CrossRef]
  61. Xu, S.; Zhang, Y.; Li, S.; Liang, X.; Yang, X. Changes and Simulation of Land Use in the Beibu Gulf River Basin Based on the CA-Markov Model. J. Beibu Gulf Univ. 2023, 38, 1–9. [Google Scholar] [CrossRef]
  62. Luo, Y.; Liu, W.; Qi, A.; Qu, Y.; Liu, W. Analysis of the temporal and spatial evolution of land use in the Dawen River Basin and multi-scenario simulation of ecological space. Water-Sav. Irrig. 2024, 1, 44–52. [Google Scholar]
  63. Chen, B.; Liao, T.; Zhang, L. Land Use Scenario Simulation and Ecological Value Assessment in Wanzhou District under Ecological Red Line Constraints. Res. Soil Water Conserv. 2020, 27, 349–357+364. [Google Scholar] [CrossRef]
  64. Liao, J.; Tang, L.; Zhu, L. Scenario Simulation of Spatiotemporal Evolution of Urban Spatial Forms Integrated with Ecological Soft Constraint Mechanisms. Acta Ecol. Sin. 2023, 43, 8139–8152. [Google Scholar] [CrossRef]
  65. Jian, S.; Ding, X.; Yu, X. Land Use Simulation for Coordinating Soil and Water Ecosystem Services. Acta Ecol. Sin. 2024, 44, 9470–9484. [Google Scholar] [CrossRef]
  66. Zhang, L.; Peng, J.; Liu, Y.; Wu, J. Coupling ecosystem services supply and human ecological demand to identify landscape ecological security pattern: A case study in Beijing–Tianjing–Hebei region, China. Urban Ecosyst. 2017, 20, 701–714. [Google Scholar] [CrossRef]
  67. Gao, L.; Tao, F.; Liu, R.; Wang, Z.; Leng, H.; Zhou, T. Multi-scenario simulation and ecological risk analysis of land use based on the PLUS model: A case study of Nanjing. Sustain. Cities Soc. 2022, 85, 104055. [Google Scholar] [CrossRef]
  68. Li, X.; Fu, J.; Jiang, D.; Lin, G.; Cao, C. Land use optimization in Ningbo City with a coupled GA and PLUS model. J. Clean. Prod. 2022, 375, 134004. [Google Scholar] [CrossRef]
  69. Li, X.; Liu, Z.; Li, S.; Li, Y. Multi-Scenario Simulation Analysis of Land Use Impacts on Habitat Quality in Tianjin Based on the PLUS Model Coupled with the InVEST Model. Sustainability 2022, 14, 6923. [Google Scholar] [CrossRef]
  70. Wang, Z.; Anya, Z.; Li, Q. Optimization of Land Use Structure Based on the Coupling of GMOP and PLUS Models: A Case Study of Lvliang City, China. Land 2024, 13, 1335. [Google Scholar] [CrossRef]
  71. Sun, Q.; Guo, L.; Gao, G.; Hu, X.; Song, T.; Huang, J. Spatiotemporal Dynamic Changes and Prediction of Wild Fruit Forests in Emin County, Xinjiang, China, Based on Random Forest and PLUS Model. Sustainability 2024, 16, 5925. [Google Scholar] [CrossRef]
  72. Yuan, L.; Xu, J.; Feng, B. Evaluation and Prediction of Carbon Storage in the Qinghai-Tibet Plateau by Coupling the GMMOP and PLUS Models. Sustainability 2024, 16, 5776. [Google Scholar] [CrossRef]
Figure 1. Distribution of sub-basins in the Beijiang River Basin.
Sustainability 16 10910 g001
Figure 2. Technical roadmap for multidimensional ecological constraints, construction, and land cover modeling in the Beijiang River Basin.
Sustainability 16 10910 g002
Figure 3. Land use distribution in the Beijiang River Basin, 1980–2020.
Sustainability 16 10910 g003
Figure 4. The Beijiang River Basin’s land use transfer area from 1980 to 2020.
Sustainability 16 10910 g004
Figure 5. Ecosystem services’ spatial distribution in the Beijiang River Basin.
Sustainability 16 10910 g005
Figure 6. Ecological constraints in the various development scenarios of Beijiang future land use modeling (areas with a value of 0).
Sustainability 16 10910 g006
Figure 7. Current land use distribution and 2020 predicted land usage in the Beijiang Basin.
Sustainability 16 10910 g007
Figure 8. Comparison of land use modeling results under different scenarios for the Beijiang Basin in 2050.
Sustainability 16 10910 g008
Table 1. Data information.
Data Type and PurposeData NameTime ResolutionSpatial ResolutionUnitData Sources
Natural factor (Calculation of ecosystem service functions)DEM/90 mmhttps://www.gscloud.cn/
(accessed on 10 June 2024)
Slope/90 m°
Average annual temperature20101000 m0.1 °Chttps://www.resdc.cn/
(accessed on 12 June 2024)
Average annual precipitation20101000 m0.1 mm
Soil type19951000 m/
Distance to water2021100 mmhttps://www.openstreetmap.org
(accessed on 10 June 2024)
Socio-economic factors (Driving factors of land use simulation)Population density20101000 m/https://www.resdc.cn/
(accessed on 12 June 2024)
Average GDP20101000 m/
Distance to railway2021100 mmhttps://www.openstreetmap.org
(accessed on 20 June 2024)
Distance to motorway
Distance to main road
Distance to primary road
Distance to secondary roads
Distance to tertiary road
Distance to urban area
Distance to township
Distance to railway station
Distance to bus station
Distance to hospital
Distance to school
Table 2. Weighting of threat sources and maximum impact distance in habitat quality calculations.
Threat FactorMaximum Impact Distance/mWeights %
Townland10,000100
Rural land800080
Other construction land900090
Farmland600060
Unused land400040
Table 3. Sensitivity of individual land use/cover to threat factors in the Beijiang Basin (%).
Land Use/CoverHabitat SuitabilityTownlandTownlandTownlandTownlandTownland
Cultivated land30806070040
Forest land1008070706020
Grassland1007050605060
Water907060704040
Construction land000000
Unused land60605060400
Table 4. Assignment and weighting of resistance factors for integrated resistance surface construction in Beijiang River Basin.
FactorCultivated LandForest LandGrasslandWaterConstruction LandUnused Land
Land cover type<50 m50~200 m200~500 m500~1000 m>1000 m0.14
Dem<2°2~5°5~15°15~25°>25°0.16
Slope<1000 m1000~3000 m3000~5000 m5000~10,000 m>10,000 m0.15
Distance to river0.8~1.00.6~0.80.4~0.60.2~0.40~0.20.22
NDVI>2000 m1000~2000 m500~1000 m250~500 m<250 m0.11
Distance to road<50 m50~200 m200~500 m500~1000 m>1000 m0.14
Table 5. Area and proportion of land use types in the Beijiang River Basin between 1980 and 2020.
Land Use TypeCultivated LandWoodlandGrasslandWaterConstruction LandUnused Land
1980Area/km29688.64333,288.6302802.056693.718710.6902.148
ratio/%20.53370.5485.9381.4701.5060.005
1990Area/km29631.10233,341.5422754.072731.566725.3092.198
ratio/%20.41170.6605.8371.5501.5370.005
2000Area/km29534.73833,331.5012741.279834.026742.0862.171
ratio/%20.20770.6395.8101.7681.5730.005
2010Area/km29247.49633,334.7902621.437905.5871074.6062.133
ratio/%19.59870.6465.5561.9192.2770.005
2020Area/km29140.66633,202.3312610.089934.6341292.5944.965
ratio/%19.37270.3655.5321.9812.7390.011
Table 6. Land use dynamics attitudes in the Beijiang River Basin from 1980 to 2020 (units/%).
Land Use Type1980–19901990–20002000–20102010–20201980–2020
Single dynamic degreesCultivated land−0.06−0.10−0.31−0.12−0.60
Forest land0.020.000.00−0.04−0.03
Grassland−0.17−0.05−0.46−0.04−0.74
Water0.521.230.790.312.58
Construction land0.200.233.091.694.50
Unused land0.23−0.12−0.185.705.67
Comprehensive dynamic degrees 0.020.030.090.050.18
Table 7. The Beijiang River Basin’s land cover type transfer matrix, 1980–2020 (unit: km2).
2020
1980Cultivated LandWoodlandGrasslandWaterConstruction LandUnused LandTotalTransition-out Area
Cultivated land8591.86374.7439.04248.05434.100.449688.241096.38
Forest land320.7232,508.83125.4285.57240.441.6533,282.62773.79
Grassland47.00261.912430.9210.5750.320.342801.05370.13
Water57.5727.194.55576.6827.610.09693.70117.02
Construction land122.9624.029.4713.54539.641.02710.66171.01
Unused land0.150.120.020.140.301.422.140.72
Total9140.2533,196.812609.41934.551292.424.9747,178.412529.06
Transition-in area548.39687.98178.50357.87752.783.552529.06
Table 8. Statistics on the area and percentage of the three ESs.
ES TypeEcological Source Area (km2)Ecological Corridor Area (km2)Total ES Area (km2)Percentage
BES11,224.63983.1512,207.7825.86
SES12,655.811910.9414,566.7530.86
IES14,457.513088.2917,545.837.17
Table 9. The Beijiang River Basin’s land use change area and rate under four development scenarios in 2050.
Cultivated LandForest LandGrasslandWaterConstruction LandUnused Land
NDS (km2)9140.6733,202.332610.09934.631292.594.97
EDS (km2)9002.9532,868.412594.251009.941722.747.84
EPS (km2)8912.9532,602.662414.251009.942258.747.58
CDS (km2)8957.9532,966.592639.251009.941628.743.66
NDS (%)−1.51−1.01−0.618.0632.9757.83
EDS (%)−2.49−1.81−7.58.0674.7552.73
CDS (%)−2.00−0.711.128.0626.01−26.37
NDS (%)−1.90−1.07−4.468.0645.5036.00
Disclaimer/Publisher’s Note: The statements, opinions and data contained in all publications are solely those of the individual author(s) and contributor(s) and not of MDPI and/or the editor(s). MDPI and/or the editor(s) disclaim responsibility for any injury to people or property resulting from any ideas, methods, instructions or products referred to in the content.

