Article

Verification of Construction Method for Smart Liners to Prevent Oil Spill Spread in Onshore

1
Corporate Affiliated Research Institute, UCI Tech, 313 Inha-ro, Michuhol-gu, Incheon 22012, Republic of Korea
2
R&D Center, GoldenPow Co., Ltd., 412 Samseong-ro, Gangnam-gu, Seoul 06185, Republic of Korea
3
Incheon Disaster Prevention Research Center, Incheon National University, 119 Academy-ro, Yeonsu-gu, Incheon 22012, Republic of Korea
4
Department of Urban Infra Engineering, Halla University, 28 Halladae-gil, Wonju-si 26404, Republic of Korea
*
Authors to whom correspondence should be addressed.
Sustainability 2024, 16(23), 10626; https://doi.org/10.3390/su162310626
Submission received: 25 October 2024 / Revised: 25 November 2024 / Accepted: 3 December 2024 / Published: 4 December 2024
(This article belongs to the Special Issue Geoenvironmental Engineering and Water Pollution Control)

Abstract

:
Onshore oil spills are directly related to soil contamination and significantly impact groundwater, vegetation, and human life. Immediate cleanup work is carried out when an oil spill occurs, but the currently used preventive measures are insufficient. Therefore, this study independently developed a smart liner that allows general groundwater flow but blocks groundwater in the event of a spill to prevent further spread, and aims to verify the excellence of the product through verification. Because the verification of the smart liner performance in real-life conditions is difficult for various reasons, large-scale experiments were simulated using a container. The Roll Spreading and Inserting Method (RSIM) and Panel Injecting Method (PIM) were used as installation methods due to the properties of the material employed. Through rainfall simulations, the discharge amount and groundwater levels before and after an oil spill were measured, and a reaction diagram was created following the smart liner’s demolition. From the results, it was found that both installation methods successfully blocked more than 99% of the drainage, and soil contaminants were not detected outside the installation area. These results confirm the effectiveness of the smart liner. Additionally, the reaction diagram indicated that the RSIM and PIM installation reaction areas were identical, validating the suitability of both methods. By conducting this study, the performance of the smart liner was verified, demonstrating its potential as an effective preventive measure against the spread of oil contamination in soil.

1. Introduction

Oil is an essential energy source for humans, and production in the oil industry has been steadily growing, increasing from 97 million barrels per day in 2015 to 100 million barrels per day in 2021 [1,2,3]. However, alongside this growth, environmental issues due to oil spills have been consistently noted. According to the ITOPF (International Tanker Owners Pollution Federation) report, although oil spill incidents have decreased since the 1970s, the annual spill volume in the 2010s reached 164,000 tons [4]. Currently, 20% of oil spills occur onshore; in the past, they mainly occurred in pipelines. Recently, they have occurred in tanks and onshore facilities, including those used for crude oil storage [5,6]. Consequently, the oil industry is paying more attention to the environment and is making efforts to reduce oil spills by setting stricter standards and regulations [7].
Onshore oil spills pose serious environmental, socioeconomic, and safety problems. These spills can contaminate soil and groundwater, harm plant and animal life, and pose health risks to nearby communities. In addition, socioeconomically, oil spills can devastate local economies, especially those dependent on agriculture or tourism. On land, oil spills affect soil. Oil spills in soil mainly occur at gas stations and refineries, where the soil is exposed to small but continuous oil leaks [8]. Oil becomes physically or chemically attached to soil particles or trapped within the soil matrix [9]. When the oil concentration in soil reaches a level of 20 to 50 g/kg−1, it is considered a threat to human health and the environment [10]. The primary objective of oil spill responses is to control the source of the spill and prevent the spread of oil. Mechanical equipment such as skimmers, booms, barriers, absorbents, dispersants, and in situ burning control is used for spill removal, and bioremediation is actively utilized [11,12]. However, these methods are utilized post-incident, and if oil spill occurrences are not monitored, the timing of response measures can be significantly delayed.
In terms of sustainability, oil spills involve many problems. For oil companies, oil spills not only affect the environment but also bring about a lot of pressure from civil society and governments. This can lead to damage to the company’s international brand reputation and government intervention or coercion into their operations [13,14,15,16]. In addition, these companies have a responsibility to build social trust through safe operation and environmental protection in the development and sale of oil, and to form a sustainable society. In terms of environmental and economic aspects, oil spills cause environmental destruction and waste of resources, which have a negative impact on sustainable development.
Although efforts are made to prevent oil spills for the development and sustainability of the oil industry, oil spills can occur onshore for various reasons. Most of these are caused by the lack of maintenance capacity of oil infrastructure, aging facility scale, and inadequate regular inspection [17]. Many onshore pipelines and storage facilities were installed decades ago, and their materials deteriorate over time. Without regular maintenance and timely replacement, these structures become vulnerable to leakage and rupture. In addition, accidents caused by human error during operation, theft in areas with social and political problems, and natural disasters such as earthquakes, floods, and hurricanes are causes that cannot be completely controlled.
Therefore, in the past, the technology to detect the area where oil spills occurred was mainly studied, and the monitoring technology based on visual surveys using the Shoreline Clean-up Assessment Technique is representative [18,19]. In addition, remote sensing technology using self-light source or infrared/ultraviolet light for tracking and mapping is being actively developed [20,21,22,23]. At this time, when an oil spill occurs, control and blockade of the area are performed, and various methods are being proposed. The representative blocking method is a vertical wall. It is installed around the contaminated area to block the movement of liquid substances including groundwater. Representative examples include mud walls, grouting walls, sheet pile walls, subsoil mixing, geomembranes, and lining technology. The permeability of the barrier material should be less than 10−7 m/s [24,25,26]. Then, a purification method for the contaminated soil is performed. Purification methods such as incineration, soil washing, soil vapor extraction, biological methods, and pyrolysis are mainly performed and are applied in various ways depending on the environment [27,28,29].
However, these methods are post-processing technologies when an oil spill occurs. Blocking the contaminated area can interfere with the flow of groundwater. This can affect ground stability by raising and lowering the groundwater level in the surrounding ground, so it should not be installed in advance. Accordingly, it is considered that the method of filtering oil through the construction of Permeable Reactive Barriers (PRBs) [30] or blocking oil spills using smart liners [31,32,33,34] is advantageous in terms of prior prevention and ground sustainability. Here, PRBs are installed in the groundwater flow path and consist of a zone of reactive material, such as granular iron. These barriers act as a filtration system, allowing groundwater to pass through while capturing and filtering out oil contaminants, ensuring that the groundwater leaving the PRB is free of oil substances. However, the installation of PRBs involves mixing with the soil, necessitating preliminary laboratory experiments, numerical analysis, and thorough geotechnical surveys and design. The hydraulic behavior of the subsurface must be fully understood. The performance benefits may not justify how time-consuming and complex this process is. For these reasons, while PRBs can be highly effective in filtering out oil contaminants from groundwater, their implementation requires careful planning, design, and monitoring to ensure optimal performance and environmental protection. In contrast, smart liners can be installed in the ground where oil spills are expected without separate simulations. A smart liner is a type of blocking wall that prevents oil spills and is easy to install and remove, unlike PRBs, which require complicated design, construction, and demolition methods. Smart liners normally allow for the free flow of groundwater, but when they come into contact with oil, they absorb it and block the flow of groundwater within 24 h. Any change in hydraulic behavior around the installation is a sign of an oil spill, and immediate remedial action is undertaken in the area where the smart liner was installed. Even if the amount of oil spill exceeds the capacity of the smart liner to absorb, no spillage is permitted because a barrier is formed.
Smart liners manufactured in fiber form have construction problems. It must be constructed vertically within the ground, but it is difficult to use vertical construction methods such as PRBs, sheet piles, and vertical membranes in the ground due to the material’s lack of rigidity or hardness. Therefore, in previous literature [34], the Roll Spreading and Inserting Method (RSIM), which can be used for this type of construction, was presented through reduction models and numerical analyses. However, this is only a verification of the RSIM’s accessory materials and does not present data showing that it actually completely blocked oil spills or problems in construction.
Therefore, in this study, the smart liner was actually installed by applying the RSIM, and the appropriateness of the method and the efficiency of preventing the spread of oil spills were verified. The verification of the construction method was performed through large-scale experiments using a large container that can control external conditions and variables. Large-scale experiments have the advantage of enabling the smooth control of pollutants and inducing accidents involving exposure to oil substances, as well as continuous and repetitive water permeability tests and the recovery of samples from undamaged smart liners. In addition, a Panel Injecting Method (PIM) that can be applied to high depths and commercialized was designed, and the same experiment as the RSIM was performed.

2. Smart Liner

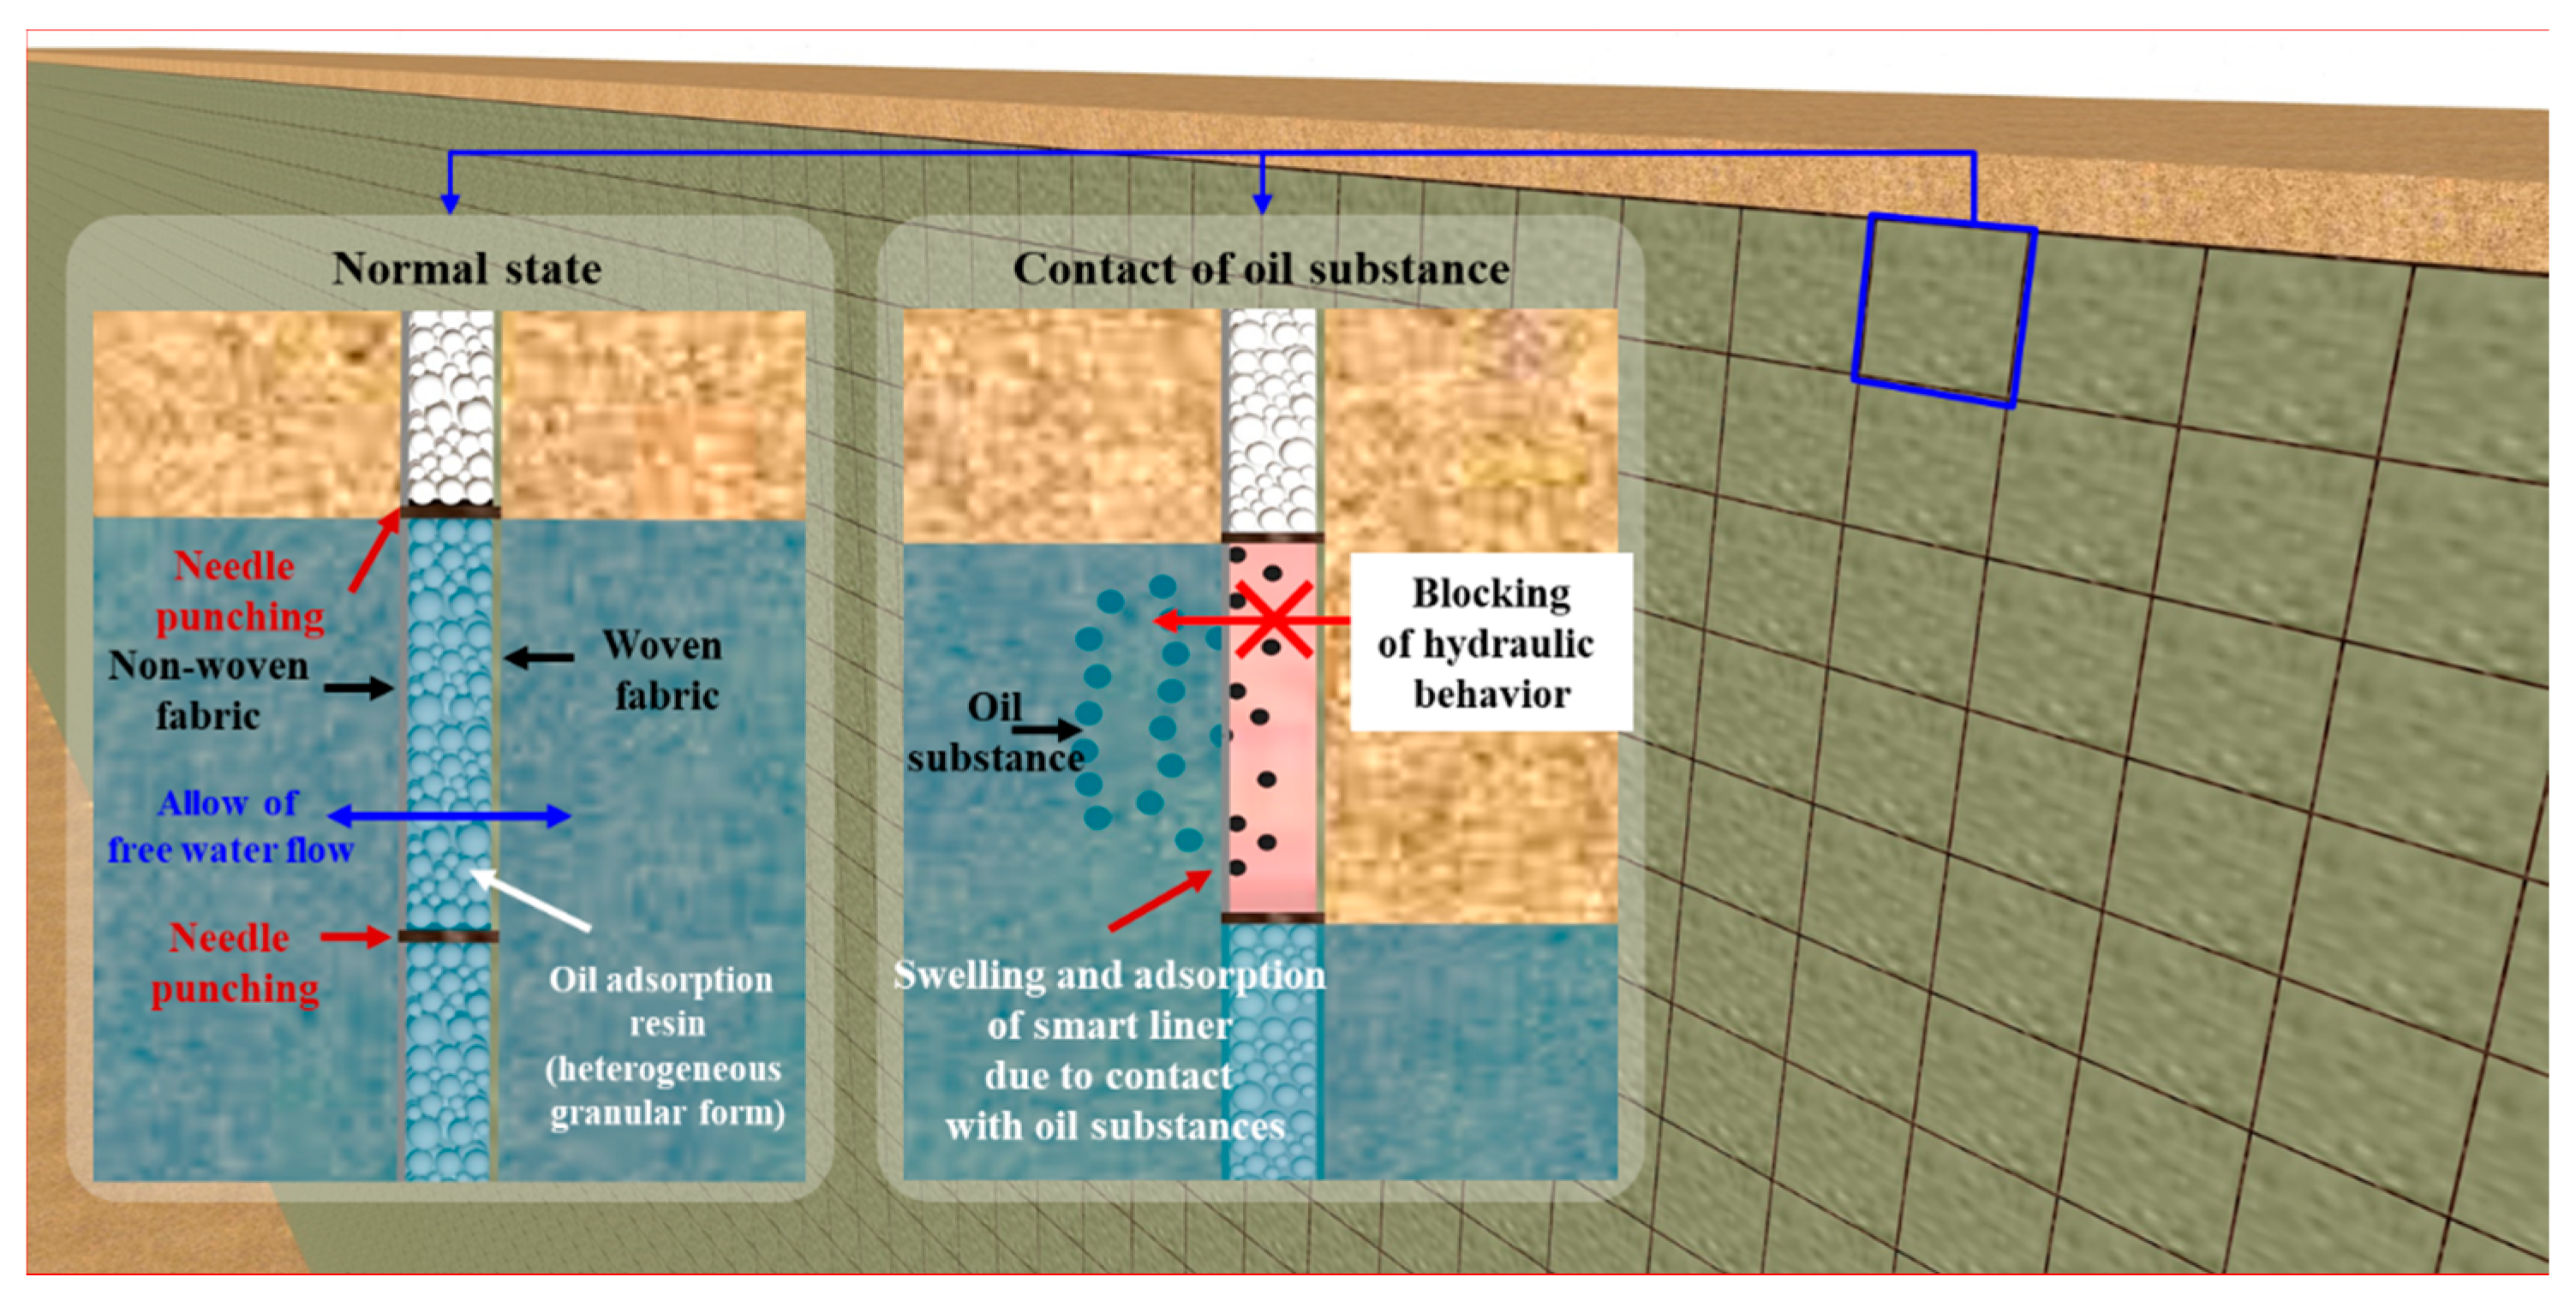
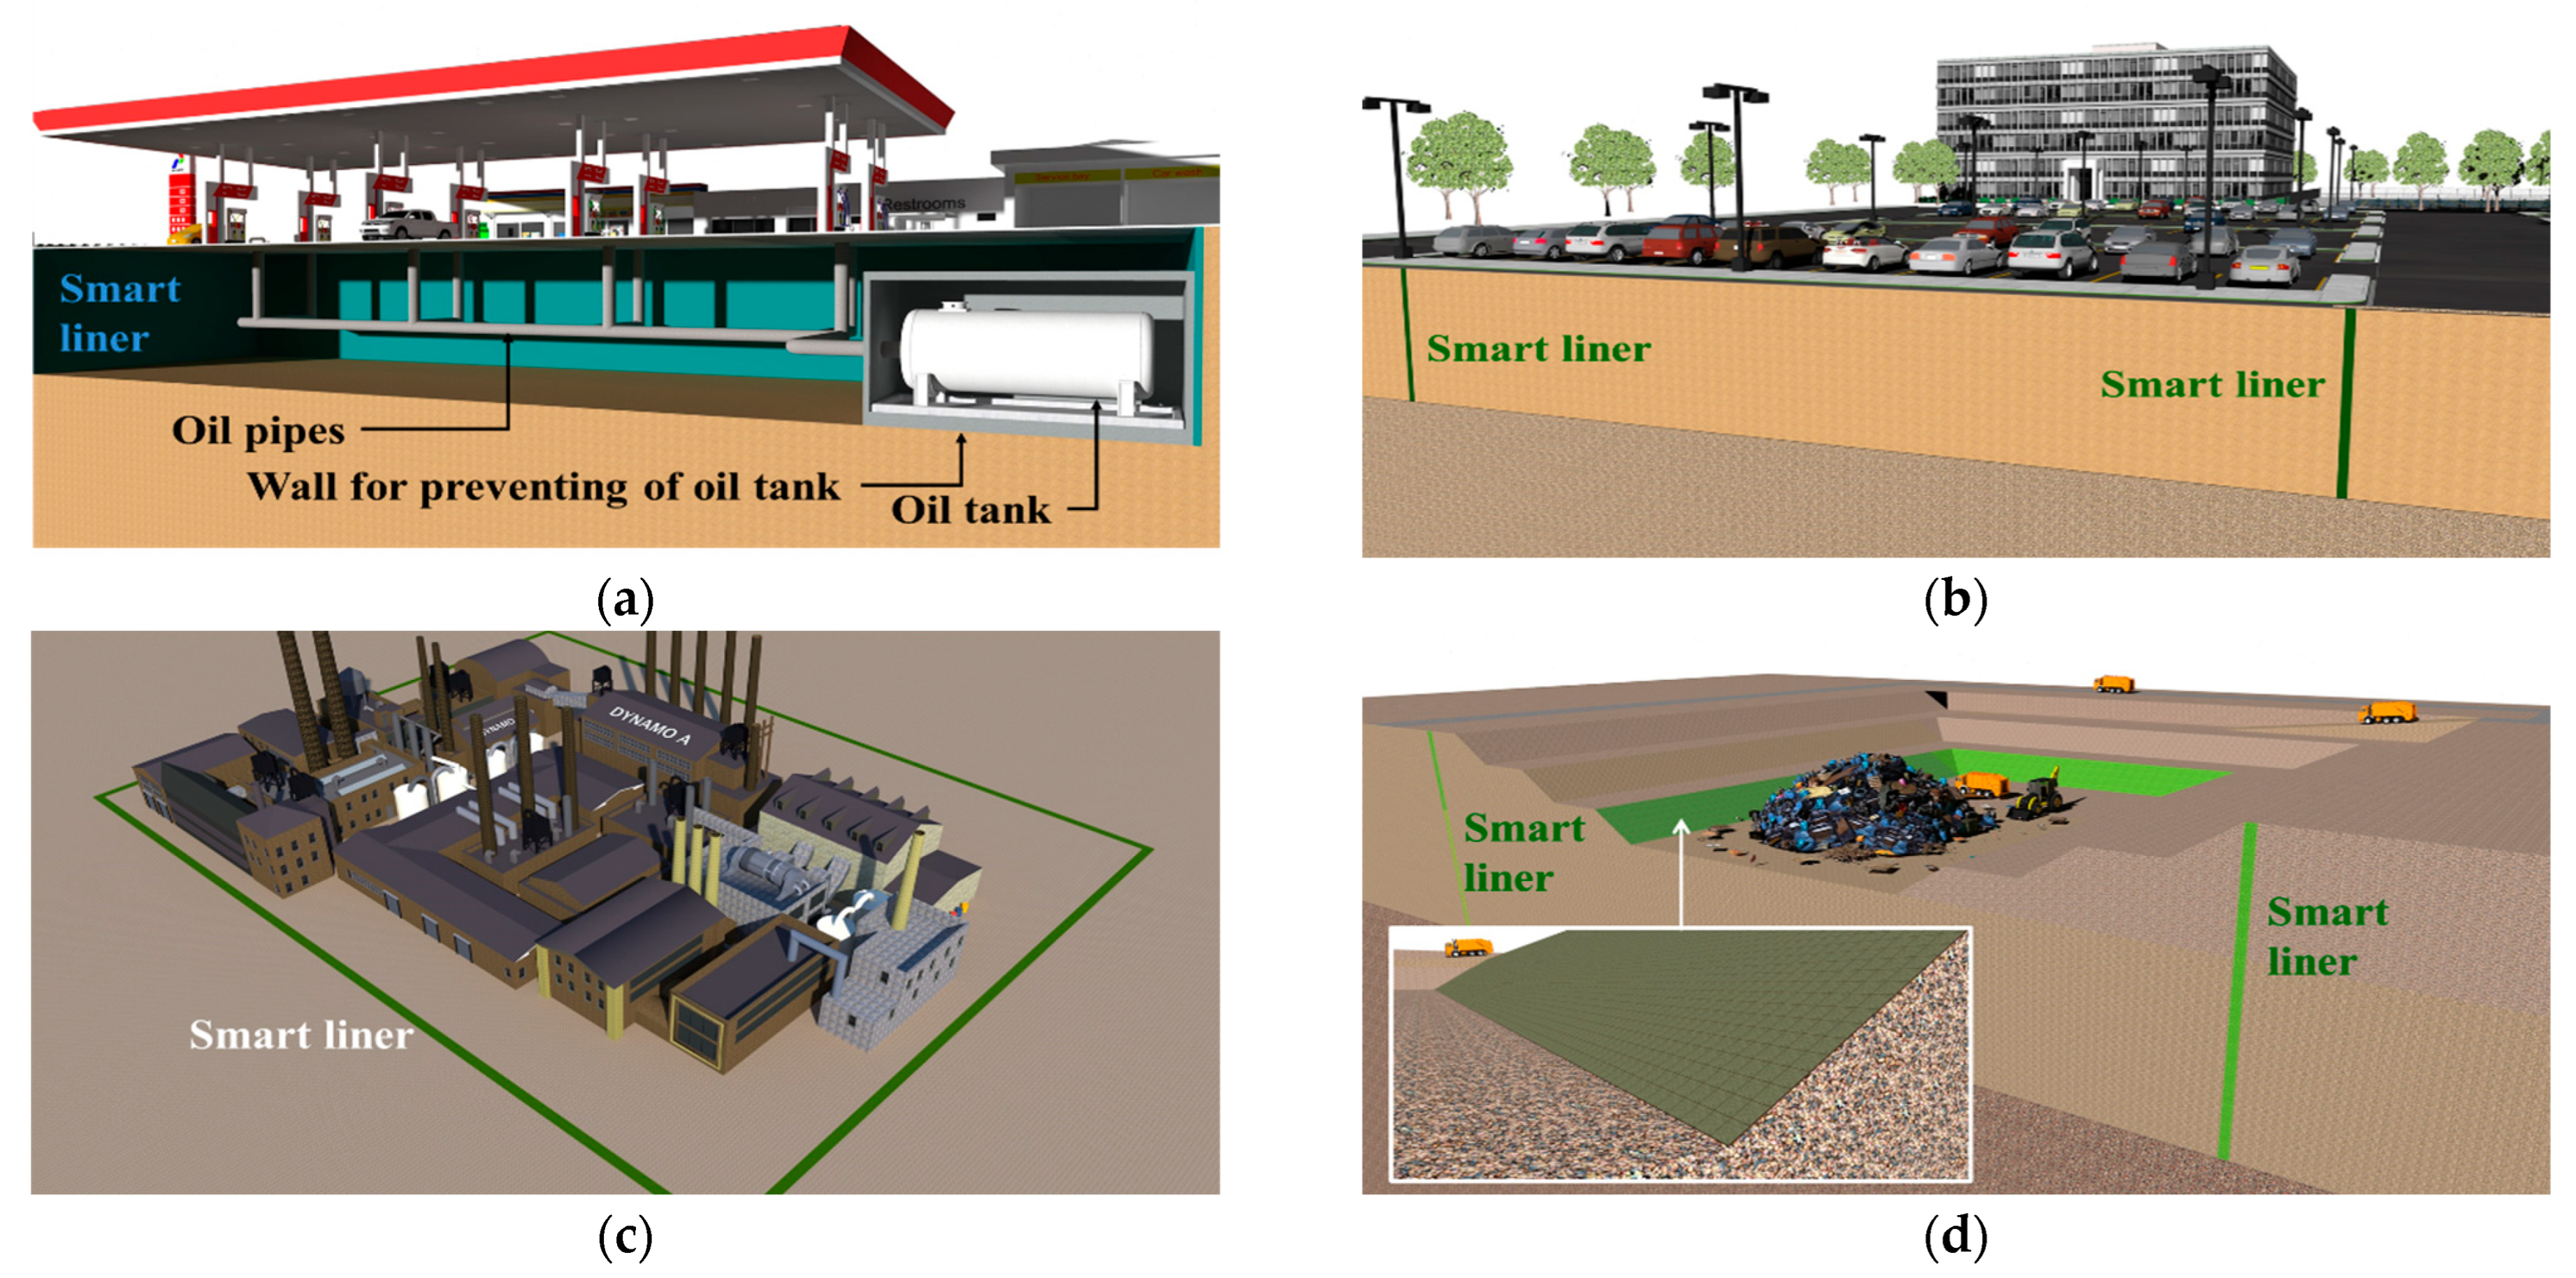
2.1. Principles and Applications

The concept and function of the smart liner designed to prevent the spread of oil spills on the ground are illustrated in Figure 1. The smart liner (Seoul, Republic of Korea) features a triple-matrix structure in the form of fibers (woven fabric, oil-absorbing resin, and non-woven fabric). Under normal conditions, it allows the flow of groundwater. When it comes into contact with oil substances during an oil spill, the oil-absorbing resin within the smart liner absorbs the oil and expands, reducing the permeability coefficient to below 10−7 cm/s. This effectively blocks the hydraulic behavior and prevents the leakage of oil substances.
The main applications of the smart liner are shown in Figure 2, consisting of (a) oil station sites that have double piping that transfers oil to the tank room and an oil pump where there is a risk of oil leakage; (b) large-scale parking facilities such as parks or complex shopping malls with high concentrations of automobiles; (c) factories and large industrial facilities handling chemicals and oils at risk of spillage; and (d) as a barrier material in landfills, slopes, and external walls to prevent oil contamination. In each application, if a small amount of oil is spilled, the smart liner will absorb it all, and although it cannot completely block it, it can help prevent it from spreading.

2.2. Construction Methods

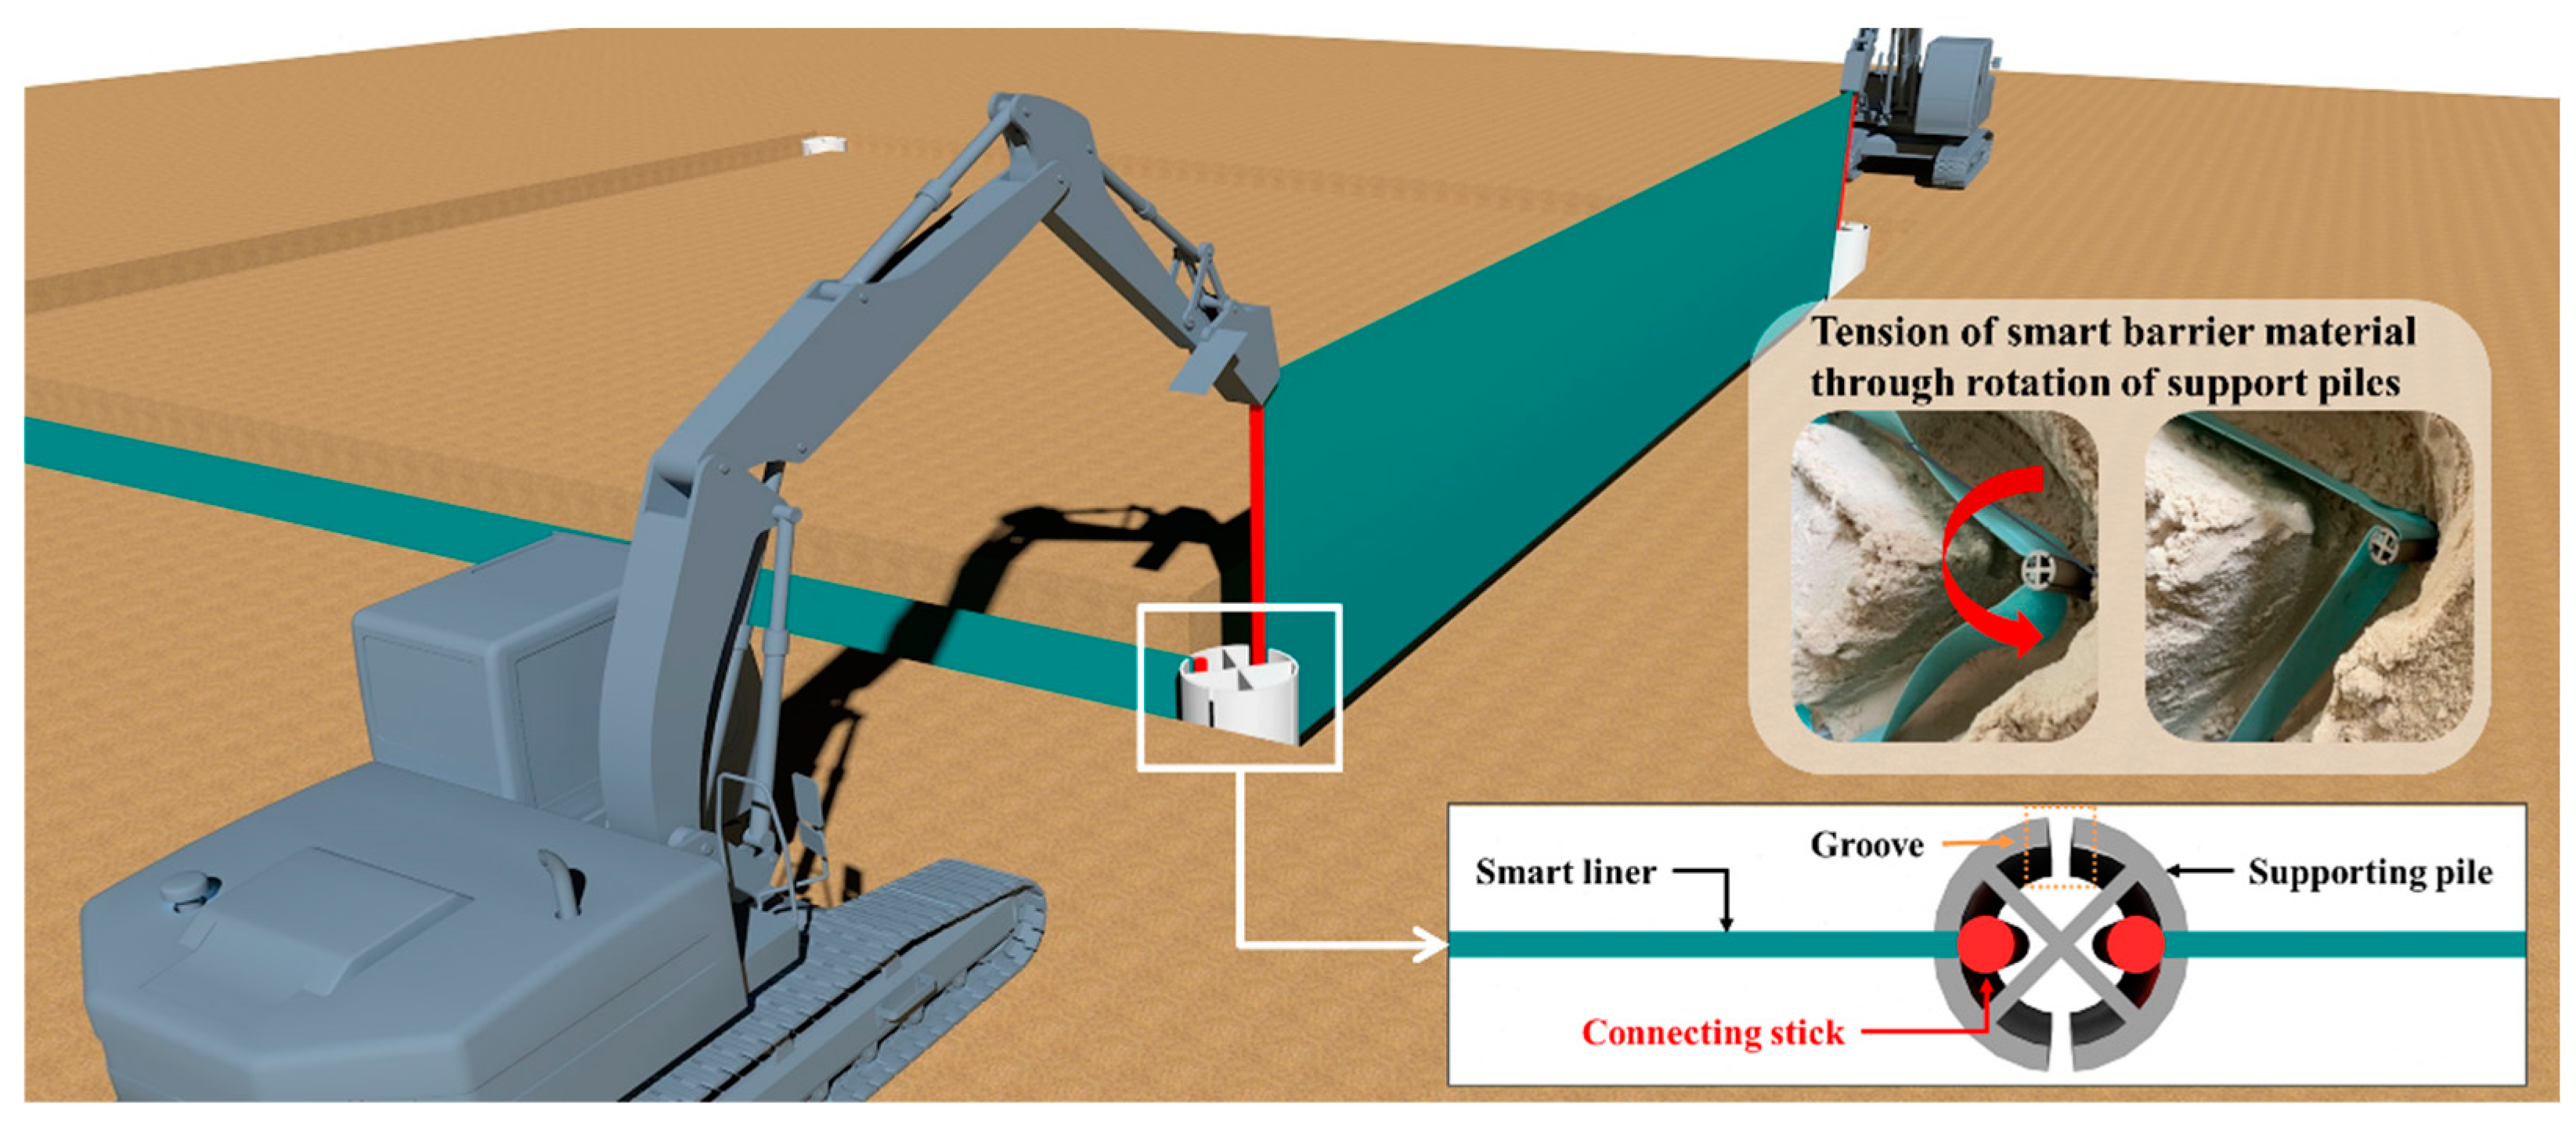
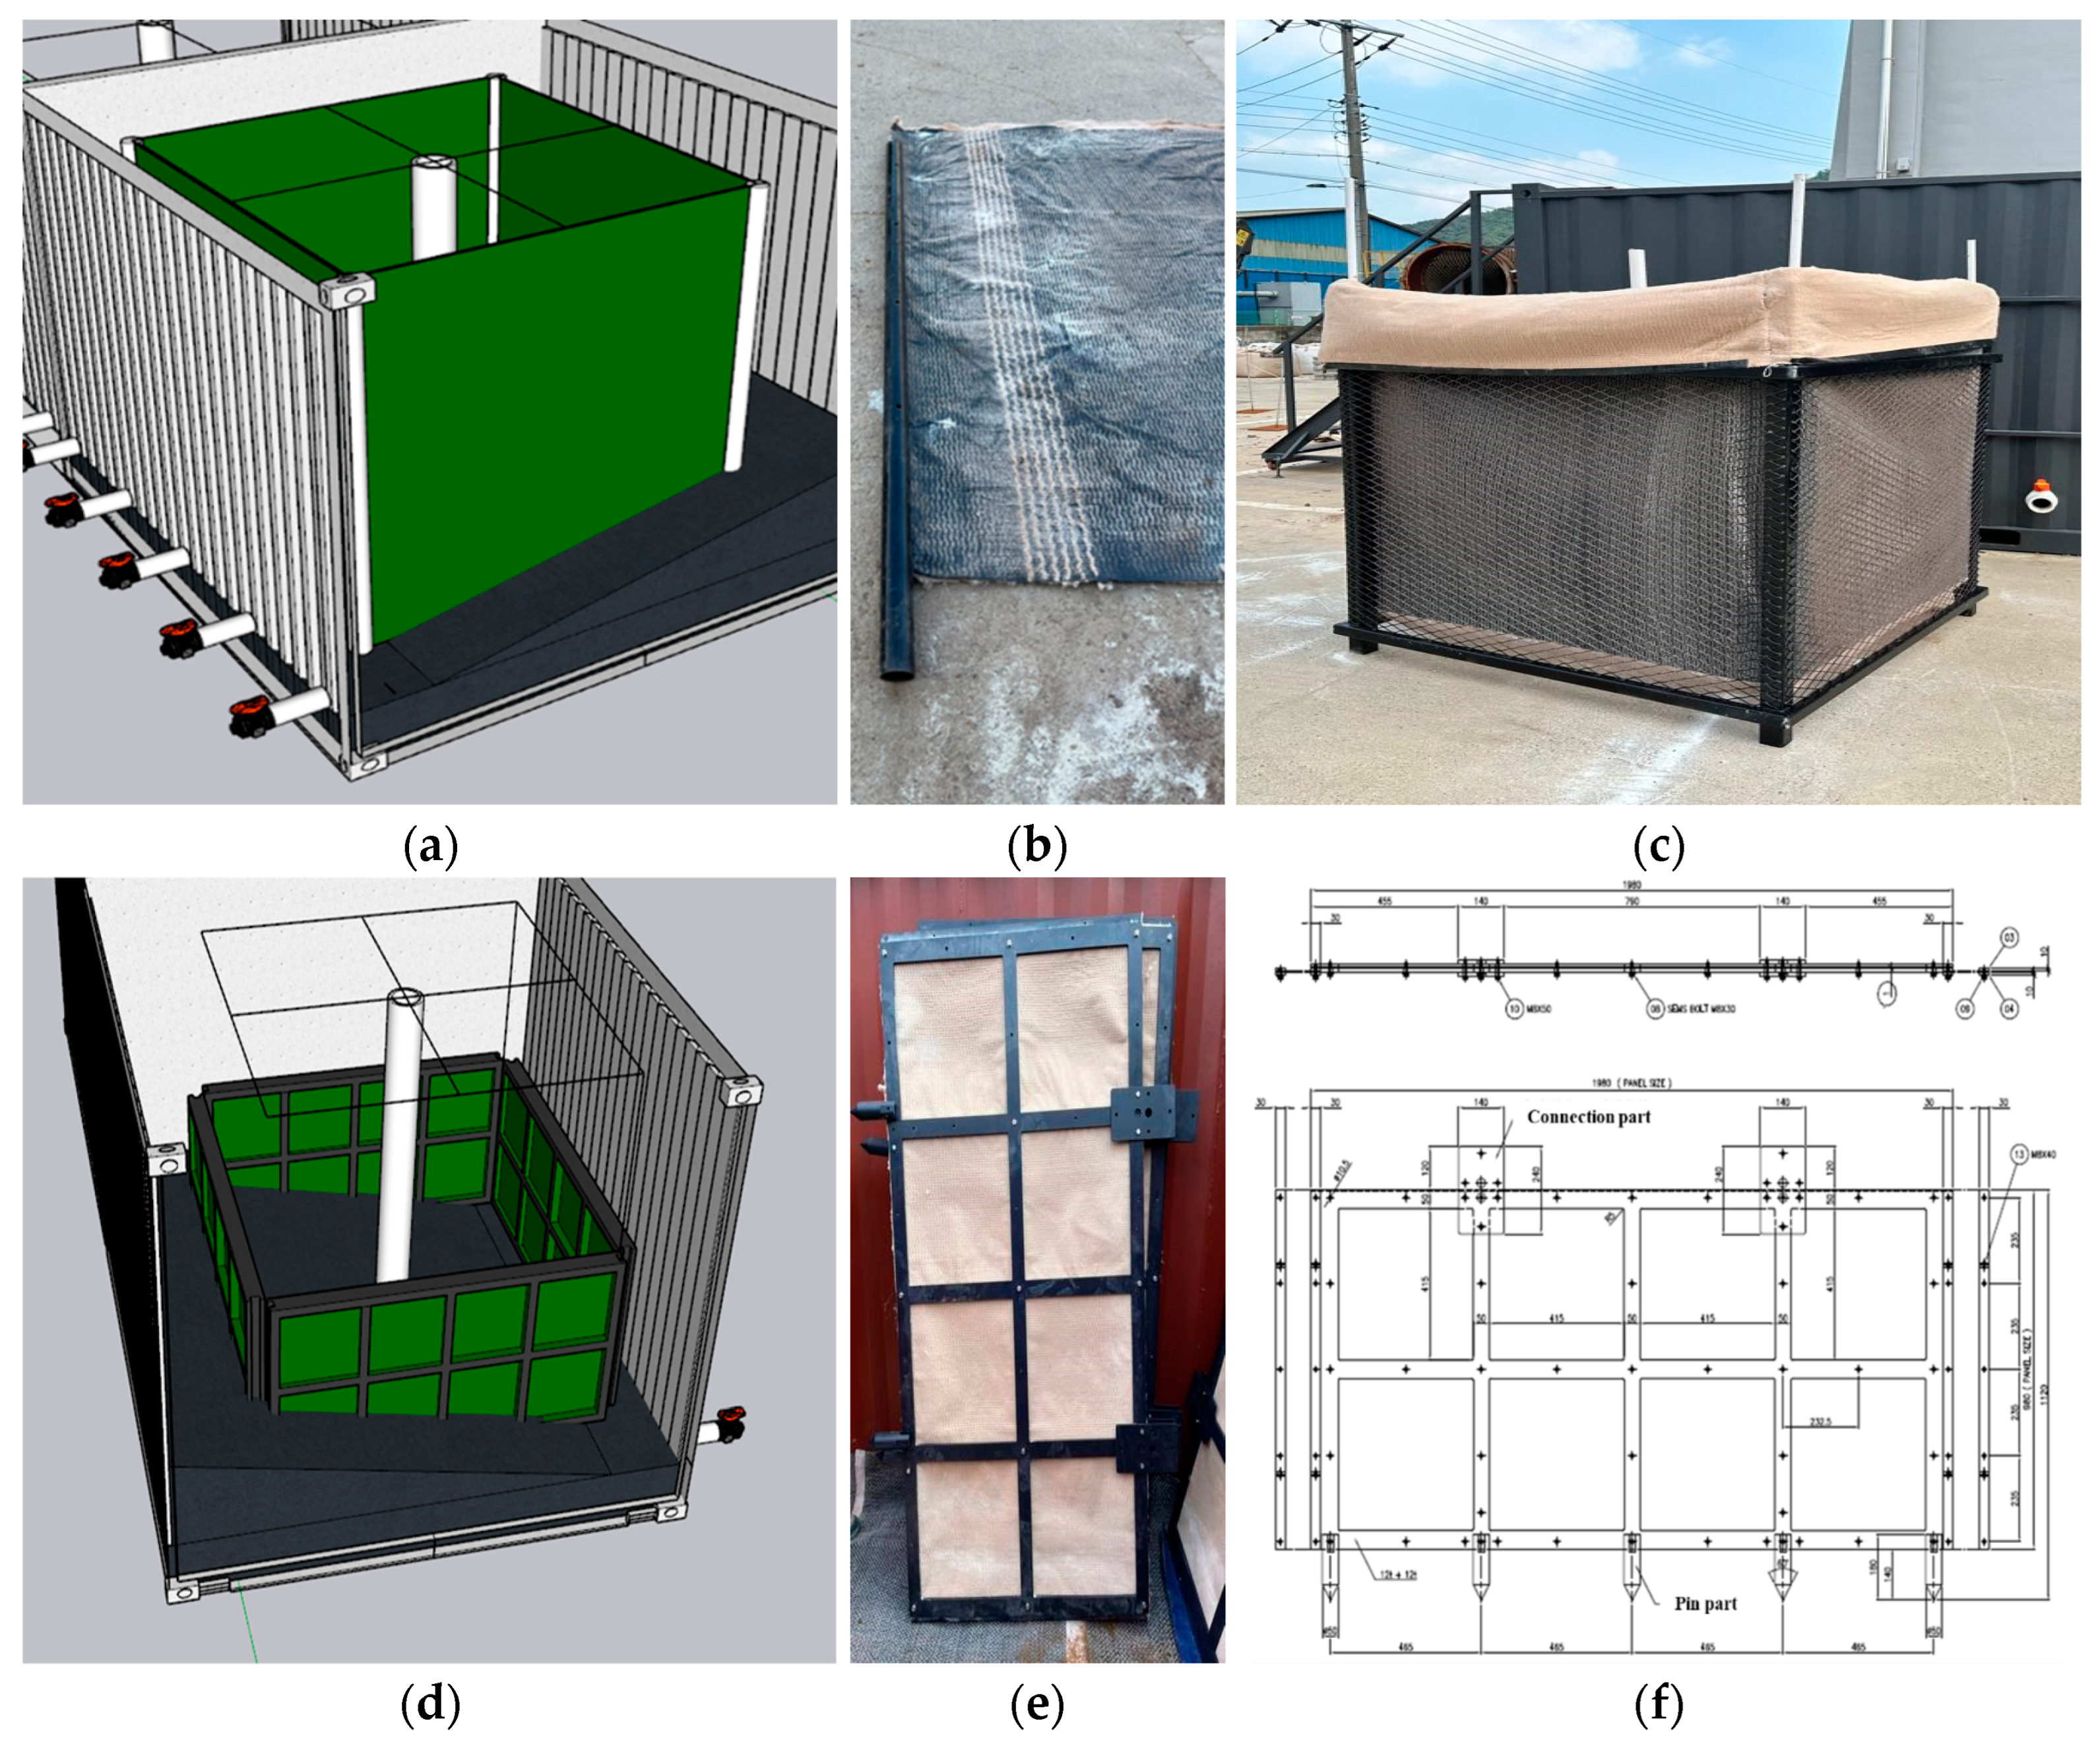
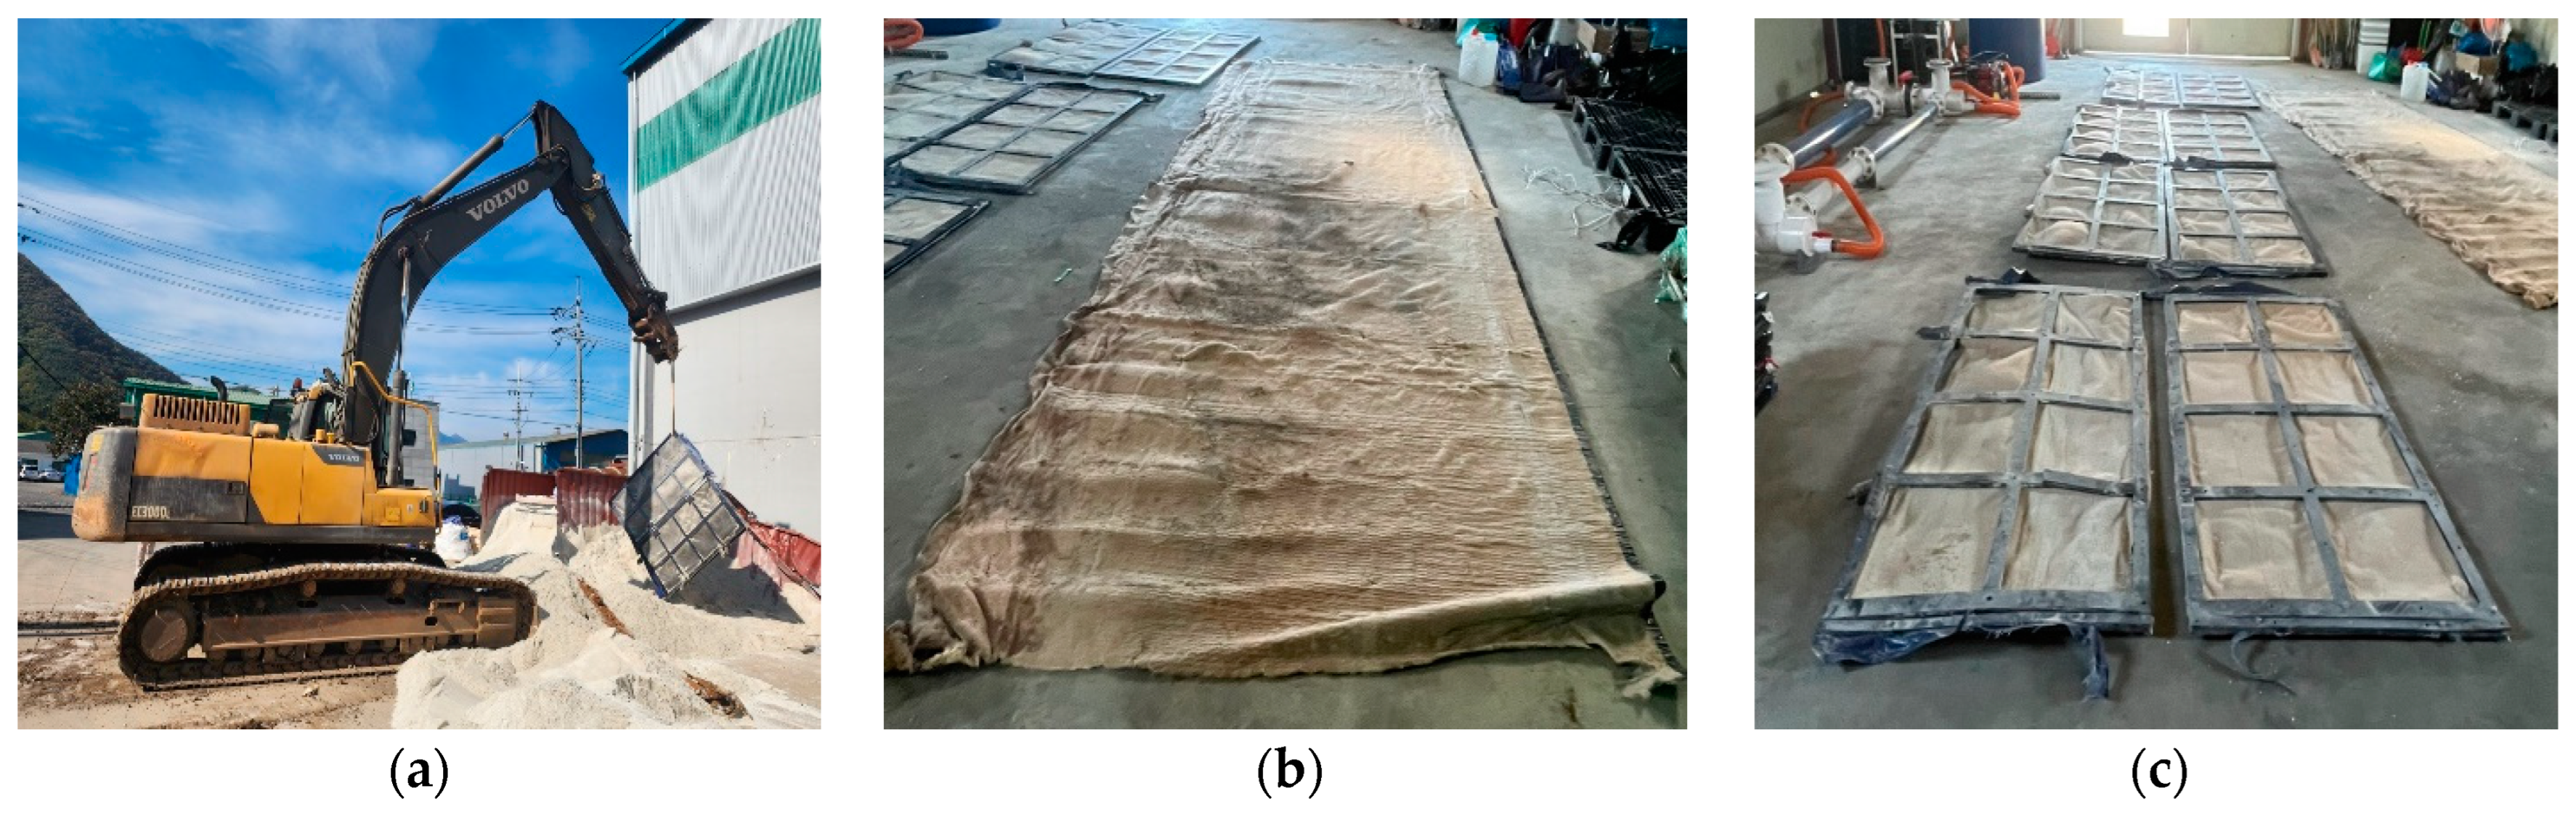
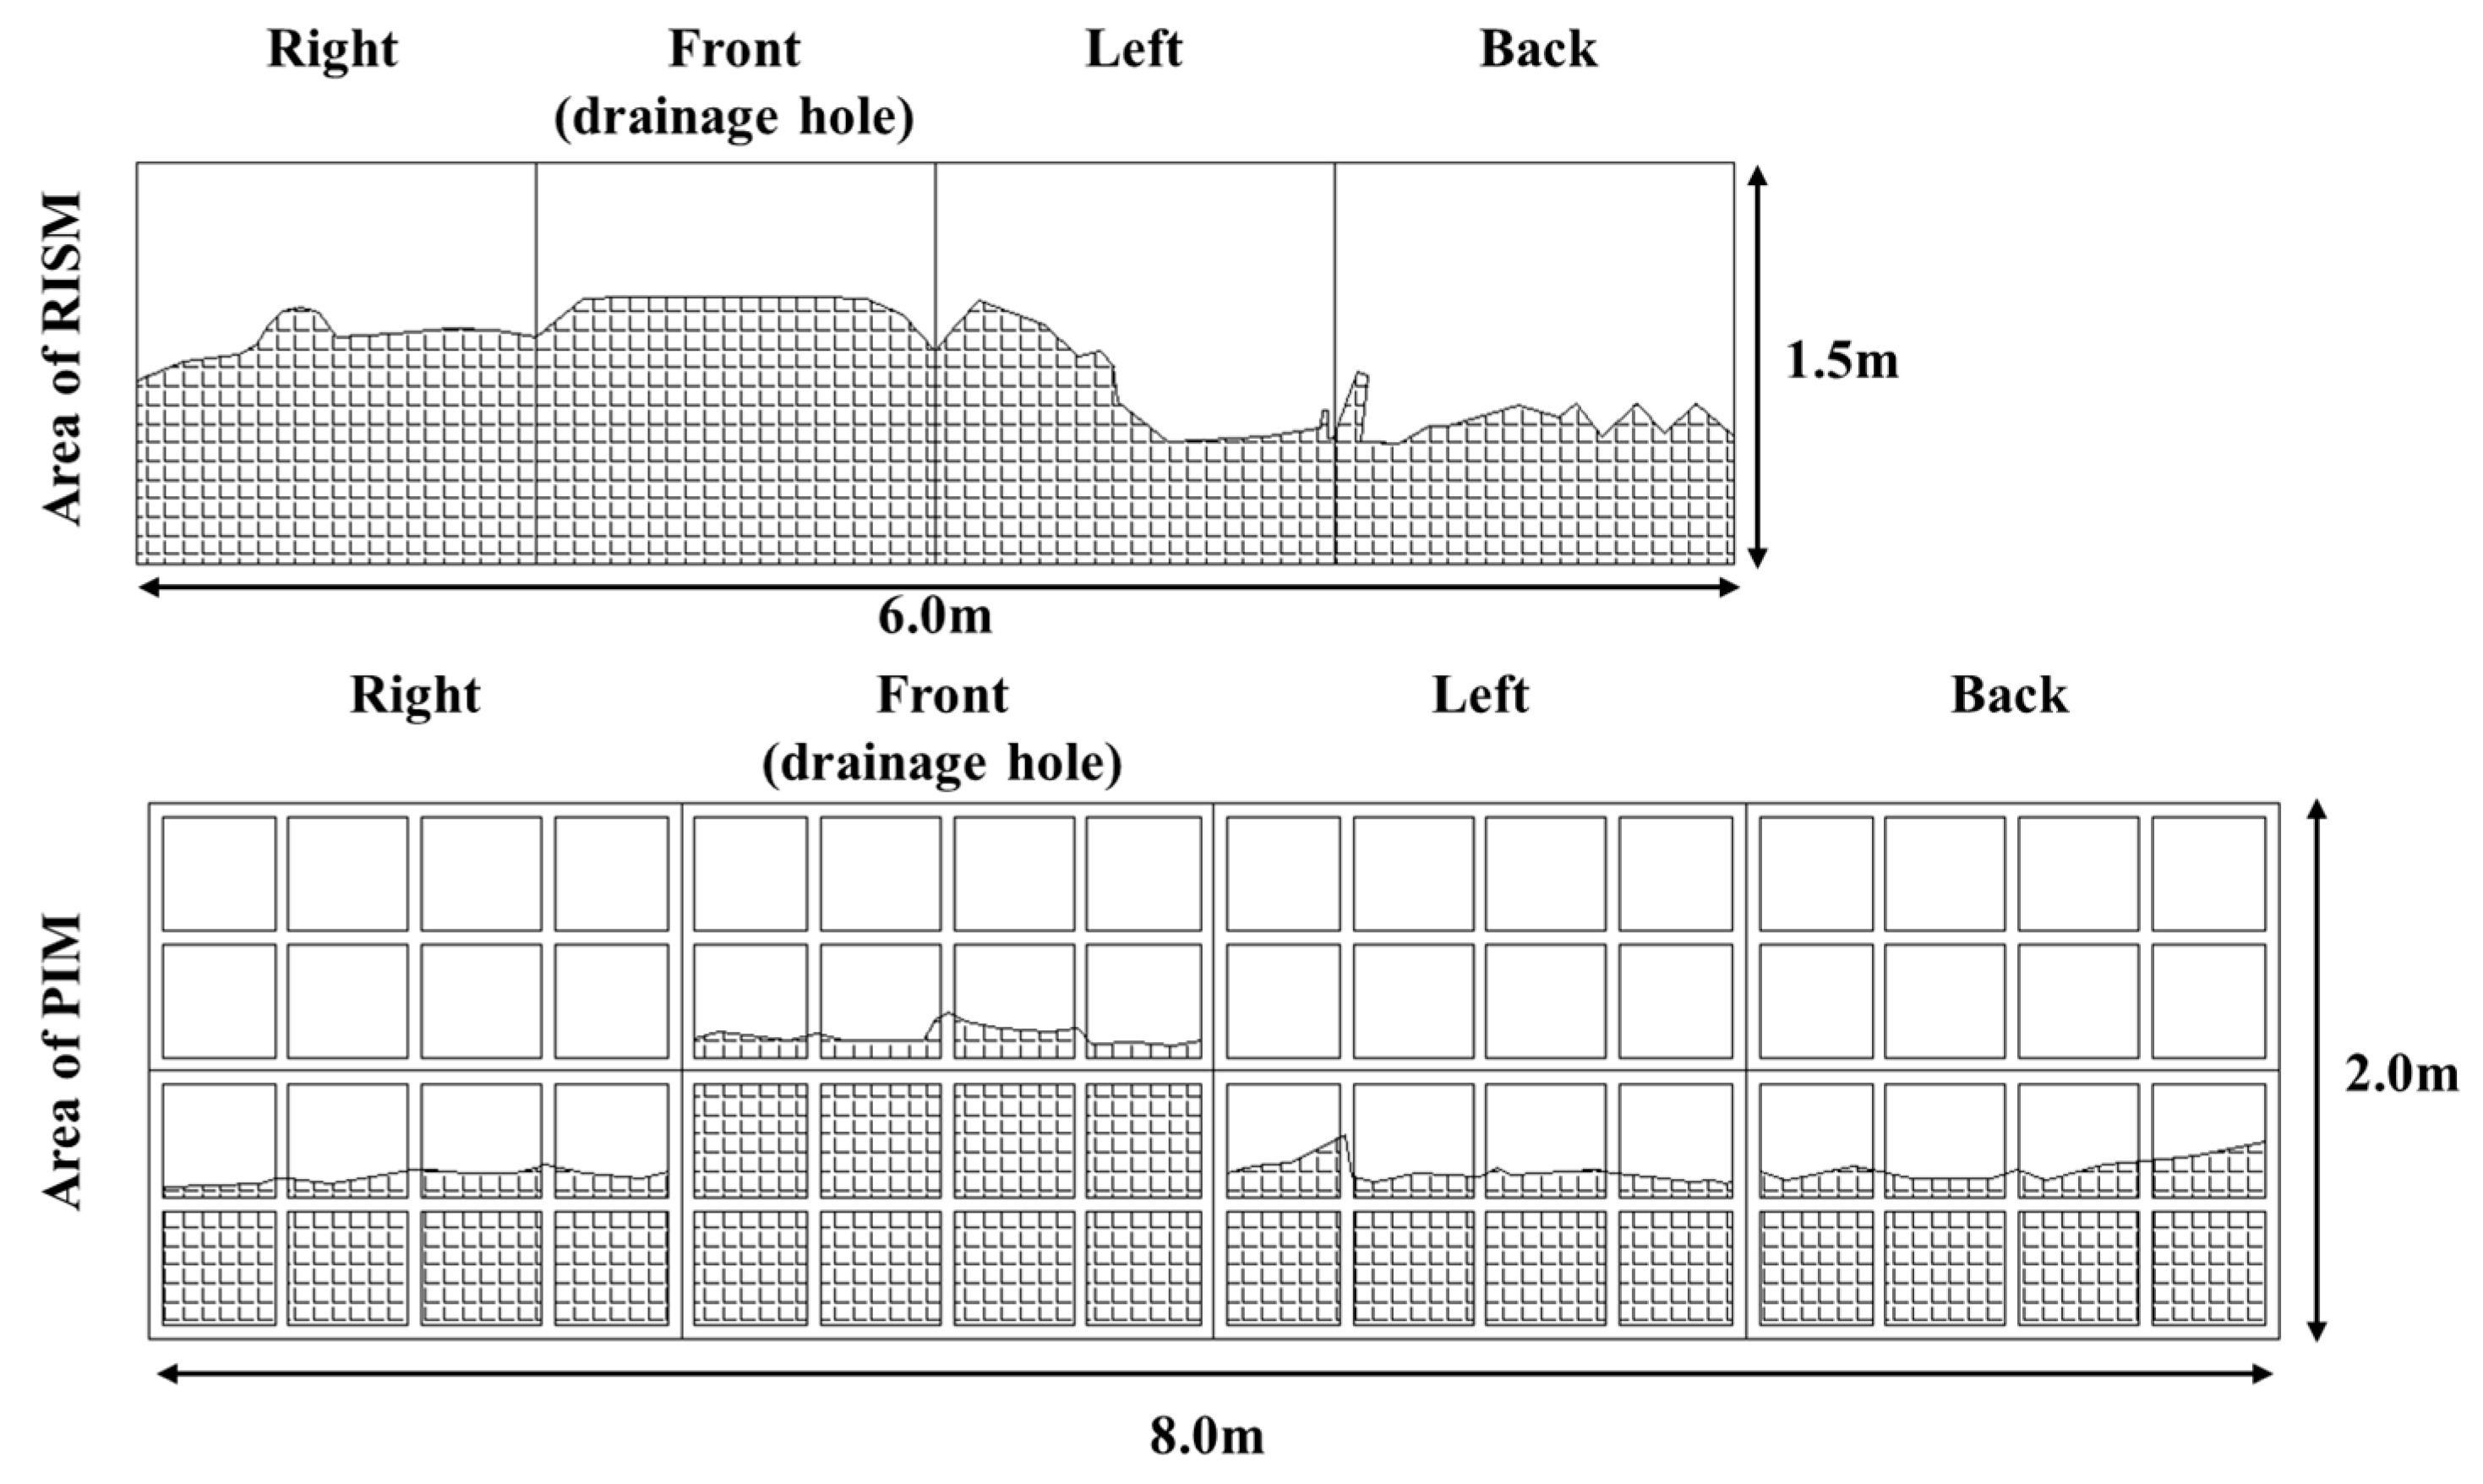
2.2.1. Roll Spreading and Inserting Method (RSIM)

The RSIM is a construction method using two backhoes after the smart liner has been fully unrolled, as shown in Figure 3 [34]. First, trench excavation is carried out on the outer part of the construction area, and supporting piles are driven into the curved point within the excavation range for the straight installation of the smart liner. Afterward, the smart liner is cut at a length longer than a specific distance (the distance between supporting piles). A connecting stick is attached to the end of the smart liner and is inserted into the groove within the support pile using a backhoe. At this time, since the installed smart liner is not under tension, this is generated by rotating the supporting pile vertically and horizontally. Finally, when installation is completed, it is buried in the ground through backfill.

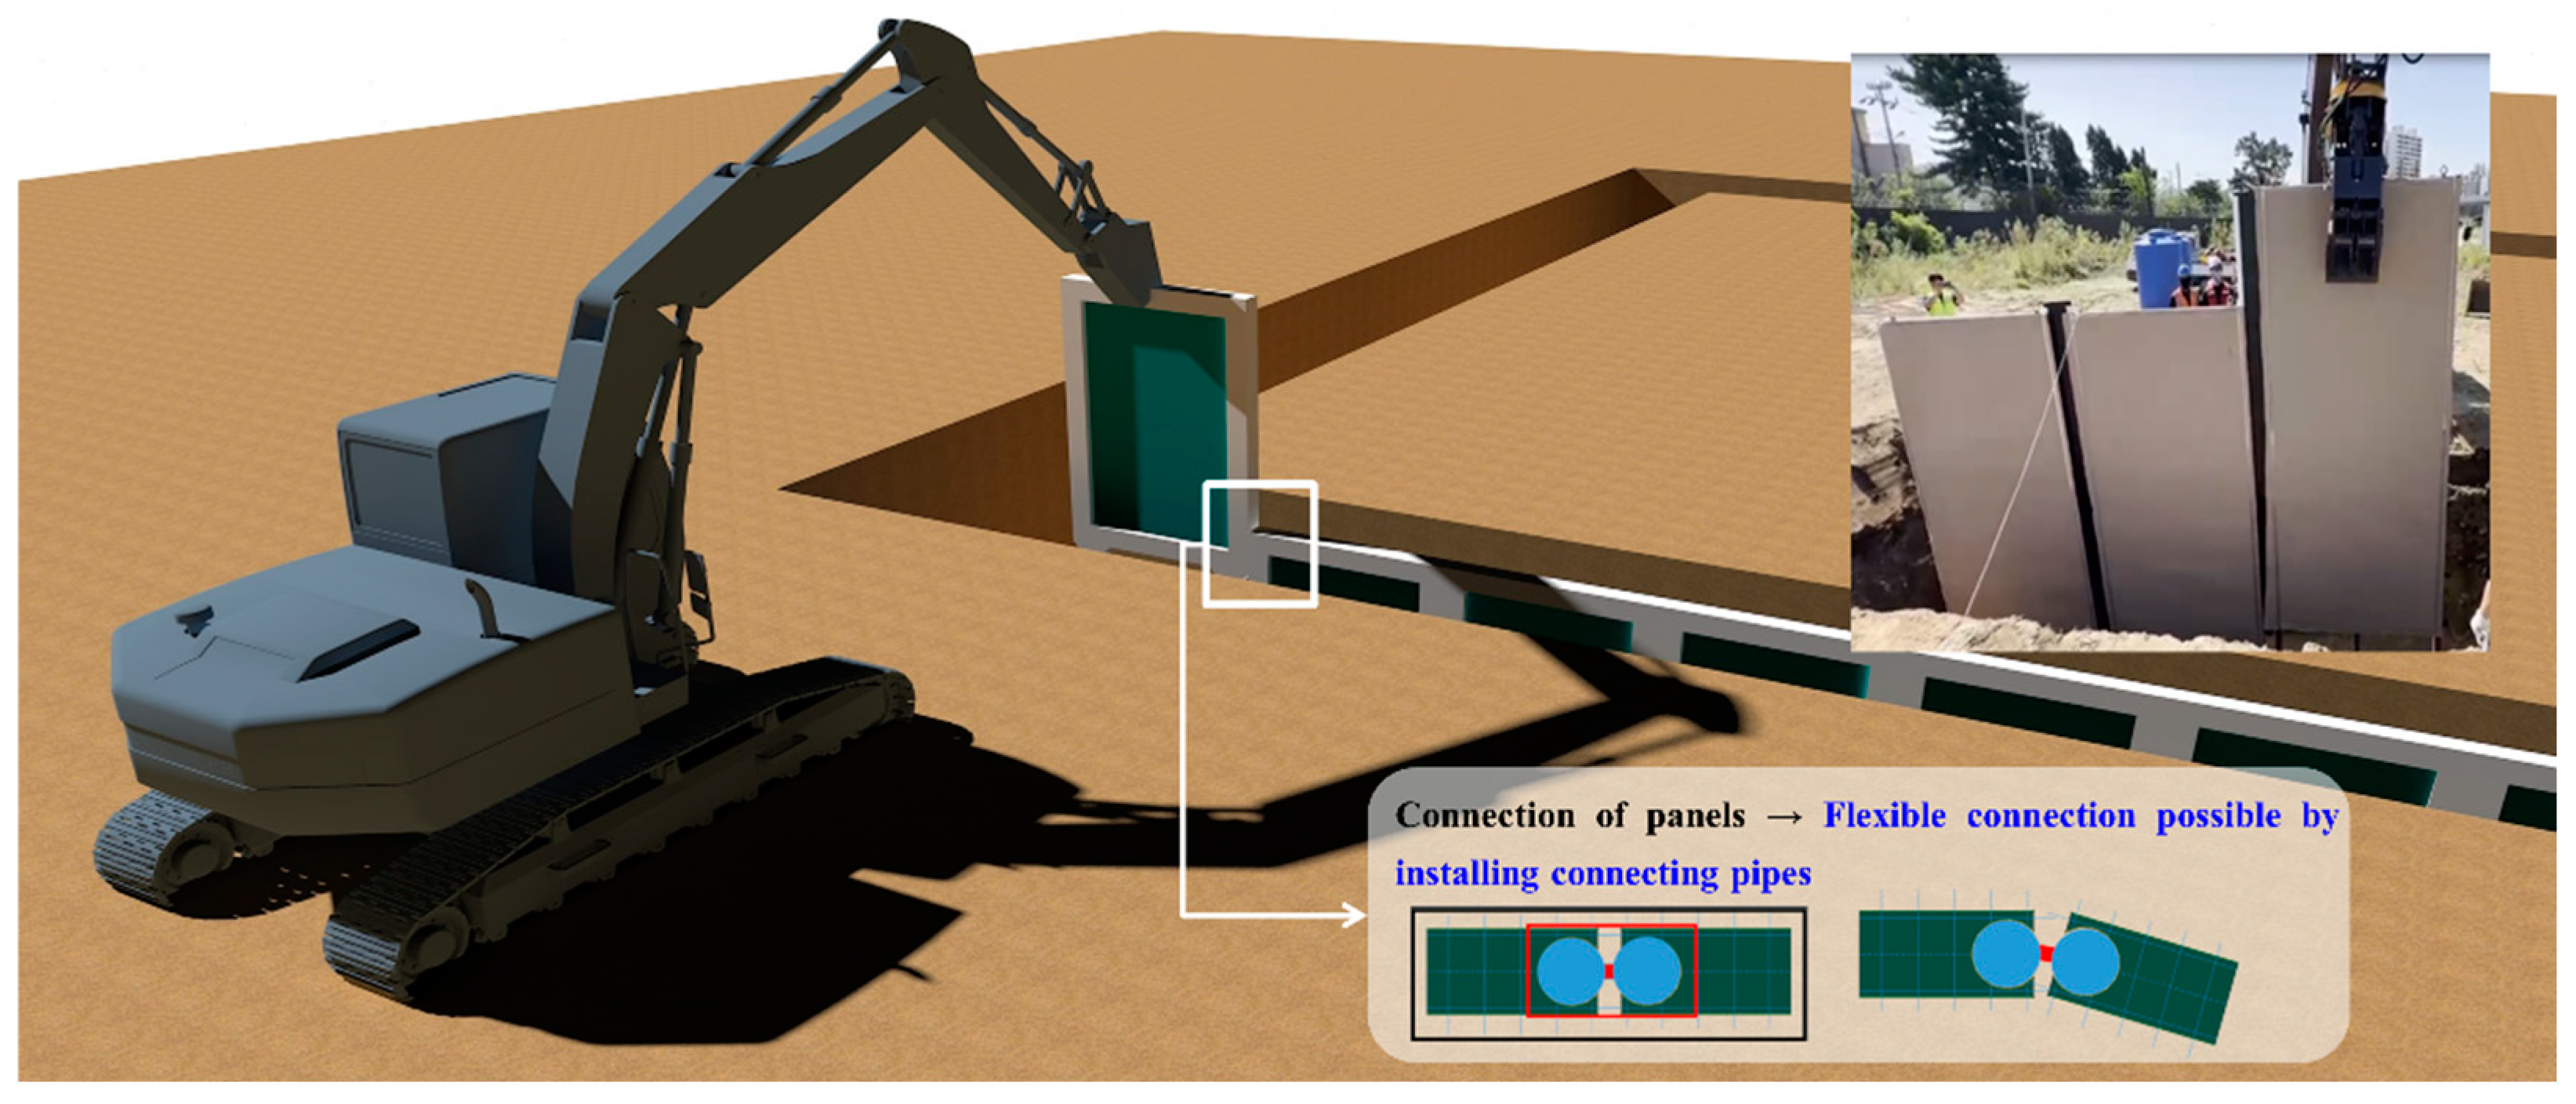
2.2.2. Panel Injecting Method (PIM)

In the case of the RSIM, the maximum production width of the roll-type smart liner is 3 m, so construction is possible only at a depth of 3 m. The PIM was designed to allow smart liners to be installed at heights of 3 m or more. Compared to the RSIM, the PIM can be used at various construction depths and has a simple construction process that involves simply pressing the smart liner into the ground.
The PIM is a method of embedding and connecting panels to the bottom of an excavation without special construction equipment or support facilities, as shown in Figure 4. This allows for the assembly of panels and smart liners on-site, which can be performed with just one backhoe. The construction method involves installing the first panel and inserting the second panel with connecting pipes into the first panel during the injecting process. This process is applied to the entire construction area. In this study, the material of the connecting pipe is rubber to enable complete waterproofing and a flexible connection, and it is completely combined with the panel. When installation is complete, it is buried in the ground through backfill.

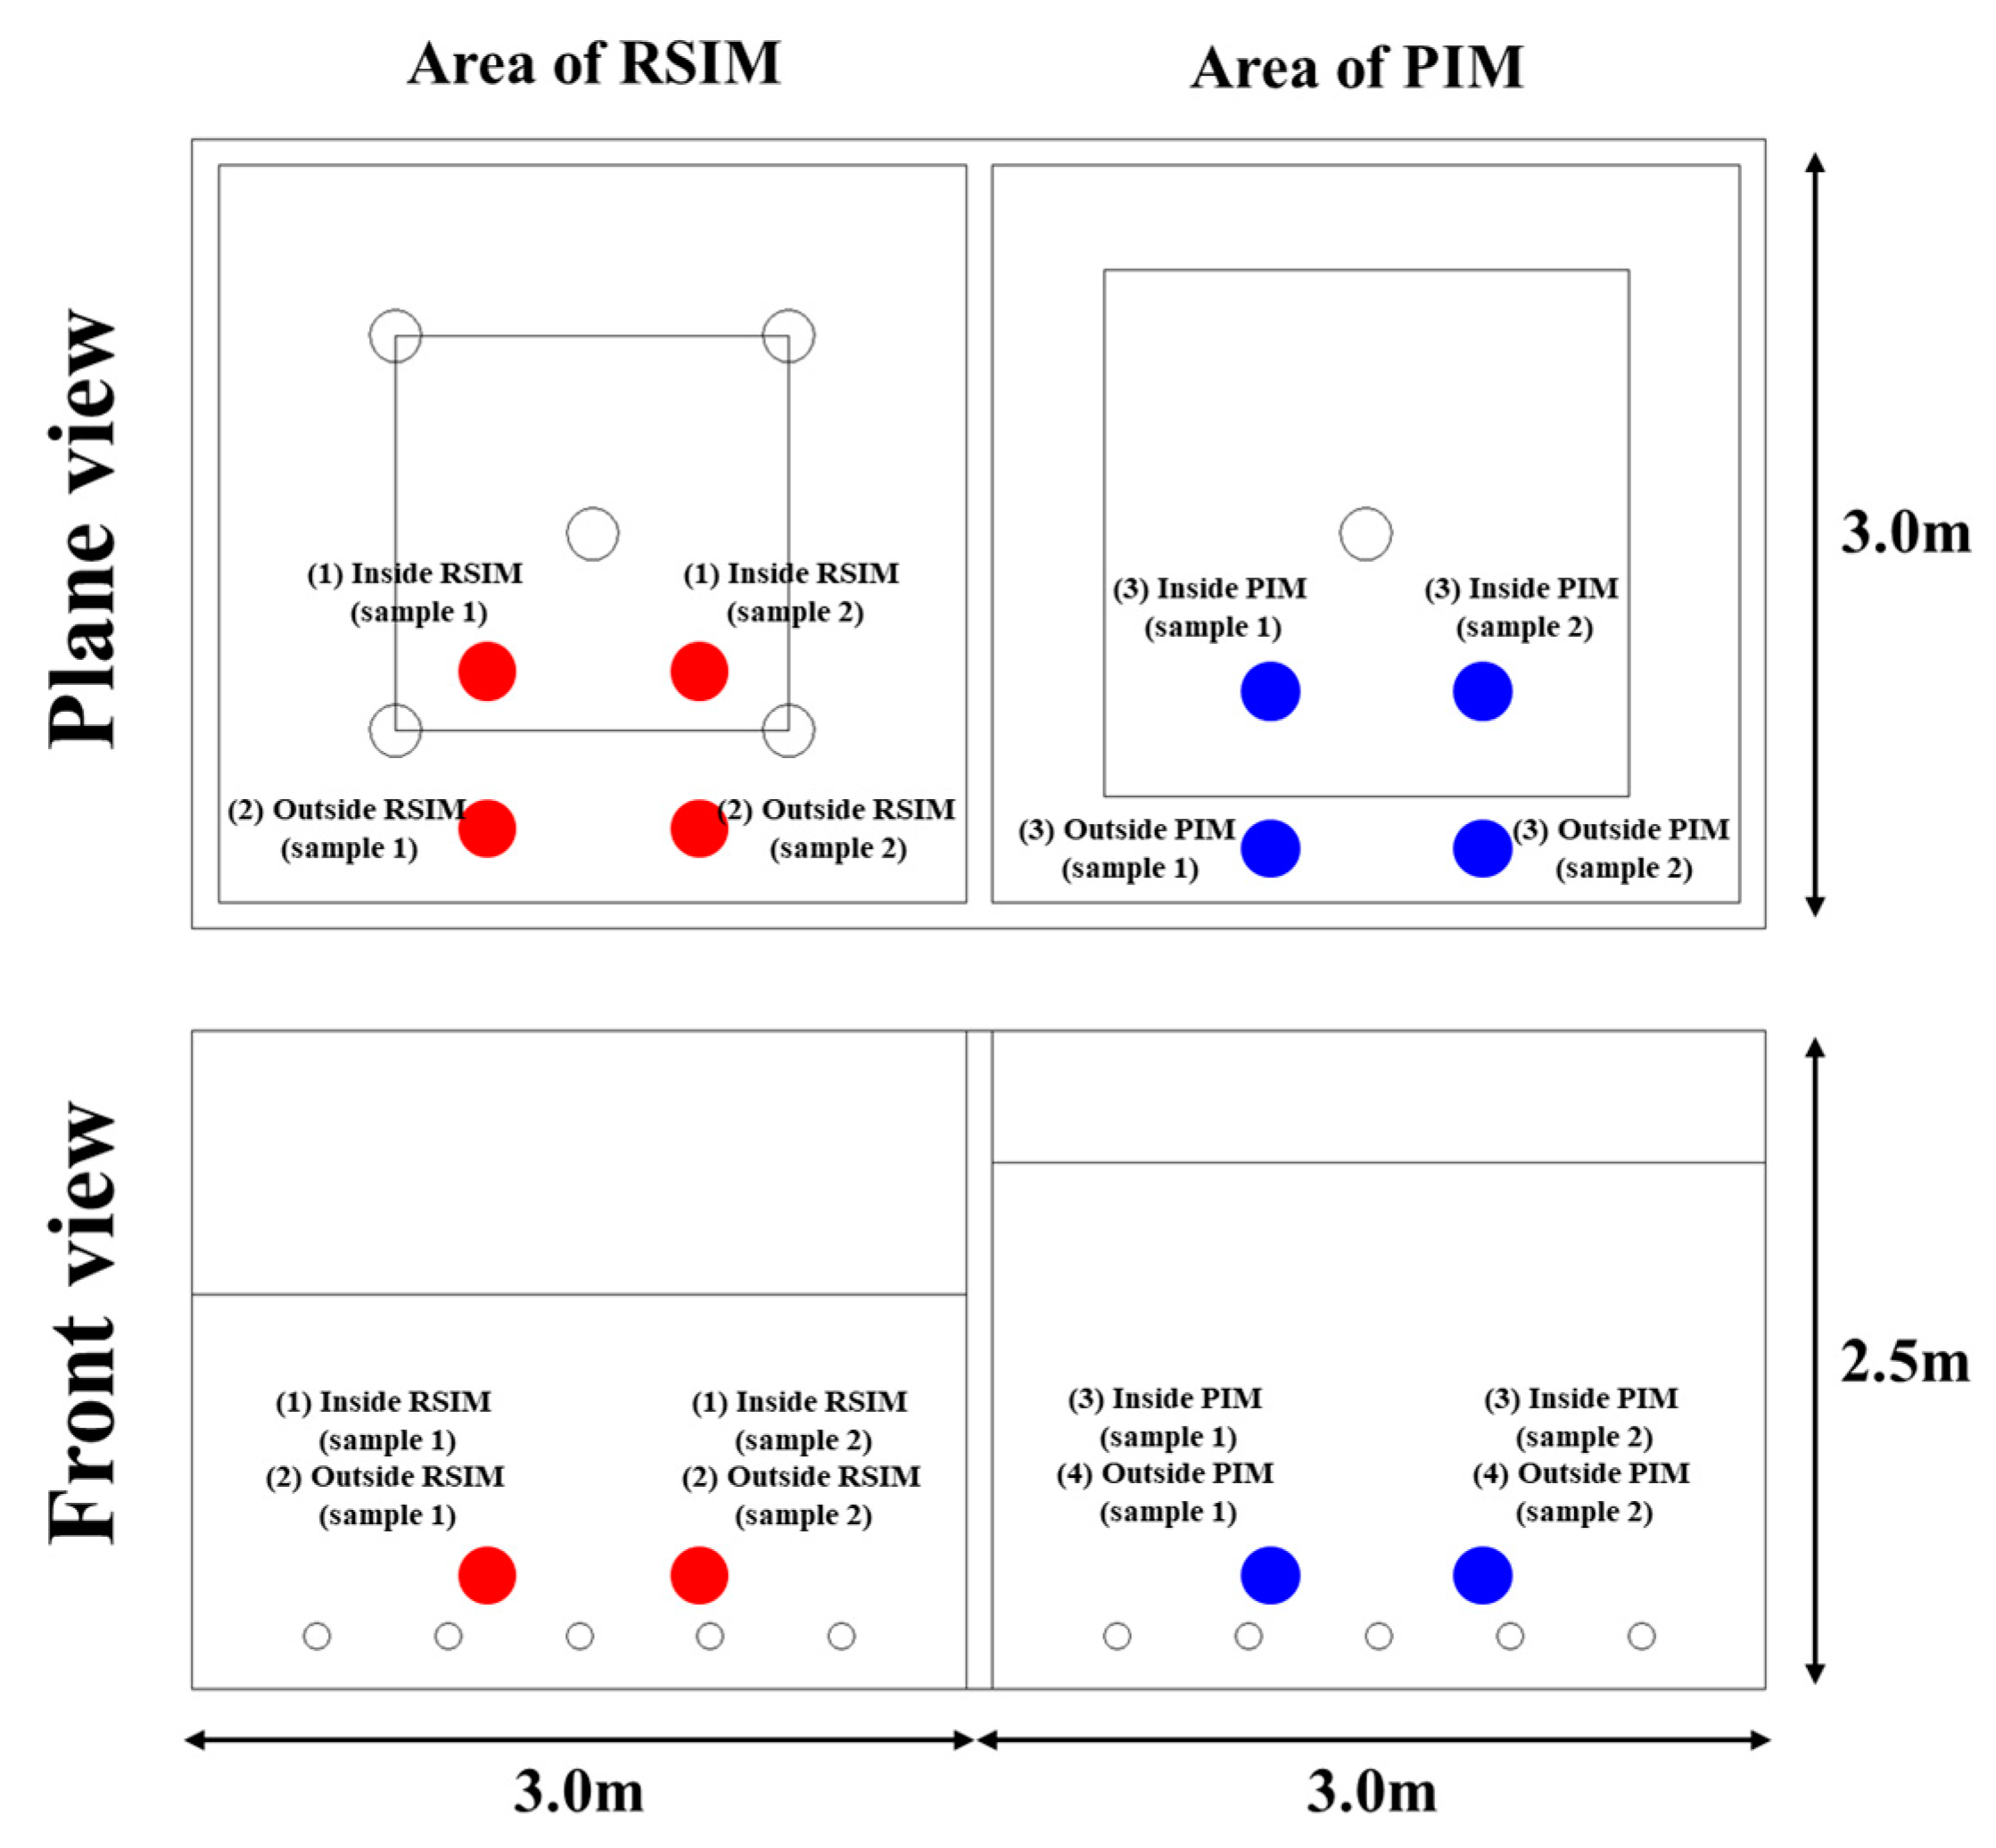
3. Setup of Large-Scale Experiments
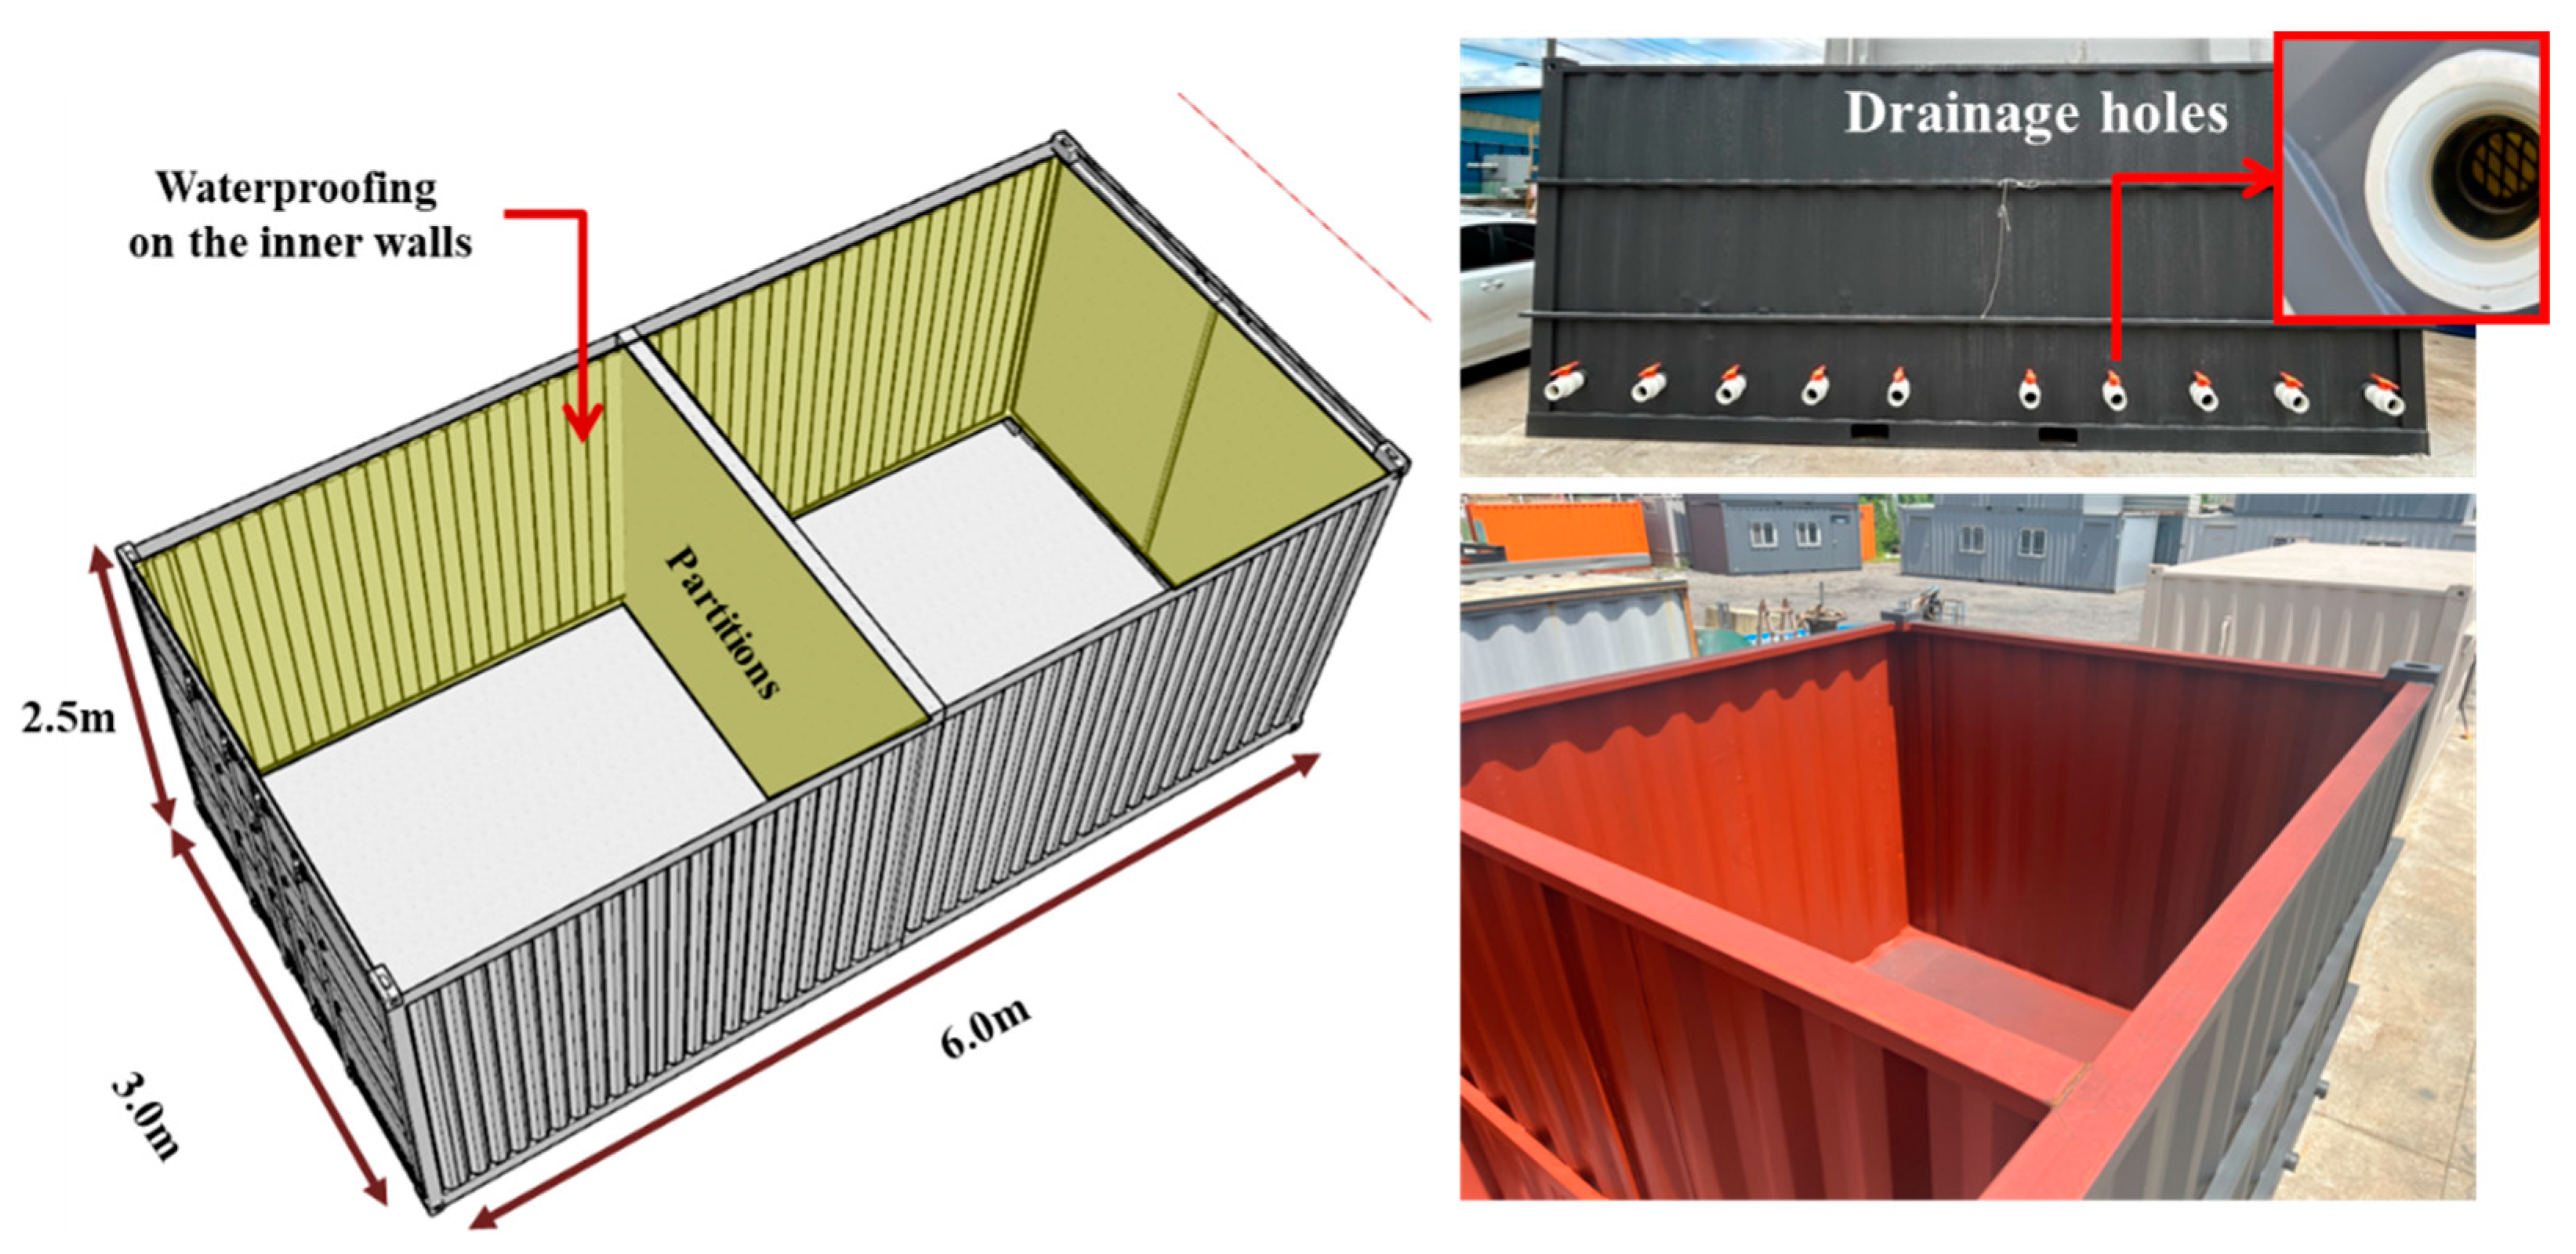
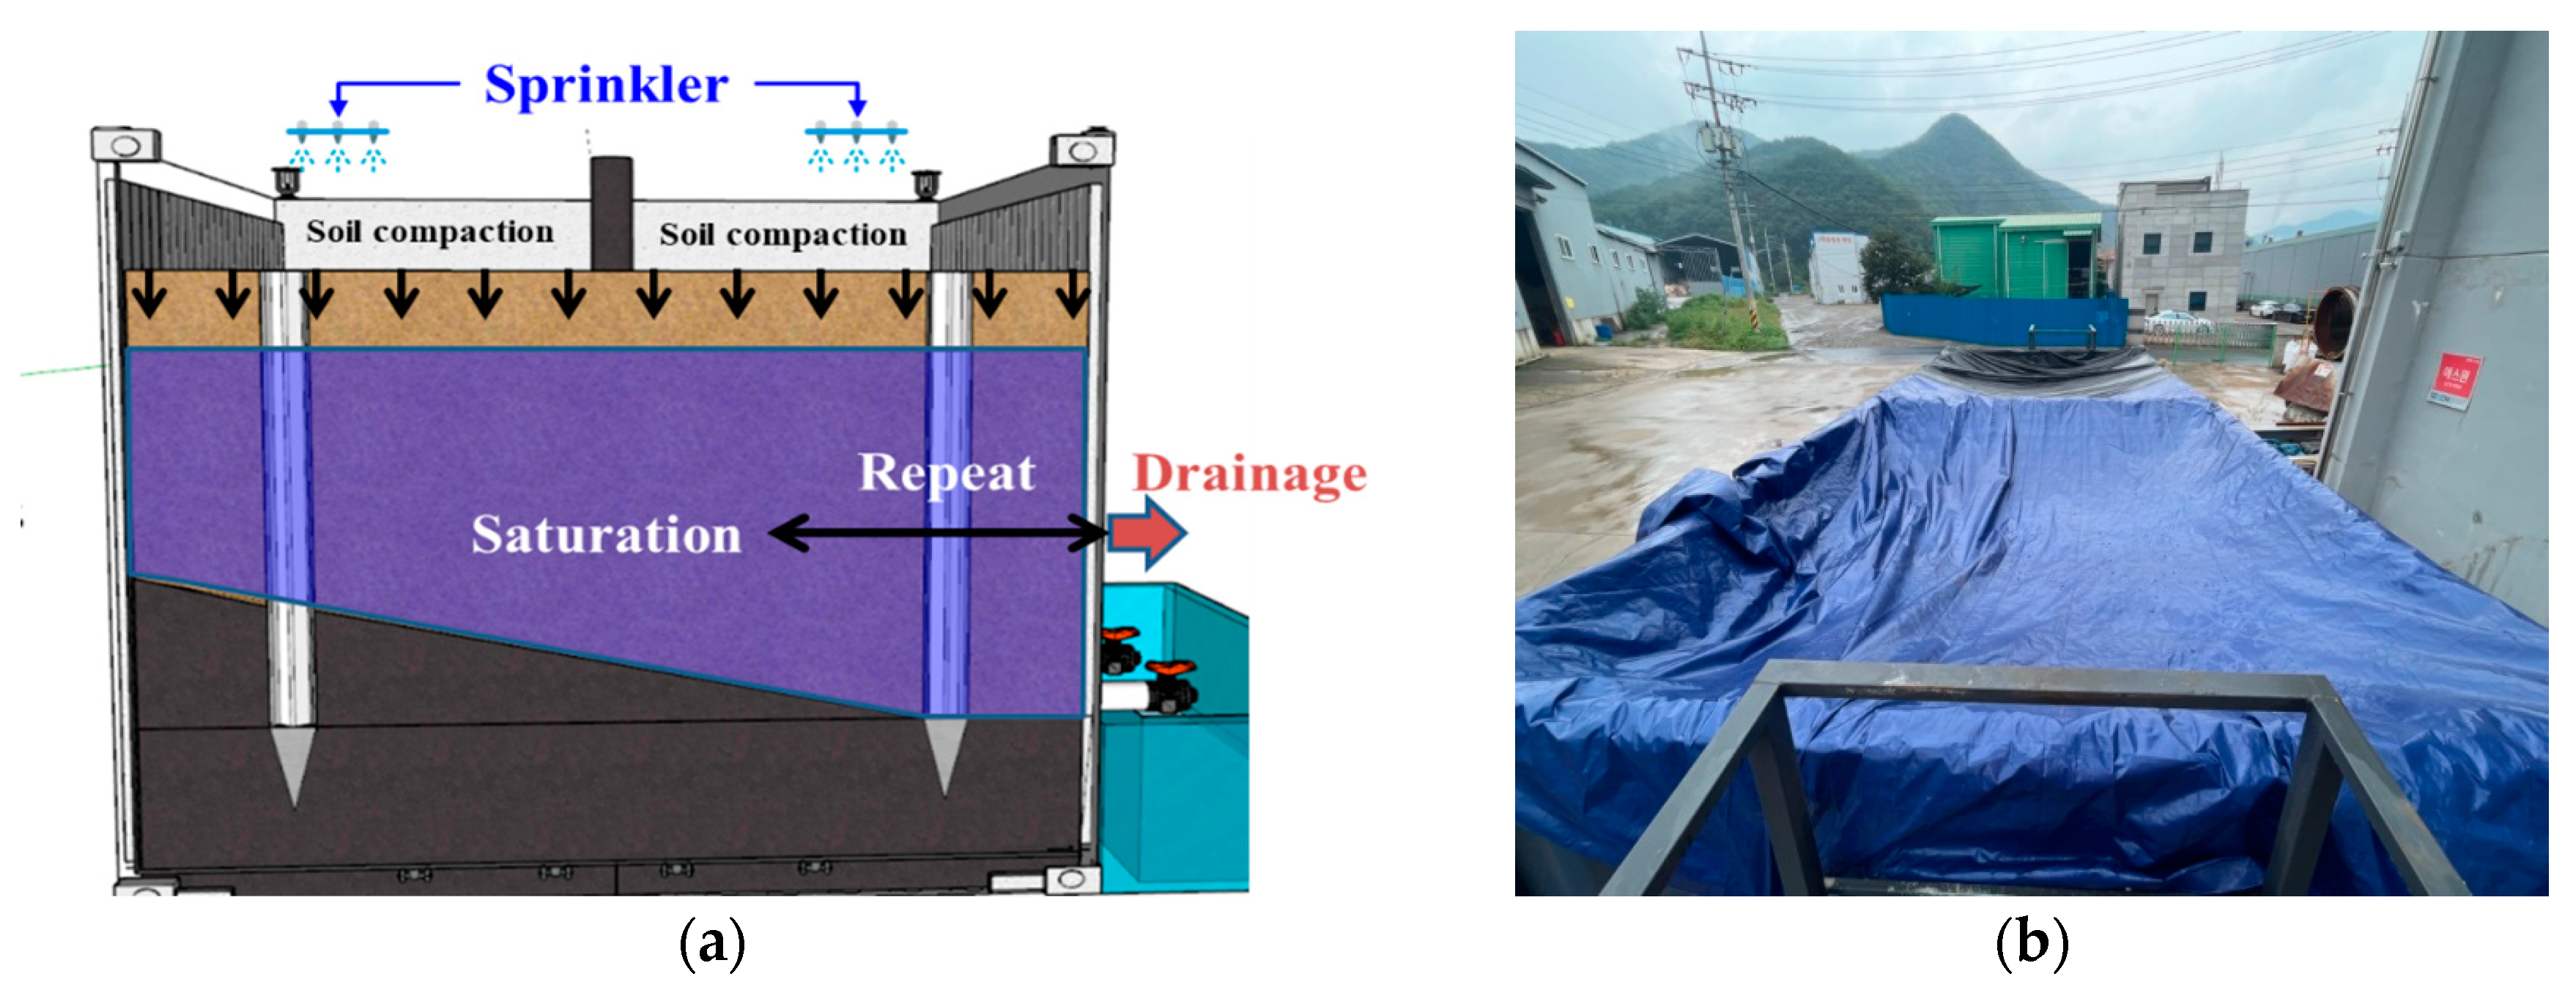
There are environmental and regulatory problems with creating a forced oil spill in real-life conditions. In the case of forced oil spills, the complete recovery of the oil is difficult and the control of groundwater flow characteristics is impossible. Therefore, in this study, a large-scale experiment bed was created using a container.

3.1. Chamber

The export container (6 × 3 × 2.5 m) was used as a chamber, as shown in Figure 5. The chamber’s inner walls were waterproofed, and partitions were installed in which the RSIM and PIM were utilized, respectively. The RSIM and PIM application areas were a square with a width and length of 3 m each. Additionally, drainage holes were drilled into the front outer wall to facilitate the drainage experiments. To prevent soil loss from the drainage holes, a steel mesh of 0.01 mm and non-woven fabric were installed.

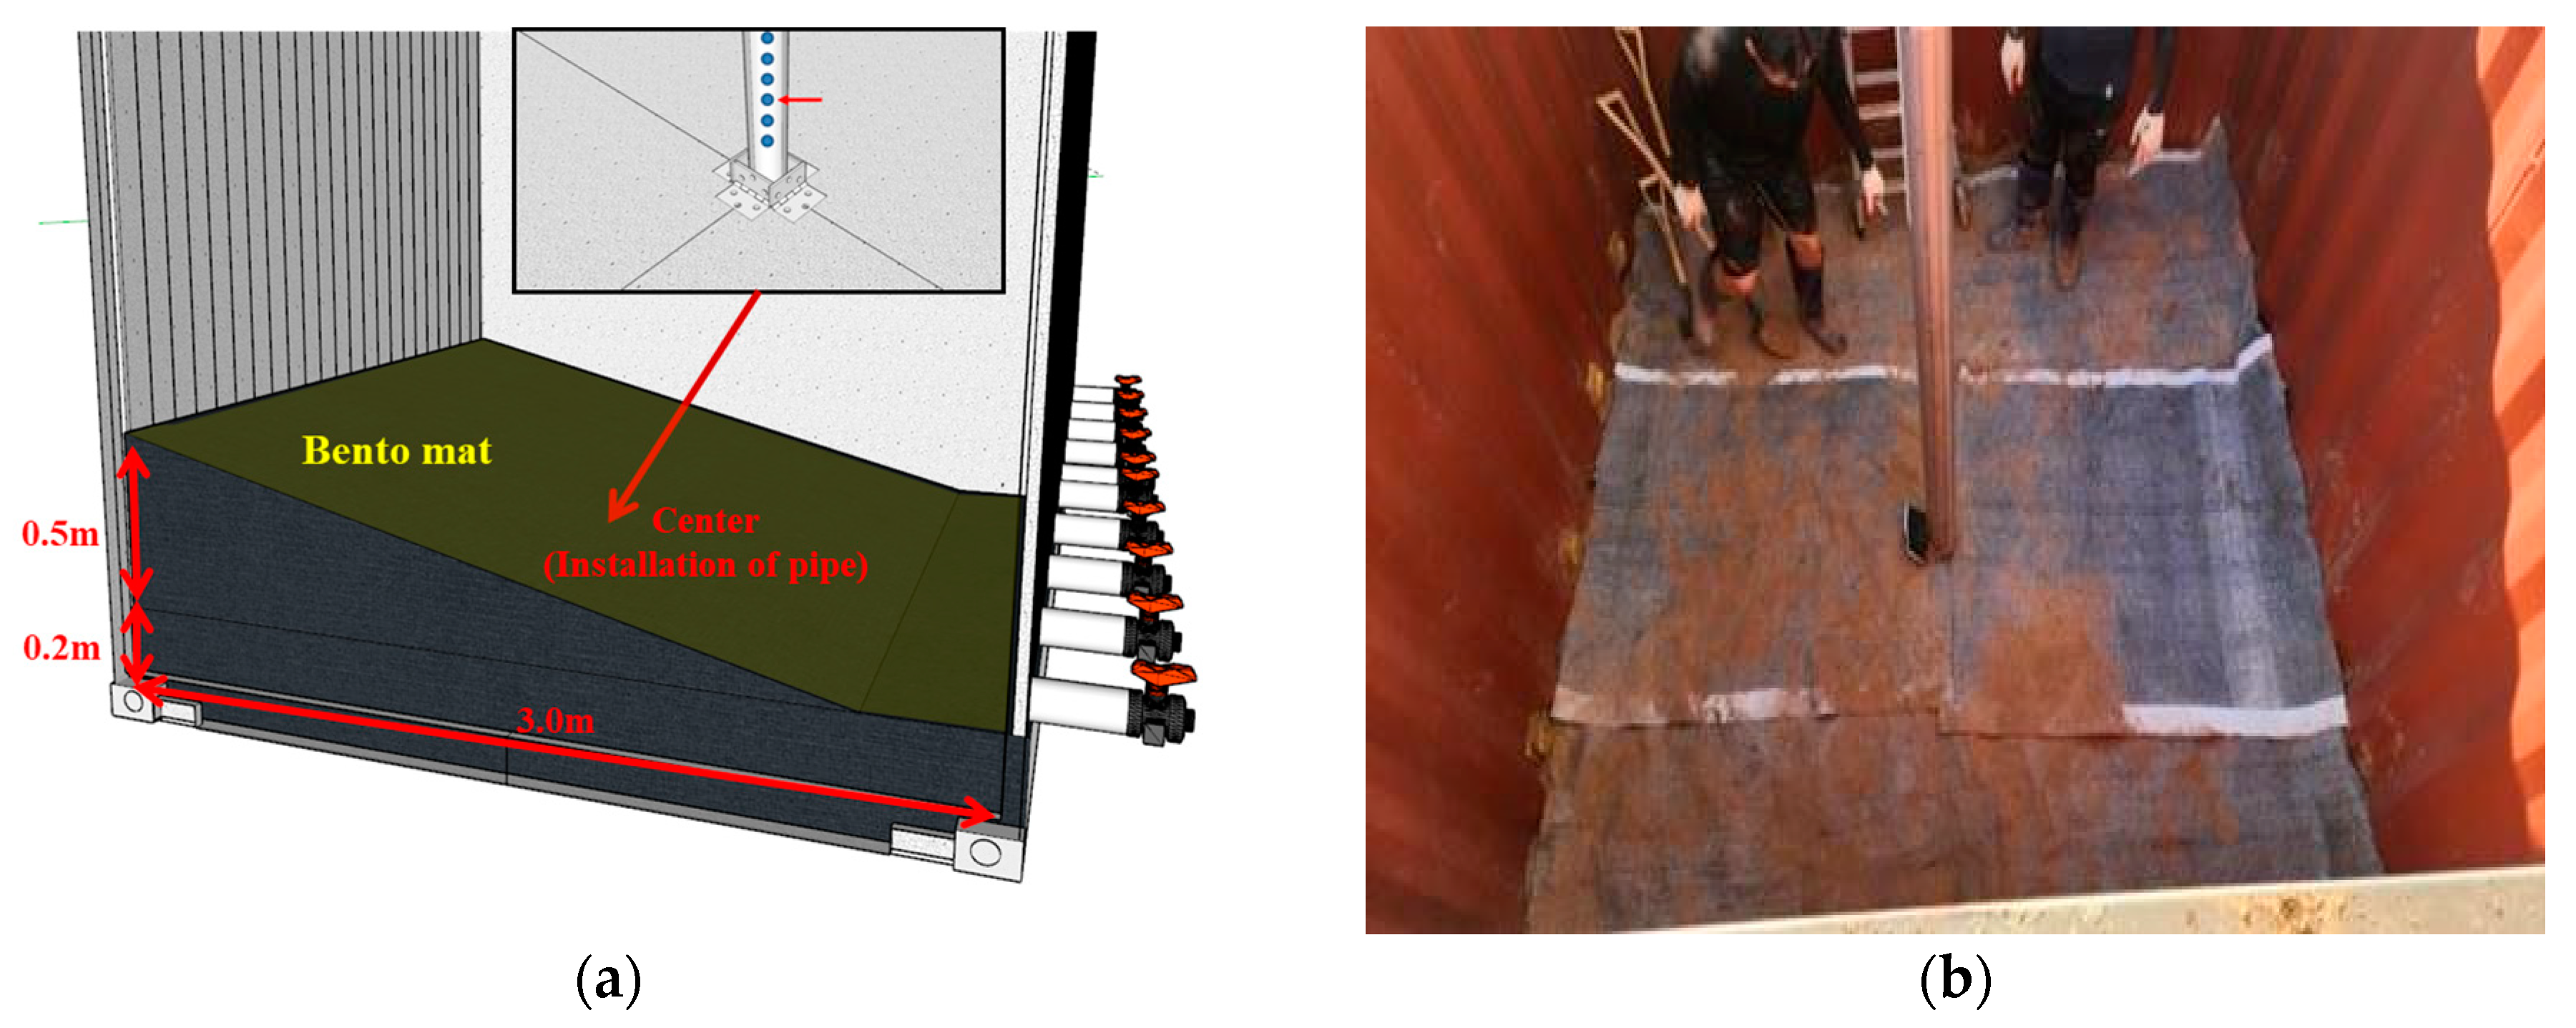
3.2. Subground and Observation Pipe

The subground was composed of bentonite powder and a mat to ensure that the water drained entirely through the drainage holes rather than seeping into the floor. Additionally, to promote the drainage of oil and water, there was a slope leading to the drainage hole. This angle is approximately 9.5 degrees. The Total Petroleum Hydrocarbons (TPH) used in the experiment were LNAPL (Light Non-Aqueous Phase Liquids) that float on water because their specific gravity is lower than that of water. Since the water level above the drainage hole is always maintained during the experiment, the possibility of downward penetration into the subground (bento mat or bentonite powder) is low, and it is judged that the oil will drain out through the drainage hole. At this time, before the creation of the subground, an observation pipe was installed in the center to monitor the water level. The installation schematic and the overall view are shown in Figure 6.

3.3. Installation of the Smart Liner Using the RSIM and PIM

The initial RSIM installation area was 2 m (width) by 2 m (length) by 2 m (height). Due to constraints of the workspace, the final RSIM installation area was reduced by 0.5 m in each dimension, resulting in dimensions of 1.5 m (width), 1.5 m (length), and 1.5 m (height). The installation schematic is shown in Figure 7a. The supporting pile is made of a 30 cm diameter circular steel pipe, with a groove in the middle to allow the connecting pipe attached to the smart liner to be inserted, as shown in Figure 7b. However, the subground, which was 20 cm thick, could not support the weight of the smart liner with the supporting pile. Therefore, an additional frame was installed, as shown in Figure 7c.
The PIM installation area schematic is shown in Figure 7d, with dimensions of 2 m (width), 2 m (length), and 2 m (height). Modular panels were fabricated with dimensions of 2 m (width), 1 m (height), and 0.1 m (thickness). The advantage of these modular panels is their flexibility in adjusting the construction area and depth by varying the number of panels used. The connection with the smart liner follows a “panel–smart liner–panel” sandwich structure, with bolted joints. Additionally, pins can be attached to the lower part of the panels for penetration into the ground, and connections can be attached to the upper part to connect the panels to each other. The assembled modular panels are shown in Figure 7e. The design of the panels is shown in Figure 7f.
The overall view of the RSIM and PIM is shown in Figure 8. To ensure full contact with the ground surface, bentonite was carefully applied underneath the smart liner after installation. After the application of 2 methods, backfilling was performed using silica sand, which drains well.

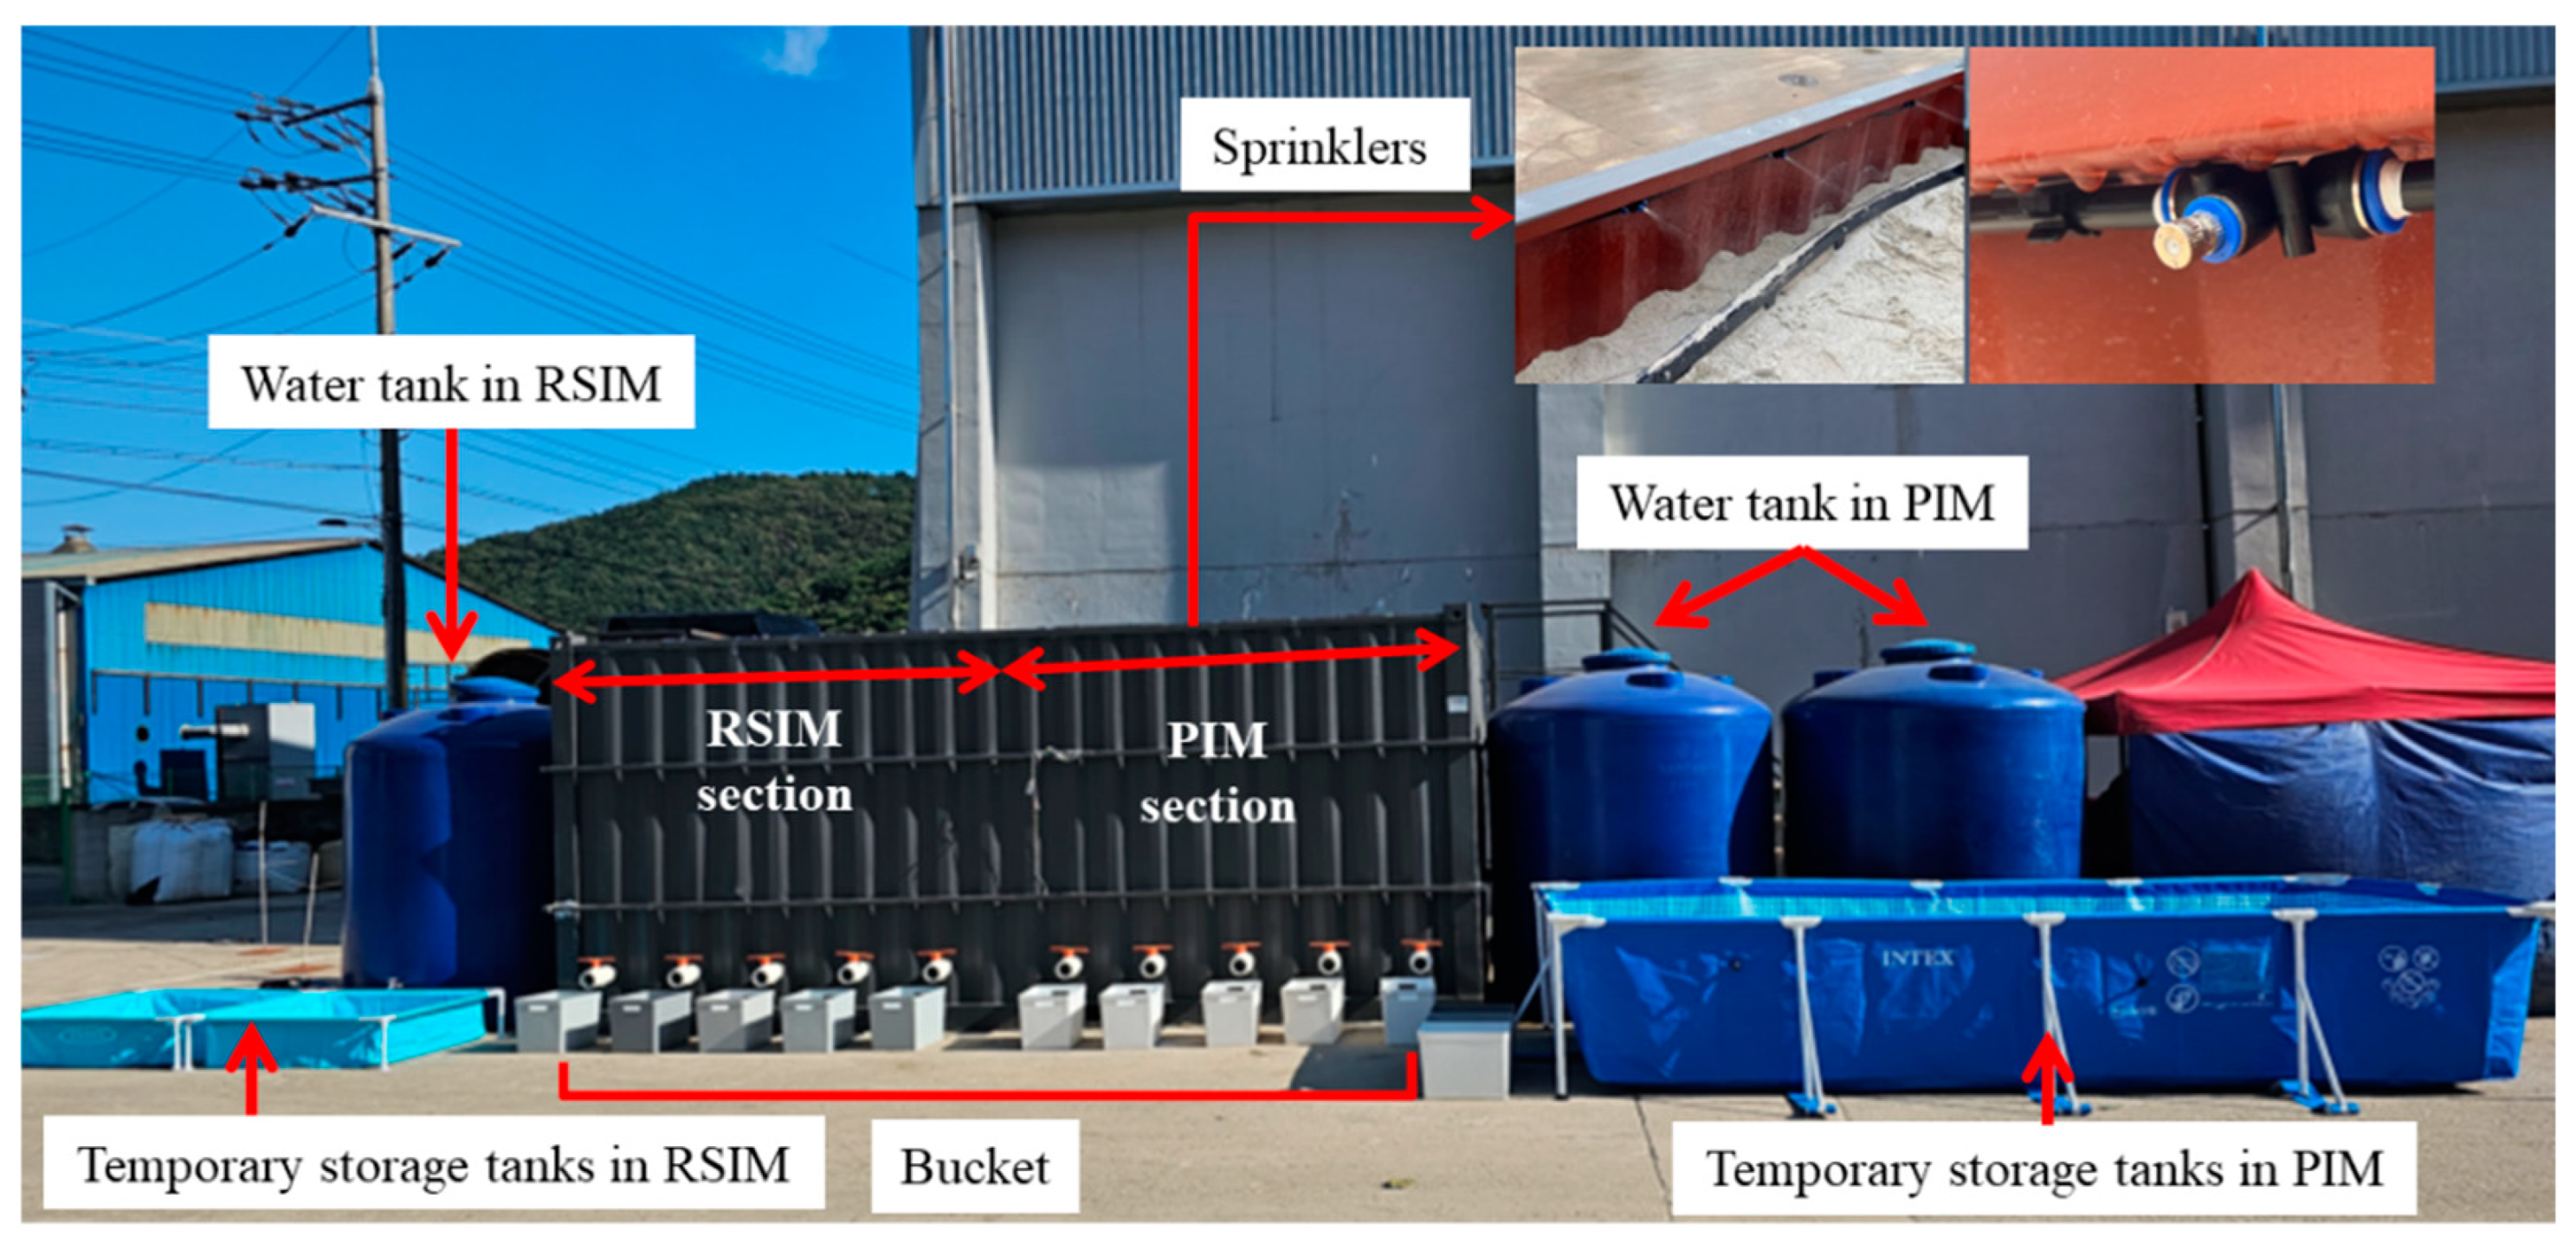
3.4. Overall View of Large-Scale Experiments

The external view of the large-scale experiments is shown in Figure 9. To evenly distribute water across the entire area, 30 sprinklers were installed per section. Additionally, buckets were placed to collect water from the drainage holes, along with temporary storage tanks and water tanks for storing the collected water. Since discharging oil into the environment can be harmful, all the water used in the experiments was stored in the water tanks and treated separately as waste.

4. Process of Large-Scale Experiments

In the large-scale experiments, after quantifying the results of the ground stabilization experiment, TPH was injected. Following this, the water level and drainage were measured, and the contamination of the water and soil was analyzed. Finally, after demolition, a distribution diagram of the reactions between the smart liner and TPH was analyzed. In this experiment, kerosene, a type of TPH, was used. Kerosene was selected over gasoline and diesel because gasoline’s high volatility poses handling challenges, while diesel’s lower volatility may not adequately represent the desired experimental conditions. The type of oil is not important in terms of the reaction.

4.1. Ground Stability with Measurement of Water Permeability

To stabilize the ground in the RSIM and PIM installation areas, a method involving soil saturation using sprinklers and subsequent drainage through a valve was employed, as shown in Figure 10. This process, a type of water compaction (rearrangement of sand particles by water), involved repeating the process of operating the sprinkler and discharging water through the drain valve.
Water was input into each section by operating the sprinklers for 12 h. After stopping the sprinklers, the drainage valves were opened, and the drainage volume and water level were measured over 500 min. This process was repeated twice, and the data were recorded. To prevent the inflow of external moisture, such as rainwater, a waterproof cover was installed over the container during the experiment. The water level was measured using a tapeline in an observation pipe, and the drainage volume was calculated by measuring the height of the water collected in a bucket.

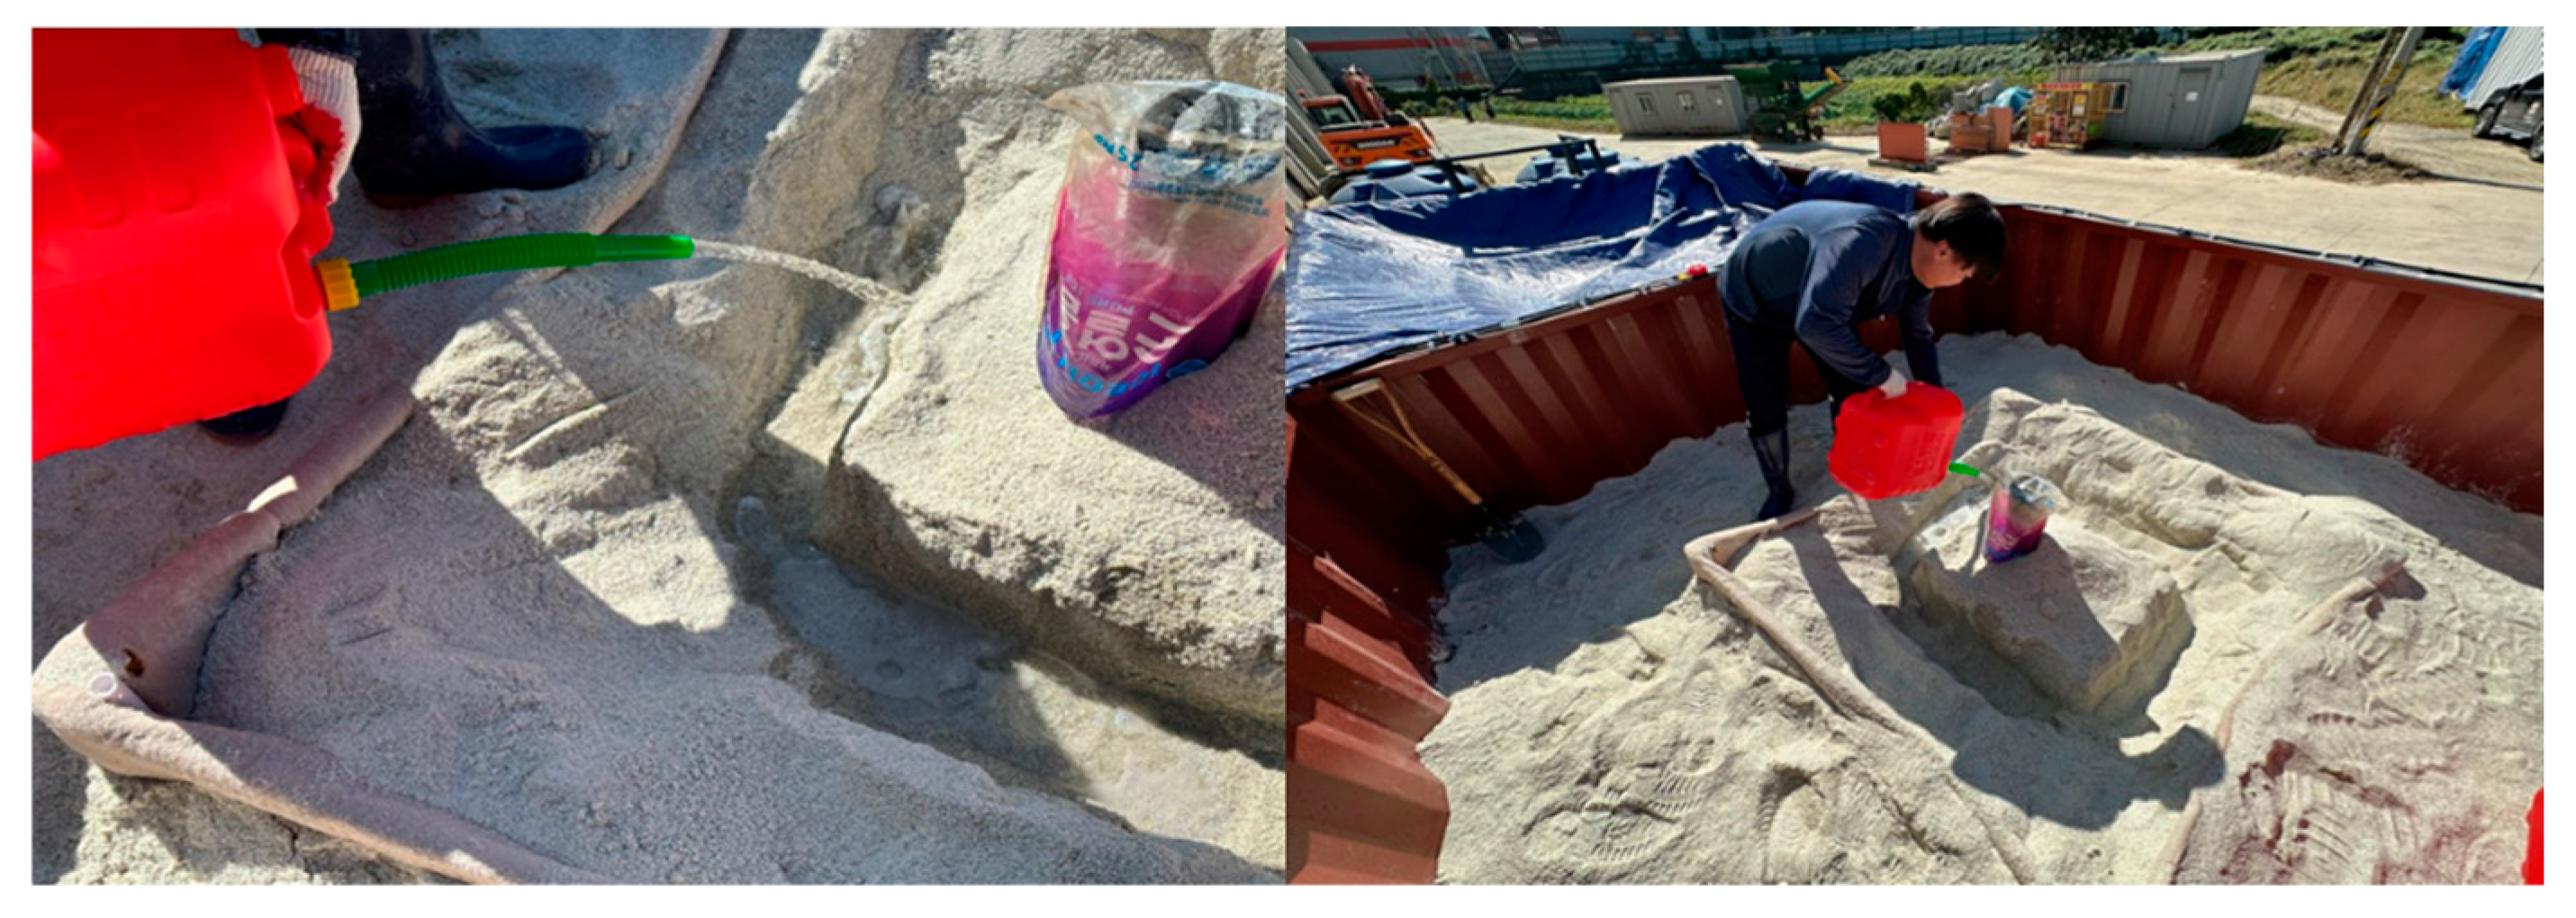
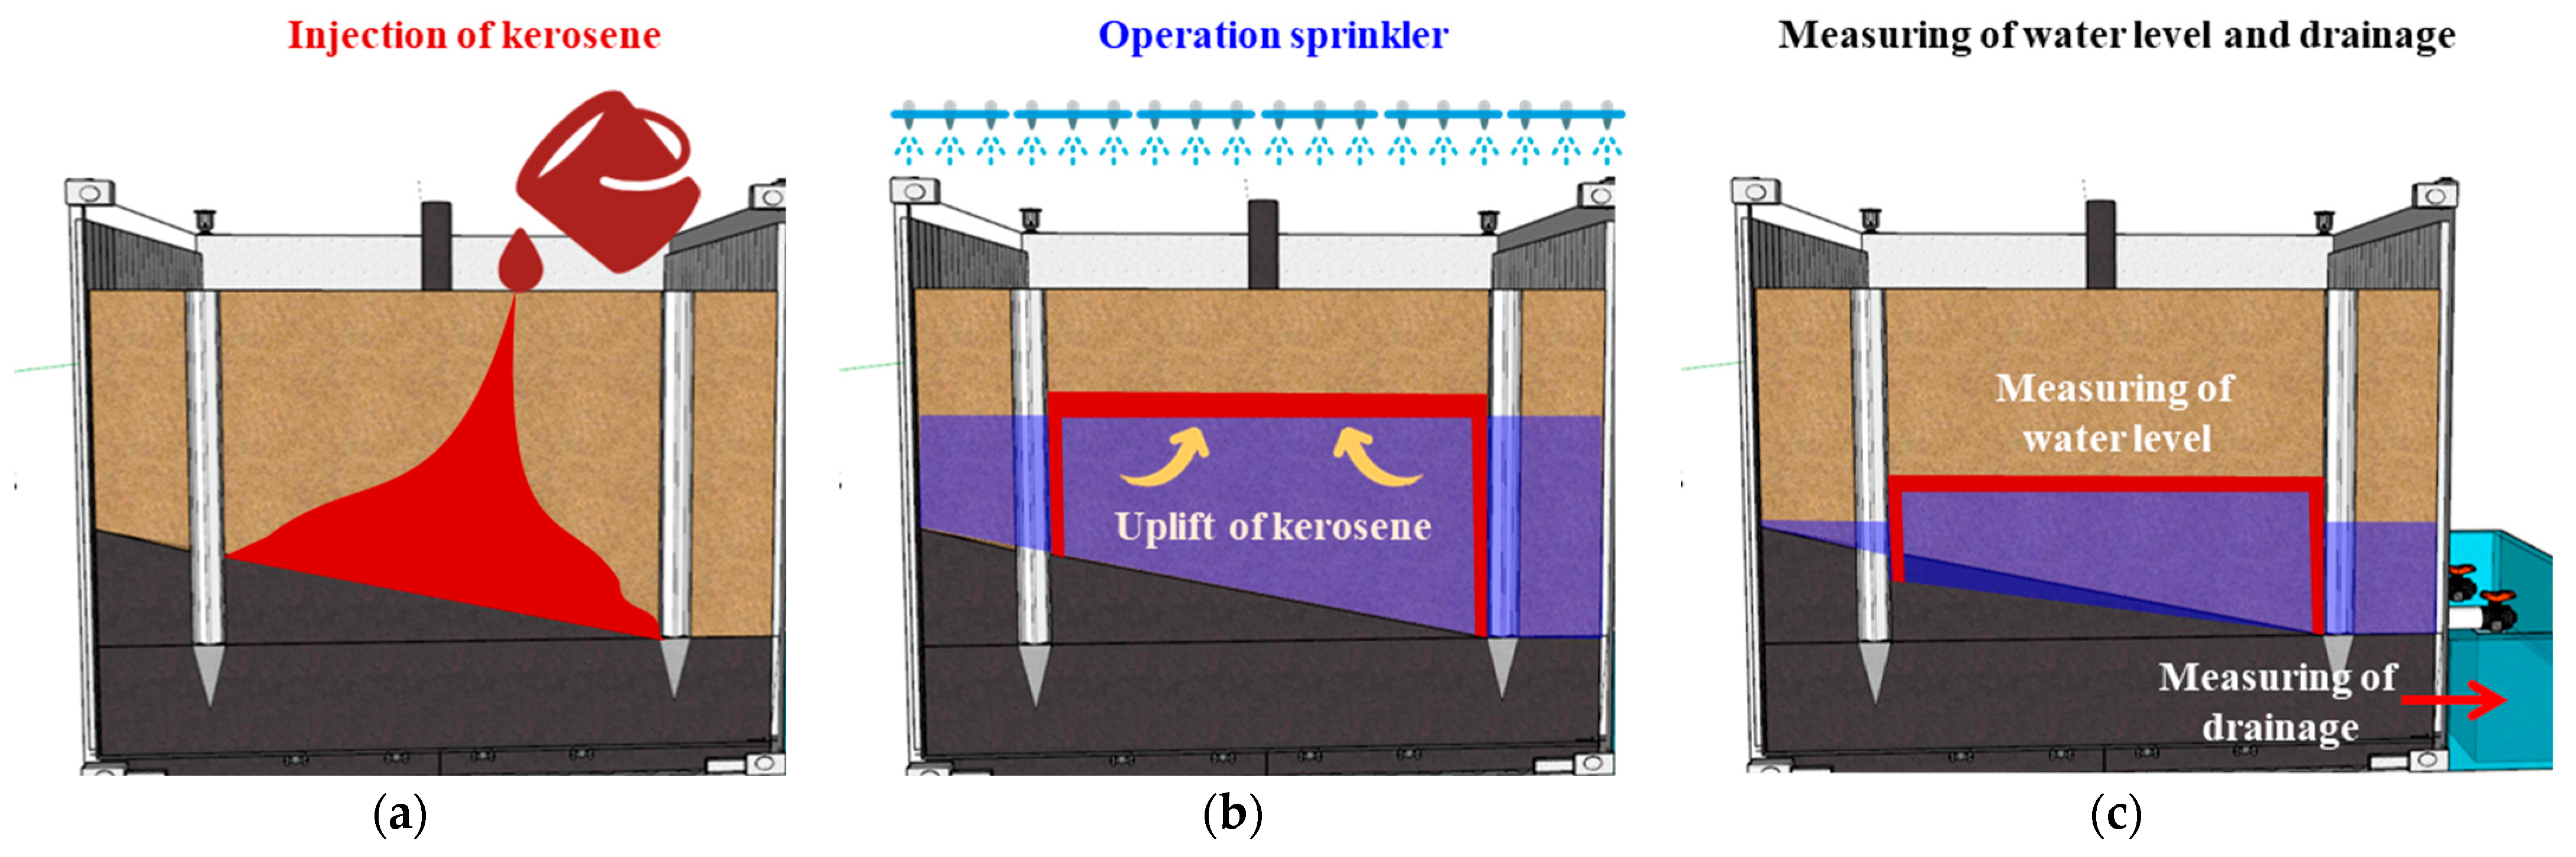
4.2. Injection of Oil Substances and Measurement of Water Level and Drainage Volume

The ground in the RSIM and PIM areas was stabilized, ensuring that the same results were obtained in the repeated experiments. To verify the oil absorption performance of the smart liner, oil with 100 L of TPH was added to each section, as shown in Figure 11.
To compare with the ground stabilization experiment results, the sprinkler was operated for more than 12 h after TPH injection, and the first experiment was conducted by measuring the water level and drainage using the same method as that used in the ground stabilization experiment. After the first experiment was completed, the second experiment was carried out by operating the sprinkler for more than 12 h without additional TPH injection and measuring the water level and drainage. This process aimed to verify the results of the first experiment and to check for any additional reactions between the TPH and smart liner.
The experimental procedure is as shown in Figure 12: (1) after draining was complete (when the water level was zero), 100 L of TPH was injected and left to stand for 24 h; (2) ground saturation was performed by operating the sprinkler (for 12 h); (3) the groundwater level reduction and drainage were measured by opening the drainage valve (observed for 500 min); (4) complete drainage of the ground (until the water level was zero) was performed; and (5) steps (2) and (3) were repeated without additional TPH injection.

5. Results

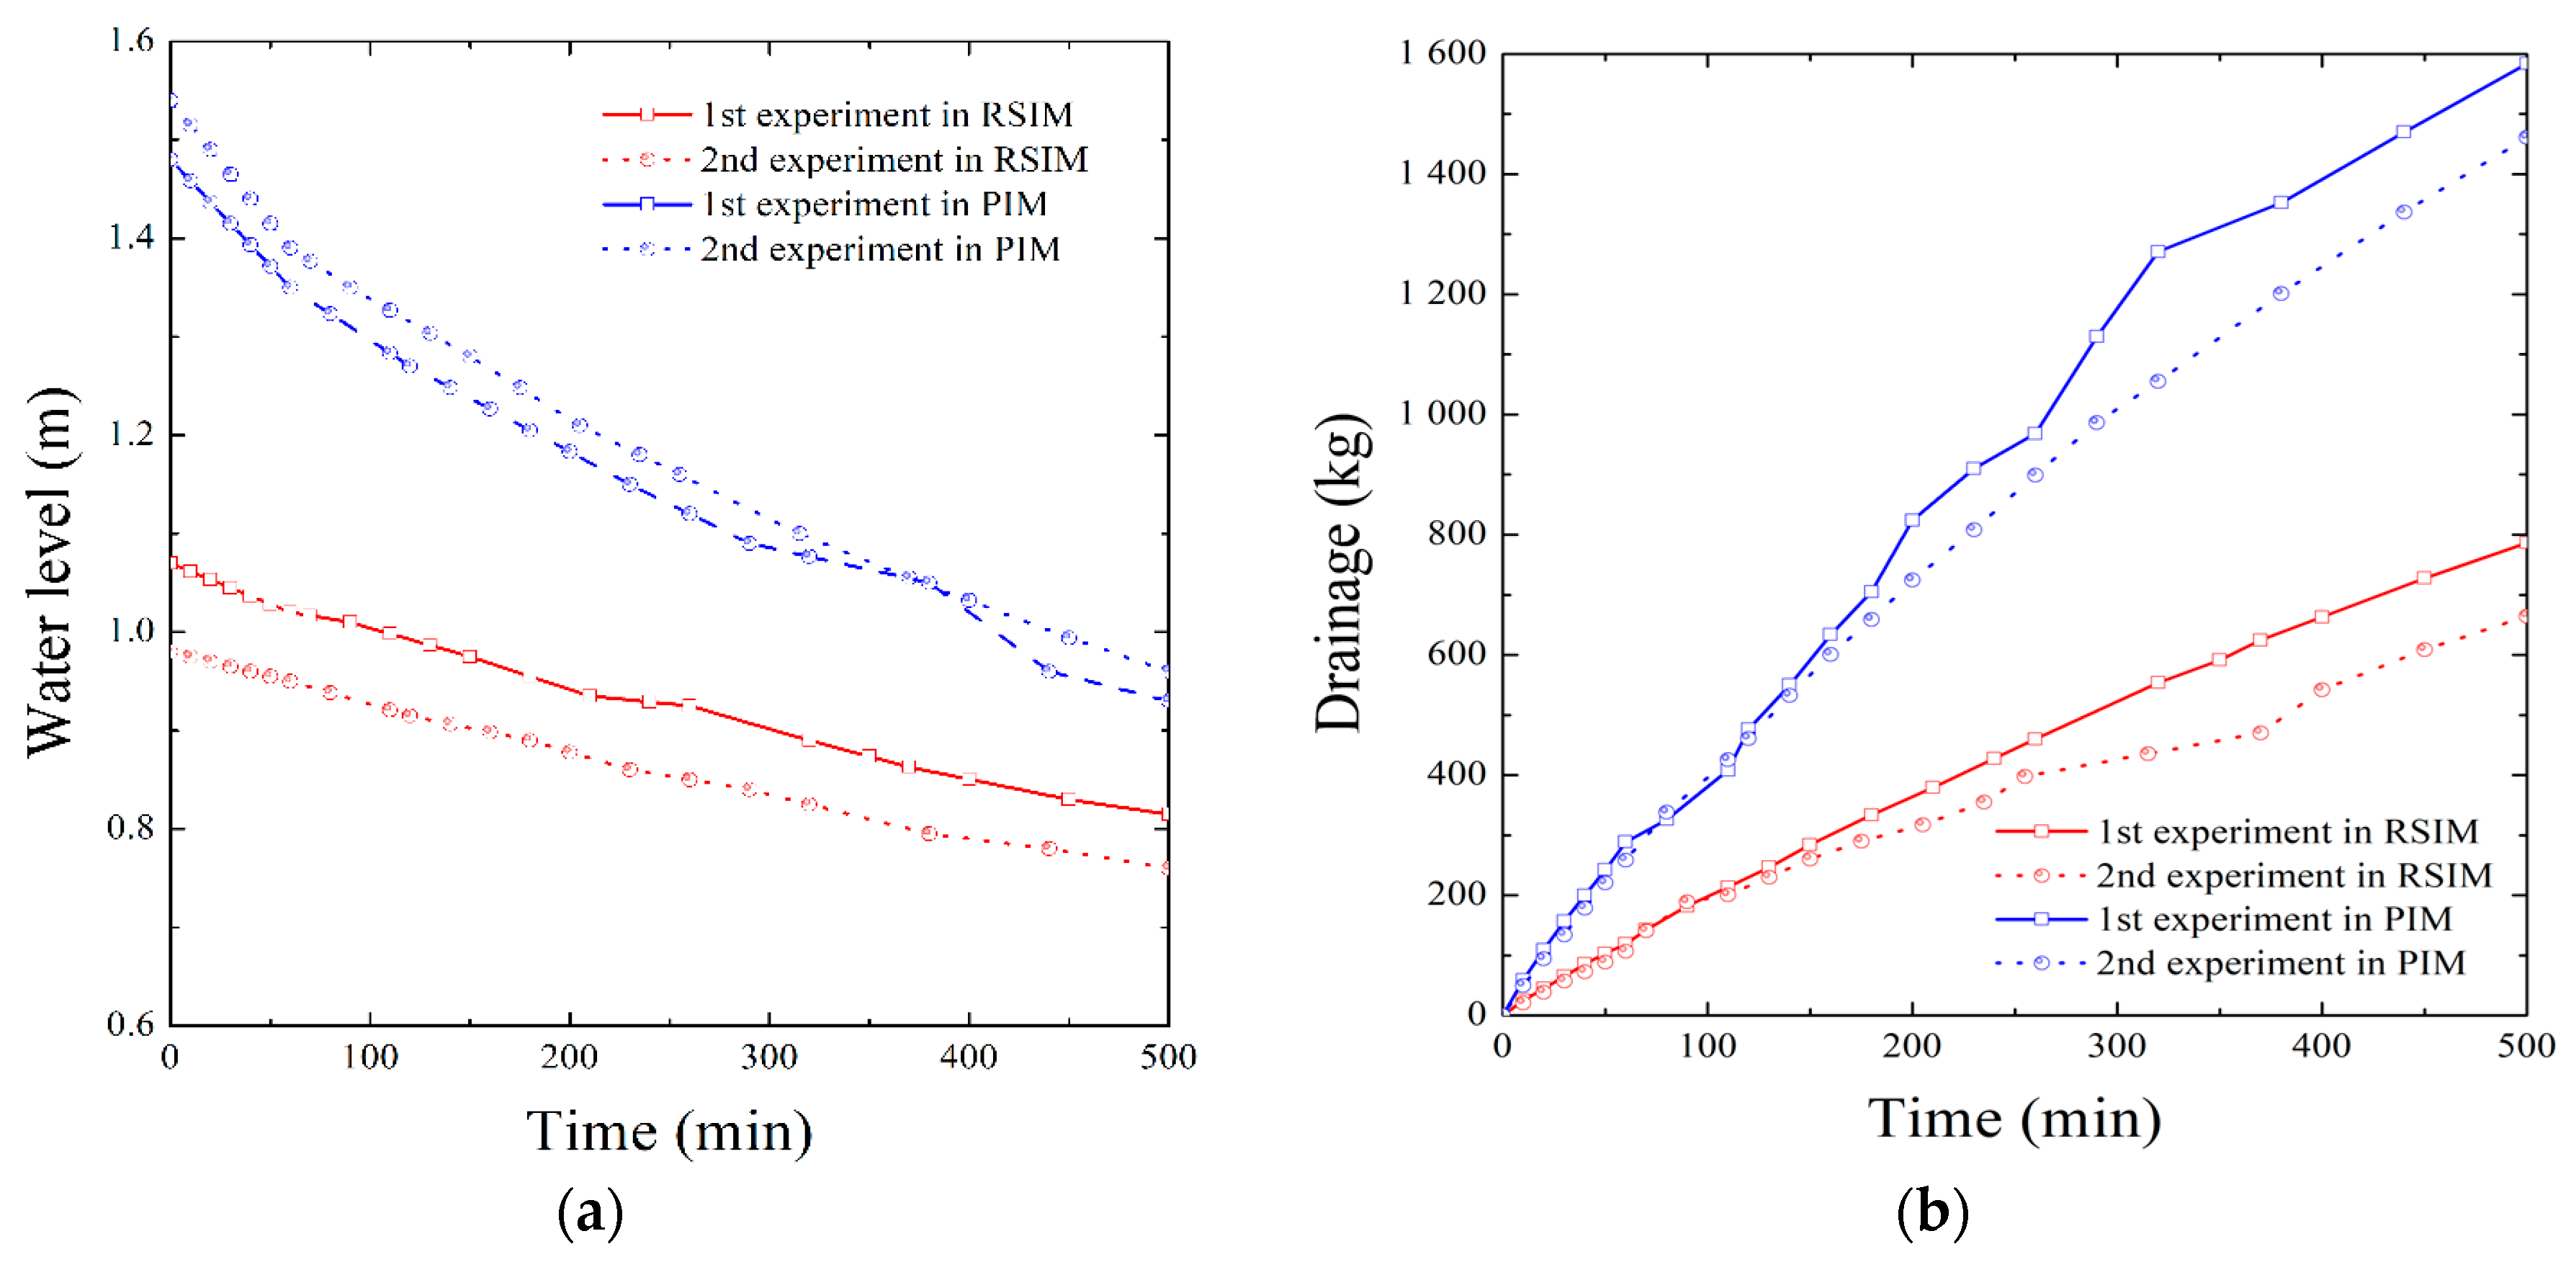
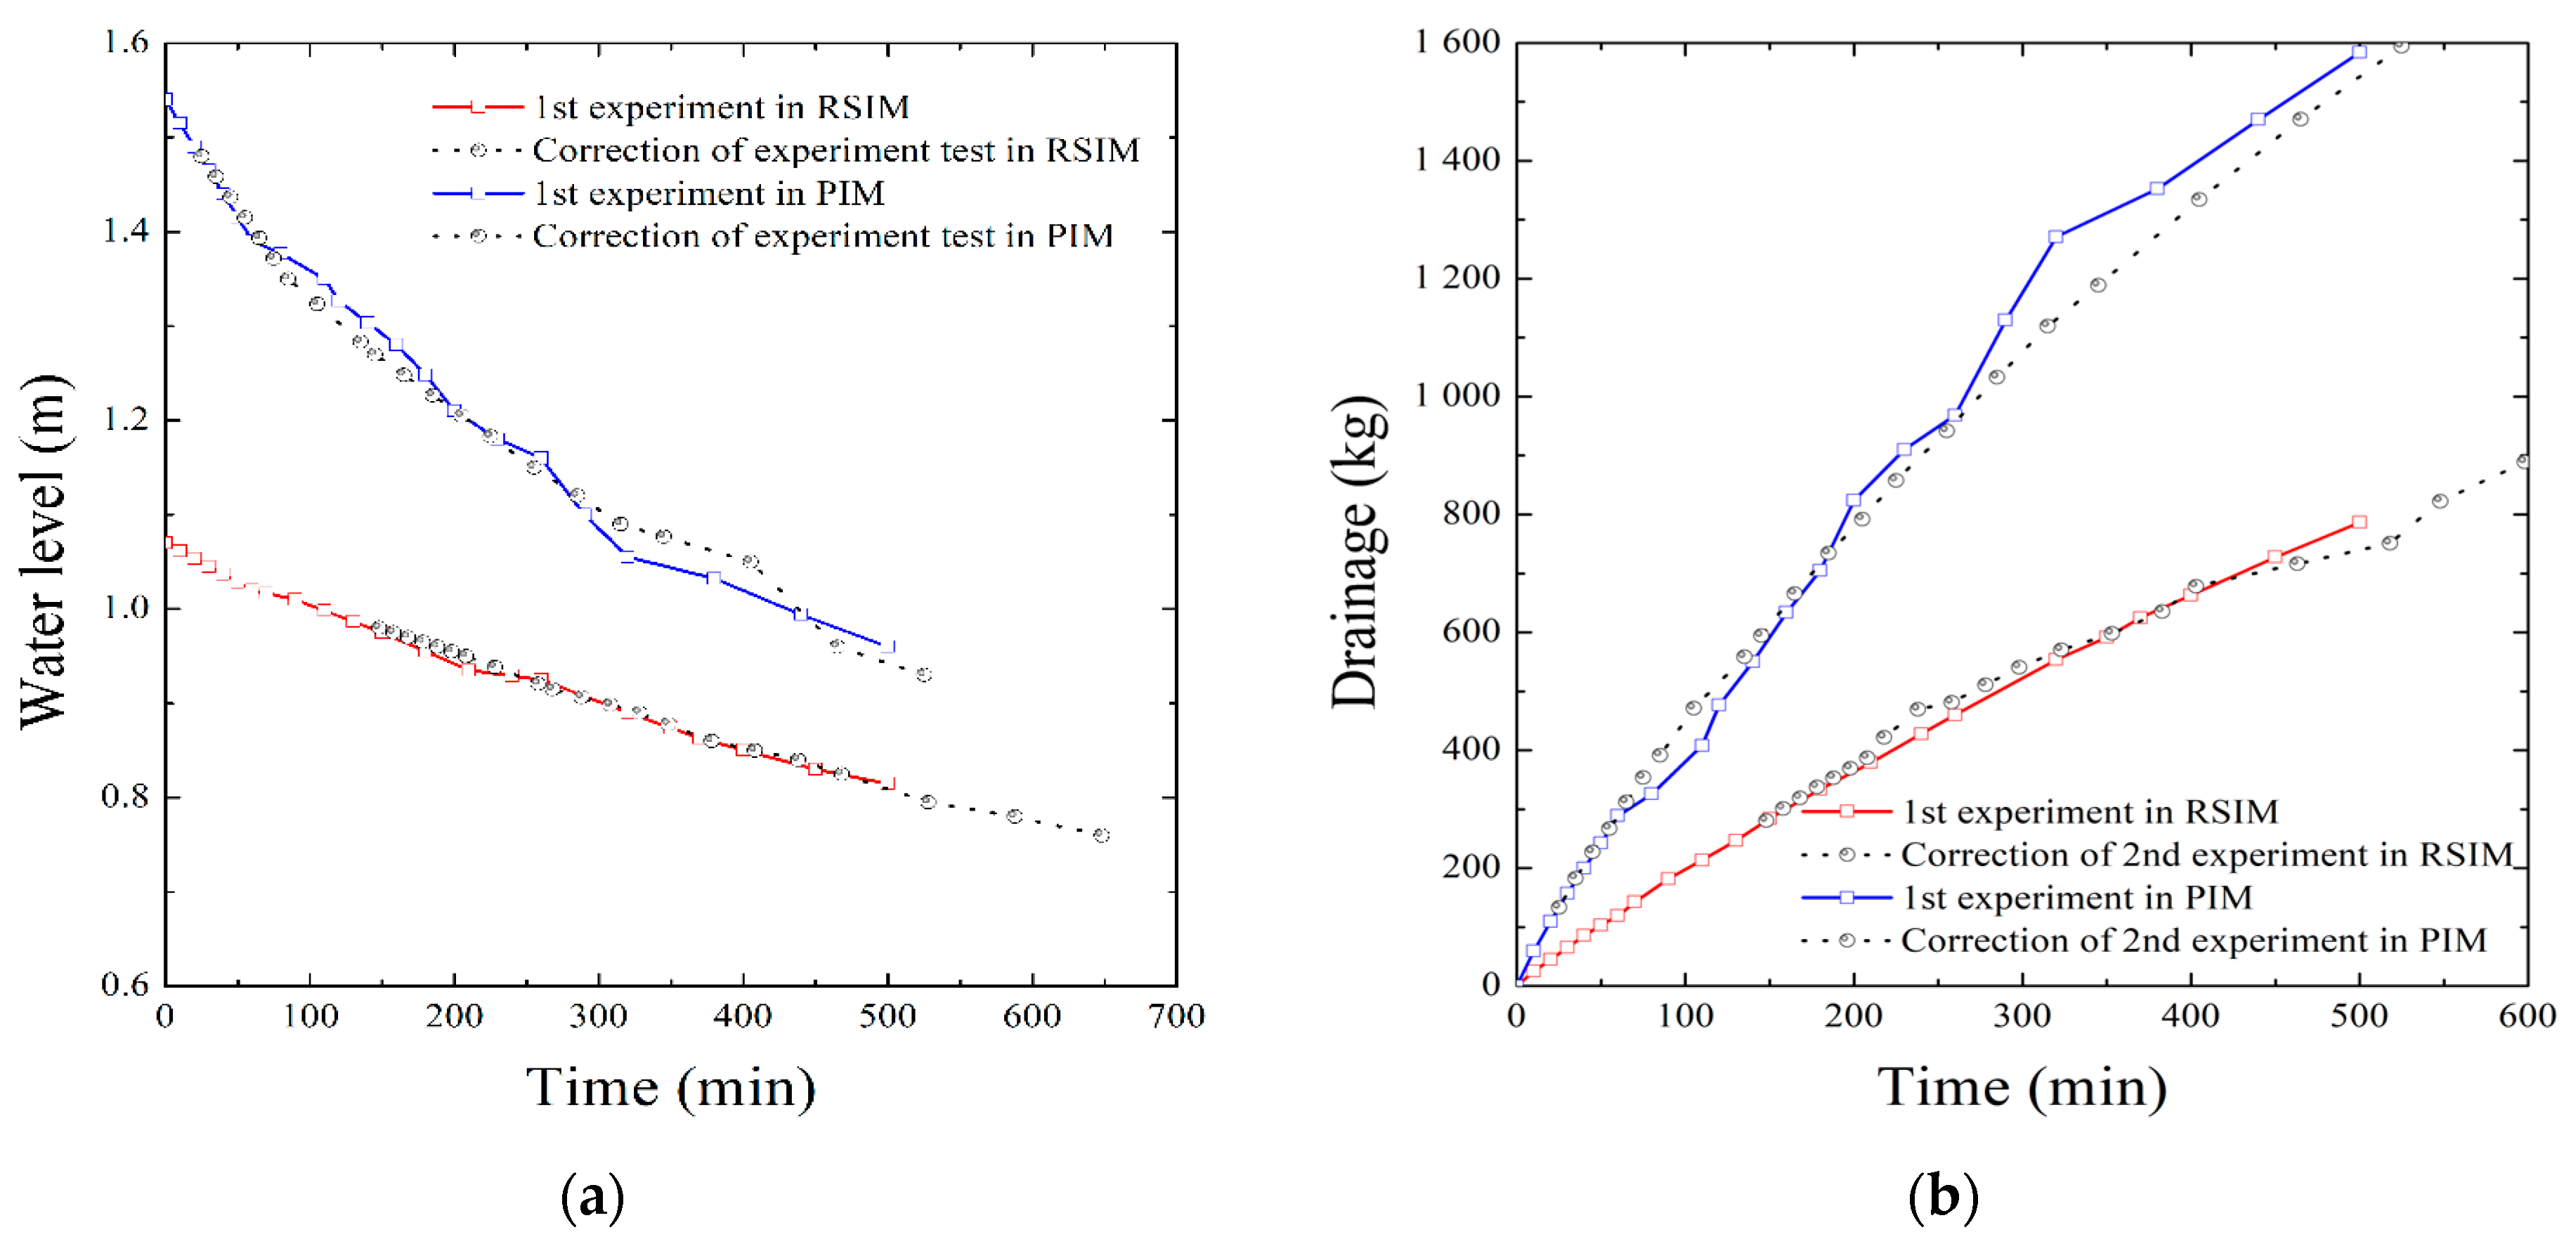
5.1. Ground Stability

Ground stabilization experiments were performed twice for each installation area. The measurement time was 500 min, and the changes in the water level and drainage are shown in Figure 13 and Table 1. The result graphs show differences due to different initial groundwater levels. To confirm whether the ground had stabilized, the experimental data from each area must be consistent.
To set the initial water level conditions, time adjustments were made to the second RIM and PIM experimental results. The RIM data were shifted 148 min to the right along the x-axis (time), and the PIM data were shifted by 25 min. As a result of these adjustments, as shown in Figure 14a, the changes in the water level over time in each experimental area exhibited similar trends.
To adjust for drainage, corrections were made to both the time and drainage amounts in the second RIM and PIM experimental results. For the RSIM, the data were shifted 148 min to the right on the x-axis (time). Additionally, on the y-axis (drainage), the data were adjusted upwards by 280 kg, which corresponds to the drainage at 148 min in the first experiment. For the PIM, the data were shifted 25 min to the right on the x-axis. On the y-axis, the data were adjusted upwards by 133 kg, corresponding to the drainage at 25 min in the first experiment. As shown in Figure 14b, these corrections resulted in similar trends in drainage changes over time across the different experimental areas. This indicates that both the RSIM and PIM areas had stabilized, and similar results can be expected from repeated experiments.

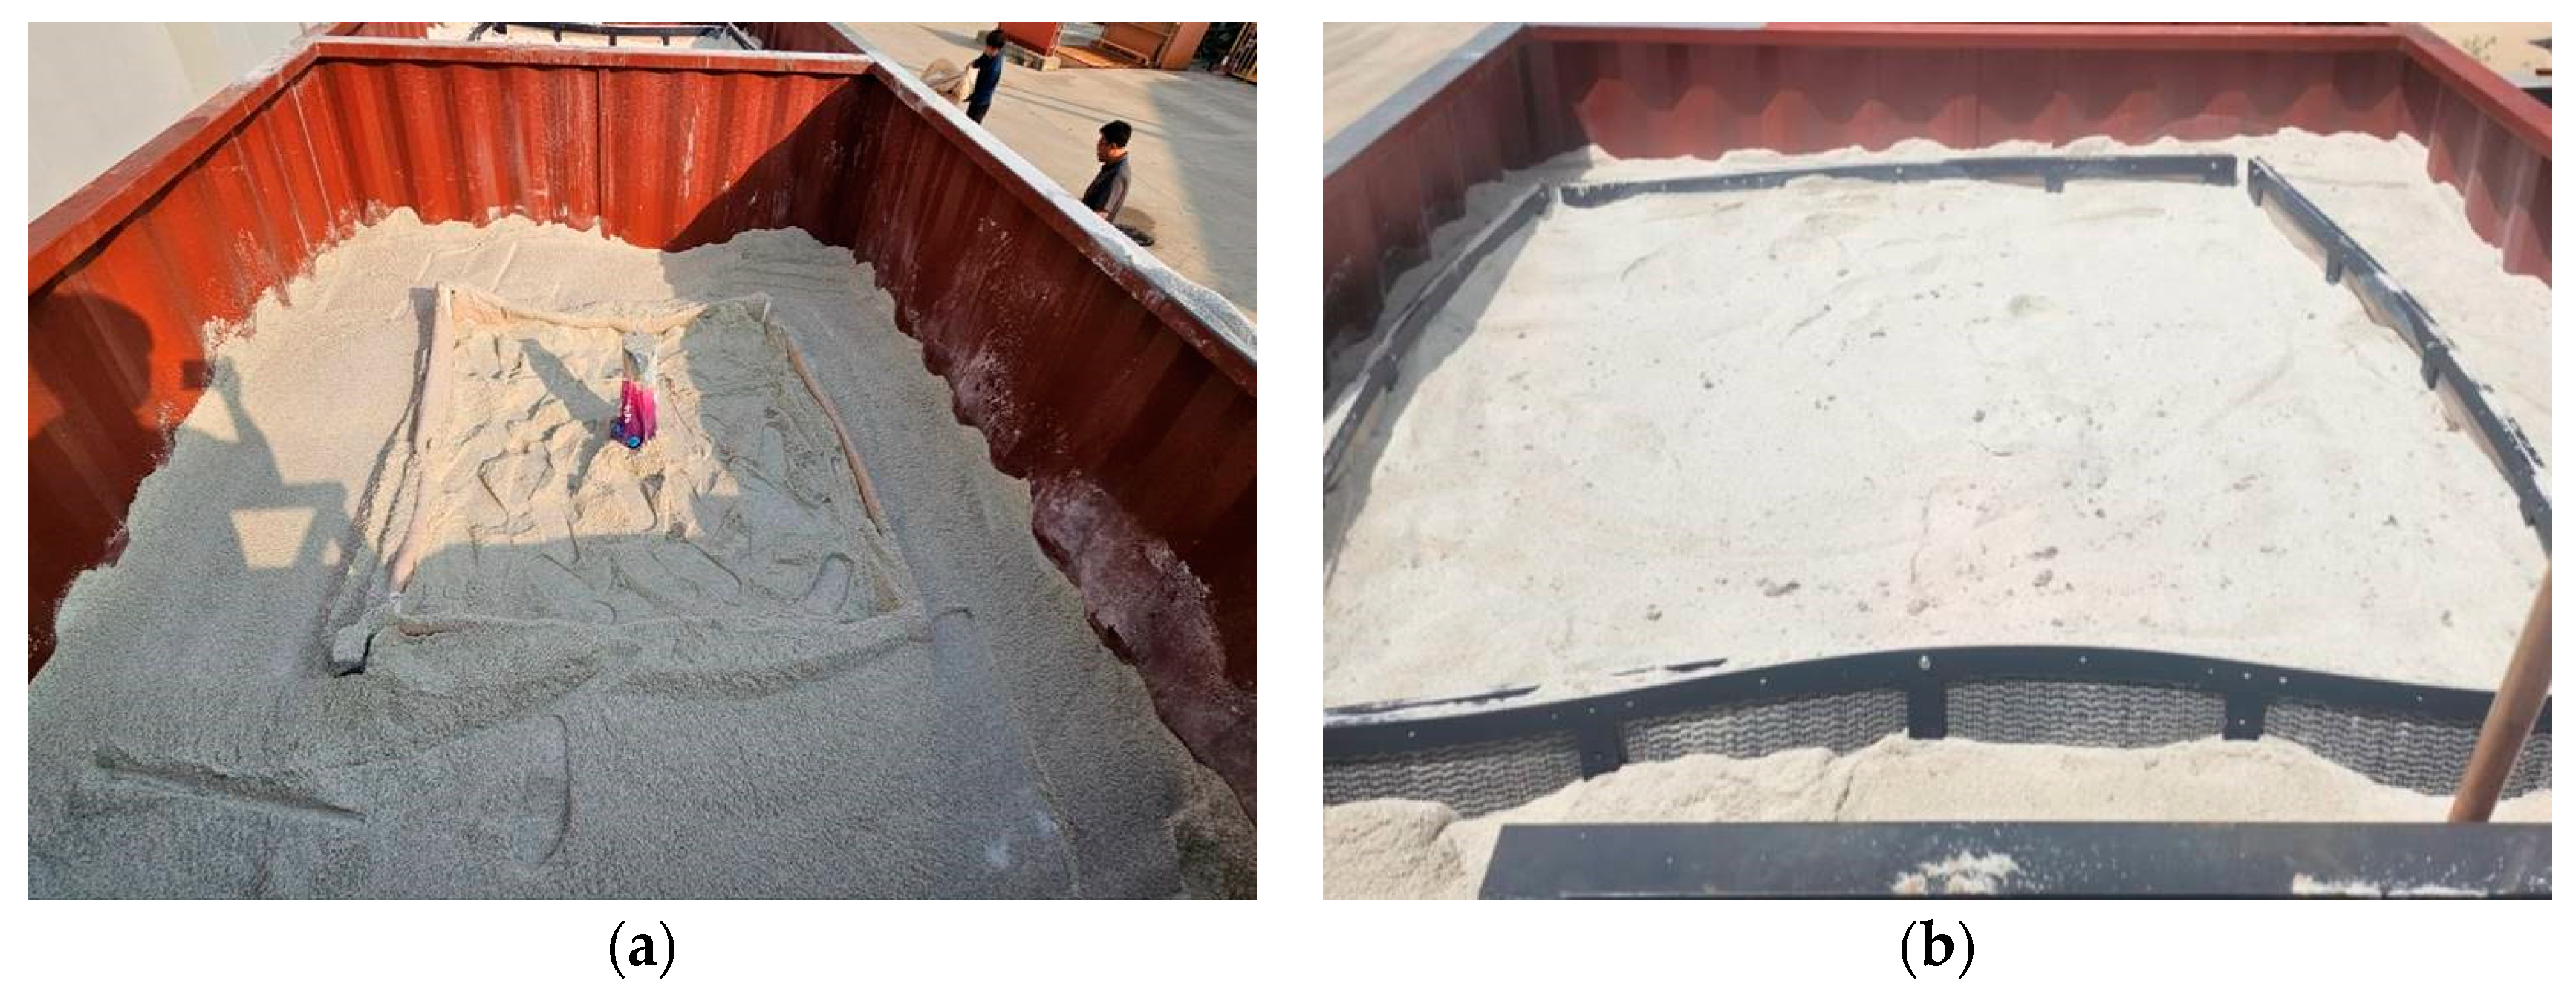
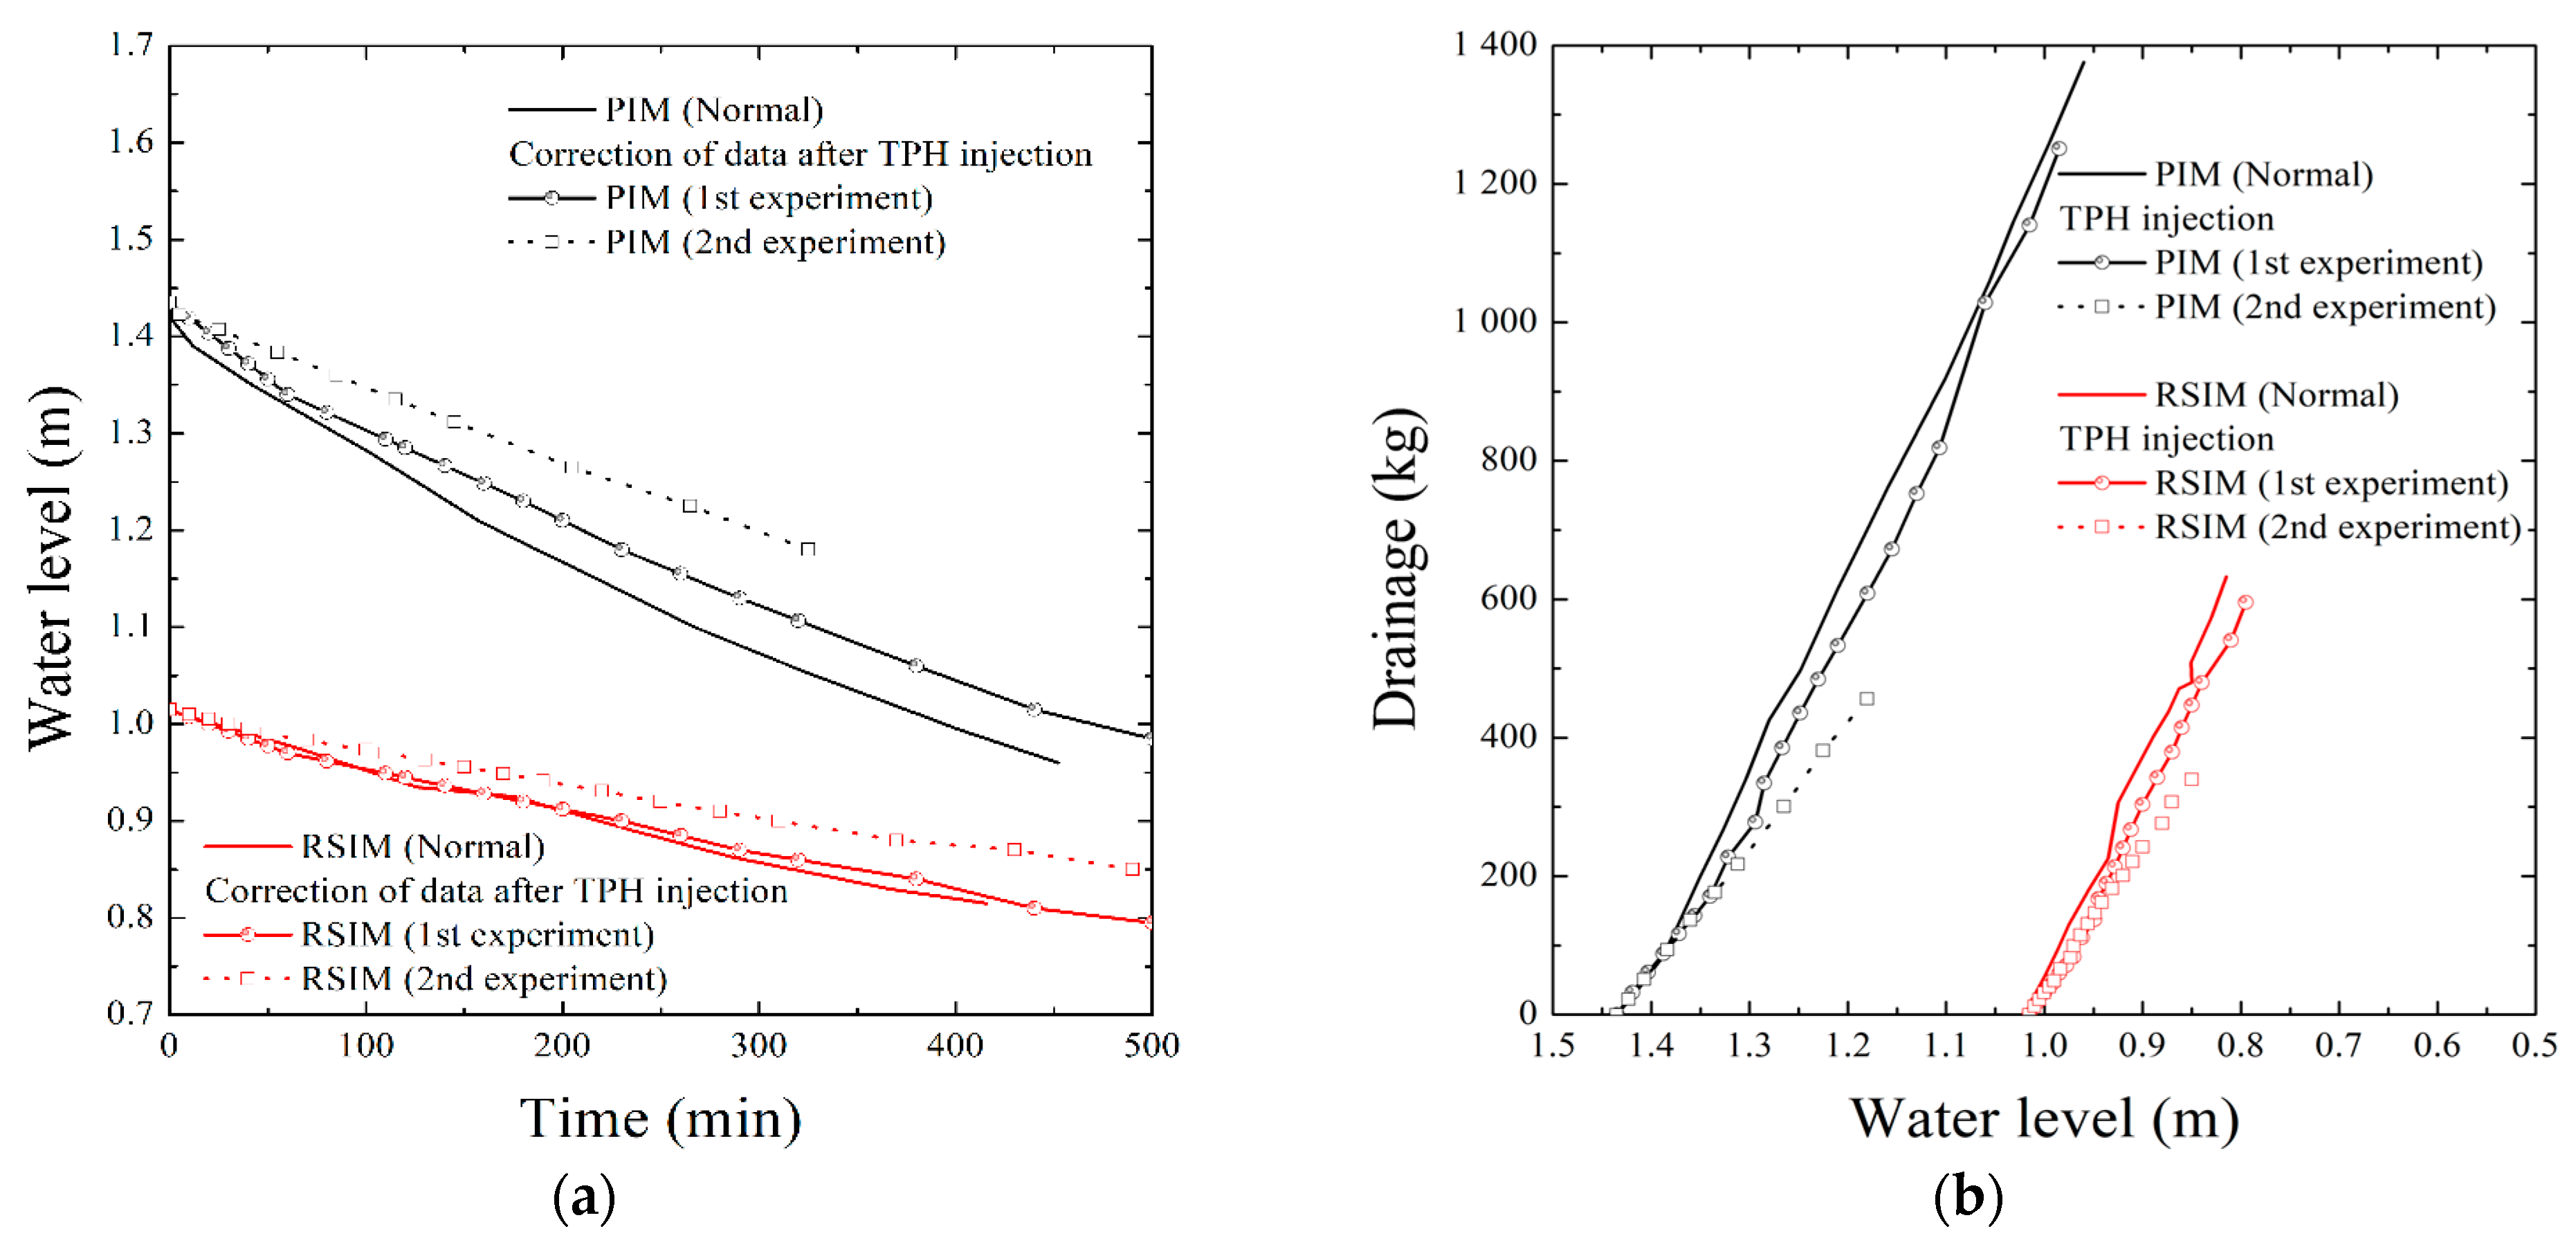
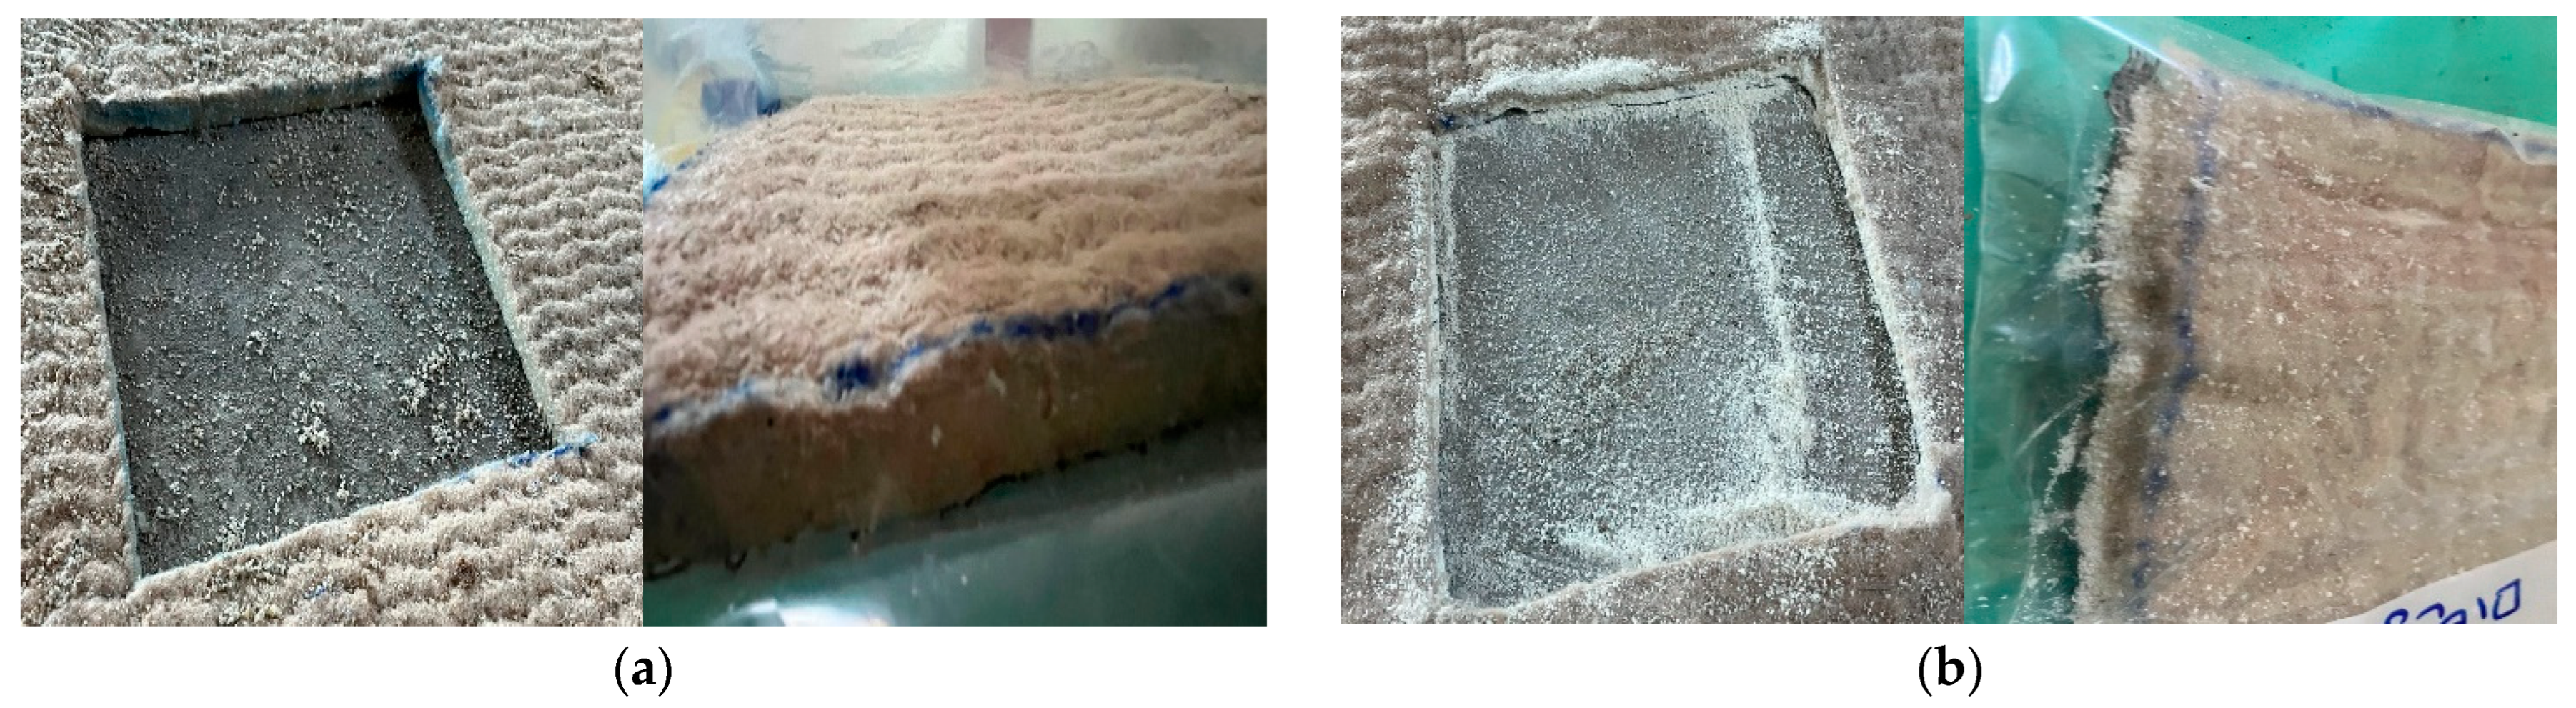
5.2. Analysis of RSIM and PIM Areas After TPH Injection

The corrected graph and detailed results of the entire dataset after TPH injection are shown in Figure 15 and Table 2. As a result of the water level correction, as shown in Figure 15a, compared to the ground stabilization data, it was confirmed that the groundwater level gradually decreased over time as the experiments progressed. In the RSIM and PIM installation zones, when considering the same water level changes, the time for the groundwater level to decrease gradually increased, and accordingly, the change ratio per minute increased.
The results of the correction for drainage are shown in Figure 15b. Unlike Figure 15a, which shows the water level with time, drainage is shown according to the water level to check the results more intuitively. As a result, it can be confirmed that the drainage decreases as the RSIM and PIM are installed and the first and second experiments are performed. Here, a high slope means that the drainage speed is fast, and a low slope means that the drainage speed is slow.
The water level analysis indicated that after the injection of TPH, the time taken for the water level to decrease to the same level increased, and the water level decreased over time. The drainage experiment results confirmed that after TPH injection, both the drainage volume and the drainage volume per water level decreased. This trend became more pronounced in the second experiment. This was due to the additional reaction caused by the movement of the TPH in the soil within the smart liner installation area toward the smart liner after the first experiment. In other words, the smart liner buried in the ground continuously absorbed TPH up to its capacity.

5.3. Measurement of Oil Leakage

To confirm the effectiveness of blocking any oil leakage, the water quality in the water tank and temporary tank and the soil in the chamber were partially collected during and after the experiment. The water quality analysis samples were taken from seven locations: (1) raw solution of TPH; (2) observation pipe of RSIM region after 24 h TPH injection; (3) water tank of RSIM region after the first drainage; (4) water tank of RSIM region after the second drainage; (5) observation pipe of PIM region after 24 h TPH injection; (6) water tank of PIM region after the first drainage; and (7) water tank of PIM region after the second drainage. The soil quality analysis samples were taken from eight locations: (1) inside and outside of RSIM region (four samples); (2) inside and outside of PIM region (four samples). The sampling location details for the soil quality analysis are shown in Figure 16.
After the completion of the experiments, the chamber was dismantled to examine the contact and reaction characteristics between the TPH and smart liner. The smart liners installed using the RSIM and PIM were retrieved (Figure 17a). The retrieved smart liners were then disassembled, as shown in Figure 17b,c.
During the inspection, it was observed that the reacted parts of the smart liner had undergone gelation (gel form), while the unreacted parts remained in powder form, as shown in Figure 18. The reaction status of the smart liner can be assessed by touch; however, this method is subjective. Therefore, a knife was used to partially check for gelation, and the reacted areas were sketched.
The water oil contaminant analysis results are shown in Table 3. The initial concentration of TPH was set at 10,000 ppm. After TPH was injected and water was added through the sprinkler, the initial water oil contaminant was measured in the RSIM and PIM observation pipes. Subsequently, during the two drainage experiments, the collected drained effluent was stored in a water tank and sampled. The samples were obtained from each tank and injection pipe in three 500 mL samples.
The results showed that the effluent from the RSIM and PIM areas had significantly lower ppm values compared to those measured in the observation pipes. Additionally, the ppm of the drainage effluent tended to decrease as the experiment progressed. In Table 3, the “difference between inside and outside” refers to the ppm difference between the observation pipe and the drainage hole in each experiment. Using this difference, the outflow rate and blocking rate were calculated.
The soil sampled from the locations indicated in Figure 16 was analyzed, and the results are presented in Table 4. The analysis indicates that the inside soil in the RSIM and PIM areas showed oil contamination levels between 40% and 60% relative to the original concentration of 10,000 ppm. However, the outside soil in the RSIM and PIM areas did not show any contamination, resulting in an outflow rate of 0% and a blocking rate of 100%. This means that the containment measures within the RSIM and PIM areas were highly effective in preventing oil leakage, as no contamination was detected in the external soil samples.
To calculate the reaction area of the smart liner, a reaction diagram was created using AutoCAD, as shown in Figure 19. In the RSIM area, a uniform reaction was observed at a height of approximately 1 m from the front of the valve. The reactions followed in sequence from the front to the side (left and right) and the back of the valve. In the RSIM area, 4.5438 m2 out of a total area of 6 m2 reacted, which corresponds to approximately 76%. In the PIM area, a uniform reaction was observed at a height of approximately 1.2 m from the front of the valve. The side parts (left and right) and the back of the valve reacted relatively uniformly within 0.8 m. In the PIM area, 4.3557 m2 reacted out of a total of 11.566 m2 (excluding the frame area), corresponding to approximately 38%. The difference in these ratios is due to the installation area. Since the reaction area was similar when 100 L of TPH was injected, it was confirmed that the performance of the smart liner was not affected by the use of any particular construction method.

6. Discussions

Previously, oil spills on land were mainly discussed as cleanup projects after the spill. Currently, oil storage facilities or pipelines on land are equipped with spill detection sensors or monitoring technologies, but the technology cannot be applied to past infrastructure, and spills were confirmed visually or by smell, such as crop failures in farmlands, wells, or valleys. In other words, when a spill was detected, it was too late, and a lot of money was needed for cleanup. However, the proposed systems can be considered a preliminary measure to prevent the spread of oil that did not exist before. The smart liner fence installed in oil-related facilities prevents oil from spreading to a wider area, and can be detected by a monitoring system after contact. Cleanup projects after detection can be reduced, and since oil is absorbed and groundwater movement is allowed, unless the entire installation area is completely blocked, time for cleanup projects can be secured. Currently, a monitoring system that can check the response of smart liners on the ground is being developed and studied, and it is expected that this will contribute to the smartness of the system.
Also, smart liners can contribute to environmental protection, resource efficiency, and long-term usability in terms of sustainability. This prevents the widespread spread of oil into soil and groundwater, leading to the prevention of long-term damage to the ecosystem. Smart liners can minimize unnecessary resource use by reacting only when oil is present. Under normal conditions, groundwater flow can be maintained without separate energy input or additional infrastructure. In addition, since smart liners directly absorb oil and block its spread, there is no need for large-scale cleanup equipment or disposable absorbents. This helps reduce the generation of secondary waste during the oil spill recovery process. Only the necessary parts can be constructed.
This study verified whether smart liners can function when installed underground to prevent the spread of oil spills. The construction methods used were the RSIM proposed in the existing literature [34] and the PIM designed to allow deep-depth construction. In the results of the large-scale experiment, it was confirmed that the smart liner’s function of preventing oil spill spread was excellent even with different construction methods. In addition, the groundwater flow test before TPH injection showed similar values regardless of the presence or absence of the smart liner, and it is predicted that normal groundwater flow will be maintained if an oil spill does not occur after installation. This is significant in that the installation of the smart liner does not lose the original function of the ground and only contributes to the prevention of oil spill spread.
The limitation of this study is that it was conducted in a specific soil (silica sand) with good permeability. Although the experimental ground confirmed a blocking performance of over 99%, there is a possibility that oil may spread more quickly in the gravel-based ground or basalt ground with extremely high permeability. In order to prepare for this, it is necessary to review methods such as expanding the absorption capacity of smart liners or adding additional auxiliary blocking systems. In addition, the risk of oil spills and the expected frequency of leakage should be considered for each facility. If installation guidelines for smart liners for each oil facility and adjustment of the amount of oil-absorbing resin inside the smart liner are implemented, it is believed that it will contribute to preventing oil spread most innovatively.

Author Contributions

Conceptualization, K.L., J.Y., J.P. and G.H. Data curation, K.L., J.P. and G.H. Funding acquisition, J.Y. Formal analysis, K.L., J.Y. and J.P. Investigation, K.L., J.Y., J.P. and G.H. Methodology, G.H. Project administration, J.P. and G.H. Resources, J.Y. and G.H. Supervision, J.P. Validation, K.L., J.P. and G.H. Visualization, K.L. Writing—original draft preparation, K.L. and J.Y. Writing—review and editing, J.Y., J.P. and G.H. All authors have read and agreed to the published version of the manuscript.

Funding

This research was funded by the Ministry of Environment, Korea Environmental Industry and Technology Institute (KEITI), grant number 2021002470007.

Institutional Review Board Statement

Not applicable.

Informed Consent Statement

Not applicable.

Data Availability Statement

Data are contained within the article.

Conflicts of Interest

Author Kicheol Lee was employed by the company UCI Tech. and, Author Jungjo Yuu was employed by the company GoldenPow Co., Ltd. The remaining authors declare that the research was conducted in the absence of any commercial or financial relationships that could be construed as a potential conflict of interest.

References

  1. Ahmad, A.A.; Muhammad, I.; Shah, T.; Kalwar, Q.; Zhang, J.; Liang, Z.; Mei, D.; Juanshan, Z.; Yan, P.; Zhi, D.X.; et al. Remediation methods of crude oil contaminated soil. World J. Agric. Soil Sci. 2020, 4, 1–8. [Google Scholar]
  2. Dos Santos, J.J.; Maranho, L.T. Rhizospheric microorganisms as a solution for the recovery of soils contaminated by petroleum: A review. J. Environ. Manag. 2018, 210, 104–113. [Google Scholar] [CrossRef]
  3. Rodrigues, S.M.; Pereira, M.E.; da Silva, E.F.; Hursthouse, A.S.; Duarte, A.C. A review of regulatory decisions for environmental protection: Part I—Challenges in the implementation of national soil policies. Environ. Int. 2009, 35, 202–213. [Google Scholar] [CrossRef] [PubMed]
  4. ITOPF. Oil Tanker Spill Statistics 2023; ITOTP: London, UK, 2024. [Google Scholar]
  5. Tang, K.H.D. Safety Performance Measurement Framework for Offshore Oil and Gas Platforms in Malaysia; University of Malaya: Kuala Lumpur, Malaysia, 2018. [Google Scholar]
  6. Tang, K.H.D.; Ting, C.H.I. Levels of petroleum hydrocarbons in soil near an onshore crude oil storage facility in Malaysia. J. Res. Environ. Earth Sci. 2021, 7, 24–32. [Google Scholar]
  7. Roberts, R.S. Risk Management of Oil Spills Onshore, Case Analysis. Master’s Thesis, Royal Institute of Technology, Stockholm, Sweden, 2013. [Google Scholar]
  8. Rhykerd, R.L.; Weaver, R.W.; McInnes, K.J. Influence of salinity on bioremediation of oil in soil. Environ. Pollut. 1995, 90, 127–130. [Google Scholar] [CrossRef] [PubMed]
  9. Helmy, Q.; Laksmono, R.; Kardena, E. Bioremediation of aged petroleum oil contaminated soil: From laboratory scale to full scale application. Procedia Chem. 2015, 14, 326–333. [Google Scholar] [CrossRef]
  10. Xu, J.; Kong, F.; Song, S.; Cao, Q.; Huang, T.; Cui, Y. Effect of Fenton pre-oxidation on mobilization of nutrients and efficient subsequent bioremediation of crude oil-contaminated soil. Chemosphere 2017, 180, 1–10. [Google Scholar] [CrossRef]
  11. Baniasadi, M.; Mousavi, S.M. A Comprehensive review on the bioremediation of oil spills. Microb. Action Hydrocarb. 2018, 223–254. [Google Scholar] [CrossRef]
  12. Walker, A.H. Oil Spills and Risk Perceptions in Oil Spill Science and Technology; Elsevier: Amsterdam, The Netherlands, 2016; pp. 1–70. [Google Scholar]
  13. Austin, D.; Sauer, A. Changing Oil: Emerging Environmental Risks and Shareholder Value in the Oil and Gas Industry; World Resources Institute: Washington, DC, USA, 2002. [Google Scholar]
  14. Pegg, S. World Leaders and Bottom Feeders: Divergent Strategies Toward Social Responsibility and Resource Extraction; Global corporate power; Lynne Rienner: Boulder, CO, USA, 2006. [Google Scholar]
  15. Chen, M.E. National Oil Companies and Corporate Citizenship: A Survey of Transnational Policy and Practice; The James A. Baker III Institute for Public Policy, Rice University: Houston, TX, USA, 2007. [Google Scholar]
  16. Fraser, G.S.; Ellis, J.; Hussain, L. An international comparison of governmental disclosure of hydrocarbon spills from offshore oil and gas installations. Mar. Pollut. Bull. 2008, 56, 9–13. [Google Scholar] [CrossRef]
  17. Nwilo, P.C.; Badejo, O.T. Impacts and management of oil spill pollution along the Nigerian coastal areas. Adm. Mar. Spaces Int. Issues 2006, 119, 1–15. [Google Scholar]
  18. Cariglia, N.; Challenger, G.; Beer, N. The Use and Misuse of SCAT in Spill Response. Int. Oil Spill Conf. Proc. 2017, 2017, 2642–2659. [Google Scholar] [CrossRef]
  19. Owens, E.; Santner, R. Integration of a shoreline response program (SRP) and shoreline assessment surveys into an Incident Management System for oil spill response. J. Environ. Manag. 2021, 279, 111637. [Google Scholar] [CrossRef] [PubMed]
  20. Fingas, M.; Brown, C.E. An Update on Oil Spill Remote Sensing. In Advances in Environmental Research; Nova Science Publishers Inc.: New York, NY, USA, 2021; Volume 80, pp. 95–137. ISBN 9781536194340. [Google Scholar]
  21. Pradhan, B.; Das, M.; Pradhan, C. Marine oil spills: Implications on response plan. EnvironmentAsia 2021, 14, 13–22. [Google Scholar]
  22. Haule, K.; Toczek, H.; Borzycka, K.; Darecki, M. Influence of dispersed oil on the remote sensing reflectance—Field experiment in the baltic sea. Sensors 2021, 21, 5733. [Google Scholar] [CrossRef]
  23. Prasad, S.; Balakrishnan Nair, T.M. Quantification of oil lost from tanker vessel using space borne radar datasets—Case study of Haldia port oil spill, July 2018. In Proceedings of the International Oil Spill Conference, Virtual, 10–13 May 2021; p. 686884. [Google Scholar]
  24. Gavaskar, A.; Gupta, N.; Sass, B.; Janosy, R.; Hicks, J. Design Guidance for Application of Permeable Reactive Barriers for Groundwater Remediation; Battelle: Columbus, OH, USA, 2000. [Google Scholar]
  25. Environmental Protection Agency. Evaluation of Subsurface Engineered Barriers at Waste Sites; EPA: Washington, DC, USA, 1998.
  26. Opdyke, S.M.; Evans, J.C. Slag-Cement-Bentonite Slurry Walls. J. Geotech. Geoenvironmental Eng. 2005, 131, 673–681. [Google Scholar] [CrossRef]
  27. He, K.; Lai, X. Application status of vertical barrier technology in site contamination remediation. In Proceedings of the 4th International Conference on Energy Equipment Science and Engineering, Xi’an, China, 28–30 December 2018. [Google Scholar]
  28. Ren, J.; Song, X.; Ding, D. Sustainable remediation of diesel-contaminated soil by low temperature thermal treatment: Improved energy efficiency and soil reusability. Chemosphere 2020, 241, 124952. [Google Scholar] [CrossRef]
  29. Liu, Y.; Zhang, Q.; Wu, B.; Li, X.; Ma, F.; Li, F.; Gu, Q. Hematite-facilitated pyrolysis: An innovative method for remediating soils contaminated with heavy hydrocarbons. J. Hazard. Mater. 2020, 383, 121165. [Google Scholar] [CrossRef]
  30. Kang, C.U.; Kim, D.H.; Khan, M.A.; Kumar, R.; Ji, S.E.; Choi, K.W.; Paeng, K.J.; Park, S.; Jeon, B.H. Pyrolytic remediation of crude oil-contaminated soil. Sci. Total Environ. 2020, 713, 136498. [Google Scholar] [CrossRef]
  31. Yuu, J.; Kim, K.S. A Experimental Study on the Permeability of Smart Liquid barrier to Organic Contaminats. In Proceedings of the 2022 Spring Geosynthetics Conference, Seoul, Republic of Korea, 31 March 2022. [Google Scholar]
  32. Lee, J.Y.; Oh, S.J.; Kim, S.H.; Lee, K.; Park, J.J.; Hong, G. Evaluation on Strength Characteristics of Reactive Materials to Prevent the Diffusion of Organic Pollutants. Korean Geosynth. Soc. 2023, 22, 35–42. [Google Scholar]
  33. Lim, H.J.; Cho, W.R.; Oh, S.J.; Kim, S.H.; Lee, J.Y. A Study on the Selectively Block Barrier for Prevent the Spread of TPH and Phenol in the Ground. J. Korean Geosynth. Soc. 2024, 23, 1–7. [Google Scholar]
  34. Lee, K.; Yuu, J.; Park, J.; Hong, G. Proposal of Construction Method of Smart Liner to Block and Detect Spreading of Soil Contaminants by Oil Spill. Int. J. Environ. Res. Public Health 2023, 20, 940. [Google Scholar] [CrossRef] [PubMed]
Figure 1. Smart liner for preventing oil spills on the ground.
Sustainability 16 10626 g001
Figure 2. Applications of smart liners: (a) oil station; (b) parking lot; (c) oil refinery; (d) landfill.
Sustainability 16 10626 g002
Figure 3. Installation of smart liner using the RSIM (modified from [34]).
Sustainability 16 10626 g003
Figure 4. Installation of smart liner using the PIM.
Sustainability 16 10626 g004
Figure 5. Chamber used in large-scale experiments.
Sustainability 16 10626 g005
Figure 6. Subground and observation pipe: (a) installation schematic; (b) composition of subground, slope, and observation pipe.
Sustainability 16 10626 g006
Figure 7. RSIM: (a) installation schematic; (b) connection of supporting pile and smart liner using connecting pipe; (c) outside frame to support the weight of smart liner; and PIM: (d) installation schematic; (e) connection of panel and smart liner; (f) design drawings of the modular panel.
Sustainability 16 10626 g007
Figure 8. Backfilling using silica sand with construction method: (a) RSIM; (b) PIM.
Sustainability 16 10626 g008
Figure 9. Overall view of large-scale experiments.
Sustainability 16 10626 g009
Figure 10. Ground stability: (a) input and discharge of water (compaction using water); (b) waterproof cover to prevent inflow of water.
Sustainability 16 10626 g010
Figure 11. Injection of TPH.
Sustainability 16 10626 g011
Figure 12. Experimental procedure for verifying the performance of smart liner with TPH injection: (a) injection of TPH (procedure 1); (b) operation of sprinkler (procedure 2); (c) measurement of water level and drainage (procedure 3).
Sustainability 16 10626 g012
Figure 13. Ground stability over time: (a) water level; (b) drainage.
Sustainability 16 10626 g013
Figure 14. Data correction over time after setting the initial water level: (a) water level; (b) drainage.
Sustainability 16 10626 g014
Figure 15. Data correction after TPH injection: (a) water level with time; (b) drainage with water level.
Sustainability 16 10626 g015
Figure 16. Locations of sample collection to check soil contamination.
Sustainability 16 10626 g016
Figure 17. Inspecting the response of the smart liner: (a) demolition; (b) retrieved smart liner in the RSIM area; (c) retrieved smart liner in the PIM area.
Sustainability 16 10626 g017
Figure 18. Inspection of reacted areas: (a) gelation of the smart liner; (b) powder form of the smart liner.
Sustainability 16 10626 g018
Figure 19. Reaction diagram of smart liner.
Sustainability 16 10626 g019
Table 1. Results of water level and drainage for ground stability.
AreasWater LevelDrainage
Initial
(m)
After 500 min
(m)
Change Ratio per Minute
(mm/min)
Amount
(kg)
Amount per Minute
(kg/min)
Amount per Water Level
(kg/cm)
RSIM1st1.070.830.48786.501.5732.78
2nd0.980.760.44664.601.3330.21
PIM1st1.540.961.161584.003.1727.31
2nd1.480.931.101461.902.9226.58
Table 2. Results of water level and drainage after injection of TPH.
AreasWater LevelDrainage
Changes
(m)
Time
(min)
Change Ratio per Minute
(mm/min)
Amount
(kg)
Amount per Minute
(kg/min)
Amount per Water Level
(kg/cm)
RSIMNo TPH1.015→0.850
(0.165)
3180.52480.211.511.51
TPH 1st3500.47446.971.281.28
TPH 2nd4900.34336.150.690.69
PIMNo TPH1.435→1.180
(0.255)
1871.36701.613.753.75
TPH 1st2301.11608.262.642.64
TPH 2nd3250.78456.041.401.40
Table 3. Results of water oil contaminant.
AreasLocationsMeasured Quantity (ppm)Difference Between Inside and Outside (ppm)Outflow Rate (%)Blocking Rate (%)
RSIMObservation pipe2788.7---
Drainage hole in first experiment16.22772.50.5899.42
Drainage hole in second experiment1.82786.90.0699.94
PIMObservation pipe5827.9---
Drainage hole in first experiment5.15822.80.0999.91
Drainage hole in second experiment0.45827.50.0199.99
Table 4. Results of soil contamination.
AreasLocationsMeasured Quantity (ppm)Outflow Rate (%)Blocking Rate (%)
RSIMInside (sample 1)4019--
Inside (sample 2)5987--
Outside (sample 1)LOD (Limit of Detection)0100
Outside (sample 2)LOD (Limit of Detection)0100
PIMInside (sample 1)5555--
Inside (sample 2)4518--
Outside (sample 1)Not detected0100
Outside (sample 2)Not detected0100
Disclaimer/Publisher’s Note: The statements, opinions and data contained in all publications are solely those of the individual author(s) and contributor(s) and not of MDPI and/or the editor(s). MDPI and/or the editor(s) disclaim responsibility for any injury to people or property resulting from any ideas, methods, instructions or products referred to in the content.

