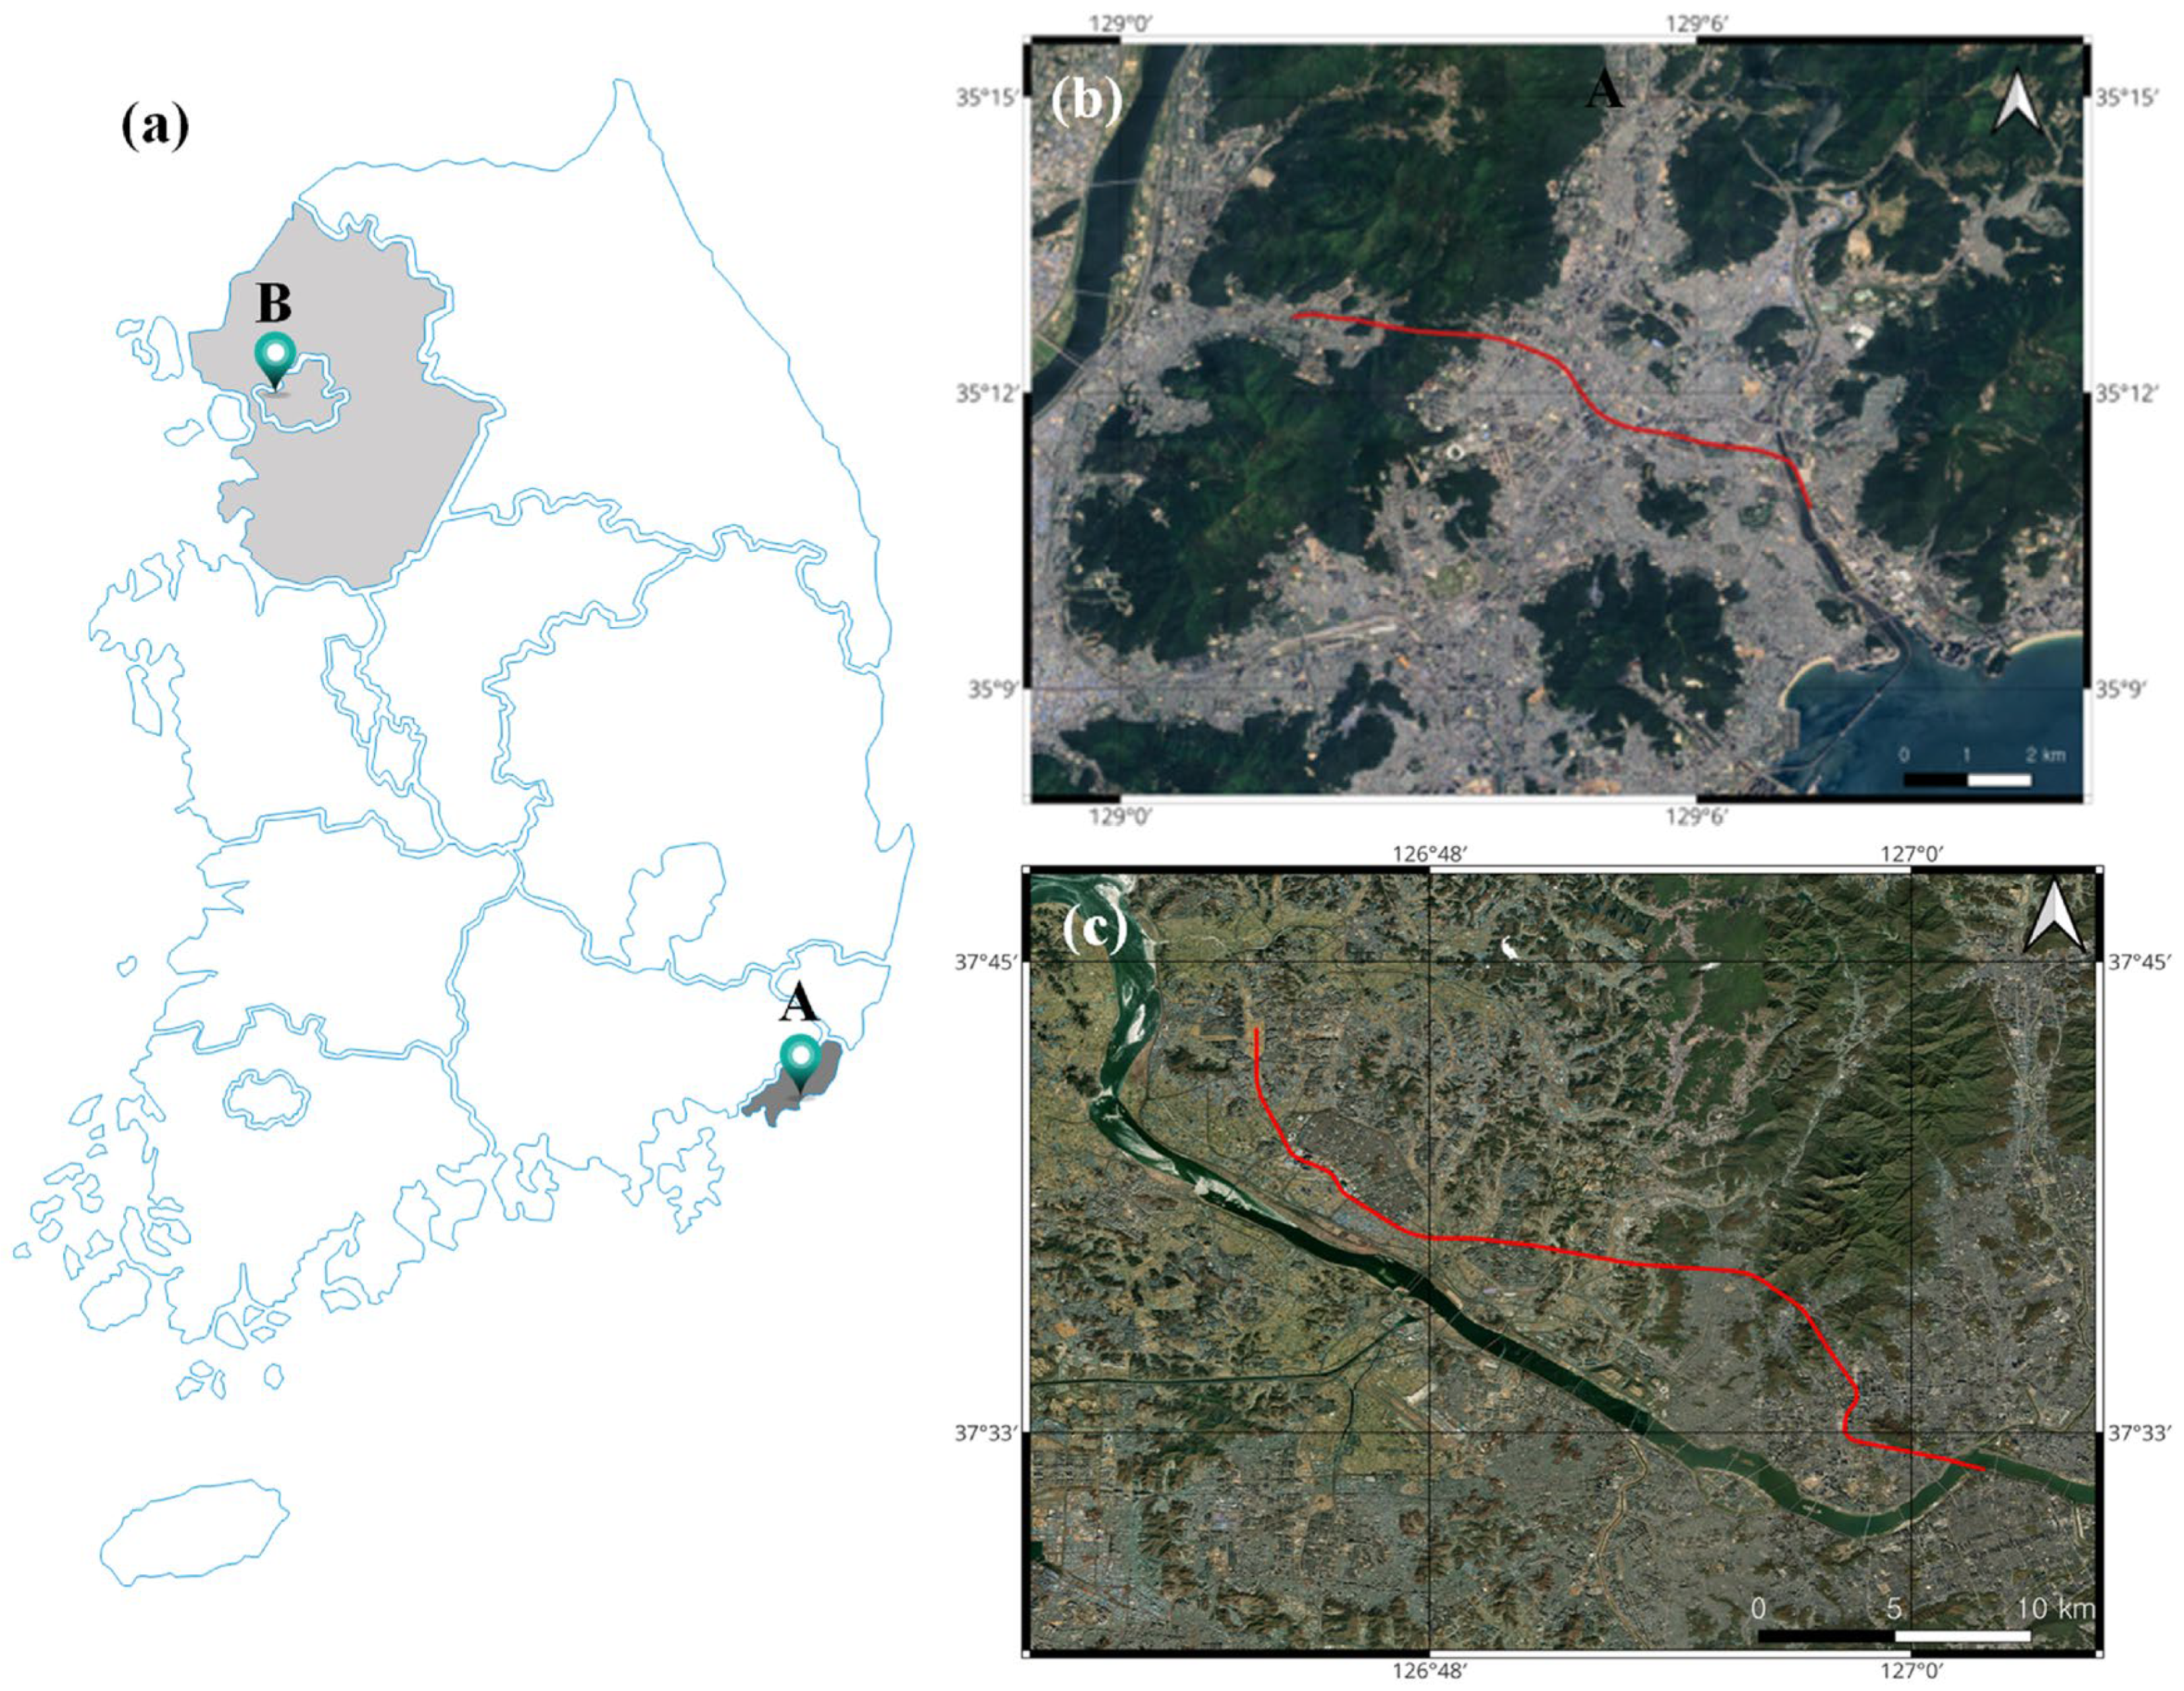
Article

Identification of Risk Zones During Infrastructure Construction and Maintenance Using Satellite SAR Data for Sustainable Urban Areas in South Korea

1
Department of Geotechnical Engineering Research, Korea Institute of Civil Engineering and Building Technology, Goyang 10223, Republic of Korea
2
Department of Geophysics, Kangwon National University, Chuncheon 24341, Republic of Korea
*
Author to whom correspondence should be addressed.
Sustainability 2024, 16(23), 10627; https://doi.org/10.3390/su162310627
Submission received: 31 October 2024 / Revised: 21 November 2024 / Accepted: 27 November 2024 / Published: 4 December 2024
(This article belongs to the Special Issue Sustainability in Civil and Infrastructure Engineering)

Abstract

:
Satellite data have emerged as a widely used tool for global research. In particular, satellite data aid in overcoming long-term observational challenges caused by seasonal effects, facilitating comprehensive monitoring of large regions and simplifying infrastructure maintenance. However, in Korea, the application of satellite SAR (Synthetic Aperture Radar) data within the construction sector remains relatively limited. This study used satellite SAR data to analyze the effects of infrastructure (underground roads and subway systems) currently under construction in Korea on the surrounding ground surface, in order to identify risk zones. This study explored methods for continuously monitoring extensive areas over long distances and selecting potential risk zones. The results indicated substantial ground displacements at specific locations and seasonal changes. Furthermore, past and current satellite SAR data were overlapped to facilitate a time-series analysis. The results confirmed that satellite SAR can improve the monitoring of construction projects in Korea and provide valuable information that can contribute to enhancing maintenance efforts, including near-future ground displacement data. The results are expected to help citizens maintain a safe and sustainable life in urban areas.

1. Introduction

Urbanization is rapidly increasing, particularly in developed countries, leading to various issues due to the saturation of aboveground urban spaces. In particular, traffic congestion results in long commutes and travel times, and the air pollution generated during traffic jams is an environmental concern. To address these problems, technologies are being developed that enable us to use underground spaces rather than aboveground spaces for transportation infrastructure. Representative projects include the Big Dig in Boston, U.S.; SR99 in Seattle, U.S.; M30 in Madrid, Spain; and A7 in Hamburg, Germany. In Seoul, Korea, the Seobu and Sinwol–Yeoui underground roads are currently operational, while the underground construction of major highways, such as the Gyeongin and Gyeongbu expressways, is in progress.
To promote the 3-D use of land and systematically advance underground space development, both domestic and international policies, laws, and guidelines are being developed. Examples include Canada’s Underground Pedestrian System Design Guidelines, Japan’s Special Measures Act on Public Use of Deep Underground, and Singapore’s Basic Policy on the Use of Underground Space, which are aimed at ensuring the safe development of urban underground areas. However, a comprehensive legal framework has yet to be established in Korea, and there remain unresolved concerns regarding ground subsidence during urban underground development.
To address these issues, technologies that can monitor wide areas throughout the design, construction, and operation phases of underground transportation infrastructure are required. Specifically, InSAR technology, which uses satellite SAR data, is being investigated as a tool for observing displacements in various structures, such as railways and bridges. Koohmishi et al. [1] proposed a method for monitoring the condition of a large-scale railway infrastructure that combines non-destructive testing techniques, such as GPR, with InSAR, a satellite analysis method. Tonelli et al. [2] used InSAR technology to monitor bridges in Italy and were able to consider the characteristics of the bridges’ foundations. InSAR technology has also been used to analyze the deformation zones and processes caused by underground mining, providing data for the maintenance and restoration of mines [3].
In Korea, Kim et al. [4] analyzed the Honam KTX line over 6 months using D-InSAR technology and TerraSAR-X satellite data and successfully derived relatively accurate ground displacement data for the railway area. However, additional research is required to confirm the reliability of long-term behavior due to insufficient data. Kim et al. [5] also analyzed the Osong railway infrastructure using D-InSAR technology with 25 images obtained from the TerraSAR-X satellite data. The results confirmed the potential of this method for monitoring long, linear, and extensive railway infrastructure. They also analyzed a PSC BOX railway bridge using MT-InSAR technology and confirmed that even minute displacements could be observed [6]. However, despite similarities between structures, variations in behavior were observed between bridges. Thus, further research is required to understand complex factors such as the concrete mix, sunlight exposure, and creep.
InSAR technology has also been used to detect ground subsidence. An analysis of the Ardabil plain in northwest Iran, using Sentinel-1 satellite SAR data from 2014 to 2021, observed subsidence phenomena due to reduced rainfall in 2018, demonstrating that the technology is suitable for monitoring large areas [7]. An analysis of southern, Texas using PS-InSAR technology with Sentinel-1 satellite SAR data from January 2020 to March 2023, identified various geological issues, including ground subsidence, flooding, and coastal erosion. The results matched data from GPS and groundwater level measurements [8].
In Korea, as the undergrounding of transportation infrastructure has recently been prioritized, studies have been conducted to monitor the resulting ground displacement. An analysis of ground subsidence due to groundwater level depletion, using InSAR technology, confirmed a correlation between lowering groundwater levels and ground subsidence [9]. In Busan, ground subsidence was observed around underground road construction, with subsidence occurring near rivers due to excavation [10]. Another study on the same underground road route found that 40–60 mm of displacement occurred in the northern part of the middle-lower reaches of the Oncheon Stream and the confluence area, indicating the need for continuous monitoring [11].
Various studies using satellite SAR data have been conducted both domestically and internationally, and a majority of these studies have demonstrated the effectiveness of using time-series analysis to observe changes in large areas; however, the impact of infrastructure being constructed underground on the surface has not been clearly identified yet. Additionally, a method for selecting risk areas after analyzing long stretches of infrastructure has not been proposed. In this study, two analytical tools were used to assess the impact of underground infrastructure construction, such as underground roads or subways in urban areas, as well as on the ground surface, in order to identify risk zones. The analysis results were further examined as tools for continuously monitoring extensive areas over long distances and selecting potential risk zones.

2. Materials and Methods

2.1. Study Areas

This study focused on the Seoul Metropolitan Area, encompassing Seoul, South Korea, and the Busan region. Two locations near ongoing underground transportation infrastructure projects were analyzed: an underground road and a subway system (Figure 1a). The first area is the construction site of the Busan Mandeok–Centum underground road (hereafter referred to as Study Area A), with the planned route shown in Figure 1b. The total route length is approximately 9.3 km, and it is adjacent to existing subway lines. The western starting point was Mandeok-dong, Buk-gu, which includes mountainous terrain composed of granodiorite and andesitic rocks, which are expected to exhibit minimal ground movement. However, most of the remaining areas, such as those around the Oncheon Stream and Suyeong River, contain soft ground formed by alluvial deposits, increasing the likelihood of ground subsidence. The second area is a part of the GTX-A metropolitan express railway line (hereafter referred to as Study Area B; Figure 1c), with a total planned route length of 38.9 km. It is currently under construction. The area is in the southern part of Goyang City, in the lower reaches of the Han River, which has widespread unconsolidated sedimentary layers formed by alluvial deposits and reclamation, making the area vulnerable to ground subsidence.
Figure 1. Overview of the two study areas—an underground road and a subway system—included in this study. (a) A indicates the Busan area; B indicates the Seoul metropolitan area. (b) Route of the Busan Mandeok–Centum underground road (modified from [11]). (c) Construction route of the GTX-A metropolitan express railway.
Sustainability 16 10627 g001

2.2. Satellite SAR Data

SAR images from the European Space Agency’s (ESA) Sentinel-1 satellite were used in this study. Sentinel-1 is equipped with a C-band SAR with a central frequency of 5.4 GHz and captures the same area every 12 days. The Sentinel-1 system comprises two satellites; however, since 23 December 2021, Sentinel-1B has experienced issues with data transmission and, consequently, it has discontinued its data supply. Therefore, only data from the Sentinel-1A satellite were used for the analysis.
For Study Area A, 172 images, collected between 14 January 2017 and 24 June 2023, were used. For Study Area B, 163 images, collected between 25 February 2017 and 30 June 2023, were used. The SAR data used in the analysis were Sentinel-1 SAR Single Look Complex (SLC) images in Interferometric Wide (IW) swath mode collected from the Alaska Satellite Facility (ASF) Data Search website (https://search.asf.alaska.edu/#/, accessed on 30 October 2024). All SAR images were captured under VV polarization from the ascending orbit of Sentinel-1.

2.3. DSM (Digital Surface Model) Construction

To use InSAR techniques to calculate ground displacement from multiple satellite SAR images, precise co-registration of SAR data and removal of interference phases caused by terrain elevation are necessary. In this study, the Copernicus GLO-30 digital surface model (DSM) was used for the co-registration of SAR data and the removal of interference phases caused by terrain elevation. The Copernicus GLO-30 DSMs of Study Areas A and B are shown in Figure 2 and Figure 3.

2.4. Analysis Methods and Software Used

This study employed the Persistent Scatterer InSAR (PSInSAR) technique, a time-series InSAR method that uses persistent scatterers to analyze ground displacement in both study areas [12]. PSInSAR is a technique that detects displacements at the millimeter level using persistent scatterers, which are points within an SAR data pixel that consistently exhibit strong and stable signals. PSInSAR tracks changes in the same scatterer, using SAR images from multiple time periods. By comparing the phase differences between SAR images acquired at different times, it is possible to measure minute displacements on the surface, such as ground deformation. This approach follows the principle of detecting changes based on the phase differences between multiple images. Using phase difference analysis, displacement data are obtained, which are then used to estimate the displacement patterns (such as planar and vertical displacements). PSInSAR is highly effective for monitoring precise surface changes as it can track displacements with millimeter-level accuracy.
PSInSAR involves selecting one image from the time-series SAR dataset as the reference image; the remaining images are secondary images used for InSAR analysis to generate interferograms. The reference image is typically selected by considering the perpendicular baseline distances between the reference and secondary images to minimize distance variance. LOS displacement distribution refers to Line of Sight displacement, representing surface displacement measurements observed by a specific sensor (e.g., InSAR) in the direction of the sensor’s line of sight. This approach projects actual 3-D deformation onto a 1-D scale, enabling the analysis of surface movement along a specified direction.
This study utilized three programs: Stanford Method for Persistent Scatterers (StaMPS, Ver 4.1b), GAMMA Software (Ver. 20230620), and ENVI SARscape(Ver. 5.6). StaMPS, developed at Stanford University, specializes in analyzing ground deformation using persistent scatterers. GAMMA software is a widely adopted Linux-based software package for processing and analyzing InSAR data, offering a range of algorithms for differential InSAR (DInSAR) and time-series analysis. SARscape, a module within the ENVI software platform, provides a user-friendly interface and a variety of features for processing and analyzing SAR data.
Data from 17 January 2021 were selected as the reference image for Study Area A; data from 17 December 2020 were selected as the reference image for Study Area B. For Study Area A, analysis was conducted using three programs: Stanford Method for Persistent Scatterers (StaMPS) [13], GAMMA Software, and ENVI SARscape, and the results were compared. For Study Area B, ground displacements were analyzed using GAMMA Software and ENVI SARscape.

3. Results

3.1. LOS Direction Displacement Velocity Analysis

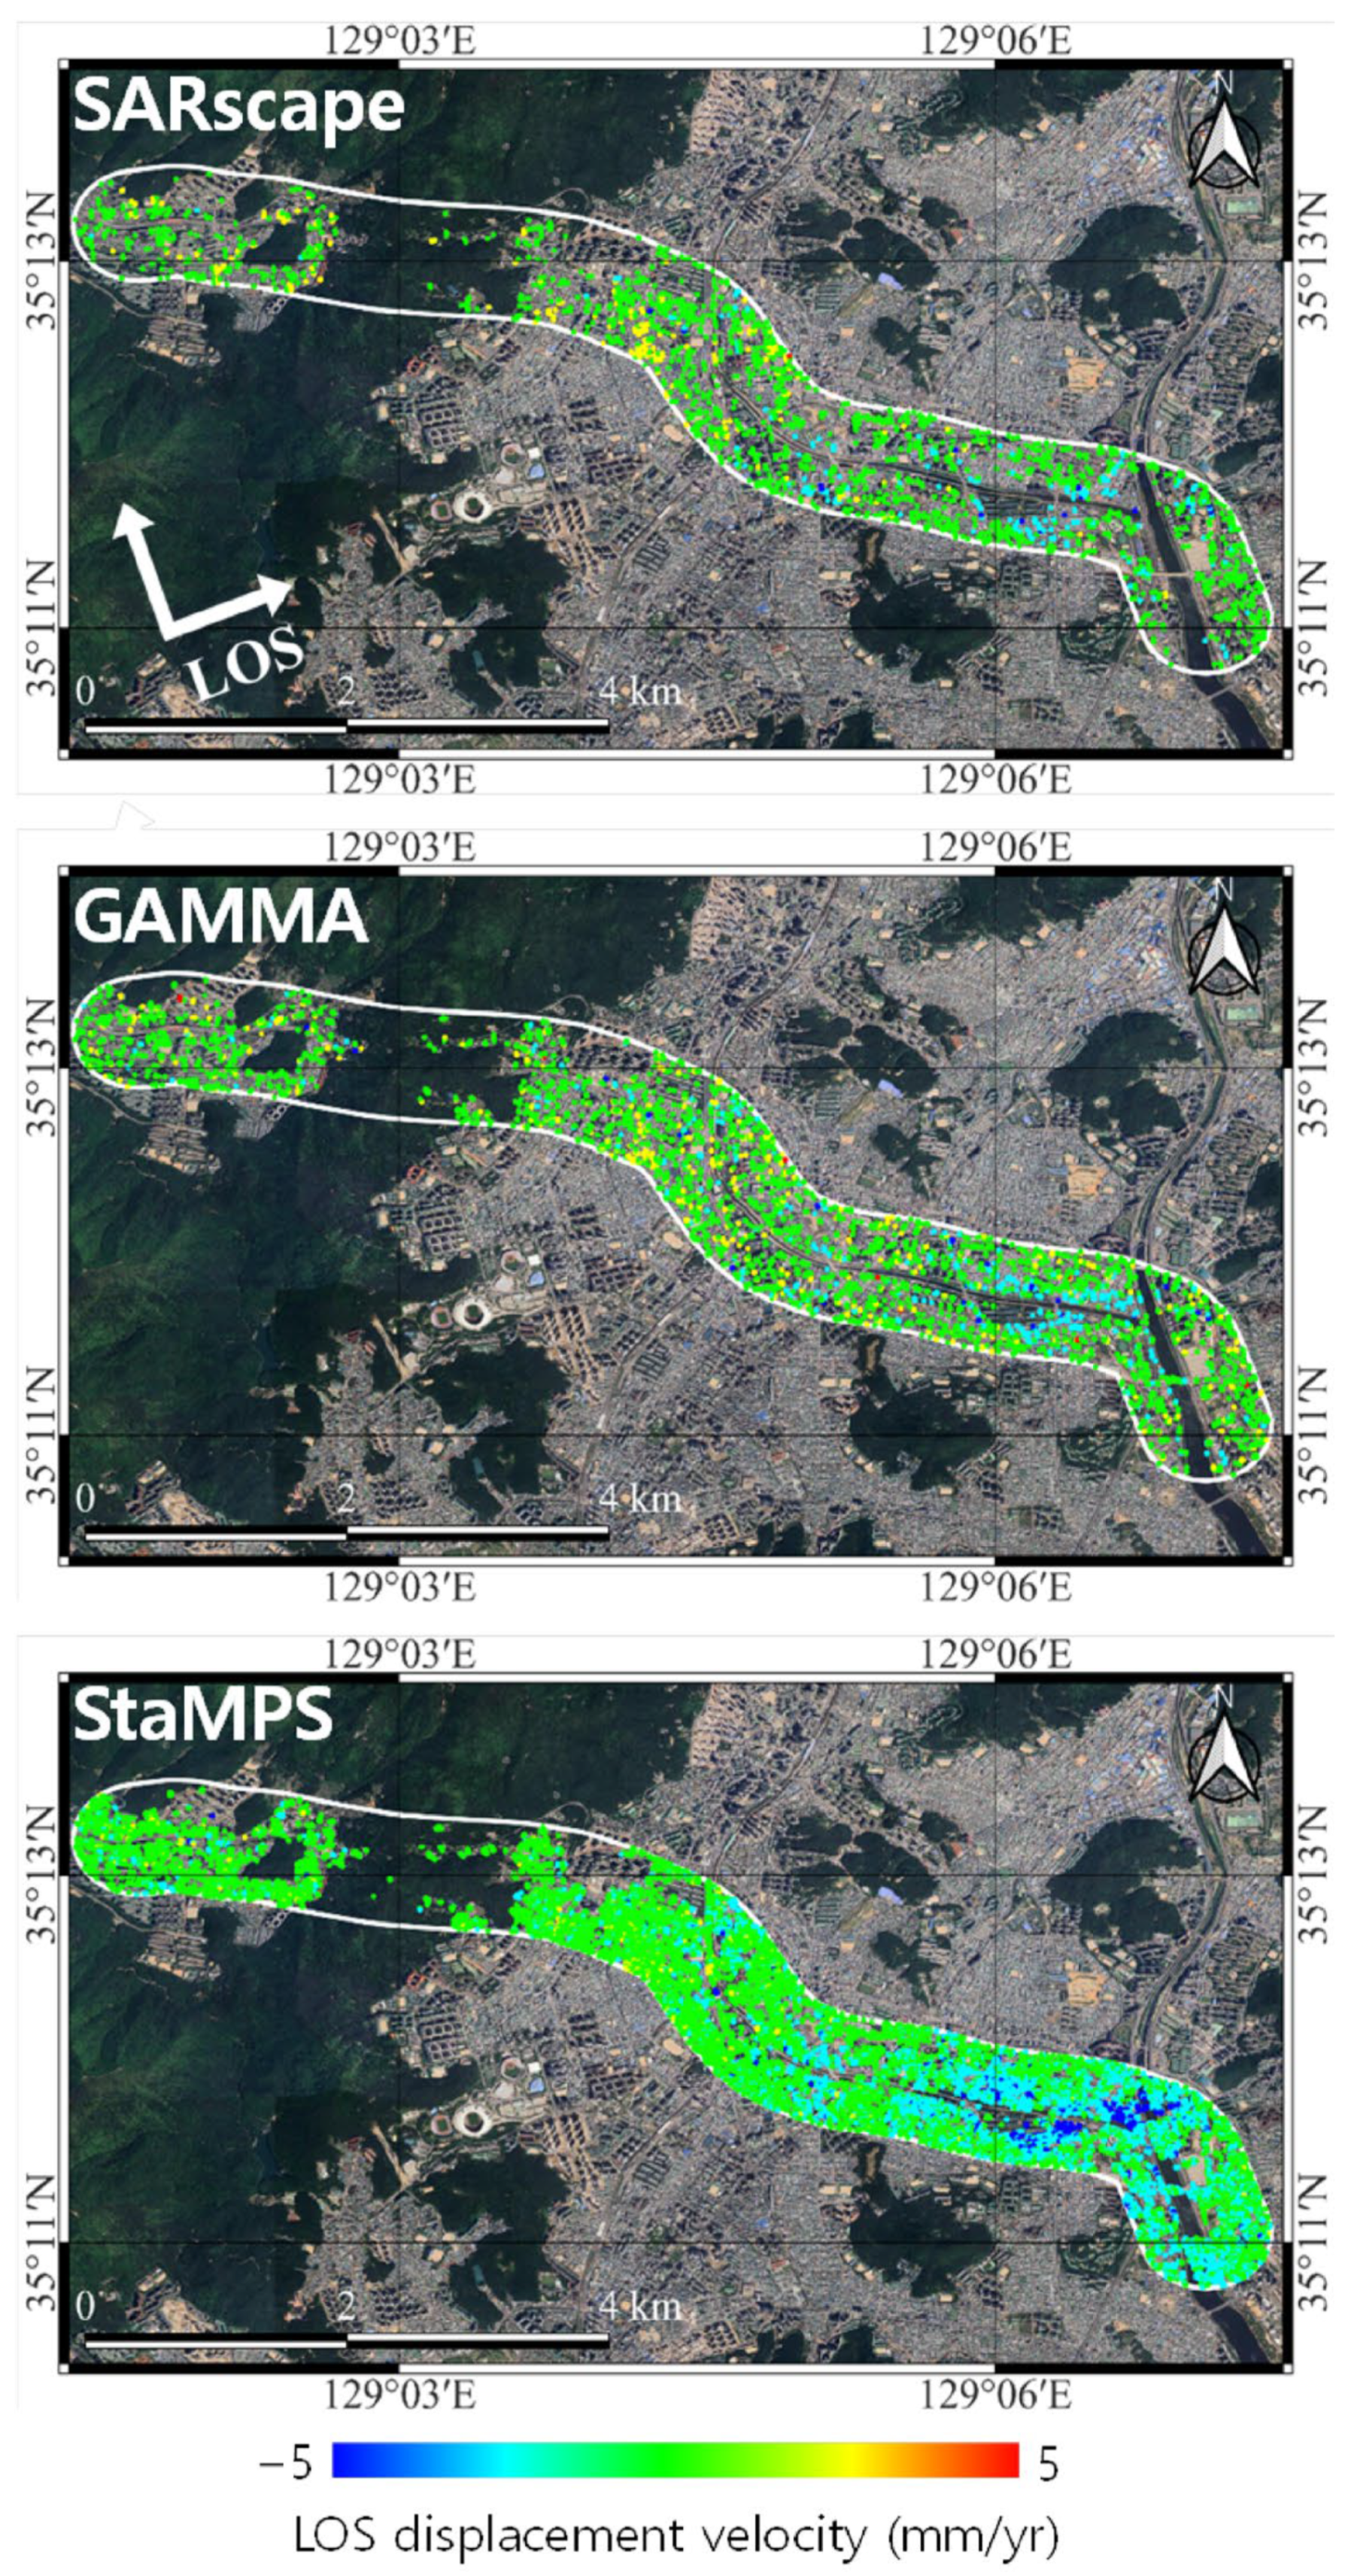
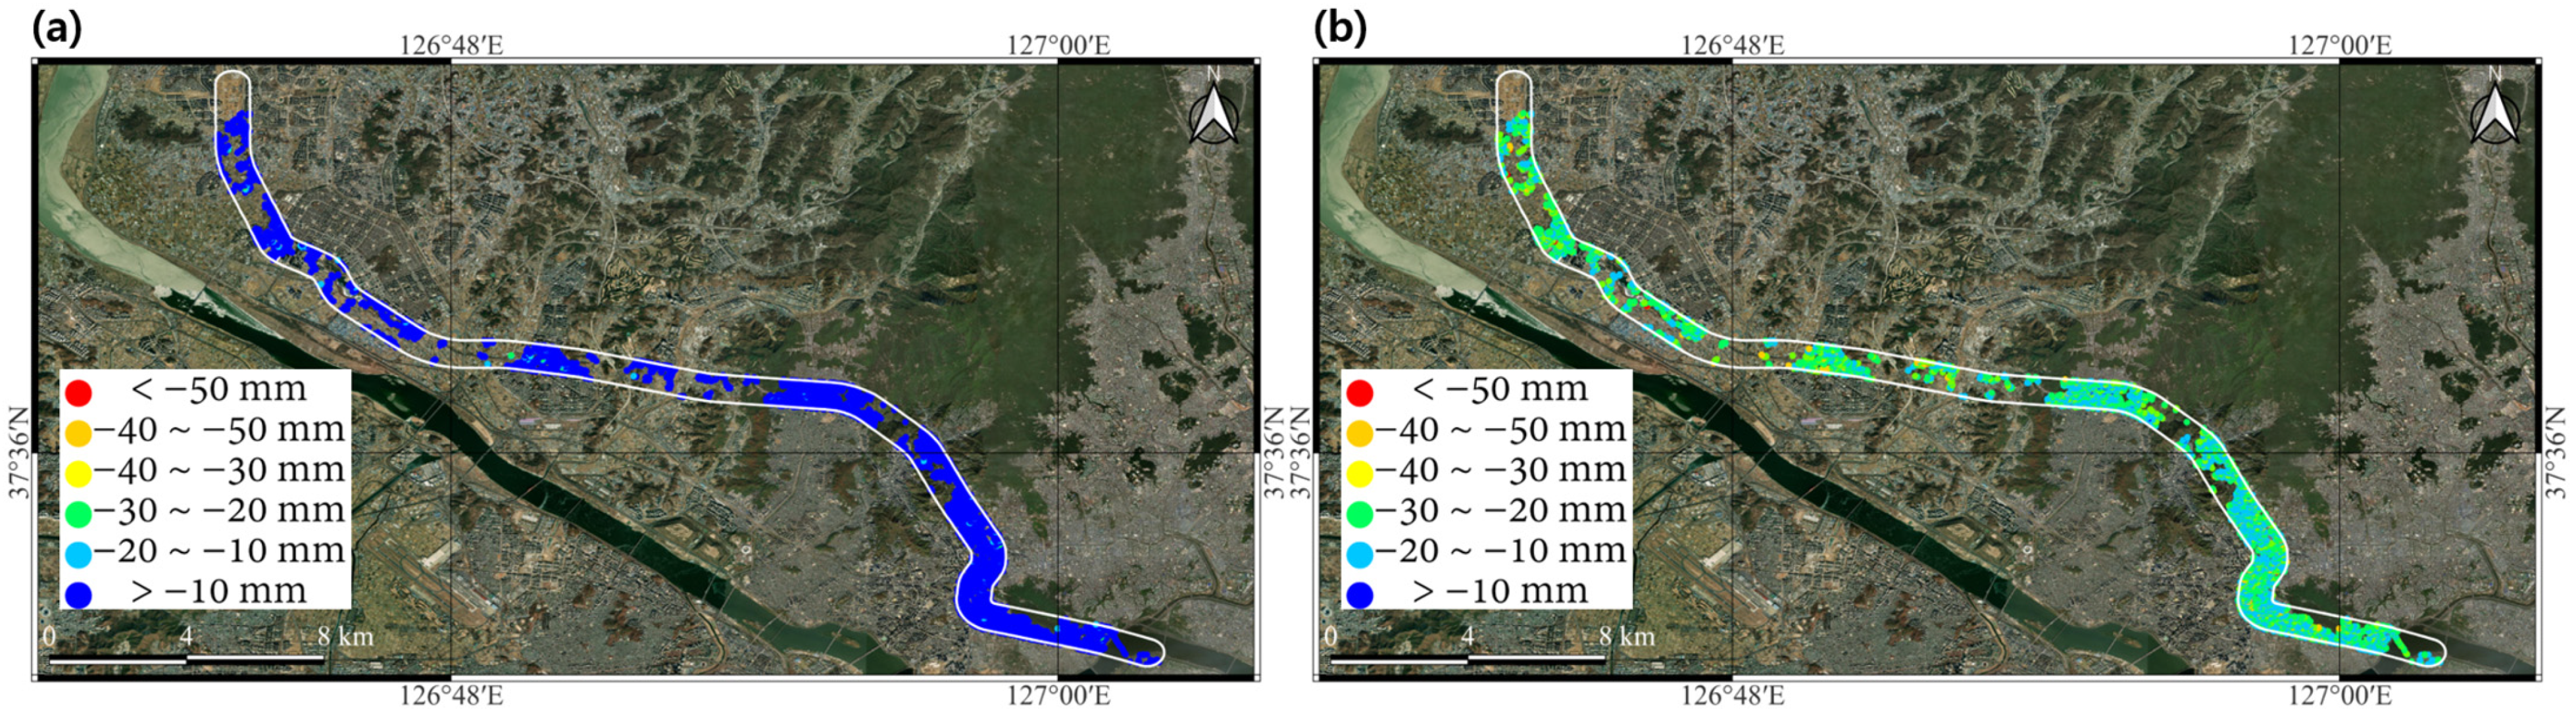
The LOS displacement velocities for Study Area A, within a 250 m radius of the Busan Mandeok–Centum underground road route, were calculated using ENVI SARscape, GAMMA software, and StaMPS (
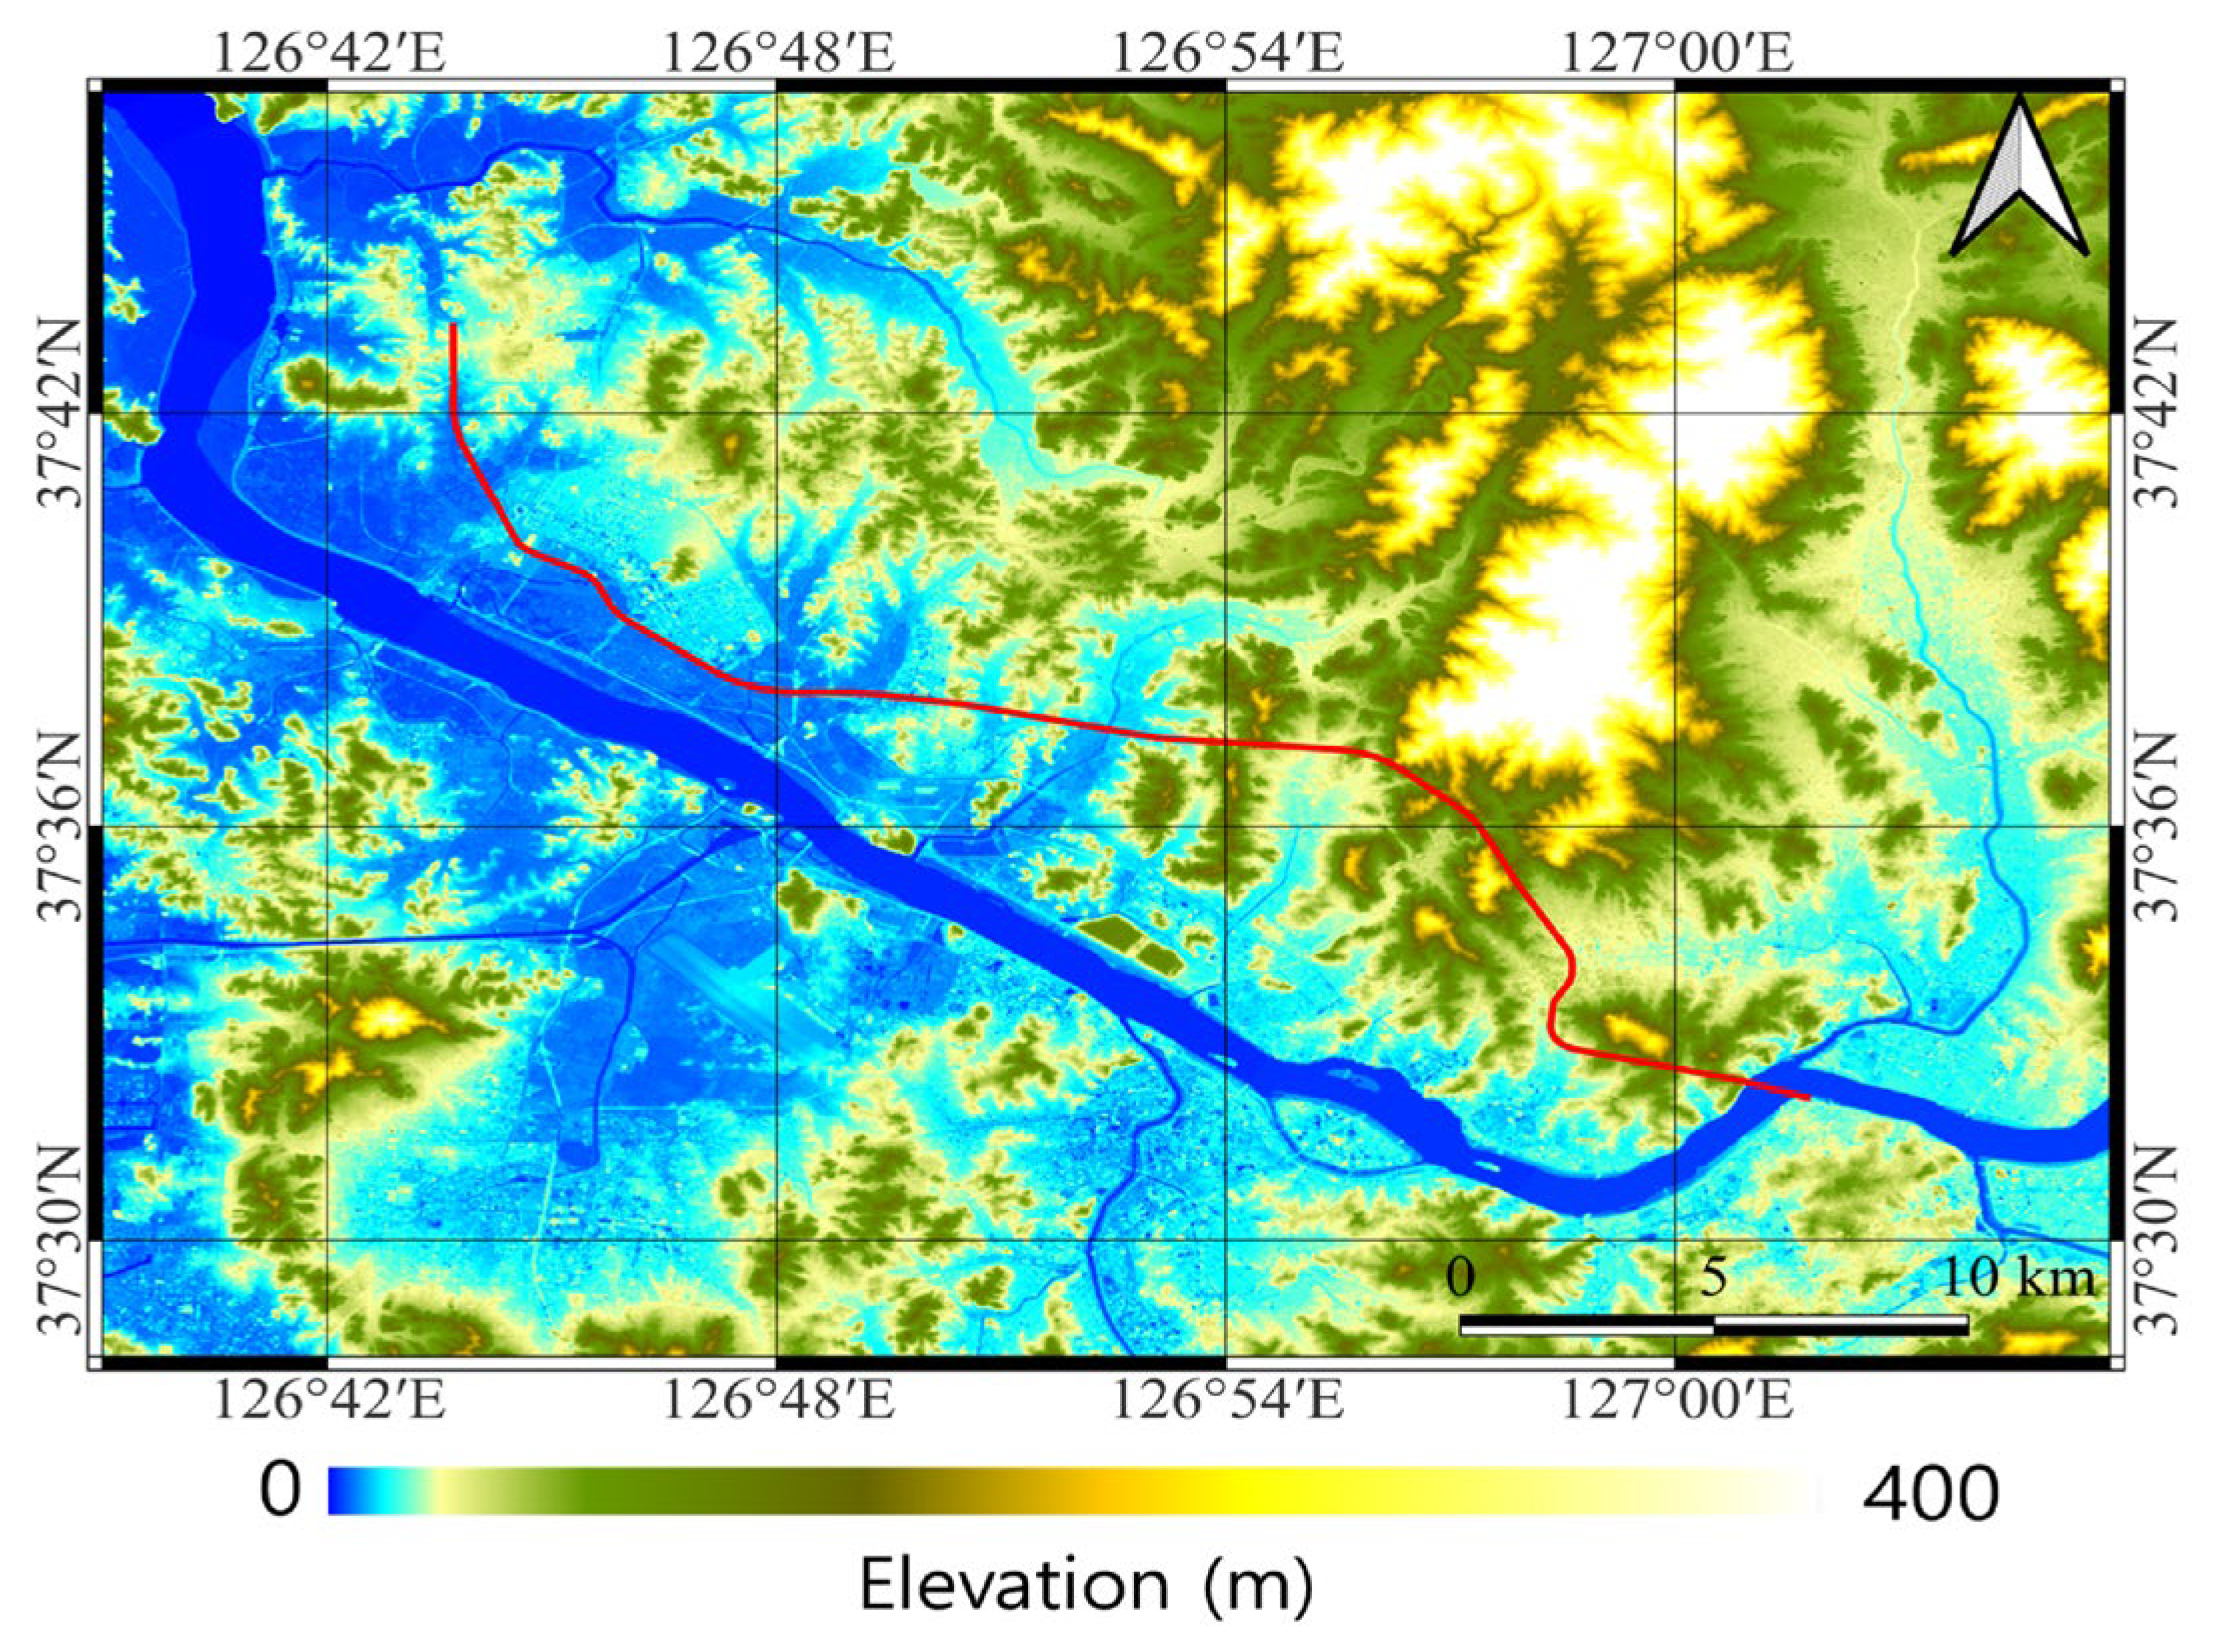
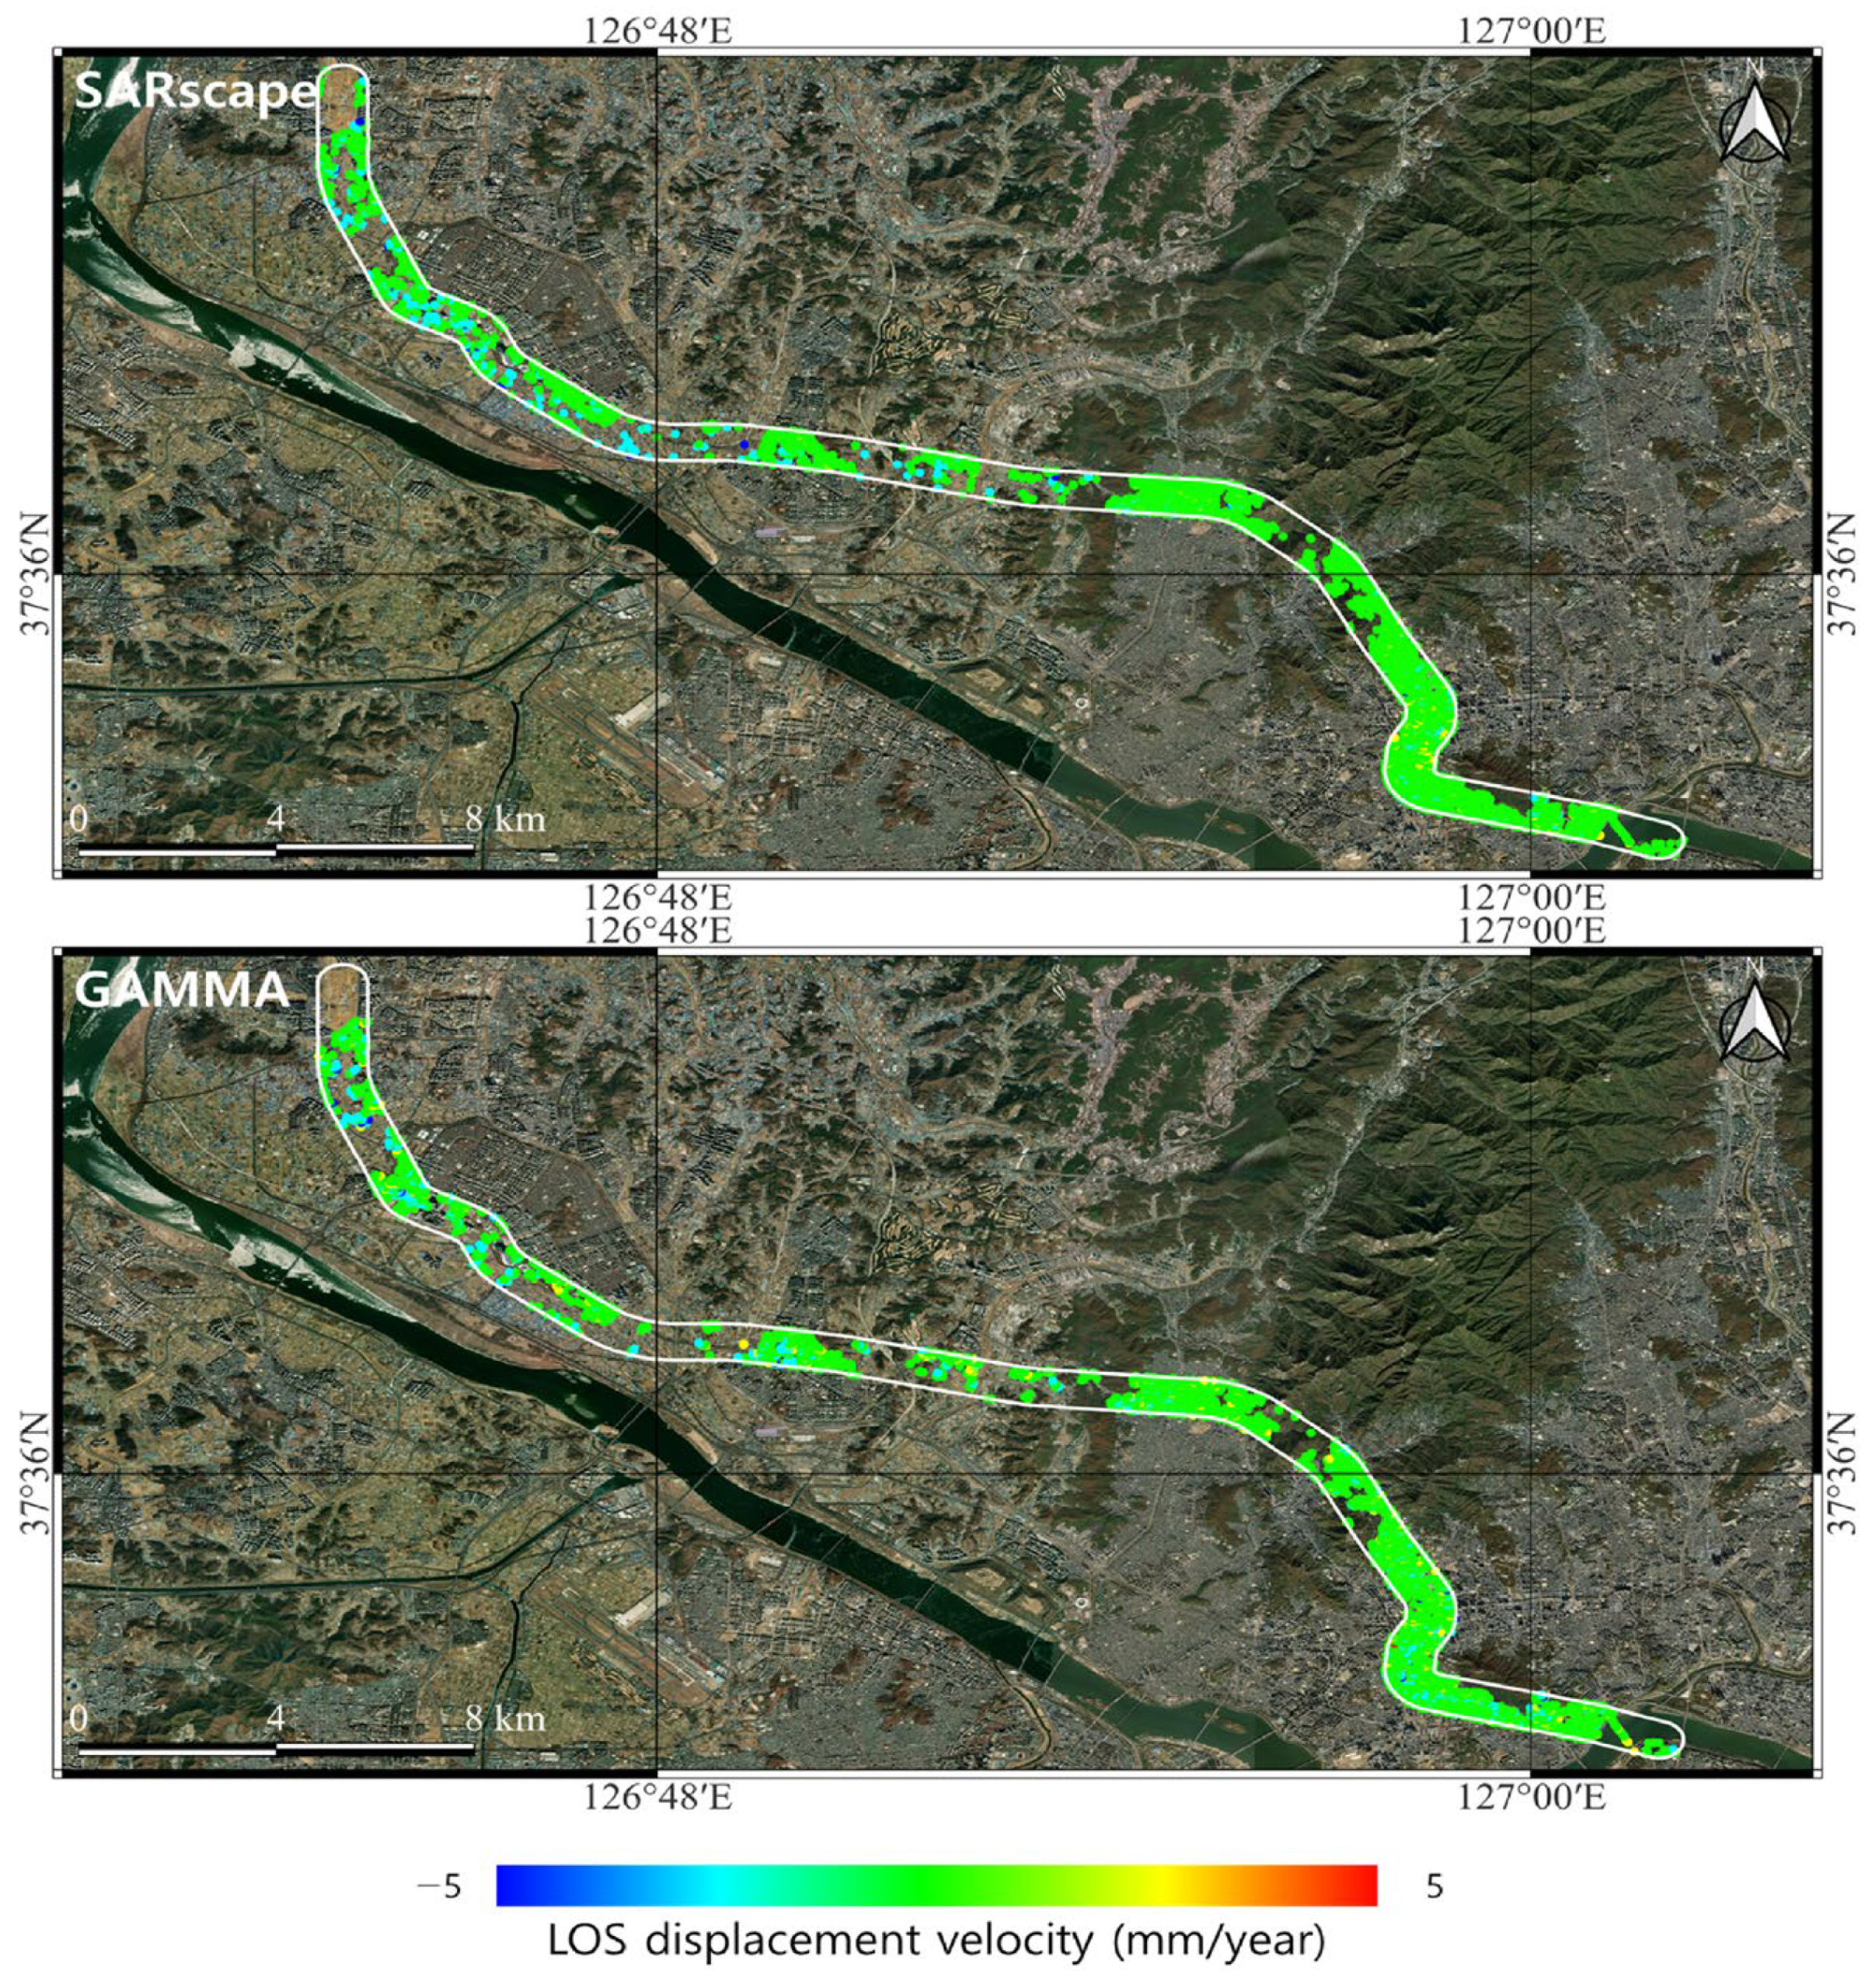
Figure 4). The numbers of persistent scatterers identified within the buffer zone were 1869, 4519, and 19,832, obtained using ENVI SARscape, GAMMA software, and StaMPS, respectively. The LOS displacement velocities for Study Area B, within a 250-m radius of the GTX-A metropolitan express railway route, were calculated using ENVI SARscape and GAMMA software (Figure 5). The numbers of persistent scatterers identified within the buffer zone were 5493 and 9023, obtained using ENVI SARscape and GAMMA software, respectively. The difference in the numbers of persistent scatterers identified by each software application can be attributed to differences in the criteria and thresholds for selecting persistent scatterers, as well as the filtering techniques used for the time-series interferometric phases.

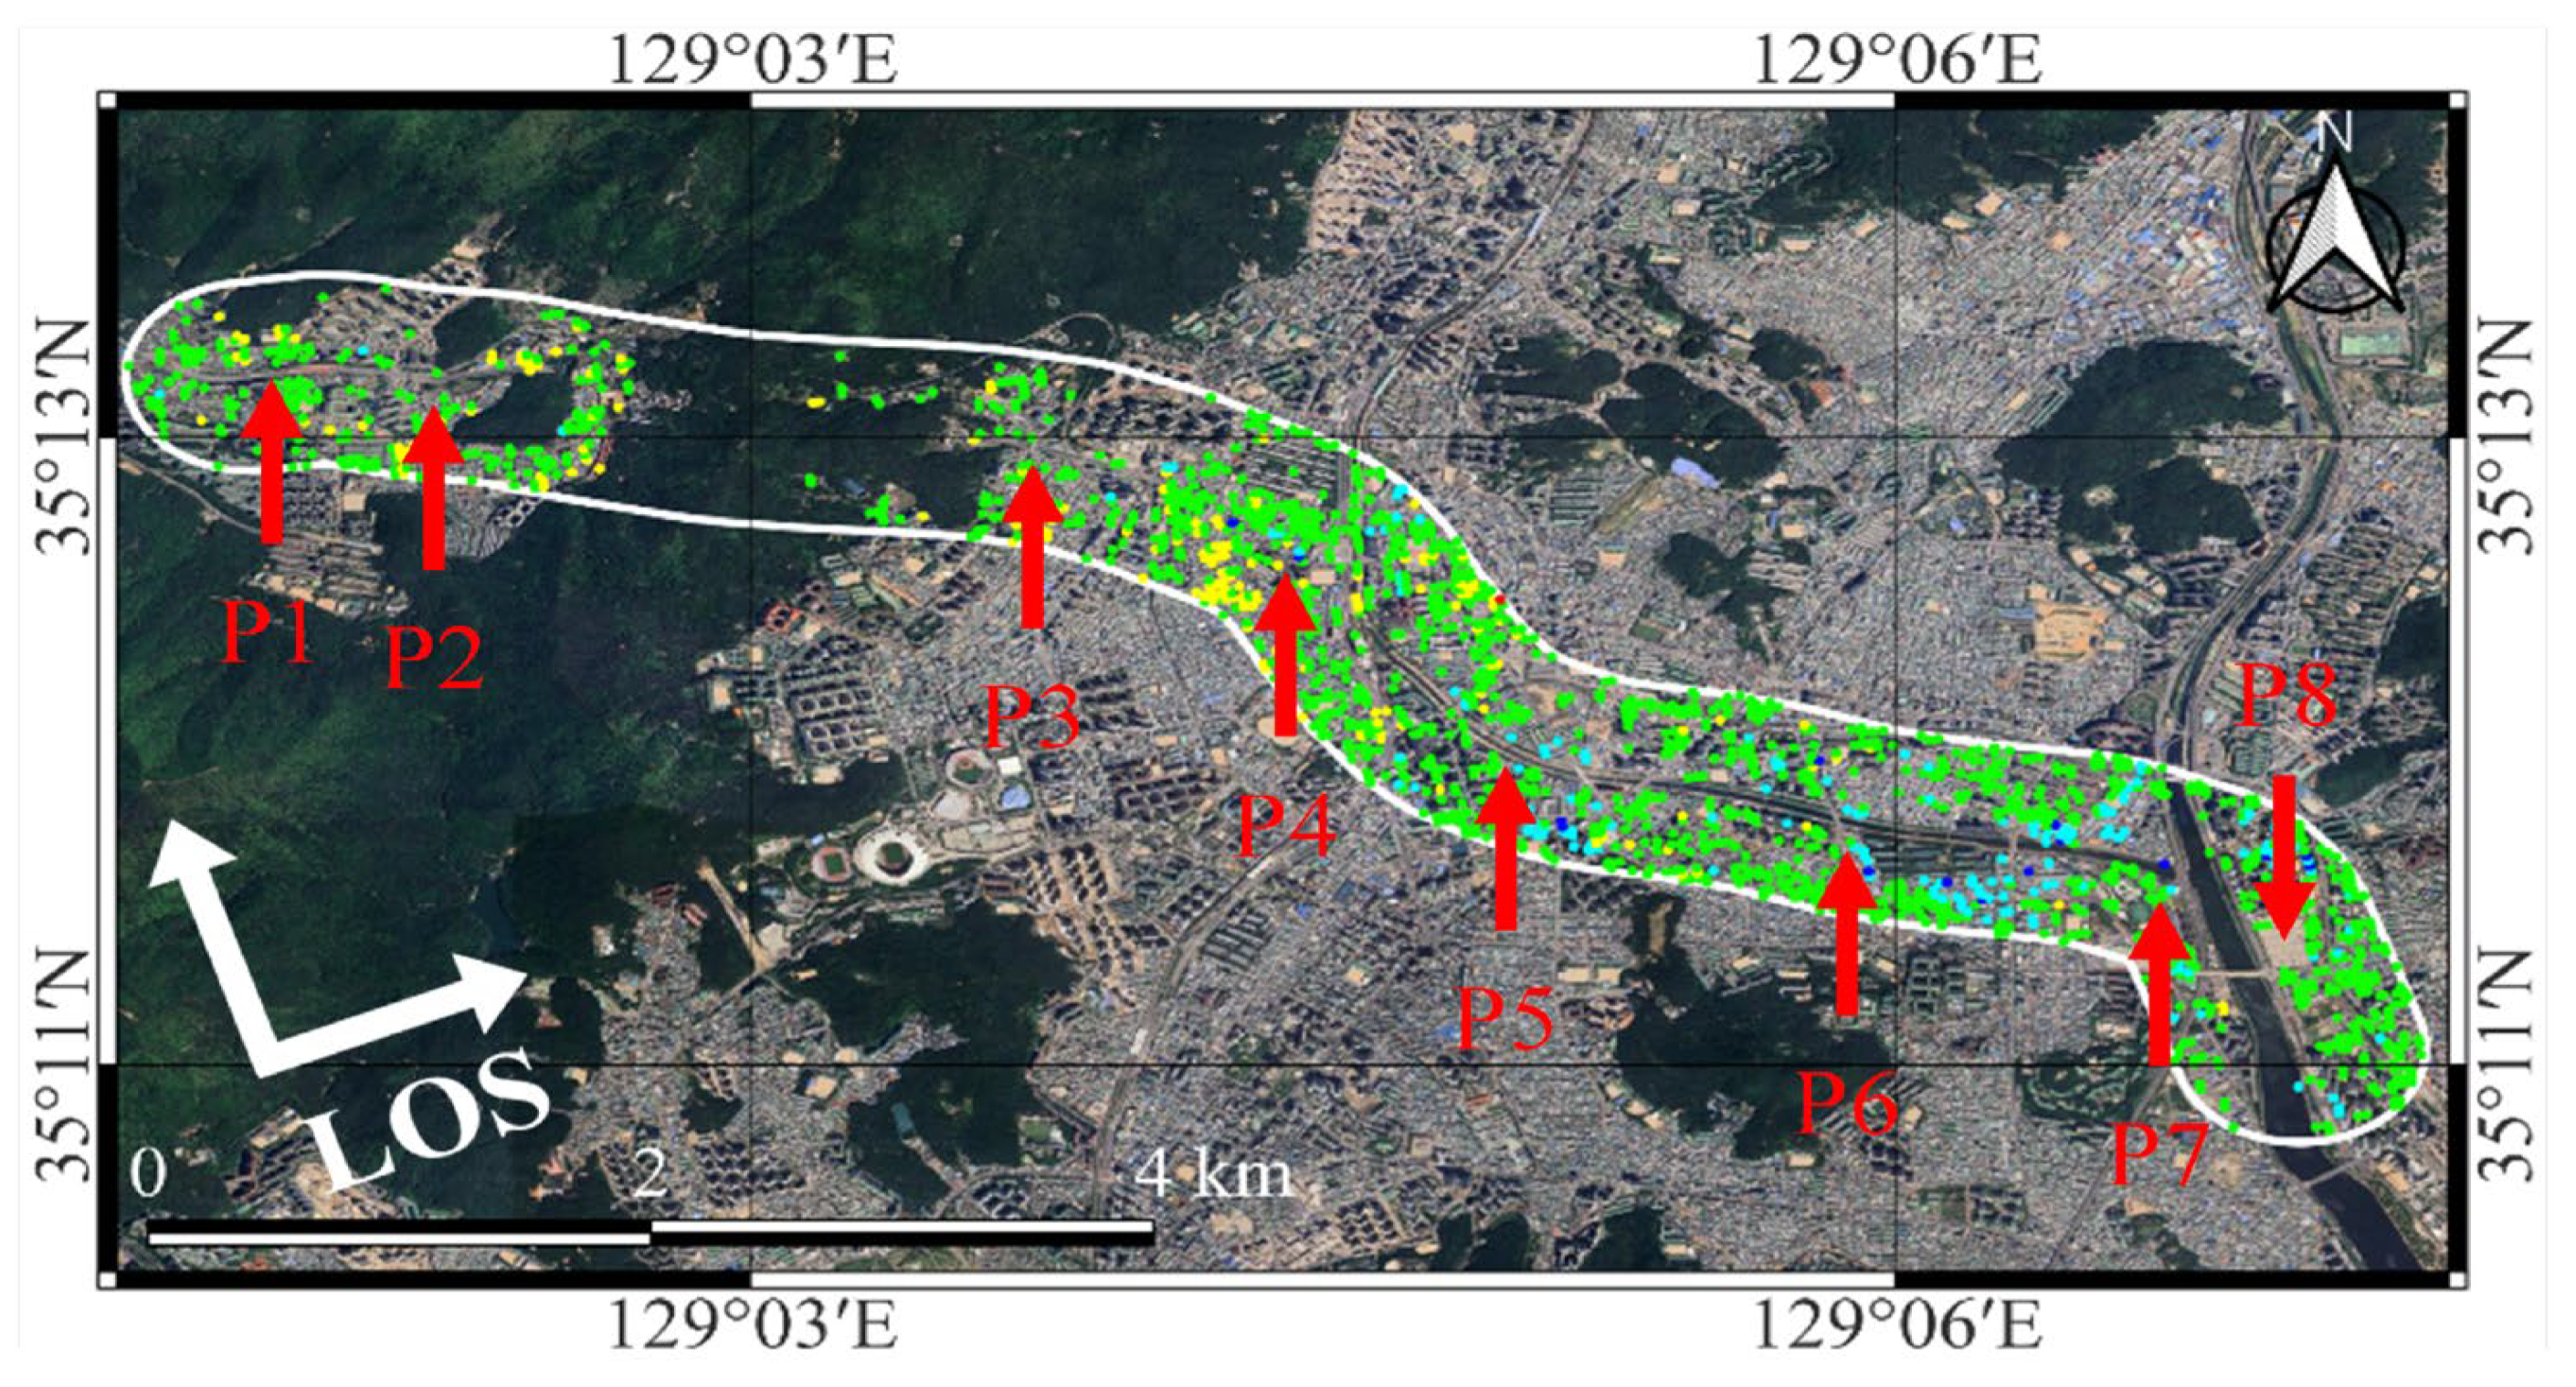
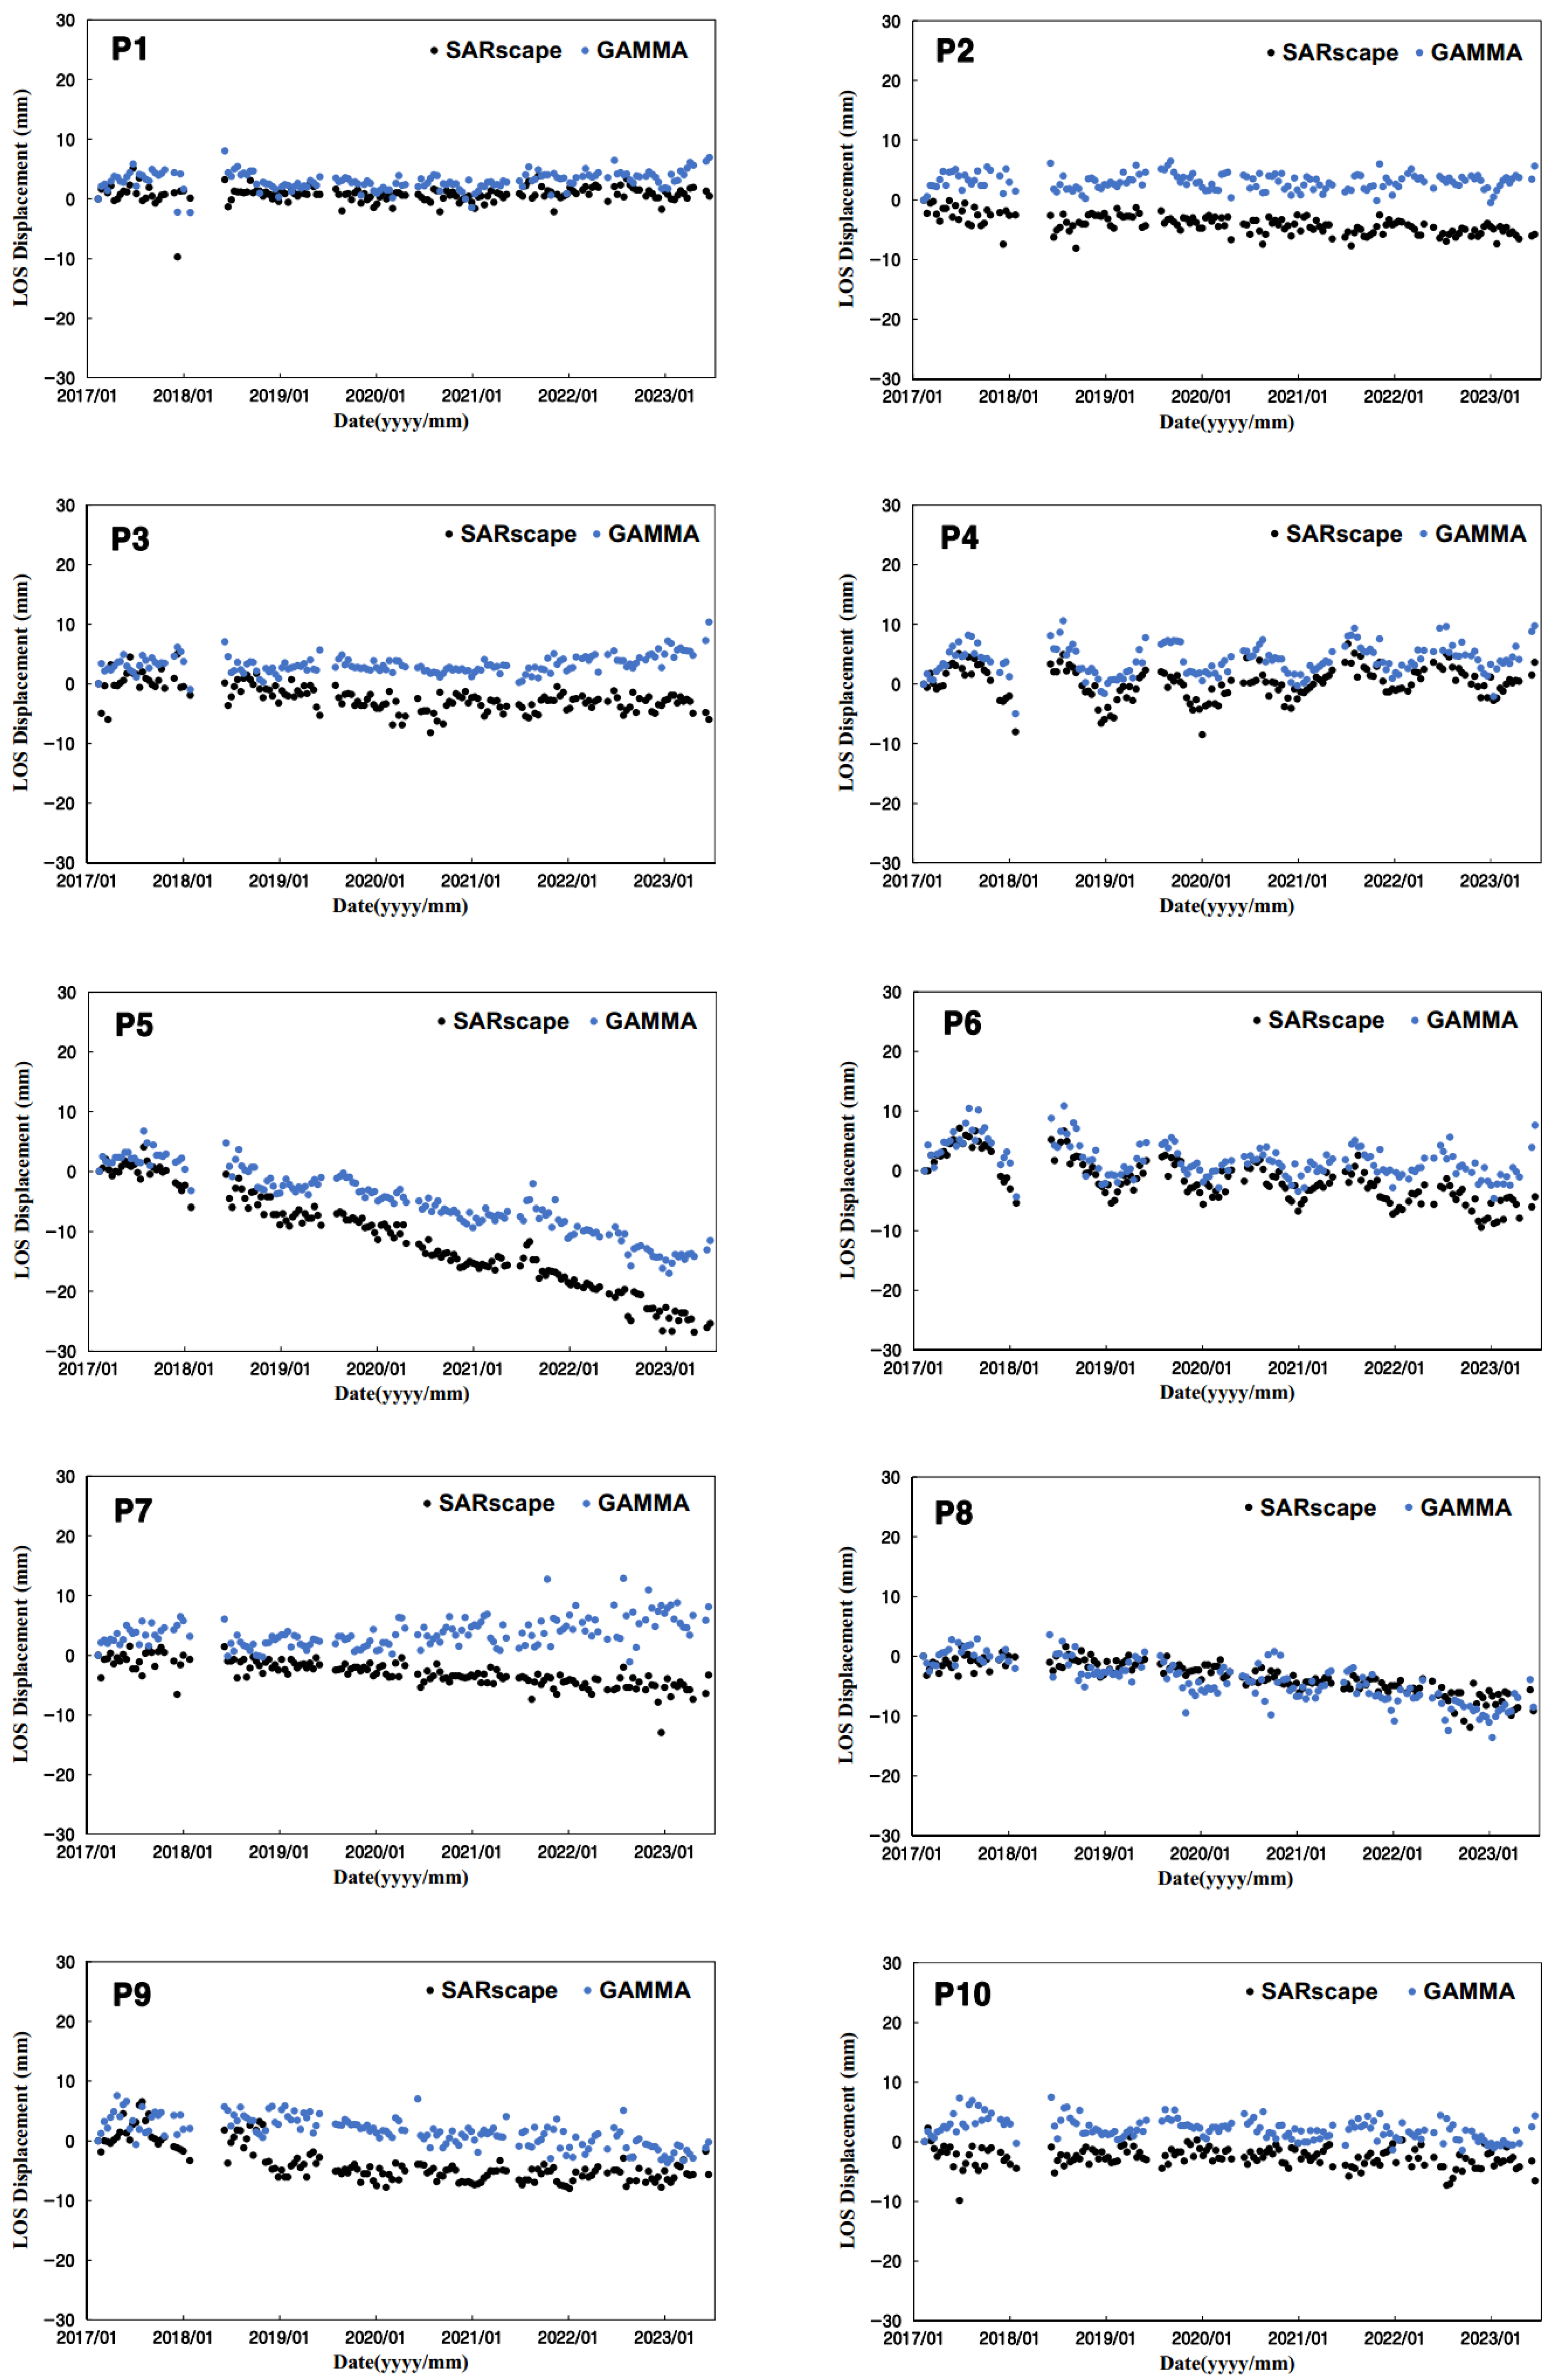
3.2. Ground Displacement Analysis Results for Study Area A

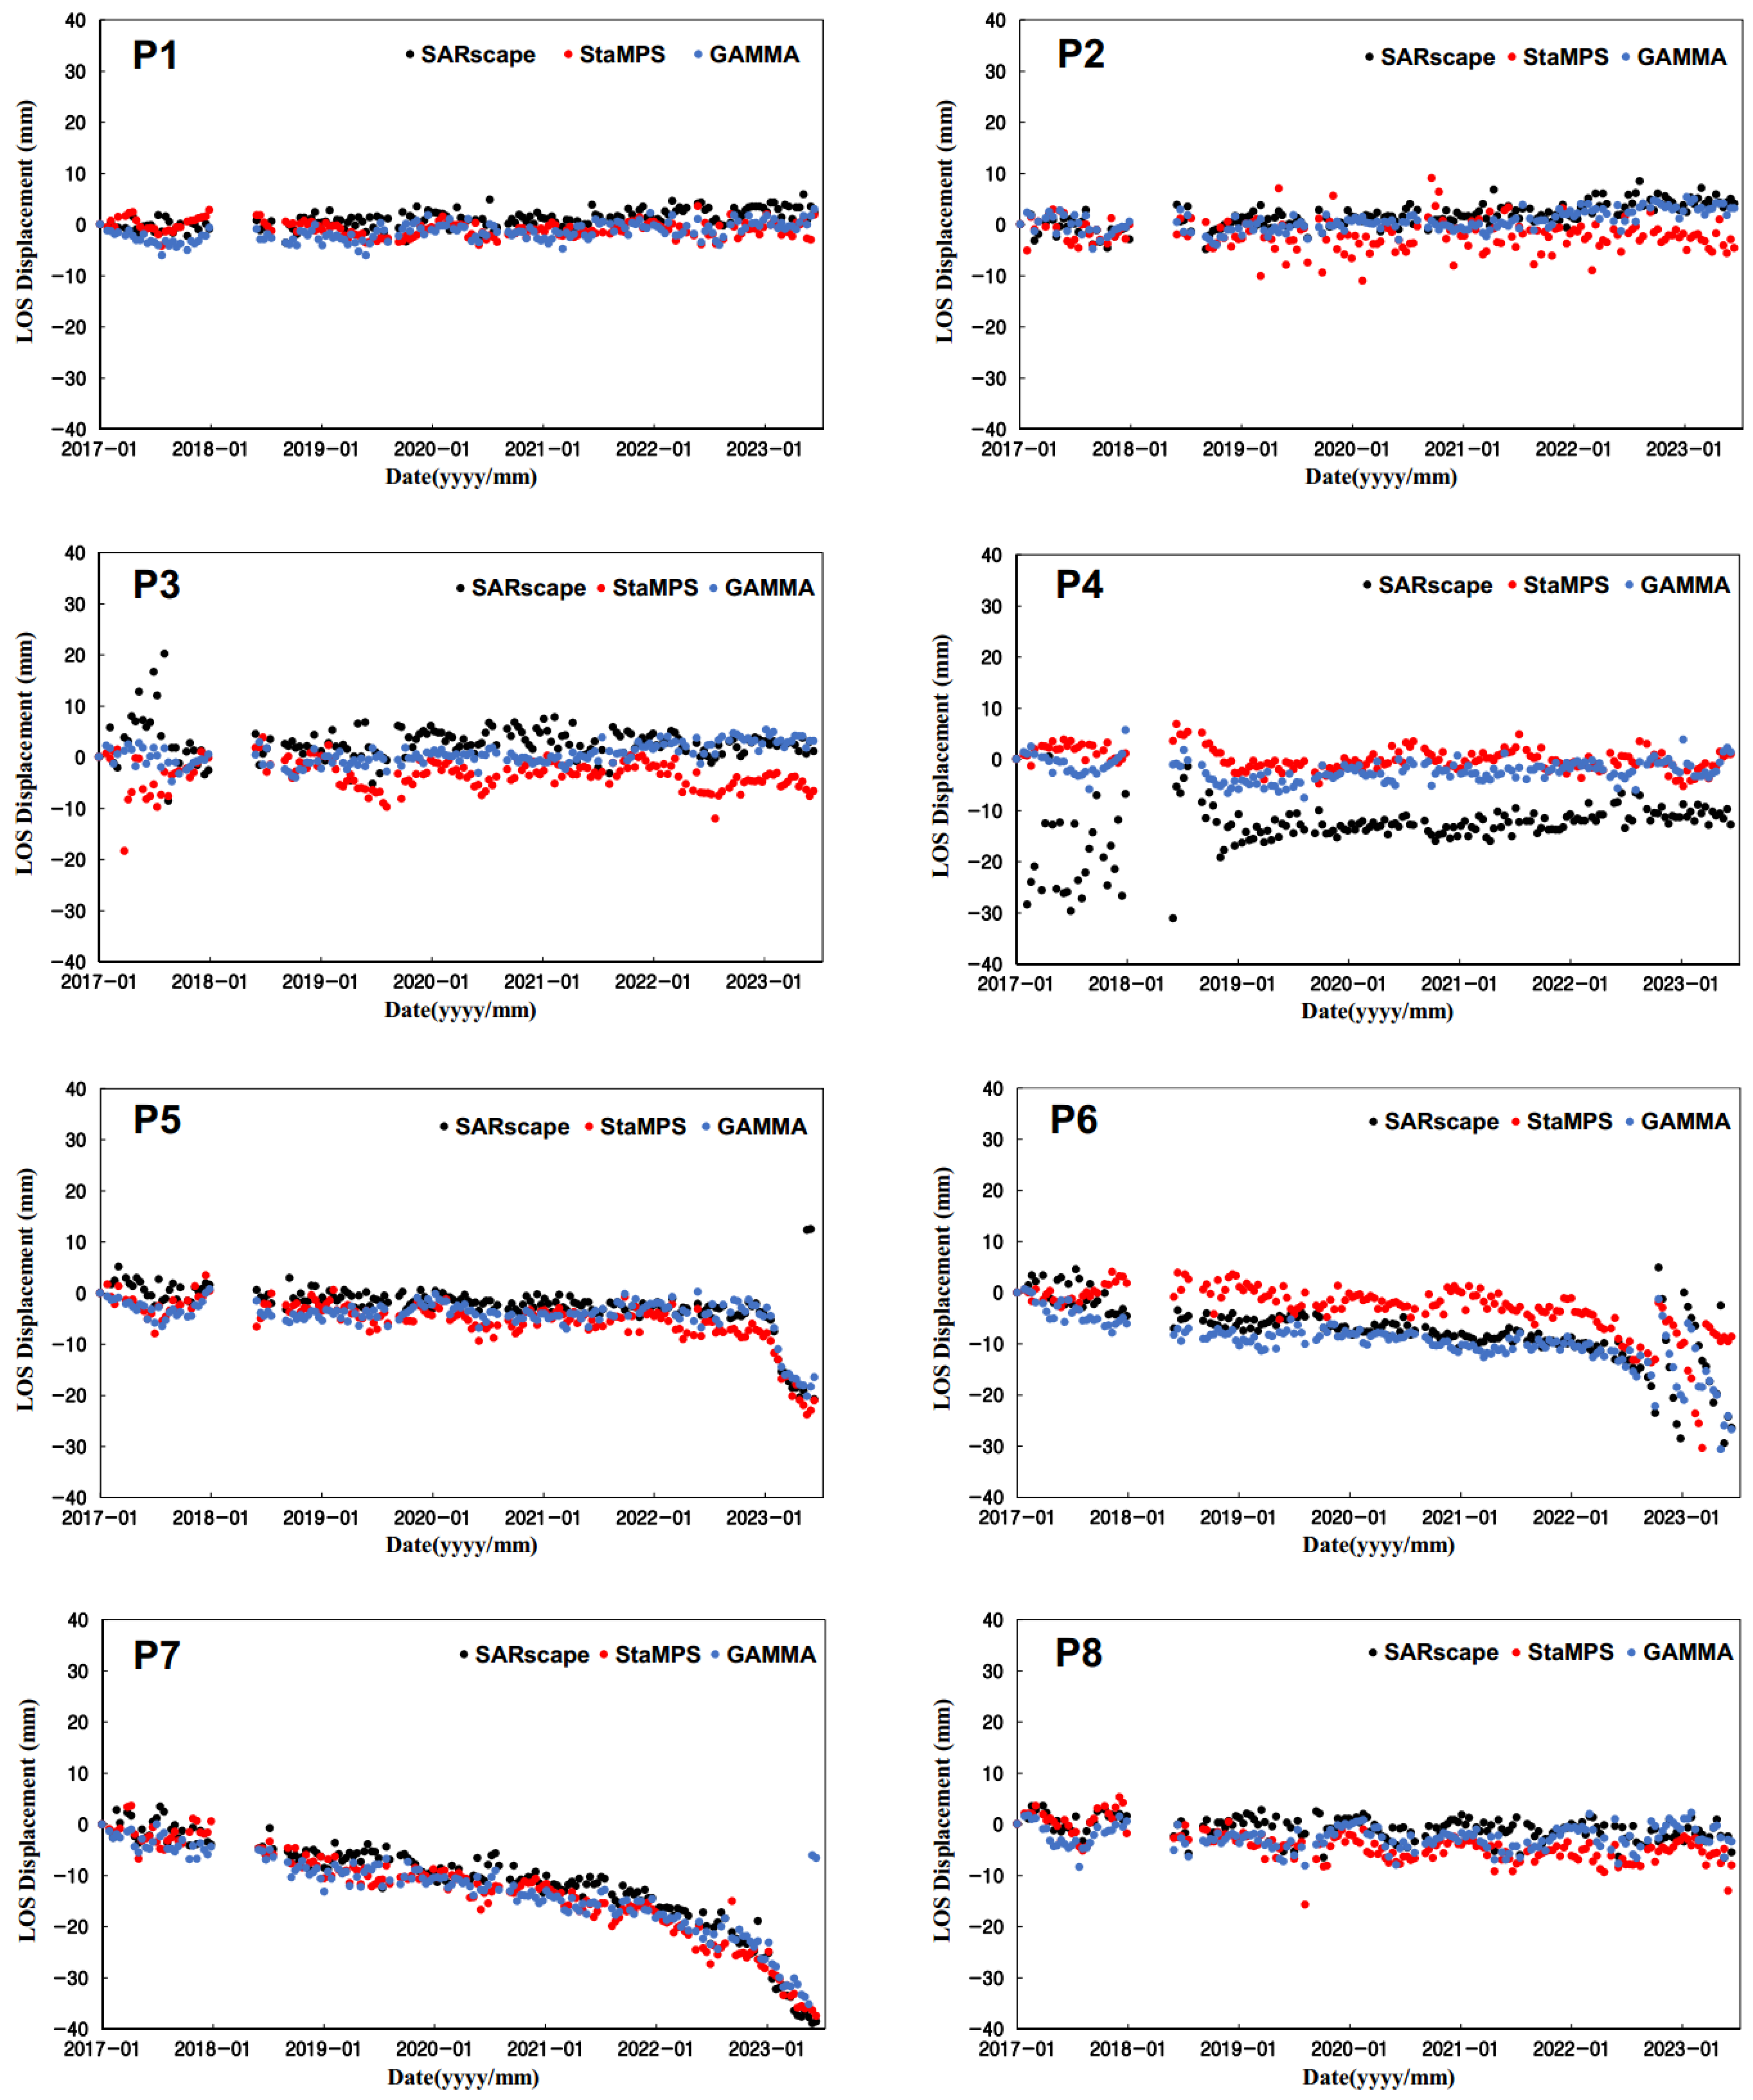
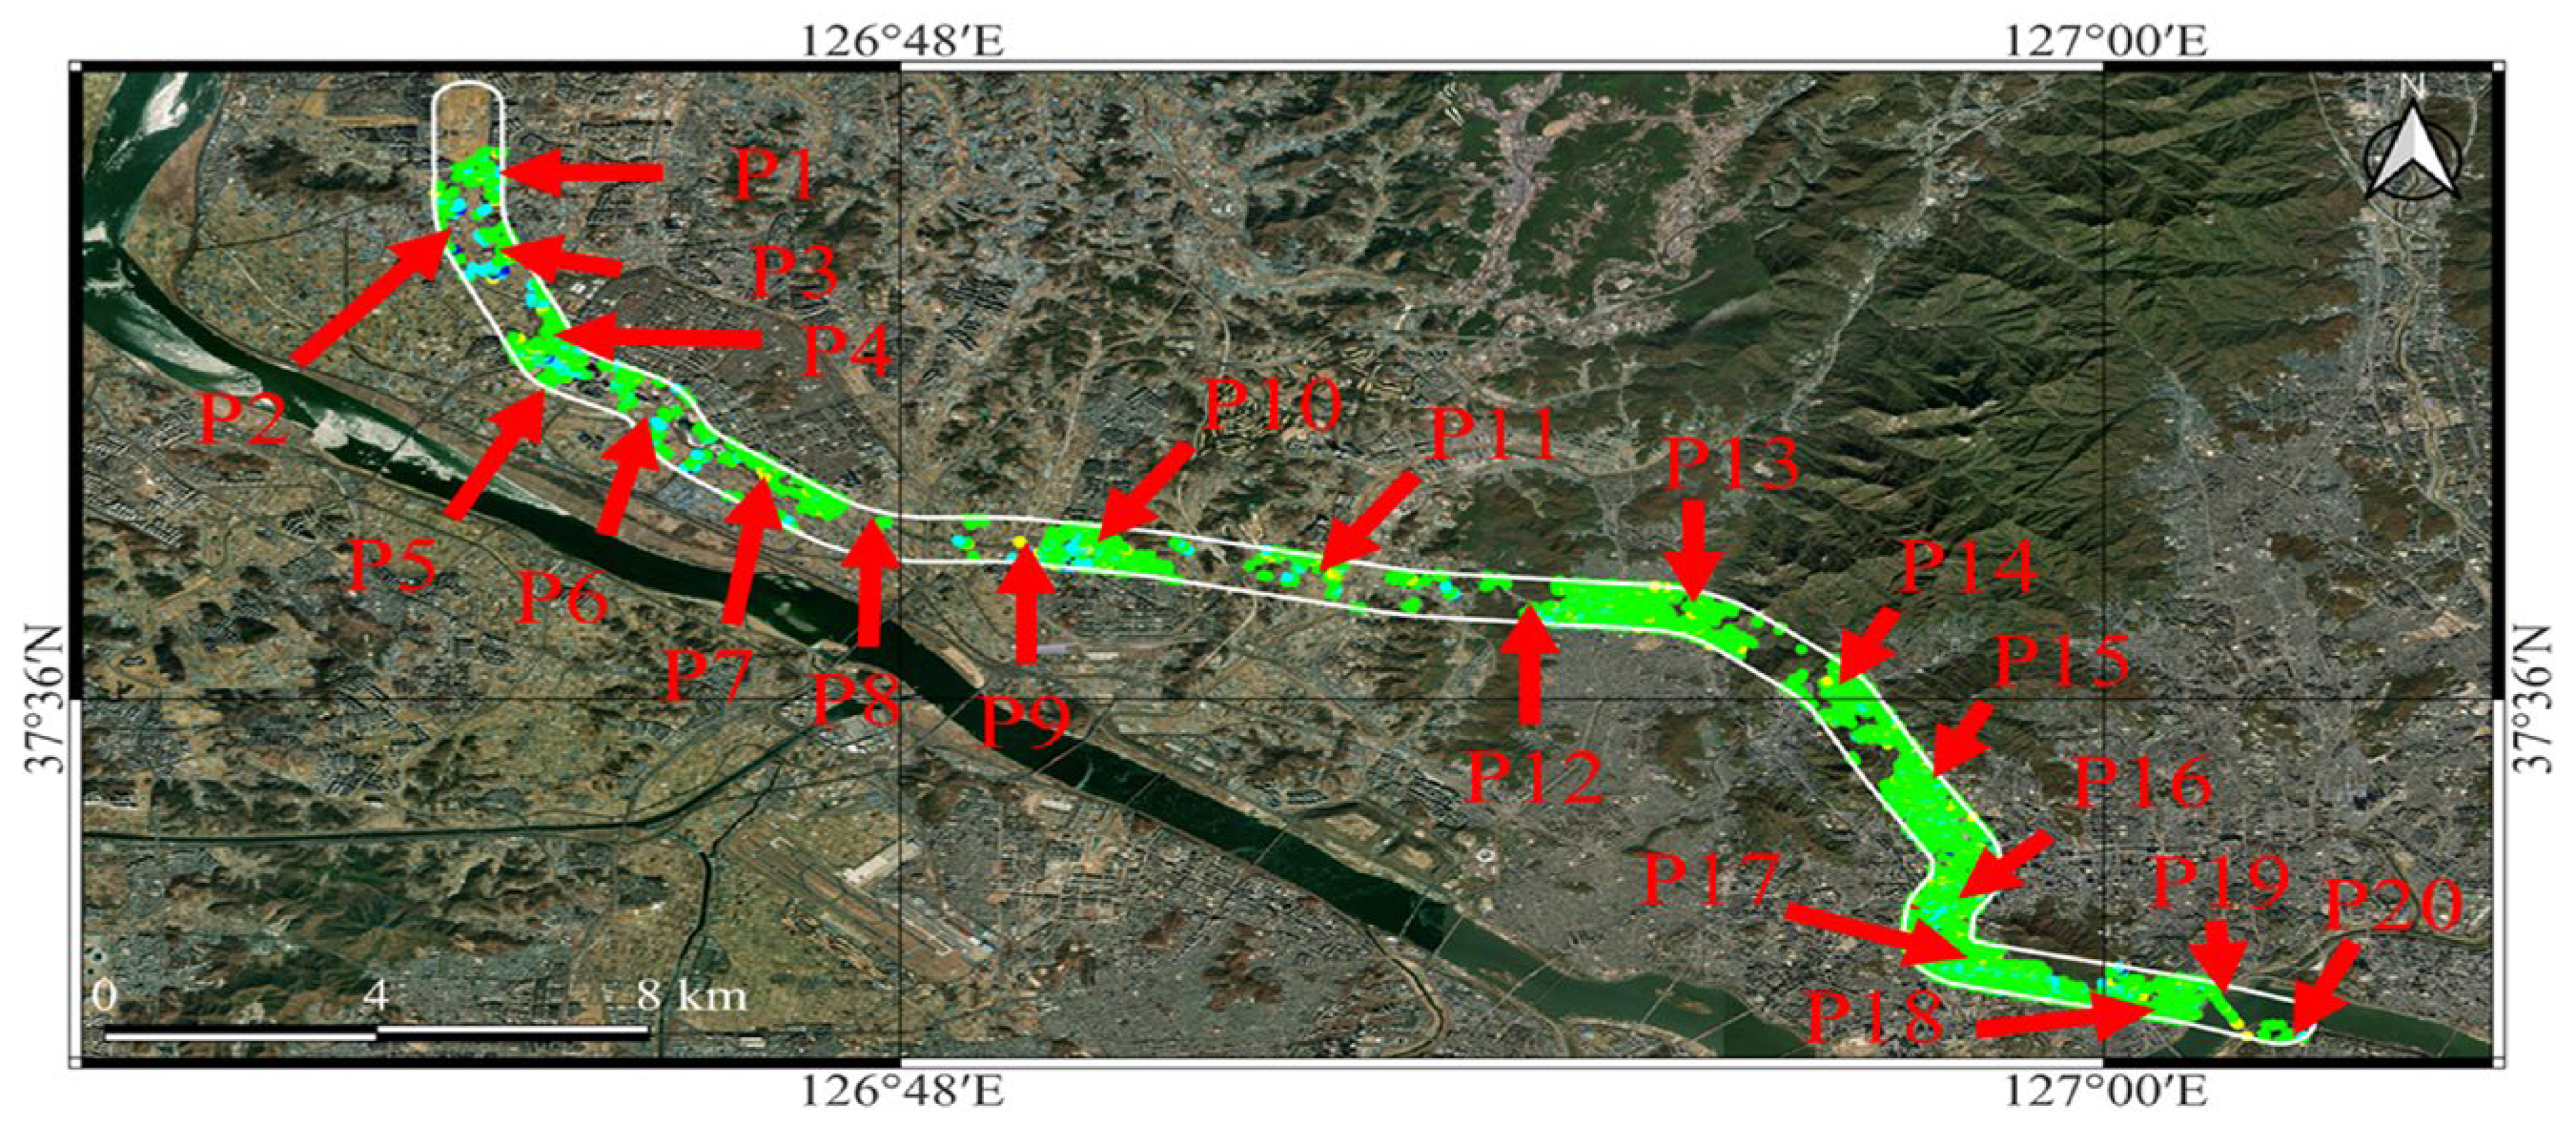
To compare the time-series ground displacement results along the Busan Mandeok–Centum underground road, the route was divided into eight sections, and one representative persistent scatterer was selected for each section close to the route, as shown in Figure 6. The time-series ground displacements for each representative persistent scatterer in each section are shown in Figure 7, where ENVI SARscape is represented in black, StaMPS in red, and GAMMA software in blue.
Figure 6. Representative persistent scatterers in Study Area A (modified from [11]).
Sustainability 16 10627 g006
Except for P4, the ENVI SARscape and GAMMA software applications produced very similar ground displacement results. The temporal variation in displacement calculated by StaMPS was similar to that of the other two software programs, but the displacement variability was greater.
The persistent scatterers P1 and P2, located in Mandeok-dong, Buk-gu, and Busan, had near-zero vertical displacement velocities, indicating that ground movement in this area was minimal and stable. The persistent scatterers P3 and P4 in Oncheon-dong, Dongnae-gu, and Busan also showed near-zero vertical displacement velocities during the observation period. Seasonal variations were observed for P3, with subsidence in summer and uplift in winter; however, the magnitudes of subsidence and uplift were approximately 1 cm, which is relatively small.
P5 is in Suan-dong, Dongnae-gu, Busan, near the Oncheon Stream and the underground road route. P5 showed rapid subsidence starting in December 2022, with an estimated subsidence of 2.5 cm over 6 months. P6 showed 1.5 cm of subsidence from 2017 to June 2022, followed by rapid subsidence of 2 cm over the next year.
The time-series vertical displacement for P7, located near the confluence of the Oncheon Stream and Suyeong River, clearly indicated subsidence, and the rate accelerated after July 2022. Before July 2022, P7 had subsided by 3 cm over approximately 5 years, but the subsidence subsequently increased by 2 cm in just 1 year, indicating rapid ground subsidence. P8, located in Jaesong-dong, Haeundae-gu, showed subsidence of around 5 mm each summer, and the displacement velocity remained close to zero during the observation period, indicating that this area is relatively stable.

3.3. Ground Displacement Analysis Results for Study Area B

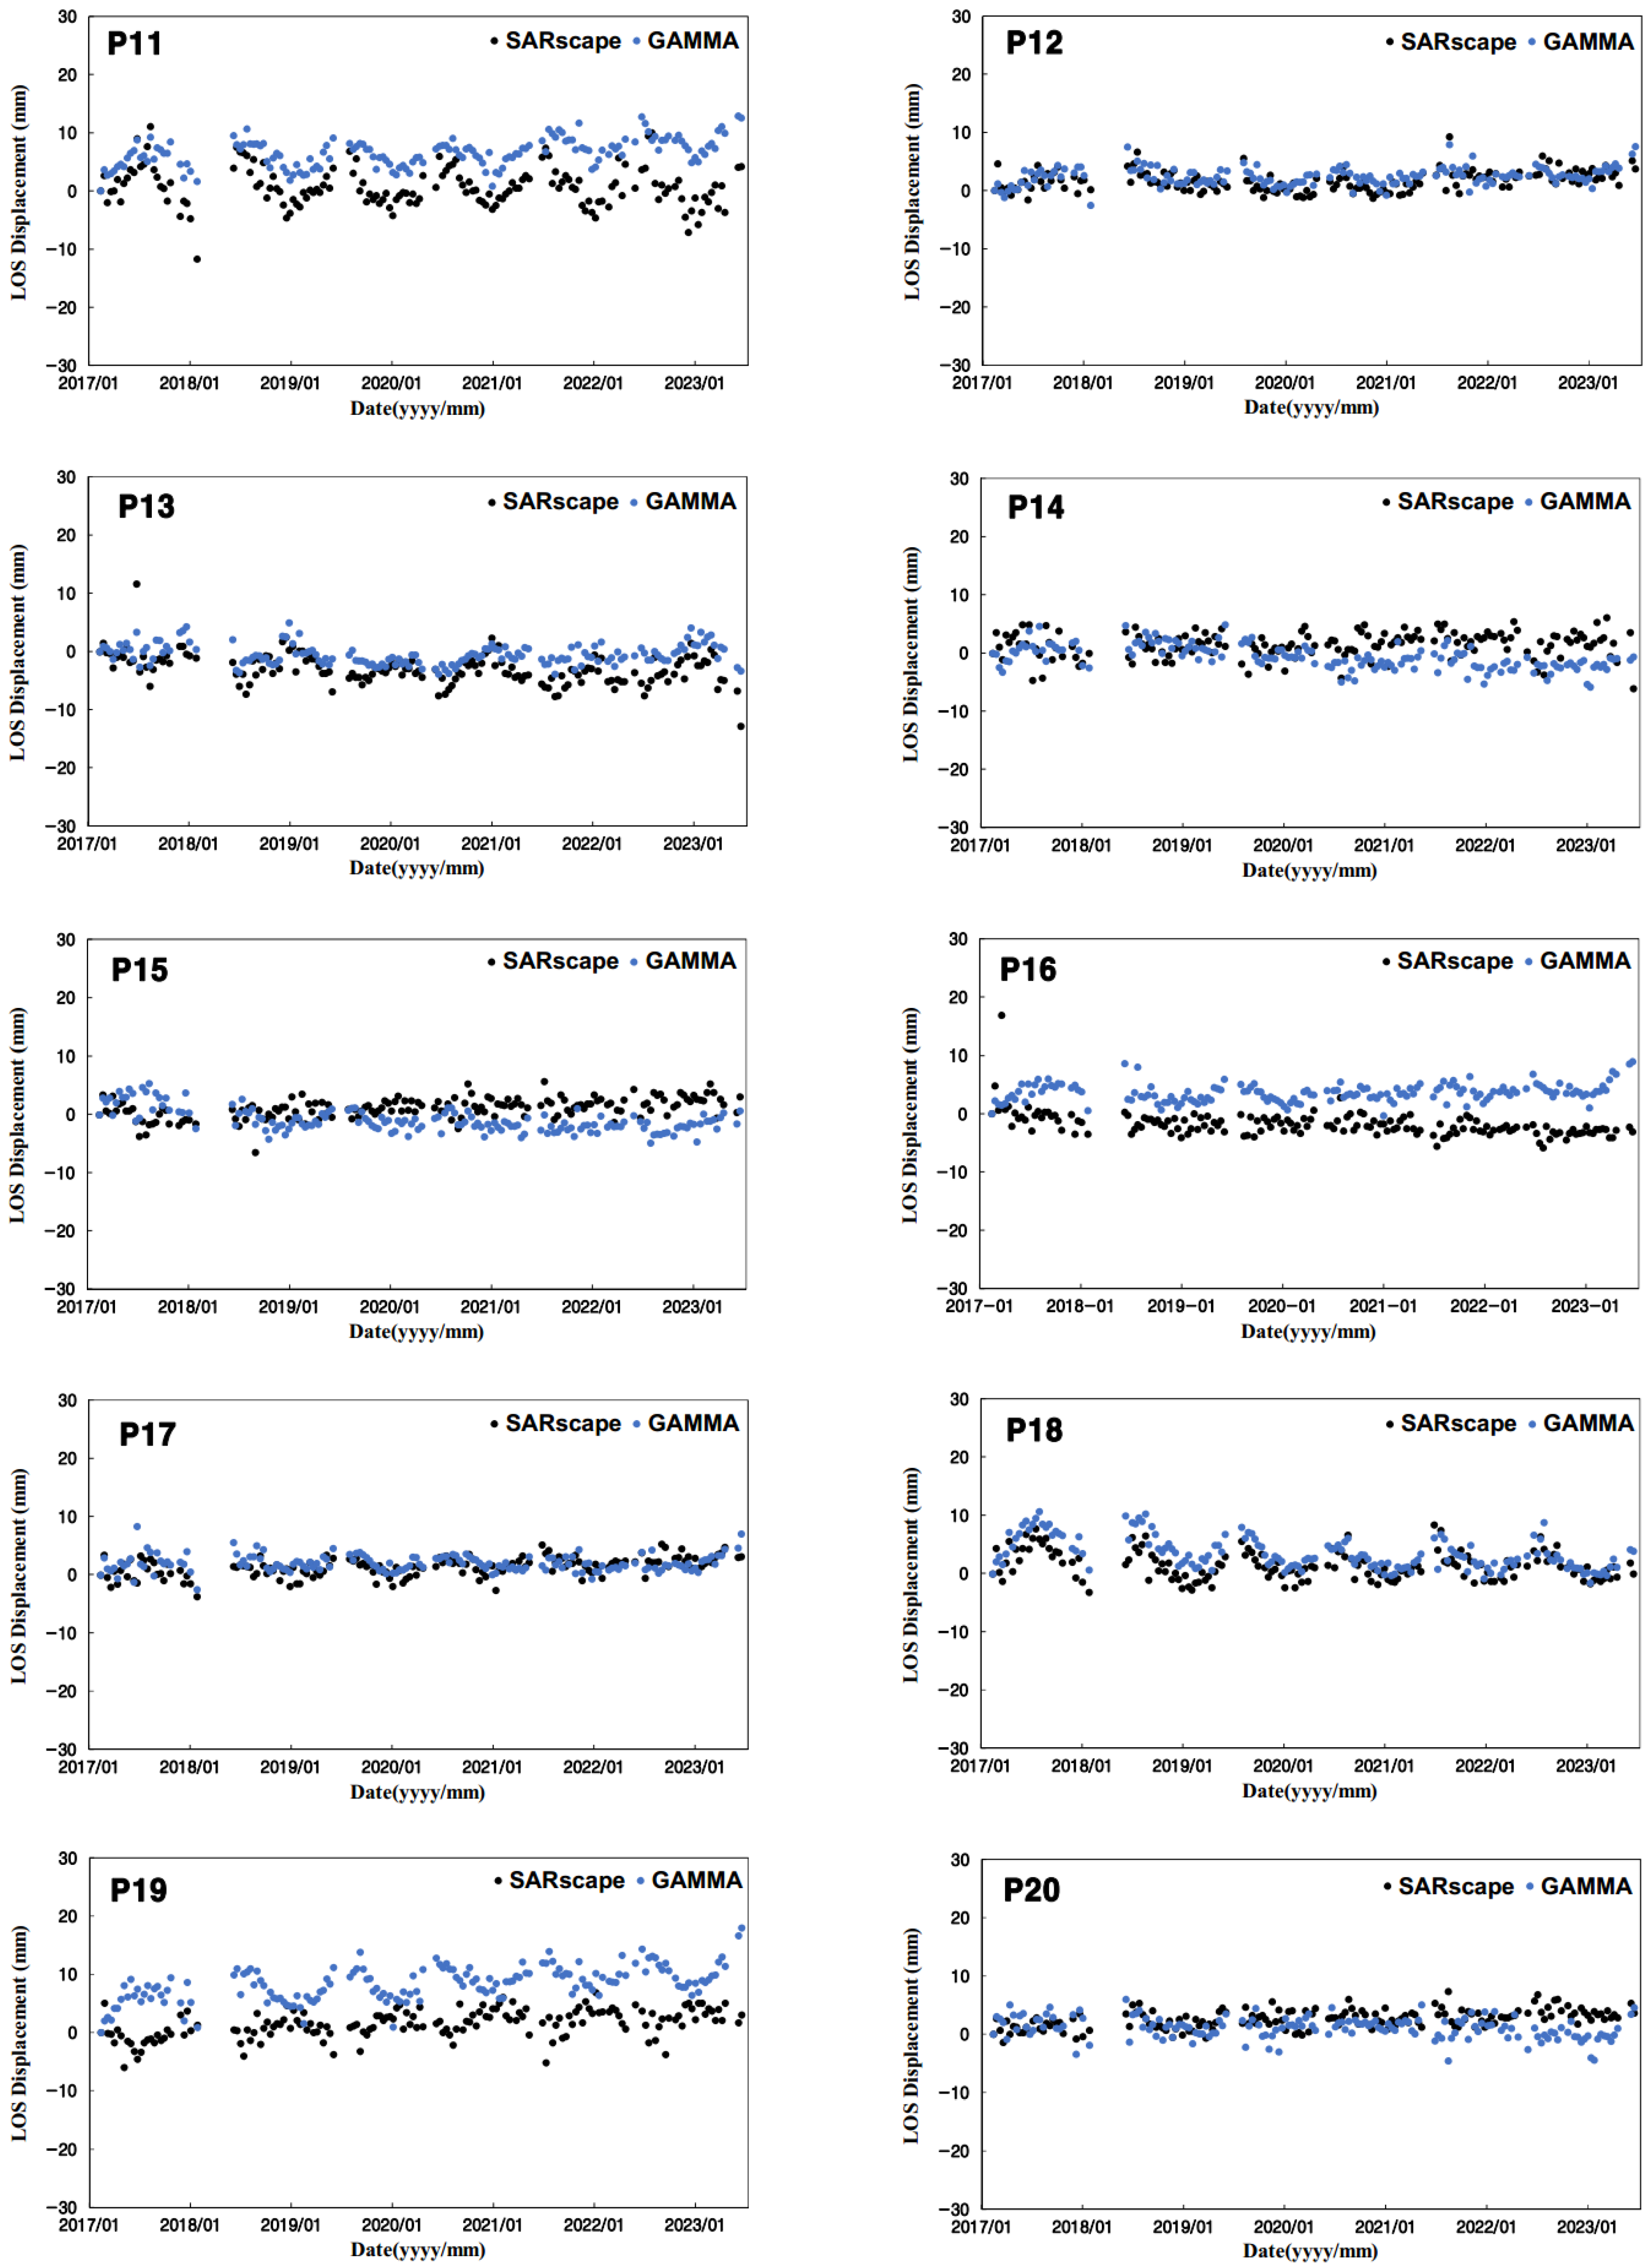
To compare the time-series ground displacements calculated by ENVI SARscape and GAMMA software near the GTX-A route in the Seoul metropolitan area, 20 representative persistent scatterers were selected for each section of the route, as shown in Figure 8. The time series showing ground displacement for each representative persistent scatterer in each section are presented in Figure 9 and Figure 10, where the ENVI SARscape and GAMMA software applications are indicated in red and blue, respectively.
P1, P5–P6, P8, P12–15, P17–18, and P20 showed similar ground displacement rates with both ENVI SARscape and GAMMA software applications, whereas other scatterers exhibited different time-series displacement patterns. For P2–3, P7, P9–11, P16, and P19, the time-series displacements calculated using the GAMMA software application indicated a gradual uplift of the ground, whereas, with SARscape, little to no change in displacement was observed. Although P5 exhibited the same displacement pattern in both software programs, the final subsidence amount was calculated differently. For P11, ENVI SARscape exhibited large variability in time-series displacement during the observation period, likely due to phase unwrapping errors. P19 showed the opposite seasonal displacement patterns for the two software programs. Given that the seasonal displacement patterns for the other scatterers were consistent between both programs, it is suspected that SARscape introduced errors in its time-series displacement for P19.
The time-series displacement calculated by ENVI SARscape generally showed less variability than that calculated by GAMMA software, which can be interpreted as the result of stronger spatiotemporal filtering in SARscape, leading to an underestimation of seasonal displacement. In contrast, the final displacements from the GAMMA software reflected seasonal variations as well as increases and decreases in displacement.
The vertical displacement velocities for P1–P4, located between Unjeong Station and Kintex Station, were close to 0 mm/year. P1–P3 showed very little variation in time-series displacement, indicating stable ground conditions. P4 exhibited seasonal displacements of approximately 1 cm, with uplift in summer and subsidence in winter, but the long-term displacement velocity was minimal.
P5–P8 are persistent scatterers located in Ilsandong. During the observation period, subsidence rates of 20 and 15 mm were observed at P5 and P8, respectively. Continuous ground subsidence was reported around Ilsandong for 4 years starting in 2018, and P5 and P8 are likely to be included in the affected area. P6 showed repeated uplift and subsidence of up to 15 mm, depending on the season. P7 initially exhibited approximately 10 mm of uplift but, after the summer of 2017, there was continuous subsidence, although the magnitude was not significant. P9 and P10, located in Hwajeong-dong, were persistent scatterers, and both showed a subsidence rate of approximately 0.1 mm/year.
P11, in Yongdu-dong, Deogyang-gu, showed a near-zero vertical displacement velocity, indicating stable ground conditions. P12–P17, along the route from Yongdu-dong, Goyang City, to Hannam-dong, Seoul, showed little to no displacement. P18 was extracted from Yongsan-dong and exhibited seasonal displacement patterns, with the magnitude of seasonal displacement decreasing over time. P19, a persistent scatterer observed near Dongho Bridge, showed seasonal displacement patterns with a final uplift of approximately 20 mm. P20 and its surrounding area in Apgujeong-dong exhibited almost no ground movement.

4. Risk Area Review

The time-series ground displacements in the two study areas exhibited varying local displacement characteristics, with instances of subsidence and uplift observed in some cases; however, overall, the displacements were minimal. Therefore, displacement velocity and cumulative displacement alone are considered insufficient to identify the risk areas within the study regions. Accordingly, this study created displacement grading maps based on the final vertical displacement and deviation between the minimum and maximum vertical displacements, and the potential for using these maps to identify risk areas was reviewed.

4.1. Risk Area Review for Study Area A

The final vertical displacement and the deviation between the minimum and maximum vertical displacements were divided into six displacement grades over the entire observation period in the Busan Mandeok–Centum section (Figure 11). Blue and red indicate very stable and highly unstable areas, respectively.
Figure 11. Displacement grading map for Study Area A based on final vertical displacement and deviation between minimum and maximum vertical displacements (modified from [11]). (a) Final vertical displacement. (b) Deviation between minimum and maximum vertical displacements.
Sustainability 16 10627 g011
The displacement grading map based on the final vertical displacement over the entire observation period shows that most areas, except for the banks of the Oncheon Stream and Suyeong River, experienced subsidence of <10 mm (Figure 11a). However, the displacement grading map, based on the deviation between the minimum and maximum vertical displacements, indicates that significant subsidence occurred in most sections near the route in the transverse direction, with subsidence exceeding the allowable limit (25 mm) [14], designating these areas as high-risk zones (Figure 11b). However, as persistent scatterers in areas with noticeable subsidence exhibited relatively small subsidence before the summer of 2022, then showed rapid subsidence thereafter, conducting separate analyses based on the period before and after the summer of 2022 may provide a clearer distinction for identifying risk areas.

4.2. Risk Area Review for Study Area B

In Study Area B, the Woonjeong–Suseo section of the GTX-A metropolitan express railway did not exhibit significant long-term displacement changes, unlike in Study Area A. Therefore, in this study, the risk areas were identified by dividing the final vertical displacements and the deviation between the minimum and maximum vertical displacements over the entire observation period into six displacement grades, as shown in Figure 12. Except for some sections in Ilsandong, the final vertical displacement was <1 cm, indicating stable ground conditions.
The displacement grading map, based on the deviation between the minimum and maximum vertical displacements, showed that subsidence occurred in most areas. In certain parts of Ilsandong, subsidence of >40 mm was observed, indicating unstable ground in the area. In most of the other areas, subsidence of 10–20 mm was observed, which likely reflects the seasonal variation in displacement. It is necessary to carefully interpret these data in conjunction with the final subsidence results and displacement velocity.

5. Conclusions

This study used satellite SAR data to analyze ground displacement associated with the construction and maintenance of infrastructure. Based on the results, the risk areas were reviewed. The findings are as follows: The PSInSAR method, using satellite SAR images, can effectively assess ground stability throughout the lifecycle of urban infrastructure construction projects. There were some differences in the results depending on the software used for PSInSAR; however, these differences can be addressed by user experience. Even when different software is used, if similar PSInSAR execution conditions (e.g., filtering conditions, phase unwrapping conditions) are applied, the discrepancies in the calculated displacements are expected to be small.
The Busan Mandeok–Centum underground road section experienced relatively little displacement. Significant ground displacement was observed in the riverbank area between the Oncheon Stream and the Suyeong River, indicating notable subsidence. In particular, ground subsidence in this area rapidly increased after the summer of 2022. For the GTX-A metropolitan express railway, seasonal variations in displacement were observed, but long-term significant displacement did not occur, except for some areas in Ilsandong.
PSInSAR can derive indicators to identify areas of risk, such as displacement velocity, final displacement, cumulative displacement, and deviation between minimum and maximum displacements. Based on the characteristics of the time-series ground displacement, it was necessary to select appropriate indicators and define the analysis period. The threshold values for determining the risk areas for each indicator should be set separately by experts, depending on the characteristics of the ground. The method for identifying risk zones from the analysis results was investigated. When only vertical displacement was considered, it was difficult to clearly identify the risk areas. However, by analyzing the deviation between minimum and maximum vertical displacements over the analysis period, it became possible to more definitively identify the risk zones. Nonetheless, the analysis results are limited to certain areas; thus, additional verification studies are required.
Ultimately, by overlapping past and current satellite SAR data for time-series analysis, it was confirmed that this approach could provide sustainable information for maintenance, including near-future ground displacement. For satellites, it takes more than a week to capture the same area again. To apply this for maintenance, it is necessary to address the gaps in time wherein images are not captured. Additionally, the techniques used to clearly identify risk areas from the interpretation results need to be validated and improved. If these aspects are addressed through further research, this approach could be applied across the broader field of sustainable maintenance.

Author Contributions

Investigation, B.P. and W.Y.; Validation, H.H.; Writing—original draft, W.K.; Writing—review & editing, S.H. All authors have read and agreed to the published version of the manuscript.

Funding

This research was supported by the International Collaborative Research Program, A Study on Monitoring Surface Displacement Using SAR Data from Satellite for Waste Landfill, of the Korea Institute of Civil Engineering and Building Technology. We are grateful for the support.

Institutional Review Board Statement

Not applicable.

Informed Consent Statement

Not applicable.

Data Availability Statement

The satellite data used in this study (Satellite SAR data, Sentinel-1) can be downloaded for free from the European Commission and European Space Agency’s Open Access Hub (https://scihub.copernicus.eu/dhus/#/home, accessed on 26 October 2024) and will be provided upon request to the corresponding author.

Conflicts of Interest

The authors declare no conflicts of interest.

References

  1. Koohmishi, M.; Kaewunruen, S.; Chang, L.; Guo, Y. Advancing railway track health monitoring: Integrating GPR, InSAR and machine learning for enhanced asset management. Autom. Constr. 2024, 162, 105378. [Google Scholar] [CrossRef]
  2. Tonelli, D.; Caspani, V.F.; Valentini, A.; Rocca, A.; Torboli, R.; Vitti, A.; Perissin, D.; Zonta, D. Interpretation of bridge health monitoring data from satellite InSAR technology. Remote Sens. 2023, 15, 5242. [Google Scholar] [CrossRef]
  3. Zhang, L.; Ge, D.; Guo, X.; Liu, B.; Li, M.; Wang, Y. InSAR monitoring surface deformation induced by underground mining using Sentinel-1 images. Proc. Int. Assoc. Hydrol. Sci. 2020, 382, 237–240. [Google Scholar] [CrossRef]
  4. Kim, H.B.; Yoon, H.S.; Youm, M.K.; Lee, W.E. Land subsidence analysis for the high-speed railway line of Honam using D-InSAR technique. J. Korean Soc. Geospat. Inform. Sci. 2017, 25, 35–41. [Google Scholar]
  5. Kim, B.K.; Lee, C.G.; Kim, W.; Yoo, M.T.; Lee, I.H. A study on the D-InSAR method for micro-deformation monitoring in railway facilities. J. Korean Geotech. Soc. 2022, 38, 43–54. [Google Scholar]
  6. Kim, W.; Kim, B.K.; Lee, C.G.; Kim, K.H.; Lee, I.H. Analysis on micro-deformation of PSC BOX railway bridge using multi-temporal InSAR. J. Korean Soc. Rail. 2024, 27, 32–40. [Google Scholar] [CrossRef]
  7. Ghorbani, Z.; Khosravi, A.; Maghsoudi, Y.; Mojtahedi, F.F.; Javadnia, E.; Nazari, A. Use of InSAR data for measuring land subsidence induced by groundwater withdrawal and climate change in Ardabil Plain, Iran. Sci. Rep. 2022, 12, 13998. [Google Scholar] [CrossRef] [PubMed]
  8. Nur, A.S.; Nam, B.H.; Choi, S.W.; Kim, Y.J. Monitoring of ground subsidence using PS-InSAR technique in the Southeast Texas (SETX) region. Int. J. Geo-Eng. 2024, 15, 13. [Google Scholar] [CrossRef]
  9. Moon, J.S.; Oh, H.S. A case study of ground subsidence analysis using the InSAR technique. J. Korean Tunnell. Undergr. Space Assoc. 2022, 24, 171–182. [Google Scholar]
  10. Kim, W.S.; Hwang, S.P.; Yoo, W.K.; Shimizu, N.; Kim, C.Y. A study on monitoring surface displacement using SAR data from satellite to aid underground construction in urban areas. J. Eng. Geol. 2024, 34, 39–49. [Google Scholar]
  11. Kim, T.W.; Han, H.S.; Lee, S.U.; Kim, W.S. Time-series interferometric synthetic aperture radar based on permanent scatterers used to analyze ground stability near a deep underground expressway under construction in Busan, South Korea. J. Eng. Geol. 2022, 33, 689–699. [Google Scholar]
  12. Ferretti, A.; Prati, C.; Rocca, F. Nonlinear subsidence rate estimation using permanent scatterers in differential SAR interferometry. IEEE Transac. Geosci. Remote Sens. 2000, 38, 2202–2212. [Google Scholar] [CrossRef]
  13. Hooper, A.; Bekaert, D.; Spaans, K.; Arikan, M. Recent advances in SAR interferometry time series analysis for measuring crustal deformation. Tectonophysics 2012, 514-517, 1–13. [Google Scholar] [CrossRef]
  14. Sower, G.F. Shallow Foundations, Foundation Engineering; Leonards, G.A., Ed.; McGraw-Hill: New York, NY, USA, 1962; p. 525. [Google Scholar]
Figure 2. DSM of Study Area A.
Sustainability 16 10627 g002
Figure 3. DSM of Study Area B.
Sustainability 16 10627 g003
Figure 4. LOS displacement velocity within a 250 m radius of the Busan Mandeok–Centum underground road in Study Area A.
Sustainability 16 10627 g004
Figure 5. LOS displacement velocity within a 250 m radius of the GTX-A route in Study Area B.
Sustainability 16 10627 g005
Figure 7. Time-series ground displacement analysis results for Study Area A.
Sustainability 16 10627 g007
Figure 8. Representative persistent scatterers in the analysis results for Study Area B.
Sustainability 16 10627 g008
Figure 9. Time-series ground displacement analysis results for Study Area B (continued in Figure 10).
Sustainability 16 10627 g009
Figure 10. Time-series ground displacement analysis results for Study Area B.
Sustainability 16 10627 g010
Figure 12. Displacement grading map for Study Area B based on final vertical displacement and deviation between minimum and maximum vertical displacements. (a) Final vertical displacement. (b) Deviation between minimum and maximum vertical displacements.
Sustainability 16 10627 g012
Disclaimer/Publisher’s Note: The statements, opinions and data contained in all publications are solely those of the individual author(s) and contributor(s) and not of MDPI and/or the editor(s). MDPI and/or the editor(s) disclaim responsibility for any injury to people or property resulting from any ideas, methods, instructions or products referred to in the content.

