Article

Spatiotemporal Changes and Driving Factors of Land Use/Land Cover (LULC) in the Wuding River Basin, China: Impacts of Ecological Restoration

1
College of Life and Environmental Science, Minzu University of China, Beijing 100081, China
2
College of Water Resources and Civil Engineering, China Agricultural University, Beijing 100083, China
3
College of Oceanography, China University of Geosciences, Beijing 100083, China
*
Authors to whom correspondence should be addressed.
Sustainability 2024, 16(23), 10453; https://doi.org/10.3390/su162310453
Submission received: 14 October 2024 / Revised: 21 November 2024 / Accepted: 26 November 2024 / Published: 28 November 2024

Abstract

:
Over the past two decades, large-scale ecological restoration in the Loess Plateau has significantly transformed land use and land cover (LULC) in the Wuding River Basin (WRB), improving ecological governance and environmental conditions. This study examines the spatiotemporal evolution of LULC and its driving factors from 2000 to 2020, employing methods such as the LULC dynamic degree, transfer matrix, migration trajectory, and geographical detector. Results show that (1) grassland dominates the basin’s LULC (78.16%), with decreases in cropland and desert areas, and expansions in grassland, forest, and urban areas. Water bodies show minimal fluctuations. The mean annual dynamic degree of LULC types (from highest to lowest) is as follows: forest > desert > urban > water > cropland > grassland. The overall dynamic degree fluctuated, initially decreasing (0.85%–0.68%), then increasing (0.68–0.89%), followed by another decline (0.89–0.30%). (2) LULC patterns follow a northwest-to-southeast gradient, with primary transitions from desert and cropland to grassland and secondary transitions to forest, urban, and water bodies. Spatial migration mainly shifts westward and northward. (3) Under the single-factor influence, natural factors, especially slope (7.2–36.4%) and precipitation (6.1–22.3%), are the primary drivers of LULC changes, with population density (7.9%) and GDP (27.5%) influencing urban areas. In the interaction of factors, topography and climate (40.5–66.1%) primarily drive increases in cropland, forest, and grassland, while human activities and climate (24.8–36.7%) influence urban and water area expansion. Desert area reduction is largely driven by climatic factors (40.3%). The interaction between two factors shows either a bi-factorial or nonlinear enhancement effect, suggesting that their combined influence offers stronger explanatory power than any single factor alone. This study highlights significant LULC changes in the WRB, driven by both natural factors and human activities, contributing to enhanced ecological governance and land use sustainability.

1. Introduction

Land serves as the foundation of human existence and a crucial resource for regional economic and ecological sustainability [1]. Changes in land use and land cover (LULC) directly reflect interactions between human activities and the natural environment, playing a vital role in shaping both human development and ecological health [2]. Dynamic changes in LULC affect various aspects, such as regional ecosystem functions [3], climate change [4], and human livelihoods [5]. Therefore, the temporal and spatial patterns of LULC and the driving mechanisms influenced by human activities and climate change have attracted significant academic attention and become central to research on regional environmental change [6]. Fundamental research on the spatiotemporal characteristics of LULC should be strengthened, and the driving mechanisms of different LULC types clarified. This approach can provide insights into current LULC patterns, guide future land resource planning, and promote sustainable ecological development.
LULC is a complex process influenced by both natural and human factors, and it is crucial for economic development and environmental sustainability. The Loess Plateau, located in northern China, is characterized by scarce water resources and a fragile ecosystem. With 70.94% of the land damaged, it is the most severely impacted region in China due to soil erosion, leading to long-term land degradation [7]. In recent decades, China has initiated a series of ecological restoration projects on the Loess Plateau, focusing on vegetation restoration, desertification control, and soil and water conservation [8]. Notable programs, including the “Grain for Green” program (1999), the “Natural Forest Protection” program (2000), and the “Beijing-Tianjin Sandstorm Source Control” program (2002), have significantly increased vegetation cover, resulting in substantial changes in LULC patterns and increased interannual variations [9,10]. These efforts have greatly improved the ecological condition of the Loess Plateau and enhanced regional ecosystem services [11,12]. Given the vulnerability and ecological importance of the Loess Plateau, it has become a focal point for research on changes in LULC types and their driving factors. Zhou et al. [13], using LULC data from 1980 to 2020 and geographically weighted regression, found that population, urbanization, and slope are the primary drivers of LULC changes at the county level in Shaanxi Province. Zhou et al. [14] employed Mann–Kendall trend tests, Pettitt tests, and landscape pattern indices, demonstrating that economic and population growth primarily influenced LULC changes in the Yan River Basin from 1990 to 2020. Zhang [2] analyzed LULC types and driving mechanisms in Gansu Province of the Yellow River Basin from 2000 to 2020. Using LULC transfer matrices, change indices, and principal component analysis, they identified population, economic level, and industrial structure as the dominant factors affecting changes in urban land and cropland. Existing analyses of LULC driving factors predominantly focus on linear methods that analyze relationships between independent variables and individual factors. However, they often lack adequate analysis of factor interactions, which hinders a comprehensive understanding of the driving mechanisms behind changes in different LULC types. Moreover, research on sandy basin ecosystems and the driving mechanisms for LULC types remain underexplored.
In the context of ecological restoration, researchers often use the Normalized Difference Vegetation Index (NDVI) [15] and Net Primary Productivity (NPP) [16] as key indicators for quantifying ecological changes in the Loess Plateau. LULC studies in this region mainly focus on LULC changes affecting the distribution of landscape patterns [17], ecosystem functions [18,19], and their economic value [20,21]. For example, Chang et al. [22] assessed regional ecological risk based on LULC landscape patterns from 2000 to 2020, which revealed a decrease in landscape fragmentation alongside increases in diversity and richness. High ecological risk areas were predominantly located in northern Shaanxi and regions adjacent to the Yellow River. Wen et al. [23] analyzed the impact of LULC changes on ecosystem service value (ESV) in northern Shaanxi from 1990 to 2020, finding a consistent increase in ESV. The ranking of service types, from highest to lowest, was as follows: regulating services > supporting services > provisioning services > cultural services. Xiong et al. [24], using the InVEST and PLUS models, quantitatively assessed three major ecosystem services—water yield, carbon storage, and soil retention—on the Loess Plateau from 2000 to 2020. The results indicated that, amidst rapid urban expansion, a gradual increase in forested areas, and a continued decrease in cropland, both water yield and soil retention increased, while carbon storage exhibited a declining trend. In summary, while previous studies indicate overall ecological improvement in the Loess Plateau, including increased vegetation cover, there is a lack of long-term studies on LULC spatiotemporal dynamics, especially quantitative analyses of migration trajectories.
The Wuding River Basin (WRB), the largest sub-basin in the middle reaches of the Yellow River, is located at the heart of the Loess Plateau, along the southern edge of the Mu Us Desert. This basin plays a critical role as an ecological barrier, which serves as a representative model due to its topographical features and ecological vulnerability [25]. It is a key area for soil and water conservation efforts and has become a focal point for ecological restoration research [26]. In this study, LULC data from 2000 to 2020, analyzed at five-year intervals, were used to examine the spatiotemporal characteristics and trajectories of LULC changes in the WRB through dynamic degree analysis, transfer matrices, and gravity center migration methods. The geographical detector model identified key driving factors and assessed pairwise interactions affecting different LULC types. A comprehensive analysis of spatiotemporal changes in LULC within the WRB, in the context of ecological restoration, can provide scientific support for formulating ecological restoration policies. Additionally, it offers valuable insights into enhancing LULC efficiency in the Loess Plateau region. This analysis also provides a reference for sustainable land development in other ecologically fragile sandy regions. This study aims to address the following scientific questions: (1) What are the spatiotemporal characteristics of LULC in the WRB? (2) How have the spatial migration trajectories of different LULC types evolved over time? (3) What mechanisms drive changes in the areas of different LULC types?

2. Materials and Methods
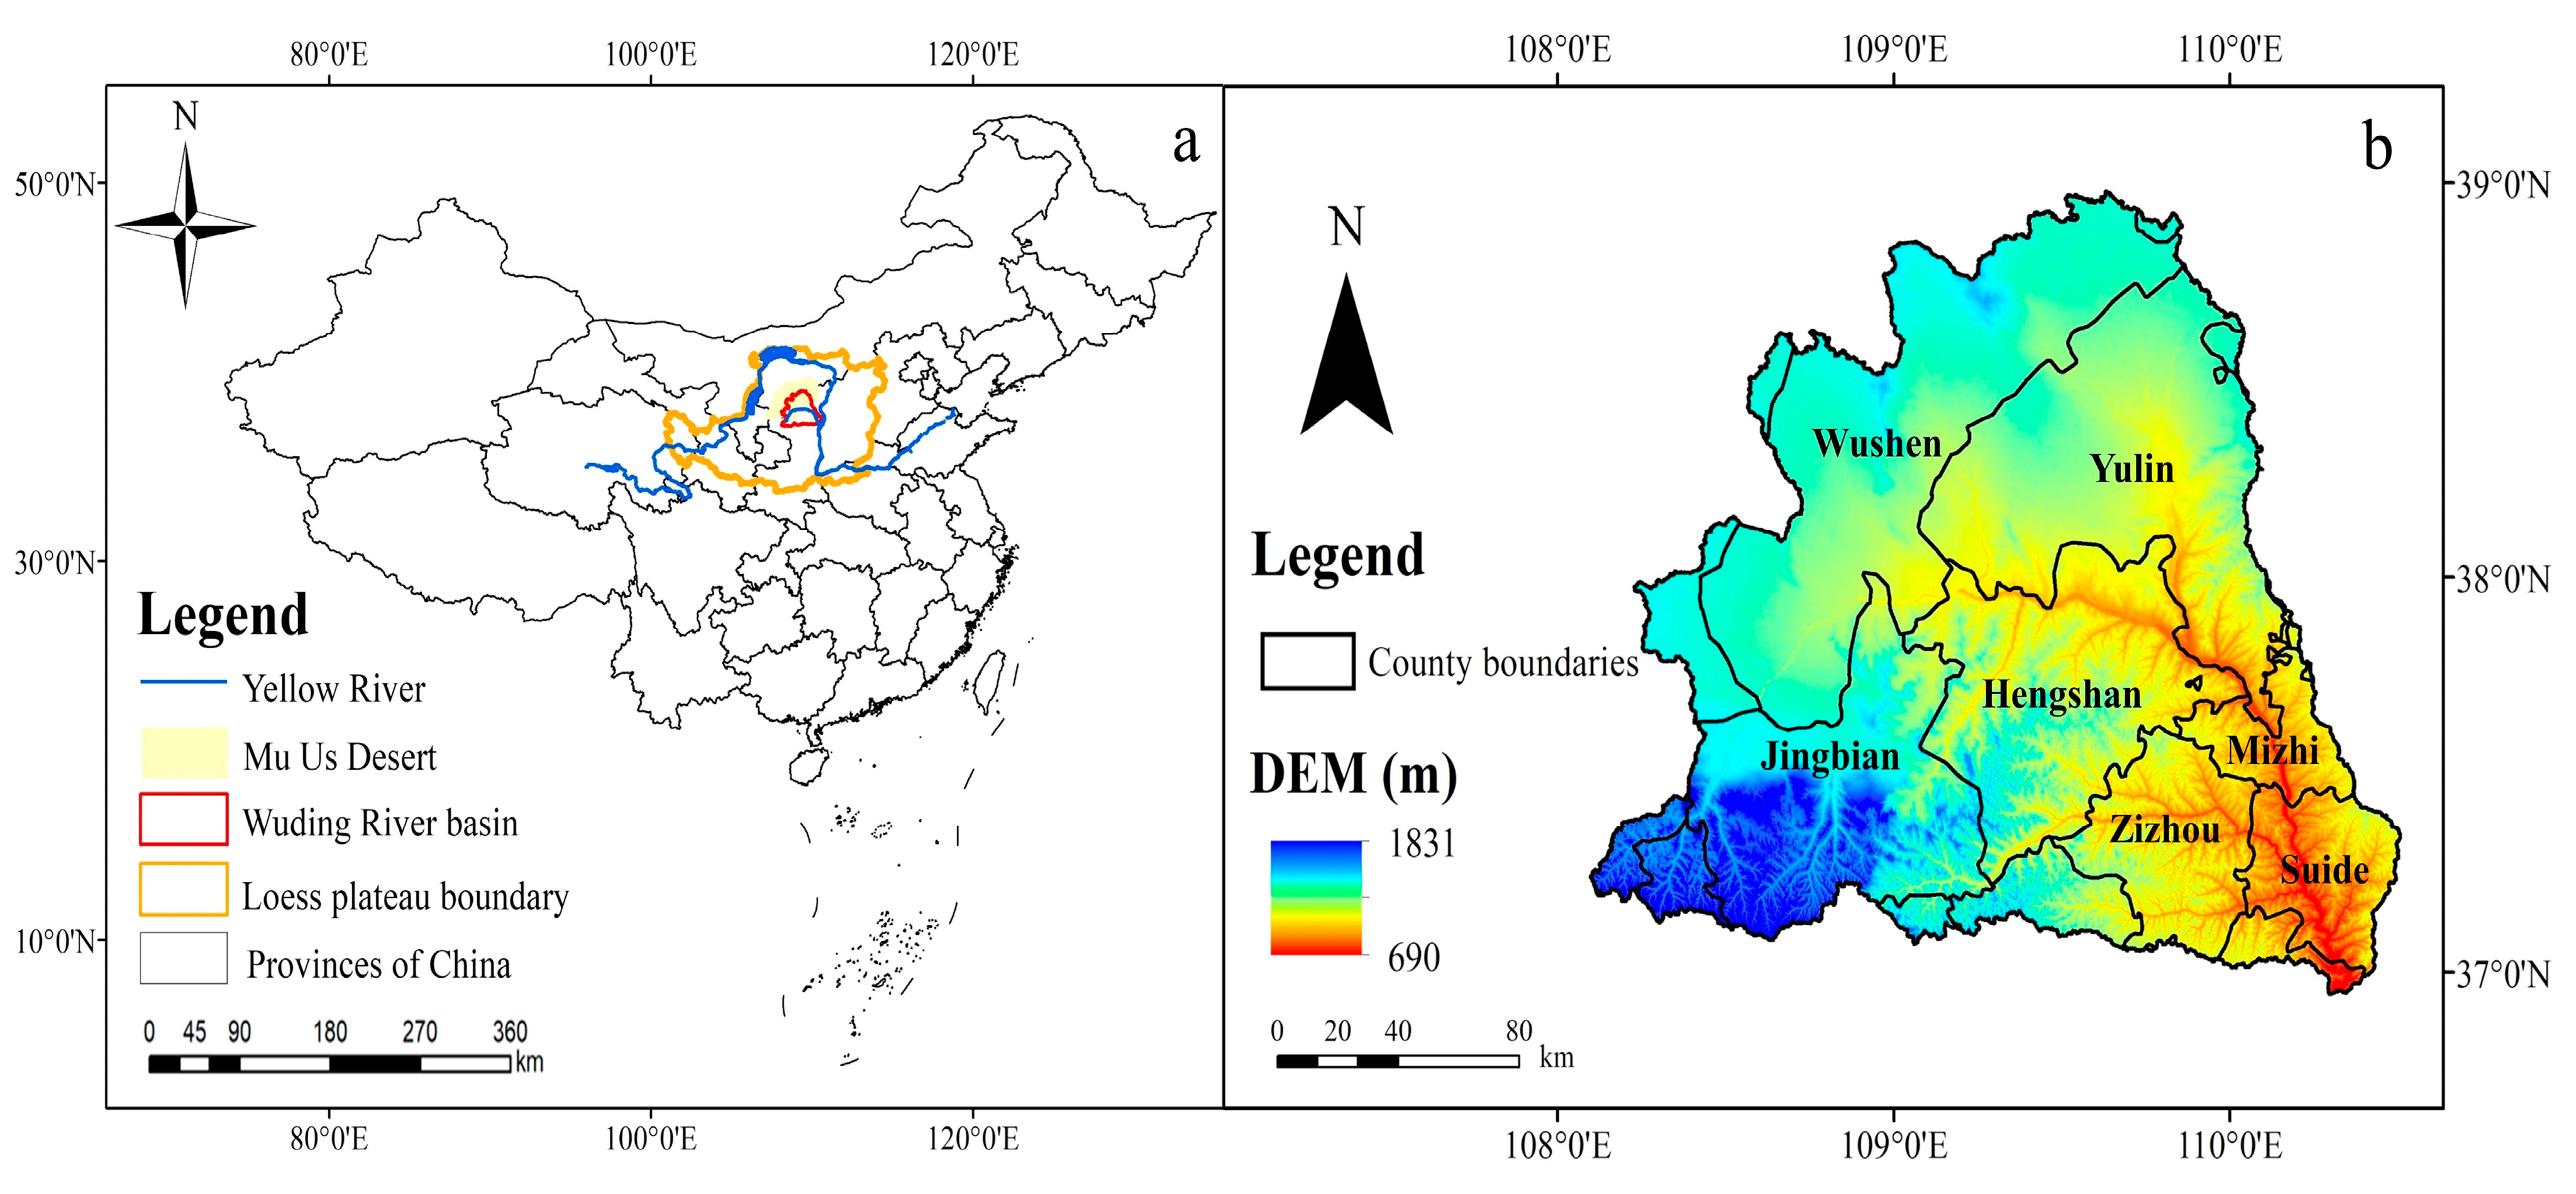
2.1. Study Area

The WRB is situated in the middle reaches of the Yellow River Basin, covering the northern part of the Loess Plateau and the southern edge of the Mu Us Desert (Figure 1a). The WRB originates from Baiyu Mountain in Dingbian County, Shaanxi Province. It flows through Wushen County, Inner Mongolia, and several counties in Shaanxi Province, including Yulin, Hengshan, Mizhi, Jingbian, Zizhou, and Suide. The river eventually merges with the Yellow River in Qingjian County (Figure 1b). Major tributaries are the Yuxi, Lu, Dali, and Huaining rivers. This study focuses on the portion of the WRB upstream of the Baijiachuan Hydrological Station, encompassing an area of 29,609.94 km2. The population of the study area is approximately 5.0 million. The basin’s geographical coordinates range from 108°05′ E to 111°01′ E and 37°02′ N to 39°05′ N, with elevations ranging from 690 to 1831 m, as shown in Figure 1b.
The basin is divided into upper, middle, and lower reaches based on administrative boundaries. The upper reaches, including Wushen County and Jingbian County, are characterized by aeolian sand and loess gully regions. The middle reaches, including Yulin City and Hengshan County, are located in the Loess Hilly Region. The lower reaches, which include Mizhi, Zizhou, and Suide counties, are likewise part of the Loess Hilly Region. The basin lies at the junction of arid and semi-arid zones and experiences a temperate continental monsoon climate. The long-term average annual temperature ranges from 7.6 to 9.9 °C, with an average annual precipitation of 350–430 mm, primarily concentrated from July to September. The average annual evaporation is approximately 1100–1400 mm. The main soil types in the basin are chestnut soil, clay, loess, and aeolian sandy soil, with loess and aeolian sandy soil being the most prevalent [27].
Over the past two decades, extensive ecological restoration projects have been undertaken in the WRB (Figure 2). From 2000 to 2005, projects such as the Beijing-Tianjin Sandstorm Source Control Project, the Natural Forest Protection Program, and the Grain for Green Project were launched. These projects effectively curbed the expansion of cropland and significantly increased forest and grassland areas. Between 2005 and 2010, efforts were expanded with the continuation of natural forest protection and the further implementation of the Grain for Green Project. Additionally, the “cropland red line” was established to secure agricultural land for food production and safety. From 2010 to 2020, comprehensive ecological restoration measures were introduced, including the continuation of the Beijing-Tianjin Sandstorm Source Control and wetland restoration. Over the past two decades, the WRB has achieved notable progress, characterized by the retreat of sand, the expansion of vegetation, and the reduction of desertification, reflecting a clear trend toward ecological improvement.

2.2. Data Sources

2.2.1. LULC Data

This study utilizes the CLCD national LULC data produced by Wuhan University, China [28]. This dataset is derived from Landsat data available on Google Earth Engine (GEE) and employs a random forest classifier to generate land classification results. It includes 5463 visually interpreted samples from across China, with an overall accuracy exceeding 79% and a spatial resolution of 30 m. The CLCD dataset has been widely used in studies of LULC temporal and spatial evolution [29]. For this study, LULC data from within the WRB boundary were extracted at five-year intervals from 2000 to 2020 (i.e., 2000, 2005, 2010, 2015, and 2020). Based on classification guidelines and the characteristics of LULC types within the basin, the data were categorized into six major classes: cropland, forest, grassland, water, urban land, and desert.

2.2.2. Driving Factor Data

Drawing on previous research findings [30,31], this study selects nine factors, considering both natural and anthropogenic influences. The natural factors include elevation, slope, distance to the river, mean annual temperature, and annual rainfall. The anthropogenic factors include population density, GDP, distance to roads, and distance to highways. Data sources are provided in Table 1, with spatial distribution illustrated in Figure 1b and Figure 3.

2.3. Research Method

2.3.1. Dynamic Degree

The single dynamic degree of LULC quantifies the changes in the area of a specific LULC type within a given period, facilitating the understanding of temporal variability and trends for individual LULC types [32,33]. It is calculated as follows:
K i = S i , b S i , a S i , a × 1 T × 100 %
where K i represents the single dynamic degree of LULC type i (%); S i , a is the area of LULC type i at the beginning of the study period (km2); S i , b is the area of LULC type i at the end of the study period (km2); and T is the duration of the study period (T = 5).
The comprehensive LULC dynamic degree reflects the overall patterns of change across all LULC types within the study period [34,35]. It is calculated as follows:
Q = i = 1 n S i j 2 i = 1 n S i × 1 T × 100 %
where Q is the comprehensive LULC dynamic degree (%); i , j are different LULC types; S i is the area of LULC type i at the beginning of the study period (km2); S i j is the absolute value of the area converted from LULC type i to type j during the study period (km2); and n is the number of LULC types.

2.3.2. Land-Use Transfer Matrix

The LULC transfer matrix, also known as the Markov matrix, intuitively reflects the magnitude and direction of area changes across different LULC types over time [36,37]. It provides a clearer understanding of land area transitions and the processes of change. In this study, the LULC data for each five-year interval were overlaid and analyzed using ArcGIS 10.8 software, resulting in the LULC transfer matrices for different periods. It is calculated as follows:
S i j = S 11   S 12 · · · S 1 n S 21   S 22 · · · S 2 n S 31   S 32 · · · S 3 n     S n 1   S n 2 · · · S n n
where S i j is the land area transfer matrix; n is the number of LULC types; and S is the area transferred from LULC type i to type j during the study period.

2.3.3. Centroid Migration Model

The centroid model is a crucial analytical tool for studying spatial changes in regional development. This model identifies the geographic center or density centroid of features by weighting characteristic data, reflecting the patterns of spatial aggregation and displacement of these features [38]. In this study, the spatial statistics tools in ArcGIS 10.8 are used to obtain the centroid coordinates and standard deviation ellipses for each LULC type transition and to calculate the centroid shift distances. It is calculated as follows:
X i , t = q = 1 m X i , q C t q q = 1 m C t q
Y i , t = q = 1 m Y i , q C t q q = 1 m C t q
L = ( X i , t + 1 X i , t ) 2 + ( Y i , t + 1 Y i , t ) 2
where X i , t and Y i , t are the centroid coordinates of LULC type iii in year t; X i , q and Y i , q are the geometric center coordinates of spatial unit q; C t q is the area of spatial unit q in year t; m is the total number of spatial units; and L is the centroid shift distance for different LULC types.

2.3.4. Geographical Detector Model

The Geographical Detector model is highly objective, addressing the limitations associated with categorical variables and effectively managing nonlinear data [39]. It has been widely applied in fields such as economics, meteorology, and hydrology [40]. The model provides an explanatory power value, q, which ranges from 0 to 1. A higher q value indicates a stronger explanatory power of the driving factor on changes in different LULC types, while a lower q value suggests a weaker explanatory power. In this study, the Geographical Detector model is applied using the fishnet tool in ArcGIS 10.8 to extract spatial locations of factors. A grid of 10 km × 10 km is created, and both the factors and LULC data are assigned to this grid, resulting in a total of 351 sampling points. Subsequently, the model is executed using the “GD” package and “gdm” function in R 4.3.1 to analyze the data and identify the driving mechanisms behind changes in LULC types.
The Factor Detector evaluates how well a driving factor X explains the spatial variation in area Y. It is calculated as follows:
q = 1 h = 1 L N h σ h 2 N σ h 2
where q is the contribution degree; h is the stratification of driving factors; N h is the number of units in layer h, and σ h 2 is the variance of the dependent variable in layer h.
Interaction effects evaluate how the combined influence of driving factors modifies their explanatory power for LULC types [41]. The interaction relationships are detailed in Table 2.

3. Results

3.1. Spatiotemporal Evolution Characteristics of LULC

3.1.1. Spatial Distribution of LULC

The spatial distribution map of LULC types in the WRB (Figure 4) demonstrates significant variation from 2000 to 2020. A clear transition pattern from desert to grassland to cropland is observed moving from the northwest to the southeast, largely influenced by the basin’s topography and hydrothermal conditions. The desert is predominantly concentrated in the Mu Us Sandy Land region in the northwest, located in the upper reaches of the WRB, including administrative areas such as Wushen County and Yulin County. This region comprises approximately 98% of the total desert area. The middle reaches of the basin display a desert-grassland-cropland spatial distribution, serving as a transitional zone for ecological conservation between the upper and lower reaches. In contrast, downstream areas, such as Mizhi County, Suide County, and Zizhou County, contain minimal desert areas, with landscapes dominated by cropland and forest, mainly focusing on grain production and artificial forest plantations.

3.1.2. Area Change and Dynamic Degree of LULC

In the WRB, grassland is the predominant LULC type, followed by cropland and desert. Forest, water bodies, and urban areas occupy minor proportions, each comprising approximately 1% of the total area. Analyzing LULC changes from 2000 to 2020 (Figure 5a) reveals a significant decrease in desert areas and notable increases in grassland, forest, and urban areas. Among these changes, grassland experiences the greatest increase, growing from 19,688.67 km2 (66.49%) in 2000 to a peak of 23,142.9 km2 (78.16%) in 2020. Conversely, desert areas saw the greatest reduction, decreasing from 3339.76 km2 (11.28%) in 2000 to 743.77 km2 (2.51%) in 2020, highlighting significant regional ecological restoration and effective desertification control. Cropland initially declines, increases, and then decreases again, rising by 382.99 km2 in 2010 compared to 2005, but generally decreasing at other times, reaching a minimum of 5395.37 km2 (17.83%) in 2020. Both urban areas and forests show considerable increases. Urban areas increase nearly threefold, largely due to rapid economic development and rising population density in the basin. Forest expands nearly twentyfold, driven by continued afforestation and reforestation efforts aligned with the “Grain-for-Green” policy. Water bodies display fluctuating trends with no significant change, primarily influenced by climate variability and adjustments in water management infrastructure.
From 2000 to 2020, the dynamic characteristics of different LULC types exhibit variability (Figure 5b). Grassland represents the largest and most extensively distributed land cover type in the study area, accounting for over 75% of the total area. Its average annual dynamic degree is 0.83%, with the highest observed between 2000 and 2005 (1.24%). Due to the substantial base area of grassland, its dynamic degree exhibits relatively minor fluctuations. Forest has an average annual dynamic degree of 28.39%, reaching its peak between 2010 and 2015 (82.38%). Forest demonstrates the most pronounced expansion and dynamic degree among all land cover types, attributed to its relatively small initial area. Urban areas show an initial increase in dynamic degree, which then decreases, falling from 5.04% in 2000 to 4% in 2020. This trend indicates a gradual deceleration in urbanization and a move towards stabilization. Among the six land cover types, only cropland and desert exhibit negative average annual dynamic degrees of −0.82% and −5.98%, respectively. The rates of decrease are most rapid between 2010 and 2015, with dynamic degrees of −1.86% and −9.34%. Water bodies experience minimal absolute changes, resulting in a lower dynamic degree. The comprehensive dynamic degrees for LULC over the four periods from 2000 to 2020 are 0.85%, 0.68%, 0.89%, and 0.30%, respectively. The higher dynamic degrees in 2000–2005 and 2010–2015 reflect a pattern of initial decrease, followed by an increase, and subsequently a decrease.

3.2. Analysis of the Land-Use Transfer Matrix

The Sankey diagram illustrating LULC transitions in the WRB from 2000 to 2020 (Figure 6) shows that the primary LULC transitions occurred among cropland, grassland, and desert, with other types experiencing relatively minor transitions. The LULC transfer data for different years is provided in Appendix A (Table A1, Table A2, Table A3 and Table A4). From 2000 to 2005, desert areas saw the largest net reduction (779.20 km2), with most of this land converted to grassland (770.08 km2). Cropland also experienced a significant net reduction (475.98 km2), primarily transitioning to grassland (467.40 km2). Among other land types, the increase in urban areas mainly resulted from conversions of cropland (11.06 km2) and grassland (10.86 km2), while the increase in water bodies mainly resulted from the conversion of grassland (7.47 km2) and cropland (3.33 km2). From 2005 to 2010, desert areas continued to experience the largest net reduction (1008.70 km2), with nearly all of this area (1003.29 km2) transitioning to grassland, accounting for 99.46% of the total area transitioned. The second most significant transition was the net conversion of grassland to cropland, resulting in a slight increase in cropland area (389.84 km2). The increase in urban areas was largely due to conversions from cropland (12.79 km2) and grassland (17.09 km2), which accounted for 37.67% and 50.34% of the total area transitioned, respectively. Forest and water bodies remained stable, with nearly equal amounts of land transferred in and out. From 2010 to 2015, the most notable transitions involved desert to grassland (703.27 km2) and cropland to grassland (587.74 km2). The increase in forest and urban areas was primarily driven by the conversion of grassland, with 23.4 km2 transitioning to forest and 18.87 km2 to urban areas. From 2015 to 2020, the dominant land use transitions involved the conversion of cropland (357.66 km2) and desert (72.52 km2) to grassland. Over time, the magnitude of LULC transitions gradually decreased, indicating a trend toward stability in the region’s LULC patterns and ecological conditions.
From 2000 to 2020, the WRB underwent frequent LULC changes, with the dominant trend being a reduction in desert and cropland, alongside an increase in grassland, forest, urban areas, and water bodies (Table 3). The total land transfer area was 7778.83 km2, accounting for 26.27% of the total area (29,609.95 km2). The most significant transitions involved the conversion of cropland (2919.36 km2) and desert (2586.90 km2) to grassland, accounting for 52.99% and 46.96% of the total transitioned area, respectively. The expansion of forest, urban areas, and water bodies was primarily driven by conversions from grassland and cropland, with transition areas of 29.14 km2, 15.79 km2, and 61.21 km2, respectively. Grassland played the most prominent role, representing over 50% of the total transitioned area. This trend indicates that rapid urban development and large-scale afforestation were mainly achieved by utilizing grassland and cropland, closely linked to human activity. In desert regions, vegetation recovery focused primarily on grassland restoration, driven by soil moisture and environmental temperature.
Spatial heterogeneity is evident in the LULC changes across different regions of the WRB. The spatial transition map (Figure 7) indicates significant decreases in desert areas in the northwest and cropland in the southeast, with both primarily transitioning to grassland. During the land use/land cover transition in the WRB, the main transition patterns are from desert and cropland to grassland, with the largest area of desert transitioning to grassland. The area of desert-to-grassland transition accounts for 90.77% of the net desert transition area, primarily concentrated in the upper reaches of the basin, including Wushen County in Ordos, Inner Mongolia, and the northern part of Yulin, Shaanxi. The area of cropland-to-grassland transition accounts for 36.52% of the net cropland transition area, mainly concentrated in the downstream regions, such as Mizhi County and Zizhou County.

3.3. Spatial Transfer Trajectory of LULC

From 2000 to 2020, the centroid migration trajectories and the sizes of standard deviation ellipses for different land types in the WRB displayed significant variations (Figure 8). Detailed parameters for ellipses can be found in Appendix A (Table A5). The analysis of migration directions and distances (Table 4) reveals the following trends. The centroid of the cropland, originally centered in the midstream region, specifically in Hengshan County, shifted 10 m southeast before moving northwest after 2005. For forest, the centroid, located downstream in Zizhou County, generally migrated northwestward, with the fastest migration occurring between 2005 and 2010 when it reached 200 m. The continuous northwestward migration of cropland and forest suggests that the “Grain for Green” policy and forest restoration efforts gradually shifted from downstream to upstream areas. The centroid of grassland remained mostly in western Hengshan County, in the midstream region. After 2000, the large-scale conversion of desert to grassland in the northwest, together with the increasing conversion of grassland to cropland in the southeast after 2010, shifted the grassland centroid’s migration trajectory from northeast to southeast. The minimal migration of grassland, as indicated by the overlapping ellipses, results from its extensive coverage, which accounts for 78.16% of the total basin area. The centroid of water bodies generally migrated northward, with the focus shifting to western Hengshan County. The centroid of urban areas in the midstream region shifted northeastward. The slowing expansion rate of urban ellipses suggests urbanization is stabilizing. Lastly, the centroid of desert areas, located upstream in Wushen County, migrated northwestward, at the fastest rate between 2010 and 2015. The shrinking desert ellipse reflects successful desertification control through ecological restoration efforts.

3.4. Driving Factors of LULC Change in the WRB

3.4.1. Single-Factor Detector

To explore the driving mechanisms of LULC changes in the WRB, this study applies the geo-detector model to quantify the influence of various factors. The changes in LULC area are used as the dependent variable (Y), with nine influencing factors identified as the independent variables (x). The analysis of these factors, based on their explanatory power (q-value) (Figure 9), shows significant variation in their influence on LULC changes. All factors show significant correlations with LULC changes at the 0.05 confidence level.
From 2000 to 2020, the factors influencing LULC changes can be grouped into two categories: urban land changes are predominantly driven by anthropogenic factors, whereas other LULC types are mainly influenced by natural factors. Slope has the most significant influence on cropland changes (36%), followed by precipitation (27.20%) and elevation (25%). For forests, precipitation exerts the largest influence (21.70%), followed by slope (14%) and population density (10.20%). Grassland is primarily affected by precipitation (22.30%), with elevation and population density each contributing 15.50%. Water bodies are minimally influenced by both natural and anthropogenic factors, as indicated by q-values below 10%, with slope having the greatest effect (7.20%), followed by precipitation (6.10%) and population density (3.70%). Changes in barren land are primarily influenced by mean annual temperature (18.60%) and precipitation (16.50%). Urban area changes are strongly correlated with economic factors (q = 0.28) and population density (q = 0.08). Overall, except for urban land, changes in other LULC types are largely determined by geographical characteristics, with natural factors playing a dominant role in vegetation restoration relative to anthropogenic factors. This indicates that regional climate change has facilitated the effective implementation of human-driven ecological initiatives.

3.4.2. Interaction Detection

LULC changes are driven by the combined influence of multiple factors. The geo-detector model results (Figure 10) show variability in the synergistic effects of factors on LULC changes. Factor interactions generally exhibit two types of relationships: two-factor enhancement and nonlinear enhancement, while nonlinear weakening and mutual independence are not observed. This indicates that factor interactions provide greater explanatory power compared to individual factors.
From 2000 to 2020, the most significant interaction affecting cropland area changes is between slope and temperature, contributing 54.50%. This indicates that topography and temperature jointly drive changes in cropland. The interaction effect is predominantly characterized by two-factor enhancement. The interaction between slope and distance to railways follows closely, with a 52.70% contribution, implying that human activities become more influential when natural conditions are stable. For forests, the strongest interaction is between precipitation and elevation, contributing 66.10%. The interaction effects, characterized by two-factor enhancement, reflect the concentration of forests in low-altitude areas with adequate moisture. Grassland area is primarily affected by the interaction between slope and elevation, contributing 40.50%, as topography determines the regional distribution of water and thermal conditions. The interaction between precipitation and elevation significantly affects grassland, with the relationship characterized by two-factor enhancement. Waterbody changes are mainly driven by the interaction between precipitation and proximity to railways or highways, indicating the joint impact of climate and human activities. Urban areas are most affected by the interaction between population and economy, contributing 35.80%, highlighting the connection between urban expansion and socio-economic growth. In the changes of waterbody and urban areas, the interaction between any two factors is characterized by nonlinear enhancement, with no evidence of two-factor enhancement. Desertification is primarily influenced by temperature and precipitation, with their interaction contributing 40.3%, emphasizing the importance of climate conditions in desert area changes. In the changes of desert area, the interaction between precipitation and topography is characterized by two-factor enhancement. Overall, the mechanisms behind LULC changes vary by type. Elevation, slope, precipitation, and GDP consistently demonstrate strong explanatory power through their interactions with other factors, underscoring their pivotal role in shaping land use patterns in the basin.

4. Discussion

4.1. Spatiotemporal Patterns of LULC Evolution in the WRB

Years of extensive agricultural and pastoral activities in the Loess Plateau have rendered its ecosystem highly fragile, resulting in frequent environmental issues such as soil erosion and desertification [13]. Since 2000, significant environmental restoration projects have been implemented in the Loess Plateau, substantially increasing vegetation coverage. The region has transitioned from a state of “desertification” to “greening”, with notable expansions in forest and grassland areas [42,43]. From 2000 to 2020, grassland was the dominant LULC type in the WRB, located in the core area of the Loess Plateau, showing a consistent annual increase. While forest and urban areas represented a smaller proportion of the landscape, forest cover expanded more than tenfold during the study period, and urban land nearly tripled. In contrast, desert and cropland areas decreased, with negative dynamic values recorded throughout the years. The most significant reduction occurred in desert areas, primarily due to ecological restoration projects such as converting cropland to forest and grassland [44], as well as desertification control measures [45,46]. These projects have also been the primary drivers of the increase in grassland and forest areas. Changes in water body areas have been relatively minor, showing a consistent upward trend, which aligns with the LULC dynamics observed in the Yellow River Basin [47]. This indicates that climate change and human activities are collaboratively fostering positive ecological development and effectively mitigating desertification. However, LULC research results vary across different scales within the Loess Plateau. For example, in the Yan River Basin of Shaanxi Province, the dominant LULC types are cropland (18.27%), forest (9.15%), and grassland (72.02%). Between 1985 and 2020, decreases in cropland and increases in forest, respectively, while other land types showed negligible changes [14]. In the Gansu section of the Yellow River Basin, the predominant LULC types are grassland, cropland, and forest. LULC transitions primarily involve shifts among cropland, grassland, and urban areas [2]. The LULC types and distributions in the WRB, located in sandy regions, differ from those in other parts of the Loess Plateau, thereby addressing a research gap regarding LULC in sandy areas. In regions without sandy soil, LULC transitions primarily involve shifts from grassland and cropland to other land types, while sandy areas predominantly experience transitions from desert to grassland.
This variation in LULC patterns arises from differences in spatial distribution influenced by water availability, thermal conditions, and topographic features. Temperature and precipitation patterns affect LULC distribution, while topographic variations and elevation changes influence vertical vegetation growth, impacting LULC types. In the WRB, LULC transitions from desert to grassland and cropland occur predominantly in a northwest-to-southeast direction. The northwestern part of the basin, located on the southern edge of the Mu Us Desert, is characterized by higher elevations, lower annual precipitation, and higher temperatures, resulting in unstable vegetation recovery and a predominance of desert LULC types. In contrast, the central and southeastern regions, part of the Loess Hilly Region, exhibit lower elevations and more favorable water and thermal conditions, with grassland, cropland, and forest as the dominant LULC types. Regarding LULC spatial migration trajectories, different LULC types primarily shift towards the north and west, indicating that the northwestern part of the basin is a key area for ecological restoration projects. The effectiveness of vegetation recovery and the enhancement of ecosystem services in this region align with successful ecological management outcomes observed on the southern edge of the Mu Us Desert [48], where desert expansion and erosion have been effectively mitigated.

4.2. Driving Mechanisms of LULC Changes in the WRB

4.2.1. Natural Factors

The driving mechanisms behind LULC changes have been extensively researched. Both natural and human factors play pivotal roles. These mechanisms vary across different LULC types due to their distinct environmental and socio-economic conditions [49]. According to the geo-detector model’s single-factor analysis, slope, precipitation, temperature, and economic factors are identified as primary drivers of LULC changes in the WRB. Given the Loess Plateau region’s arid to semi-arid climate, climate conditions act as a decisive factor in regional vegetation development and growth [50]. Precipitation plays a crucial role in providing soil moisture, essential for plant recovery and growth. Conversely, reduced precipitation leads to higher regional temperatures and increased evapotranspiration, suppressing vegetation growth. Temperature influences LULC changes by enhancing vegetation photosynthesis and improving water use efficiency, thereby promoting ecological improvement and vegetation development. However, excessively high temperatures can lead to prolonged surface heating, posing a threat to vegetation recovery.
Climate change strongly influences the distribution of LULC types. From 2000 to 2020, the WRB experienced a trend towards “warming and moistening”, with increases in both precipitation and temperature [51]. Precipitation and temperature exhibit a northwest-to-southeast gradient, driving LULC transitions from desert to grassland and cropland. This trend aligns with studies on ecological restoration in the Loess Plateau, where vegetation recovery exceeds 60%, outperforming non-restoration areas. The northwestern sandy areas are more significantly affected by precipitation [52], making precipitation a key factor in driving LULC changes in the basin. Grassland, the dominant LULC type, showed the largest increase during land transitions. Grassland vegetation, primarily composed of Gramineae with shallow root systems, relies on natural precipitation for water supply [53]. This finding aligns with geo-detector analysis, which indicates that grassland changes are most sensitive to precipitation. Forest areas also benefit from increased precipitation, which drives the expansion of both grassland and forest. Conversely, temperature is the main factor affecting changes in desert areas. In sandy regions, insufficient water and thermal conditions impede vegetation recovery, exacerbating desertification.
In addition to meteorological factors, topographic elements such as elevation and slope significantly influence LULC changes [54]. Elevation affects LULC primarily by altering water and heat availability, influencing the vertical distribution of vegetation. At high altitudes, harsh climate conditions typically restrict vegetation growth and recovery, while lower altitudes with milder climates and fertile soils support vegetation restoration [55]. Field surveys in the WRB indicate that in the northwestern sandy areas with higher elevations, vegetation mainly comprises grasslands, concentrated in low-lying areas like river valleys and lakes. In contrast, the high-dune regions exhibit sparse vegetation. The southeastern part of the basin, characterized by lower elevations, is dominated by cropland (e.g., barley) and forested areas (e.g., coniferous forests). Slope also significantly affects LULC changes, particularly in the Loess Plateau’s steep mountainous and hilly terrain, which is shaped by complex geological structures, intense river erosion, and long-term wind erosion [56]. Steeper slopes constrain LULC changes, as different slope gradients necessitate varying LULC practices. Steeper slopes increase soil erosion risk, hinder soil conservation, and are less suitable for large-scale cultivation. Slope variability significantly influences cropland changes in the WRB, where cropland is frequently replaced by forest and grassland in steeper areas. This shift improves regional soil and water conservation, reduces soil erosion risks, and supports findings that natural vegetation restoration is effective for recovery in arid regions of northwestern China [57].

4.2.2. Human Factors

LULC changes are influenced not only by natural factors but also by anthropogenic factors, such as the expansion of cropland, conversion of farmland to forests and grasslands, and urban growth [58]. Since the 1990s, a series of national and local ecological restoration projects have been implemented in the Loess Plateau region, including the Grain-for-Green Program [59], the Three-North Shelterbelt Program [60], and the Beijing-Tianjin Sandstorm Source Control Project [61]. These initiatives have led to a continuous expansion of forest and grassland areas in the WRB, highlighting the positive role of human interventions in ecological restoration [62]. Research confirms the significant impact of human activities in driving LULC changes. For example, in northern Shaanxi, a significant reduction in cropland and an increase in forested areas are evident due to large-scale human interventions aimed at restoring forests and grasslands [63]. In the Mu Us Sand, the “forbidding grazing and rotational grazing” policy has notably improved vegetation, highlighting the role of human interventions in vegetation recovery [64]. Ecological engineering not only improves vegetation restoration and LULC dynamics but also significantly promotes economic and social development. The Grain-for-Green Program, initiated in 1999, is considered the largest ecological restoration project in a developing country, effectively mitigating land degradation while enhancing ecosystem services. By the year 2050, the Chinese government is expected to invest over $40 billion in the program. As ecological projects expand, the value of the tertiary industry in the Loess Plateau region has notably increased [65].
However, human activities also have adverse effects on LULC [66]. With increasing population density and rapid economic development, urban areas in the WRB have experienced consistent annual expansion, often at the expense of ecological resources. Urban land primarily encroaches upon grasslands and cultivated areas, illustrating the negative impact of human activities on ecosystems. The successful implementation of the Grain-for-Green policy in the Loess Plateau has largely been driven by financial subsidies, but the extension of national ecological forestry subsidies beyond the original eight-year period poses challenges to the region’s sustainable economic development [67]. Additionally, areas such as Wushen County in Inner Mongolia and Yulin City in Shaanxi Province are hotspot areas for coal mining [68], where mining activities can lead to vegetation destruction, soil erosion, and other geological hazards [69]. Under the framework of ecological restoration, the WRB should enhance the socio-economic benefits of forestry and grassland, explore multiple restoration approaches (e.g., public welfare forest construction), rationally develop land resources, and strengthen regulations in specific areas to mitigate further degradation of LULC and effectively consolidate regional ecological achievements.
In the context of ecological restoration, both natural and anthropogenic factors contribute to ecological recovery. The interaction between various factors exerts a stronger influence on LULC changes than any single factor. Natural factors are the primary drivers of the rapid and substantial expansion of forest and grassland areas in the WRB. The interaction between climate and topographic factors strongly affects cropland, forest, grassland, and desert, while water bodies and urban areas are primarily shaped by the combination of climate and human activities. This highlights the critical role of climate change in facilitating the successful implementation of ecological restoration projects.
Thus, ecological restoration efforts must be tailored to local conditions and focused on sustainable development. It is critical to carefully manage the scale of land development, balance conservation and utilization, protect the regional environment, and meet population needs to ensure sustainable regional development. In sandy regions, the restoration of natural vegetation and improvement of vegetation cover should remain priorities. In grassland areas, protective measures such as fencing, grazing bans, and controlled grazing should be employed to maintain a balance between grass and livestock, preventing overgrazing and avoiding degradation of pastureland. Urban expansion should not be achieved at the expense of cropland reduction or uncontrolled growth [70]. Maintaining a certain amount of cropland is crucial for ensuring regional food security and meeting food demand. This can be supported by developing high-quality farmland, optimizing agricultural structures, and promoting strategies like “crop-livestock integration” to enhance agricultural productivity and increase income in urban areas. In regions with lower elevation and gentler slopes, where water and heat conditions are favorable and habitat quality is high, an appropriate increase in afforestation efforts should be considered. Such efforts would enhance ecosystem structure and function while contributing to biodiversity conservation [71]. This study presents a holistic framework for land management strategies that integrates ecological, agricultural, and urban considerations. These strategies offer practical solutions for achieving long-term sustainability across diverse landscapes.

4.3. Limitations and Prospects

In the context of ecological restoration, this study focuses on the WRB to comprehensively analyze the spatiotemporal evolution of LULC and its driving factors, providing a representative case for watershed studies in the sandy regions of the Loess Plateau. Compared to previous research [72,73,74], this study delves into the trajectories of LULC transitions, addressing critical gaps in the dynamics at spatial scales. However, there are limitations in data acquisition and model parameter setting. Our analysis covered the period from 2000 to 2020, representing the key historical phase during which the areas of various LULC types in the WRB changed under the combined influence of natural and human factors. Due to limitations in the available dataset, this analysis is confined to the period up to 2020, despite potential changes in LULC beyond that year. Therefore, future research could focus on analyzing the recent spatiotemporal distribution characteristics of land use types using remote sensing data and a geographic inversion method, rather than relying solely on datasets. Meanwhile, by selecting an appropriate pixel scale for the region, the Geographical Detector model can effectively analyze influencing factors. Future efforts should focus on refining the discretization methods and the number of classes, investigating the effects of parameter variations on land area changes, and identifying optimal parameter settings. Such advancements would represent a significant technical innovation in the field.

5. Conclusions

This study is based on five periods of LULC data for the WRB from 2000 to 2020. It employs land dynamic degree, transition matrix, and centroid migration models to analyze the spatial and temporal changes in LULC and its spatial migration trajectories. Additionally, the Geographic Detector method is used to analyze the driving factors of LULC area changes caused by natural and anthropogenic factors. The findings are as follows:
(1)
The primary land use and cover types in the WRB are grassland, cropland, and desert. Ecological restoration has led to a reduction in cropland (from 6428.73 km2 in 2000 to 5394.56 km2 in 2020), while grassland increased significantly (from 66.50% to 78.16%) and desert areas diminished substantially (from 3338.62 km2 to 743.18 km2). Forest and urban areas showed steady growth, and water bodies fluctuated slightly. The land dynamic degree ranked as follows: forest > desert > urban > water > cropland > grassland, with the overall dynamic degree fluctuating over time.
(2)
LULC types in the basin follow a northwest to southeast gradient of desert, grassland, and cropland. Key changes include the conversion of desert and cropland into grassland, with forest, urban, and water areas primarily expanding from grassland. LULC centroids shifted west and north, with the greatest migration observed for forest and desert areas. As ecological restoration progressed, the extent of centroid migration decreased, approaching stability.
(3)
Natural factors, particularly slope and precipitation, are the main drivers of LULC changes, excluding urban land, where economic factors and population density dominate. Climate change provides favorable conditions for ecological restoration. Dual-factor interactions have greater explanatory power than individual factors, showing enhanced or nonlinear effects. The strongest interactions are: slope and temperature for cropland (54.50%), precipitation and elevation for forest (66.10%), slope and elevation for grassland (40.50%), precipitation and proximity to railways for water areas (24.80%), population and economic factors for urban areas (35.80%), and temperature and precipitation for desert areas (40.30%).

Author Contributions

J.X. and Y.F. conceived the idea. T.S., M.N. and Y.Y. carried out all the analyses. T.S. wrote and reviewed the paper. All authors have read and agreed to the published version of the manuscript.

Funding

This study was funded by the National Natural Science Foundation of China (42001023). The authors appreciate the anonymous reviewers for their constructive comments and suggestions.

Institutional Review Board Statement

Not applicable.

Informed Consent Statement

Not applicable.

Data Availability Statement

The data presented in this study are available on request from the corresponding author.

Acknowledgments

The authors would like to express their sincere thanks to the anonymous reviewers because their comments and suggestions were of great help in improving the quality of this paper.

Conflicts of Interest

The authors declare no conflicts of interest.

Appendix A

Land transfer, standard deviation ellipse, and center of gravity migration trajectory.
Table A1. Land transfer from 2000 to 2005 (unit: km2).
LULCCroplandForestGrasslandWaterUrbanDesertSumRoll Out
Cropland4990.760.051424.563.3311.060.206429.961439.20
Forest0.062.520.050.000.000.002.630.11
Grassland957.160.1418,476.807.4710.86236.2419,688.671211.87
Water2.030.002.8853.230.580.0058.725.49
Urban0.040.000.062.0788.030.0090.202.17
Desert3.930.001006.322.972.422324.123339.761015.64
Sum5953.982.7120,910.6769.07112.952560.5629,609.94-
Roll in963.220.192433.8715.8424.92236.44--
Table A2. Land transfer from 2005 to 2010 (unit: km2).
LULCCroplandForestGrasslandWaterUrbanDesertSumRoll Out
Cropland5156.500.28782.102.2912.790.025953.98797.48
Forest0.012.700.000.000.000.002.710.01
Grassland1171.943.6419,616.804.6317.0996.5720,910.671293.87
Water5.740.012.0159.631.280.4069.079.44
Urban0.020.000.000.97111.960.00112.950.99
Desert2.760.001099.860.282.791454.872560.561105.69
Sum6336.976.6321,500.7767.80145.911551.8629,609.94-
Roll in1180.473.931883.978.1733.9596.99--
Table A3. Land transfer from 2010 to 2015 (unit: km2).
LULCCroplandForestGrasslandWaterUrbanDesertSumRoll Out
Cropland4863.513.841450.569.079.940.056336.971473.46
Forest0.016.620.000.000.000.006.630.01
Grassland862.8223.4020,535.388.3018.8752.0021,500.77965.39
Water4.420.021.1361.530.660.0467.806.27
Urban0.000.000.001.84144.070.00145.911.84
Desert17.620.00755.270.433.34775.201551.86776.66
Sum5748.3833.8822,742.3481.17176.88827.2929,609.94-
Roll in884.8727.262206.9619.6432.8152.09--
Table A4. Land transfer from 2015 to 2020 (unit: km2).
LULCCroplandForestGrasslandWaterUrbanDesertSumRoll Out
Cropland4571.330.721166.841.677.710.115748.381177.05
Forest1.9831.880.020.000.000.0033.882.00
Grassland809.184.2221,737.832.9324.74163.4422,742.341004.51
Water3.220.012.2673.401.101.1881.177.77
Urban0.000.000.020.56176.300.00176.880.58
Desert9.640.00235.960.202.45579.04827.29248.25
Sum5395.3536.8323,142.9378.76212.30743.7729,609.94-
Roll in824.024.951405.105.3636.00164.73--
Table A5. Migration parameter of land-use type from 2000 to 2020.
Major Axis/kmMinor Axis/kmAzimuth Angle/°XYArea/km2
Cropland
200080.71 59.74 99.14 109.49 37.7815,147.86
200581.13 60.63 100.85 109.50 37.7815,451.65
201079.99 60.78 98.07 109.46 37.8015,273.06
201576.83 63.72 97.58 109.38 37.8815,379.64
202074.05 63.95 94.96 109.34 37.9314,876.33
Forest
200073.94 18.84 91.34 110.07 37.404374.89
200578.56 24.42 91.71 110.02 37.406024.65
201065.88 29.58 88.94 109.82 37.436121.04
201563.60 42.71 91.92 109.66 37.478533.61
202065.72 37.80 87.34 109.70 37.467802.63
Grassland
200074.02 69.53 11.22 109.25 37.9616,166.90
200573.96 68.89 14.81 109.25 37.9616,006.56
201074.39 68.86 10.93 109.25 37.9816,092.91
201575.04 70.58 0.73 109.27 37.9716,635.89
202075.43 71.24 174.96 109.28 37.9516,881.73
Water
200080.52 61.01 56.57 109.21 37.9115,432.70
200579.35 63.30 50.02 109.21 37.9615,777.66
201081.89 59.27 47.01 109.17 37.9615,363.22
201580.58 53.60 42.74 109.14 37.9713,569.27
202081.89 50.45 42.29 109.14 37.97 12,977.41
Urban
200060.70 52.99 63.43 109.60 37.88 10,104.59
200559.93 56.58 65.31 109.61 37.90 10,653.02
201059.29 58.84 18.97 109.61 37.94 10,958.69
201560.47 57.16 176.97 109.63 37.98 10,857.03
202060.90 55.78 2.28 109.63 38.02 10,671.81
Desert
200067.99 43.64 40.63 109.10 38.33 9321.25
200568.58 40.78 43.47 109.04 38.36 8785.30
201067.85 38.00 46.34 108.98 38.42 8099.30
201562.80 34.40 42.85 108.92 38.46 6786.98
202067.04 32.75 41.26 108.86 38.42 6897.45

References

  1. Mas, J.F.; Kolb, M.; Paegelow, M.; Camacho Olmedo, M.T.; Houet, T. Inductive pattern-based land use/cover change models: A comparison of four software packages. Environ. Model. Softw. 2014, 51, 94–111. [Google Scholar] [CrossRef]
  2. Zhang, T. Temporal and Spatial Evolution of Land Use in Gansu Section of The Yellow River Basin and Analysis of Driving Forces. Acad. J. Sci. Technol. 2023, 4, 88–93. [Google Scholar] [CrossRef]
  3. Krause, A.; Haverd, V.; Poulter, B.; Anthoni, P.; Quesada, B.; Rammig, A.; Arneth, A. Multimodel Analysis of Future Land Use and Climate Change Impacts on Ecosystem Functioning. Earth’s Future 2019, 7, 833–851. [Google Scholar] [CrossRef]
  4. Froese, R.; Schilling, J. The Nexus of Climate Change, Land Use, and Conflicts. Curr. Clim. Change Rep. 2019, 5, 24–35. [Google Scholar] [CrossRef]
  5. Cheng, Z.; Zhang, Y.; Wang, L.; Wei, L.; Wu, X. An Analysis of Land-Use Conflict Potential Based on the Perspective of Production–Living–Ecological Function. Sustainability 2022, 14, 5936. [Google Scholar] [CrossRef]
  6. Yao, Z.; Zhang, L.; Tang, S.; Li, X.; Hao, T. The basic characteristics and spatial patterns of global cultivated land change since the 1980s. J. Geogr. Sci. 2017, 27, 771–785. [Google Scholar] [CrossRef]
  7. Borrelli, P.; Robinson, D.A.; Fleischer, L.R.; Lugato, E.; Ballabio, C.; Alewell, C.; Meusburger, K.; Modugno, S.; Schütt, B.; Ferro, V.; et al. An assessment of the global impact of 21st century land use change on soil erosion. Nat. Commun. 2017, 8, 2013. [Google Scholar] [CrossRef]
  8. Feng, X.; Fu, B.; Lu, N.; Zeng, Y.; Wu, B. How ecological restoration alters ecosystem services: An analysis of carbon sequestration in China’s Loess Plateau. Sci. Rep. 2013, 3, 2846. [Google Scholar] [CrossRef]
  9. Li, G.; Sun, S.; Han, J.; Yan, J.; Liu, W.; Wei, Y.; Lu, N.; Sun, Y. Impacts of Chinese Grain for Green program and climate change on vegetation in the Loess Plateau during 1982–2015. Sci. Total Environ. 2019, 660, 177–187. [Google Scholar] [CrossRef]
  10. Piao, S.; Yin, G.; Tan, J.; Cheng, L.; Huang, M.; Li, Y.; Liu, R.; Mao, J.; Myneni, R.B.; Peng, S.; et al. Detection and attribution of vegetation greening trend in China over the last 30 years. Glob. Change Biol. 2015, 21, 1601–1609. [Google Scholar] [CrossRef]
  11. Crouzeilles, R.; Ferreira, M.S.; Chazdon, R.L.; Lindenmayer, D.B.; Sansevero, J.B.B.; Monteiro, L.; Iribarrem, A.; Latawiec, A.E.; Strassburg, B.B.N. Ecological restoration success is higher for natural regeneration than for active restoration in tropical forests. Sci. Adv. 2017, 3, 1701345. [Google Scholar] [CrossRef] [PubMed]
  12. Luo, Y.; Lü, Y.; Fu, B.; Zhang, Q.; Li, T.; Hu, W.; Comber, A. Half century change of interactions among ecosystem services driven by ecological restoration: Quantification and policy implications at a watershed scale in the Chinese Loess Plateau. Sci. Total Environ. 2019, 651, 2546–2557. [Google Scholar] [CrossRef] [PubMed]
  13. Zhou, X.; Zhou, Y. Spatio-Temporal Variation and Driving Forces of Land-Use Change from 1980 to 2020 in Loess Plateau of Northern Shaanxi, China. Land 2021, 10, 982. [Google Scholar] [CrossRef]
  14. Zhou, J.; Gao, P.; Wu, C.; Mu, X. Analysis of Land Use Change Characteristics and Its Driving Forces in the Loess Plateau: A Case Study in the Yan River Basin. Land 2023, 12, 1653. [Google Scholar] [CrossRef]
  15. Zhao, A.; Zhang, A.; Lu, C.; Wang, D.; Wang, H.; Liu, H. Spatiotemporal variation of vegetation coverage before and after implementation of Grain for Green Program in Loess Plateau, China. Ecol. Eng. 2017, 104, 13–22. [Google Scholar] [CrossRef]
  16. Mao, S.; Shangguan, Z. Evolution of spatiotemporal patterns in vegetation net primary productivity and the driving forces on the Loess Plateau. Front. Environ. Sci. 2023, 11, 1134917. [Google Scholar] [CrossRef]
  17. Liu, X.; Zhang, Y. Landscape Analysis of Runoff and Sedimentation Based on Land Use/Cover Change in Two Typical Watersheds on the Loess Plateau, China. Life 2022, 12, 1688. [Google Scholar] [CrossRef]
  18. Hu, B.; Li, Z.; Wu, H.; Han, H.; Cheng, X.; Kang, F. Coupling strength of human-natural systems mediates the response of ecosystem services to land use change. J. Environ. Manag. 2023, 344, 118521. [Google Scholar] [CrossRef]
  19. Hu, Y.; Gao, M.; Batunacun. Evaluations of water yield and soil erosion in the Shaanxi-Gansu Loess Plateau under different land use and climate change scenarios. Environ. Dev. 2020, 34, 100488. [Google Scholar] [CrossRef]
  20. Zhang, J.; Qu, M.; Wang, C.; Zhao, J.; Cao, Y. Quantifying landscape pattern and ecosystem service value changes: A case study at the county level in the Chinese Loess Plateau. Glob. Ecol. Conserv. 2020, 23, 01110. [Google Scholar] [CrossRef]
  21. Zhang, X.; Liu, Y.; Wang, Y.; Yuan, X. Interactive relationship and zoning management between county urbanization and ecosystem services in the Loess Plateau. Ecol. Indic. 2023, 156, 111021. [Google Scholar] [CrossRef]
  22. Chang, S.; Dai, Z.Z.; Wang, X.; Zhu, Z.Y.; Feng, Y.Z. Landscape pattern identification and ecological risk assessment employing land use dynamics on the Loess Plateau. Agronomy 2023, 13, 2247. [Google Scholar] [CrossRef]
  23. Wen, X.; Wang, J.; Han, X. Impact of land use evolution on the value of ecosystem services in the returned farmland area of the Loess Plateau in northern Shaanxi. Ecol. Indic. 2024, 163, 112119. [Google Scholar] [CrossRef]
  24. Xiong, M.; Li, F.; Liu, X.; Liu, J.; Luo, X.; Xing, L.; Wang, R.; Li, H.; Guo, F. Characterization of Ecosystem Services and Their Trade-Off and Synergistic Relationships under Different Land-Use Scenarios on the Loess Plateau. Land 2023, 12, 2087. [Google Scholar] [CrossRef]
  25. Huang, T.; Liu, Y.; Wu, Z.; Xiao, P.; Wang, J.; Sun, P. Quantitative analysis of runoff alteration based on the Budyko model with time-varying underlying surface parameters for the Wuding River Basin, Loess Plateau. Ecol. Indic. 2024, 158, 111377. [Google Scholar] [CrossRef]
  26. Chen, Y.; Zhang, P.; Zhao, Y.; Qu, L.; Du, P.; Wang, Y. Factors affecting runoff and sediment load changes in the Wuding River basin from 1960 to 2020. Hydrology 2022, 9, 198. [Google Scholar] [CrossRef]
  27. Zeng, Y.; Yu, Q.; Wang, X.; Ma, J.; Xu, C.; Qiu, S.; Liu, W.; Wang, F. Research on the Relationship between the Structure of Forest and Grass Ecological Spaces and Ecological Service Capacity: A Case Study of the Wuding River Basin. Remote Sens. 2023, 15, 2456. [Google Scholar] [CrossRef]
  28. Yang, J.; Huang, X. The 30 m annual land cover dataset and its dynamics in China from 1990 to 2019. Earth Syst. Sci. Data 2021, 13, 3907–3925. [Google Scholar] [CrossRef]
  29. Shao, W.; Zhang, Z.; Guan, Q.; Yan, Y.; Zhang, J. Comprehensive assessment of land degradation in the arid and semiarid area based on the optimal land degradation index model. Catena 2024, 234, 107563. [Google Scholar] [CrossRef]
  30. Wang, Y.; Jiang, R.; Yang, M.; Xie, J.; Zhao, Y.; Li, F.; Lu, X. Spatiotemporal characteristics and driving mechanisms of land use/land cover (LULC) changes in the Jinghe River Basin, China. J. Arid Land 2024, 16, 91–109. [Google Scholar] [CrossRef]
  31. Wei, Z.; Du, N.; Yu, W. Land use change and its driving factors in the ecological function area: A case study in the Hedong Region of the Gansu Province, China. J. Arid Land 2024, 16, 71–90. [Google Scholar] [CrossRef]
  32. Jiang, P.; Cheng, L.; Li, M.; Zhao, R.; Duan, Y. Impacts of LUCC on soil properties in the riparian zones of desert oasis with remote sensing data: A case study of the middle Heihe River basin, China. Sci. Total Environ. 2015, 506–507, 259–271. [Google Scholar] [CrossRef] [PubMed]
  33. Zhang, S.; Zhang, H.; Gu, X.; Liu, J.; Yin, Z.; Sun, Q.; Wei, Z.; Pan, Y. Monitoring the Spatio-Temporal Changes of Non-Cultivated Land via Long-Time Series Remote Sensing Images in Xinghua. IEEE Access 2022, 10, 84518–84534. [Google Scholar] [CrossRef]
  34. Lee, J.; Yin, X.; Zhu, H.; Zheng, X. Geographical Detector-Based Research of Spatiotemporal Evolution and Driving Factors of Oasification and Desertification in Manas River Basin, China. Land 2023, 12, 1487. [Google Scholar] [CrossRef]
  35. Long, H.; Qu, Y. Land use transitions and land management: A mutual feedback perspective. Land Use Policy 2018, 74, 111–120. [Google Scholar] [CrossRef]
  36. Chen, D.; Zhang, F.; Jim, C.Y.; Bahtebay, J. Spatio-temporal evolution of landscape patterns in an oasis city. Environ. Sci. Pollut. Res. 2023, 30, 3872–3886. [Google Scholar] [CrossRef]
  37. Zhang, X.; Deng, Y.; Hou, M.; Yao, S. Response of Land Use Change to the Grain for Green Program and Its Driving Forces in the Loess Hilly-Gully Region. Land 2021, 10, 194. [Google Scholar] [CrossRef]
  38. Xu, Y.; Hao, S.; Cui, Y.; Li, P.; Sheng, L.; Liao, C. Analysis of the spatiotemporal expansion and pattern evolution of urban areas in Anhui Province, China, based on nighttime light data. Ecol. Indic. 2023, 157, 111283. [Google Scholar] [CrossRef]
  39. Meng, X.; Gao, X.; Lei, J.; Li, S. Development of a multiscale discretization method for the geographical detector model. Int. J. Geogr. Inf. Sci. 2021, 35, 1650–1675. [Google Scholar] [CrossRef]
  40. Shang, S.; Cui, T.; Wang, Y.; Gao, Q.; Liu, Y. Dynamic variation and driving mechanisms of land use change from 1980 to 2020 in the lower reaches of the Yangtze River, China. Front. Environ. Sci. 2024, 11, 1335624. [Google Scholar] [CrossRef]
  41. Wang, J.F.; Zhang, T.L.; Fu, B.J. A measure of spatial stratified heterogeneity. Ecol. Indic. 2016, 67, 250–256. [Google Scholar] [CrossRef]
  42. Bai, R.; Wang, X.; Li, J.; Yang, F.; Shangguan, Z.; Deng, L. The impact of vegetation reconstruction on soil erosion in the Loess plateau. J. Environ. Manag. 2024, 363, 121382. [Google Scholar] [CrossRef] [PubMed]
  43. Song, X.; Xie, P.; Sun, W.; Mu, X.; Gao, P. The greening of vegetation on the Loess Plateau has resulted in a northward shift of the vegetation greenness line. Glob. Planet. Change 2024, 237, 104440. [Google Scholar] [CrossRef]
  44. Wang, J.; Peng, J.; Zhao, M.; Liu, Y.; Chen, Y. Significant trade-off for the impact of Grain-for-Green Programme on ecosystem services in North-western Yunnan, China. Sci. Total Environ. 2017, 574, 57–64. [Google Scholar] [CrossRef] [PubMed]
  45. Wang, N.; Xie, J.; Han, J.; Luo, L. A comprehensive framework on land-water resources development in Mu Us Sandy Land. Land Use Policy 2014, 40, 69–73. [Google Scholar] [CrossRef]
  46. Wang, Z.; Zhang, T.; Pei, C.; Zhao, X.; Li, Y.; Hu, S.; Bu, C.; Zhang, Q. Multisource Remote Sensing Monitoring and Analysis of the Driving Forces of Vegetation Restoration in the Mu Us Sandy Land. Land 2022, 11, 1553. [Google Scholar] [CrossRef]
  47. Fu, C.; Liu, Y.; Chen, Y.; Li, F.; Huang, J.; Huang, H. Simulation of Land Use Change and Habitat Quality in the Yellow River Basin under Multiple Scenarios. Water 2022, 14, 3767. [Google Scholar] [CrossRef]
  48. Tong, S.; Ma, Y. Evaluation of Ecological Vulnerability of Yulin City under the Background of Returning Farmland to Forests. IOP Conf. Ser. Mater. Sci. Eng. 2020, 768, 052127. [Google Scholar] [CrossRef]
  49. He, J.; Shi, X.; Fu, Y.; Yuan, Y. Evaluation and simulation of the impact of land use change on ecosystem services trade-offs in ecological restoration areas, China. Land Use Policy 2020, 99, 105020. [Google Scholar] [CrossRef]
  50. Bai, Y.; Zhu, Y.; Liu, Y.; Wang, S. Vegetation greening and its response to a warmer and wetter climate in the yellow river basin from 2000 to 2020. Remote Sens. 2024, 16, 790. [Google Scholar] [CrossRef]
  51. Ru, X.; Song, H.; Xia, H.; Zhai, S.; Wang, Y.; Min, R.; Zhang, H.; Qiao, L. Effects of Land Use and Land Cover Change on Temperature in Summer over the Yellow River Basin, China. Remote Sens. 2022, 14, 4352. [Google Scholar] [CrossRef]
  52. Li, S.; Liang, W.; Fu, B.; Lü, Y.; Fu, S.; Wang, S.; Su, H. Vegetation changes in recent large-scale ecological restoration projects and subsequent impact on water resources in China’s Loess Plateau. Sci. Total Environ. 2016, 569–570, 1032–1039. [Google Scholar] [CrossRef] [PubMed]
  53. Li, D.; An, L.; Zhong, S.; Shen, L.; Wu, S. Declining coupling between vegetation and drought over the past three decades. Glob. Change Biol. 2024, 30, 17141. [Google Scholar] [CrossRef] [PubMed]
  54. Gao, Y.; Fu, S.; Cui, H.; Cao, Q.; Wang, Z.; Zhang, Z.; Wu, Q.; Qiao, J. Identifying the spatio-temporal pattern of drought characteristics and its constraint factors in the Yellow River Basin. Ecol. Indic. 2023, 154, 110753. [Google Scholar] [CrossRef]
  55. Xu, M.; Li, X.; Liu, M.; Shi, Y.; Zhou, H.; Zhang, B.; Yan, J. Spatial variation patterns of plant herbaceous community response to warming along latitudinal and altitudinal gradients in mountainous forests of the Loess Plateau, China. Environ. Exp. Bot. 2020, 172, 103983. [Google Scholar] [CrossRef]
  56. Wu, Q.; Jiang, X.; Shi, X.; Zhang, Y.; Liu, Y.; Cai, W. Spatiotemporal evolution characteristics of soil erosion and its driving mechanisms-a case Study: Loess Plateau, China. Catena 2024, 242, 108075. [Google Scholar] [CrossRef]
  57. Shao, W.; Guan, Q.; Tan, Z.; Luo, H.; Li, H.; Sun, Y.; Ma, Y. Application of BP-ANN model in evaluation of soil quality in the arid area, northwest China. Soil Tillage Res. 2021, 208, 104907. [Google Scholar] [CrossRef]
  58. Tong, S.; Zhang, J.; Ha, S.; Lai, Q.; Ma, Q. Dynamics of Fractional Vegetation Coverage and Its Relationship with Climate and Human Activities in Inner Mongolia, China. Remote Sens. 2016, 8, 776. [Google Scholar] [CrossRef]
  59. Liu, Y.F.; Liu, Y.; Shi, Z.H.; López Vicente, M.; Wu, G.L. Effectiveness of re-vegetated forest and grassland on soil erosion control in the semi-arid Loess Plateau. Catena 2020, 195, 104787. [Google Scholar] [CrossRef]
  60. Li, Y.; Cao, Z.; Long, H.; Liu, Y.; Li, W. Dynamic analysis of ecological environment combined with land cover and NDVI changes and implications for sustainable urban–rural development: The case of Mu Us Sandy Land, China. J. Clean. Prod. 2017, 142, 697–715. [Google Scholar] [CrossRef]
  61. Li, C.; Gao, Z.; Sun, B.; Wu, J.; Wang, H.; Ding, X. Ecological restoration effects of the Beijing–Tianjin Sandstorm Source Control Project in China since 2000. Ecol. Indic. 2023, 146, 109782. [Google Scholar] [CrossRef]
  62. Yu, L.; Wu, Z.; Du, Z.; Zhang, H.; Liu, Y. Insights on the roles of climate and human activities to vegetation degradation and restoration in Beijing-Tianjin sandstorm source region. Ecol. Eng. 2021, 159, 106105. [Google Scholar] [CrossRef]
  63. Wen, X.; Wang, J.; Han, X.; Ma, L. Where Are the Trade-Offs in Multiple Ecosystem Services in the Process of Ecological Restoration? A Case Study on the Vegetation Restoration Area in the Loess Plateau, Northern Shaanxi. Land 2024, 13, 70. [Google Scholar] [CrossRef]
  64. Zhang, Q.; Jia, B.; Li, T.; Li, W. Research on the sustainability of “greening” process in the Mu Us Sandy Land based on the spatiotemporal stability of ecological land. PLoS ONE 2024, 19, 0292469. [Google Scholar] [CrossRef]
  65. Zhao, H.; He, H.; Wang, J.; Bai, C.; Zhang, C. Vegetation Restoration and Its Environmental Effects on the Loess Plateau. Sustainability 2018, 10, 4676. [Google Scholar] [CrossRef]
  66. Yang, S.; Liu, J.; Wang, C.; Zhang, T.; Dong, X.; Liu, Y. Vegetation dynamics influenced by climate change and human activities in the Hanjiang River Basin, central China. Ecol. Indic. 2022, 145, 109586. [Google Scholar] [CrossRef]
  67. Olawumi, T.O.; Chan, D.W.M. A scientometric review of global research on sustainability and sustainable development. J. Clean. Prod. 2018, 183, 231–250. [Google Scholar] [CrossRef]
  68. Sun, S. Study on the Restoration and Control of Yulin Landscape, Forest, Field, Lake and Grass System. Acad. J. Sci. Technol. 2023, 5, 41–43. [Google Scholar] [CrossRef]
  69. Zhang, X.; Liu, K.; Wang, S.; Wu, T.; Li, X.; Wang, J.; Wang, D.; Zhu, H.; Tan, C.; Ji, Y. Spatiotemporal evolution of ecological vulnerability in the Yellow River Basin under ecological restoration initiatives. Ecol. Indic. 2022, 135, 108586. [Google Scholar] [CrossRef]
  70. Lan, J.; Chai, Z.; Tang, X.; Wang, X. Landscape Ecological Risk Assessment and Driving Force Analysis of the Heihe River Basin in the Zhangye Area of China. Water 2023, 15, 3588. [Google Scholar] [CrossRef]
  71. Wang, C.; Yu, C.; Chen, T.; Feng, Z.; Hu, Y.; Wu, K. Can the establishment of ecological security patterns improve ecological protection? An example of Nanchang, China. Sci. Total Environ. 2020, 740, 140051. [Google Scholar] [CrossRef]
  72. Chi, W.; Wang, Y.; Lou, Y.; Na, Y.; Luo, Q. Effect of Land Use/Cover Change on Soil Wind Erosion in the Yellow River Basin since the 1990s. Sustainability 2022, 14, 12930. [Google Scholar] [CrossRef]
  73. Du, L.; Dong, C.; Kang, X.; Qian, X.; Gu, L. Spatiotemporal evolution of land cover changes and landscape ecological risk assessment in the Yellow River Basin, 2015–2020. J. Environ. Manag. 2023, 332, 117149. [Google Scholar] [CrossRef] [PubMed]
  74. Ji, Q.; Liang, W.; Fu, B.; Zhang, W.; Yan, J.; Lü, Y.; Yue, C.; Jin, Z.; Lan, Z.; Li, S.; et al. Mapping Land Use/Cover Dynamics of the Yellow River Basin from 1986 to 2018 Supported by Google Earth Engine. Remote Sens. 2021, 13, 1299. [Google Scholar] [CrossRef]
Figure 1. Geographical location (a), county distribution, and elevation (b).
Sustainability 16 10453 g001
Figure 2. Ecological protection policy of WRB.
Sustainability 16 10453 g002
Figure 3. Spatial distribution of driving factors. (a): slope; (b): distance from river; (c): temperature; (d): precipitation; (e): population; (f): GDP; (g): distance from road; (h): distance from railways.
Sustainability 16 10453 g003
Figure 4. Spatial distribution of LULC (ae) from 2000 to 2020.
Sustainability 16 10453 g004
Figure 5. Area (a) and dynamic index (b) of LULC from 2000 to 2020.
Sustainability 16 10453 g005
Figure 6. Land transfer from 2000 to 2020.
Sustainability 16 10453 g006
Figure 7. Land map from 2000 to 2020 (1: Cropland; 2: Forest; 3: Grassland; 4: Water; 5: Urban; 6: Desert. For example, 12 indicates the conversion from cropland to forest, 13 indicates the conversion from cropland to grassland, and so forth for other combinations. The blank areas represent regions where no land use change occurred).
Sustainability 16 10453 g007
Figure 8. Center of gravity transfer locus of LULC from 2000 to 2020.
Sustainability 16 10453 g008
Figure 9. Single factor of LULC from 2000 to 2020 (ELV, elevation; SLP, slope; DRI, distance to rivers; TEM, annual average temperature; PRE, annual precipitation; PD, population density; GDP, Gross Domestic Product; DRO, distance to road; DRA, distance to railway).
Sustainability 16 10453 g009
Figure 10. Two-factor interaction of LULC from 2000 to 2020. (Two-factor enhancements marked with ▲ in the figure, the rest are non-linear enhancements) (ELV, elevation; SLP, slope; DRI, distance to rivers; TEM, annual average temperature; PRE, annual precipitation; PD, population density; GDP, Gross Domestic Product; DRO, distance to road; DRA, distance to railway).
Sustainability 16 10453 g010
Table 1. Data sources in this paper.
TypeFactorResolutionData Source
Natural factorsElevation30 mGeospatial Data Cloud (https://www.gscloud.cn/)
Slope30 m
Distance to the river30 m
Annual average temperature1 kmResource and Environmental Science Data Platform (https://www.resdc.cn/)
Annual precipitation1 km
Human factorsPopulation density1 km
GDP1 km
Distance to the main road1 kmOpenStreetMap
(https://www.openstreetmap.org/)
Distance to the railway1 km
Table 2. Types of factor interactions.
Typeq Value
Nonlinear weakeningq(X1∩X2) < min (q(X1), q(X2))
Single factor nonlinear weakeningmin (q(X1), q(X2)) < q(X1∩X2) < max (q(X1), q(X2))
Two-factor enhancementq(X1∩X2) > max (q(X1), q(X2))
Nonlinear enhancementq(X1∩X2) > q(X1) + q(X2)
Independenceq(X1∩X2) = q(X1) + q(X2)
Table 3. Land transfer from 2000 to 2020 (unit: km2).
2020CroplandForestGrasslandWaterUrbanDesertSumRoll Out
2000
Cropland3443.935.012919.3613.8145.951.896429.962986.03
Forest0.042.480.110.000.000.002.630.15
Grassland1828.7829.1417,633.9515.7961.21119.8019,688.672054.72
Water10.270.132.4642.992.570.3058.7215.73
Urban0.850.000.143.2485.980.0090.214.23
Desert111.510.042586.902.9616.57621.773339.762717.99
Sum5395.3736.8123,142.9378.79212.28743.7629,609.95-
Roll in1951.4434.335508.9735.80126.30122.00--
Table 4. Distance (km) and direction of the center of gravity transfer.
Type2000–20052005–20102010–20152015–2020
DirectionDistanceDirectionDistanceDirectionDistanceDirectionDistance
CroplandSE0.01NW0.04NW0.11NW0.06
ForestNW0.05NW0.20NW0.16NW0.04
GrasslandNE0.00NE0.02SE0.02SE0.02
WaterNE0.05NW0.04NW0.03NE0.00
UrbanNE0.02NE0.04NE0.04NE0.04
DesertNW0.06NW0.08NW0.07SW0.07
N: North; S: South; W: West; E: East.
Disclaimer/Publisher’s Note: The statements, opinions and data contained in all publications are solely those of the individual author(s) and contributor(s) and not of MDPI and/or the editor(s). MDPI and/or the editor(s) disclaim responsibility for any injury to people or property resulting from any ideas, methods, instructions or products referred to in the content.

