Article

Spatial-Temporal Evolution of Carbon Sequestration and Emission Reduction Capacity of Agricultural Cultivation in Different Functional Grain Areas

School of Earth Sciences and Spatial Information Engineering, Hunan University of Science and Technology, Xiangtan 411201, China
*
Author to whom correspondence should be addressed.
Sustainability 2024, 16(23), 10455; https://doi.org/10.3390/su162310455
Submission received: 14 October 2024 / Revised: 16 November 2024 / Accepted: 27 November 2024 / Published: 28 November 2024

Abstract

:
The capacity of agricultural cultivation for carbon sequestration and emission reduction plays a key role in advancing the green and sustainable development of agriculture and achieving both emission reduction and carbon sink objectives. This study constructs an index for agricultural carbon sequestration and emission reduction capacity using spatial autocorrelation analysis, Theil index, and kernel density estimation, to thoroughly explore spatiotemporal changes and regional differences in carbon sequestration and emission reduction capacity across China and its different grain functional areas. Major findings include: (1) From 2000 to 2020, China’s agricultural carbon sequestration and emission reduction capacity exhibited a fluctuating upward trend, consistent in grain main production areas, while production–consumption and main marketing areas showed a fluctuating decline. (2) From 2000 to 2020, positive spatial correlation in carbon sequestration and emission reduction capacity increased at both national and regional levels, particularly in the main production and production–consumption areas, while the main consumption areas demonstrated a trend toward negative correlation. (3) The Theil index of China’s agricultural carbon sequestration and emission reduction capacity showed an overall fluctuating increase, with interregional differences contributing over 54%, significantly surpassing intra-regional contributions. Moreover, the main producing regions are the main source of the overall national variance. (4) Kernel density analysis highlights that there are significant differences in the distribution and evolution of carbon sequestration and emission reduction capacity among different grain functional areas, and the overall development is unbalanced. Therefore, each region needs to formulate tailored measures to improve agricultural carbon sequestration efficiency, promote regional sustainable development, and achieve carbon reduction goals.

1. Introduction

Agricultural cultivation, as a basic industry supporting the national economy and guaranteeing national grain security, is both a source of carbon emissions from agriculture and an important carbon sink. Choosing agricultural cultivation to sequester carbon and reduce emissions not only provides an effective way to reduce agricultural carbon emissions but also injects a new impetus into the green and sustainable development of agriculture. It is regarded as one of the key strategies to promote Chinese agriculture to achieve the goal of carbon neutrality. The carbon sequestration and emission reduction capacity of agricultural planting refers to the ratio of the sum of the carbon absorbed by crops through photosynthesis and the carbon fixed by farmland soil in the process of agricultural planting divided by the ratio of the input of agricultural materials to the carbon produced by the crops themselves. In recent years, China has actively taken measures to reduce carbon emissions, but greenhouse gas emissions from agricultural sources still account for 24% of the national total [1]. As a major agricultural country, China’s issues in agricultural planting carbon sequestration and emission reduction require in-depth research and resolution. The 2022 Government Work Report explicitly put forward the requirement to “promote the green development of agriculture”, and in the same year, the Ministry of Agriculture and Rural Affairs and the National Development and Reform Commission issued the Implementation Plan for Emission Reduction and Carbon Sequestration in Agriculture and Rural Areas. This puts forward agricultural emission reduction and carbon sequestration targets, work priorities, and implementation paths at the national and regional levels, indicating that the promotion of carbon sequestration and emission reduction in agricultural cultivation is an intrinsic requirement for realizing the green development of agriculture and promoting the enhancement of the quality and efficiency of agriculture.
Presently, research on carbon sequestration and emission reduction in agriculture mainly focuses on the measurement of agricultural carbon sources/sinks, spatial and temporal patterns of carbon sources/sinks and influencing factors, as well as pathways of carbon sequestration and emission reduction in agriculture and compensation mechanisms. In the measurement of agricultural carbon sources/sinks, existing studies mainly utilize carbon emission coefficients to estimate carbon emissions by combining various carbon emission sources. For example, Asumadu-Sarkodie and Owusu [2] estimated carbon emissions from agricultural land in Ghana based on the emission coefficient method, and concluded that fertilizer application and straw burning would promote agricultural carbon emissions. Goglio et al. [3] measured agricultural carbon emissions from agricultural material inputs, agricultural machinery energy consumption, and rice growth. Grace et al. [4], Just C et al. [5], and Don A et al. [6] measured carbon sequestration in agricultural soils, but were less involved in carbon sequestration in crops. Shang J et al. [7] measured the carbon emissions from Chinese agriculture in 1993–2011 based on the emission coefficient method, and He et al. [8] measured the carbon emissions from agriculture in China’s main grain-producing areas in terms of agricultural material inputs, crop cultivation, animal ruminants, etc. Yang et al. [9] estimated the Chinese agricultural carbon sink potential in 1993–2011 and concluded that agricultural carbon sinks contribute to agricultural economic development. In addition, Tian et al. [10] re-measured China’s agricultural carbon emissions from 2005 to 2019 and analyzed the current characteristics of China’s agricultural carbon emissions.
In terms of the spatial and temporal patterns, influencing factors, and dynamic evolution of agricultural carbon sources/sinks, some scholars have studied agricultural carbon sources/sinks at the national, regional, provincial, and county scales. He et al. [11] and Wang et al. [12] used the dynamic gray correlation method and the LMDI decomposition model to explore the spatiotemporal pattern of China’s agricultural carbon emissions in 2001–2016 as well as the carbon sources and sinks of farmland in Henan Province in 2010–2020, along with their influencing factors, and found that crop yields are an important factor that affects carbon sequestration. Cui et al. [13], Wu et al. [14], and Zhang et al. [15] explored the dynamic evolution of agricultural carbon emissions (or carbon intensity) and its regional differences based on the kernel density function and spatial autocorrelation methods. They found that China’s agricultural carbon emissions were spatially non-equilibrated, generally showing a pattern of high emissions in the central–eastern part of the country and low emissions in the western part of the country. In addition, the provincial agricultural carbon emissions demonstrated high–high and low–low agglomeration.
In terms of agricultural sequestration carbon emission reduction paths and compensation mechanisms, Lessmann et al. [16], Gao et al. [17], and Li et al. [18] analyzed the carbon emission reduction potential and compensation mechanisms of agriculture based on the crop carbon sink function. Zhang et al. [19] and Cai et al. [20] used the spatial panel stochastic frontier production function to estimate the carbon emission reduction potential of agricultural cultivation based on the absolute and conditional convergence, analyzing the path and mode of agricultural carbon emission reduction in China. Additionally, Yan et al. [21] explored the farmland emission reduction and carbon sequestration pathway of assisted carbon neutrality based on statistical data after comparatively analyzing the carbon emissions from crop production in various regions.
In summary, existing research primarily uses the emission coefficient method to assess agricultural carbon emissions, revealing the impact of agricultural cultivation on carbon emissions and its spatial variations, with a particular emphasis on the importance of agricultural inputs and crop yields for carbon absorption. In addition, these studies have explored pathways and compensation mechanisms for agricultural carbon emission reduction, providing scientific support for green and sustainable agricultural development and carbon neutrality, but there is still potential for further improvement and expansion. First, the existing literature mainly focuses on the spatial and temporal characteristics of the overall carbon emissions from agriculture or the net carbon sink of arable land and the potential for carbon compensation [22,23,24,25], while relatively few studies have incorporated the carbon sources and sinks of agricultural cultivation into the same framework from the overall agricultural sector, especially the dynamic evolution of carbon sequestration and emission reduction from agricultural cultivation is seldom involved. Second, from the perspective of research scale, most of the existing literature focuses on the national, typical regional, provincial, and county levels [26,27,28,29,30]. Although some scholars have also explored the equity, dynamic evolution, and driving effects of agricultural carbon emissions in China’s main grain-producing areas [31], there are not many studies on the spatial and temporal patterns and regional differences of carbon sequestration and emission reductions in agricultural cultivation from different grain functional areas (main producing areas, main marketing areas, and production and marketing balance areas). In this paper, based on measuring the carbon sources/sinks of agricultural cultivation in China’s provincial areas in 2000–2020, we constructed a carbon sequestration emission reduction index and utilized spatial autocorrelation, Theil’s index, and kernel density estimation to explore the spatial and temporal characteristics of carbon sequestration and emission reduction in agricultural cultivation in different grain functional areas, as well as regional differences and dynamic evolution. We thus contribute to the advancement of China’s agricultural low-carbon transition and the formulation of a “dual-carbon” agricultural policy, and provide a scientific basis for realizing green transformation and sustainable development in the agricultural sector.

2. Materials and Methods
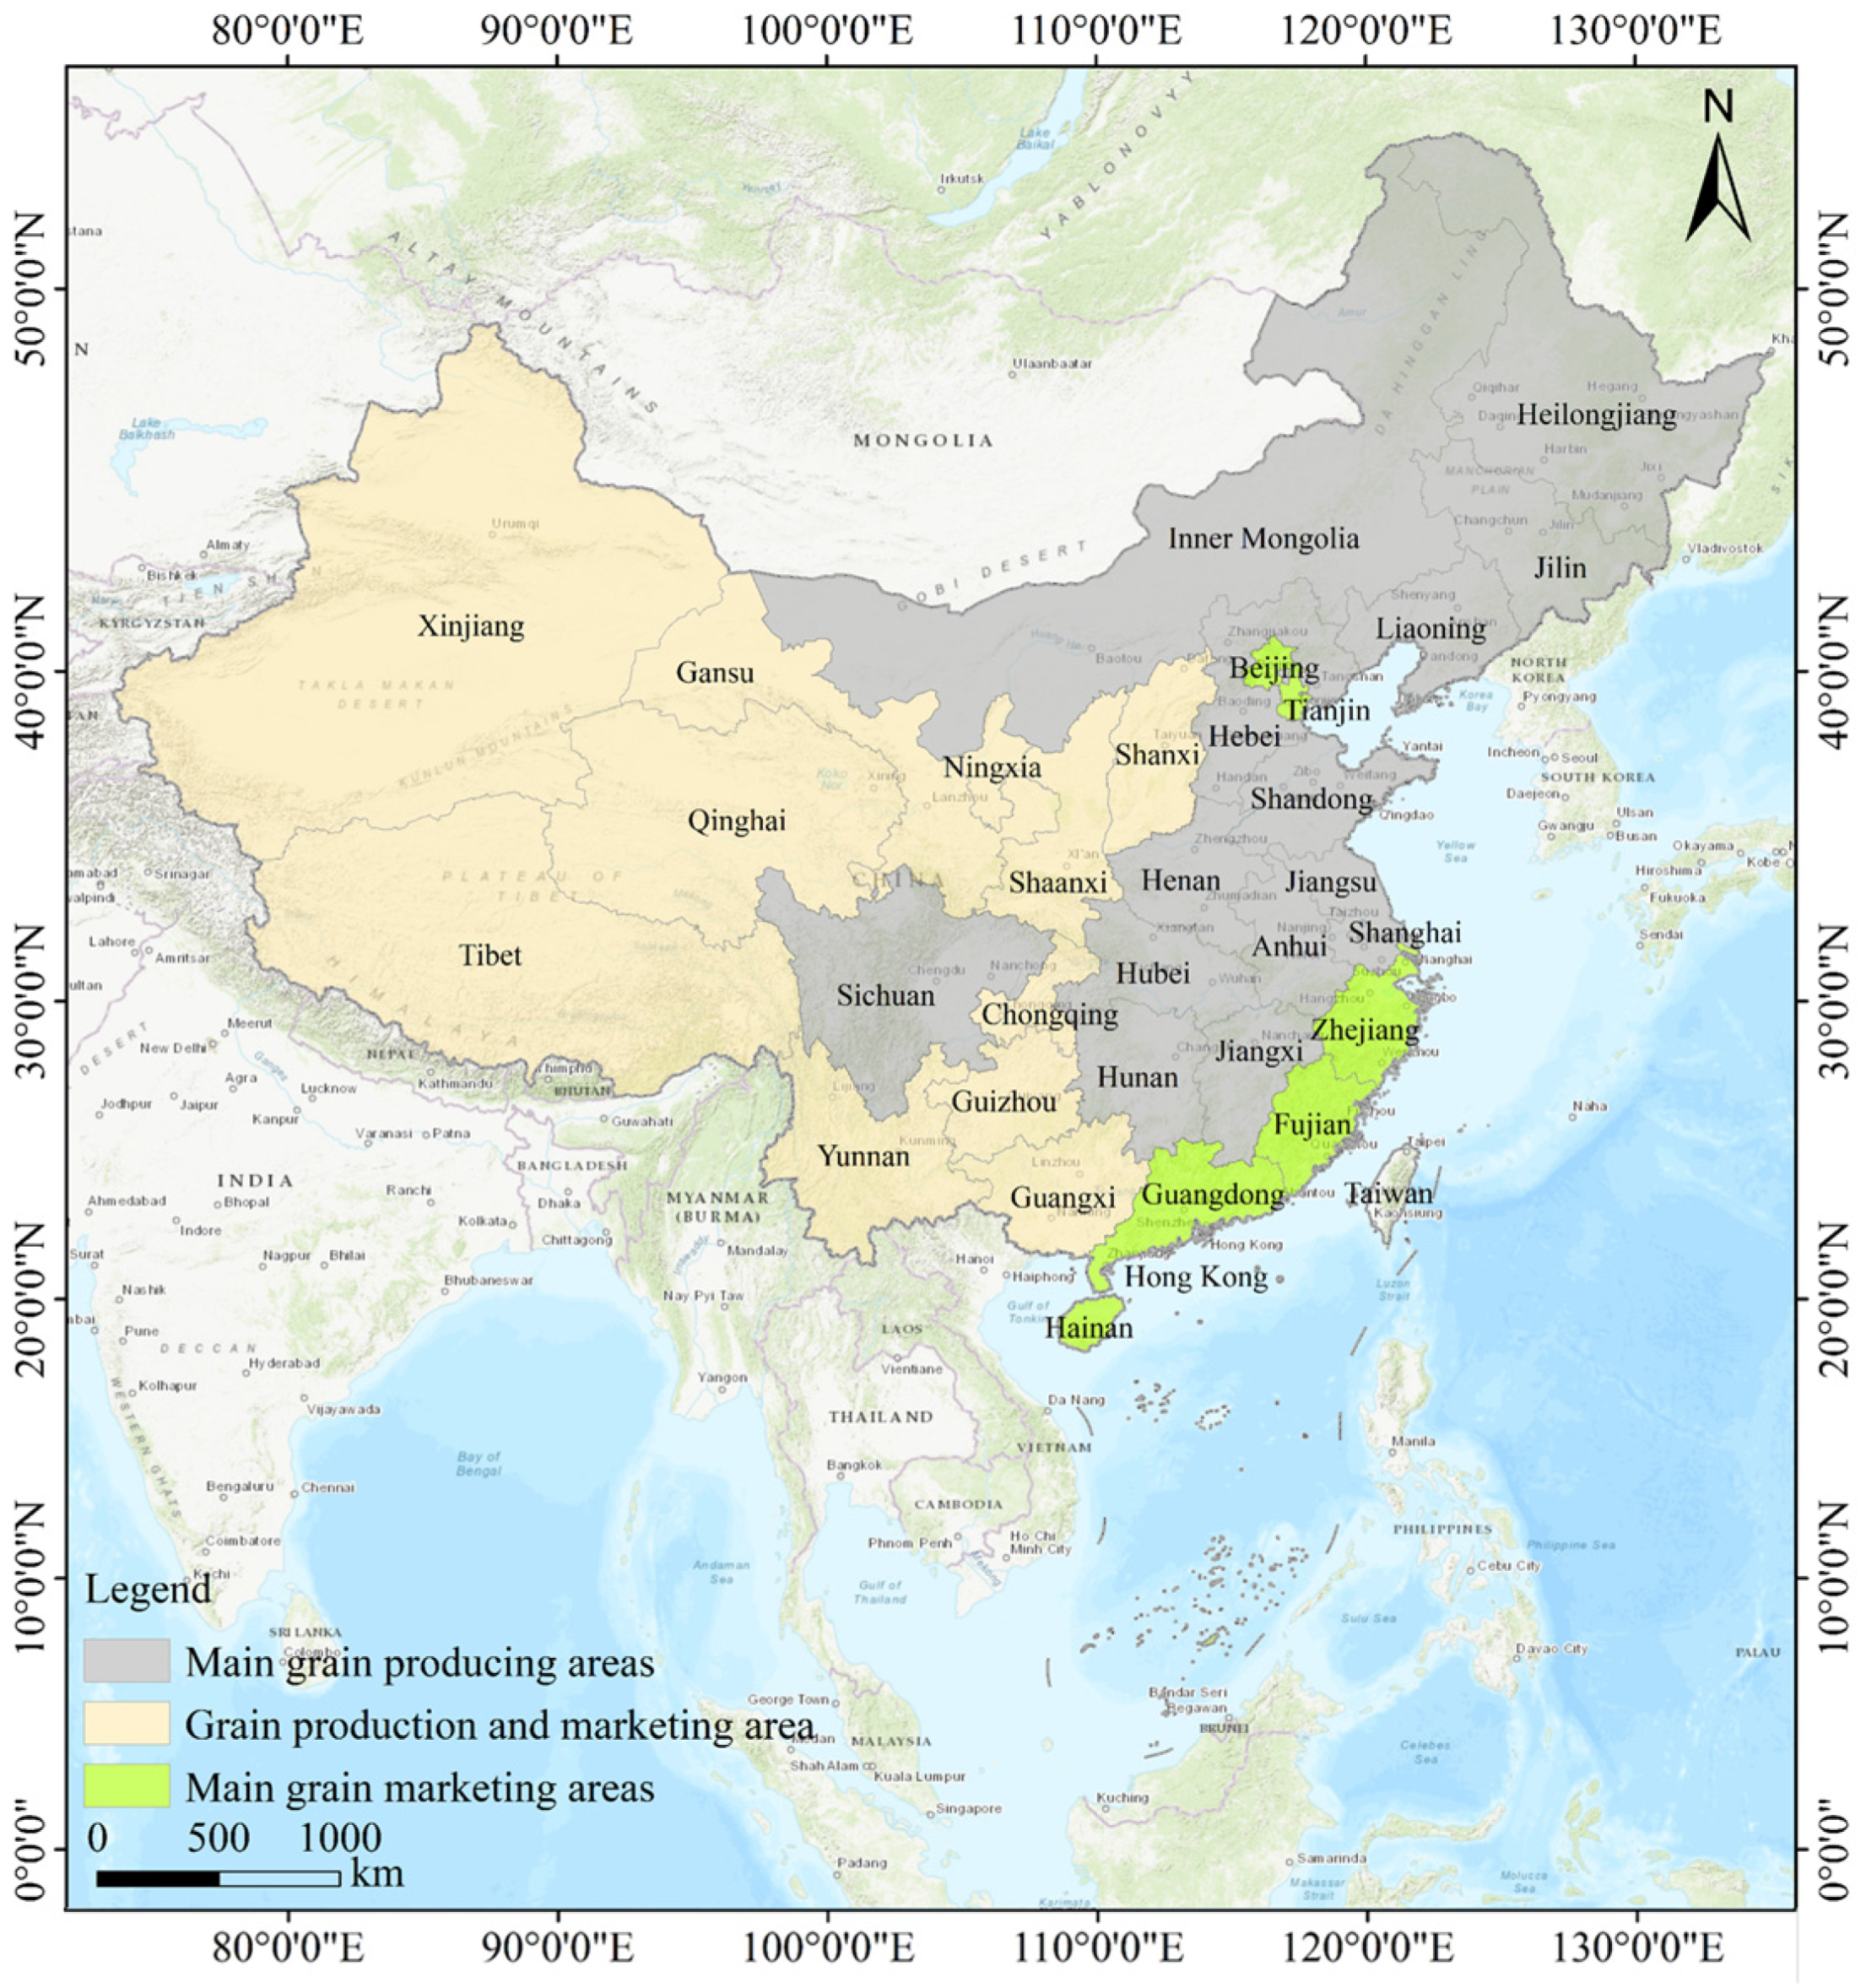
2.1. Study Area

According to the Guiding Opinions on the Establishment of Functional Grain-Producing Areas and Important Agricultural Product Production Protection Areas, issued by the State Council in 2017, based on the economic conditions, agricultural cultivation level, and resource endowment of provinces (autonomous regions and municipalities directly under the central government), as well as the situation of grain production and consumption, mainland China is divided into the main grain-producing areas, the main grain marketing areas, and balanced production and marketing areas (Figure 1). Among them, the main grain-producing areas are located in the central and northeastern parts of China, and the provincial areas are mostly characterized by a suitable temperate monsoon climate and fertile black and loess soils. Thus, in addition to achieving self-sufficiency, grain production can also be supplied to other regions, and the economic scale effect is obvious. The production and marketing balance areas are mainly located in the northwestern and southwestern parts of China, and are constrained by natural factors such as mountains, hills, and climate, with relatively fragmented land, diverse climates, and low soil fertility. As a result, food production in these areas is only self-sufficient and makes a limited contribution to national food production. The main grain marketing areas are mainly concentrated in the relatively economically developed coastal areas, where urbanization and industrialization are accelerating and the area of arable land has been drastically reduced. The reality of a large number of people and a small amount of land has led to a large gap between grain production and demand.

2.2. Data Sources

Taking the provinces in mainland China as the basic unit, the fertilizers, pesticides, agricultural films, diesel fuel usage, effective irrigated area, sown area of grain crops and grain crop production, etc. required for calculating carbon sequestration and emission reduction in agricultural cultivation were obtained from the China Rural Statistical Yearbook, the China Statistical Yearbook, and data from statistical yearbooks and bulletins of each province from 2001 to 2021. Considering the availability of data, this study excludes Hong Kong, Macao, and Taiwan. The missing data from individual provinces are interpolated and supplemented by the smoothing method, which is mainly the amount of agricultural film and diesel fuel used in Xinjiang and Hainan provinces in 2001 and 2005, and the amount of agricultural film used in Gansu province in 2002 and 2006. In addition, provincial administrative division vector data were obtained from the national 1:1 million basic geographic information dataset (https://www.webmap.cn (accessed on 18 March 2024)).

2.3. Methodology

2.3.1. Characterization of the Carbon Sequestration and Emission Reduction Capacity of Agricultural Cultivation

Considering that the difference between carbon absorption and carbon emission in the process of agricultural cultivation exists positively or negatively, and taking into account the convenience of subsequent analysis, this paper adopts the ratio of carbon absorbed by crops and fixed in the soil to that produced by agricultural material inputs and crop growth to characterize the capacity of carbon sequestration and emission reduction in agricultural cultivation. The specific calculation formulas are as follows:
F = C T + C s o i l E C O 2 + E N 2 0 + E C H 4
In this formula, F is the index of carbon sequestration and emission reduction ability of agricultural planting. F > 1 indicates that the carbon sequestration and emission reduction in agricultural planting is mainly based on carbon sinks, and the larger the value is, the stronger the carbon sequestration and emission reduction ability; F < 1 indicates that the carbon sequestration and emission reduction in agricultural planting is mainly based on carbon source, and the smaller the value is, the weaker the carbon sequestration and emission reduction ability is; F = 1 indicates that the carbon emission and carbon absorption of agricultural planting are equal to each other, i.e., in a carbon-neutral state. C T and C s o i l are the carbon absorbed by grain crops and fixed by farmland soil, respectively; E C O 2 is the carbon emission produced by agricultural materials; E N 2 O is the emission of N2O from farmland; and E C H 4 is the emission of CH4 from rice. For comparison, this paper refers to the 100-year level of Warming Potential in the Fifth Assessment Report of the IPCC, and uniformly converts C, CH4, and N2O to CO2 equivalent, with conversion factors of 44/12, 25, and 298, respectively.
(1) Estimation of carbon emissions from agricultural cultivation
As can be seen from Equation (1), carbon emissions during agricultural cultivation include three components: carbon emissions from agricultural material inputs ( E C O 2 ), N2O emissions from crops (spring wheat, winter wheat, and maize) ( E N 2 O ), and CH4 emissions from rice ( E C H 4 ) (carbon emissions from soil respiration will be taken into account in the calculation of soil carbon sinks). Of these, E C O 2 is calculated as follows:
E c o 2 = Σ ( T i × α i ) + A i r × g + G s × j + S i × h
where T i is the use of agricultural fertilizers, pesticides, and agricultural films; α i is the carbon emission coefficient of fertilizers, pesticides, and agricultural films; A i r is the irrigated area of farmland; g is the carbon emission coefficient of farmland irrigation; G s is the diesel fuel consumption of agricultural machinery; j is the carbon emission coefficient of mechanical diesel fuel; S i is the area of farmland tilling; and h is the carbon emission coefficient of farmland tilling. The carbon emission coefficients of each type of agricultural material are shown in Table 1.
The carbon equivalent of CH4 emissions from rice cultivation is calculated as:
E C H 4 = S r × E F r × 25
In the formula, E C H 4 is the carbon equivalent of CH4 emission from rice cultivation; S r is the area of rice cultivation; E F r is the emission factor of CH4 of rice (taking the value of 236.7 kg/hm2); and 25 is the conversion coefficient of CH4 to CO2. The carbon equivalent of N2O emission from other major grain crops was calculated as:
E N 2 O = B i × β i × 298
where E N 2 O is the carbon equivalent of N2O emission from grain crop cultivation; B i is the cultivated area of grain crops (spring wheat, winter wheat, and maize); β i is the emission coefficient of N2O for the corresponding grain crops (0.40 kg/hm2, 1.75 kg/hm2, and 2.53 kg/hm2 for spring wheat, winter wheat, and maize, respectively) [33]; and 298 is the conversion factor of N2O to CO2.
(2) Estimation of carbon sinks from agricultural cultivation
The carbon sink of agricultural cultivation mainly includes two aspects: carbon absorbed by grain crops and carbon fixed by farmland soil. The carbon absorbed by grain crops mainly refers to the CO2 fixed by photosynthesis during the growth of rice, wheat, corn, etc. The specific calculation formula [34] is as follows:
C T = P i = B i Y i ( 1 W i ) ( 1 + R i ) L i
where C T is the total carbon uptake of grain crops; P i is the carbon uptake of i grain crops; B i , Y i , W i , L i , and R i are the carbon uptake rate, economic yield, water content, root–crown ratio, and economic coefficient of i crops, respectively. Referring to the research results of Luo, H.L. [35], and Han et al. [36], the values of carbon uptake rate, economic coefficient, water content, and root–crown ratio of three major grain crops are shown in Table 2.
Soil carbon sequestration in agricultural fields refers to the process in which carbon absorbed, transformed, and stored by grain crops from the atmosphere enters the soil in the form of root secretions, dead root systems, or residues, and is converted into soil organic matter and stored in the soil under the action of microorganisms. Since the formation of soil organic matter and soil respiration are simultaneous, soil carbon sequestration in this paper refers to the net carbon sequestration of the soil after eliminating soil respiration, which is calculated as follows:
C s o i l = F s o i l × A
where C s o i l is the amount of carbon sequestered in farmland soil; F s o i l is the rate of carbon sequestration in farmland soil, taking the average value of 0.892 t/(hm2∙a1) [37]; and A is the area of cultivated land.

2.3.2. Spatial Correlation Analysis

To explore whether there are overall spatial autocorrelation and local aggregation characteristics (i.e., the degree of correlation between a certain spatial unit and the neighboring units) in carbon sequestration emission reduction from agricultural cultivation, this paper selects the global Moran index ( I G ) and the local Moran index ( I i ) to measure carbon sequestration emission reduction from agricultural cultivation. The specific calculation formulas are as follows:
I G = n i = 1 n j = 1 n W i j x i x ¯ x j x ¯ i = 1 n j = 1 n W i j i = 1 n x i x ¯ 2
I i = n x i x ¯ x i x ¯ 2 i = 1 n w i j ( x j x ¯ )
where x i and x j are the carbon sequestration emission reduction indices of spatial units i and j , respectively; x ¯ is the average value of carbon sequestration emission reduction indices of the whole study area; and w i j is the weight of spatial units i and j . If there is a common boundary between the units, it takes 1, and if vice versa, it takes 0; n is the number of spatial units; and the value of I G varies in [−1, 1]. I G > 0 indicates that carbon sequestration emission reduction in the study area is positively correlated, I G < 0 indicates negatively correlated, and I G = 0 indicates no correlation. I i > 0 indicates that the spatial unit has a similar carbon sequestration and emission reduction capacity to the neighboring spatial units of agricultural cultivation (i.e., high–high aggregation or low–low aggregation), and I i < 0 indicates that the spatial unit has a different carbon sequestration and emission reduction capacity to the neighboring spatial units, which means that it forms a high–low aggregation or a low–high aggregation [38].

2.3.3. Theil Index

The Theil index is one of the classic methods for measuring regional differences. Its greatest advantage is that it can decompose the overall differences of multiple regions into intra-regional and inter-regional differences and reveal the direction and extent of changes in intra-regional and inter-regional differences, as well as their respective contributions to the overall differences, to identify the main sources of the overall differences. Usually, Theil’s index varies between 0 and ~1, and the closer its value is to 1, the larger the regional differences; the closer its value is to 0, the smaller the regional differences. This paper draws on the Theil index analysis method to decompose the overall difference in the carbon sequestration and emission reduction capacity of Chinese agricultural cultivation into the inter-regional and intra-regional differences (i.e., differences among provinces) among the three major grain functional areas (main grain-production areas, production and marketing areas, and main marketing areas) according to the idea of “country-grain functional area-provincial area”. This is expressed by the formula:
T p = T W + T B = j ( Y j Y ) T w i + T B
T w i = i ( Y j i Y j ) l n ( Y j i / Y j X j i / X j )
T B = j ( Y j Y ) l n ( Y j / Y X j / X )
where T p is the overall Theil index of carbon sequestration and emission reduction capacity of agricultural cultivation; T W and T B are Theil indices reflecting intra-regional and inter-regional differences, respectively; T w i is the Theil index of carbon sequestration and emission reduction in each province in the region; Y j is the carbon sink of agricultural cultivation in region j ; Y is the carbon sink of agricultural cultivation in the whole country; Y j i is the carbon sink of agricultural cultivation in province i in region j ; X j i is the carbon emission from agricultural cultivation in province i of district j ; X j is the carbon emission from agricultural cultivation in district j ; and j is the carbon emission from agricultural cultivation in the whole country. To reveal the extent to which inter-zone differences and intra-zone differences contribute to the overall differences, the ratios of T W and T B to the overall Theil index T p are utilized to express them, respectively.

2.3.4. Kernel Density Estimation

To quantify the non-equilibrium dynamic evolution of the carbon sequestration and emission reduction capacity of agricultural cultivation at the national scale and in different functional grain areas, this paper adopts the kernel density estimation method to elucidate it. Assuming that the kernel density function of random variable x is f( x ), the probability density at point x can be expressed as:
f x = 1 N h i = 1 n k x i x ¯ h
where N is the number of provinces in the study area; x i is the independent and homogeneous distribution of carbon sequestration emission reduction capacity of province i in the study area; x ¯ represents the average value of carbon sequestration emission reduction capacity of each province in the study area; h is the bandwidth, i.e., the width of the surface extended spatially with x as the source point, and h is directly determined by the degree of smoothing of the kernel density estimation (generally determined through the selection of multiple values of h in the test, and in this paper, we selected the automatic bandwidth of the data). k ( · ) is the kernel density function, and a Gaussian kernel function is usually chosen for density estimation.

3. Results

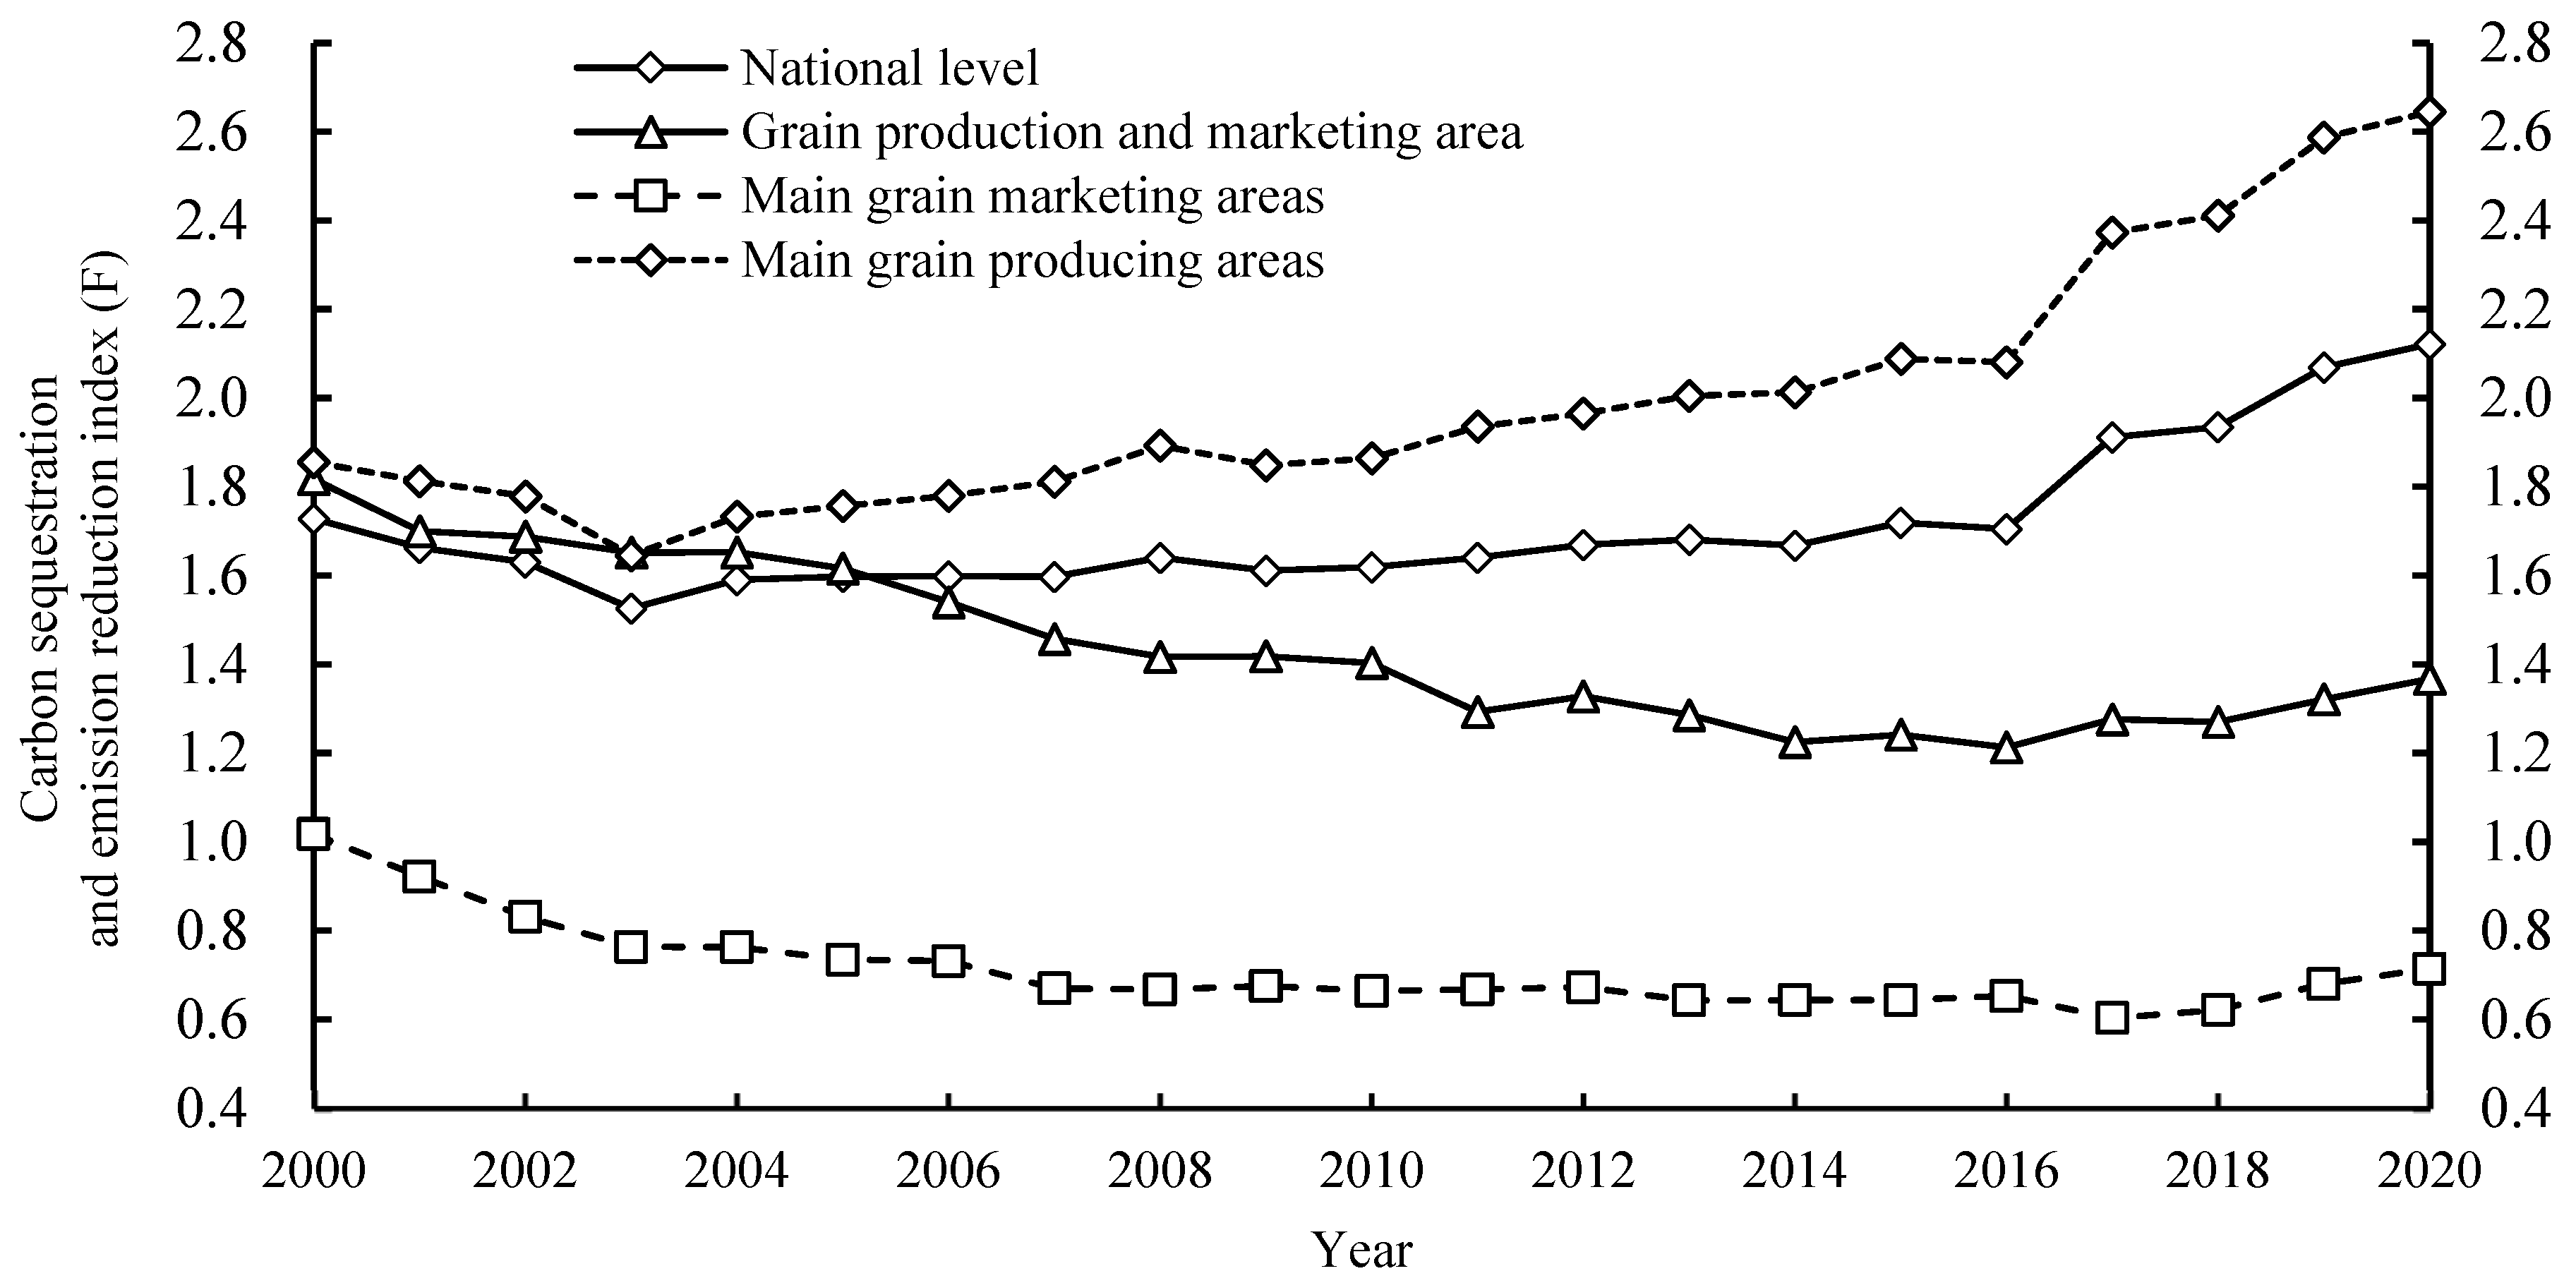
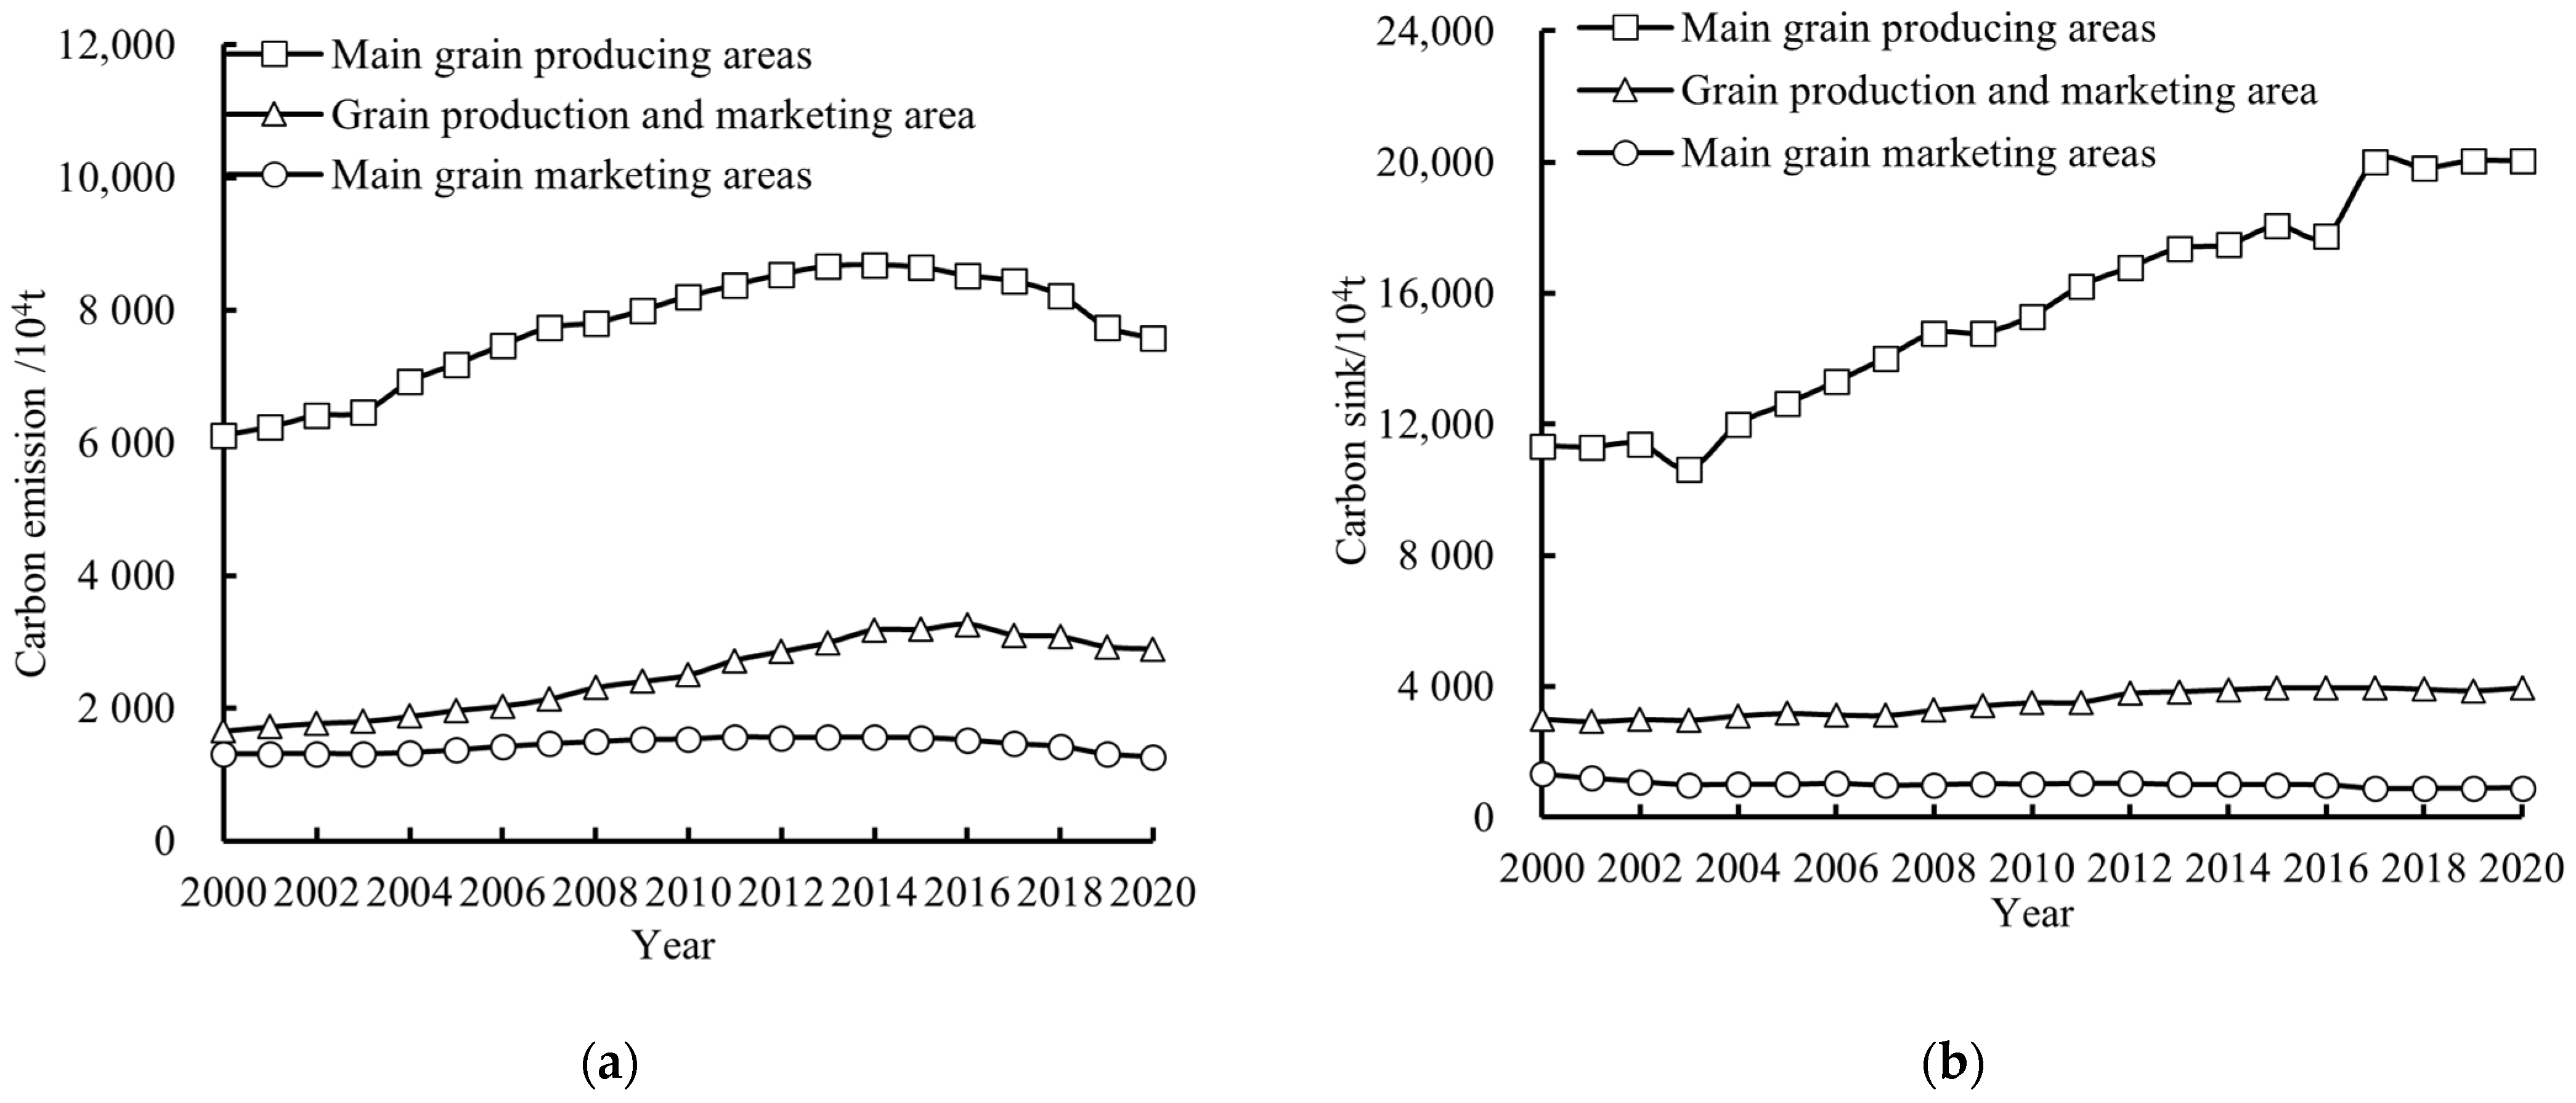
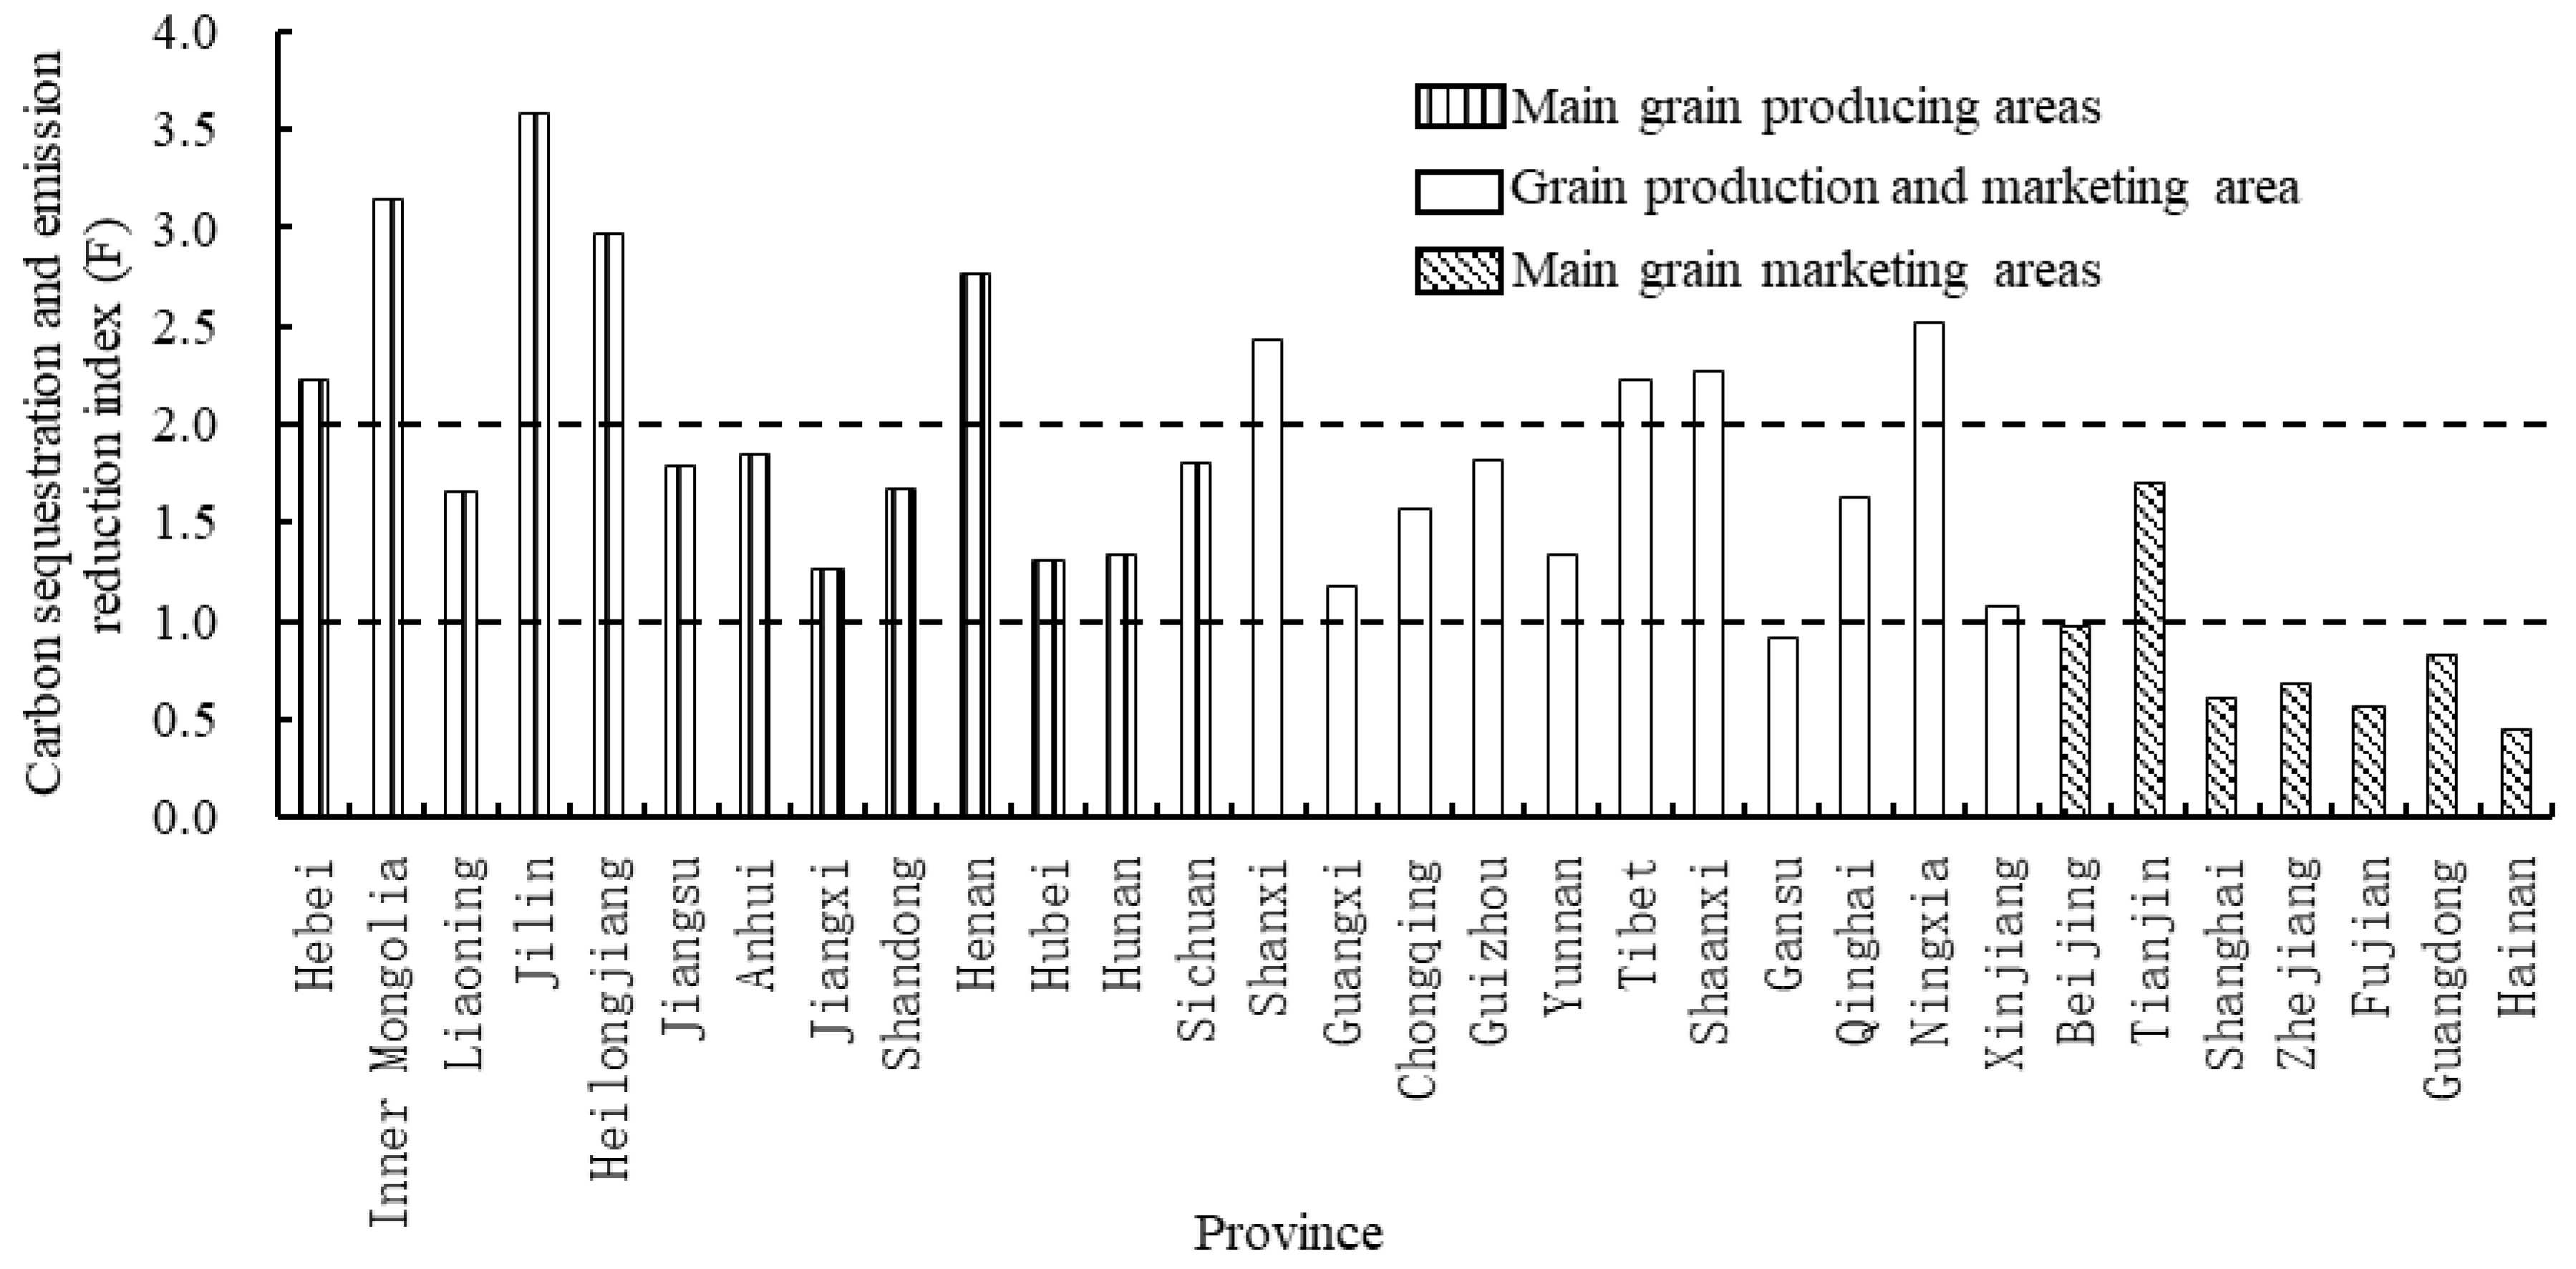
3.1. Spatial and Temporal Changes in Carbon Sequestration and Emission Reduction Capacity of Agricultural Cultivation

Figure 2 shows that the carbon sequestration and emission reduction capacity of Chinese agricultural cultivation in 2000–2020 (expressed as the average value of each province) showed an overall fluctuating upward trend over time. The carbon sequestration and emission reduction capacity (F-value) increased from 1.73 in 2000 to 2.12 in 2020, with an average annual increase of 1.19%, and the F-value of each year is far > 1.0. This indicates that the effect of carbon sequestration and emission reduction by agricultural cultivation is remarkable, and the level of low-carbon development of agriculture is constantly improving. The substantial increase in carbon sinks from agricultural cultivation is the main reason for the significant rise in Chinese agricultural cultivation’s carbon sequestration and emission reduction capacity [39]. According to the estimation, the carbon sink of Chinese agricultural cultivation increased from 1.57 × 10⁸ t in 2000 to 2.49 × 10⁸ t in 2020, while the carbon emission from agricultural cultivation only increased from 0.91 × 10⁸ t to 1.17 × 10⁸ t during the same period, with the former increase being 1.7 to 2.1 times greater than the latter. Specifically, China’s carbon sequestration and emission reduction capacity has gone through three stages: “rapid decline, slow rise, and rapid rise”.
The first stage (2000–2003) is the stage of declining carbon sequestration and emission reduction capacity. In this stage, the large input of agricultural materials and the expansion of rice planting areas [15], which were incentivized by the policy of “two reliefs and three subsidies”, led to an increase in carbon emissions from agricultural cultivation from 0.91 × 10⁸ t in 2000 to 0.96 × 10⁸ t in 2003, with an average annual growth rate of 1.83%. Meanwhile, the sequestration of carbon sequestration in agricultural cultivation decreased from 1.57 × 10⁸ t to 1.46 × 10⁸ t during the same period. Absorption decreased from 1.57 × 10⁸ t to 1.46 × 10⁸ t, with an average annual decrease of 2.34%. The decrease in carbon sinks and increase in carbon emissions thus led to a rapid decrease in sequestration emission reduction capacity from 1.73 to 1.53.
The second stage (2004–2015) is the slow enhancement stage. During this period, although the average annual growth rate of agricultural cultivation carbon sinks amounted to 3.90% (i.e., from 1.61 × 10⁸ t in 2004 to 2.30 × 10⁸ t in 2015), the increase in agricultural material inputs and the expansion of the scale of rice cultivation due to the stimulation of agricultural cultivation policies that benefited the agricultural sector (e.g., the abolition of the agricultural tax) led to the high annual growth rate of agricultural cultivation carbon emissions in China. This reached an average rate of 2.92% and peaked in 2014 (1.34 × 10⁸ t). This led to a slow increase in the carbon sequestration and emission reduction capacity of agricultural cultivation, with an average annual growth rate of only 1.18%.
The third stage (2016–2020) is the stage of rapid increase in carbon sequestration and emission reduction capacity. During this period, the national implementation of the “one control, two reductions” emission reduction policy and the transformation and upgrading of agriculture, the increase in agricultural science and technology inputs, and the integration of the concept of green development of agriculture greatly improved the utilization efficiency of agricultural materials. The high inputs, consumption, and emissions of arable land were effectively controlled [22], the carbon emissions of agricultural cultivation fell from 1.33 × 10⁸ t to 1.17 × 10⁸ t, and the average growth rate of carbon sequestration was only 1.18%. Meanwhile, the carbon sink of agricultural cultivation increased from 2.27 × 10⁸ t to 2.49 × 10⁸ t (Figure 3), so the carbon sequestration and emission reduction capacity of agricultural cultivation rose rapidly at this stage.
From the view of grain functional areas (Figure 2), in 2000–2020, the carbon sequestration and emission reduction capacity of agricultural cultivation in the main grain-producing areas is consistent with the changing law at the national level, and also shows a fluctuating and increasing trend of “decreasing first, then slowly rising and then rapidly rising”. The F-value fluctuates from 1.86 in 2000 to 2.64 in 2020, and its inter-annual fluctuation and carbon sequestration and emission reduction capacity are significantly larger than that of the whole country and other grain functional areas. This indicates that the carbon sequestration and emission reduction capacities of agricultural cultivation in the main grain-producing areas are greatly affected by agricultural policies, agricultural material inputs, and agricultural science and technology levels. This also indicates that carbon sinks of agricultural cultivation in the main grain-producing areas are much larger than carbon sources. For example, the carbon sink of agricultural cultivation in the main grain-producing areas in 2020 was 20,035.44 × 104 t, and the carbon emissions were 7575.35 × 104 t (Figure 3). For grain production and marketing areas and main marketing areas, the carbon sequestration and emission reduction capacity of agricultural cultivation shows a fluctuating downward trend, with the F-value decreasing from 1.82 (production and marketing areas) and 1.02 (main marketing areas) in 2000 to 1.37 and 0.71 in 2020, respectively (Figure 2). This may be attributed to the decrease in the sown area of grain crops in the production and marketing areas and main marketing areas during the study period, resulting in limited carbon sinks in agricultural cultivation (the carbon sinks of the main marketing areas are on a downward trend). Meanwhile, carbon emissions showed an increasing trend (Figure 3). In addition, the correlation coefficients between the main grain-producing areas, production and marketing areas, and the main marketing areas and the national-level carbon sequestration and emission reduction capacity of agricultural cultivation were 0.971, −0.392, and −0.190, respectively. This indicates that the main grain production areas had the greatest positive influence on the overall carbon sequestration and emission reduction capacity of agricultural cultivation in China.
From a spatial perspective (Figure 4), most of the provinces in the country, except for the main marketing areas, have an index of carbon sequestration and emission reduction capacity of agricultural cultivation exceeding 1.0. This indicates that the carbon sinks in most of the provinces between the main grain-producing areas and the production and marketing areas are larger than the carbon sources, but the spatial differentiation is obvious. The top four provinces in terms of average sequestration and emission reduction capacity of agricultural cultivation in the period 2000–2020 are, in order of priority, Jilin, Inner Mongolia, Heilongjiang, and Henan, and all are located in the main grain-producing areas. This indicates that although the carbon emissions from agricultural cultivation in the main grain-producing areas are higher and increasing (Figure 3a), the favorable climate and soil conditions, green and low-carbon agricultural production technology, and the growing grain sowing area [39] lead to a significantly larger carbon sink capacity of agricultural cultivation in the main producing areas than in the grain-producing and marketing areas and the main marketing areas (Figure 3b). According to the statistics, the average annual carbon sink in the main producing areas accounted for 77.02% of the total carbon sink in agricultural cultivation in the country. In Jilin and Heilongjiang, for example, the unique natural conditions (flat and fertile land, light and heat conditions during the same period of rain and heat) and large-scale sowing area of grain crops (up to 2.26 × 10⁷ hm2 of grain sowing area in 2020) make it easy for both to promote low-carbon and high-efficiency planting techniques and carry out large-scale agricultural operations in the process of agricultural production. This leads to an improvement in the efficiency of the utilization of agricultural materials and a continuous reduction in carbon emissions. From 2000–2020, the average annual carbon emissions from agricultural cultivation in Jilin and Heilongjiang were 323.29 × 10⁴ t and 535.22 × 10⁴ t, respectively, and the corresponding carbon sinks from agricultural cultivation were as high as 1.17 × 10⁷ t and 1.67 × 10⁷ t, with the number of carbon sinks being 3.6 times the amount of carbon emissions (Jilin) and 3.1 times the amount of carbon emissions (Heilongjiang).
The last four provinces in terms of carbon sequestration and emission reduction capacity of agricultural cultivation are Hainan, Fujian, Shanghai, and Zhejiang, with carbon sequestration and emission reduction capacity indices below 0.65, and all of them are located in the main grain marketing area (Figure 4). The reason for their low carbon sequestration and emission reduction capacities may be that these provinces and regions are relatively economically developed, and rapid urbanization has crowded out arable land, leading to a reduction in the area under crop cultivation, which limits the carbon sink capacity. Secondly, the contribution of agricultural material inputs to carbon emissions from agricultural cultivation in the main marketing areas has been on the increase (e.g., the contribution of carbon emissions due to agricultural films in Shanghai, Zhejiang, Hainan, and Fujian has increased from 47.84%, 16.84%, 1.87% and 14.55% in 2000, respectively, to 57.89%, 41.41%, 44.66% and 35.70% in 2020, respectively). As a result, the growth of carbon sinks from agricultural cultivation has found it difficult to offset the increase in carbon emissions.
The carbon sequestration and emission reduction capacity of grain-producing and marketing regions is also relatively high, except in Gansu, where the carbon sequestration and emission reduction capacity index is less than 1.0, and in Shanxi, Shaanxi, Ningxia, and Tibet, where it exceeds 2.0 (Figure 4). This is because the carbon emissions from agricultural materials and soils in the four provinces of Shanxi, Shaanxi, Ningxia, and Tibet have seen a significant decline in recent years. In addition, the high inputs and emissions from crop cultivation have been effectively curbed, the carbon emissions from rice cultivation in Shanxi and Shaanxi have been reduced, and the base of carbon emissions from agricultural cultivation in Qinghai is not high per se (annual average of 16.12 × 10⁴ t). This leads to a larger index of carbon sequestration and emission reduction capacity for these provinces. In Gansu and Xinjiang, the focus of agricultural development is not crop cultivation. In addition, poor water-heat matching means the carbon sink of agricultural cultivation is limited, thus the carbon sequestration and emission reduction capacity is lower. As for Guizhou, Yunnan, and Chongqing, the higher sequestration and emission reduction capacity index may be related to the reduction in agricultural materials in recent years, resulting in a decline in carbon emissions from agricultural materials and soil management. While Guangxi is one of China’s most important rice-producing areas, the superior hydrothermal conditions make the contribution of rice carbon emissions in the total carbon emissions from agricultural cultivation reach 30.39% per annum on average. This leads to high carbon emissions from agricultural cultivation, and thus lower sequestration and emission reduction capacity. Considering the differences in agricultural resource endowment carbon sequestration and emission reduction capacity of different grain functional areas, the implementation of differentiated sink enhancement and emission reduction is the way to go. This not only helps to optimize the potential of regional carbon sinks but also promotes the sustainable use of agricultural resources, providing strong support for the promotion of green and sustainable agricultural development.

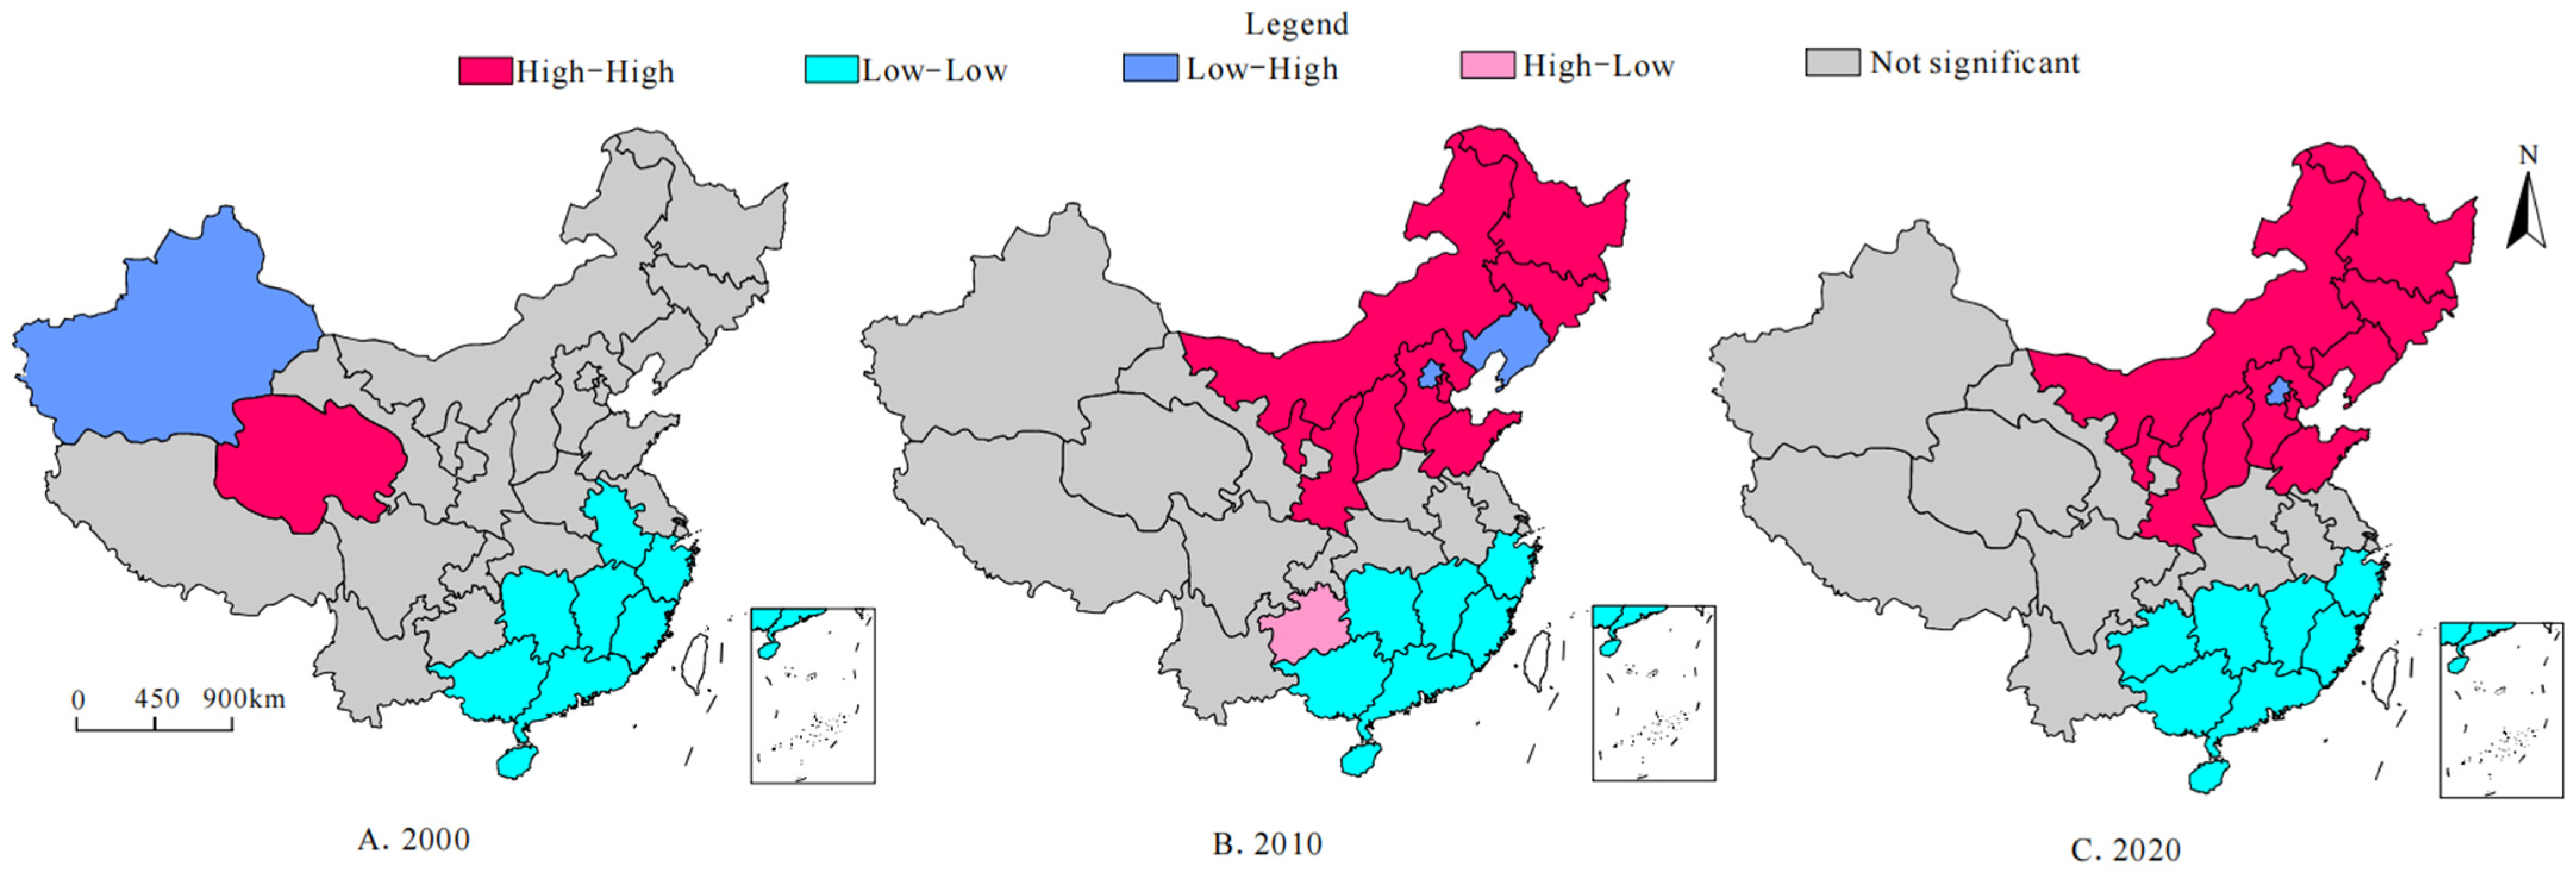
3.2. Characteristics of Spatial Correlation of Carbon Sequestration and Emission Reduction Capacity of Agricultural Cultivation

To explore the spatial correlation characteristics of the carbon sequestration and emission reduction capacity of agricultural cultivation, this paper measured the global Moran’s I index in 2000, 2010, and 2020. Table 3 shows that at the national level, the Moran’s I indices for the above three years are all greater than 0 and pass the significance test at the level of α = 0.05. This indicates that there is a significant positive spatial correlation between China’s carbon sequestration and the emission reduction capacity of agricultural cultivation and that this positive spatial correlation increases with the increase in years. From the perspective of the subregion, the global Moran’s I index of the main grain production area and the production and marketing area have similar characteristics, i.e., the Moran’s I index turns from negative to positive with the increase in the year and shows an upward trend. This indicates that the spatial difference in the carbon sequestration and emission reduction capacity of agricultural cultivation in these two functional areas is narrowing and the positive spatial correlation is increasing, but most of them do not pass the significance test. The global Moran’s I index of the main grain marketing area shows a fluctuating downward trend, i.e., from 0.605 in 2000 to −0.201 in 2020, indicating that the significant positive spatial correlation of the carbon sequestration and emission reduction capacity of agricultural cultivation in the main grain marketing area is rapidly disappearing and that differences are beginning to appear. The reason for this may be that before 2020, the agricultural cultivation sequestration emission reduction capacity of the provinces and regions in the main marketing area was generally low. However, since 2020, the agricultural cultivation sequestration emission reduction capacity of Tianjin has increased tremendously (its sequestration emission reduction index has increased rapidly from 1.36 in 2000 to 3.21 in 2020). This may have led to the formation of an obvious gap with the sequestration emission reduction capacity of other provinces and regions in the main marketing area, and thus made the global Moran’s I index negative in 2020.
Since the global Moran’s I index cannot measure the correlation of local spatial neighboring units, this paper uses the local indicators of spatial association (LISA) to reveal the clustering characteristics of local spatial units of the carbon sequestration and emission reduction capacity of agricultural cultivation. As can be seen from Figure 5, there are local spatial agglomeration characteristics of China’s agricultural cultivation carbon sequestration and emission reduction capacity, and the pattern of “high in the north and low in the south” is very obvious.
In 2000, the areas of high–high agglomeration of agricultural cultivation carbon sequestration and emission reduction capacity were mainly distributed in Qinghai, the grain production and marketing area. The areas of low–low agglomeration were mainly concentrated in Hunan and Jiangxi, the main grain production area, Anhui and Hainan, Guangdong, Zhejiang, and Fujian in the main marketing area, and Guangxi in the grain production and marketing area. The carbon sequestration and emission reduction capacity index varies from 0.810 to 1.542; the low–high aggregation area is only distributed in Xinjiang in the grain production and marketing area, and the high–low aggregation area does not exist.
In 2010, there was a significant increase in the number of provinces with high-high aggregation. This mainly includes Heilongjiang, Jilin, and Inner Mongolia, which are the main grain-producing areas of northern China, as well as Shandong, Hebei, Shanxi, Shaanxi, and Ningxia in the production and marketing areas, and Tianjin in the main grain marketing area. The significant increase in this high–high aggregation indicates that the carbon sequestration and emission reduction capacity of agricultural cultivation in grain production and marketing areas and main marketing areas may be positively affected by carbon sequestration and emission reduction in main grain production areas to a certain extent, which means that China’s carbon sequestration and emission reduction capacity of agricultural cultivation has been enhanced. Meanwhile, the low–low aggregation area is relatively stable, and the overall pattern did not change significantly compared with that of 2000. However, the low–high aggregation area of the province has changed greatly, and the original low–high aggregation area in Xinjiang was no longer significant in 2010.
In 2020, the spatial agglomeration characteristics of China’s agricultural cultivation carbon sequestration and emission reduction capacity were more or less the same as in 2010, i.e., mainly in the “high in the north and low in the south” pattern. However, the difference is that Liaoning, which belonged to the low–high agglomeration in 2010, was converted into a high–high agglomeration in 2020. In addition, Guizhou, which was a high–low agglomeration in 2010, became a low–low agglomeration in 2020, indicating that the carbon sequestration and emission reduction capacity of agricultural cultivation in individual provinces in the grain production and marketing areas is decreasing.

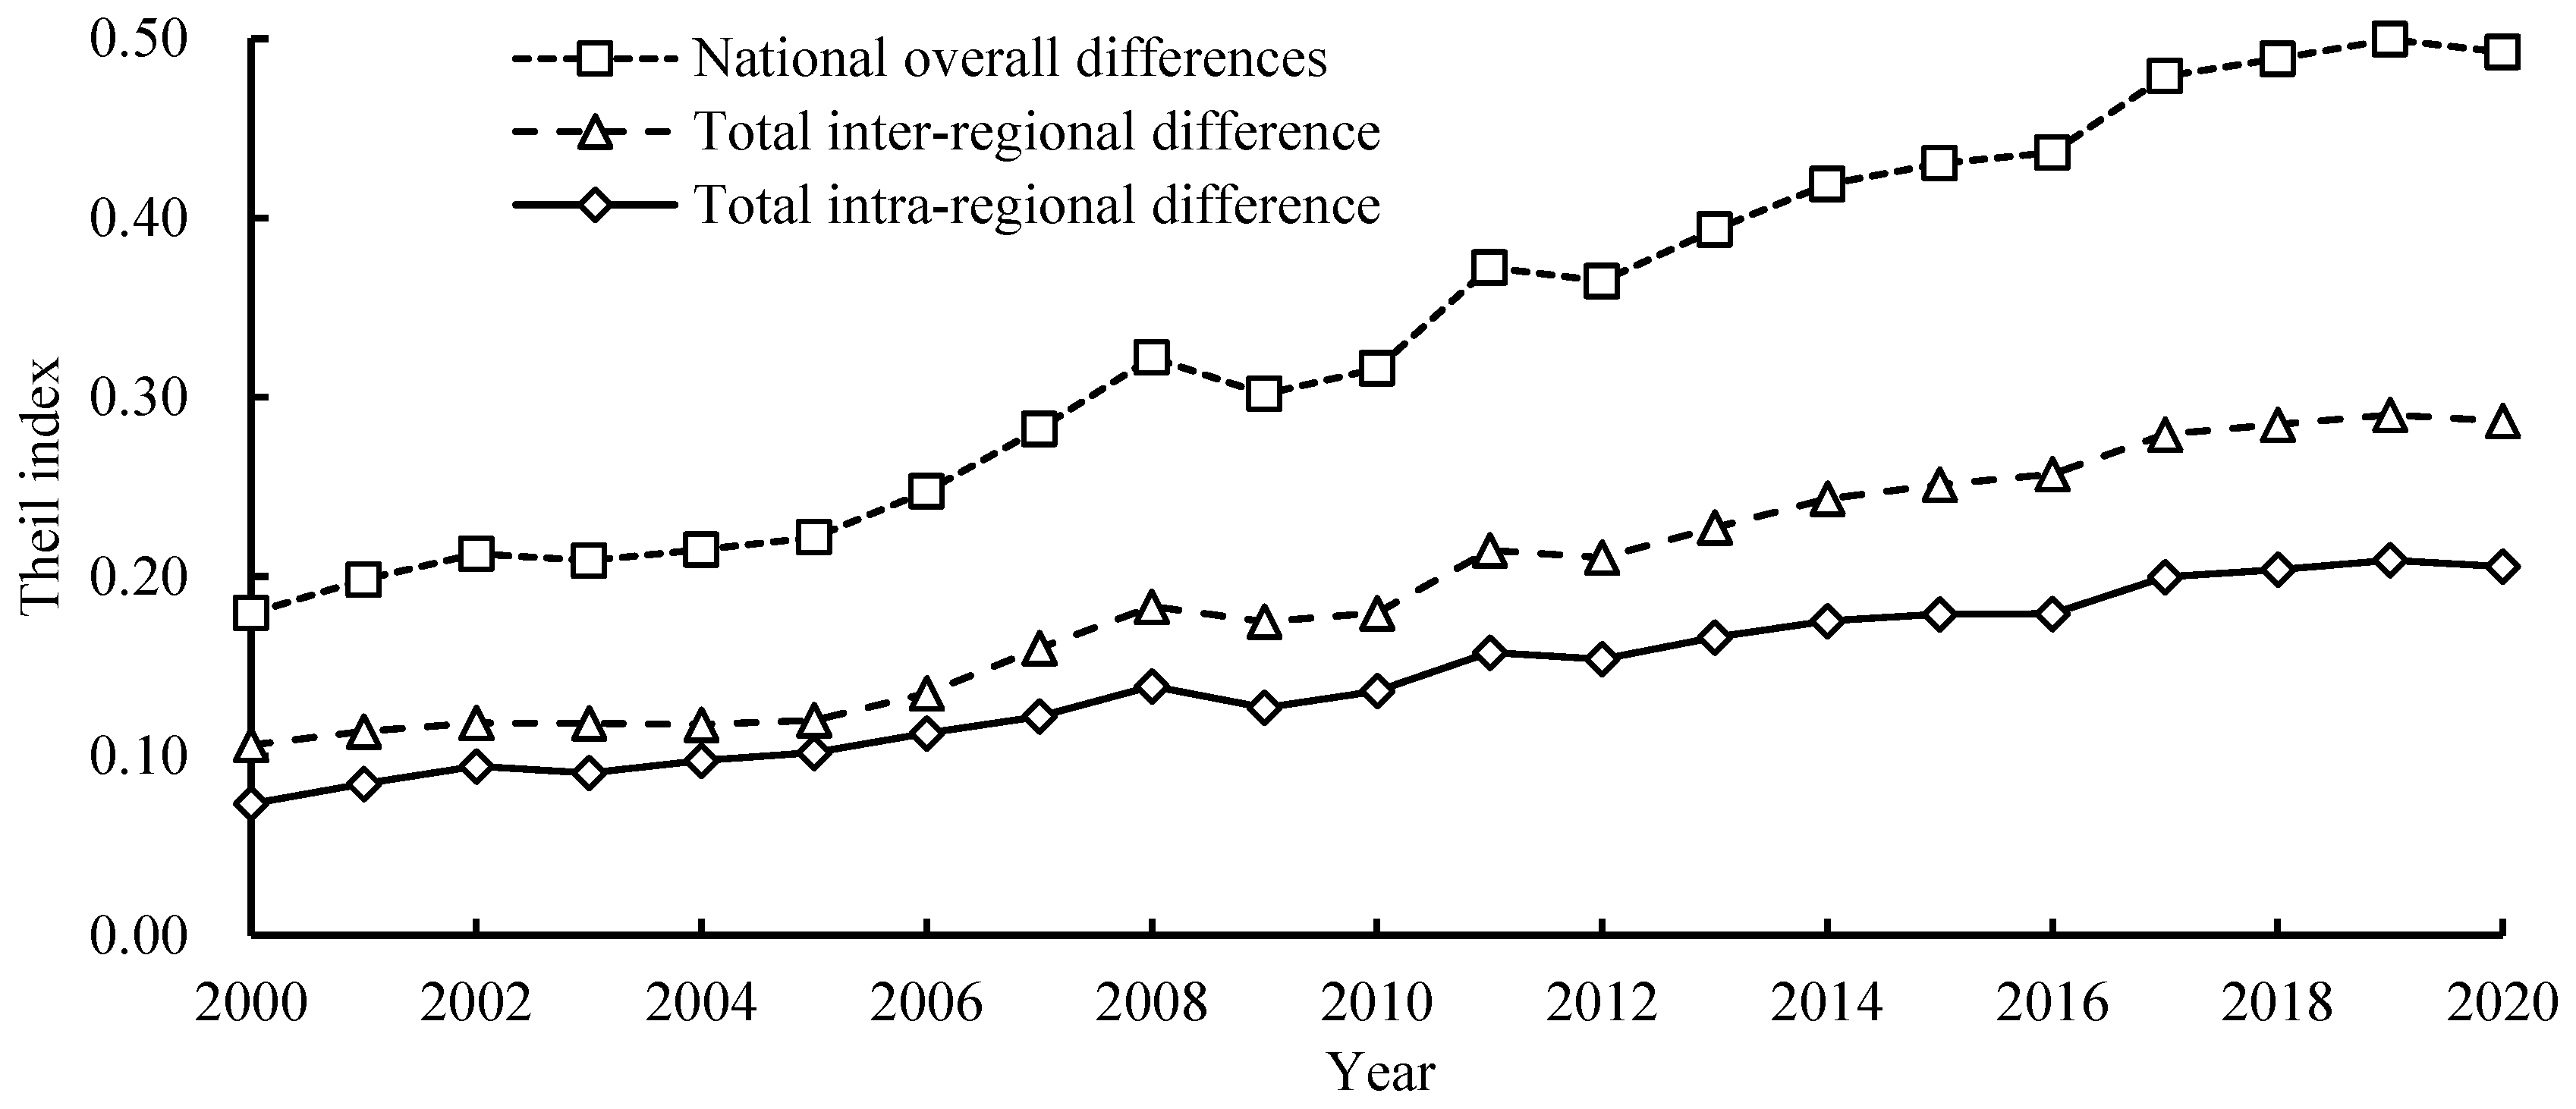
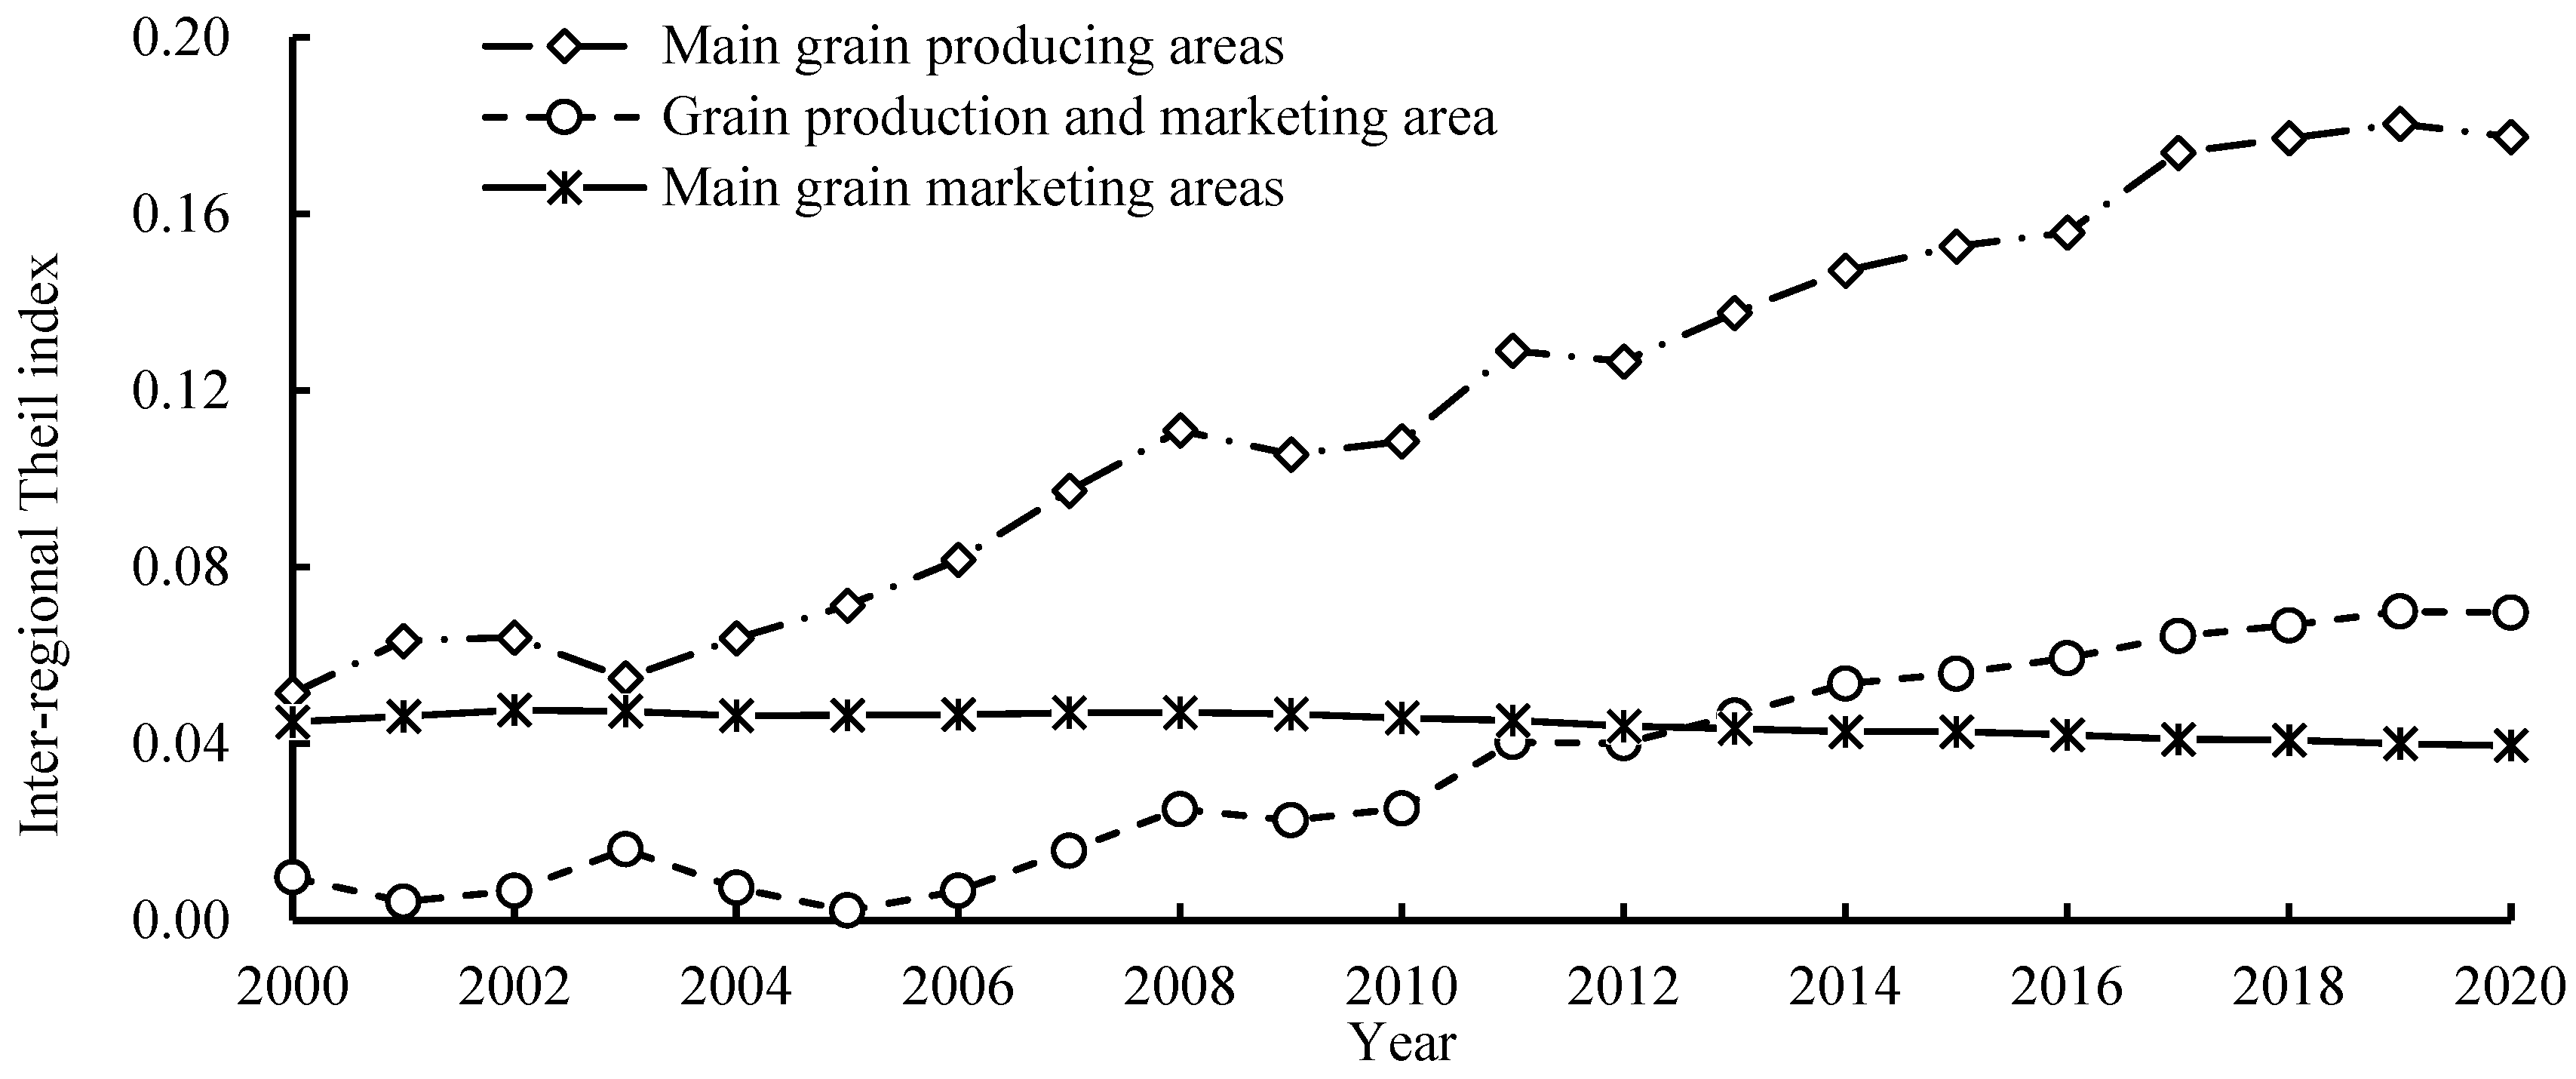
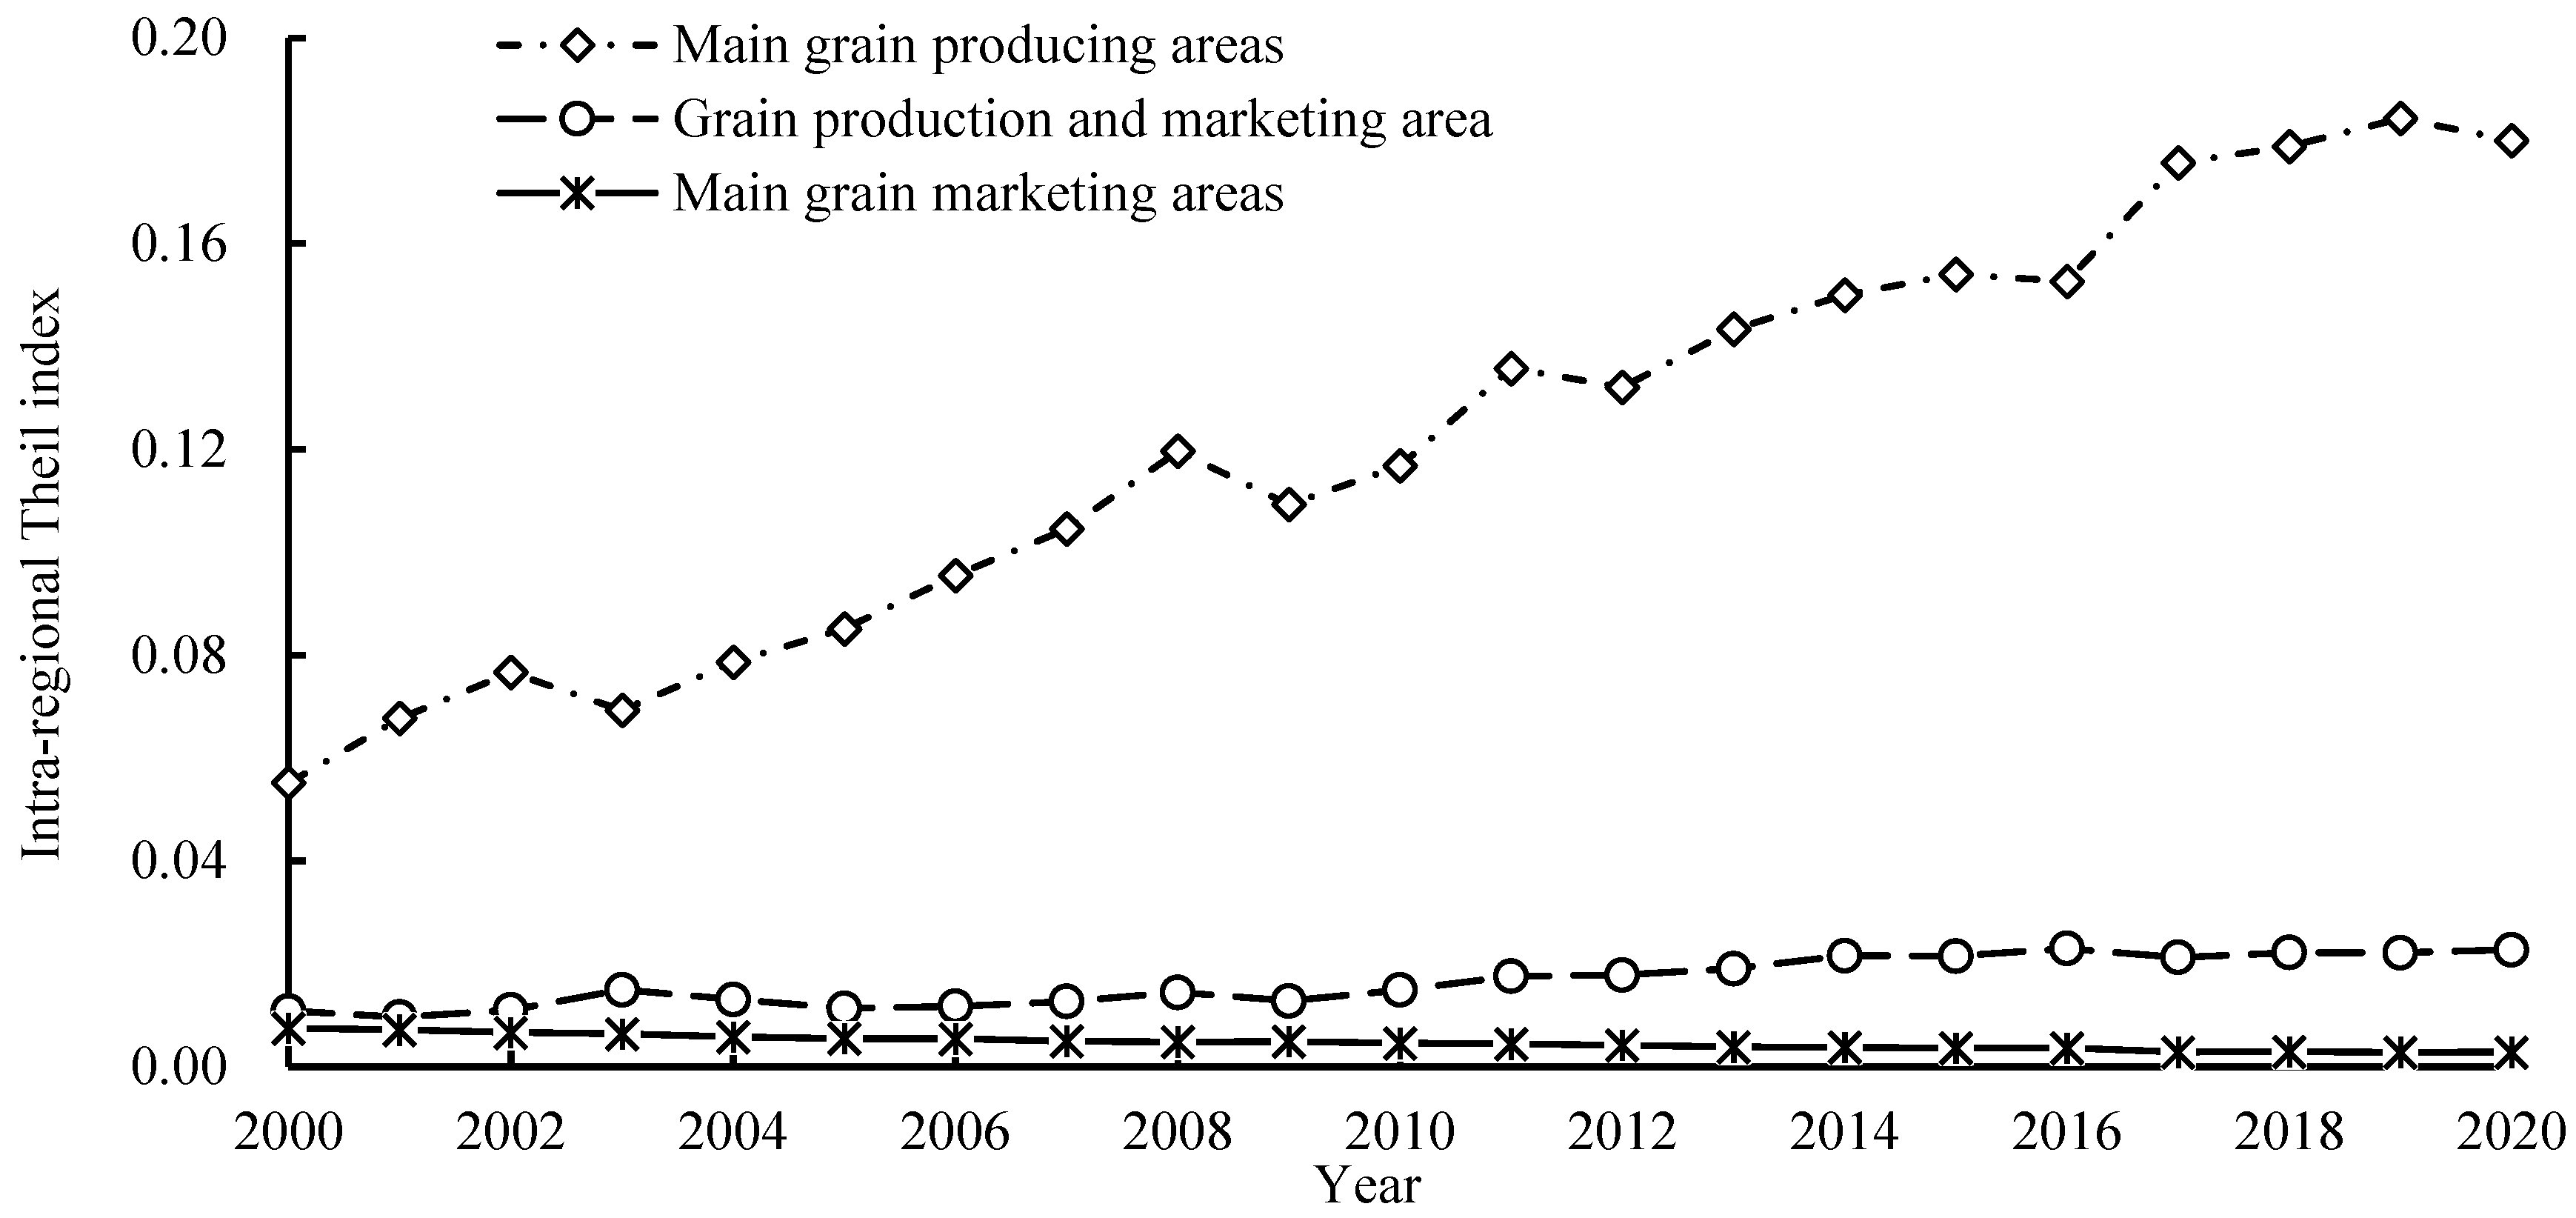
3.3. Analysis of Regional Differences in Carbon Sequestration and Emission Reduction Capacity of Agricultural Cultivation

Figure 6 shows that the overall Theil index of the carbon sequestration and emission reduction capacity of Chinese agricultural cultivation in 2000–2020 varied from 0.179 to 0.499, with the overall fluctuation showing an obvious “M”-shaped increase. In stages, the overall Theil index increased steadily in 2000–2008, with an average annual increase of 9.91%, indicating that the difference in the carbon sequestration and emission reduction capacity of Chinese agricultural cultivation has been expanding, but it is lower than the overall average level of 0.337. In 2008–2012, the overall Theil index showed a fluctuating increase from 0.322 in 2008 to 0.365 in 2012, with a significant fluctuation during the period. In 2012–2020, the overall Theil index showed a continuous increase, with an average annual growth rate of 4.37%, which indicates that the overall difference in the carbon sequestration and emission reduction capacity of agricultural cultivation in China has continued to widen. Among them, the differences in the types of crops grown in agriculture in various provinces and regions, as well as the differences in soil and climate conditions, directly affect the growth cycle of crops, the rate of carbon absorption, and other effects of carbon sequestration. At the same time, the application level of precision agriculture technology and the popularization of national agricultural emission reduction policies also show differences in different regions, making the performance of agricultural carbon sequestration and emission reduction in different regions different. The interaction of these factors leads to the gap in the carbon sequestration and emission reduction capacity of agricultural cultivation in different regions.
Further analysis reveals that the Theil index of the total difference between the zones and the total difference within the zones has the same pattern of change as that of the Theil index of the overall difference in the whole country, i.e., both show an upward trend of “M”-type fluctuation. However, the Theil index of the total difference between the zones is significantly larger than that of the total difference within the zones (Figure 6), and the variation intervals of the two are 0.106~0.287 (mean value 0.194) and 0.07~0.206 (mean value 0.143), respectively, which indicates that the total difference between zones is the main source of the overall difference of the national capacity of carbon sequestration and emission reduction in agricultural cultivation, while the influence of the total difference within zones is relatively small.
From the viewpoint of grain functional areas, the interval Theil index showed different evolutionary trends (Figure 7). Among them, the inter-area Theil index of the main grain production area and production and marketing area showed an “M”-type change and increased. The inter-area Theil index of the main production area was significantly larger than that of the production and marketing area, with average values of 0.116 and 0.034, respectively. The inter-area Theil of the main grain marketing area showed a slight downward trend. This indicates that the inter-area difference in carbon sequestration and emission reduction capacity of agricultural cultivation in the main production and marketing areas is shrinking, while the inter-area difference between the main production and marketing areas is expanding. Compared with the inter-area Theil index, the intra-area Theil index of the main production area is similar to its inter-area Theil index in terms of value and trend, i.e., it shows an upward change in the “M” shape; while the intra-area Theil index of the production and marketing area and the main marketing area are smaller than their inter-area Theil indices. The Theil index in the production and marketing area showed a slow upward trend, while the Theil index in the main marketing area showed a weak downward trend and was the smallest (Figure 8). This differentiation indicates that the carbon sequestration and emission reduction capacity of agricultural cultivation in different functional grain areas varies significantly.
In terms of contribution rates (Table 4), the contributions of total inter-area variance to the overall variance of carbon sequestration and emission reduction from agricultural cultivation in China in 2000–2020 were all above 54.0% (mean value of 57.24%) and varied in a U-shape over time, whereas the contributions of total intra-area variance varied in an inverted U-shape ranging from 40.89% to 45.91% (mean value of 42.76%) and both began to stabilize in 2014. This indicates that the total differences between and within zones in the carbon sequestration and emission reduction capacity of Chinese agricultural cultivation tend to gradually converge from the initial divergence. Specifically, the contribution of the main production area to the total difference between zones is as high as 48.50~62.27%, while the contribution of the production and marketing area and the main marketing area to the total difference between zones is smaller. Among them, the inter-zone contribution of the main production area and the production and marketing area showed an M-type and W-type increase, respectively, while the main marketing area showed an M-type fluctuation decrease (Table 4). Among the intra-regional differences, the largest contribution to the total intra-regional difference in carbon sequestration and emission reduction from agricultural cultivation was made by the main production area, followed by the production and marketing area, and the smallest contribution was made by the main marketing area (the average annual contribution was only 3.96%). Among them, the contribution of the intra-zone variance in the main production area varied from 75.05% to 88.07% (average value of 84.35%) and showed a fluctuating upward trend, while the contribution of the intra-zone variance in the production and marketing area and the main marketing area both showed a slow downward trend (Table 4). The above results indicate that the inter- and intra-regional differences in the main grain production areas are the main source of the overall variation in the carbon sequestration and emission reduction capacity of agricultural cultivation in China.

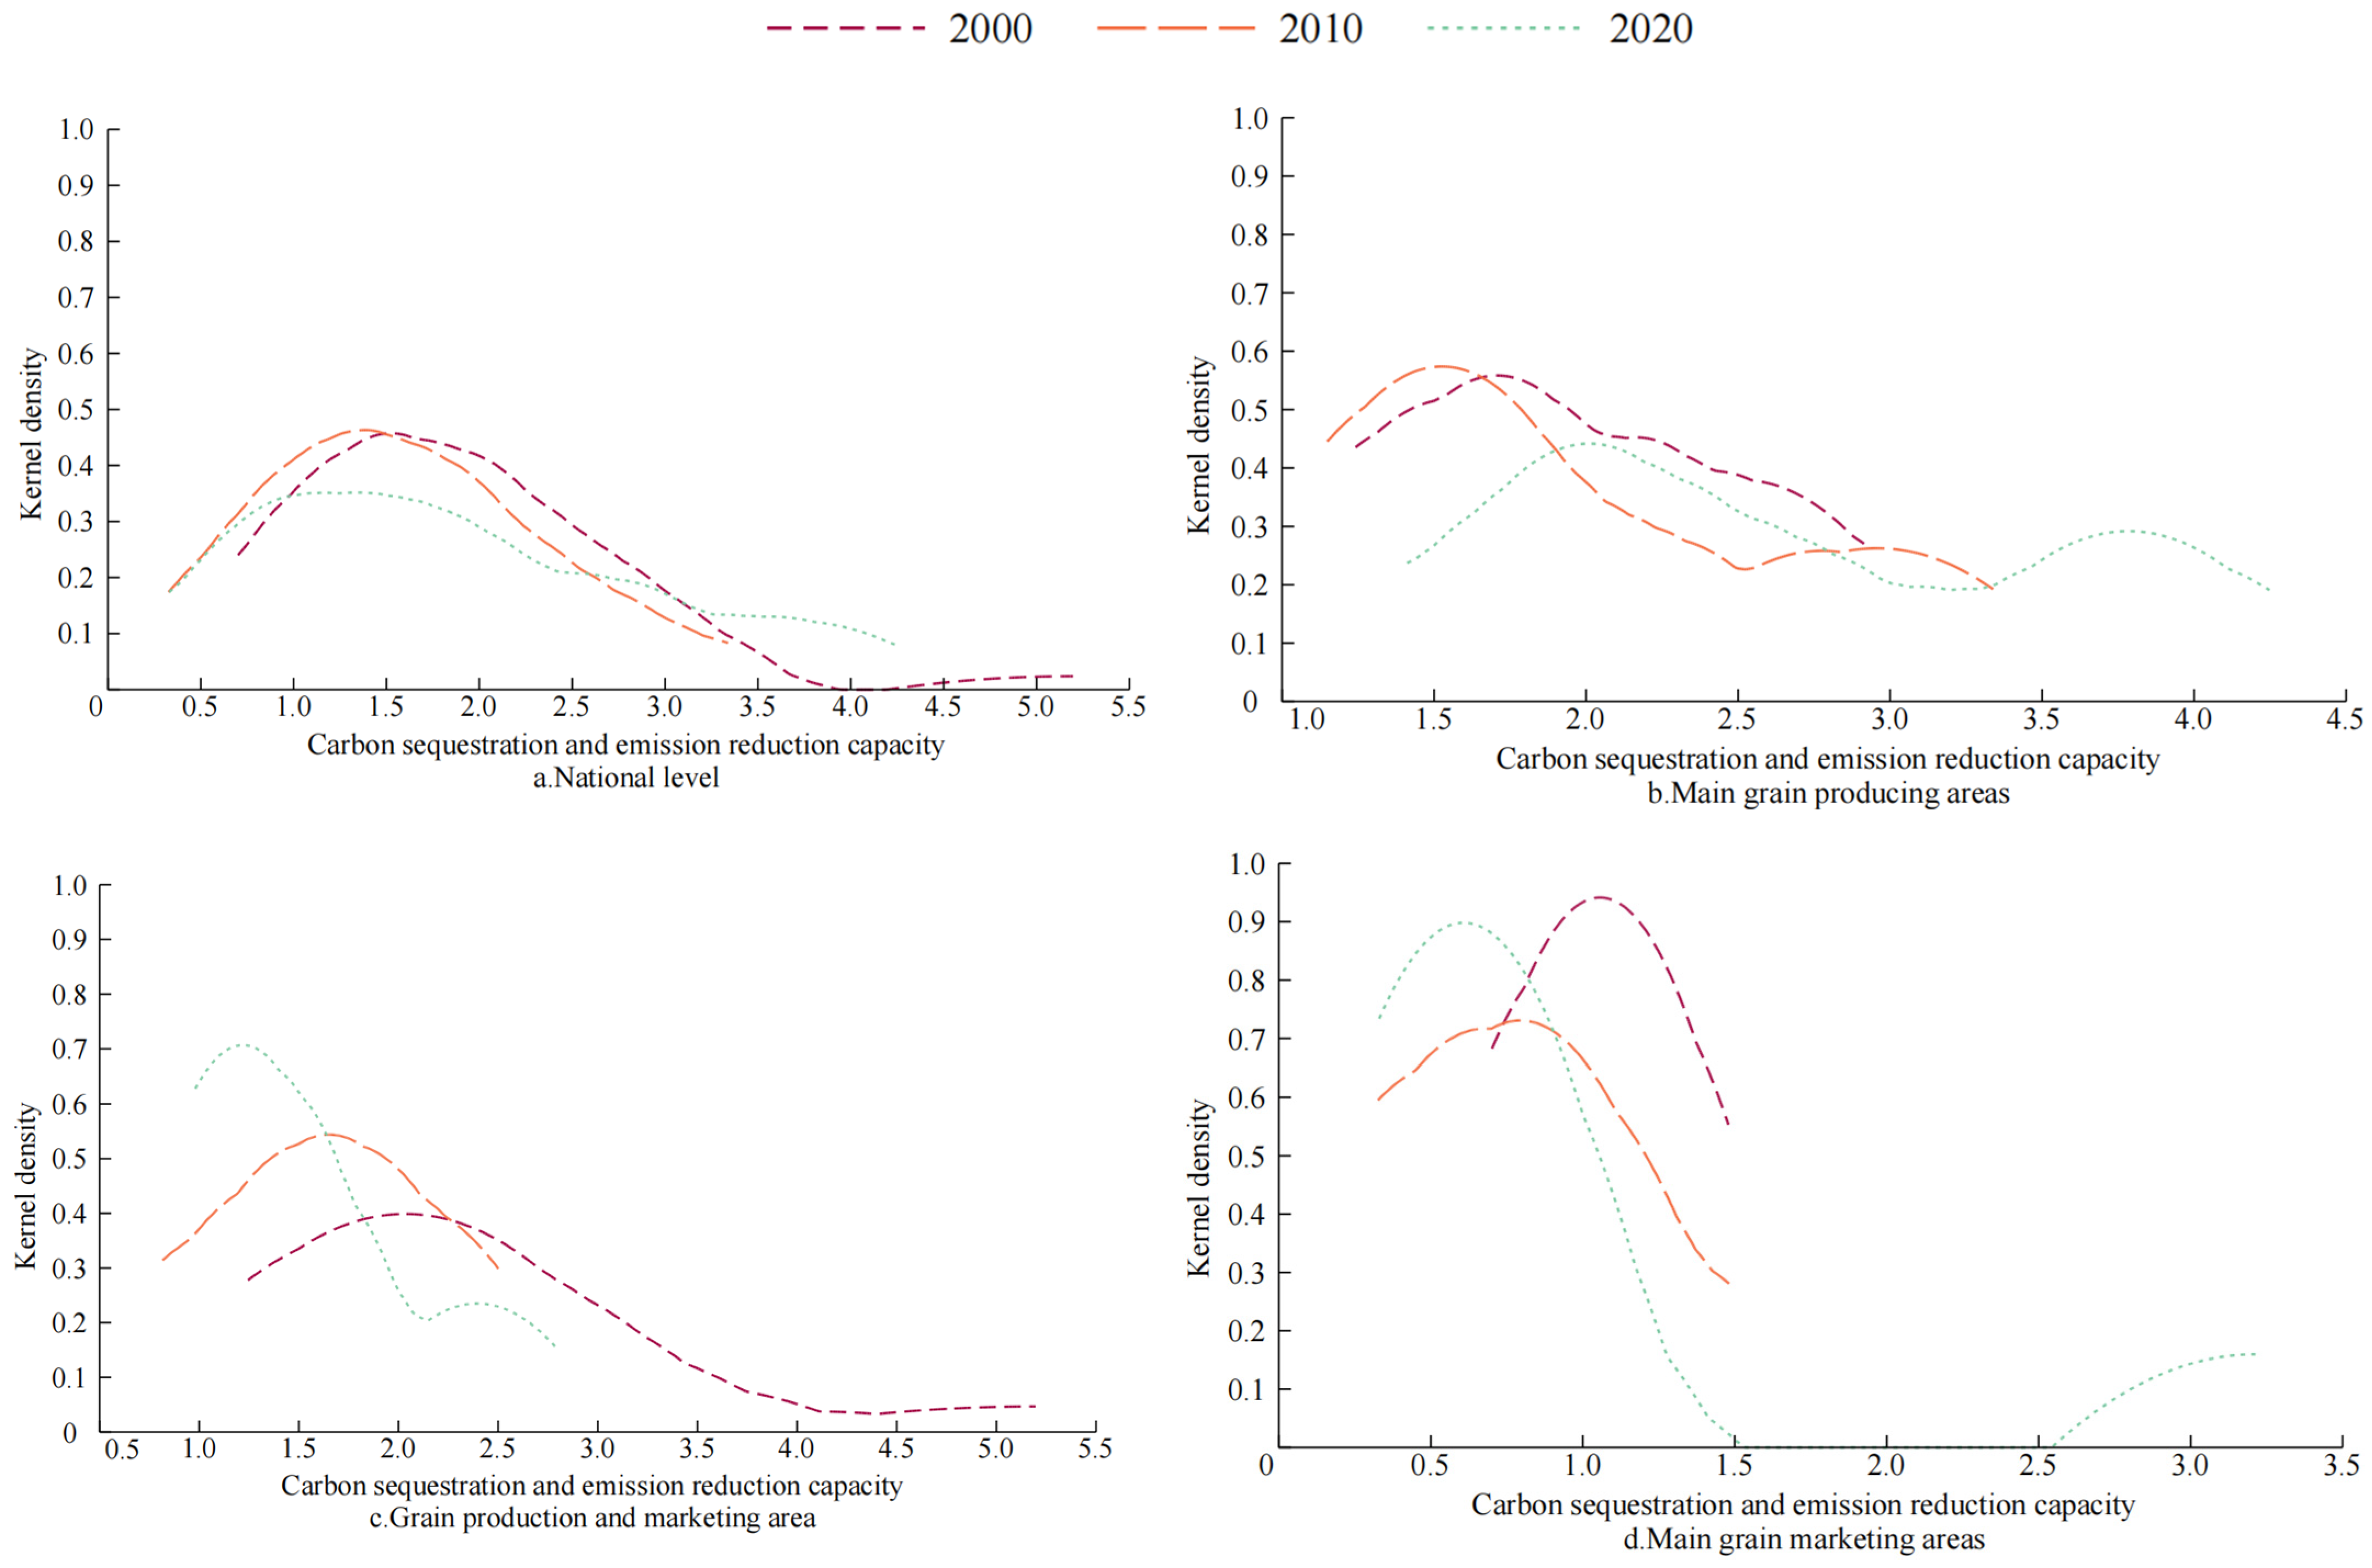
3.4. Dynamic Evolution of Carbon Sequestration and Emission Reduction Capacity of Agricultural Cultivation

In order to reveal the evolutionary characteristics of the carbon sequestration and emission reduction capacity of agricultural cultivation, the kernel density method was utilized to estimate the carbon sequestration and emission reduction capacity of agricultural cultivation in China and different functional grain areas, and the kernel density curves were plotted for the years 2000, 2010, and 2020.
From the distribution position of the curve (Figure 9), the centers of the kernel density curves for both the national level and the main grain-producing areas initially shifted to the left before moving to the right during the study period. Notably, the shift to the right was more pronounced in the main grain-producing areas, indicating a decrease followed by an increasing trend in the carbon sequestration and emission reduction capacity of agricultural cultivation at the national level and in these main grain-producing areas. The main grain-producing areas experienced the most significant changes. Meanwhile, the centers of the kernel density curves for grain production and marketing areas, as well as the main marketing areas, shifted considerably to the left, suggesting a continuous decline in their carbon sequestration and emission reduction capacity in agricultural cultivation. These findings are consistent with the conclusions from the previous time-series analysis of changes in carbon sequestration and emission reduction capacity in agricultural cultivation.
In terms of the curve span, the variation interval of the kernel density function (KDF) between the national level and the grain-producing and marketing regions showed a trend of narrowing and then widening, i.e., the KDF variation interval in 2010 narrowed compared with that in 2000. Meanwhile, the KDF interval in 2020 widened compared with that in 2010, but the variation in the grain-producing and marketing regions was more pronounced (Figure 9). This indicates that the regional gap between the national level and the capacity of agricultural cultivation to sequester carbon emission reduction in grain production and marketing areas shows a narrowing trend in 2000–2010 and a widening trend in 2010–2020, with a larger gap between provinces in the production and marketing areas. However, the variation interval of the kernel density function between the main grain-producing areas and the main marketing areas gradually becomes wider and wider, and the increase in the span is very obvious, which indicates that the regional gap in the carbon sequestration and emission reduction capacity of agricultural cultivation in the main grain -producing areas and the main marketing areas are continuously expanding. This may be related to the differences in the basis of agricultural development, natural conditions, and the level of agricultural science and technology of different provinces in the grain functional area.
From the peak of the curve, the peaks of the kernel density function (KDF) at the national level and in the main production areas show a tendency to increase and then decrease. In 2000–2020, the KDF at the national level shifted from bimodal to weakly multimodal, with the change of the broad peak becoming more and more pronounced, while the KDF in the main production areas shifted from multi-peak to bimodal, which suggests that the capacity of the national level and that of the main production areas to reduce the emission of carbon sequestered by agricultural cultivation is in the form of a concentration and diffusion trend. This indicates that the national level and the capacity of agricultural cultivation for carbon sequestration and emission reduction in the main grain-producing areas are in a situation of concentration and diffusion. The peak value in the production and marketing areas shows a gradual upward trend from a broader single peak to a sharper double peak, which means that the carbon sequestration and emission reduction capacity of agricultural cultivation in the grain production and marketing areas is concentrated in the high-value areas, and polarization is beginning to appear. The peak value of nuclear density in the main marketing area showed a downward and then upward trend, shifting from a single-peak pattern to a double-peak pattern (Figure 9), which indicates that there is a characteristic of diffusion to aggregation in the high-value area of agricultural cultivation carbon sequestration and emission reduction capacity in the main marketing area of grains. Overall, there are different dynamic evolution patterns in the carbon sequestration and emission reduction capacity of agricultural cultivation in different grain functional areas, and the phenomenon of uneven regional development is very obvious. These differences constrain the sustainable development potential of the regions. Therefore, promoting balanced development, especially upgrading the capacity of regions with weak carbon sequestration and emission reduction capacity, has become key to achieving sustainable agricultural development.

4. Discussion

As an important part of China’s carbon-neutral strategy, the development of carbon sequestration in agriculture is one of the effective pathways to achieving “carbon peak and carbon neutrality”. It provides substantial environmental, economic, and social benefits, positioning it as a key focus for future agricultural development and the advancement of ecological civilization, while also playing a vital role in fostering long-term sustainability. However, the limitations and regional adaptability of carbon sequestration technologies in agricultural planting are important factors hindering the green development of agriculture and the improvement of quality and efficiency, so in-depth research on carbon sequestration and emission reduction in agricultural planting should not be delayed. To solve the above problems, this study analyzes the spatial and temporal patterns and dynamic evolution of the carbon sequestration and emission reduction capacity of agricultural cultivation in different functional grain areas from 2000 to 2020.
(1) From 2000 to 2020, the national carbon emission from agricultural cultivation increased from 9080.33 × 104 t to 11,734.48 × 104 t and reached a peak of 13,385.47×104 t in 2015. The carbon sink increased from 15,687.76 × 104 t to 24,894.49 × 104 t, an increase of 58.69%, and is still on the rise. This is consistent with the findings of Zhang et al. [39] and Cui et al. [40] in their studies on the effects of changes in grain cultivation on carbon emissions. After reaching the peak, with the proposal of the “double carbon” goal and the implementation of the “National Agricultural Modernization Plan (2016–2020)”, the state’s policy support for agricultural production has increased, agricultural production technology and production scale has improved, and all kinds of material inputs have been reduced redundantly so that the capacity of agricultural planting carbon sequestration and emission reduction has been improved.
Therefore, the reduced and efficient use of pesticides and chemical fertilizers should be further promoted [41] to reduce the excessive use of chemicals through scientific application and precise management. This will enhance fertilizer efficiency and reduce environmental pollution and greenhouse gas emissions. We should also focus on the development and implementation of biodegradable agricultural films to replace the traditional plastic films, to reduce their residues in the soil and their adverse impact on the ecological environment. In addition, the promotion of water-saving irrigation technologies such as drip irrigation, sprinkler irrigation, and micro-sprinkler irrigation can significantly improve the utilization efficiency of water resources and reduce the waste of energy and carbon emissions in the irrigation process. With the increasingly serious problem of water shortage, water-saving irrigation not only saves water but also improves the energy utilization of agricultural production, reduces the carbon footprint, and contributes to green development. Increasing the application of green energy in related industries [42], especially the application of renewable energy sources, such as solar energy and wind energy, will effectively reduce dependence on fossil fuels and lower carbon emissions. In addition, using biomass (such as straw) as clean energy not only promotes the recycling of agricultural waste but also reduces pollutant emissions, improves the energy efficiency of agricultural systems, and further promotes the development of sustainable agriculture.
(2) Through the spatial autocorrelation analysis of the carbon sequestration and emission reduction capacity of agricultural cultivation, it was found that the spatial clustering characteristics of the carbon sequestration and emission reduction capacity of agricultural cultivation in China in 2020 were basically the same as in 2010, and the distribution pattern of “high in the north and low in the south” was still present. This result is consistent with the findings of Dong Xiaolong et al. [43], further verifying the stability of the pattern and the significance of the regional characteristics. In the study of regional differences in the carbon sequestration and emission reduction capacity of agricultural cultivation, the gap between the main grain-producing areas and the grain-producing and marketing areas has been expanding, and the Theil index in the main marketing areas has shown a weak downward trend and is the smallest. In the study of dynamic evolution, it was found that the carbon sequestration and emission reduction capacity of agricultural cultivation between the main grain-producing areas and the provinces in the grain production and marketing areas was expanding. The high-value area of agricultural planting carbon sequestration emission reduction capacity in the main grain production and marketing areas has the characteristic of spreading to aggregation, which also reflects the reduction in the difference within the main production and marketing areas. By comparing the results of the above two studies, it was found that the conclusions of the studies verified each other, making this conclusion reasonable.
Therefore, differentiated carbon sequestration and reduction policies should be formulated according to local conditions, taking into account the resource endowments and ecological conditions of each region, so as to improve the relevance and effectiveness of the policies. For the northern regions with strong agricultural carbon sequestration capacities, the application and promotion of carbon sequestration technologies should be further strengthened, and support for soil carbon sinks and ecological restoration measures should be increased to consolidate their advantages in national carbon sequestration and emission reduction. Meanwhile, for the southern regions with relatively weak carbon sequestration capacity, it is necessary to optimize agricultural production methods, such as the promotion of water-saving irrigation, ecological farming, and other technologies, through policy guidance and technological innovation, so as to enhance their carbon emission reduction capacity. The carbon sequestration ability of the southern region is relatively weak. To narrow the regional development gap, the government should promote communication and cooperation among regions and facilitate resource sharing and technology transfer, to avoid the widening of the gap caused by the situation of solo development in certain regions.
At the same time, it should pay attention to balanced development within the region, ensuring fairness in the distribution of resources and the effective implementation of policies. The “Matthew effect” can be prevented through the implementation of incentive mechanisms, such as financial subsidies and technical support for regions and farmers with significant carbon sequestration and emission reduction effects, to encourage other regions to follow suit. At the same time, it is necessary to provide targeted assistance policies for regions lagging in development, narrowing the gap within the region and ensuring the balanced enhancement of agricultural carbon sequestration and emission reduction capacity [44,45].
Through the above analysis and discussion, the limitations of this study are summarized as follows:
(1) Due to the availability of data, this paper is based only on statistical data and fails to test the estimation of data. In the carbon sink calculation of the planting industry, only three major grain crops are calculated. However, in real life, due to the vastness of China, many types of grain crops can be considered for the study of countless crops, and future research will improve the accuracy of carbon sink estimation.
(2) The study of carbon sequestration and emission reduction by agricultural cultivation is wide-ranging and rich in content. There is no lack of coupling and synergistic relationships with other research fields. Among them, there must be a certain link between grain security carbon sequestration and emission reduction capacity [46]. China has always advocated “grain security, national security”, so subsequent research will explore the relationship between the two from a broader perspective to explore the depth of carbon sequestration and emission reduction in agricultural cultivation.
(3) In the future, remote sensing and satellite data can be used to enrich the content of the study, improve the scientific validity of the results, and conduct multi-scale comparative studies to provide more targeted policies for China’s regional low-carbon development in agriculture.

5. Conclusions

Based on estimating the carbon sinks of agricultural cultivation in provincial areas of mainland China, this paper analyzes the spatial and temporal characteristics, regional differences, and dynamic evolution of the carbon sequestration and emission reduction capacity of agricultural cultivation at the national level and in different grain functional areas by constructing an index of the carbon sequestration and emission reduction capacity of agricultural cultivation. The main conclusions are as follows: (1) From the spatiotemporal perspective, the national agricultural carbon sequestration and emission reduction capacity showed a “rapid decline-slow rise-rapid rise” trend during the study period, with an average annual increase of 1.19%. Among the three major grain functional zones, the main production areas followed the national trend, while production sales and main sales areas exhibited a fluctuating downward trend. Spatial differentiation in carbon sequestration and emission reduction capacity was significant, with capacities ranked as follows: main production areas > production-sales areas > main sales areas. Most provincial indices exceeded 1.0. The top four provinces in average capacity were Jilin, Inner Mongolia, Heilongjiang, and Henan, while the bottom four were Hainan, Fujian, Shanghai, and Zhejiang, all with indices below 0.65. (2) From 2000 to 2020, the national agricultural carbon sequestration and emission reduction capacity showed a significant and continuously increasing positive spatial correlation. The positive spatial correlation strengthened in the main production and production-sales areas, while differentiation emerged in the main sales areas. At the local level, the local spatial clustering characteristics of China’s agricultural planting carbon sequestration and emission reduction capacity were evident, with a significant pattern of higher capacity in the north and lower capacity in the south. (3) The Theil indices for overall, inter-regional, and intra-regional differences in China’s agricultural carbon sequestration and emission reduction capacity all exhibited a fluctuating increasing trend, with inter-regional indices significantly exceeding intra-regional ones. The evolution trends of these indices varied across grain functional areas, with the main production areas having significantly higher indices than production–consumption and main consumption areas. During the study period, inter-regional differences contributed over 54% to overall differences, while intra-regional contributions were smaller. The main production areas contributed the most to both inter- and intra-regional differences, ranging from 48.50% to 62.27% and 75.05% to 88.07%, respectively, from 2000 to 2020. These differences in the main production areas were the primary sources of overall disparities in China’s agricultural carbon sequestration and emission reduction capacity. (4) From 2000 to 2020, the kernel density function of national and different grain functional areas’ agricultural planting carbon sequestration and emission reduction capacity showed different evolution trends in terms of location, span, and peak. In main production areas, capacity exhibited both agglomeration and diffusion, while production–consumption areas showed significant polarization, and main consumption areas evolved from dispersion to agglomeration. Uneven development across different functional areas was evident.

Author Contributions

Conceptualization, Y.W. and X.L.; methodology, Y.W.; software, Y.W.; validation, Y.W., X.L. and M.S.; formal analysis, Y.W.; investigation, M.S.; resources, X.L.; data curation, Y.W.; writing—original draft preparation, Y.W; writing—review and editing, X.L.; visualization, M.S.; supervision, X.L.; funding acquisition, X.L. All authors have read and agreed to the published version of the manuscript.

Funding

This research was funded by the Key Project of Hunan Provincial Department of Education (No.23A0353).

Institutional Review Board Statement

Not applicable.

Informed Consent Statement

Not applicable.

Data Availability Statement

No new data were created or analyzed in this study. Data sharing is not applicable to this article.

Conflicts of Interest

The authors declare no conflicts of interest.

References

  1. Xue, Y.; Li, C.H.; Li, J.W.; Lyu, H.; Lai, Q.Y.; Kang, Z.L.; Yao, P.; Li, J.H. Analysis of spatial and temporal characteristics and drivers of agricultural carbon emissions in China. Chin. J. Eco-Agric. 2024, 32, 1805–1817. [Google Scholar] [CrossRef]
  2. Asumadu-Sarkodie, S. The Relationship between Carbon Dioxide and Agriculture in Ghana: A Comparison of VECM and ARDL Model. Env. Sci. Pollut. Res. 2016, 23, 10968–10982. [Google Scholar] [CrossRef] [PubMed]
  3. Goglio, P. A Comparison of Methods to Quantify Greenhouse Gas Emissions of Cropping Systems in LCA. J. Clean. Prod. 2018, 172, 4010–4017. [Google Scholar] [CrossRef]
  4. Grace, P.R.; Antle, J.; Aggarwal, P.K.; Ogle, S.; Paustian, K.; Basso, B. Soil Carbon Sequestration and Associated Economic Costs for Farming Systems of the Indo-Gangetic Plain: A Meta-Analysis. Agric. Ecosyst. Environ. 2012, 146, 137–146. [Google Scholar] [CrossRef]
  5. Just, C.; Armbruster, M.; Barkusky, D.; Baumecker, M.; Diepolder, M.; Döring, T.F.; Heigl, L.; Honermeier, B.; Jate, M.; Merbach, I.; et al. Soil Organic Carbon Sequestration in Agricultural Long-Term Field Experiments as Derived from Particulate and Mineral-Associated Organic Matter. Geoderma 2023, 434, 116472. [Google Scholar] [CrossRef]
  6. Don, A.; Seidel, F.; Leifeld, J.; Kätterer, T.; Martin, M.; Pellerin, S.; Emde, D.; Seitz, D.; Chenu, C. Carbon Sequestration in Soils and Climate Change Mitigation—Definitions and Pitfalls. Glob. Chang. Biol. 2024, 30, e16983. [Google Scholar] [CrossRef]
  7. Shang, J.; Yang, G.; Yu, F.W. Agricultural greenhouse gases emissions and influencing factors in China. Chin. J. Eco-Agric. 2015, 23, 354–364. [Google Scholar] [CrossRef]
  8. He, H.S.; Fu, B.J. Measurement of agricultural carbon emission and pressure of emission reduction in main grain-producing areas of China. Ecol. Econ. 2019, 35, 99–104. [Google Scholar]
  9. Yang, G.; Chen, Y. China’s agriculture carbon sink estimation and its coupling analysis with agricultural economy development. China Popul. Resour. Environ. 2016, 26, 171–176. [Google Scholar] [CrossRef]
  10. Tian, Y.; Yin, M.H. Re-evaluation of China’s agricultural carbon emissions: Basic status, dynamic evolution and spatial spillover effects. Chin. Rural. Econ. 2022, 3, 104–127. [Google Scholar]
  11. He, Y.Q.; Chen, R.; Wu, H.Y.; Xu, J.; Song, Y. Spatial dynamics of agricultural carbon emissions in China and the related driving factors. Chin. J. Eco-Agric. 2018, 26, 1269–1282. [Google Scholar] [CrossRef]
  12. Wang, L.; Liu, Y.Y.; Zhang, Y.H.; Dong, S.H. Spatial and temporal distribution of carbon source/sink and decomposition of influencing factors in farmland ecosystem in Henan Province. Acta Sci. Circumstantiae 2022, 42, 410–422. [Google Scholar] [CrossRef]
  13. Cui, P.F.; Zhu, X.Q.; Li, W. Dynamic evolution and influencing factors analysis of carbon emissions in Chinese agriculture. World Agric. 2018, 4, 127–134. [Google Scholar] [CrossRef]
  14. Wu, G.Y.; Liu, J.D.; Yang, L.S. Dynamic Evolution of China’s Agricultural Carbon Emission Intensity and Carbon Offset Potential. China Popul. Resour. Environ. 2021, 31, 69–78. [Google Scholar] [CrossRef]
  15. Zhang, L.Q.; He, T.T. Spatiotemporal of agricultural carbon emission and decoupling in China during 1997-2018: An empirical research based on spatial and distribution dynamics method. J. Yunnan Agric. Univ. (Soc. Sci.) 2022, 16, 78–90. [Google Scholar] [CrossRef]
  16. Lessmann, M.; Ros, G.H.; Young, M.D.; De Vries, W. Global Variation in Soil Carbon Sequestration Potential through Improved Cropland Management. Glob. Change Biol. 2022, 28, 1162–1177. [Google Scholar] [CrossRef]
  17. Gao, B.; Fang, J.; Xu, Q.T.; Li, Y.B.; Lu, X.L. Dynamic change and analysis of reduction potential of agricultural carbon emissions in Baicheng city. J. Chin. Agric. Mech. 2016, 37, 195–203. [Google Scholar] [CrossRef]
  18. Li, Y.; Ge, Y.X.; Liu, A.H.; Liang, Y. Research on agricultural ecological compensation mechanism based on carbon sequestration function of grain crops. Agric. Econ. Issues 2014, 35, 33–40. [Google Scholar] [CrossRef]
  19. Zhang, J.W.; Zhang, J.H.; Wu, F.W. Analysis of carbon emissions and emission reduction pathways in China’s grain production. Stat. Decis. Mak. 2018, 34, 168–172. [Google Scholar] [CrossRef]
  20. Cai, Y.R.; Wang, L.G. Carbon sequestration and greenhouse gas mitigation paths and modes in a typical agroecosystem in northern China. Chin. J. Eco-Agric. 2022, 30, 641–650. [Google Scholar] [CrossRef]
  21. Yan, S.J.; Deng, A.X.; Shang, Z.Y.; Tang, Z.W.; Chen, C.Q.; Zhang, J.; Zhang, W.J. Characteristics of carbon emission and approaches of carbon mitigation and sequestration for carbon neutrality in China’s crop production. Acta Agron. Sin. 2022, 48, 930–941. [Google Scholar] [CrossRef]
  22. Li, Q.; Gao, W.; Wei, J.F.; Jiang, Z.F.; Zhang, Y.; Lyu, J.X. Spatiotemporal evolution and comprehensive zoning of net carbon sink in cultivated land use in China. Trans. Chin. Soc. Agric. Eng. 2022, 38, 239–249. [Google Scholar] [CrossRef]
  23. Wu, H.Y.; Meng, Y.; Huang, H.J.; Chen, W.K. Spatiotemporal Coupling Between the Net Carbon Sequestration of Cropland Use and Agricultural Production in China. J. Soil Water Conserv. 2022, 36, 361–376. [Google Scholar] [CrossRef]
  24. Wen, S.; Hu, Y.; Liu, H. Measurement and Spatial–Temporal Characteristics of Agricultural Carbon Emission in China: An Internal Structural Perspective. Agriculture 2022, 12, 1749. [Google Scholar] [CrossRef]
  25. Hu, C.; Fan, J.; Chen, J. Spatial and Temporal Characteristics and Drivers of Agricultural Carbon Emissions in Jiangsu Province, China. Int. J. Environ. Res. Public Health 2022, 19, 12463. [Google Scholar] [CrossRef] [PubMed]
  26. Zhang, Q.Q.; Qu, Y.B.; Zhan, L.Y.; Su, D.S.; Wei, C.C. Dynamic evolution and driving effects of carbon emissions from grain production in China. Acta Geograhica Sin. 2023, 78, 2186–2208. [Google Scholar] [CrossRef]
  27. Miao, Q.; Zhai, Y.J.; Hu, L.L. Spatial differential and dynamic evolution of carbon emission efficiency of grain production in five provinces of Huang-Huai-Hai region. Bull. Soil Water Conserv. 2024, 44, 389–398. [Google Scholar] [CrossRef]
  28. Zhang, H.; Zhang, L.W.; He, Z.H. The spatiotemporal distribution and driving factors of agricultural net carbon sink in northeast agricultural areas. J. Agric. Resour. Environ. 2024, 41, 505–517. [Google Scholar] [CrossRef]
  29. Zhou, Y.F.; Li, B.; Zhang, R.Q. Spatiotemporal evolution and influencing factors of agricultural carbon emissions in Hebei Province at the county scale. Chin. J. Eco-Agric. 2022, 30, 570–581. [Google Scholar] [CrossRef]
  30. Gao, J.; Zhao, R.; Zhan, Y. Land Comprehensive Carrying Capacity of Major Grain-Producing Areas in Northeast China: Spatial–Temporal Evolution, Obstacle Factors and Regulatory Policies. Sustainability 2022, 14, 11322. [Google Scholar] [CrossRef]
  31. Tian, Y.; Wu, H.T. Research on fairness of agricultural carbon emissions in China major grain producing areas from the perspective of industrial structure. Agric. Technol. Econ. 2020, 1, 45–55. [Google Scholar] [CrossRef]
  32. Li, B.; Wang, C.Y.; Zhang, J.B. Dynamic evolution and spatial spillover of China agricultural net carbon sink. China Popul. Resour. Environ. 2019, 29, 68–76. [Google Scholar] [CrossRef]
  33. Wang, Y.N.; Zhang, Q.L.; Chen, W. Study on provincial agricultural carbon emission and emission reduction potential based on carbon sink function: Taking China three main grain crops as an example. Chong Qing Soc. Sci. 2022, 5, 58–75. [Google Scholar] [CrossRef]
  34. Sun, X.X.; Zhang, H.B.; Yu, Y.P. Spatial and temporal dynamics in carbon source/sink and equity of the farmland ecosystem in Jiangsu coastal area, China. Chin. J. Agric. Resour. Reg. Plan. 2021, 42, 56–64. [Google Scholar]
  35. Luo, H.L. Advances on carbon storage in crops of China. Ecol. Environ. Sci. 2014, 23, 692–697. [Google Scholar] [CrossRef]
  36. Han, Z.Y.; Meng, Y.L.; Xu, J.; Hu, Y.; Zhou, Z.G. Temporal and spatial difference in carbon footprint of regional farmland ecosystem ─Taking Jiangsu Province as a Case. J. Agro-Environ. Sci. 2012, 31, 1034–1041. [Google Scholar]
  37. Han, B.; Wang, X.K.; Lu, F.; Duan, X.N.; Ouyang, Z.Y. Soil carbon sequestration and its potential by cropland ecosystems in China. Acta Ecol. Sin. 2008, 2, 612–619. [Google Scholar] [CrossRef]
  38. Yang, Q.; Si, X.H.; Wang, J. The measurement and its distribution dynamic evolution of grain production efficiency in China under the goal of reducing pollution emissions and increasing carbon sink. J. Nat. Resour. 2022, 37, 600–615. [Google Scholar] [CrossRef]
  39. Zhang, Y.; Li, H.; Zhao, Z.H. Research on the effects of grain crop planting changes on agricultural carbon emissions between provinces in China. Chin. J. Agric. Resour. Reg. Plan. 2023, 44, 29–38. [Google Scholar] [CrossRef]
  40. Cui, H.; Wang, B.C.; Zhou, M.S. Spatiotemporal evolution and driving factors of China’s agricultural carbon emissions. Chin. J. Eco-Agric. 2024, 32, 1097–1108. [Google Scholar] [CrossRef]
  41. Pergner, I.; Lippert, C. On the Effects That Motivate Pesticide Use in Perspective of Designing a Cropping System without Pesticides but with Mineral Fertilizer—A Review. Agron. Sustain. Dev. 2023, 43, 24. [Google Scholar] [CrossRef]
  42. Mostafaeipour, A.; Bidokhti, A.; Fakhrzad, M.-B.; Sadegheih, A.; Zare Mehrjerdi, Y. A New Model for the Use of Renewable Electricity to Reduce Carbon Dioxide Emissions. Energy 2022, 238, 121602. [Google Scholar] [CrossRef]
  43. Dong, X.L.; Zheng, L.Q.; Lian, H.F.; Tian, B.L.; Chen, Z.Y. The spatiotemporal dynamics and drivers of China’s agricultural net carbon sink. J. Soil Water Conserv. 2024, 38, 198–208. [Google Scholar] [CrossRef]
  44. Cui, Y. Regional Difference Decomposition and Its Spatiotemporal Dynamic Evolution of Chinese Agricultural Carbon Emission: Considering Carbon Sink Effect. Env. Sci. Pollut. Res. 2021, 28, 38909–38928. [Google Scholar] [CrossRef]
  45. Yu, C. Regional Differential Decomposition and Convergence of Rural Green Development Efficiency: Evidence from China. Env. Sci. Pollut. Res. 2020, 27, 22364–22379. [Google Scholar] [CrossRef]
  46. Zhang, W.J.; Cyan, S.J.; Czhang, J.; Cjiang, Y.; Cdeng, A.X. Win-win strategy for national food security and agricultural double-carbon goals. Sci. Agric. Sin. 2021, 54, 3892–3902. [Google Scholar] [CrossRef]
Figure 1. The spatial distribution of China’s three major grain functional areas. Note: Hong Kong, Macao, and Taiwan were not included in the study due to missing data caused by differences in statistical calibers, data collection methods, and management systems.
Sustainability 16 10455 g001
Figure 2. The change of carbon sequestration and emission reduction ability of agricultural planting in different grain functional areas of China.
Sustainability 16 10455 g002
Figure 3. The changes in carbon sources and sinks from agricultural planting in different grain functional areas of China. (a) Carbon emissions from agricultural planting; (b) agricultural planting carbon sink.
Sustainability 16 10455 g003
Figure 4. The average carbon sequestration and emission reduction capacity of agricultural planting in different grain functional areas in China from 2000 to 2020. Note: The dashed lines in the figure represent the value lines for F = 1.0 and F = 2.0, respectively.
Sustainability 16 10455 g004
Figure 5. LISA cluster distribution of carbon sequestration and emission reduction capacity of agricultural cultivation in China.
Sustainability 16 10455 g005
Figure 6. Temporal changes in the overall, interval, and intra-regional Theil index of carbon sequestration and emission reduction capacity of Chinese agricultural plantations.
Sustainability 16 10455 g006
Figure 7. Interval-region Theil index of carbon sequestration and emission reduction in agricultural planting in China’s grain functional areas.
Sustainability 16 10455 g007
Figure 8. The Theil index within the carbon sequestration and emission reduction zones of agricultural cultivation in different functional grain areas in China.
Sustainability 16 10455 g008
Figure 9. Kernel density curves of carbon sequestration and emission reduction from agricultural cultivation in the whole country and the three major functional grain zones.
Sustainability 16 10455 g009
Table 1. Carbon emission factors and sources of agricultural substances.
Agricultural MaterialsCarbon Emission CoefficientData Sources
Chemical fertilizer898.40/(kg/t)ORAL
Pesticides4940.15/(kg/t)ORAL
Agricultural film5180.00/(kg/t)IREEA
Agricultural diesel592.70/(kg/t)Wu et al. [14]
Farmland plowing312.60/(kg/hm2)IREEA
Irrigation of farmland266.48/(kg/hm2)Li et al. [32]
Note: ORNL is the Oak Ridge National Laboratory; IREEA is the Institute of Agricultural Resources, Ecosystems and Environment, Nanjing Agricultural University.
Table 2. Water content, economic coefficients, carbon uptake, and root–crown ratios of major grain crops.
Main Grain CropsMoisture Content
(Wi)
Economic Coefficient
(Li)
Carbon Absorption Rate
(Bi)
Root Shoot Rate
(Ri)
Wheat0.1200.4000.4850.166
Corn0.1300.4000.4710.170
Rice0.1200.4500.4140.125
Table 3. The global Moran’s index for carbon sequestration and emission reduction capacity in agricultural planting in China and three major grain functional areas.
YearNational LevelMain Production AreaProduction and Marketing AreaMain Marketing Area
IGZp-ValueIGZp-ValueIGZp-ValueIGZp-Value
20000.1652.6300.009−0.113−0.1800.481−0.357−1.7210.0220.6051.8510.041
20100.3264.7450.0010.1281.2480.119−0.129−0.1930.4670.7272.2260.050
20200.4286.2870.0010.2952.2350.0250.1661.3570.098−0.201−0.3140.359
Table 4. The sources and contributions of the differences in carbon sequestration and emission reduction in agricultural planting among the three major grain functional areas in China from 2000 to 2020.
Year MPA PMA MMA T W B C T W R C Year MPA PMA MMA T W B C T W R C
200048.50
75.05
9.19
14.72
42.31
10.23
59.1140.89 201160.11
86.05
18.79
11.14
21.09
2.81
57.64 42.36
200155.66
80.08
3.72
11.44
40.62
8.48
57.3742.63201260.08
85.74
19.04
11.56
20.88
2.70
57.7742.23
200254.12
81.27
5.66
11.67
40.22
7.06
55.68 44.32 201360.50
86.24
20.39
11.46
19.10
2.30
57.78 42.22
200346.37
76.49
13.60
16.48
40.03
7.03
56.64 43.36 201460.44
85.57
22.02
12.31
17.54
2.13
58.14 41.86
200459.33
80.65
6.25
13.41
39.42
5.94
54.67 45.33 201560.75
85.98
22.24
12.01
17.00
2.02
58.38 41.62
200559.44
83.53
1.84
11.12
38.72
5.35
54.09 45.91 201660.58
85.15
23.09
12.84
16.33
2.01
58.93 41.07
200660.52
84.75
4.94
10.42
34.53
4.83
54.51 45.49 201762.27
87.95
23.06
10.63
14.68
1.42
58.30 41.70
200760.78
85.57
9.85
10.36
29.37
4.07
56.74 43.26 201862.21
87.71
23.46
10.87
14.34
1.42
58.27 41.73
200860.57
86.14
13.74
10.40
25.69
3.46
56.89 43.11 201962.14
88.07
24.08
10.58
13.78
1.35
58.11 41.89
200960.34
86.10
12.96
10.05
26.70
3.84
57.96 42.04 202061.87
87.57
24.32
11.04
13.81
1.38
58.25 41.75
201060.39
85.72
14.12
10.92
25.50
3.36
56.87 43.13
Note: MPA stands for main producing area, PMA stands for producing and marketing area, and MMA stands for main marketing area; the underlined data is the contribution rate of inter-area variance to the total inter-area variance, while the non-underlined data is the contribution rate of intra-area variance to the total intra-area variance; and TWBC and TWRC are the contribution rates of total inter-area and total intra-area variance to the overall national variance, respectively.
Disclaimer/Publisher’s Note: The statements, opinions and data contained in all publications are solely those of the individual author(s) and contributor(s) and not of MDPI and/or the editor(s). MDPI and/or the editor(s) disclaim responsibility for any injury to people or property resulting from any ideas, methods, instructions or products referred to in the content.

