Article

Assessing Drought Risk and the Influence of Climate Projections in Sri Lanka for Sustainable Drought Mitigation via Geospatial Techniques

by
S. D. Sachini Kaushalya Dissanayake
1,2,
Yuanshu Jing
1,2,* and
Tharana Inu Laksith
3
1
Collaborative Innovation Center on Forecast and Evaluation of Meteorological Disasters (CIC-FEMD), Nanjing University of Information Science and Technology, Nanjing 210044, China
2
Jiangsu Key Laboratory of Agricultural and Ecological Meteorology, School of Applied Meteorology, Nanjing University of Information Science and Technology, Nanjing 210044, China
3
Post Graduate Institute of Science, University of Peradeniya, Peradeniya 20400, Sri Lanka
*
Author to whom correspondence should be addressed.
Sustainability 2024, 16(23), 10375; https://doi.org/10.3390/su162310375
Submission received: 26 September 2024 / Revised: 21 November 2024 / Accepted: 23 November 2024 / Published: 27 November 2024

Abstract

:
Sri Lanka is highly vulnerable to climatic change, making drought risk assessment an essential tool for the development of effective mitigation strategies. This study addresses existing gaps by employing geospatial techniques to evaluate drought risk in Sri Lanka and focusing on future trends in temperature and precipitation. The observed meteorological data, projected climate variables, and environmental factors were analyzed using the standardized precipitation evapotranspiration index (SPEI). Key findings show that the northwestern and southern regions of Sri Lanka are particularly susceptible to increased drought hazards, while the southwestern region, characterized by the highest density of built-up areas, is also more vulnerable. A combination of hazard and vulnerability data reveals that the northwestern, upper–central, and southern regions exhibit relatively high drought risk. The spatial distributions of the predicted meteorological variables align closely with current patterns, and significant increasing trends were observed under the SSP 2.6 and SSP 8.5 scenarios. Precipitation and temperature correlate with drought, indicating an elevated risk of future drought events. This study provides a comprehensive understanding of the interplay between climate change and drought risk in Sri Lanka, offering valuable insights for policymakers and resource managers to develop sustainable drought mitigation plans.

1. Introduction

Drought is a significant natural disaster that adversely affects humans across many regions of the world [1,2,3]. Sri Lanka, an island nation located south of the Indian subcontinent [4], is no exception to these effects [5,6]. The Department of Disaster Information, Sri Lanka “http://www.desinventar.lk (accessed on 23 August 2023)”, stated that variations in temperature and precipitation are the key driving factors affecting drought in the country. A fact sheet released by the United States Agency for International Development (USAID) based on Coupled Model Intercomparison Project Phase 6 (CMIP6) data [7] indicates that the temperature and rainfall in Sri Lanka are projected to increase in the near future under various greenhouse gas emission scenarios [8]. Consequently, it is crucial to understand drought risk [9,10,11] to develop effective strategies for mitigating its impacts [12,13,14].
Global climate change has become increasingly evident in recent years, accelerated by human activities [15,16,17]. This, in turn, has led to an increase in the frequency of natural disasters [18]. Recent studies have highlighted changes in the Sri Lankan climate as a result of global climate change [19]. Floods, droughts, landslides, cyclones, and tsunamis are the most frequent natural disasters in Sri Lanka [20], with drought events occurring more frequently in recent years [21]. Drought, defined as a prolonged water shortage in a specific area [22], is closely influenced by temperature fluctuations [23]. Although drought may develop gradually, its impacts can be long-lasting [24]. To identify drought events, various drought indices have been introduced and widely adopted worldwide [25,26]. The standardized precipitation evapotranspiration index (SPEI) is utilized in this study because of its superior performance in calculating drought [27,28,29]. The SPEI accounts for both water input as precipitation and water loss as evapotranspiration via temperature [30].
Several studies have been conducted on drought characteristics such as frequency, intensity, and duration in Sri Lanka [31]. Ref. [32] studied drought-prone areas in the country, whereas [33] emphasized the importance of drought risk reduction in the dry zone of Sri Lanka. Nevertheless, a knowledge gap remains in the study of drought risk assessment [34,35]. Ref. [36] reported that drought risk assessment is a stepped process. The process consists of calculating drought hazards, assessing vulnerability to drought, and estimating potential high-risk areas [9,36]. In [37], a novel method was discussed to analyze the spatial and temporal variations in agricultural drought via hazard and exposure in Heilongjiang Province, China. Another study conducted in Nebraska, United States of America (USA), suggested a drought risk assessment model based on agricultural yield loss [38]. In Bangladesh, socioeconomic factors such as population density, the female-to-male ratio, and poverty level were used to assess drought vulnerability [9]. Ref. [39] used drought hazard and vulnerability data to calculate drought risk in Southwest China. Ref. [40] used environmental factors to study vulnerability to drought on a global scale. Another global-scale drought risk assessment was conducted by the authors of [41] using irrigated and rain-fed systems to calculate drought hazards.
CMIP6 provides a collection of global climate models that help in understanding predicted global climate change and its implications. It employs different shared socioeconomic pathways (SSPs) to present various predictions of the future climate based on the evolution of greenhouse gas concentrations over the next century [42]. Given the recent fluctuations in temperature and precipitation patterns [43,44], climate models can be used to predict future variations. Geospatial techniques, particularly geographic information systems (GISs) and remote sensing, play crucial roles in expressing the spatial distribution of results with enhanced clarity and understanding [45,46,47]. When combined with remote sensing technologies, GIS is a powerful tool for assessing natural disasters [48]. The authors of [49] used GIS techniques to categorize drought risk in Ethiopia. In Pakistan [50] and India [51], the normalized difference vegetation index (NDVI) has been used as a remote sensing technique to assess drought. The authors of [52] also used GIS to characterize and study drought hazards in China. Another study [53] used remote sensing big data to calculate the spatial and temporal characteristics and factors influencing drought in southern China.
Given this context, this study takes on added urgency, employing geospatial techniques to assess and map the drought risk across Sri Lanka, with a keen focus on projected climate trends. This study uses observed precipitation and temperature data to evaluate drought hazards across Sri Lanka, which are quantified through specific drought indices. The vulnerability of different regions is then determined by integrating meteorological and environmental factors via advanced geospatial techniques. By combining drought hazard and vulnerability assessments, the overall drought risk in Sri Lanka can be calculated. Additionally, projected temperature and precipitation data are analyzed to identify future climate patterns, with trend analysis conducted to examine the potential influence of these variables on future drought occurrences in Sri Lanka.

2. Materials and Methods

2.1. Data

There two main types of data used in this study. The tabular data include daily observation data for precipitation and maximum and minimum temperatures from 1972 to 2021 at 15 locations across all the provinces provided by the Department of Meteorology, Sri Lanka. These data were selected on the basis of continuous data availability. CMIP6-predicted climate data from 2020 to 2100 under two different SSPs—SSP2.6 and SSP8.5—were selected as the least-case scenario and worst-case scenario. The data are freely available at “https://climateknowledgeportal.worldbank.org/ (accessed on 17 March 2024)”.
Remote sensing data containing land use and land cover, soil type, and elevation data were used to identify the environmental factors affecting drought vulnerability. The land use and land cover data were downloaded from the data archive of the official website of the Environmental Systems Research Institute (ESRI) Living Atlas “https://livingatlas.arcgis.com/landcover/ (accessed on 15 September 2023)”. These data are high-resolution (10 m), accurate, comparable, and free to use (open access data). These data were reanalyzed via the production of the SENTINAL-2 satellites. Global soil-type data were downloaded from the website of the map archive of the Food and Agriculture Organization (FAO) of the United Nations “https://www.fao.org/soils-portal/data-hub/soil-maps-and-databases/faounesco-soil-map-of-the-world/en/ (accessed on 17 September 2023)”. Elevation data were downloaded from the National Aeronautics and Space Administration Shuttle Radar Topography Mission (NASA SRTM) map archive with a spatial resolution of 1 arc second “https://www.earthdata.nasa.gov/ (accessed on 17 September 2023)”.

2.2. Methodology

2.2.1. Distributions of Average Temperature and Precipitation

The observed meteorological data were tabular in form, with missing values. These data were preprocessed to identify and omit possible outliers. An outlier is a data entry different from other data in the datasheet that can be described as an extreme value [54]. This was done by assessing normal distribution curves of tabular data via descriptive statistics in the SPSS Statistics 21 software package. The dataset was then treated with multiple imputation methods [55] to fill out the missing values. Then, spatial distribution techniques were used in the ArcGIS Pro 3 environment to develop their distributions across Sri Lanka.

2.2.2. Drought Calculation

The SPEI is a relatively modern drought index that considers precipitation and temperature data to measure drought. This makes it more sensitive to changes in temperature and more accurate under drought conditions. The SPEI [56,57,58] considers the difference between precipitation and evapotranspiration. In the present study, a library called climate data tools (CDT) was used in the R Studio 4.2 environment for the calculation of the SPEI. The CDT library “https://github.com/rijaf-iri/CDT#readme (accessed on 25 August 2023)” is a collection of powerful tools for working in R studio that allows users to work with climate data simply. Table 1 shows the SPEI drought values with their respective drought categories. Extreme drought has the lowest frequency, whereas near-normal drought has the highest frequency of approximately 45% during this period.

2.2.3. Correlations of Drought with Temperature and Precipitation

The correlation coefficient is a measurement of how strong the relationship between the considered variables is. Pearson’s correlation measures linear correlations between a pair of variables or among a set of variables [59]. Pearson’s correlation can be defined as the covariance of considered variables divided by their standard deviation. The result of Pearson’s correlation coefficient lies between −1 and 1. When the correlation coefficient is 0, there is no relationship. Pearson’s correlation coefficient can be calculated via the following formula. The SPSS Statistics 21 software package was used for the calculations.

2.2.4. Drought Risk Assessment Process

Drought risk assessment is a combined process. The first step involves calculating drought hazards based on the severity of the drought index values [9]. For the validation of SPEI values, we used annual SPEI data from the Laboratory of Climate Services and Climatology (LCSC) website “https://lcsc.csic.es/contact/ (accessed on 5 October 2023)” due to the lack of published historical drought data in Sri Lanka. The Pearson correlation coefficient was used to evaluate the linear relationship between the datasets. The drought values from the SPEI were categorized into normal, moderate, severe, and extreme drought events and assigned intensity values. The frequency of drought events was calculated. These frequencies were multiplied by the intensity value to assess drought hazard. Then, spatial distribution techniques were used to visualize drought hazards in Sri Lanka.
As the next step, hazard data were normalized. Data normalization transformed the data into a common scale to omit anomalies in the data. This was done to reduce the effect of the measurement scale on the analysis. Drought vulnerability is the degree to which an area is susceptible to the negative impacts of drought events. This study calculated drought vulnerability by combining and overlaying meteorological and environmental variables [36]. Land use, soil type, elevation, slope, precipitation, and mean temperature were selected as variables. In the first step, all the variables were reclassified via GIS techniques for normalization. Then, a weight was added based on the influence of the factor on drought events. Some assumptions were made in this step. The first assumption is that areas with higher annual rainfall are less prone to drought and that the temperature in the atmosphere decreases with elevation. These conditions make an area less prone to drought [60]. The second assumption is that increasing temperature might increase vulnerability to drought [23]. The third assumption is that different land use types and soil structures could influence drought vulnerability in a given area [61]. These weighted layers were then overlaid via a GIS environment. In this study, the fuzzy overlay method was used [62]. Fuzzy overlay is a spatial analysis technique in which a mathematical framework that can handle uncertainty and imprecision in data, called the fuzzy method, is used to combine multiple data layers into a single composite layer. The final step of the drought risk calculation was calculated via raster calculator tools in the ArcGIS Pro 3 software package.

2.2.5. Trend Analysis of the Predicted Temperature and Precipitation

Statistical methods can be used to study whether predicted temperature and precipitation data tend to increase or decrease. The Mann–Kendall (MK) test can be used to calculate data that have increasing or decreasing trends in long-term meteorological datasets [63].
S = i = 1 n 1 j = i + 1 n s i g n ( X j X i )
where S is the test statistic, n is the sample size (number of data points), and X i and X j are the data values. To identify the direction of the trend, Z statistics can be used as follows:
Z = S 1 v a r ( S ) ,   i f   S > 0 0 ,   i f   S = 0 S + 1 v a r ( S ) ,   i f   S < 0
When Z > 0, the trend tends to increase, whereas when Z < 0, the trend tends to decrease and Z = 0 represents no trend. The MK test only detects the presence and direction of the trend. Sen’s slope [64] can be used to calculate the magnitude of the trend as follows:
β = M e d i a n X j X i j i ,   j > i
where β represents the magnitude of the trend.

3. Results

3.1. Spatial Distribution of Current Annual Rainfall and Mean Temperature

The spatial distribution of annual rainfall is represented in Figure 1. The map shows that the spatial distribution of rainfall ranges from approximately 910 mm to 3700 mm. According to the figure, districts such as “Rathnapura” in the southwestern region had the highest annual precipitation. This area is also called the wet zone of Sri Lanka [65]. The lowest precipitation occurred in the northwestern and southern parts of the country, such as “Mannar” and “Hambantota”. The dry zone is located in the northwestern regions along the southeastern parts of the island via the northeastern and eastern provinces. For example, a relatively greater amount of precipitation was observed in the “Batticaloa”, “Trincomalee”, and “Vavunia” districts than in other areas of the dry zone, with values of approximately 1700 mm, 1560 mm, and 1400 mm, respectively. The lowest precipitation values are observed in “Mannar” in the northwestern and “Hambantota” in the southern parts of the dry zone.
The spatial distribution of the current mean temperature of Sri Lanka is shown in Figure 2. The temperature in Sri Lanka ranges from 16 to 29 °C. For example, “Nuwara Eliya” is the coolest district, whereas “Trincomalee” is the warmest district, which are the wet zone and the dry zone of the country, respectively. The coastal areas of Sri Lanka tend to have higher mean temperatures than the central montane region. Specifically, the northwestern and 181 eastern coastal areas tend to have the warmest mean temperatures, ranging from 27 to 29 °C. In contrast, the central highlands have cooler mean temperatures, ranging from 16 to 21 °C.

3.2. Drought Hazard

The overall correlation coefficient was r = 0.54 (p < 0.01) between calculated SPEI values from observed data and published remotely sensed SPEI data. Table A1 represents the correlation coefficient values. This indicates a significant positive association between the data. The determination of drought hazards involves multiplying the drought severity by its frequency. Figure 3 displays the spatial distribution of drought hazards. This figure can be used to identify potentially high-drought-severity areas with a relatively high frequency. The range of hazard levels is normalized into scales of 0 to 1 representing low to high hazard levels, shows that the “Puttalam”, “Katugastota”, and “Hambantota” areas are associated with relatively high drought hazard levels. For example, drought severity in these areas is high and much more frequent. In contrast, areas such as “Colombo”, “Galle”, “Trincomalee”, and “Nuwara Eliya” presented the lowest hazard values. Not only in the dry zone but also in areas much closer to the wet zone of Sri Lanka, such as “Kurunegala”, have greater drought hazards.

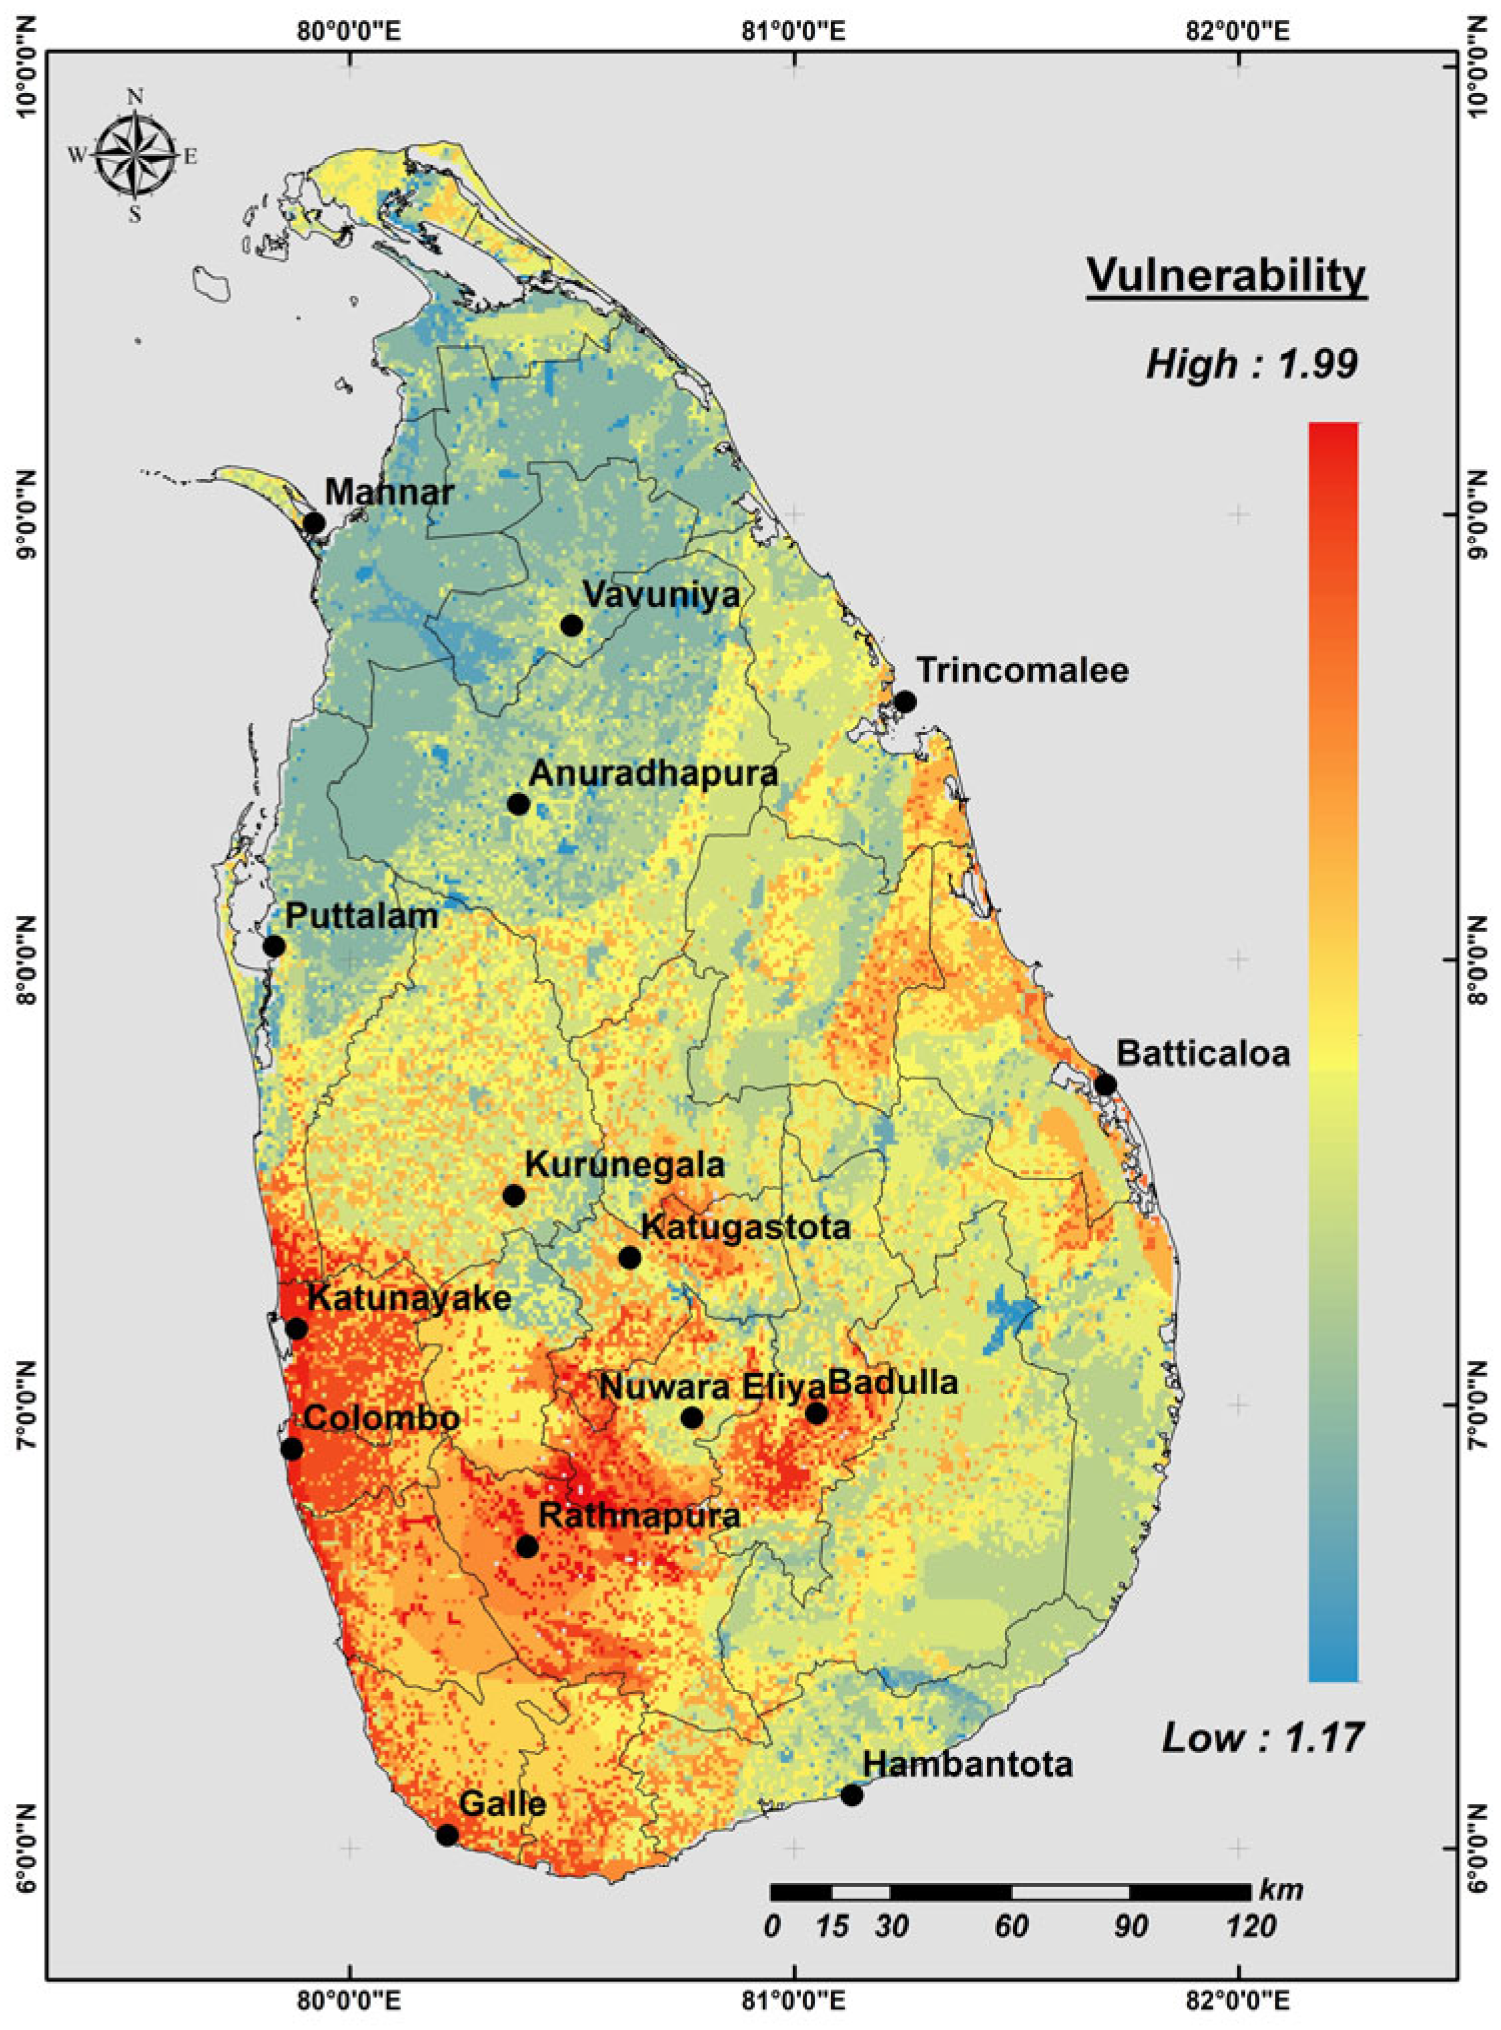
3.3. Vulnerability to Drought

After the drought hazard was assessed, the drought-vulnerable areas were computed. For the calculation of vulnerability to drought, a value was added to factors influencing drought vulnerability from 1 to 5 as a weight for the level of vulnerability with the order of increasing vulnerability. All these factors were then reclassified according to their weighted scale via geospatial technologies. These maps were overlaid to determine drought vulnerability. Table 2 shows the selected factors and their importance to drought vulnerability.
Figure 4 shows the spatial distributions of the selected environmental factors. The spatial distributions of the rainfall and temperature maps are shown in Figure 1 and Figure 2, respectively. The elevation of Sri Lanka ranges from 0 at the mean sea level to 2523 m. Figure 4a shows the elevation distribution. Higher elevations are clustered in the central and southwestern parts of the country. There are three main elevation levels in Sri Lanka [66]: coastal grounds, intermediate lands, and central highlands. The land use types of Sri Lanka are represented in Figure 4b. Different land cover types are reclassified into 5 main types: water bodies, forests, vegetation/grasslands, bare soil, and built-up areas. The built-up areas are located in the western and central parts, as well as the northern tip, of the country. Most of the country is covered by forest and vegetation. According to the soil-type map in Figure 4c, five main soil types were identified: water, clay loam, sandy clay loam, loam, and sandy loam. The sandy clay loam in the northern, north–central, and southeastern regions and the loam soil in the southwestern to central regions cover most of the country.
Figure 5 shows the drought vulnerability map of Sri Lanka. The vulnerability level is often classified into several categories, such as low, moderate, high, and very high. The map shows that the vulnerability ranges from 1.17 to 1.99. The highest vulnerabilities are clustered in the southwestern region of the country. Higher population density, dense built-up areas and a considerably lower amount of vegetative areas are significant in this area, which might be the reason for its greater vulnerability to drought. The drought vulnerability of the country gradually decreases from highly urbanized areas in the south of the country to northern regions. Another low-vulnerability area is clustered in the southeastern part of the country. Two national parks, “Kumana” and “Yala”, are located there [67].

3.4. Drought Risk

Drought risk is a combination of drought hazard and vulnerability, often classified from low to very high. In this study, drought risk is represented on a scale ranging from 0.003 to 1.62. The drought risk map of Sri Lanka is presented in Figure 6. High-drought-risk areas include “Puttalam” in the northwestern region, “Katugastota” in the central region, and “Hambantota” in the southern region of the country. This pattern is similar to that of drought hazards, since hazards are computed by drought severity and frequency. For example, areas such as “Anuradhapura” in the dry zone of the country presented relatively low drought risk. In contrast, Eastern regions such as “Trincomalee” and western regions such as “Colombo” and “Galle” in the wet zone of southern China presented the lowest drought risk.

3.5. Influence of Projected Temperature and Rainfall on Drought from 2021 to 2100

Drought can be influenced by temperature and precipitation, and it was calculated via the SPEI based on the observed temperature and precipitation data from 1972 to 2020. Since there are two influencing variables, the correlations of these variables with drought were computed via the Pearson correlation coefficient. Table 3 shows that drought values are positively correlated with precipitation but negatively correlated with temperature. The correlation coefficient between drought and precipitation is approximately 0.208 and is significant. The value is −0.086 for drought and temperature and is not significant.
The spatial distributions of the projected temperature (Figure 7) and precipitation (Figure 8) from 2021 to 2100 were mapped under the SSP 2.6 and SSP 8.5 greenhouse gas emission scenarios. For ease of study, the distribution was divided into 2040, 2060, 2080, and 2100. The predicted temperature distributions under SSP 2.6 and SSP 8.5 are similar but differ in intensity. For example, SSP 8.5 results in much greater saturated mean temperatures than SSP 2.6 does. The extent of less warm areas, indicated in blue in SSP 8.5, is smaller than that in SSP 2.6 from 2040 to 2100.
Since the spatial distributions of the predicted temperature and precipitation exhibited similar distribution patterns, temporal distribution was carried out to study the variations in these variables from 2021 to 2100. Figure 9a represents the annual variations in temperature under SSP 2.6 and SSP 8.5. Both GHG emission scenarios showed increasing trends in 2021. Under SSP 2.6, the temperature increased from 2021 to 2062, then tended to stabilize. In contrast, SSP 8.5 gradually increased throughout the period from approximately 27 °C to 31 °C. Like temperature, predicted precipitation showed an increasing trend under SSP 2.6 and SSP 8.5. Figure 9b shows that SSP8.5 experienced a gradual increase in precipitation from 2021 to 2100. The projected precipitation under the SSP 2.6 scenario increases with variation and tends to decrease after 2062, but overall, SSP 2.6 exhibits an increasing trend.
Both the temperature and precipitation values tended to increase in the SSP 2.6 and SSP 8.5 scenarios; the significance of the trend was calculated via the MK test, and Sen’s slope estimator was used to identify the magnitude of the trend. The significance and Sen’s slope values of the predicted meteorological variables are presented in Table 4 and correspond to their location and scenario. The p values of the predicted temperatures at all locations under the least-case (SSP 2.6) and worst-case (SSP 8.5) scenarios are less than 0. The predicted temperature is significant throughout the period in Sri Lanka. Higher Sen’s slope values resulted in an SSP of 8.5 at approximately 0.04. The Sen’s slope value under SSP 2.6 was lower than that under SSP 8.5, at approximately 0.005. These values are acceptable, since the increasing trend in SSP 8.5 is much greater than that in SSP 2.6. The MK test results for the predicted precipitation differed from those for the predicted temperature. The table shows that the increasing trend of precipitation in Anuradhapura, Batticaloa, Mannar, Trincomalee, and Vavuniya is not significant under SSP 2.6. In contrast, the trend under SSP 8.5 is significant at all the considered locations, with much larger magnitudes.

4. Discussion

4.1. Spatial Distributions of Current Temperature and Precipitation

Drought is a meteorological disaster that occurs in Sri Lanka. Since temperature and precipitation are the major influencing meteorological factors, their distributions were mapped via geospatial techniques. The distribution of precipitation over Sri Lanka revealed that more precipitation was clustered in the southwestern part of the country, which is the wet zone of the country, and minimum precipitation was distributed in the northwestern and southern parts of the country. These results were similar to those reported in [68], in which the spatiotemporal variations in rainfall over Sri Lanka were studied at a seasonal scale. In contrast to precipitation, the distribution of temperature was cooler in the central parts of the country, whereas coastal areas presented hotter conditions. Ref. [69] reported similar temperature variations across the country. Since central Sri Lanka is well known for its hills and mountain range, relatively low temperatures are evident there.

4.2. Drought Risk Assessment

Drought risk assessment is a combined process that can assess drought hazard and vulnerability. One of the main limitations of this study was the absence of groundwater data. According to the authors’ knowledge ground water has not been effectively observed in the country. There was a notable variation between the correlation coefficient values between observed and remotely sensed data in the validation. This was due to the geospatial difference. Observation stations record values in proximity to the premises, but satellites cover a broader spatial range at the same time. This could lead to average climate and topographical variation within the satellite sensor’s spatial resolution, leading to generalized drought rather than ground observations. Similar to [9], drought hazards were calculated based on the severity and frequency of drought, with high-hazard areas in the northwestern and southern parts of the dry zone and central Sri Lanka in Katugastota. Since other areas of central Sri Lanka are less hazard-prone, factors other than meteorological variables could be influenced. An area could be vulnerable to drought based on land, soil, elevation, etc. Therefore, drought vulnerability can be assessed by integrating meteorological and environmental factors [70]. Land use type, soil type, and elevation were chosen as environmental factors that can influence drought vulnerability. The spatial distribution of drought vulnerability revealed greater vulnerability on the western and west sides of the southern regions toward the central parts of the country. This may be because these parts of Sri Lanka are the most populated area and have the most urbanized land. Drought risk was integrated by combining and overlaying the values of drought hazard and vulnerability via GIS techniques [61]. The areas with the highest drought risk are located in “Puttalam” in northwestern Sri Lanka, “Hambantota” in southern Sri Lanka, and “Katugastota” in central Sri Lanka.

4.3. Influence of Projected Temperature and Rainfall on Future Drought Events

The analysis revealed a significant positive correlation between the precipitation and SPEI values; an increase in precipitation resulted in higher SPEI values, indicative of wetter conditions. Conversely, the temperature and SPEI values exhibited a negative correlation, where an increase in temperature was associated with lower SPEI values, indicating drier conditions. However, the influence of precipitation on drought conditions appears to be more pronounced, as the correlation between temperature and the SPEI was not found to be significant.
Given the substantial impact of temperature and precipitation on drought, CMIP6-predicted values were mapped to assess their future distributions. The spatial distribution of these variables from 2021 to 2100 is expected to mirror current patterns, albeit with increased intensity under both SSP scenarios. Consequently, the temporal distributions of these variables were examined further. The analysis revealed increasing trends in both temperature and precipitation across the considered scenarios. Specifically, the temperature under SSP 8.5 gradually increased from 2021 to 2100, while SSP 2.6 also exhibited an increasing trend, although to a lesser extent than SSP 8.5. In contrast, precipitation exhibited greater inter-annual variability within its increasing trend.
To quantify the significance and magnitude of these trends, the Mann–Kendall test was employed alongside Sen’s slope estimator. The results indicated a significant increasing trend in temperature under both the SSP 2.6 scenario and the SSP 8.5 scenario. However, the increasing trend in future precipitation under SSP 2.6 was found to be insignificant across most locations within Sri Lanka’s dry zone, areas also identified as high-drought-risk zones according to the drought risk assessment. In contrast, SSP 8.5 presented significant increases in precipitation across all the considered locations.
These findings suggest that the projected increase in future precipitation could lead to a reduction in drought events within Sri Lanka’s wet zone [71], given the positive and significant correlation between precipitation and the SPEI. Similar to a multi-model future drought characteristic study conducted using CMIP6 data in South Asia [72], high-drought-risk areas in the dry zone may continue to experience drought conditions because of the significant increase in temperature and the lack of significant increases in precipitation under SSP 2.6.

4.4. Implications of Drought Risk Assessment for Sustainable Development in Sri Lanka

Drought risk assessment could be a key tool in addressing sustainable development in a developing country like Sri Lanka. As one of the major implications, sustainable water management [73] practices like improving water storage by managing irrigation systems, effective water allocation, improving water-saving practices with citizen science, etc., can be implemented by identifying highly drought-prone regions using the drought risk assessment maps.
The development of early drought warning systems [74] could be identified as another implication of drought risk assessment with respect to sustainable development. Drought conditions predicted by these systems can be used to efficiently deliver early alerts to agricultural communities. Rainwater harvesting [75] is a popular approach that can be implemented during extended dry periods. The use of climate-resilient agricultural practices is another approach to sustainable development. Authorities can promote crop diversification, encourage the planting of drought-resilient crops, and introduce modified drought-tolerant crop varieties.
Community-based drought management programs like drought awareness and public education camps can be launched as useful tools in rural areas. These programs efficiently aid in increasing local preparedness and awareness of drought events. At the government level, officials can implement national-level climate adaptation plans based on the results of drought risk assessments for sustainable development in Sri Lanka.

5. Conclusions

Given the substantial knowledge gap in understanding drought risk and the influence of future temperature and precipitation patterns on drought in Sri Lanka, this study undertook an integrated drought risk assessment. The assessment incorporated meteorological variables in conjunction with key environmental factors to provide a comprehensive analysis. Additionally, this study investigated the potential impacts of future changes in temperature and precipitation, as projected by climate models.
The findings reveal that the areas at the highest risk of drought are located primarily in the northwestern, southern, and central regions of Sri Lanka. Through correlation analysis, it was determined that precipitation is positively correlated with drought occurrence, whereas temperature is negatively correlated with drought occurrence. The observed trends in projected temperature and precipitation indicate their likely influence on future drought conditions, with a particular emphasis on regional variations. Specifically, the wet zone of Sri Lanka is projected to experience fewer drought events than the dry zone.
These results have significant implications for future research on the interactions between climatic variables and natural disasters. Moreover, they provide a critical foundation for the formulation of natural disaster mitigation strategies and sustainable development aimed at enhancing climate resilience in Sri Lanka.

Author Contributions

Conceptualization, S.D.S.K.D. and Y.J.; methodology, S.D.S.K.D.; formal analysis, S.D.S.K.D., Y.J. and T.I.L.; investigation, S.D.S.K.D.; data curation, S.D.S.K.D. and Y.J.; writing—original draft preparation, S.D.S.K.D.; writing—review and editing, S.D.S.K.D. and Y.J.; funding acquisition, Y.J. All authors have read and agreed to the published version of the manuscript.

Funding

The study was supported by a project of the Department of Science and Technology in Jiangsu Province (No. BE2023400).

Institutional Review Board Statement

Not applicable.

Informed Consent Statement

Not applicable.

Data Availability Statement

The datasets used in the present study can be obtained from the Sri Lanka Meteorology Agency.

Acknowledgments

The authors acknowledge the Sri Lanka Meteorology Agency for providing the data used in this study. The authors are grateful to the four anonymous reviewers for their constructive and useful comments.

Conflicts of Interest

The authors declare no conflicts of interest.

Appendix A

Table A1. Correlation coefficient values between SPEI values were calculated using observations and published remotely sensed data.
Colombo PublishedAnuradhapura PublishedTrincomalee PublishedPuttalam PublishedGalle PublishedNuwaraeliya Published
Colombo ObservedPearson Correlation0.61 **0.69 **0.71 **0.67 **0.44 **0.59 **
Sig. (2-tailed)0.000.000.000.000.000.00
Anuradhapura ObservedPearson Correlation0.43 **0.52 **0.51 **0.46 **0.44 **0.59 **
Sig. (2-tailed)0.000.000.000.000.000.00
Trincomalee ObservedPearson Correlation0.39 **0.53 **0.53 **0.27 **0.23 *0.43 **
Sig. (2-tailed)0.000.000.000.000.010.00
Puttalam ObservedPearson Correlation0.72 **0.83 **0.81 **0.56 **0.57 **0.81 **
Sig. (2-tailed)0.000.000.000.000.000.00
Galle ObservedPearson Correlation0.38 **0.20 *0.25 **0.32 **0.34 **0.18
Sig. (2-tailed)0.000.030.010.000.000.05
Nuwaraeliya ObservedPearson Correlation0.61 **0.52 **0.52 **0.55 **0.69 **0.67 **
Sig. (2-tailed)0.000.000.000.000.000.00
** Correlation is significant at the 0.01 level (2-tailed). * Correlation is significant at the 0.05 level (2-tailed).

References

  1. Zhang, L.; Zhou, T. Drought over East Asia: A Review. J. Clim. 2015, 28, 3375–3399. [Google Scholar] [CrossRef]
  2. Kuwayama, Y.; Thompson, A.; Bernknopf, R.; Zaitchik, B.; Vail, P. Estimating the Impact of Drought on Agriculture Using the U.S. Drought Monitor. Am. J. Agric. Econ. 2019, 101, 193–210. [Google Scholar] [CrossRef]
  3. Lloyd-Hughes, B.; Saunders, M.A. A Drought Climatology for Europe. Int. J. Climatol. 2002, 22, 1571–1592. [Google Scholar] [CrossRef]
  4. Wei, X. The Geography and Remote Sensing Analysis of Sri Lanka; Springer: Singapore, 2021; ISBN 9789813346277. [Google Scholar]
  5. van Zyl, J.; Van Der Vyver, A.; Groenewald, J.A. The Influence of Drought and General Economic Effects on Agriculture: A Macro-Analysis. Agrekon 1987, 26, 8–12. [Google Scholar] [CrossRef]
  6. Bhaga, T.D.; Dube, T.; Shekede, M.D.; Shoko, C. Impacts of Climate Variability and Drought on Surface Water Resources in Sub-Saharan Africa Using Remote Sensing: A Review. Remote Sens. 2020, 12, 4184. [Google Scholar] [CrossRef]
  7. Shrestha, A.; Rahaman, M.M.; Kalra, A.; Jogineedi, R.; Maheshwari, P. Climatological Drought Forecasting Using Bias Corrected CMIP6 Climate Data: A Case Study for India. Forecasting 2020, 2, 59–84. [Google Scholar] [CrossRef]
  8. Nagamuthu, P. Assessment of Projected Temperature and Precipitation in the Northern Province of Sri Lanka through Statistically Downscaled CMIP6 Projection. J. Geol. Geogr. Geoecol. 2024, 33, 132–154. [Google Scholar] [CrossRef]
  9. Shahid, S.; Behrawan, H. Drought Risk Assessment in the Western Part of Bangladesh. Nat. Hazards 2008, 46, 391–413. [Google Scholar] [CrossRef]
  10. Nam, W.H.; Hayes, M.J.; Svoboda, M.D.; Tadesse, T.; Wilhite, D.A. Drought Hazard Assessment in the Context of Climate Change for South Korea. Agric. Water Manag. 2015, 160, 106–117. [Google Scholar] [CrossRef]
  11. Solh, M.; Van Ginkel, M. Drought Preparedness and Drought Mitigation in the Developing World’s Drylands. Weather Clim. Extrem. 2014, 3, 62–66. [Google Scholar] [CrossRef]
  12. Speranza, C.I. Drought Coping and Adaptation Strategies: Understanding Adaptations to Climate Change in Agro-Pastoral Livestock Production in Makueni District, Kenya. Eur. J. Dev. Res. 2010, 22, 623–642. [Google Scholar] [CrossRef]
  13. Opiyo, F.; Wasonga, O.; Nyangito, M.; Schilling, J.; Munang, R. Drought Adaptation and Coping Strategies Among the Turkana Pastoralists of Northern Kenya. Int. J. Disaster Risk Sci. 2015, 6, 295–309. [Google Scholar] [CrossRef]
  14. Adhikari, S. Drought Impact and Adaptation Strategies in the Mid-Hill Farming System of Western Nepal. Environments 2018, 5, 101. [Google Scholar] [CrossRef]
  15. Karl, T.R.; Trenberth, K.E. Modern Global Climate Change. Science 2003, 302, 1719–1723. [Google Scholar] [CrossRef]
  16. Lobell, D.B.; Gourdji, S.M. The Influence of Climate Change on Global Crop Productivity. Plant Physiol. 2012, 160, 1686–1697. [Google Scholar] [CrossRef]
  17. Sun, Y.; Zhang, X.; Ding, Y.; Chen, D.; Qin, D.; Zhai, P. Understanding Human Influence on Climate Change in China. Natl. Sci. Rev. 2022, 9, nwab113. [Google Scholar] [CrossRef]
  18. Zommers, Z.; Singh, A. Reducing Disaster: Early Warning Systems for Climate Change; Springer: Dordrecht, The Netherlands, 2014; pp. 1–387. [Google Scholar] [CrossRef]
  19. Nissanka, S.P.; Sangakkara, U.R. Global Climate Change and Its Impacts on Sri Lanka Global; Faculty of Agriculture, University of Peradeniya Sri Lanka: Kandy, Sri Lanka, 2009; ISBN 9789554122413. [Google Scholar]
  20. Wickramaratne, S.; Ruwanpura, J.; Ranasinghe, U.; Walawe-Durage, S.; Adikariwattage, V.; Wirasinghe, S.C. Ranking of Natural Disasters in Sri Lanka for Mitigation Planning. Int. J. Disaster Resil. Built Environ. 2012, 3, 115–132. [Google Scholar] [CrossRef]
  21. Shelton, S.; Ogou, F.K.; Pushpawela, B. Spatial-Temporal Variability of Droughts during Two Cropping Seasons in Sri Lanka and Its Possible Mechanisms. Asia-Pacific J. Atmos. Sci. 2022, 58, 127–144. [Google Scholar] [CrossRef]
  22. Tate, E.L.; Gustard, A. Drought Definition: A Hydrological Perspective. In Drought and Drought Mitigation in Europe; Springer: Dordrecht, The Netherlands, 2000; pp. 23–48. [Google Scholar] [CrossRef]
  23. Vicente-Serrano, S.M.; Lopez-Moreno, J.I.; Beguería, S.; Lorenzo-Lacruz, J.; Sanchez-Lorenzo, A.; García-Ruiz, J.M.; Azorin-Molina, C.; Morán-Tejeda, E.; Revuelto, J.; Trigo, R.; et al. Evidence of Increasing Drought Severity Caused by Temperature Rise in Southern Europe. Environ. Res. Lett. 2014, 9, 044001. [Google Scholar] [CrossRef]
  24. Wilhite, D.; Glantz, M.H. The Role of Definitions Understanding: The Drought Phenomenon: The Role of Definitions; Westview Press: Boulder, CO, USA, 1987; pp. 11–27. [Google Scholar]
  25. Zargar, A.; Sadiq, R.; Naser, B.; Khan, F.I. A Review of Drought Indices. Environ. Rev. 2011, 19, 333–349. [Google Scholar] [CrossRef]
  26. Yihdego, Y.; Vaheddoost, B.; Al-Weshah, R.A. Drought Indices and Indicators Revisited. Arab. J. Geosci. 2019, 12, 69. [Google Scholar] [CrossRef]
  27. Beguería, S.; Sergio, M.; Vicente-Serrano, S.M.; Reig, F.; Latorre, B. Standardized Precipitation Evapotranspiration Index (SPEI) Revisited: Parameter Fitting, Evapotranspiration Models, Tools, Datasets and Drought Monitoring. Int. J. Climatol. 1994, 34, 3001–3023. [Google Scholar] [CrossRef]
  28. Vicente-Serrano, S.M.; Beguería, S.; Lorenzo-Lacruz, J.; Camarero, J.J.; López-Moreno, J.I.; Azorin-Molina, C.; Revuelto, J.; Morán-Tejeda, E.; Sanchez-Lorenzo, A. Performance of Drought Indices for Ecological, Agricultural, and Hydrological Applications. Earth Interact. 2012, 16, 1–27. [Google Scholar] [CrossRef]
  29. Tirivarombo, S.; Osupile, D.; Eliasson, P. Drought Monitoring and Analysis: Standardised Precipitation Evapotranspiration Index (SPEI) and Standardised Precipitation Index (SPI). Phys. Chem. Earth Parts A/B/C 2018, 106, 1–10. [Google Scholar] [CrossRef]
  30. Blauhut, V.; Gudmundsson, L.; Stahl, K. Towards Pan-European Drought Risk Maps: Quantifying the Link between Drought Indices and Reported Drought Impacts. Environ. Res. Lett. 2015, 10, 014008. [Google Scholar] [CrossRef]
  31. Ekanayake, E.; Perera, K. Analysis of Drought Severity and Duration Using Copulas in Anuradhapura, Sri Lanka. Br. J. Environ. Clim. Chang. 2014, 4, 312–327. [Google Scholar] [CrossRef]
  32. Chithranayana, R.D.; Punyawardena, B.V.R. Identification of drought prone agro-ecological regions in Sri Lanka. J. Natl. Sci. Found. Sri Lanka 2008, 36, 117. [Google Scholar] [CrossRef]
  33. Rekha, N. Drought Risk Reduction in the Dry Zone of Sri Lanka; Emerald Group Publishing Ltd.: Leeds, UK, 2011; Volume 8, ISBN 9780857248633. [Google Scholar]
  34. Haque, A.K.E.; Mukhopadhyay, P.; Nepal, M.; Shammin, M.R. Change and Community Resilience; Springer Nature: Singapore, 2022; ISBN 9789811606793. [Google Scholar]
  35. Burchfield, E.; Williams, N.E.; Carrico, A.R. Rescaling Drought Mitigation in Rural Sri Lanka. Reg. Environ. Chang. 2018, 18, 2495–2503. [Google Scholar] [CrossRef]
  36. Zhao, J.; Zhang, Q.; Zhu, X.; Shen, Z.; Yu, H. Drought Risk Assessment in China: Evaluation Framework and Influencing Factors. Geogr. Sustain. 2020, 1, 220–228. [Google Scholar] [CrossRef]
  37. Pei, W.; Fu, Q.; Liu, D.; Li, T.; Cheng, K.; Cui, S. A Novel Method for Agricultural Drought Risk Assessment. Water Resour. Manag. 2019, 33, 2033–2047. [Google Scholar] [CrossRef]
  38. Wu, H.; Wilhite, D.A. An Operational Agricultural Drought Risk Assessment Model for Nebraska, USA. Nat. Hazards 2004, 33, 1–21. [Google Scholar] [CrossRef]
  39. Zeng, Z.; Wu, W.; Li, Z.; Zhou, Y.; Guo, Y.; Huang, H. Agricultural Drought Risk Assessment in Southwest China. Water 2019, 11, 1064. [Google Scholar] [CrossRef]
  40. Guo, H.; Zhang, X.; Lian, F.; Gao, Y.; Lin, D.; Wang, J. Drought Risk Assessment Based on Vulnerability Surfaces: A Case Study of Maize. Sustainability 2016, 8, 813. [Google Scholar] [CrossRef]
  41. Meza, I.; Siebert, S.; Döll, P.; Kusche, J.; Herbert, C.; Rezaei, E.E.; Nouri, H.; Gerdener, H.; Popat, E.; Frischen, J.; et al. Global-Scale Drought Risk Assessment for Agricultural Systems. Nat. Hazards Earth Syst. Sci. 2020, 20, 695–712. [Google Scholar] [CrossRef]
  42. Meinshausen, M.; Nicholls, Z.R.J.; Lewis, J.; Gidden, M.J.; Vogel, E.; Freund, M.; Beyerle, U.; Gessner, C.; Nauels, A.; Bauer, N.; et al. The Shared Socio-Economic Pathway (SSP) Greenhouse Gas Concentrations and Their Extensions to 2500. Geosci. Model Dev. 2020, 13, 3571–3605. [Google Scholar] [CrossRef]
  43. Thevakaran, A.; Suppiah, R.; Sonnadara, U. Trends in Extreme Rainfall Events in Sri Lanka,1961-2010. J. Natl. Sci. Found. Sri Lanka 2019, 47, 285–295. [Google Scholar] [CrossRef]
  44. Jayawardena, I.S.P.; Darshika, D.T.; Herath, H.C.R. Recent Trends in Climate Extreme Indices over Sri Lanka. Am. J. Clim. Chang. 2018, 07, 586–599. [Google Scholar] [CrossRef]
  45. Nas, B. Geostatistical Approach to Assessment of Spatial Distribution of Groundwater Quality. Polish J. Environ. Stud. 2009, 18, 1073–1082. [Google Scholar]
  46. Shipley, S.; Graffman, I.; Ingram, J. GIS Applications in Climate and Meteorology. In Proceedings of the ESRI Annual User Conference, San Diego, CA, USA, 26–30 June 2000. [Google Scholar]
  47. Alahacoon, N.; Edirisinghe, M.; Ranagalage, M. Satellite-Based Meteorological and Agricultural Drought Monitoring for Agricultural Sustainability in Sri Lanka. Sustainability 2021, 13, 3427. [Google Scholar] [CrossRef]
  48. Krishnamoorthi, N. Role of Remote Sensing and GIS in Natural-Disaster Management Cycle. Imp. J. Interdiscip. Res. 2016, 2, 144–154. [Google Scholar]
  49. Legesse, G.; Suryabhagavan, K.V. Remote Sensing and GIS Based Agricultural Drought Assessment in East Shewa Zone, Ethiopia. Trop. Ecol. 2014, 55, 349–363. [Google Scholar]
  50. Belal, A.A.; El-Ramady, H.R.; Mohamed, E.S.; Saleh, A.M. Drought Risk Assessment Using Remote Sensing and GIS Techniques. Arab. J. Geosci. 2014, 7, 35–53. [Google Scholar] [CrossRef]
  51. Rajpoot, P.S.; Kumar, A. Impact assessment of meteorological drought on rainfed agriculture using drought index and NDVI modeling: A case study of Tikamgarh district, M. P., India. Appl. Geomat. 2019, 11, 15–23. [Google Scholar] [CrossRef]
  52. He, B.; Lü, A.; Wu, J.; Zhao, L.; Liu, M. Drought Hazard Assessment and Spatial Characteristics Analysis in China. J. Geogr. Sci. 2011, 21, 235–249. [Google Scholar] [CrossRef]
  53. Xu, X.; Xie, F.; Zhou, X. Research on Spatial and Temporal Characteristics of Drought Based on GIS Using Remote Sensing Big Data. Clust. Comput. 2016, 19, 757–767. [Google Scholar] [CrossRef]
  54. Finch, W.H. Distribution of Variables by Method of Outlier Detection. Front. Psychol. 2012, 3, 211. [Google Scholar] [CrossRef]
  55. Afrifa-Yamoah, E.; Mueller, U.A.; Taylor, S.M.; Fisher, A.J. Missing Data Imputation of High-Resolution Temporal Climate Time Series Data. Meteorol. Appl. 2020, 27, e1873. [Google Scholar] [CrossRef]
  56. Wang, Q.; Zeng, J.; Qi, J.; Zhang, X.; Zeng, Y.; Shui, W.; Xu, Z.; Zhang, R.; Wu, X.; Cong, J. A Multi-Scale Daily SPEI Dataset for Drought Characterization at Observation Stations over Mainland China from 1961 to 2018. Earth Syst. Sci. Data 2021, 13, 331–341. [Google Scholar] [CrossRef]
  57. Abeysiriwardana, H.D.; Muttil, N.; Rathnayake, U. A Comparative Study of Potential Evapotranspiration Estimation by Three Methods with FAO Penman–Monteith Method across Sri Lanka. Hydrology 2022, 9, 206. [Google Scholar] [CrossRef]
  58. Xu, C.Y.; Singh, V.P. A Review on Monthly Water Balance Models for Water Resources Investigations. Water Resour. Manag. 1998, 12, 20–50. [Google Scholar] [CrossRef]
  59. Sedgwick, P. Pearson’s Correlation Coefficient. BMJ 2012, 345, e4483. [Google Scholar] [CrossRef]
  60. Alahacoon, N.; Edirisinghe, M. Spatial Variability of Rainfall Trends in Sri Lanka from 1989 to 2019 as an Indication of Climate Change. ISPRS Int. J. Geo-Inf. 2021, 10, 84. [Google Scholar] [CrossRef]
  61. Heydari Alamdarloo, E.; Khosravi, H.; Nasabpour, S.; Gholami, A. Assessment of Drought Hazard, Vulnerability and Risk in Iran Using GIS Techniques. J. Arid Land 2020, 12, 984–1000. [Google Scholar] [CrossRef]
  62. Talebiniya, M.; Khosravi, H.; Zehtabian, G.; Malekian, A.; Keshtkar, H. Investigating the Role of Meteorological Drought and Geodetic Factors on Land Subsidence Vulnerability Using Fuzzy Overlay. Desert 2022, 27, 227–245. [Google Scholar] [CrossRef]
  63. Nashwan, M.S.; Shahid, S. Spatial Distribution of Unidirectional Trends in Climate and Weather Extremes in Nile River Basin. Theor. Appl. Climatol. 2019, 137, 1181–1199. [Google Scholar] [CrossRef]
  64. Agbo, E.P.; Ekpo, C.M.; Edet, C.O. Analysis of the Effects of Meteorological Parameters on Radio Refractivity, Equivalent Potential Temperature and Field Strength via Mann-Kendall Test. Theor. Appl. Climatol. 2021, 143, 1437–1456. [Google Scholar] [CrossRef]
  65. Ampitiyawatta, A.D.; Wijeratne, A.W. Impact of Temporal Changes of Rainfall on Major Climatic Zones of Sri Lanka. Trop. Agric. Res. Ext. 2015, 18, 148. [Google Scholar] [CrossRef]
  66. Gunatilleke, C.V.S.; Gunatilleke, I.A.U.N.; Esufali, S.; Harms, K.E.; Ashton, P.M.S.; Burslem, D.F.R.P.; Ashton, P.S. Species-Habitat Associations in a Sri Lankan Dipterocarp Forest. J. Trop. Ecol. 2006, 22, 371–384. [Google Scholar] [CrossRef]
  67. Breuste, J.; Jayathunga, S. Representatives of Nature Conservation and Ecotourism in Different Biomes of Sri Lanka. Hercynia 2010, 43, 257–276. [Google Scholar]
  68. Pawar, U.; Karunathilaka, P.; Rathnayake, U. Spatio-Temporal Rainfall Variability and Concentration over Sri Lanka. Adv. Meteorol. 2022, 2022, 6456761. [Google Scholar] [CrossRef]
  69. Senatilleke, U.; Gunathilake, M.B.; Alyousifi, Y.; Rathnayake, U. Analysis of Recent Trends and Variability of Temperature and Relative Humidity over Sri Lanka. Mausam 2022, 73, 511–524. [Google Scholar] [CrossRef]
  70. Blauhut, V.; Stahl, K.; Stagge, J.H.; Tallaksen, L.M.; de Stefano, L.; Vogt, J. Estimating Drought Risk across Europe from Reported Drought Impacts, Drought Indices, and Vulnerability Factors. Hydrol. Earth Syst. Sci. 2016, 20, 2779–2800. [Google Scholar] [CrossRef]
  71. Wang, T.; Tu, X.; Singh, V.P.; Chen, X.; Lin, K. Global Data Assessment and Analysis of Drought Characteristics Based on CMIP6. J. Hydrol. 2021, 596, 126091. [Google Scholar] [CrossRef]
  72. Zhai, J.; Mondal, S.K.; Fischer, T.; Wang, Y.; Su, B.; Huang, J.; Tao, H.; Wang, G.; Ullah, W.; Uddin, M.J. Future Drought Characteristics through a Multi-Model Ensemble from CMIP6 over South Asia. Atmos. Res. 2020, 246, 105111. [Google Scholar] [CrossRef]
  73. Russo, T.; Alfredo, K.; Fisher, J. Sustainable Water Management in Urban, Agricultural, and Natural Systems. Water 2014, 6, 3934–3956. [Google Scholar] [CrossRef]
  74. Wilhite, D.A.; And, M.V.K.S.; Wood, D.A. Early Warning Systems for Drought Preparedness and Drought Management. In Proceedings of the Expert Group Meeting, Lisbon, Portugal, 5–7 September 2000; pp. 57–73. [Google Scholar]
  75. Che-Ani, A.I.; Shaari, N.; Sairi, A.; Zain, M.F.M.; Tahir, M.M. Rainwater Harvesting as an Alternative Water Supply in the Future. Eur. J. Sci. Res. 2014, 34, 132–140. [Google Scholar]
Figure 1. Map of the spatial distribution of annual rainfall over Sri Lanka.
Sustainability 16 10375 g001
Figure 2. Map of the spatial distribution of the annual mean temperature across Sri Lanka.
Sustainability 16 10375 g002
Figure 3. Drought hazard map of Sri Lanka.
Sustainability 16 10375 g003
Figure 4. Environmental factors influencing vulnerability to drought. (a) Elevation map of Sri Lanka; (b) reclassified land use/land cover map of Sri Lanka; (c) reclassified soil-type map of Sri Lanka.
Sustainability 16 10375 g004
Figure 5. Drought vulnerability map of Sri Lanka.
Sustainability 16 10375 g005
Figure 6. Drought risk map of Sri Lanka.
Sustainability 16 10375 g006
Figure 7. Spatial distributions of the projected temperatures under SSP 2.6 and SSP 8.5 from 2021 to 2100.
Sustainability 16 10375 g007
Figure 8. Spatial distributions of projected precipitation under SSP 2.6 and SSP 8.5 from 2021 to 2100.
Sustainability 16 10375 g008
Figure 9. Temporal distributions of the projected meteorological variables. (a) Temporal distribution of projected temperature under SSP 2.6 and SSP 8.5. (b) Temporal distribution of projected precipitation under SSP 2.6 and SSP 8.5.
Sustainability 16 10375 g009
Table 1. SPEI values, drought categories, and their frequencies.
SPEI ValueDrought CategoryFrequency (%)
0 to −0.99Near Normal45
−1 to −1.49Moderate25
−1.50 to −1.99Severe20
−2 or lessExtreme10
Table 2. Environmental factors and their importance to drought vulnerability.
Environmental FactorImportance
RainfallMain driving factor of drought
TemperatureMain driving factor of drought
ElevationDrought occurrence differs depending on the level of elevation
Land UseEffect on the occurrence of drought
Soil TypeThe amount of water in the soil affects drought
Table 3. Correlations between drought and influencing meteorological factors.
PrecipitationTemperatureSPEI
PrecipitationPearson Correlation1−0.319 **0.208 **
Sig. (2-tailed) 0.0000.000
N588588588
TemperaturePearson Correlation−0.319 **1−0.086
Sig. (2-tailed)0.000 0.280
N588588588
SPEIPearson Correlation0.208 **−0.0861
Sig. (2-tailed)0.0000.280
N588588588
** The correlation is significant at the 0.01 level (2-tailed).
Table 4. MK test and Sen’s slope values of the predicted temperature and precipitation.
LocationTemperaturePrecipitation
SSP 2.6SSP 8.5SSP 2.6SSP 8.5
p ValueSen’s Slopep ValueSen’s Slopep ValueSen’s Slopep ValueSen’s Slope
Anuradhapura<0.00 *0.0057<0.00 *0.04340.19330.3257<0.00 *2.5582
Badulla<0.00 *0.0054<0.00 *0.04350.0112 *0.7556<0.00 *3.3777
Batticaloa<0.00 *0.0057<0.00 *0.04320.10810.4196<0.00 *3.0575
Colombo<0.00 *0.0056<0.00 *0.04380.0010 *1.4774<0.00 *6.0540
Galle<0.00 *0.0057<0.00 *0.04310.0015 *1.0343<0.00 *3.8028
Hambantota<0.00 *0.0057<0.00 *0.04310.0015 *1.0343<0.00 *3.8028
Katugastota<0.00 *0.0055<0.00 *0.04390.0092 *0.9959<0.00 *3.8047
Katunayake<0.00 *0.0056<0.00 *0.04380.0010 *1.4774<0.00 *6.0540
Kurunegala<0.00 *0.0054<0.00 *0.04350.0029 *0.7627<0.00 *3.6204
Mannar<0.00 *0.0059<0.00 *0.04320.13030.4451<0.00 *2.3983
Nuwara Eliya<0.00 *0.0055<0.00 *0.04390.0092 *0.9959<0.00 *3.8047
Puttalam<0.00 *0.0054<0.00 *0.04350.0029 *0.7627<0.00 *3.6204
Rathnapura<0.00 *0.0055<0.00 *0.04400.0021 *1.5687<0.00 *5.8016
Tricomalee<0.00 *0.0057<0.00 *0.04320.10810.4196<0.00 *3.0575
Vavuniya<0.00 *0.0059<0.00 *0.04320.13030.4451<0.00 *2.3983
* The correlation is significant at the 0.05 level.
Disclaimer/Publisher’s Note: The statements, opinions and data contained in all publications are solely those of the individual author(s) and contributor(s) and not of MDPI and/or the editor(s). MDPI and/or the editor(s) disclaim responsibility for any injury to people or property resulting from any ideas, methods, instructions or products referred to in the content.

