
Windy Sites Prioritization in the Saudi Waters of the Southern Red Sea

 ,
,  , , , , ,
  and
and
Abstract
1. Introduction
2. Site and Data Description
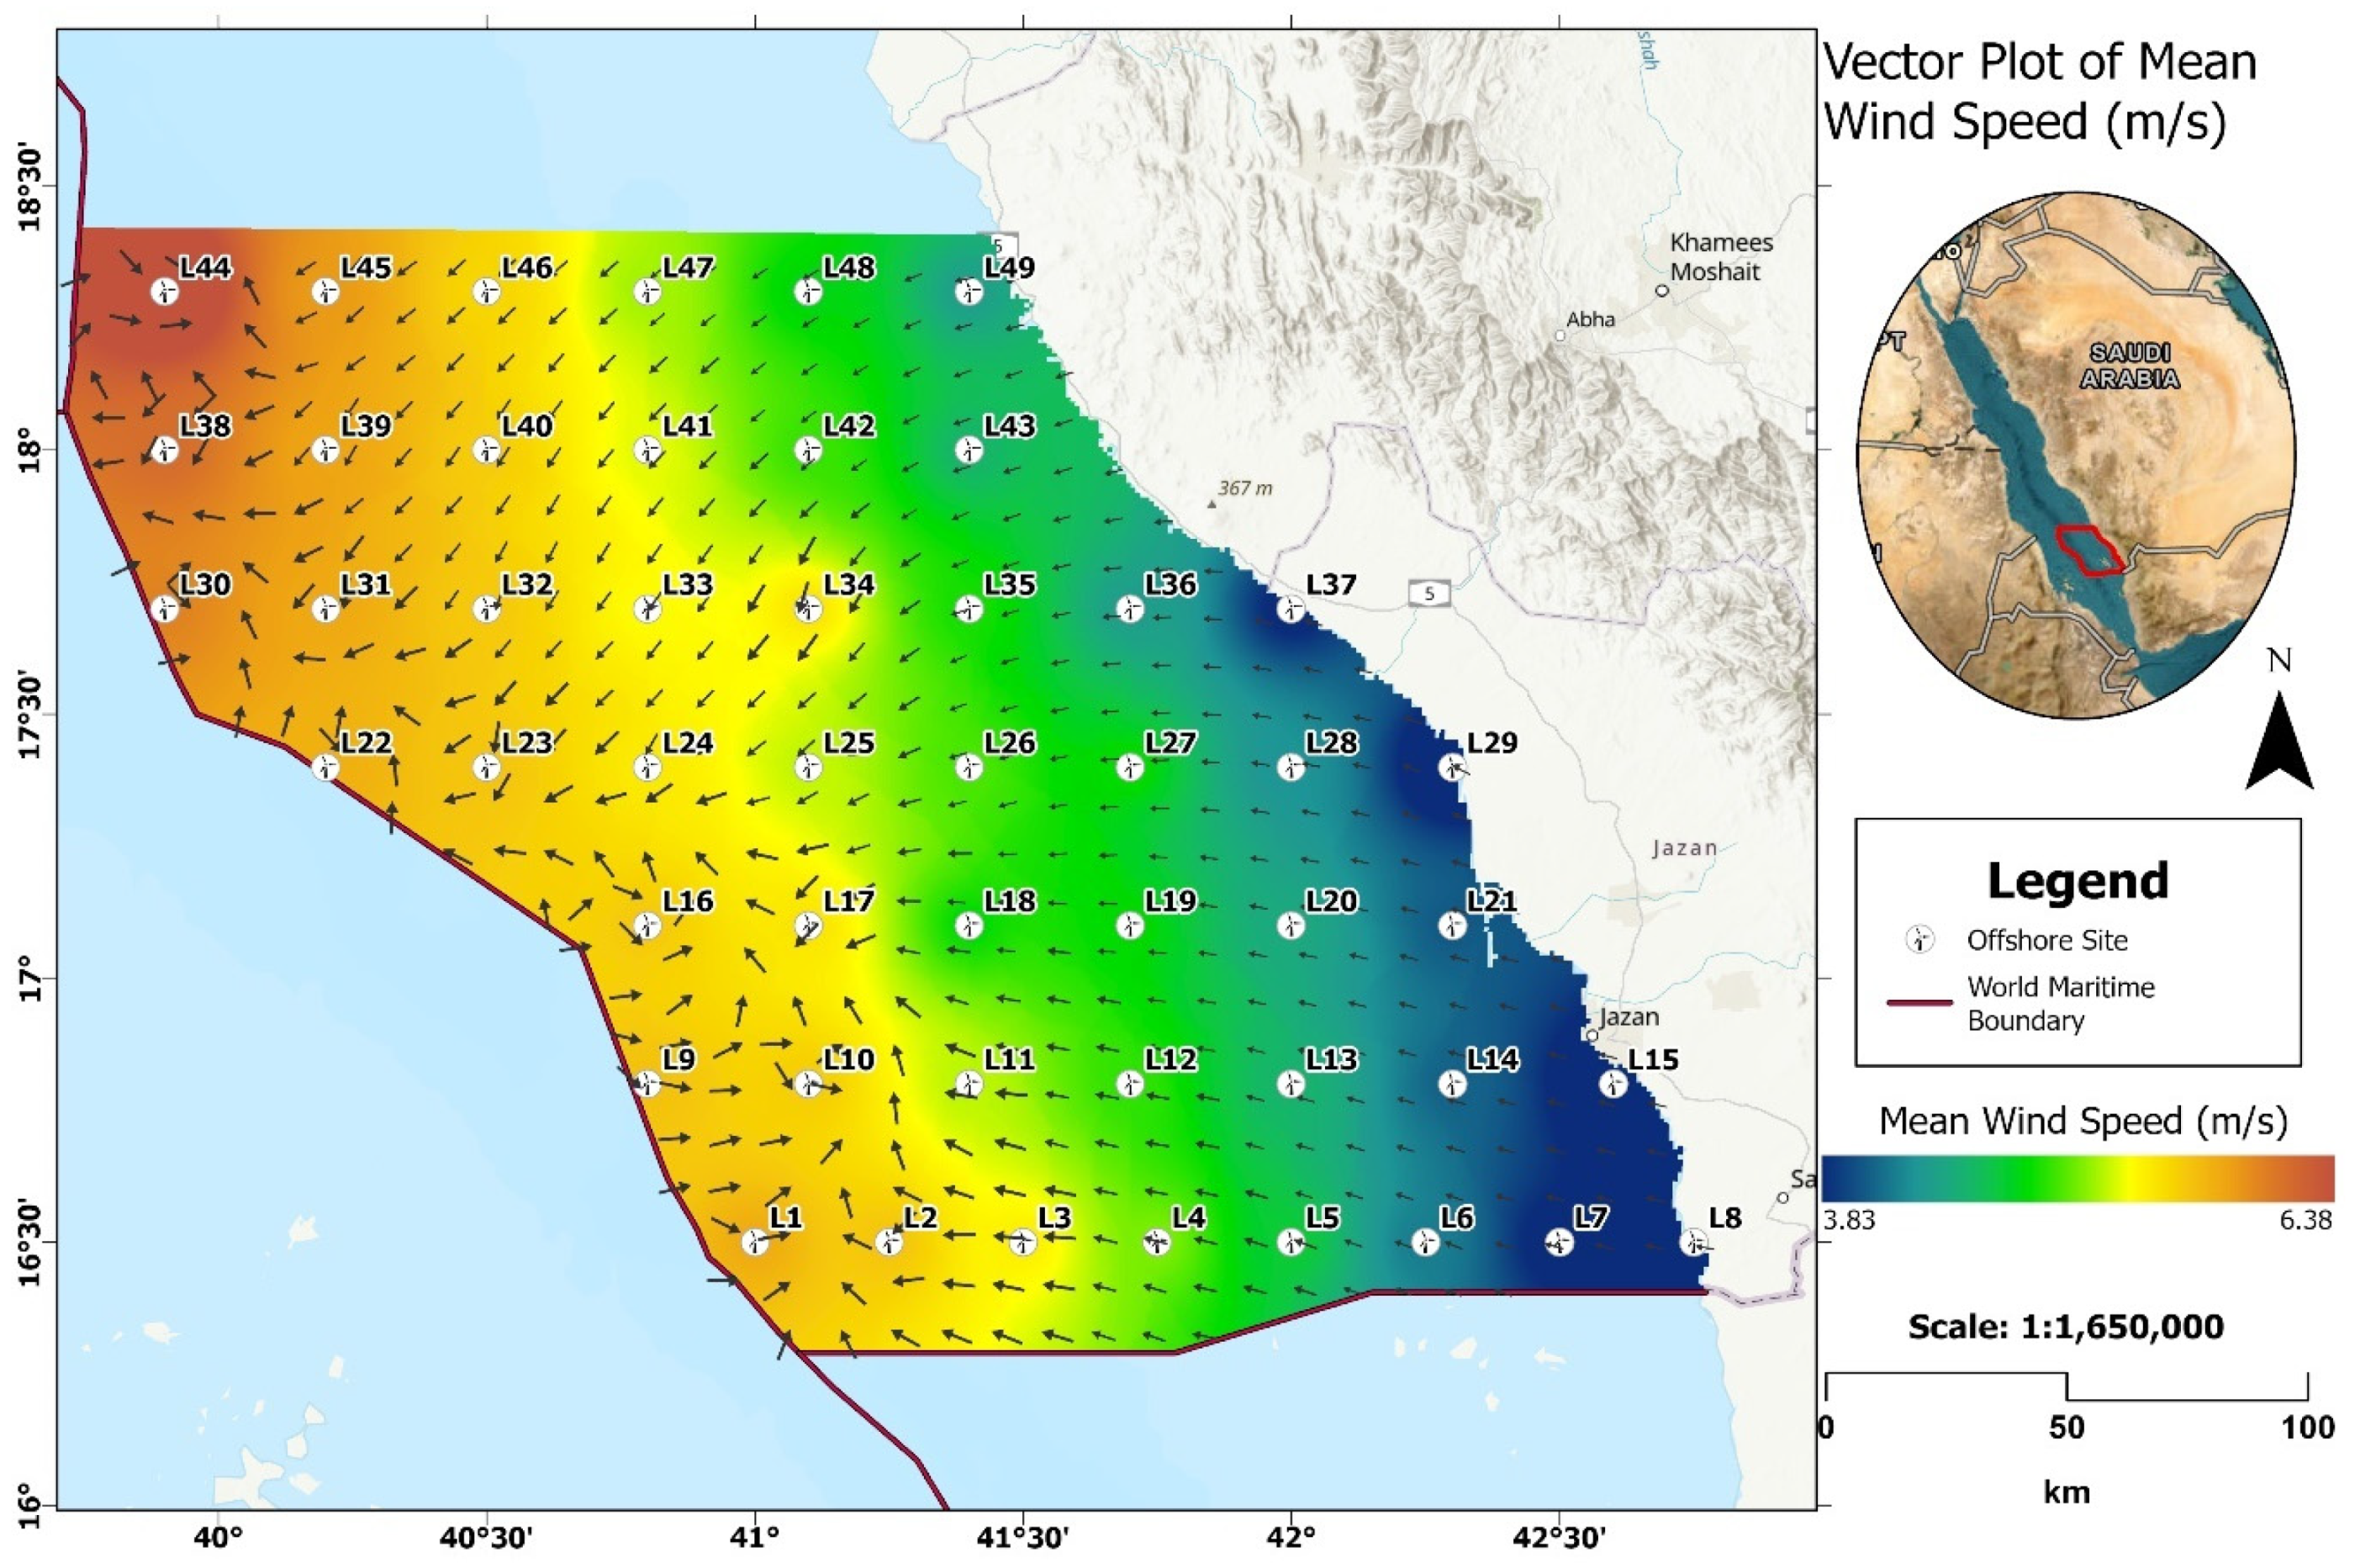
2.1. Site Description
2.2. Data Description
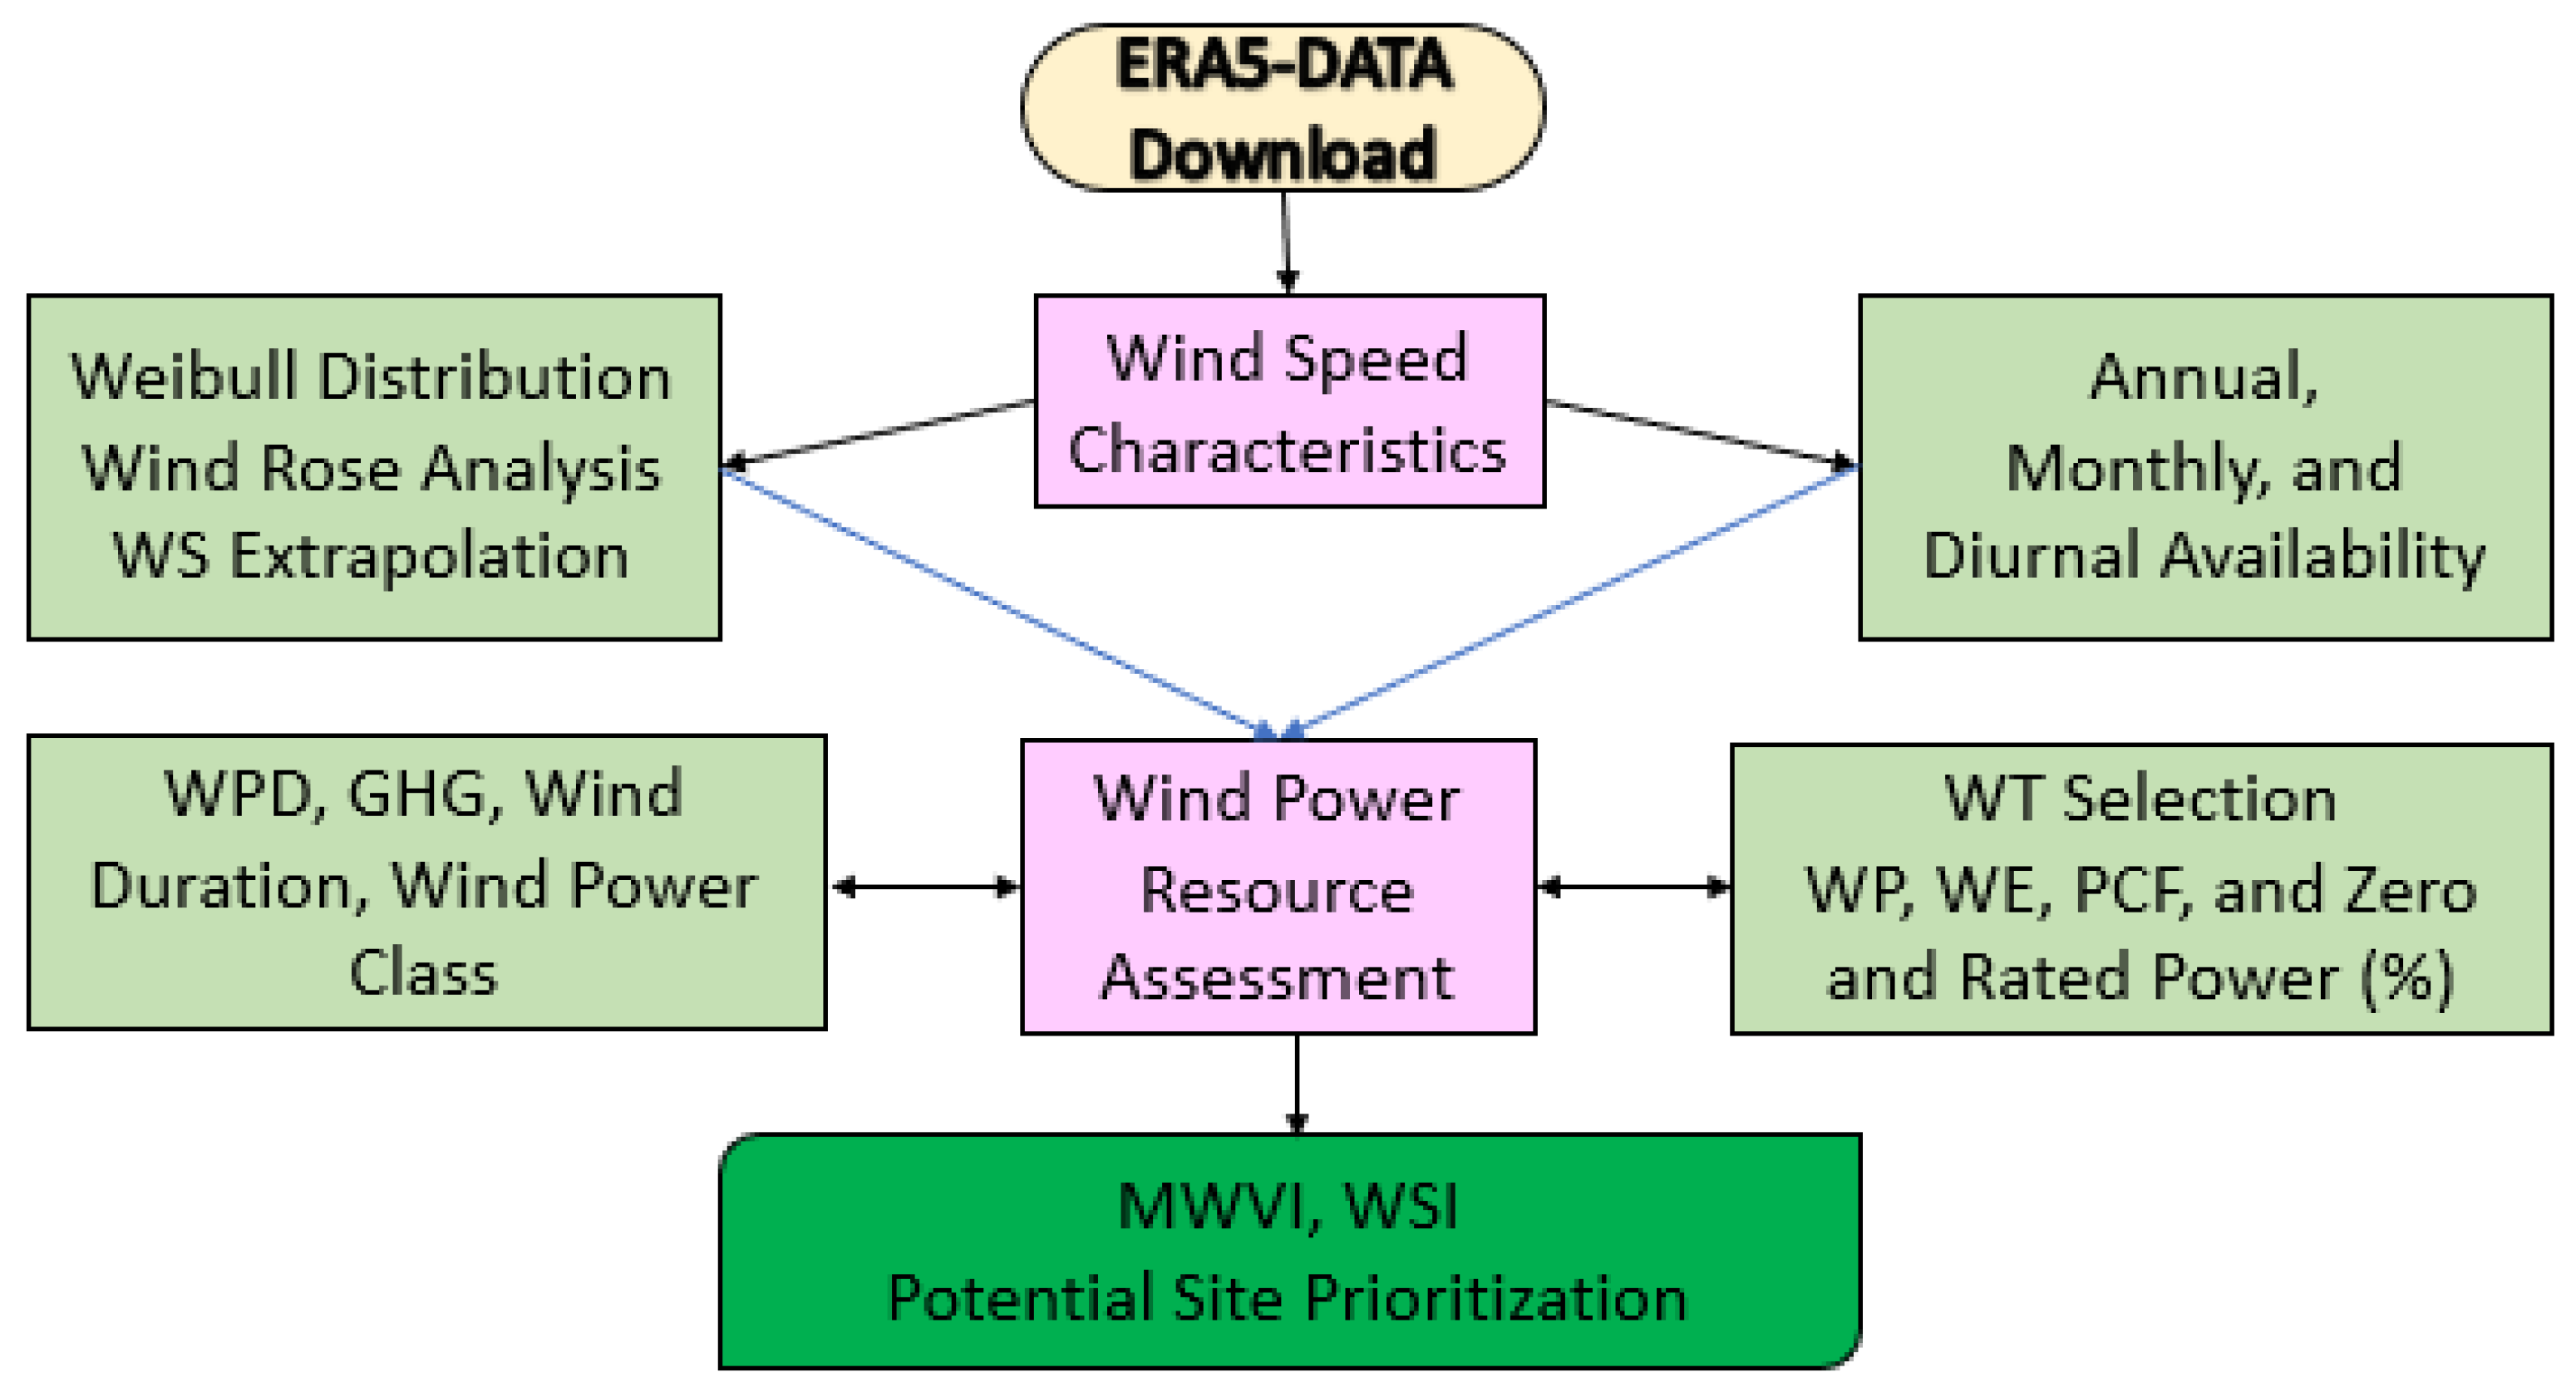
3. Methodology
4. Results and Discussion
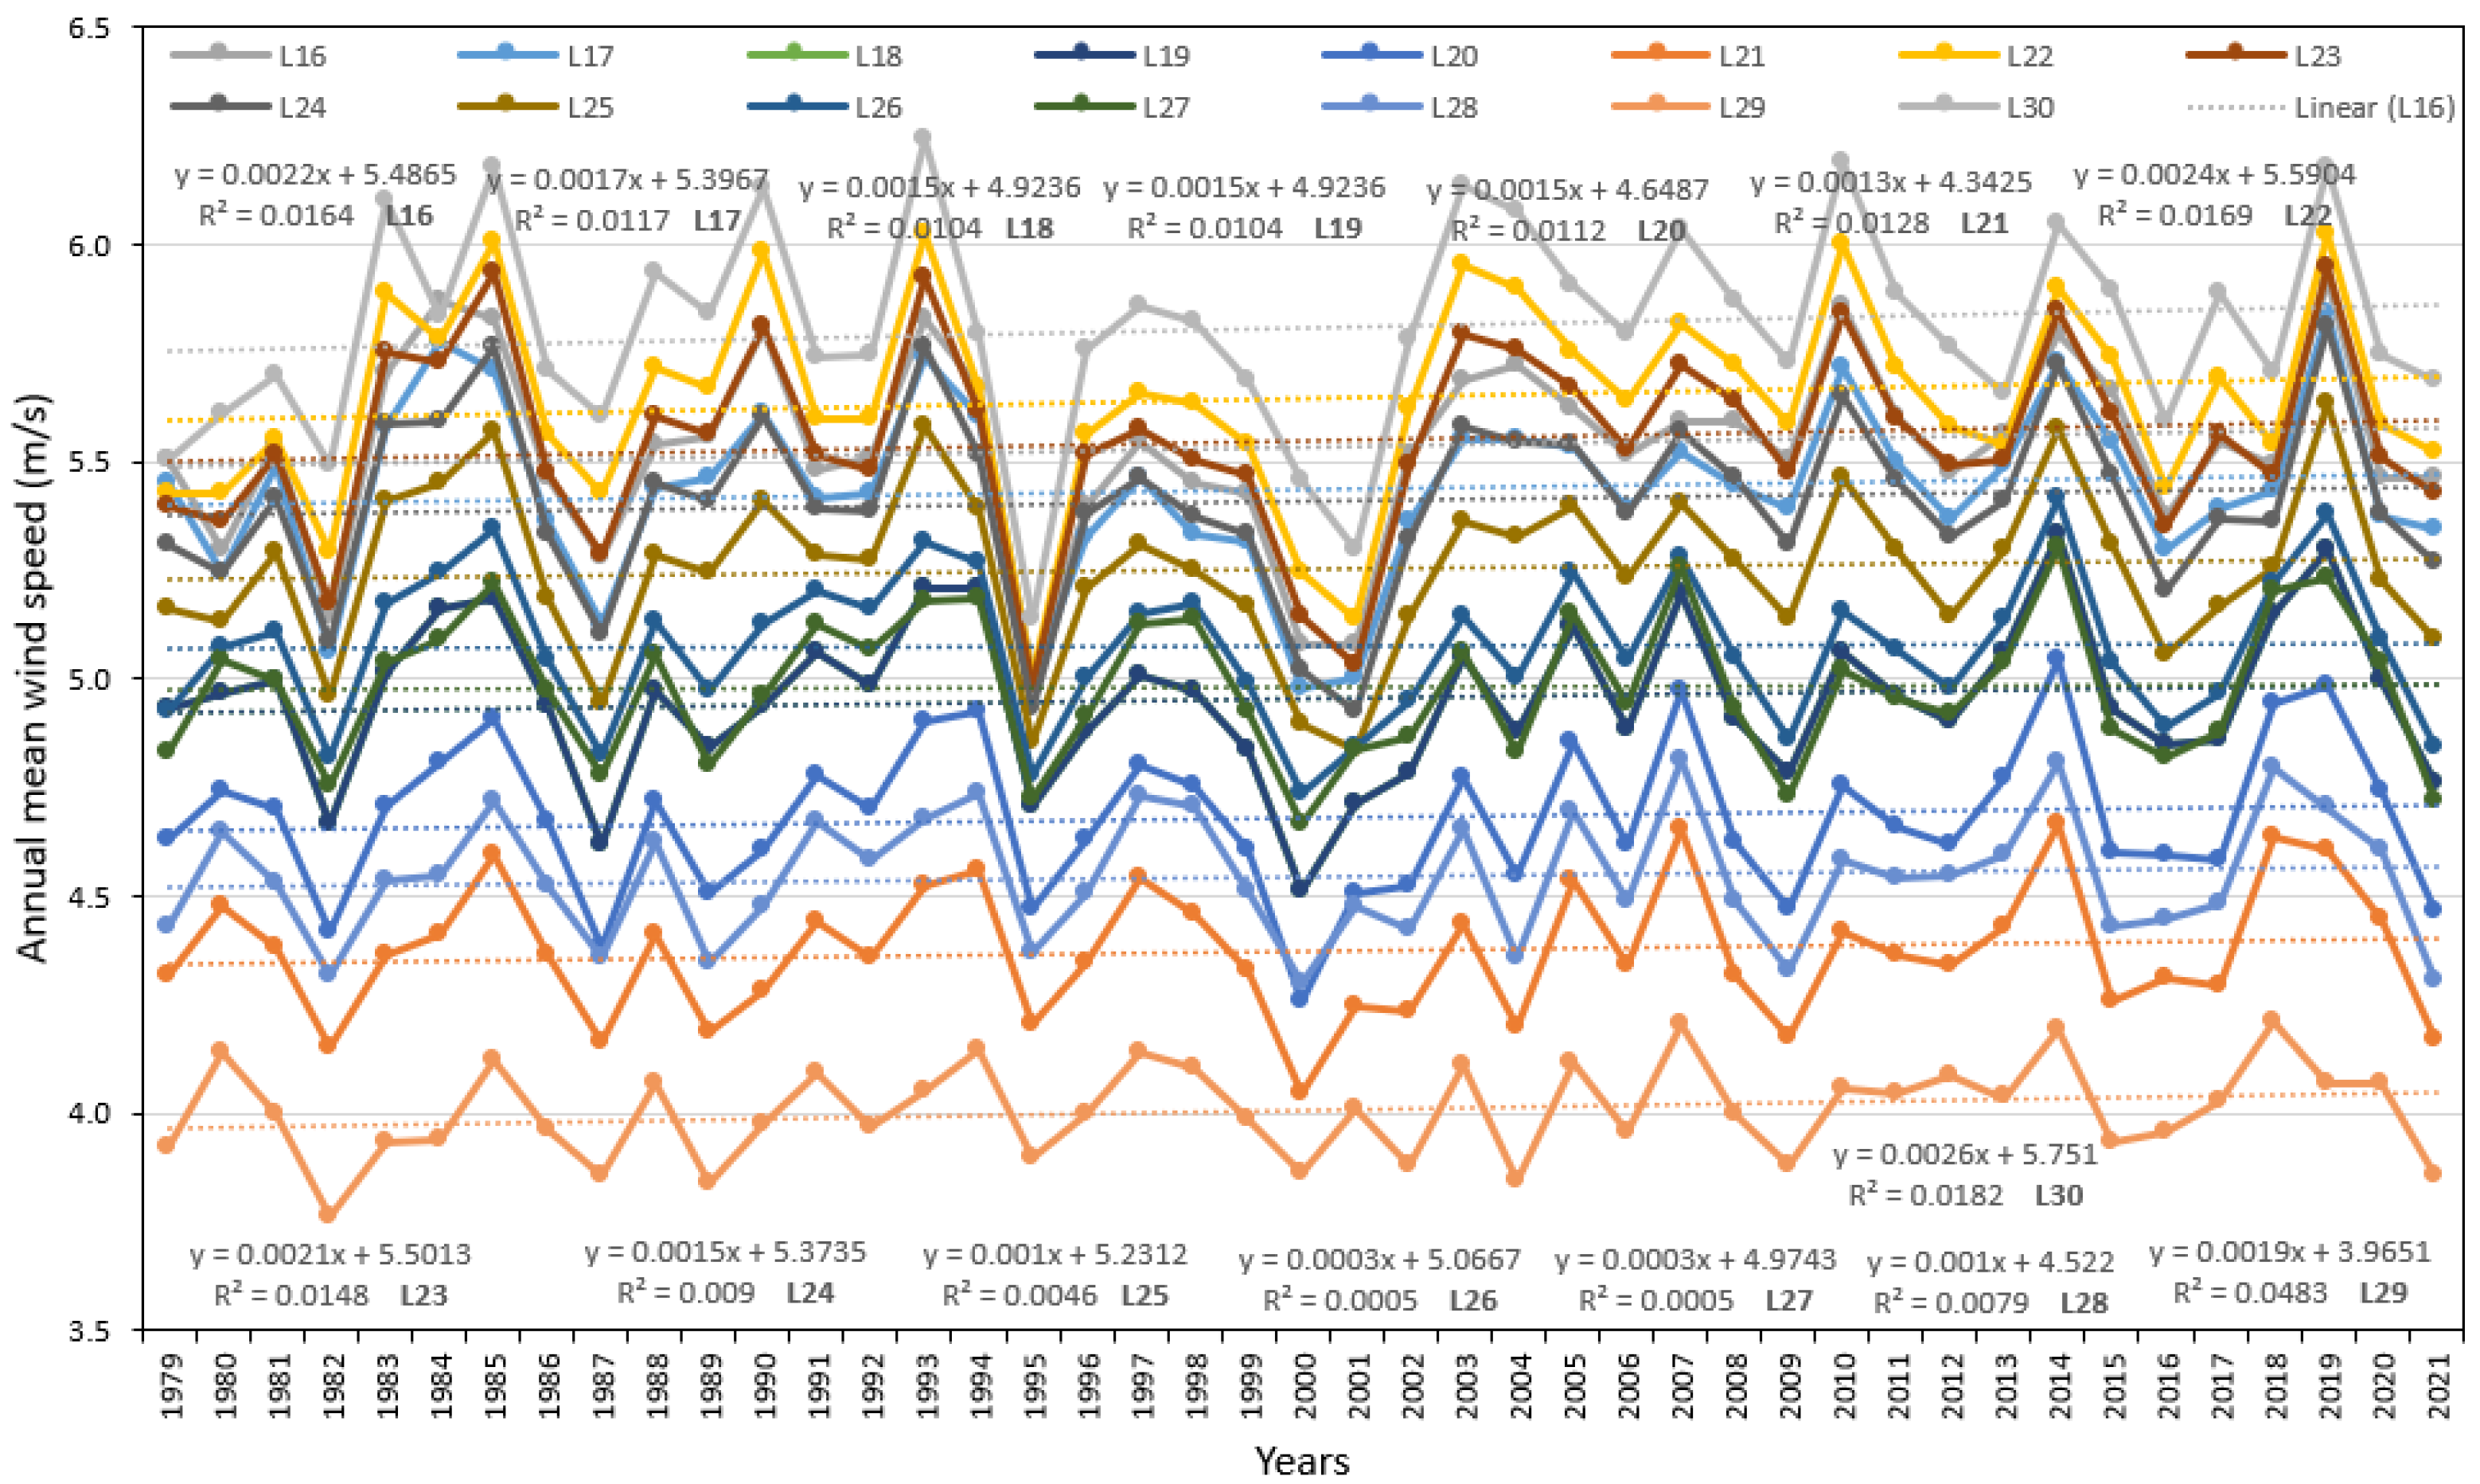
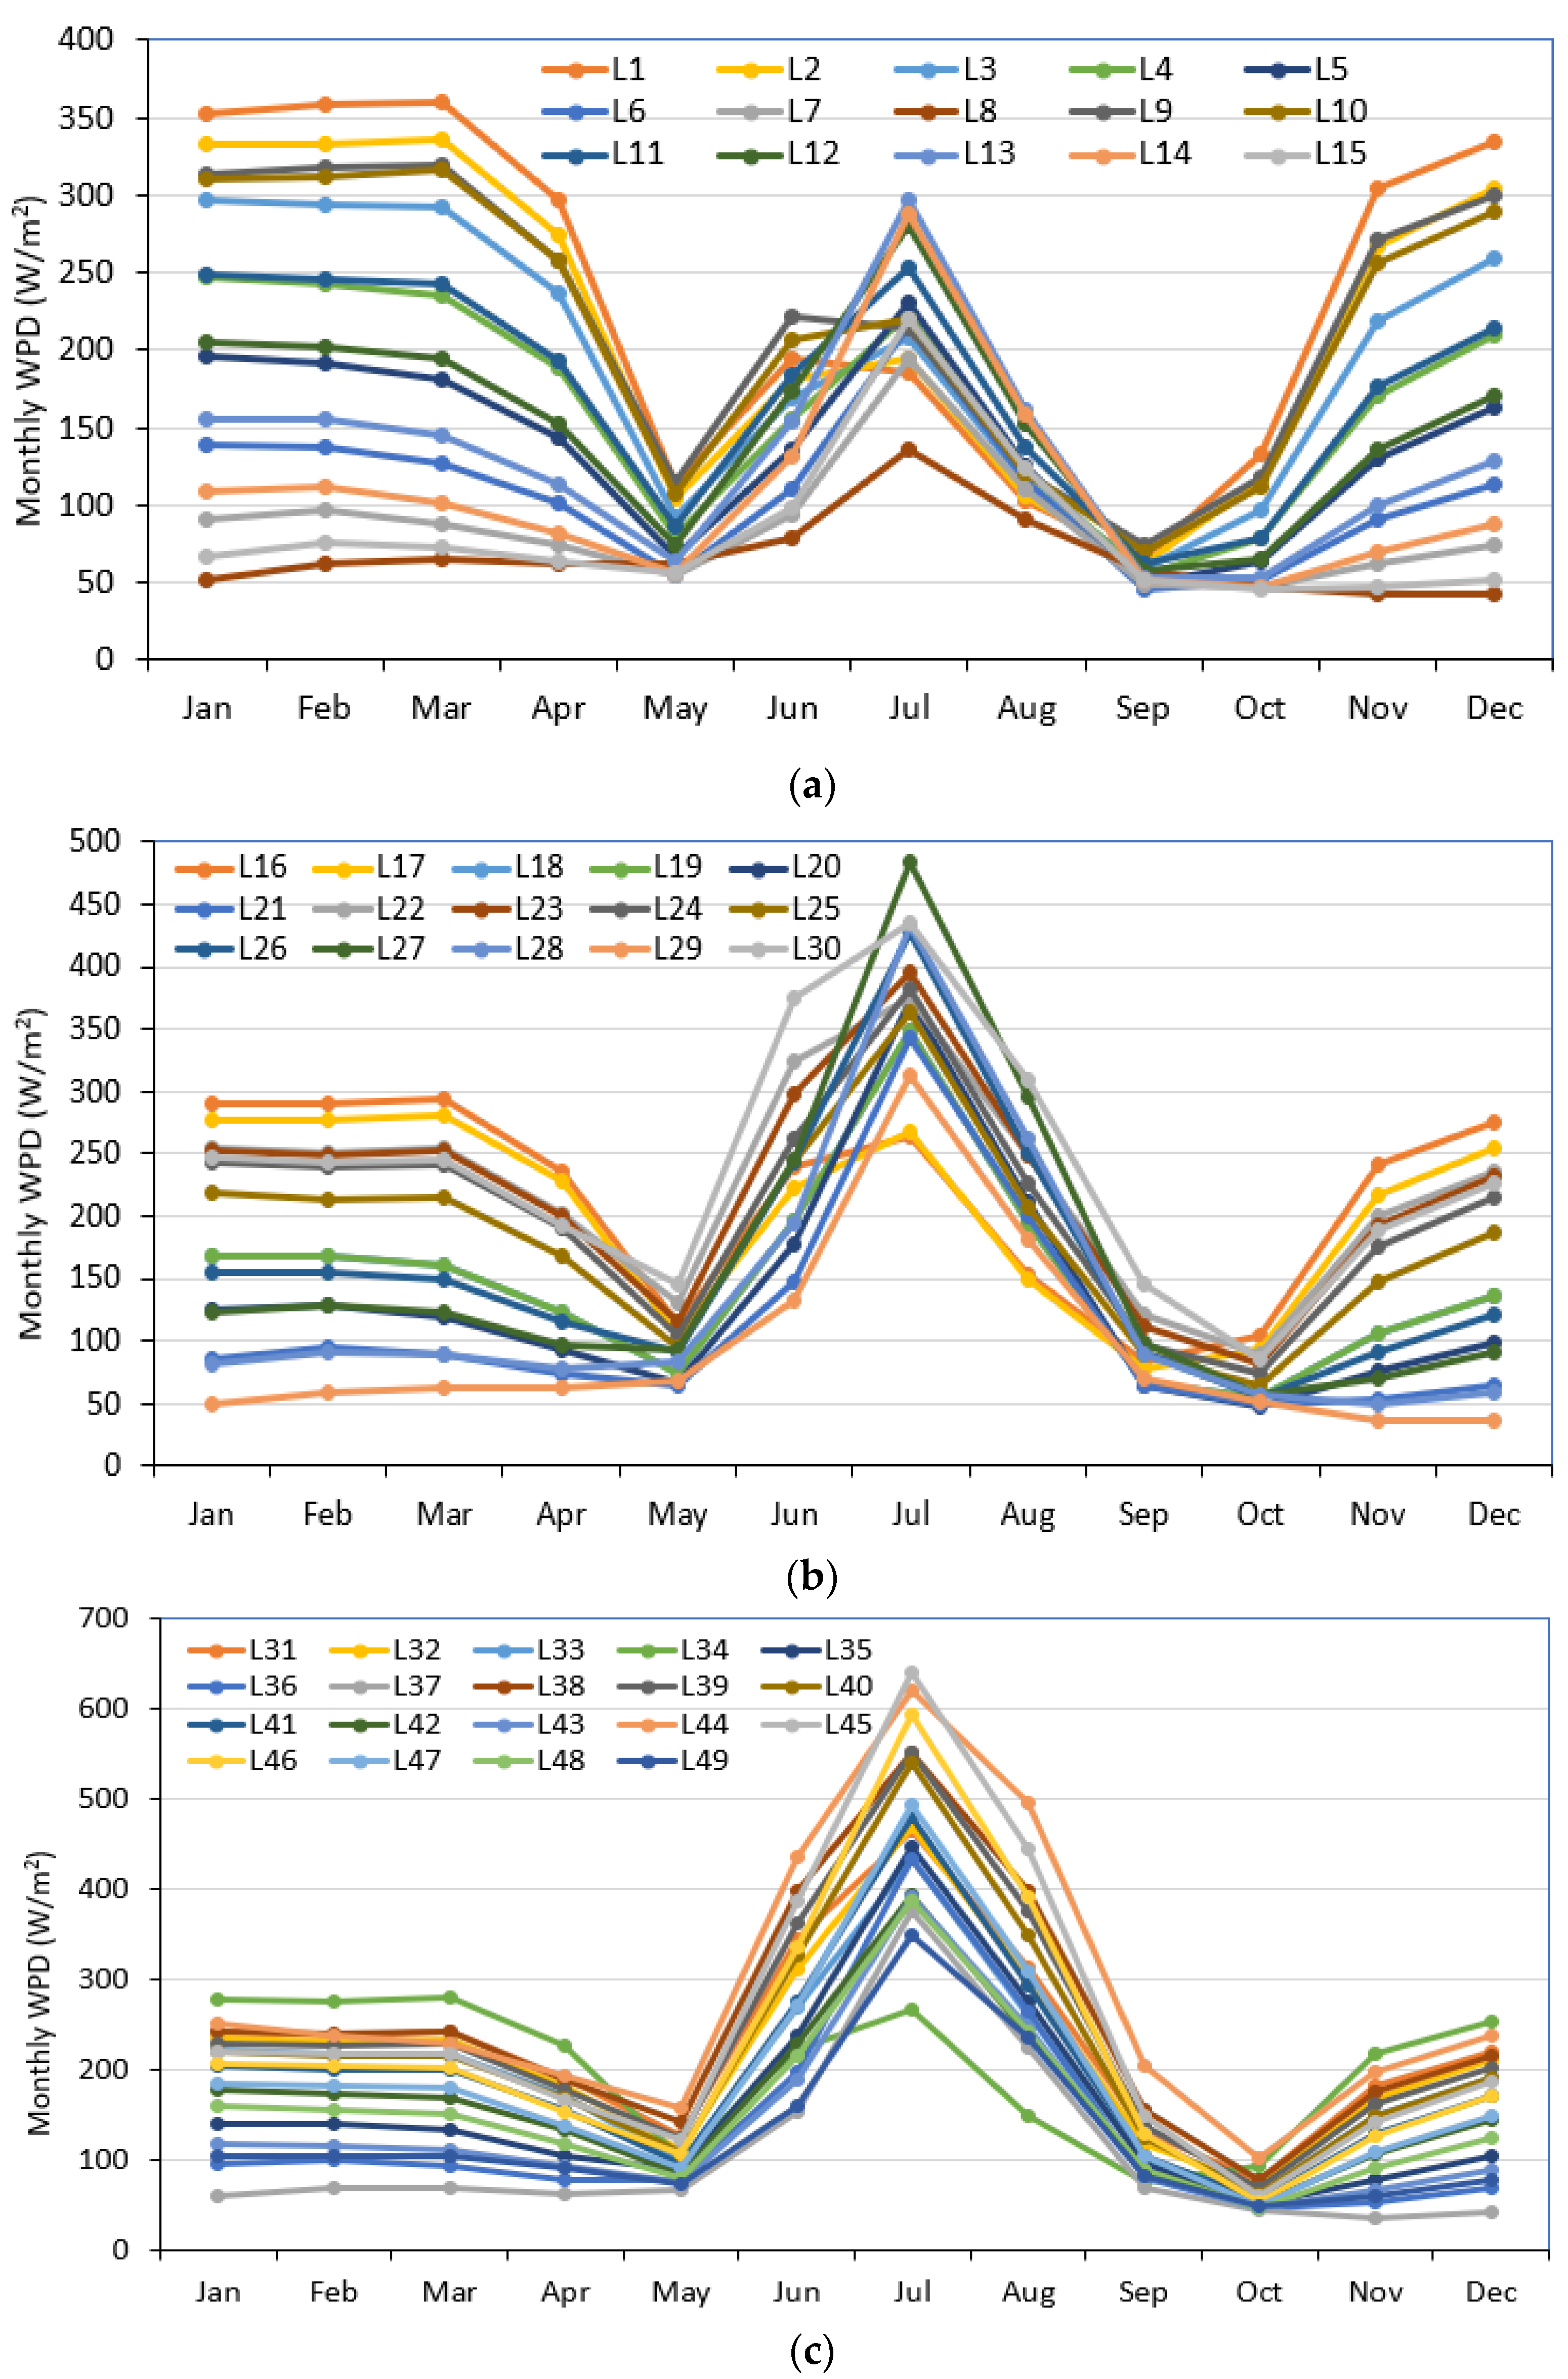
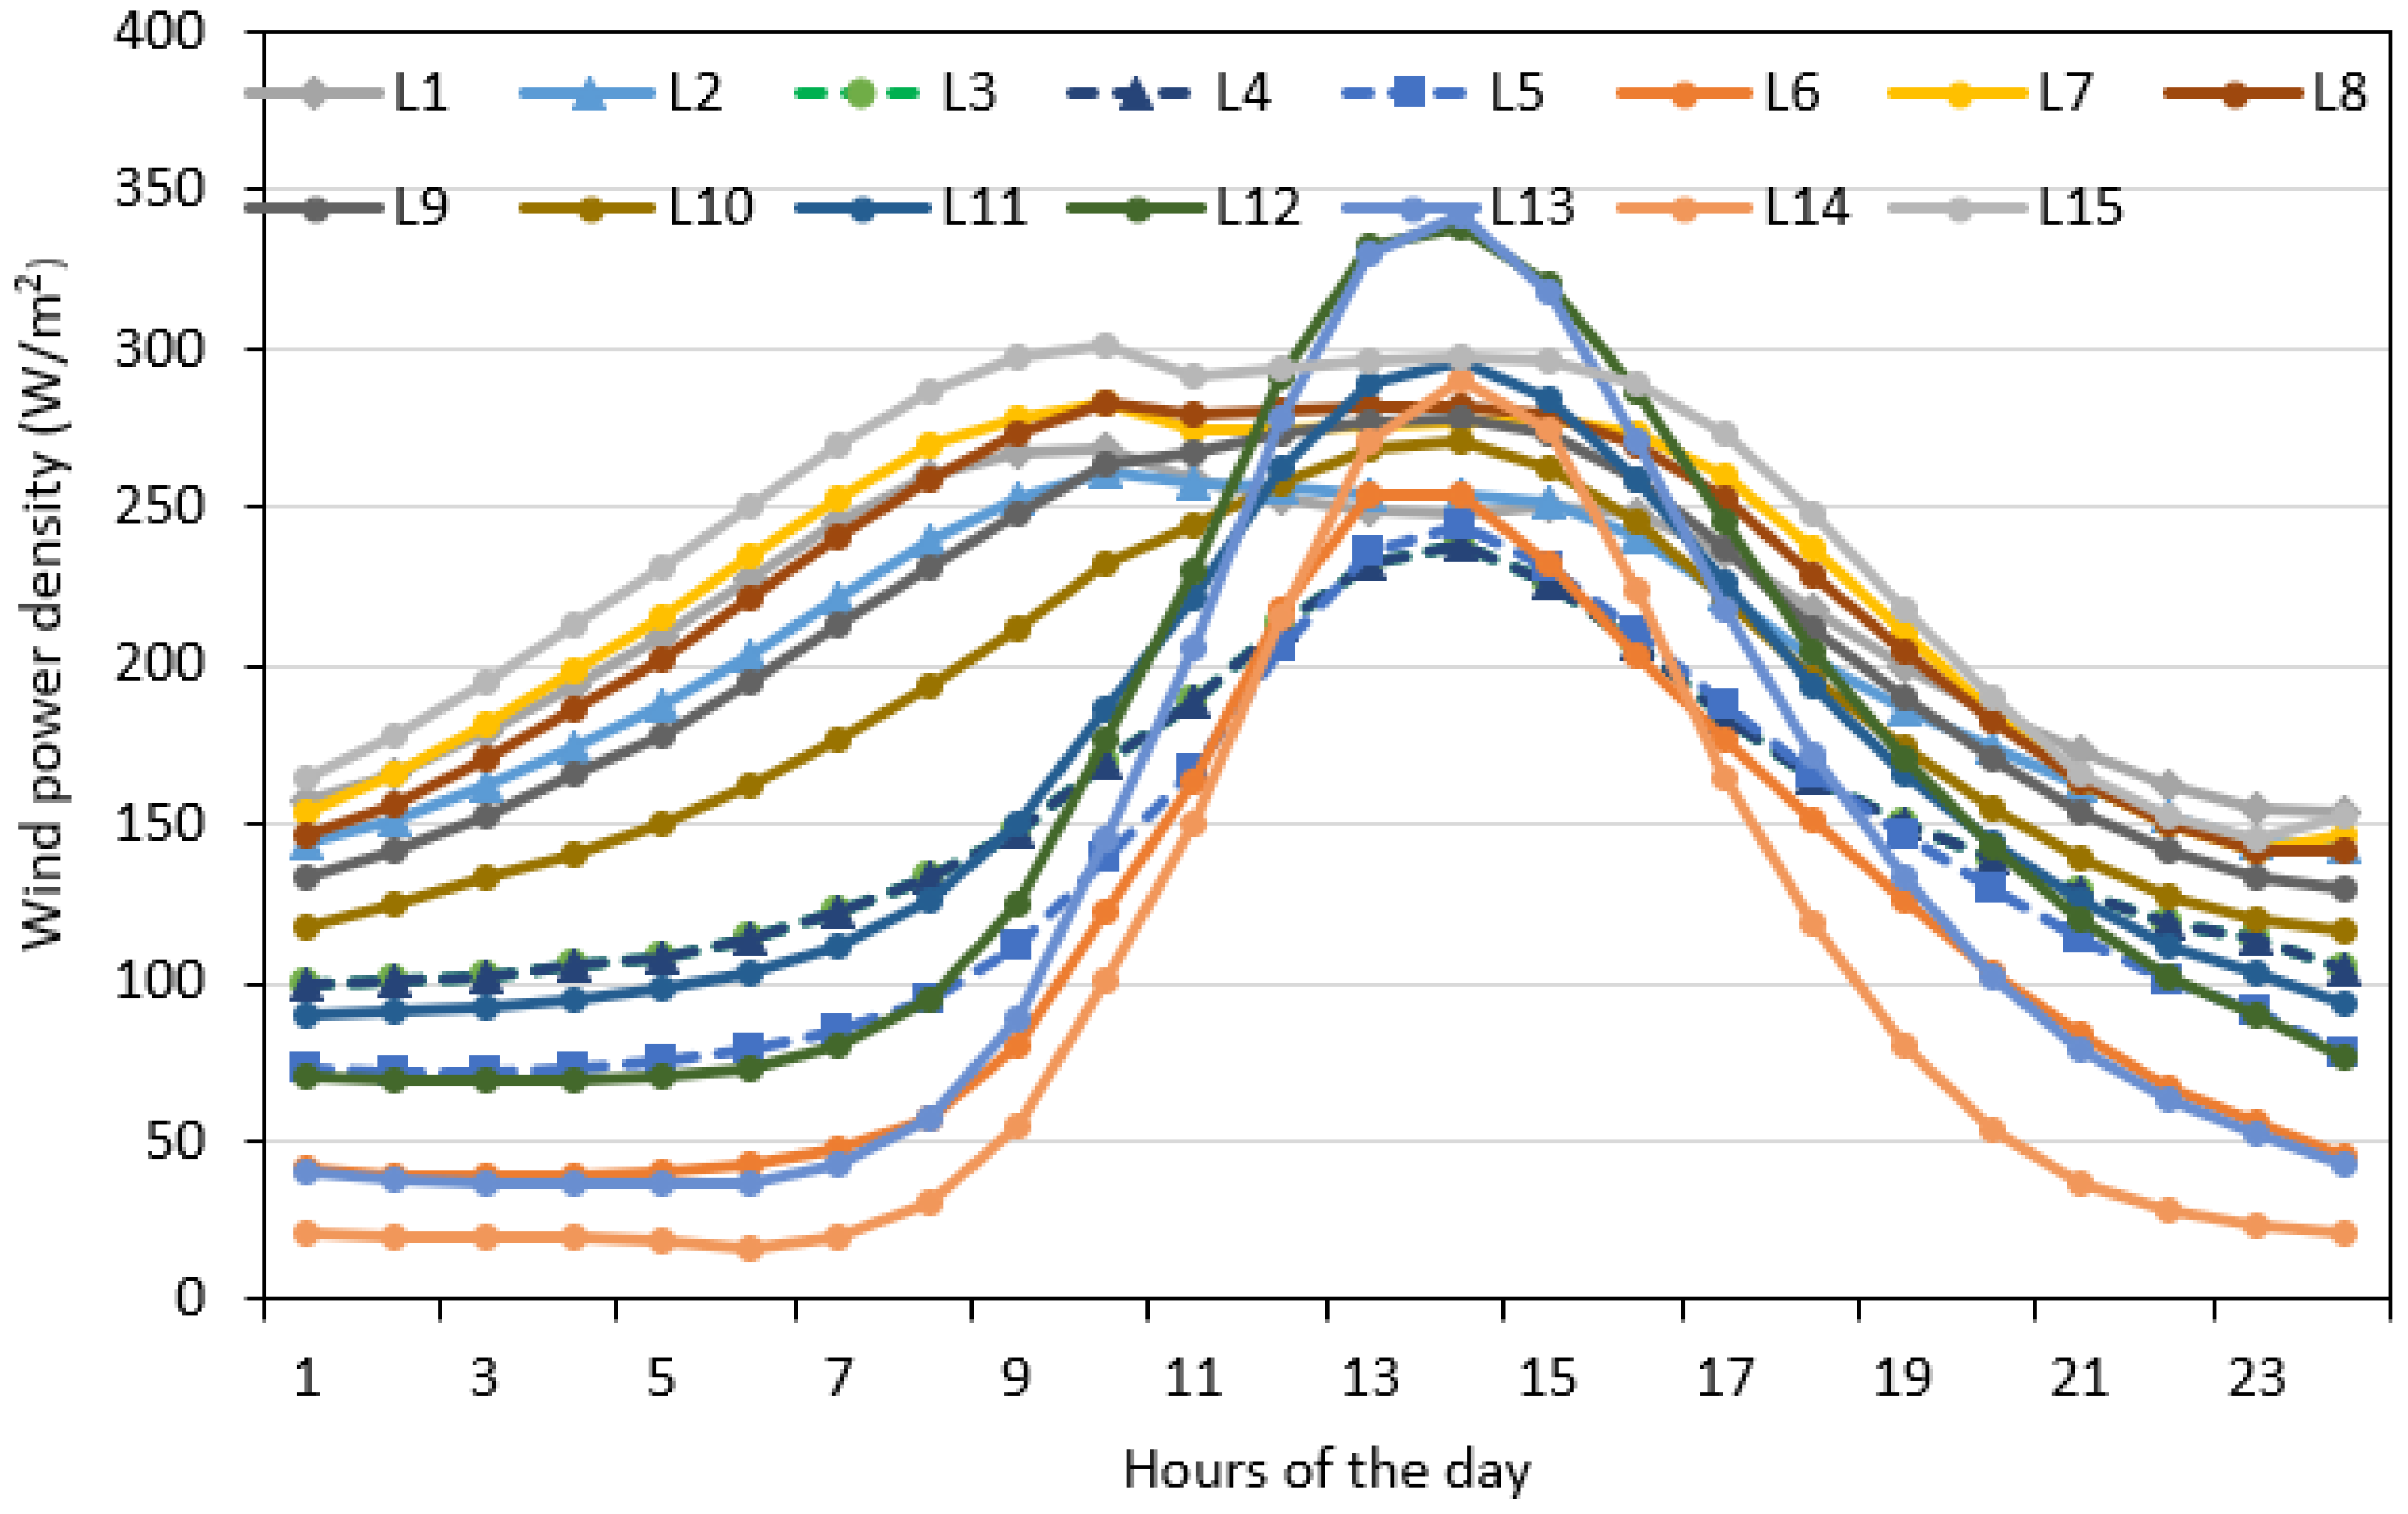
4.1. Variability of Wind Speed and Wind Power Density on Annual, Monthly, and Hourly Scales
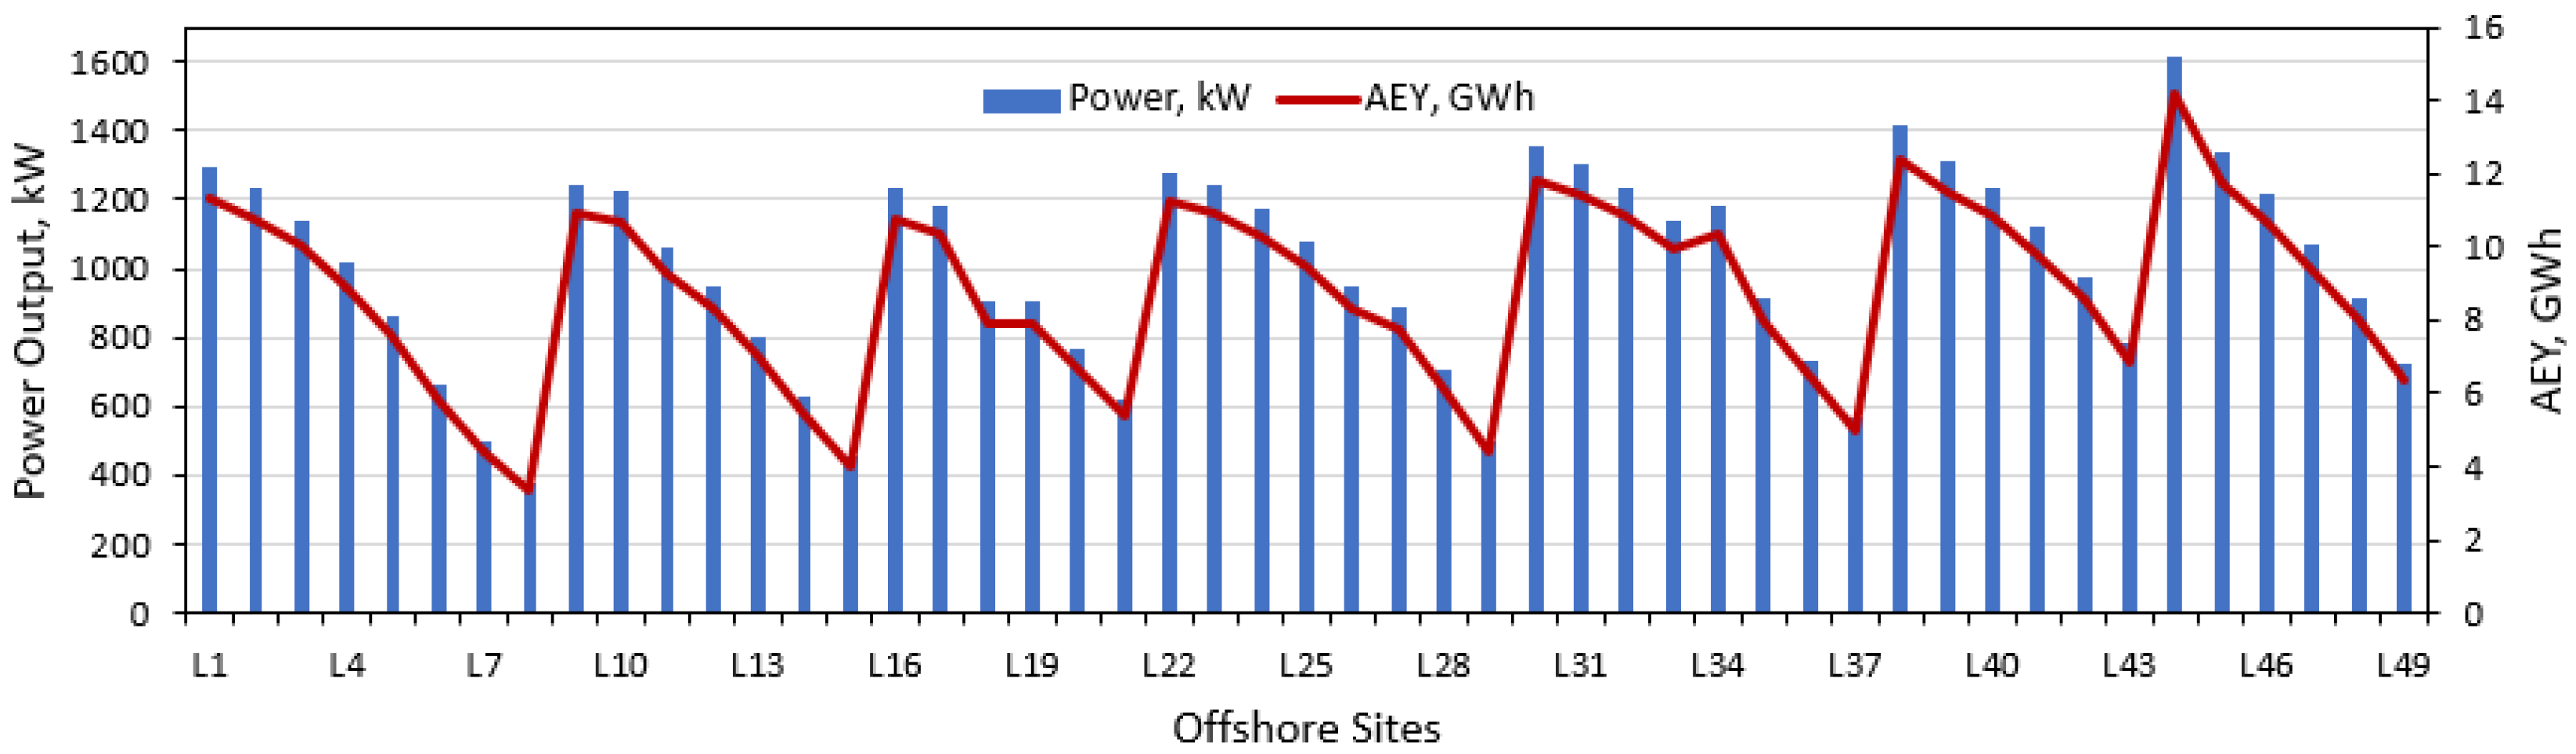
4.2. Wind Power Generation and Plant Capacity Factor Analysis
5. Conclusions
- Overall, the long-term annual mean wind speeds varied between 3.83 and 6.39 m/s at L8 and L44 sites while the respective wind WPD values were estimated to be 66.6 and 280.0 W/m2. The prevailing wind directions were found to be from the north and northwest, meaning less turbulence, veering, and backing effects; assuring longer life of the wind turbines.
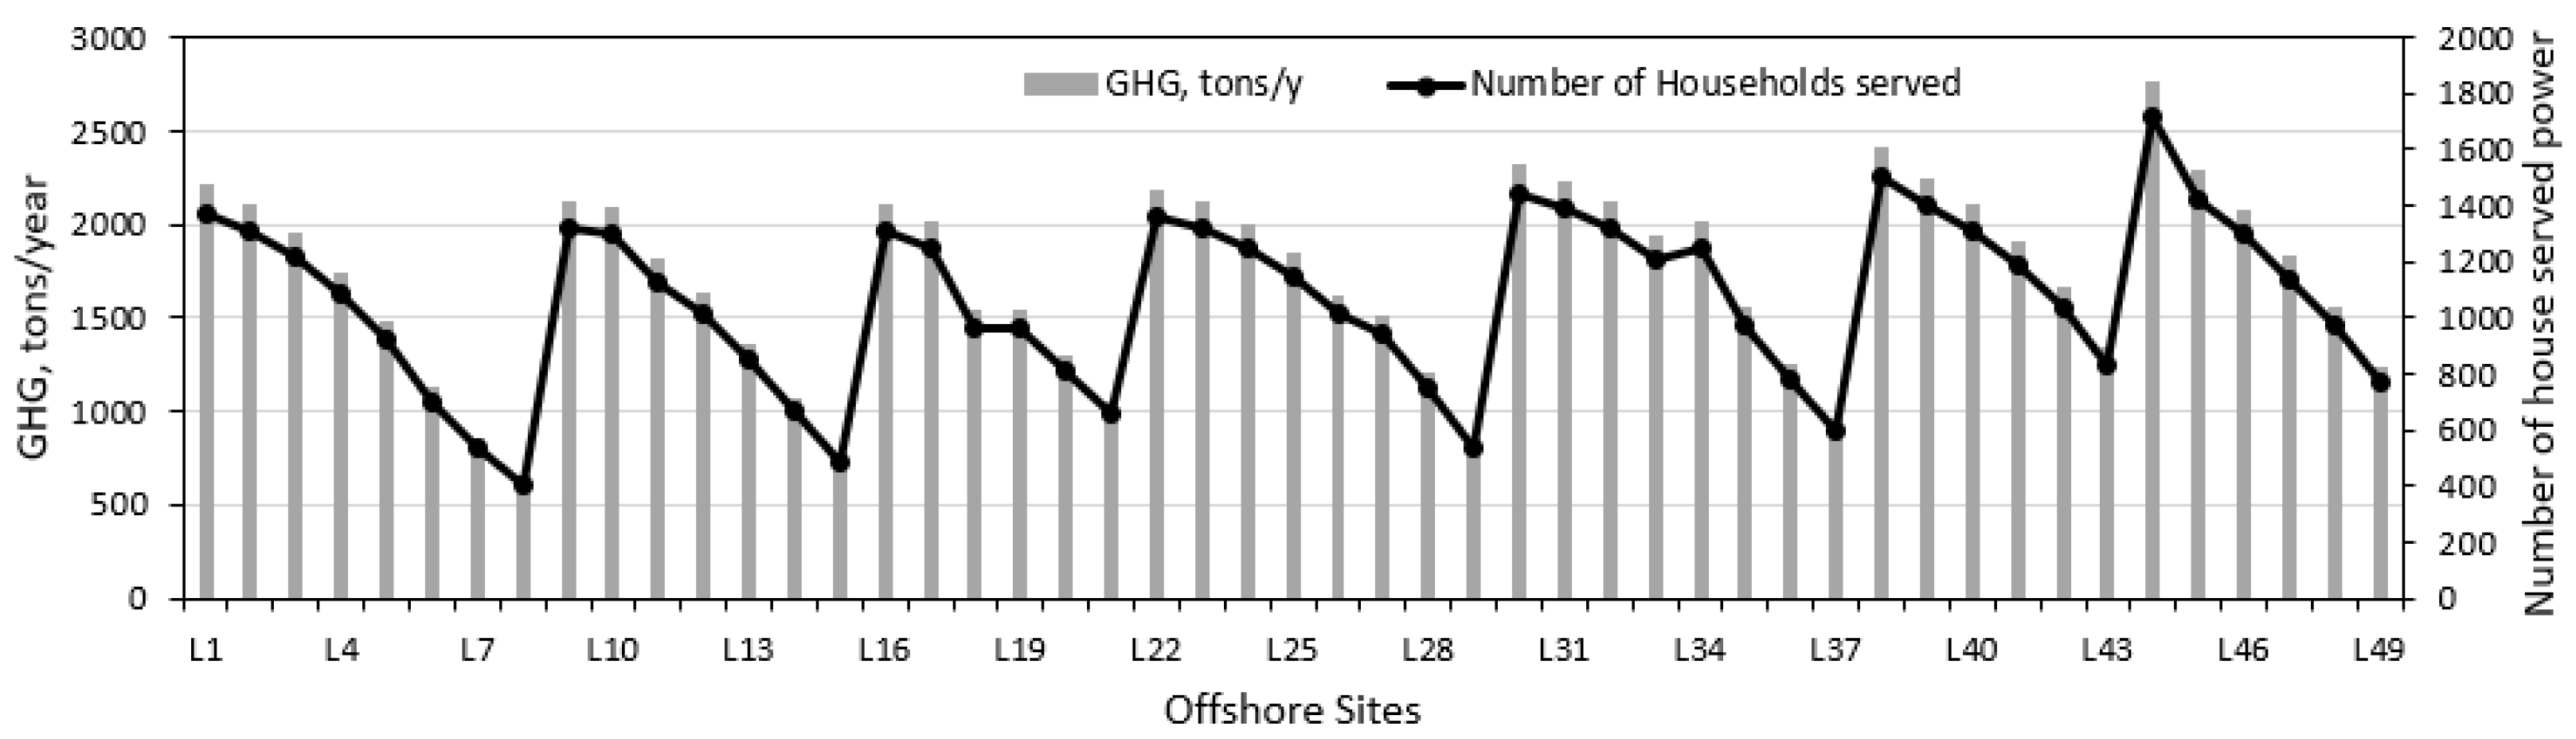
- Higher values of mean power of 725 kW to 1600 kW and AEY of 6.35 GWh to 14.14 GWh were observed at L49 and L44. The PCFs at coastal sites L8, L15, L21, L29, L37, L43, and L49 had the lowest values of 6.19, 7.14, 10.00, 8.12, 9.17, 12.77, and 11.78%, while near Saudi water limiting areas L1, L9, L16, L22, L30, L38, and L44 the highest values of 21.03, 20.25, 20.00, 20.83, 22.00, 22.98, and 26.24% were observed, respectively.
- The Weibull shape and scale parameters ranged from 1.59 (L37) to 1.97 (L44) and 4.31 m/s (L8) and 7.2. m/s (L44).
- Lower values of mean wind variability indices (MWVI) are preferred due to being representative of the least turbulent nature of the winds, which assures a longer working life of the WTs. In the present case, MWVI varied between 0.98 and 3.18 at L18 and L37 sites. At ten potential windy sites (L44, L38, L30, L45, L39, L31, L1, L22, L9, and L23), MWVI values were around 1.0 and 3.00 which simply means that winds are relatively turbulent but still good for the longer working life of wind turbines. Next, higher values of MWSI are opted for while selecting a potential windy site. In the present case, MWSI values of 0.38 to 6.67 were obtained corresponding to L15 and L18 sites. At the first 10 preferred sites, MWSI values remained >3.0 except sites L30, L22, and L23 where these are <1.0.
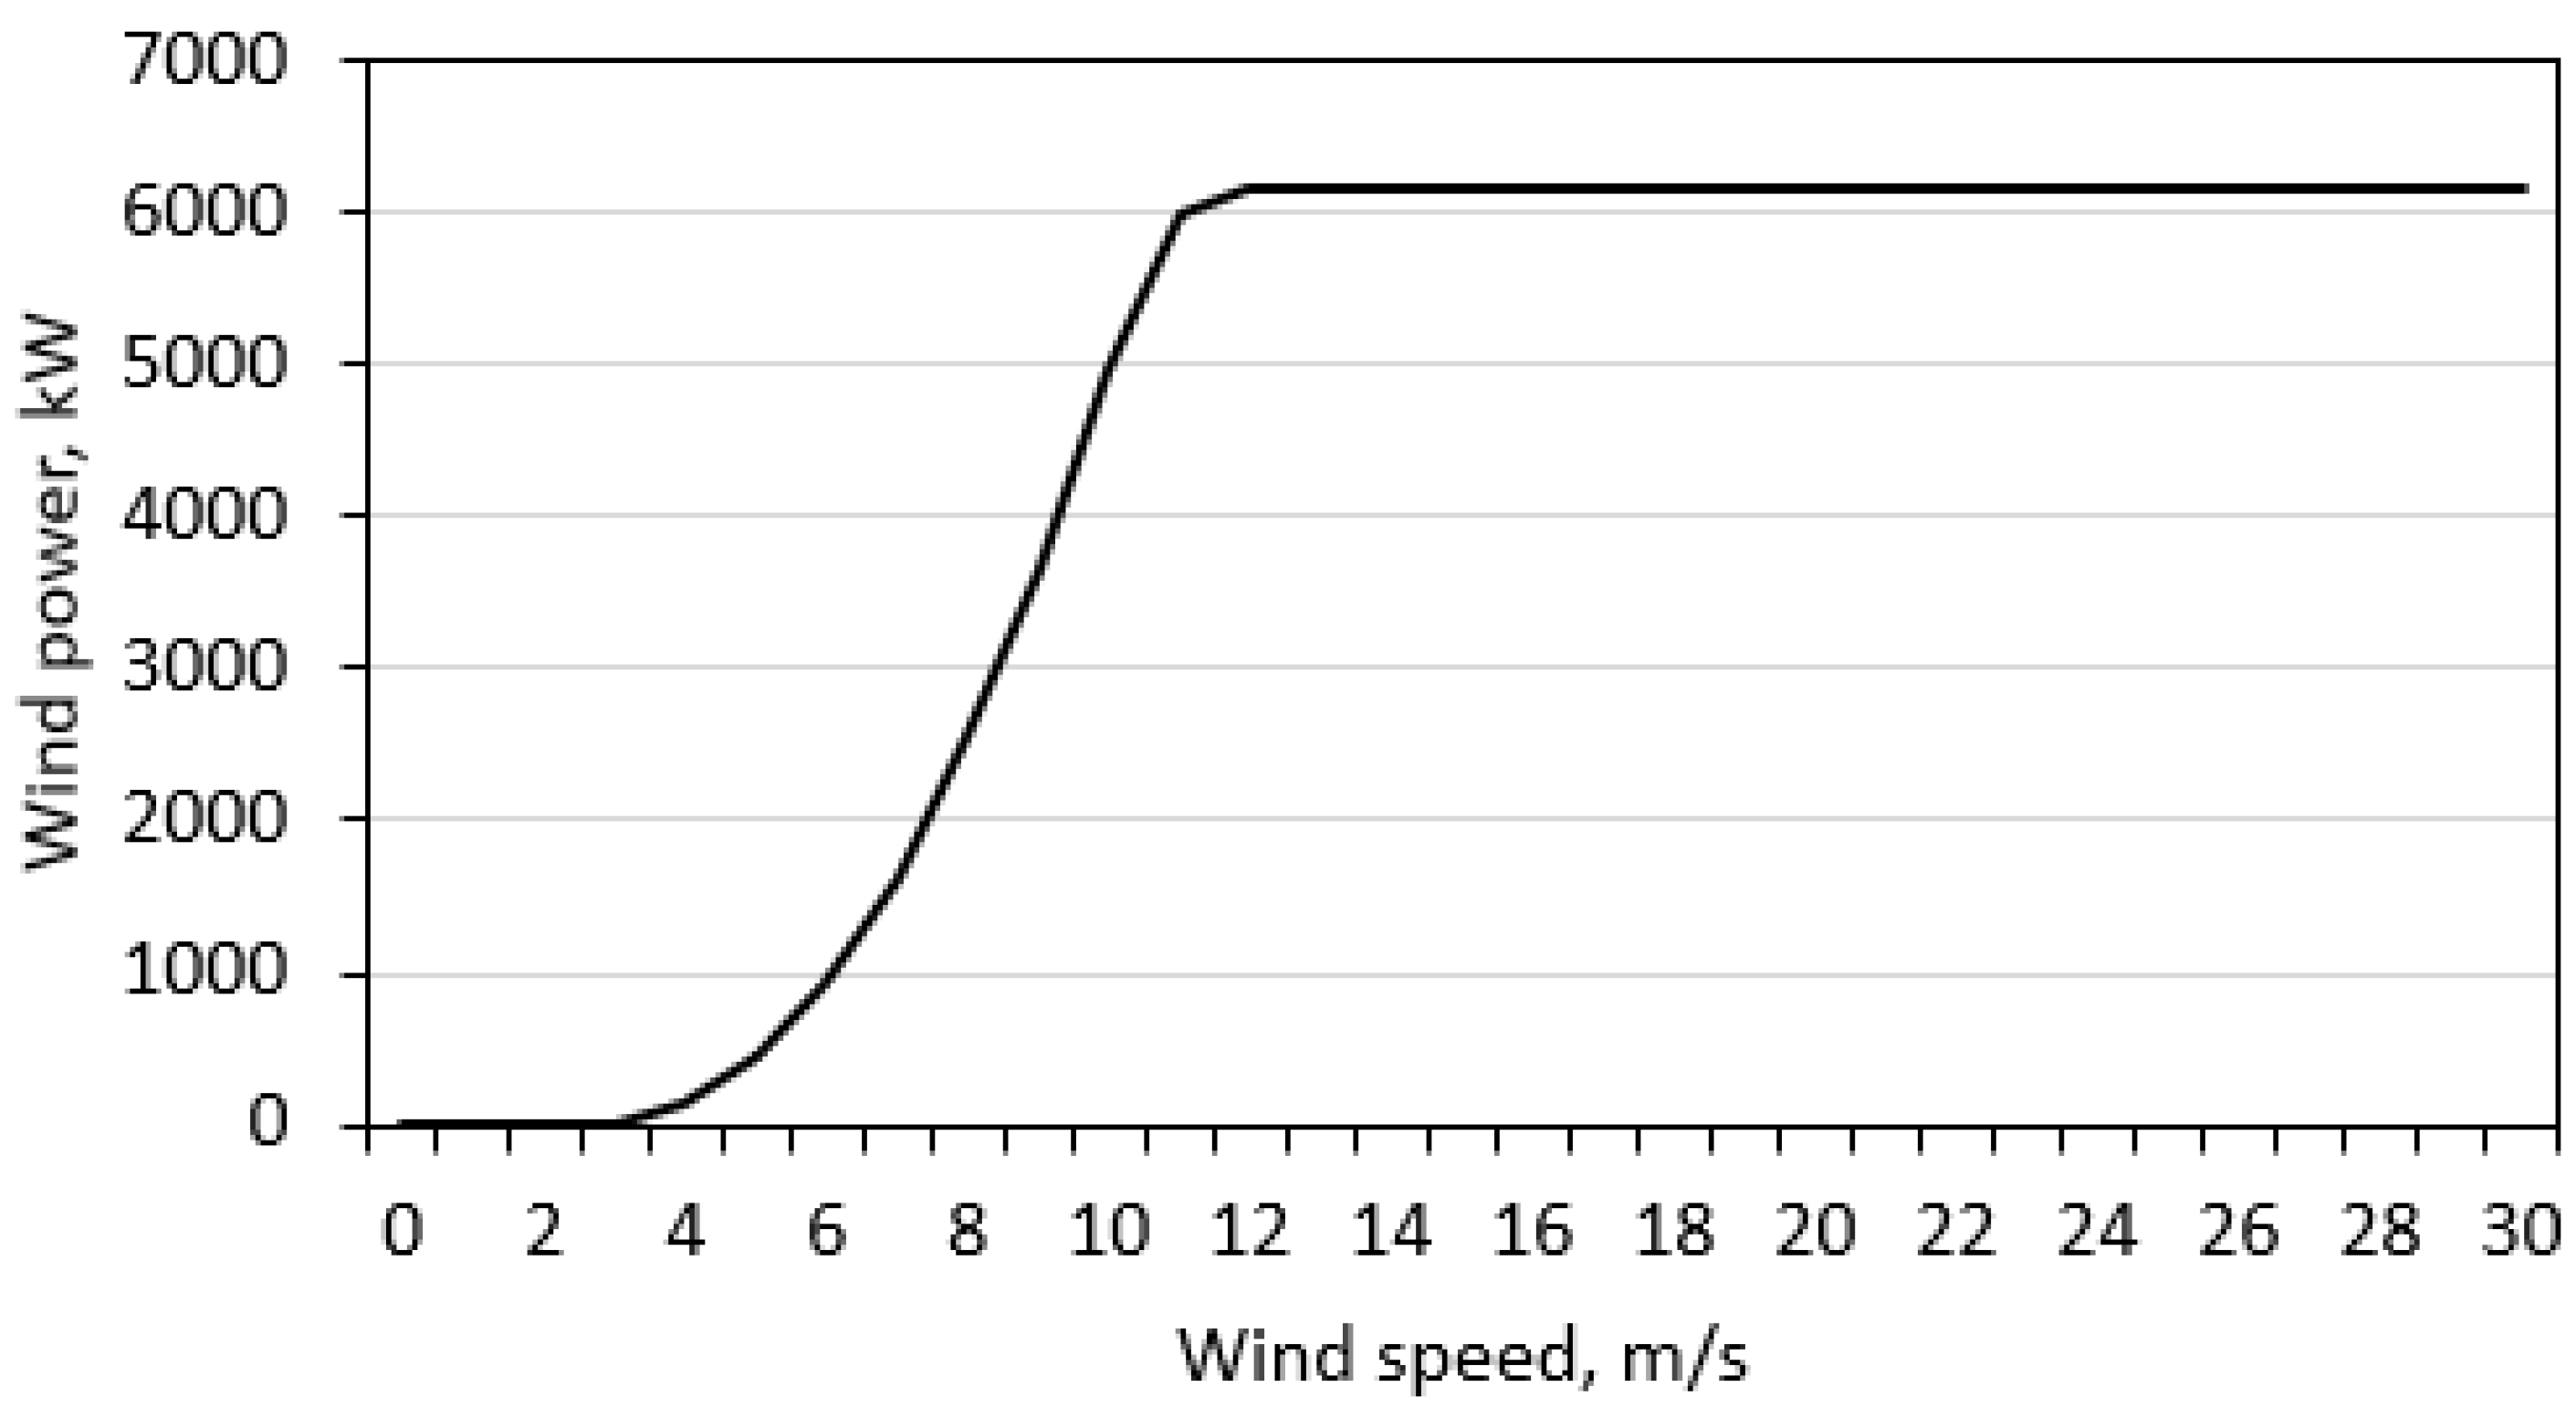
- For the chosen 6.2 MW rated power offshore wind turbine with a cut-in speed of 3.5 m/s, the wind duration was found to be between 49% at L8 and 77% at L44 with an overall average of 63.2%. This high availability of wind in the region under investigation, is a good indicator for promoting the offshore wind farms deployment.
- Decreasing trends of wind power, AEYs, and PCFs were observed from Saudi waters’ limiting boundary towards the Red Sea coastal sites. However, slightly increasing values of the above measures were seen while moving from the southernmost part to the northern sites.
- It was noticed that COE increases from the western water boundary to the eastern coastal area and slightly decreases from south to northwards. In this region, the wind power can be produced at a COE of 2.07 USD/kWh to 8.78 USD/kWh corresponding to sites L8 and L44 with an overall mean of 3.72 USD/kWh.
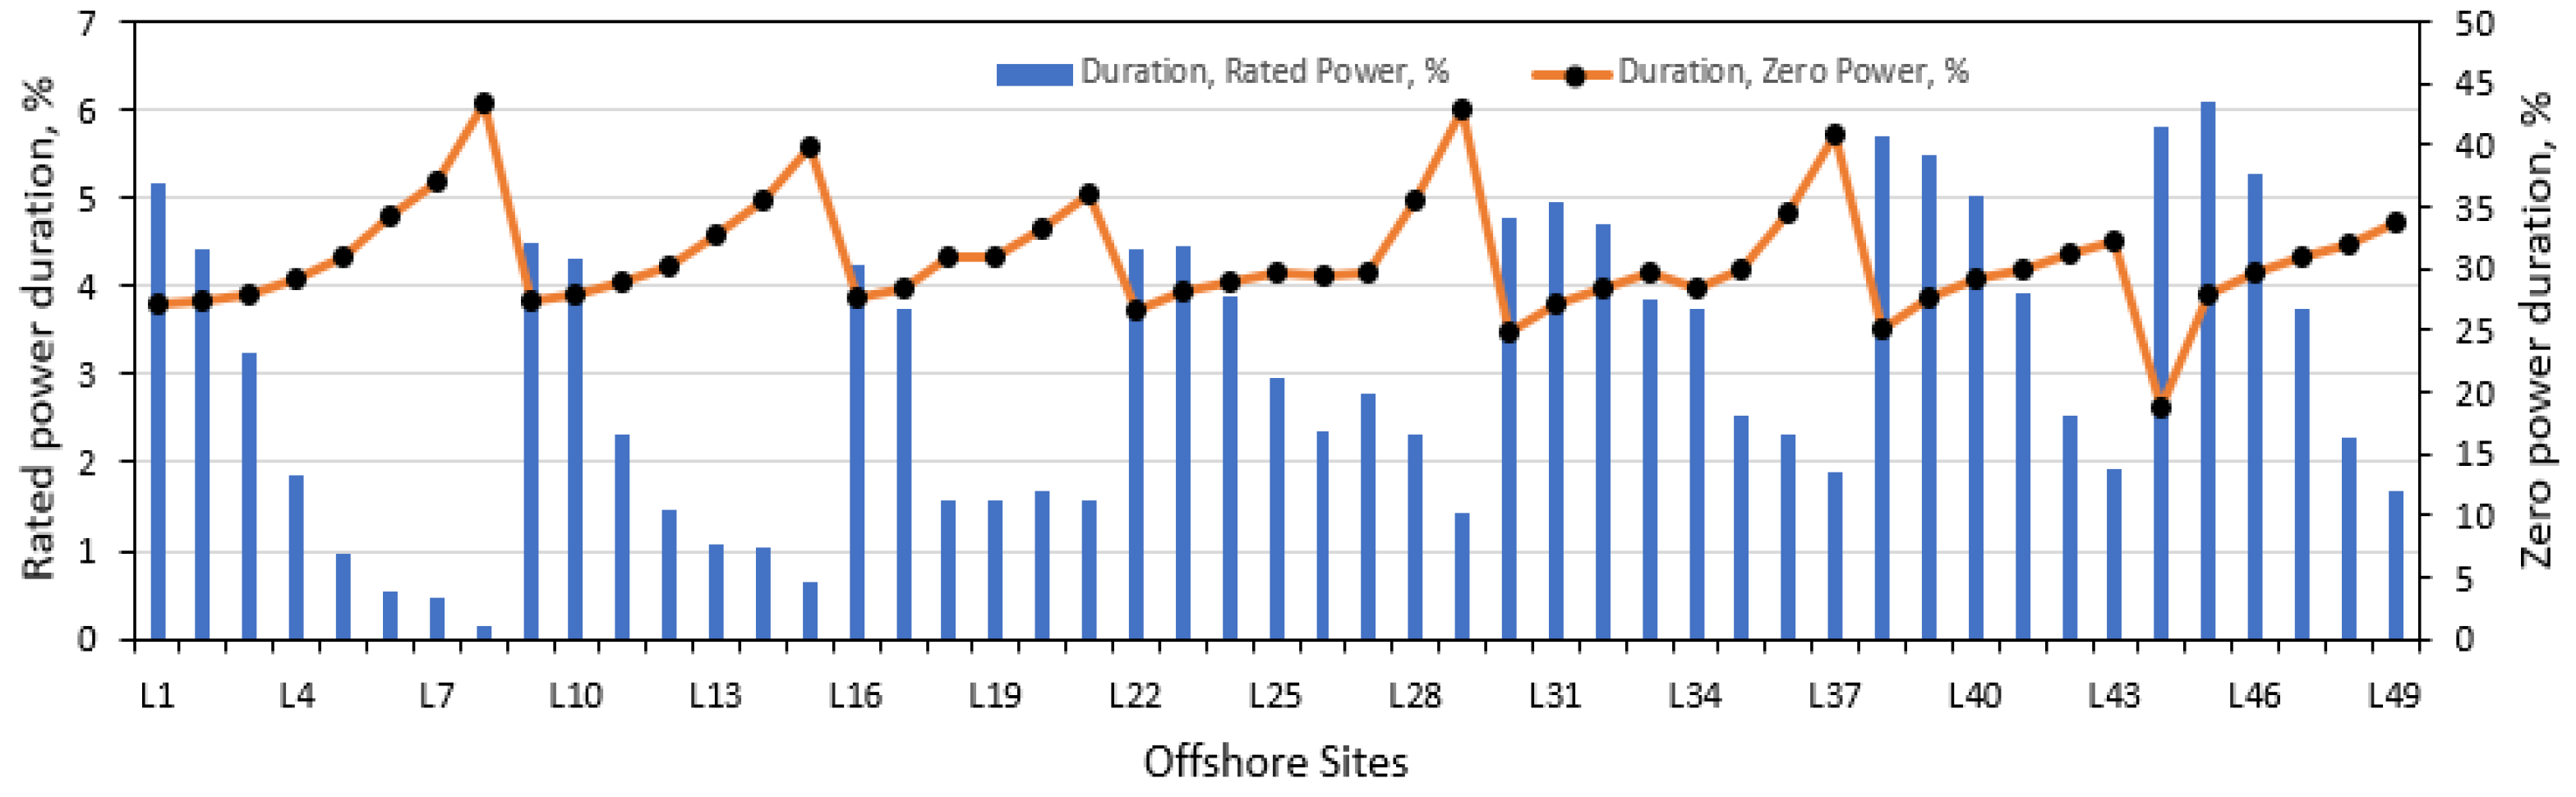
- The chosen WT could produce the rated power >3.0% of the time annually at 23 sites, while on average, did not produce any power for 30.79% of the time.
Author Contributions
Funding
Data Availability Statement
Conflicts of Interest
Nomenclature
| AEY | Annual Energy Yield (kWh/yr, MWh/yr, or GWh/yr) |
| CAPEX | Capital Expenditure |
| CCMP | Cross-Calibrated Multi-Platform |
| CFSR | Climate Forecast System Reanalysis |
| CFSv2 | Climate Forecast System Version 2 |
| COE | Cost of Energy (USD/kWh) |
| CRMC | Cube Root Mean Cubed |
| DCoast | Distance from the coast (km) |
| ECMWF | Medium-Range Weather Forecasts |
| ERA | Fifth Generation ECMWF |
| F | Percent Frequency of WPD above 200/250 W/m2 |
| GW | Gigawatt |
| GWh | Gigawatt hour |
| HH | Hub Height (m) |
| kW | kilo Watt |
| kWh | kilo Watt hour |
| COE | Cost of Energy (USD/MWh) |
| MCP | Measure Correlate Predict |
| MERRA | Modern-Era Retrospective Analysis for Research and Applications |
| MERRA | Modern-Era Retrospective Analysis for Research and Applications (v2) |
| MW | Megawatt |
| MWh | Megawatt hour |
| MWVI | Mean Wind Variability Index |
| MWSI | Mean Windy Site Identifier |
| OWP | Offshore Wind Power |
| OWPR | Offshore Wind Power Resources |
| OWPRA | Offshore Wind Power Resources Assessment |
| PCF | Plant Capacity Factor (%) |
| RD | Rotor Diameter (m) |
| V | Hourly Mean Wind Speed (m/s) |
| WP | Gross Wind Power (W, kW, MW, or GW) |
| WS | Wind Speed (m/s) |
| WD | Wind Direction (°) |
| WPC | Wind Power Class (1-Poor, 2-Marginal, 4-Good, so on) |
| WPD | Wind Power Density (W/m2) |
| WPDMEM | Wind Power Density for most energetic month |
| WPDLEM | Wind Power Density for least energetic month |
| WPDMEY | Wind Power Density for most energetic year |
| WPDLEY | Wind Power Density for least energetic year |
| WPDMEP | Mean Wind Power Density for entire data set |
| WSE | Wind Shear Exponent |
| WT | Wind Turbine |
| Symbols | |
| α | Wind Shear Exponent |
| ρ | Air Density (kg/m3) |
| σ | Standard Deviation |
References
- MacAskill, A.; Mitchell, P. Offshore wind—An overview. WIREs Energy Environ. 2013, 2, 374–383. [Google Scholar] [CrossRef]
- Rehman, S.; Kotb, K.M.; Zayed, M.E.; Menesy, A.S.; Irshad, K.; Alzahrani, A.S.; Mohandes, M.A. Techno-economic evaluation and improved sizing optimization of green hydrogen production and storage under higher wind penetration in Aqaba Gulf. J. Energy Storage 2024, 99, 113368. [Google Scholar] [CrossRef]
- Arrambide, I.; Zubia, I.; Madariaga, A. Critical review of offshore wind turbine energy production and site potential assessment. Electr. Power Syst. Res. 2018, 167, 39–47. [Google Scholar] [CrossRef]
- Archer, C.L.; Jacobson, M.Z. Evaluation of global wind power. J. Geophys. Res. Atmos. 2005, 110. [Google Scholar] [CrossRef]
- Jennings, T.; Tipper, H.A.; Daglish, J.; Grubb, M.; Drummond, P. Policy, Innovation and Cost Reduction in UK Offshore Wind; University College London: London, UK, 2020. [Google Scholar]
- Rodrigues, S.; Restrepo, C.; Kontos, E.; Pinto, R.T.; Bauer, P. Trends of offshore wind projects. Renew. Sustain. Energy Rev. 2015, 49, 1114–1135. [Google Scholar] [CrossRef]
- Arshad, M.; O’kelly, B. Global status of wind power generation: Theory, practice, and challenges. Int. J. Green Energy 2019, 16, 1073–1090. [Google Scholar] [CrossRef]
- Glasson, J. Community Benefits and UK Offshore Wind Farms: Evolving Convergence in a Divergent Practice. J. Environ. Assess. Policy Manag. 2020, 22, 2150001. [Google Scholar] [CrossRef]
- Do, T.N.; Burke, P.J.; Hughes, L.; Thi, T.D. Policy options for offshore wind power in Vietnam. Mar. Policy 2022, 141, 105080. [Google Scholar] [CrossRef]
- Sacco, R.L.; Megre, M.; de Medeiros Costa, H.K.; Brito, T.L.F.; dos Santos, E.M. Energy transition policies in Germany and the United Kingdom. Energy Res. Soc. Sci. 2024, 110, 103460. [Google Scholar] [CrossRef]
- Dehghani-Sanij, A.; Al-Haq, A.; Bastian, J.; Luehr, G.; Nathwani, J.; Dusseault, M.; Leonenko, Y. Assessment of current developments and future prospects of wind energy in Canada. Sustain. Energy Technol. Assess. 2021, 50, 101819. [Google Scholar] [CrossRef]
- Kara, T.; Şahin, A.D. Implications of Climate Change on Wind Energy Potential. Sustainability 2023, 15, 14822. [Google Scholar] [CrossRef]
- Steen, M.; Mäkitie, T.; Hanson, J.; Normann, H.E. Developing the industrial capacity for energy transitions: Resource formation for offshore wind in Europe. Environ. Innov. Soc. Transit. 2022, 53, 100925. [Google Scholar] [CrossRef]
- Qiu, D.; Baig, A.M.; Wang, Y.; Wang, L.; Jiang, C.; Strbac, G. Market design for ancillary service provisions of inertia and frequency response via virtual power plants: A non-convex bi-level optimisation approach. Appl. Energy 2024, 361, 122929. [Google Scholar] [CrossRef]
- Li, R.; Jin, X.; Yang, P.; Feng, Y.; Liu, Y.; Wang, S.; Ou, X.; Zeng, P.; Li, Y. Large-scale offshore wind energy integration by wind-thermal bundled power system: A case study of Yangxi, China. J. Clean. Prod. 2024, 435, 140601. [Google Scholar] [CrossRef]
- Zhang, Y.; Zhang, D.; Jiang, H. A Review of Offshore Wind and Wave Installations in Some Areas with an Eye towards Generating Economic Benefits and Offering Commercial Inspiration. Sustainability 2023, 15, 8429. [Google Scholar] [CrossRef]
- Mathews, J.; Thurbon, E.; Kim, S.-Y.; Tan, H. Gone with the wind: How state power and industrial policy in the offshore wind power sector are blowing away the obstacles to East Asia’s green energy transition. Rev. Evol. Politi-Econ. 2022, 4, 27–48. [Google Scholar] [CrossRef]
- Musial, W.D.; Beiter, P.C.; Nunemaker, J.; Heimiller, D.M.; Ahmann, J.; Busch, J. Oregon Offshore Wind Site Feasibility and Cost Study; National Renewable Energy Laboratory: Golden, CO, USA, 2019. [Google Scholar] [CrossRef]
- Wang, J.; Wei, X.; Juanatas, R. Study on the optimization strategy of offshore wind power. Int. J. Low-Carbon Technol. 2023, 18, 367–372. [Google Scholar] [CrossRef]
- Ministerie van Algemene Zaken, “Offshore Wind Energy”, Renewable Energy | Government.nl. Available online: https://www.tweedekamer.nl/downloads/document?id=2022D36279 (accessed on 17 November 2024).
- Basha, J.S.; Jafary, T.; Vasudevan, R.; Bahadur, J.K.; Al Ajmi, M.; Al Neyadi, A.; Soudagar, M.E.M.; Mujtaba, M.; Hussain, A.; Ahmed, W.; et al. Potential of Utilization of Renewable Energy Technologies in Gulf Countries. Sustainability 2021, 13, 10261. [Google Scholar] [CrossRef]
- Ahmed, A.S. Wind resource assessment and economics of electric generation at four locations in Sinai Peninsula, Egypt. J. Clean. Prod. 2018, 183, 1170–1183. [Google Scholar] [CrossRef]
- International Energy Agency. World Energy Prices: An Overview; International Energy Agency (IEAb): Paris, France, 2023. [Google Scholar]
- Al-Dubai, T.A.; Abu-Zied, R.H.; Basaham, A.S. Present environmental status of Al-Kharrar Lagoon, central of the eastern Red Sea coast, Saudi Arabia. Arab. J. Geosci. 2017, 10, 305. [Google Scholar] [CrossRef]
- ACWA Power. Saudi Arabia is Unlocking the Potential of Wind Energy. Available online: https://www.acwapower.com/news/saudi-arabia-is-unlocking-the-potential-of-wind-energy/ (accessed on 15 August 2024).
- Albraheem, L.; Alawlaqi, L. Geospatial analysis of wind energy plant in Saudi Arabia using a GIS-AHP technique. Energy Rep. 2023, 9, 5878–5898. [Google Scholar] [CrossRef]
- Musial, W.; Ram, B. Large-Scale Offshore Wind Energy for the United States: Assessment of Opportunities and Barriers; National Renewable Energy Laboratory: Golden, CO, USA, 2010. [Google Scholar]
- Rehman, S.; Irshad, K.; Ibrahim, N.I.; AlShaikhi, A.; Mohandes, M.A. Offshore Wind Power Resource Assessment in the Gulf of North Suez. Sustainability 2023, 15, 15257. [Google Scholar] [CrossRef]
- Alkhayyat, M.; Brahimi, T.; Langodan, S.; Hoteit, I. Wave Energy in the Red Sea Region Perspectives and Analysis. In Proceedings of the 2020 6th IEEE International Energy Conference (ENERGYCon), Gammarth, Tunisia, 28 September–1 October 2020; pp. 457–463. [Google Scholar]
- Hayes, L.; Stocks, M.; Blakers, A. Accurate long-term power generation model for offshore wind farms in Europe using ERA5 reanalysis. Energy 2021, 229, 120603. [Google Scholar] [CrossRef]
- Früh, W.-G. Long-term wind resource and uncertainty estimation using wind records from Scotland as example. Renew. Energy 2013, 50, 1014–1026. [Google Scholar] [CrossRef]
- Cannon, D.; Brayshaw, D.; Methven, J.; Coker, P.; Lenaghan, D. Using reanalysis data to quantify extreme wind power generation statistics: A 33 year case study in Great Britain. Renew. Energy 2015, 75, 767–778. [Google Scholar] [CrossRef]
- Nezhad, M.M.; Neshat, M.; Groppi, D.; Marzialetti, P.; Heydari, A.; Sylaios, G.; Garcia, D.A. A primary offshore wind farm site assessment using reanalysis data: A case study for Samothraki island. Renew. Energy 2021, 172, 667–679. [Google Scholar] [CrossRef]
- Sharp, E.; Dodds, P.; Barrett, M.; Spataru, C. Evaluating the accuracy of CFSR reanalysis hourly wind speed forecasts for the UK, using in situ measurements and geographical information. Renew. Energy 2015, 77, 527–538. [Google Scholar] [CrossRef]
- Gualtieri, G. Reliability of ERA5 Reanalysis Data for Wind Resource Assessment: A Comparison against Tall Towers. Energies 2021, 14, 4169. [Google Scholar] [CrossRef]
- Hersbach, H.; Bell, B.; Berrisford, P.; Hirahara, S.; Horányi, A.; Muñoz-Sabater, J.; Nicolas, J.; Peubey, C.; Radu, R.; Schepers, D.; et al. The ERA5 global reanalysis. Q. J. R. Meteorol. Soc. 2020, 146, 1999–2049. [Google Scholar] [CrossRef]
- Camargo, L.R.; Gruber, K.; Nitsch, F. Assessing variables of regional reanalysis data sets relevant for modelling small-scale renewable energy systems. Renew. Energy 2019, 133, 1468–1478. [Google Scholar] [CrossRef]
- Windnavigator. Available online: https://windnavigator.ul-renewables.com/index.php/wsa (accessed on 13 February 2023).
- Rehman, S.; El-Amin, I.M.; Ahmad, F.; Shaahid, S.M.; Al-Shehri, A.M.; Bakhashwain, J.M. Wind power resource assess-ment for Rafha, Saudi Arabia. Renew. Sustain. Energy Rev. 2007, 11, 937–950. [Google Scholar] [CrossRef]
- Farrugia, R.N. The wind shear exponent in a Mediterranean island climate. Renew. Energy 2003, 28, 647–653. [Google Scholar] [CrossRef]
- Gonçalves, M.; Martinho, P.; Guedes Soares, C. A 33-year hindcast on wave energy assessment in the western French coast. Energy 2018, 165, 790–801. [Google Scholar] [CrossRef]
- Kamranzad, B.; Etemad-Shahidi, A.; Chegini, V. Developing an optimum hotspot identifier for wave energy extracting in the northern Persian Gulf. Renew. Energy 2017, 114, 59–71. [Google Scholar] [CrossRef]
- Akpinar, E.K.; Akpinar, S. An assessment on seasonal analysis of wind energy characteristics and wind turbine charac-teristics. Energy Convers. Manag. 2005, 46, 1848–1867. [Google Scholar] [CrossRef]
- Rehman, S.; Natarajan, N.; Mohandes, M.A.; Meyer, J.P.; Alam, M.; Alhems, L.M. Wind and wind power characteristics of the eastern and southern coastal and northern inland regions, South Africa. Environ. Sci. Pollut. Res. 2021, 29, 85842–85854. [Google Scholar] [CrossRef]
- Energy Consumption in Saudi Arabia WorldData. Available online: https://www.worlddata.info/asia/saudi-arabia/energy-consumption.php (accessed on 20 March 2023).
- Liang, Y.; Ma, Y.; Wang, H.; Mesbahi, A.; Jeong, B.; Zhou, P. Levelised cost of energy analysis for offshore wind farms—A case study of the New York State development. Ocean Eng. 2021, 239, 109923. [Google Scholar] [CrossRef]
- Martinez, A.; Iglesias, G. Multi-parameter analysis and mapping of the levelised cost of energy from floating offshore wind in the Mediterranean Sea. Energy Convers. Manag. 2021, 243, 114416. [Google Scholar] [CrossRef]


| Location | Depth | DCoast | Location | Depth | DCoast | ||||
|---|---|---|---|---|---|---|---|---|---|
| Name | Lat, °N | Lon, °E | (m) | (km) | Name | Lat, °N | Lon, °E | (m) | (km) |
| L1 | 16.50 | 41.00 | −878.04 | 156.81 | L26 | 17.40 | 41.40 | −22.70 | 63.23 |
| L2 | 16.50 | 41.25 | −1135.72 | 132.38 | L27 | 17.40 | 41.70 | −2.06 | 45.91 |
| L3 | 16.50 | 41.50 | −424.03 | 108.96 | L28 | 17.40 | 42.00 | −43.42 | 23.45 |
| L4 | 16.50 | 41.75 | −102.43 | 87.42 | L29 | 17.40 | 42.30 | −11.17 | 2.23 |
| L5 | 16.50 | 42.00 | −4.18 | 69.53 | L30 | 17.70 | 39.90 | −610.39 | 175.45 |
| L6 | 16.50 | 42.25 | −69.93 | 49.76 | L31 | 17.70 | 40.20 | −1171.65 | 149.16 |
| L7 | 16.50 | 42.50 | −34.93 | 23.79 | L32 | 17.70 | 40.50 | −476.09 | 120.67 |
| L8 | 16.50 | 42.75 | −4.87 | 0.13 | L33 | 17.70 | 40.80 | −74.37 | 93.99 |
| L9 | 16.80 | 40.80 | −1284.92 | 155.21 | L34 | 17.70 | 41.10 | −39.86 | 66.01 |
| L10 | 16.80 | 41.10 | −916.00 | 136.08 | L35 | 17.70 | 41.40 | −33.62 | 40.75 |
| L11 | 16.80 | 41.40 | −39.04 | 105.96 | L36 | 17.70 | 41.70 | −13.06 | 17.88 |
| L12 | 16.80 | 41.70 | −31.71 | 75.20 | L37 | 17.70 | 42.00 | −14.68 | 0.50 |
| L13 | 16.80 | 42.00 | −7.48 | 46.09 | L38 | 18.00 | 39.90 | −1277.47 | 158.54 |
| L14 | 16.80 | 42.30 | −32.94 | 25.20 | L39 | 18.00 | 40.20 | −1272.07 | 130.60 |
| L15 | 16.80 | 42.60 | −6.97 | 3.40 | L40 | 18.00 | 40.50 | −358.83 | 104.82 |
| L16 | 17.10 | 40.80 | −927.94 | 132.18 | L41 | 18.00 | 40.80 | −59.35 | 77.75 |
| L17 | 17.10 | 41.10 | −47.32 | 109.17 | L42 | 18.00 | 41.10 | −30.91 | 49.00 |
| L18 | 17.10 | 41.40 | −28.57 | 91.58 | L43 | 18.00 | 41.40 | −48.09 | 22.23 |
| L19 | 17.10 | 41.70 | −3.56 | 68.55 | L44 | 18.30 | 39.90 | −1582.36 | 145.15 |
| L20 | 17.10 | 42.00 | −62.04 | 37.60 | L45 | 18.30 | 40.20 | −715.73 | 115.50 |
| L21 | 17.10 | 42.30 | −27.38 | 6.69 | L46 | 18.30 | 40.50 | −279.74 | 86.96 |
| L22 | 17.40 | 40.20 | −1064.20 | 165.25 | L47 | 18.30 | 40.80 | −74.11 | 59.30 |
| L23 | 17.40 | 40.50 | −1100.56 | 137.80 | L48 | 18.30 | 41.10 | −9.42 | 37.21 |
| L24 | 17.40 | 40.80 | −529.01 | 111.02 | L49 | 18.30 | 41.40 | −9.10 | 7.71 |
| L25 | 17.40 | 41.10 | −18.48 | 86.66 | |||||
| Sites | WS (m/s) | WD (°) | c (m/s) | k | WPD (W/m2) | F (%) > 200 W/m2 | Temp (°C) | Wind Duration (%) | MWVI | MWSI | Vmax,E | |
|---|---|---|---|---|---|---|---|---|---|---|---|---|
| L44 | 6.39 | 14.2 | 7.20 | 1.97 | 280.59 | 40.29 | 27.93 | 77 | 1.84 | 6.14 | 5.023 | 10.288 |
| L38 | 5.91 | 357.5 | 6.64 | 1.74 | 253.04 | 34.47 | 28.00 | 70 | 1.87 | 4.67 | 4.068 | 10.287 |
| L30 | 5.81 | 11.9 | 6.36 | 1.77 | 236.49 | 33.39 | 28.01 | 70 | 2.93 | 0.72 | 3.987 | 9.738 |
| L45 | 5.72 | 325.2 | 6.41 | 1.65 | 246.74 | 31.97 | 27.99 | 67 | 2.35 | 3.36 | 3.642 | 10.363 |
| L39 | 5.68 | 339.9 | 6.37 | 1.67 | 237.89 | 31.81 | 28.02 | 67 | 2.03 | 3.73 | 3.692 | 10.194 |
| L31 | 5.67 | 356.4 | 6.36 | 1.70 | 231.39 | 31.88 | 28.03 | 68 | 1.67 | 4.43 | 3.780 | 10.042 |
| L1 | 5.66 | 56.5 | 6.35 | 1.70 | 233.52 | 31.25 | 28.04 | 68 | 1.26 | 5.78 | 3.771 | 10.016 |
| L22 | 5.64 | 15.5 | 6.34 | 1.73 | 223.73 | 31.66 | 28.07 | 68 | 2.46 | 1.01 | 3.856 | 9.865 |
| L9 | 5.57 | 45.9 | 6.25 | 1.72 | 220.19 | 30.46 | 28.04 | 67 | 1.11 | 6.04 | 3.766 | 9.796 |
| L23 | 5.55 | 357.1 | 6.22 | 1.69 | 219.05 | 30.48 | 28.04 | 66 | 2.65 | 0.59 | 3.675 | 9.860 |
| L2 | 5.55 | 314.8 | 6.23 | 1.72 | 217.65 | 30.09 | 28.04 | 67 | 1.26 | 5.21 | 3.753 | 9.750 |
| L32 | 5.53 | 341 | 6.20 | 1.68 | 220.63 | 30.07 | 28.06 | 66 | 1.80 | 3.68 | 3.604 | 9.913 |
| L16 | 5.53 | 28.1 | 6.21 | 1.72 | 215.13 | 30.26 | 28.10 | 67 | 1.26 | 5.78 | 3.738 | 9.736 |
| L40 | 5.52 | 327.4 | 6.18 | 1.65 | 223.05 | 29.71 | 28.05 | 65 | 2.14 | 3.10 | 3.517 | 9.993 |
| L10 | 5.52 | 19.6 | 6.19 | 1.71 | 214.82 | 30.00 | 28.06 | 67 | 1.14 | 5.64 | 3.706 | 9.734 |
| L46 | 5.48 | 315.1 | 6.13 | 1.63 | 223.17 | 29.10 | 28.07 | 63 | 2.42 | 2.69 | 3.426 | 10.018 |
| L34 | 5.43 | 344.2 | 6.10 | 1.72 | 203.98 | 29.20 | 28.02 | 66 | 1.00 | 5.96 | 3.668 | 9.565 |
| L17 | 5.43 | 344.2 | 6.10 | 1.72 | 203.98 | 29.20 | 28.02 | 66 | 1.26 | 5.21 | 3.668 | 9.565 |
| L24 | 5.41 | 334.1 | 6.06 | 1.69 | 204.19 | 28.77 | 28.09 | 65 | 1.28 | 5.54 | 3.572 | 9.621 |
| L3 | 5.39 | 267.9 | 6.06 | 1.75 | 195.14 | 28.38 | 28.08 | 67 | 1.22 | 4.53 | 3.744 | 9.348 |
| L33 | 5.34 | 323.9 | 5.99 | 1.68 | 199.54 | 27.84 | 28.12 | 64 | 1.85 | 3.00 | 3.497 | 9.554 |
| L41 | 5.30 | 316 | 5.95 | 1.67 | 197.45 | 27.14 | 28.13 | 64 | 2.15 | 2.49 | 3.445 | 9.525 |
| L25 | 5.25 | 314.5 | 5.90 | 1.72 | 184.35 | 26.90 | 28.11 | 65 | 1.43 | 4.67 | 3.553 | 9.243 |
| L11 | 5.24 | 270.2 | 5.89 | 1.77 | 176.79 | 26.78 | 28.08 | 65 | 1.08 | 4.38 | 3.672 | 9.039 |
| L47 | 5.21 | 308.7 | 5.84 | 1.66 | 189.21 | 25.76 | 28.11 | 63 | 2.35 | 2.08 | 3.351 | 9.392 |
| L4 | 5.16 | 255.4 | 5.81 | 1.79 | 167.42 | 25.78 | 28.10 | 65 | 1.16 | 3.73 | 3.670 | 8.840 |
| L26 | 5.08 | 285 | 5.71 | 1.77 | 162.25 | 23.70 | 28.09 | 65 | 1.51 | 3.89 | 3.568 | 8.754 |
| L42 | 5.05 | 308 | 5.68 | 1.71 | 166.47 | 23.99 | 28.10 | 63 | 2.06 | 1.94 | 3.405 | 8.912 |
| L12 | 5.04 | 259.5 | 5.67 | 1.79 | 155.39 | 24.37 | 28.11 | 64 | 1.43 | 2.66 | 3.586 | 8.630 |
| L35 | 5.00 | 287.6 | 5.62 | 1.75 | 158.56 | 22.36 | 28.16 | 64 | 2.49 | 1.43 | 3.459 | 8.698 |
| L27 | 4.98 | 274 | 5.60 | 1.74 | 159.05 | 21.47 | 28.06 | 64 | 1.62 | 3.06 | 3.428 | 8.698 |
| L19 | 4.96 | 264.9 | 5.58 | 1.77 | 149.87 | 23.02 | 28.17 | 63 | 1.00 | 5.96 | 3.491 | 8.537 |
| L18 | 4.96 | 264.9 | 5.58 | 1.77 | 149.87 | 23.02 | 28.17 | 63 | 0.98 | 6.67 | 3.491 | 8.537 |
| L48 | 4.93 | 301.4 | 5.54 | 1.71 | 155.80 | 22.33 | 28.10 | 61 | 2.18 | 1.59 | 3.310 | 8.706 |
| L5 | 4.88 | 248.5 | 5.49 | 1.81 | 139.67 | 22.16 | 28.11 | 63 | 1.30 | 2.38 | 3.516 | 8.289 |
| L43 | 4.74 | 286.6 | 5.33 | 1.74 | 136.04 | 18.89 | 28.71 | 61 | 2.52 | 1.02 | 3.253 | 8.293 |
| L13 | 4.74 | 253.6 | 5.34 | 1.78 | 131.64 | 20.36 | 28.19 | 61 | 1.84 | 1.45 | 3.350 | 8.156 |
| L20 | 4.68 | 258.2 | 5.27 | 1.74 | 131.82 | 18.85 | 28.17 | 60 | 1.96 | 1.76 | 3.232 | 8.162 |
| L49 | 4.62 | 281.1 | 5.19 | 1.73 | 124.98 | 16.93 | 28.65 | 60 | 2.39 | 0.89 | 3.161 | 8.078 |
| L36 | 4.61 | 272.5 | 5.16 | 1.67 | 132.95 | 16.99 | 28.87 | 59 | 2.90 | 0.78 | 2.981 | 8.286 |
| L28 | 4.55 | 258.3 | 5.10 | 1.65 | 130.69 | 16.10 | 28.76 | 58 | 2.29 | 1.68 | 2.895 | 8.249 |
| L6 | 4.48 | 247.6 | 5.05 | 1.82 | 108.55 | 16.74 | 28.13 | 59 | 1.57 | 1.16 | 3.255 | 7.588 |
| L14 | 4.40 | 253.4 | 4.95 | 1.77 | 107.75 | 15.27 | 28.20 | 57 | 2.24 | 0.74 | 3.100 | 7.588 |
| L21 | 4.37 | 255.6 | 4.92 | 1.72 | 110.95 | 14.20 | 28.06 | 57 | 1.96 | 1.76 | 2.960 | 7.700 |
| L37 | 4.17 | 252.4 | 4.66 | 1.59 | 106.69 | 12.08 | 29.90 | 53 | 3.18 | 0.41 | 2.492 | 7.784 |
| L7 | 4.16 | 253.9 | 4.69 | 1.85 | 85.95 | 11.78 | 28.12 | 55 | 1.72 | 0.59 | 3.081 | 6.971 |
| L15 | 4.02 | 255.5 | 4.53 | 1.79 | 81.09 | 9.93 | 28.27 | 53 | 2.14 | 0.38 | 2.865 | 6.886 |
| L29 | 4.01 | 241.7 | 4.49 | 1.60 | 93.84 | 10.69 | 29.97 | 51 | 2.68 | 1.27 | 2.435 | 7.437 |
| L8 | 3.83 | 260.2 | 4.31 | 1.83 | 66.60 | 8.50 | 28.25 | 49 | 1.41 | 0.40 | 2.796 | 6.466 |
| Site | Y = mx + c | R2 | Site | Y = mx + c | R2 | Site | Y = mx + c | R2 |
|---|---|---|---|---|---|---|---|---|
| L1 | 0.0027x + 5.5985 | 0.0230 | L18 | 0.0015x + 4.9236 | 0.0104 | L35 | 0.0003x + 4.9887 | 0.0007 |
| L2 | 0.0022x + 5.4988 | 0.0165 | L19 | 0.0015x + 4.9236 | 0.0104 | L36 | 0.0007x + 4.5867 | 0.0031 |
| L3 | 0.0019x + 5.3490 | 0.0144 | L20 | 0.0015x + 4.6487 | 0.0112 | L37 | 0.0013x + 4.1352 | 0.0164 |
| L4 | 0.0020x + 5.1176 | 0.0171 | L21 | 0.0013x + 4.3425 | 0.0128 | L38 | 0.0028x + 5.8456 | 0.0206 |
| L5 | 0.0022x + 4.8279 | 0.0221 | L22 | 0.0024x + 5.5904 | 0.0169 | L39 | 0.0029x + 5.6193 | 0.0235 |
| L6 | 0.0020x + 4.4351 | 0.0247 | L23 | 0.0021x + 5.5013 | 0.0148 | L40 | 0.0023x + 5.4648 | 0.0171 |
| L7 | 0.0021x + 4.1164 | 0.0430 | L24 | 0.0015x + 5.3735 | 0.0090 | L41 | 0.0017x + 5.2620 | 0.0118 |
| L8 | 0.0026x + 3.7716 | 0.1717 | L25 | 0.0010x + 5.2312 | 0.0046 | L42 | 0.0012x + 5.0210 | 0.0076 |
| L9 | 0.0027x + 5.5112 | 0.0245 | L26 | 0.0003x + 5.0667 | 0.0005 | L43 | 0.0012x + 4.7129 | 0.0105 |
| L10 | 0.0023x + 5.4669 | 0.0184 | L27 | 0.0003x + 4.9743 | 0.0005 | L44 | 0.0030x + 6.3195 | 0.0221 |
| L11 | 0.0018x + 5.1989 | 0.0136 | L28 | 0.0010x + 4.5220 | 0.0079 | L45 | 0.0031x + 5.6483 | 0.0277 |
| L12 | 0.0019x + 4.9988 | 0.0161 | L29 | 0.0019x + 3.9651 | 0.0483 | L46 | 0.0023x + 5.4244 | 0.0175 |
| L13 | 0.0019x + 4.7004 | 0.0173 | L30 | 0.0026x + 5.7510 | 0.0182 | L47 | 0.0019x + 5.1592 | 0.0143 |
| L14 | 0.0017x + 4.3630 | 0.0184 | L31 | 0.0026x + 5.6148 | 0.0193 | L48 | 0.0015x + 4.8876 | 0.0131 |
| L15 | 0.0018x + 3.9810 | 0.0387 | L32 | 0.0022x + 5.4833 | 0.0161 | L49 | 0.0020x + 4.5705 | 0.0366 |
| L16 | 0.0022x + 5.4865 | 0.0164 | L33 | 0.0016x + 5.3062 | 0.0100 | |||
| L17 | 0.0017x + 5.3967 | 0.0117 | L34 | 0.0017x + 5.3967 | 0.0117 |
Disclaimer/Publisher’s Note: The statements, opinions and data contained in all publications are solely those of the individual author(s) and contributor(s) and not of MDPI and/or the editor(s). MDPI and/or the editor(s) disclaim responsibility for any injury to people or property resulting from any ideas, methods, instructions or products referred to in the content. |
© 2024 by the authors. Licensee MDPI, Basel, Switzerland. This article is an open access article distributed under the terms and conditions of the Creative Commons Attribution (CC BY) license (https://creativecommons.org/licenses/by/4.0/).
Share and Cite
Rehman, S.; Irshad, K.; Mohandes, M.A.; AL-Shaikhi, A.A.; Syed, A.H.; Zayed, M.E.; Alam, M.A.; Fertahi, S.e.-D.; Raza, M.K. Windy Sites Prioritization in the Saudi Waters of the Southern Red Sea. Sustainability 2024, 16, 10169. https://doi.org/10.3390/su162310169
Rehman S, Irshad K, Mohandes MA, AL-Shaikhi AA, Syed AH, Zayed ME, Alam MA, Fertahi Se-D, Raza MK. Windy Sites Prioritization in the Saudi Waters of the Southern Red Sea. Sustainability. 2024; 16(23):10169. https://doi.org/10.3390/su162310169
Chicago/Turabian StyleRehman, Shafiqur, Kashif Irshad, Mohamed A. Mohandes, Ali A. AL-Shaikhi, Azher Hussain Syed, Mohamed E. Zayed, Mohammad Azad Alam, Saïf ed-Dîn Fertahi, and Muhammad Kamran Raza. 2024. "Windy Sites Prioritization in the Saudi Waters of the Southern Red Sea" Sustainability 16, no. 23: 10169. https://doi.org/10.3390/su162310169
APA StyleRehman, S., Irshad, K., Mohandes, M. A., AL-Shaikhi, A. A., Syed, A. H., Zayed, M. E., Alam, M. A., Fertahi, S. e.-D., & Raza, M. K. (2024). Windy Sites Prioritization in the Saudi Waters of the Southern Red Sea. Sustainability, 16(23), 10169. https://doi.org/10.3390/su162310169