Article

Dynamic Response Study of Coral Reef Revetment Project Under Extreme Wave Action

Tianjin Research Institute for Water Transport Engineering, Ministry of Transport, Tianjin 300456, China
*
Author to whom correspondence should be addressed.
Sustainability 2024, 16(22), 9939; https://doi.org/10.3390/su16229939
Submission received: 17 October 2024 / Revised: 7 November 2024 / Accepted: 13 November 2024 / Published: 14 November 2024
(This article belongs to the Special Issue Critical Issues in Ocean and Coastal Engineering)

Abstract

:
It is crucial for reef revetments to respond dynamically to rigorous wave actions for structural stability and safety. A comprehensive analysis of the interaction between the wave force and wave overtopping in a reef revetment project was conducted based on wave flume experiments. This study explored how wave conditions, the water depth along the reef flat, and the proximity of the reef edge to the revetment project influenced wave overtopping and wave force patterns. The results indicate that as the incident wave height, period, and water depth along the reef flat increased, the average wave overtopping within the revetment project also increased. Additionally, higher levels of average wave overtopping occurred with the decrease in the distance between the revetment project and the reef edge. The peak wave force on the seawall of the revetment project was studied in response to various factors, including wave period, wave height, water depth along the reef flat, and distance to the reef edge. The changes in the maximum wave force reflected those of the average wave overtopping, with a strong linear correlation. The quantitative relationship between these variables was determined, and the wave forces on the seawall could be indirectly estimated using the average wave overtopping volume. This study provides an efficient methodology for assessing the dynamic attributes of revetment projects and the disaster risk of these structures.

1. Introduction

Revetment projects are pivotal infrastructural components of coral reefs and play a crucial role in preventing the erosion of coral reefs, enhancing their stability, and fostering biodiversity. Given the intricate marine setting in which coral reefs reside, they are frequently exposed to intense wave phenomena, including typhoon-induced waves and storm surges. To maximize the utilizable space within the reef ecosystem, revetment projects are typically constructed in close proximity to the reef’s edge, thereby narrowing the reef flat and reducing the propagation distance for waves and currents. This spatial rearrangement heightens wave–current dynamics within the vicinity of the revetment, triggering pronounced wave overtopping and intensified impacts upon the seawall of the revetment structure. Consequently, the structural integrity and safety of coral reef revetment projects are directly jeopardized by these intensified hydrodynamic forces. However, it is challenging to directly measure the wave forces on revetment projects. Based on physical model testing, a quantitative relationship between the two parameters of overtopping and wave force is established, providing a simplified and rapid method to estimate the seawall wave forces in coral reef revetment projects. This improves the efficiency of stability assessments for revetment projects.
Over the years, numerous scholars have delved into the intricacies of wave forces acting on seawalls. The American standard adopts the calculation method proposed by Pendersen [1] for irregular wave-induced seawall forces, though it is limited by the fact that it is applicable to deep-water waves only. To broaden the scope, Nørgaard et al. [2] modified Pendersen’s formula, resulting in a versatile equation capable of estimating seawall wave forces in both deep- and shallow-water environments. In the Japanese breakwater design code, the method advocated by Yoshimi Goda [3] is employed; this method acknowledges distinct distribution patterns of wave forces above and below the water surface. Cecioni [4] conducted a total of 184 random wave experiments on three models of different rubble mound breakwaters reproduced at the new small–medium-scale wave flume of the Department of Engineering at Roma Tre University. The collected data were utilized to improve the prediction of wave forces on the seawall, and a new empirical formula was proposed. Han [5] conducted 744 tests to investigate the wave force on the seawall under swell conditions. The test data were compared with those of the Pedersen, Martin, Nørgaard, and Chinese Design Code methods, and a linear modification approach was proposed to improve the original Pedersen, Martin, and Nørgaard methods. Molines [6] conducted numerical experiments that utilized the open-source platform OpenFOAM to assess the impact of nine different seawall geometries on the wave force, and the OpenFOAM model was validated through comparisons with laboratory experiments. Han [7] developed a three-dimensional numerical wave flume to investigate the interactions between monochromatic waves in rubble mound breakwater and a seawall and proposed a new empirical formula to predict the wave forces acting on the seawall under intermediate and deep-water conditions. Coral reefs typically have steep forward slopes and are often subjected to intense long-period waves, such as typhoon waves and storm surges, limiting the applicability of existing norms and calculation formulas. Chen [8] conducted large-scale wave flume experiments to study the characteristics of horizontal and lifting forces on the seawall of coral reef slope breakwaters under various water depths and wave conditions. Based on the test results, they modified the existing standard wave force calculation formula to better suit the wave force calculation for seawalls in reef slope topographies.
There is abundant research on the wave overtopping laws of breakwaters. VanderMeer’s [9] formula for maximum and average wave overtopping for sloping breakwaters is generally adopted in Europe. In the Coastal Engineering Manual of the United States, Ward [10] proposed a formula for calculating wave overtopping through experimental research. The Japanese scholar Yoshimi Goda [3] studied the law of irregular wave overtopping on breakwaters and proposed a formula for calculating the amount of irregular wave overtopping; this formula is widely used by Japanese designers. In China’s Port and Waterway Hydrological Code [11], a formula for calculating the amount of wave overtopping (Q) per unit time per unit width of slope breakwater was also proposed. Xia [12] combined current domestic and international specifications, standards, and engineering test cases to discuss the criteria and values of wave overtopping and proposed recommended values for the allowable wave overtopping volume for breakwaters and revetment projects. Through small-scale physical model experiments, Pillai [13] investigated the average wave overtopping rate of breakwaters and established a database containing a broader range of data on wave steepness, berm width, berm height, and crest height. Based on comprehensive experimental conditions, including both existing and newly collected experiments, a new formula was developed. It has been verified that this new formula outperforms other prediction models in representing the influence of relative water depth on the wave overtopping rate. Molines [14] developed a fully automated method for detecting the overtopping waves and volumes of individual waves using two-dimensional physical testing. This demonstrated that the maximum overtopping volume of a single wave can potentially be much larger than average wave overtaking q (m3/s/m), making it a better indicator for assessing direct hazards. Yoo [15] proposed a new method for estimating individual wave overtopping volumes and utilized the temporal variation in wave overtopping heights to develop an observation system that can quantitatively assess wave overtopping volumes in actual coastal areas. Some scholars have also studied the wave overtopping volume of revetment projects on coral reefs. Chen Songgui et al. [16] used large-scale wave flume experiments to analyze the influence of different factors on wave overtopping and proposed a calculation formula for the wave overtopping of vertical breakwaters on coral reefs. Miyaguni et al. [17] studied the wave overtopping rate of waves of coral reef breakwaters and compared the wave overtopping laws between the seawall on a uniform slope and the breakwater on a coral reef flat. They found that wave overtopping on coral reefs was mainly affected by the wave set-up on the reef flat and proposed a method for calculating the wave overtopping volume of reef flat breakwaters using the Goda diagram method.
Currently, there is a relatively extensive body of research focusing on the wave overtopping or wave force of revetment projects. However, research that combines and comprehensively analyzes both aspects remains limited. Pedersen [1] conducted research on wave forces and wave overtopping for seawalls in laboratory tests at the Coastal Laboratory of Aalborg University. Based on the analysis of the test data, a design method was proposed for calculating the maximum wave force on the seawall, and a new formula for overtopping discharge was introduced. However, no further analysis was conducted of the relationship between the two. Molines [18] utilized neural network technology to develop a calculator for predicting wave forces based on wave overtopping volumes. The wave force predictor was calibrated using the results from 274 two-dimensional flume experiments, validating the feasibility of predicting wave forces through wave overtopping volumes. Based on two-dimensional flume model experiments, Formentin [19] tested the relationship between wave overtopping volumes and wave forces on smooth vertical walls under the action of breaking and non-breaking waves. He emphasized the strict correlation between these two variables and proposed a formula for calculating wave forces using wave overtopping volumes. Formentin’s research primarily focused on the relationship between wave overtopping volumes and wave forces on the seawall of vertical walls. However, core reef revetment projects feature steep slopes in front of the reefs, and the revetment structures are of the slope type, which differ significantly from traditional vertical breakwater structures. Currently, there is a lack of quantitative research on the relationship between wave overtopping volumes and seawall wave forces in core reef revetment projects.
In summary, the body of research investigating the overtopping volume and seawall wave forces associated with coral reef revetment projects remains sparse, and a comprehensive analysis encompassing both aspects is notably absent. This gap is further exacerbated by the practical challenges encountered in directly measuring wave forces on coral reef revetments. To address these limitations, the present study leverages flume testing to delve into the intricate effects of wave period, wave height, reef flat water depth, and the proximity of the revetment project to the reef edge on both the overtopping volume and seawall wave forces. Furthermore, we establish a quantitative relationship between these two parameters, thereby offering a streamlined and expedited methodology for estimating the seawall wave forces in coral reef revetment projects, enhancing the efficiency and accuracy of such calculations.

2. Materials and Methods

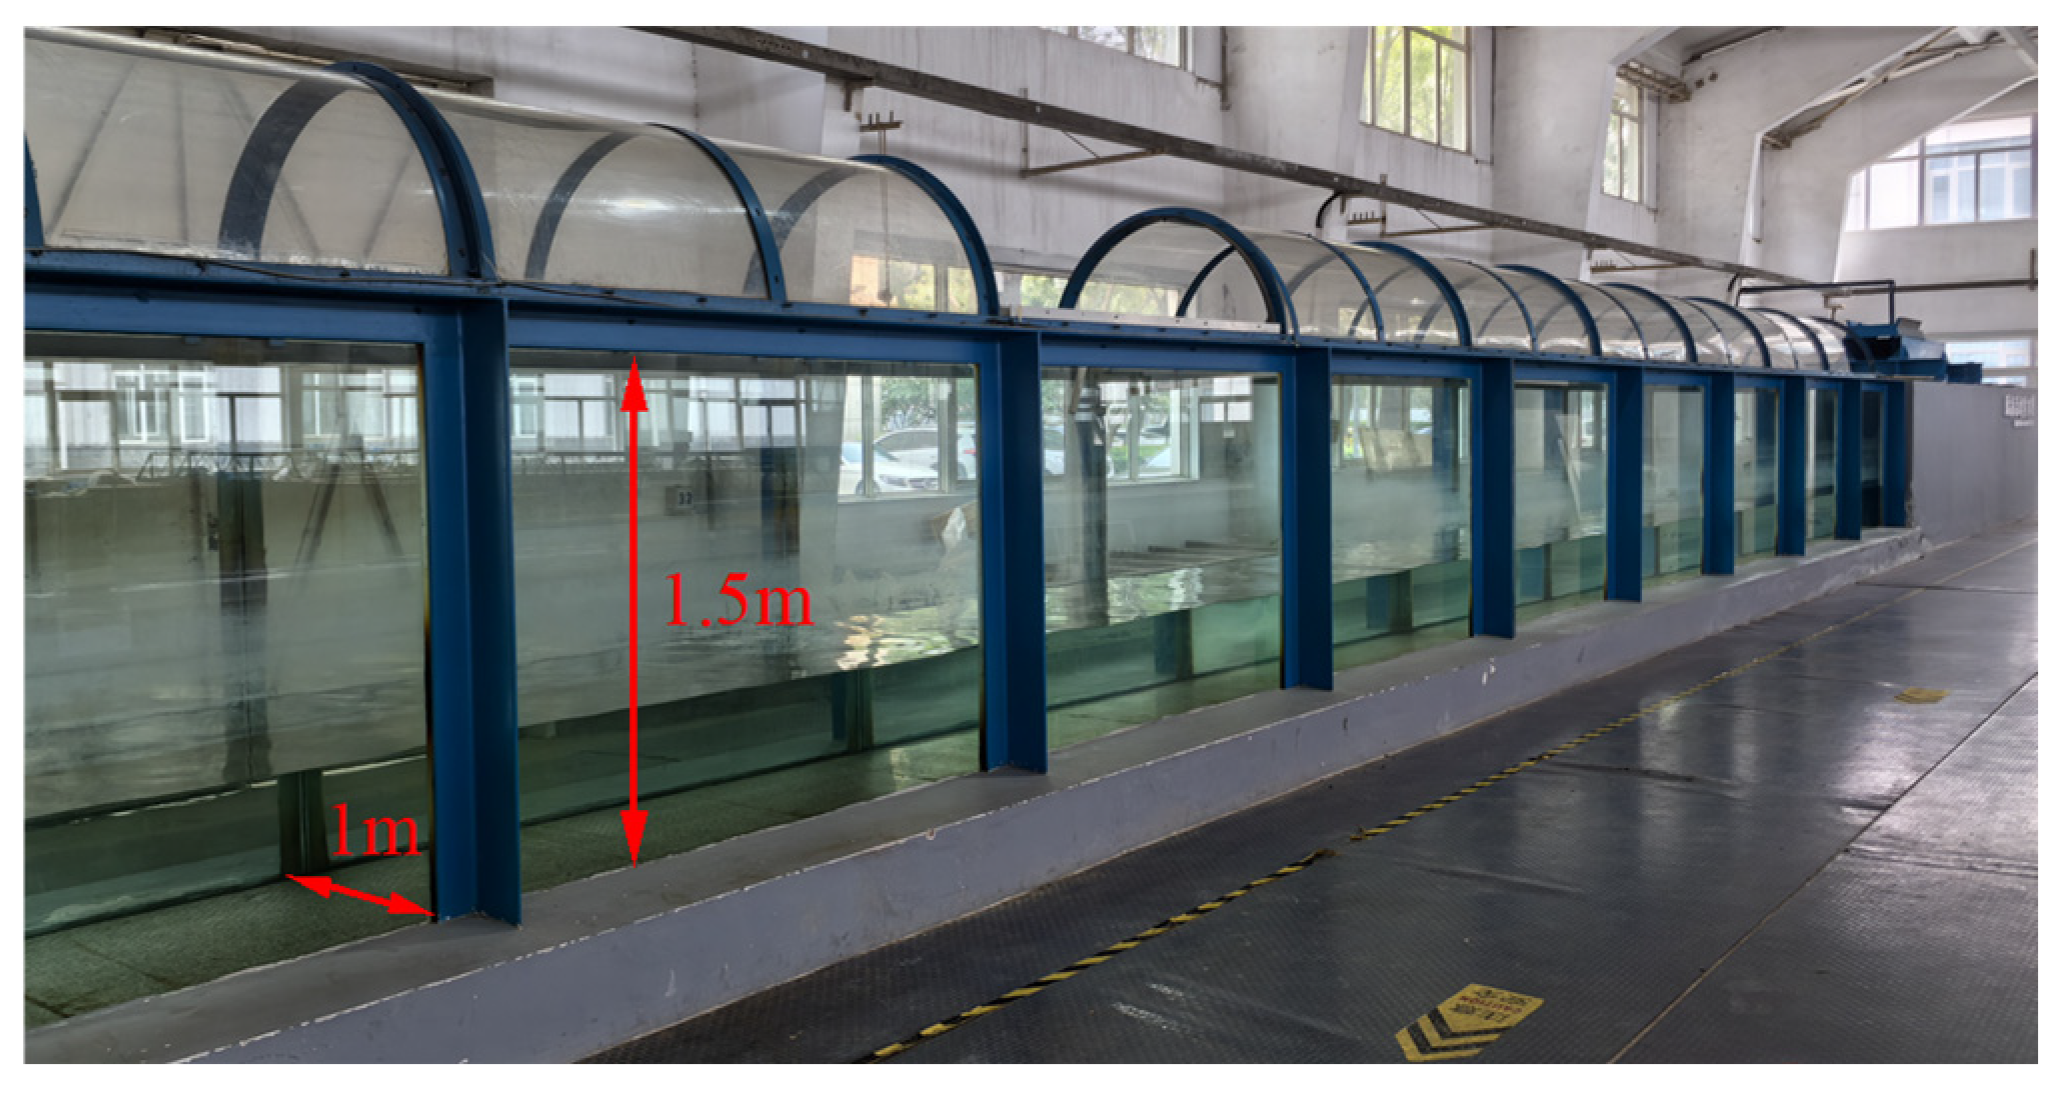
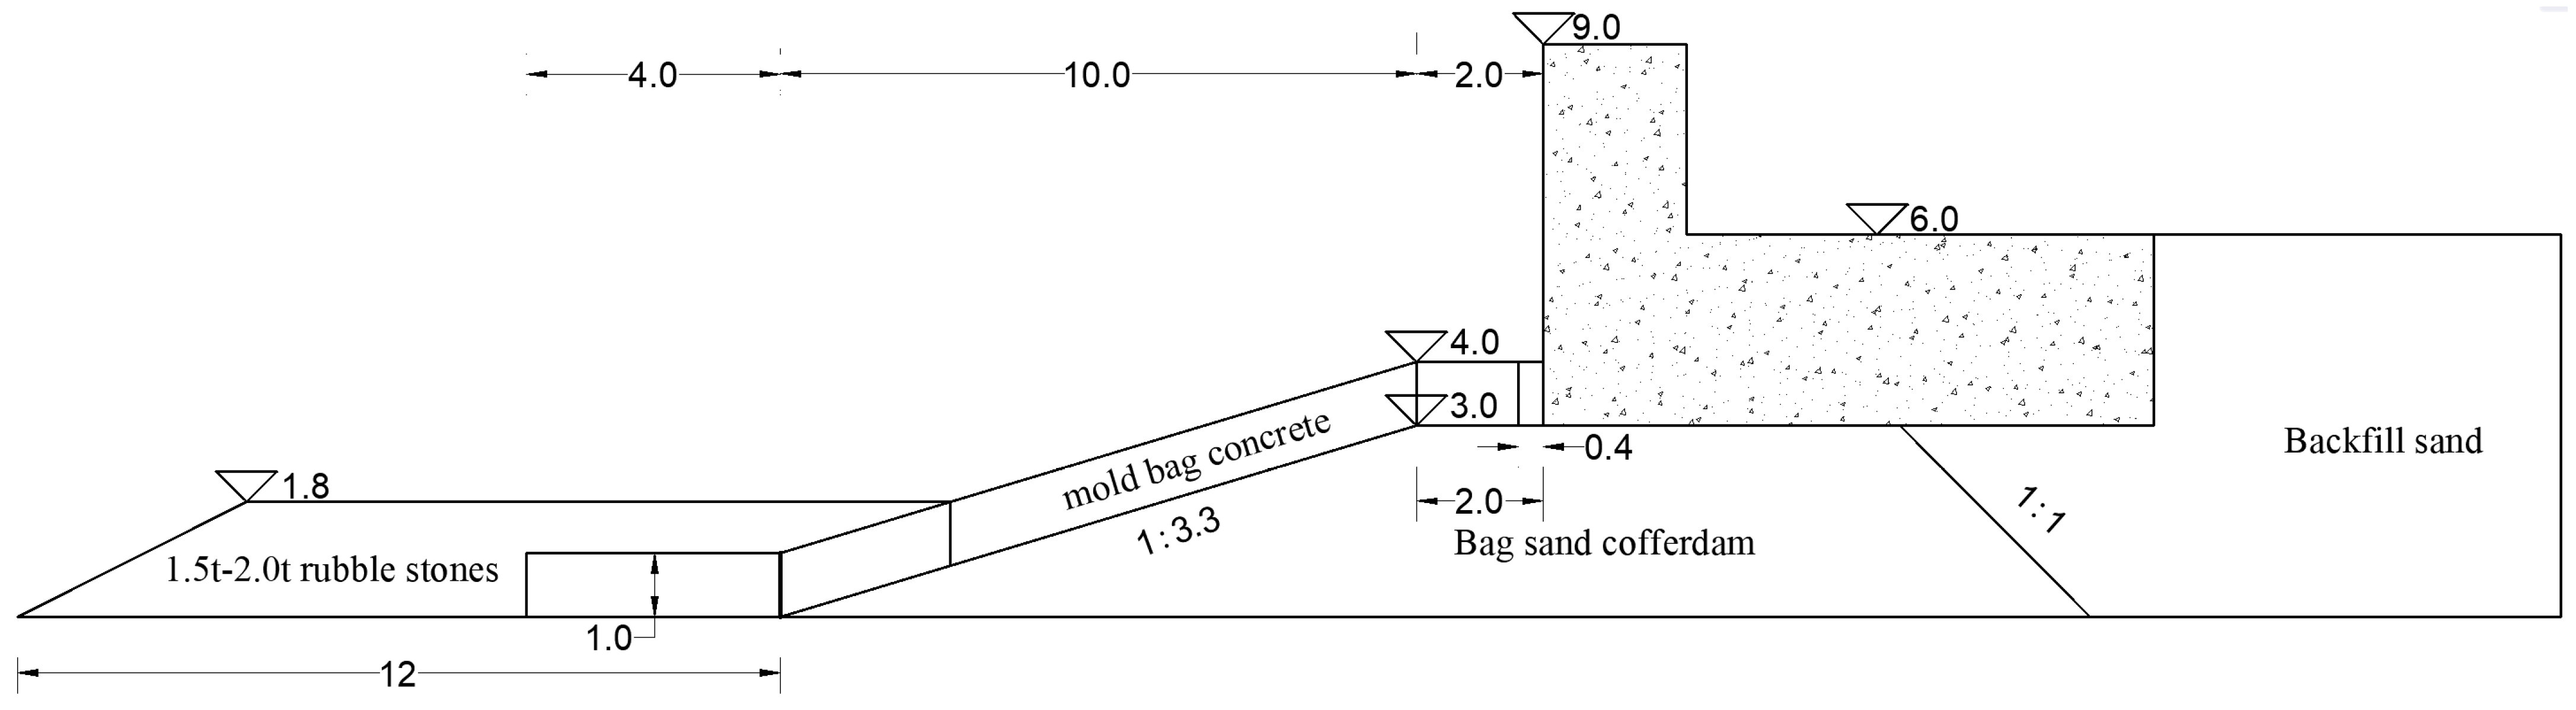
2.1. Experimental Design

The experiments were conducted in the wave flume of the Tianjin Institute of Water Transport Engineering Science, Ministry of Transport. The flume, as depicted in Figure 1, is 68 m in length, 1.0 m in width, and 1.5 m in height. A push-plate wave generator capable of generating both regular and irregular waves (JONSWAP spectrum) is located at one end of the flume. The wave generator is capable of producing waves with Hs (the effective wave height) values ranging from 0m to 0.5 m and Tp (the spectral peak period) values ranging from 0.5 s to 5.0 s. Additionally, it features an active absorption function that maximizes the elimination of the influence of secondary reflection on the test results.
The experiment utilizes a normal-scale model. The wave maker has the capacity to produce a wave with a maximum height of 30 cm; the maximum simulated wave height in the experiment is 12 m (prototype wave height). Therefore, a model scale of 1:40 was selected. The cross-section design of the revetment project employs an asymmetric arrangement. The embankment is constructed using sand-filled bags, with a top elevation of +3.00 m. The slope ratio on the wave-facing side is 1:3.33, while the slope ratio on the back side of the wave is 1:1 and features an attached geotextile filter layer. The seawall is made of cast-in-place concrete, with a top elevation of +9.0 m. On the wave-facing side, a mold bag concrete protection structure is utilized, with a thickness of 1.0 m. The connection between the mold bag concrete and the seawall is made of 0.4 m wide post-cast concrete. At the toe of the slope, rubble stones ranging from 1.5 t to 2.0 t are used for base protection, with a top elevation of +1.80 m. The backfilling sand behind the revetment is filled to an elevation of +6.00 m. A section of the revetment engineering is illustrated in Figure 2.
The revetment model is situated on the flume test platform, which simulates generalized island and reef terrain. The test platform stands at a height of 0.75 m behind a 1:2 slope, and the revetment project is strategically positioned on the platform area. The elevation of the embankment top is set at 0.225 m (with the reef platform elevation being 0 m), and the width of the embankment top measures 0.056 m. The two wave gauges are spaced 1 m apart and positioned 10 m away from the test platform. The model’s elevation is precisely controlled using a level meter, while its length is measured with a steel ruler, allowing for a margin of error of ±1.0 mm. The water depth of the reef flat is denoted as h, and the distance from the breast wall of the revetment project to the reef edge is represented by S. The layout of the experimental model is depicted in Figure 3, where the provided values correspond to the model’s specifications. In Figure 3, S is the distance between the revetment project and reef edge, Rc is the height from the top of the seawall of the revetment project to the water surface of the reef flat, h is the reef flat water depth, and Z0 is the height of the reef flat.
Wave pressure data for the vertical seawall of the revetment project were collected using point pressure sensors with a measurement range of ±20 KPa, a measurement accuracy of ±0.1 KPa, and a sampling frequency of 100 Hz. All the sensors were calibrated by instrument inspection personnel before use.
Five pressure sensors were positioned on the wave-facing surface of the seawall, while six sensors were arranged at its bottom. The sensor positions are depicted in Figure 4, where the numerical values provided are the model values.
Wave overtopping was collected and measured using a self-made water collection box and tank. The collection tank had a width of 0.15 m, while the dimensions of the water collection box were 1 m × 0.5 m × 0.3 m. The front edge of the collection tank overlapped with the front edge of the seawall of the revetment project, and its back edge was placed inside the water collection box. The volume of water was measured over a specific period to determine the wave overtopping amount of the model. For irregular waves, the total overtopping water of a complete wave train was considered as the total overtopping amount for the corresponding duration, and subsequently, the average overtopping amount per unit width was calculated. Based on the similarity criteria, the model overtopping amount was then converted into the original overtopping amount. The average overtopping amount per unit width was determined using the following formula:
Q = V/bt
where Q is the average overtopping amount per unit width (m3/m·s); V is the total amount of water overflowed by a wave train (m3); b is the width of the collected wave overtopping (m); and t is the duration of a wave train action (s).

2.2. Experimental Procedure

To investigate the impact of various factors, such as the incident wave characteristics, the reef flat water depth, and the distance of the revetment project from the reef edge, on the wave force and the overtopping amount of the coral reef revetment projects, experiments were conducted using irregular waves with four distinct wave periods and six different wave heights. The incident wave was calibrated utilizing the JONSWAP spectrum, incorporating a spectral peak factor of γ = 3.3. Furthermore, based on the actual reef revetment structures and the hydrological wave conditions in the South China Sea, the parameters of the revetment structures and the wave parameters were selected to encompass the extreme wave conditions that may occur in the South China Sea. Three varying reef flat water depths and four different distances between the revetment project and the reef edge were established, as presented in Table 1.

3. Results

3.1. Analysis of Average Overtopping Volume

The amount of overtopping serves as an indicator of the protective effect of the revetment project on the rear area, which is a key focus in the construction and design of such projects. This experiment primarily aims to analyze the influence of various factors, including the incident wave period, wave height, freeboard height, and location of the revetment project, on the amount of overtopping. Additionally, it examines the interrelationship between wave steepness, relative freeboard height, and the dimensionless average overtopping amount.

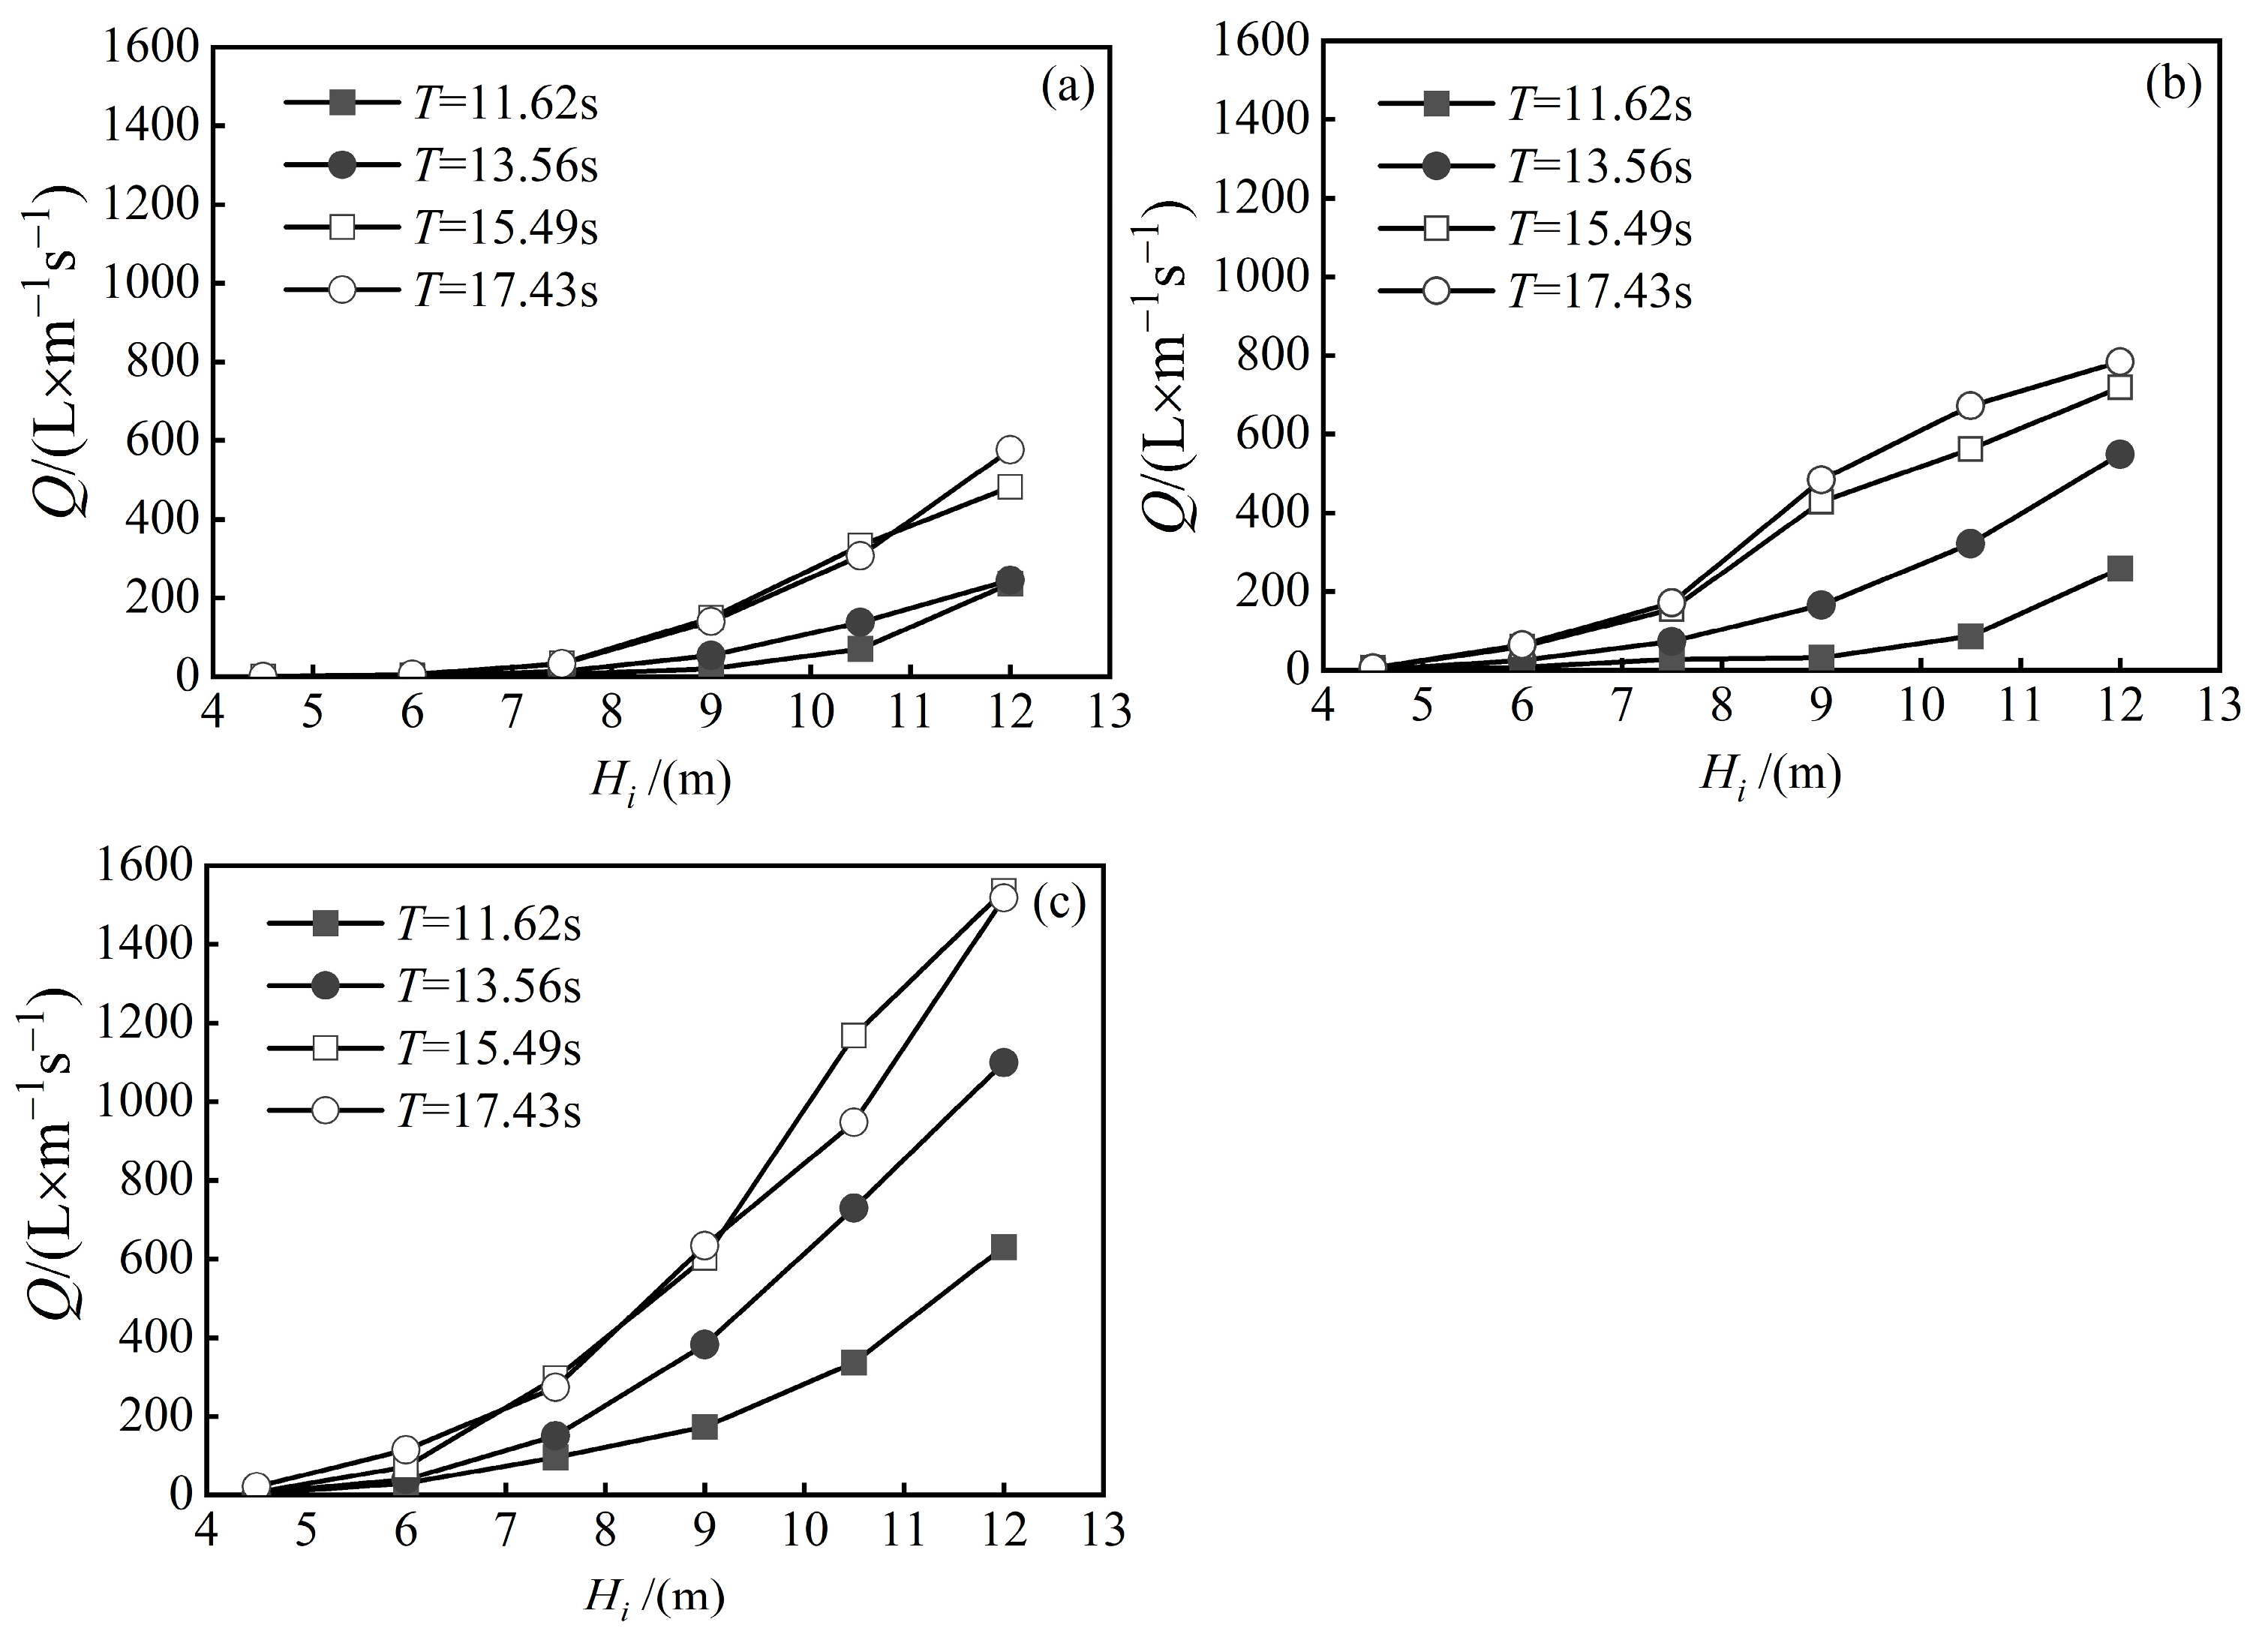
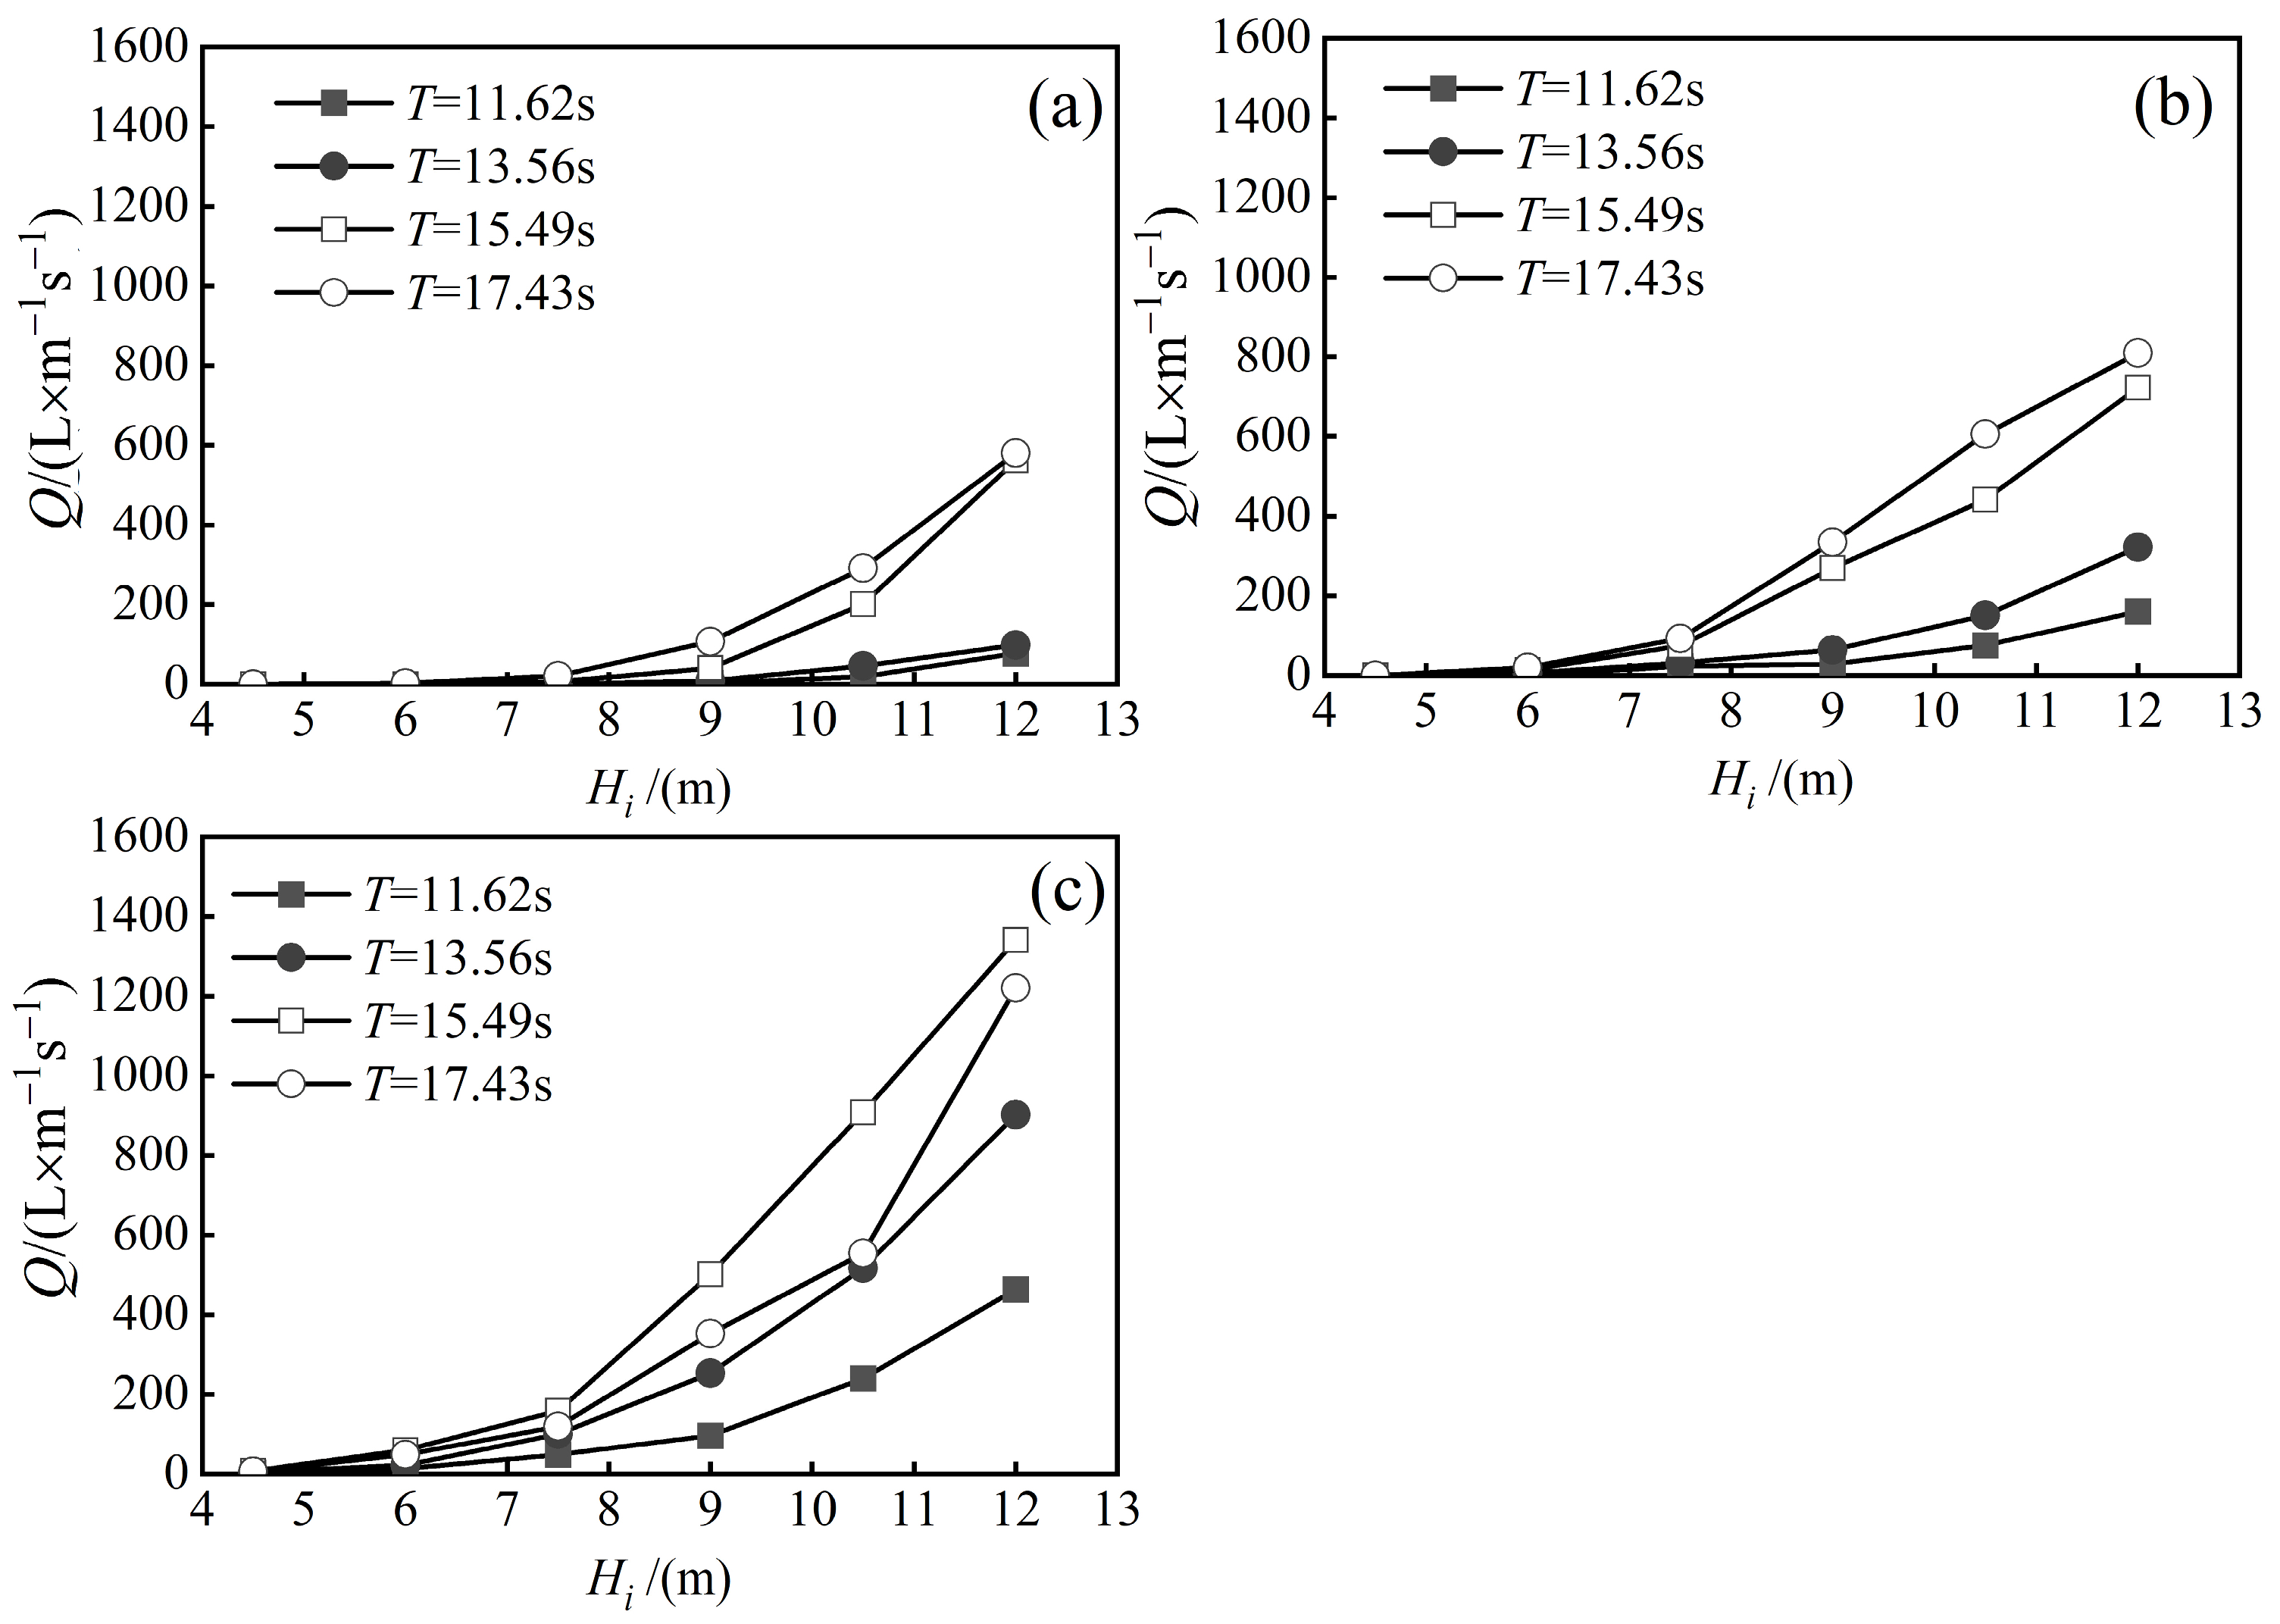
3.1.1. The Influence of Incident Wave Height and Period on Overtopping

The following positions of the revetment seawall were selected to analyze the influence of wave period and wave height on the average overtopping amount for different reef flat water depths: 75 m (position 1) and 150 m (position 2) from the reef edge. The results are presented in Figure 5 and Figure 6.
As is evident from Figure 5 and Figure 6, in the same revetment project location, when the freeboard height and incident wave period remain constant, the average overtopping amount of the revetment project gradually increases as the incident wave height increases. Similarly, in the same revetment project location, when the freeboard height and incident wave height are held constant, the average overtopping amount of the revetment project increases with the increase in the incident wave period.

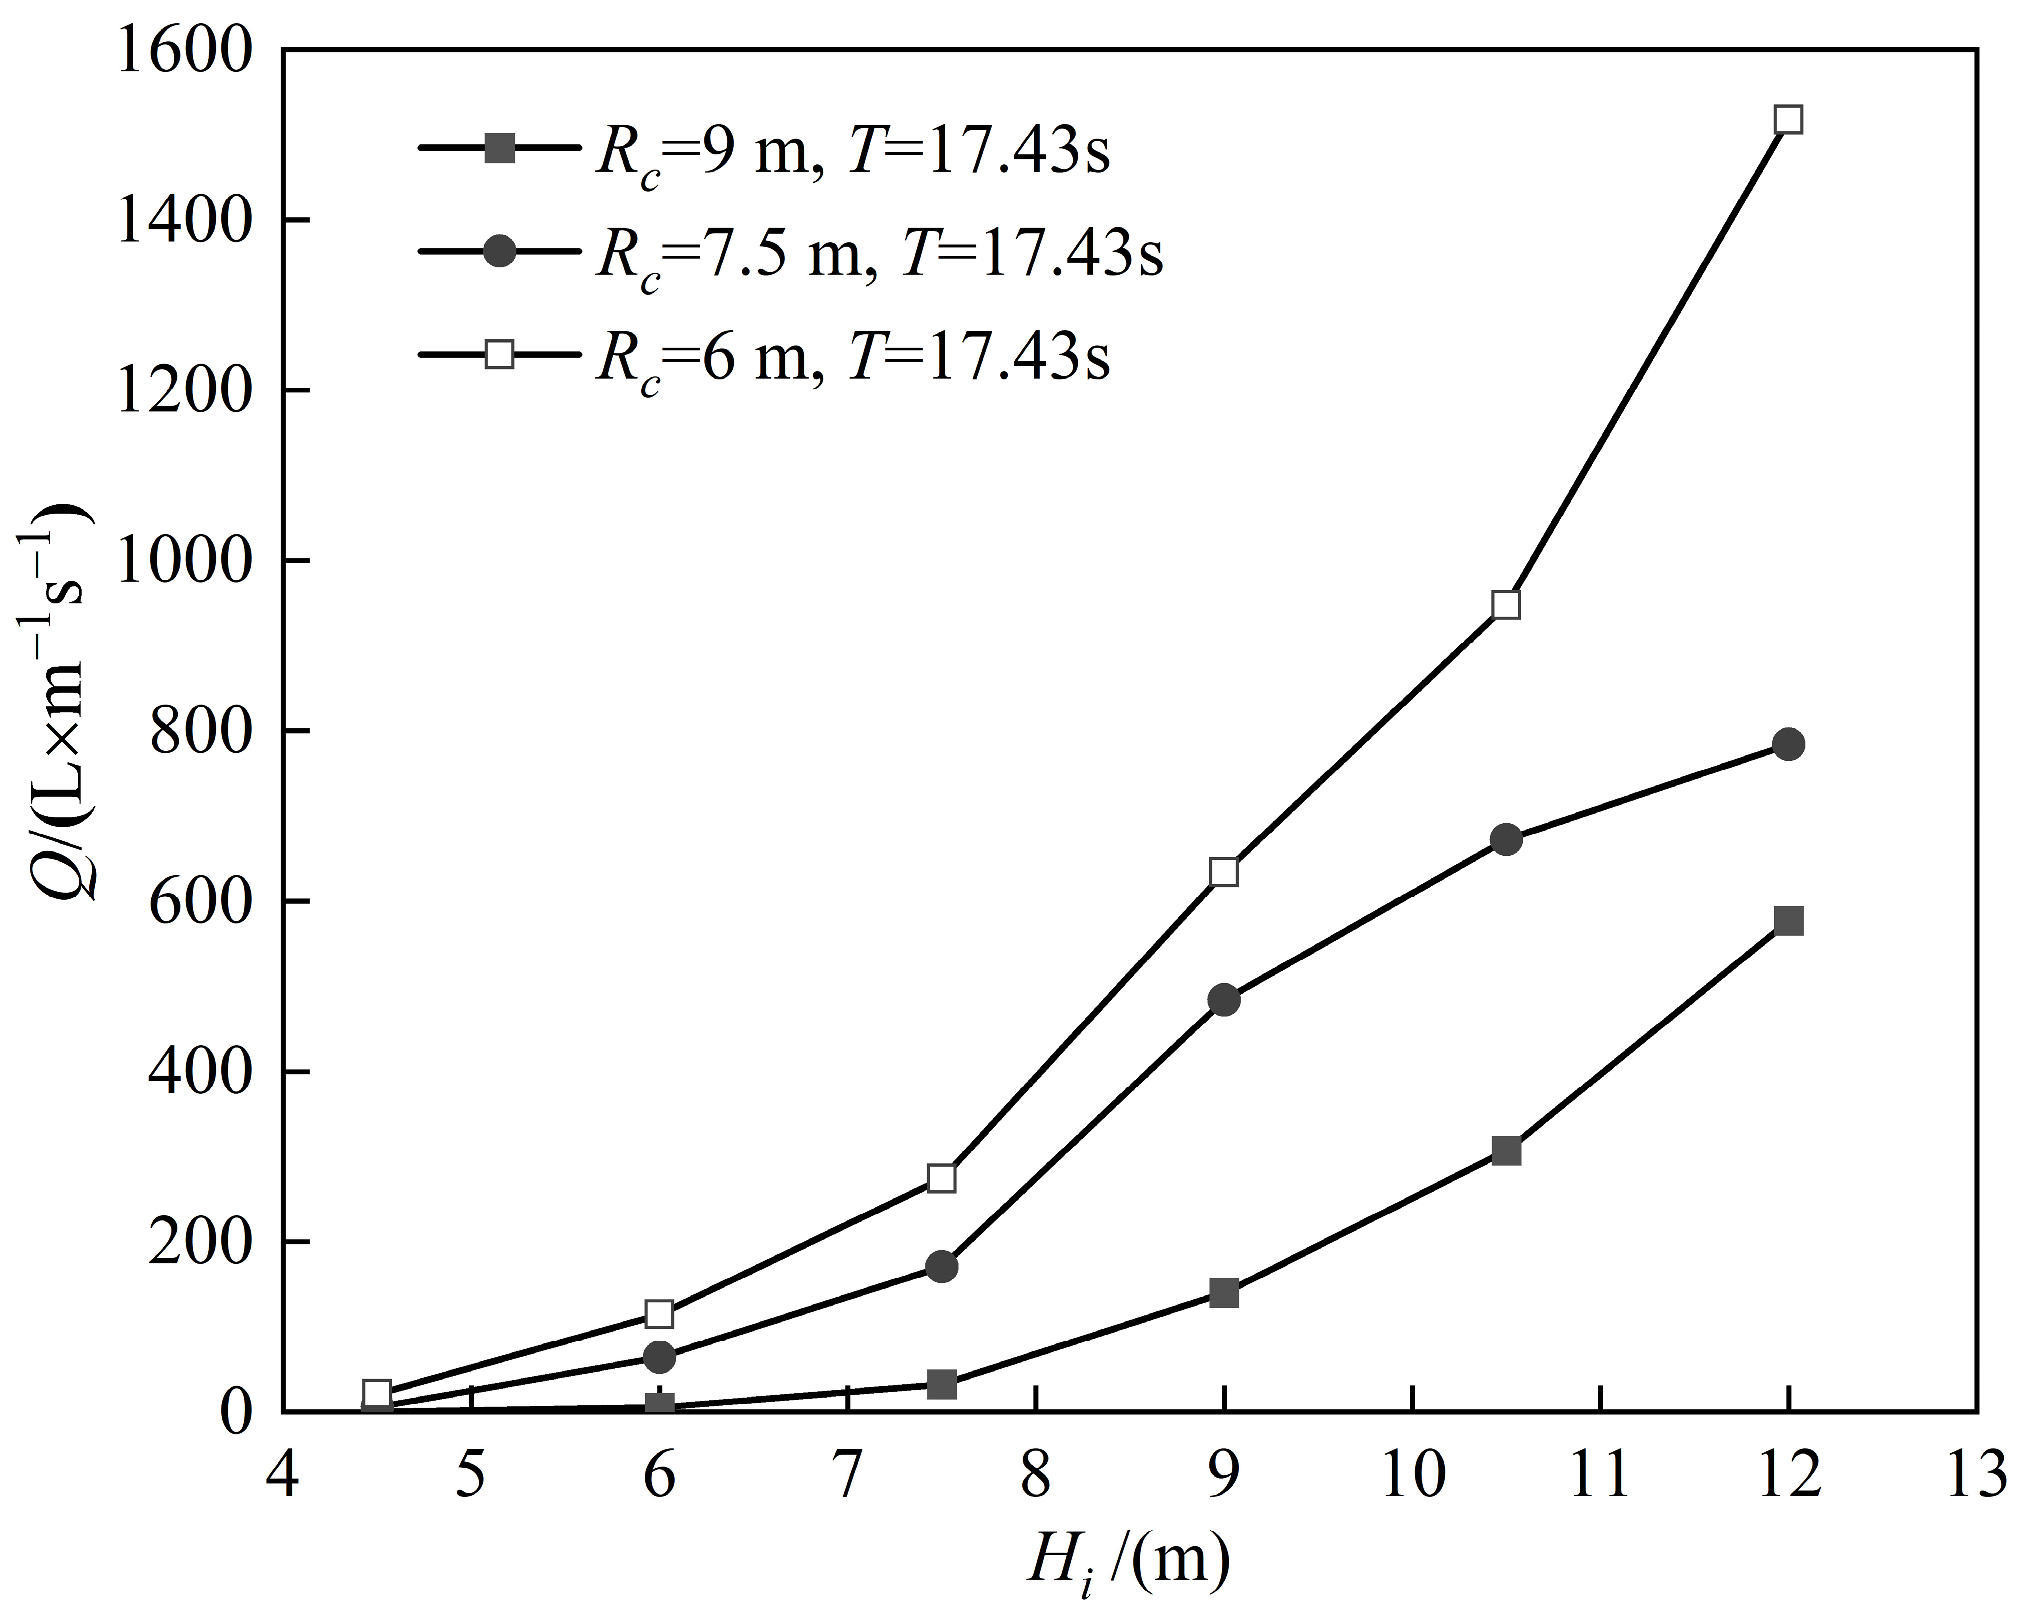
3.1.2. The Influence of Freeboard Height on Overtopping

Based on the analysis presented in Section 3.1.1, it is evident that in the same revetment project location the overtopping amount of the revetment project increases as the incident wave period and wave height increase. Consequently, the position of the revetment seawall located 75 m from the reef edge, with an incident wave period of 17.43 s, was selected for further study. The focus is on analyzing the influence of freeboard height on the average overtopping amount. The results of this analysis are presented in Figure 7.
From Figure 7, it is evident that when the revetment project location remains fixed, and both the incident wave period and wave height are constant, the average overtopping amount of the revetment project exhibits an increase as the freeboard height decreases. This observation can be attributed to the fact that as the freeboard height decreases, the height difference between the static surface of the reef flat and the top elevation of the seawall becomes smaller. Consequently, under the same incident wave conditions, it becomes easier for waves to overtop the seawall and form overtopping, ultimately resulting in a larger average overtopping amount.

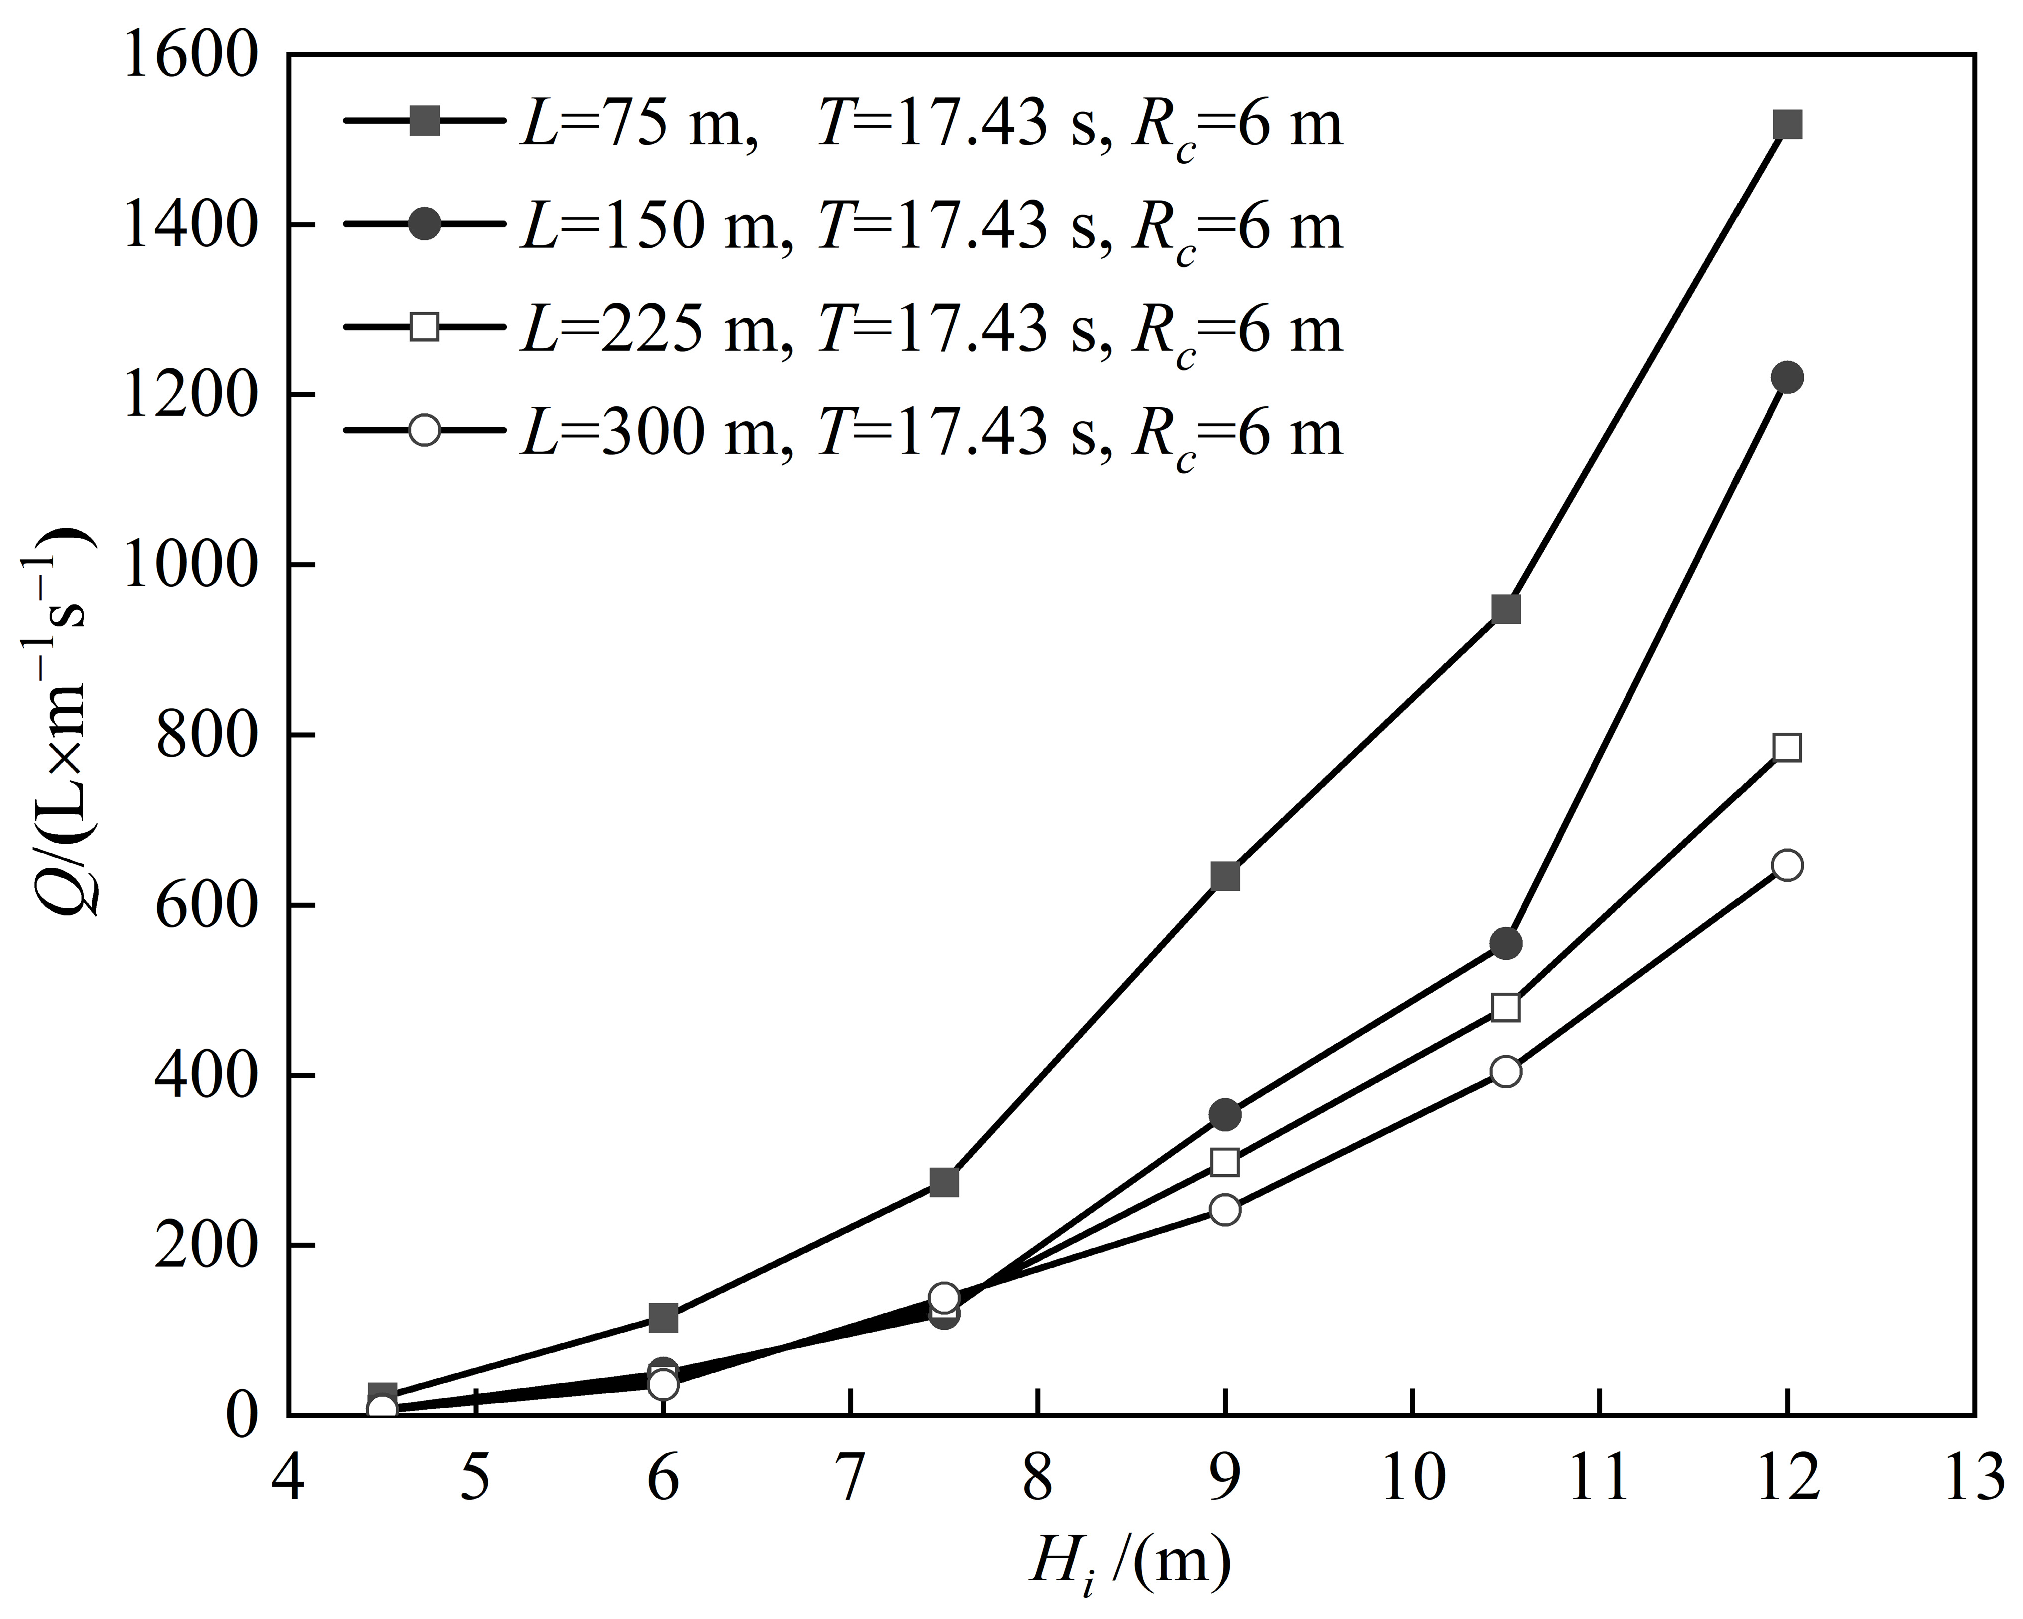
3.1.3. The Influence of the Location of the Revetment Project on Overtopping

Based on the analysis presented in Section 3.1.1 and Section 3.1.2, it is evident that the overtopping amount increases as the wave period and wave height increase; it also increases as the freeboard height decreases. Consequently, to investigate the influence of the revetment project location (specifically, the distance of the revetment seawall from the reef edge) on the average overtopping amount, a minimum freeboard height of 6 m and a maximum incident wave period of 17.43 s were considered in this study. The results of this investigation are presented in Figure 8.
From Figure 8, it is evident that when the freeboard height remains constant, and both the incident wave period and wave height are held constant, the average overtopping amount increases as the distance between the revetment project and the reef edge decreases. This observation can be attributed to the fact that as the distance between the revetment project and the reef edge diminishes, the wave propagation distance on the reef flat becomes shorter, leading to reduced wave energy dissipation and a larger wave set-up. Consequently, the average overtopping amount becomes larger.

3.1.4. The Influence of Wave Steepness on Overtopping

Wave steepness is the ratio of wave height (H) to wave length (L), expressed as δ = H/L. When wave steepness exceeds a certain critical value, wave breaking occurs. The magnitude of wave steepness directly influences the likelihood of wave breaking occurring and the severity of the breaking. The greater the wave steepness, the more prone the wave is to breaking during propagation, and thus to dissipating energy. This results in a lower energy when the wave reaches the seawall of the revetment and, consequently, a decreased wave overtopping capacity. To further investigate the impact of wave steepness on the dimensionless average overtopping volume q ( q = Q / g H i 3 ), given that the overtopping volume is maximal when the seawall of the revetment is situated 75 m from the reef edge (position 1), the freeboard heights of 9 m and 6 m were selected for analysis under the conditions of revetment project location 1. The results of this analysis are presented in Figure 9.
As is evident from the figure, the dimensionless average overtopping volume gradually decreases as the wave steepness increases. This trend can be attributed to the fact that wave steepness represents the characteristic of incoming waves breaking at the reef edge of coral islands. When the incoming wave height remains constant, a larger wave steepness indicates a higher likelihood of the incoming wave breaking at the reef edge, and the degree of breaking is relatively more severe. Consequently, there is increased energy dissipation due to the breaking at the reef edge, resulting in less wave energy being transmitted to the seawall. This leads to a smaller dimensionless average overtopping volume.

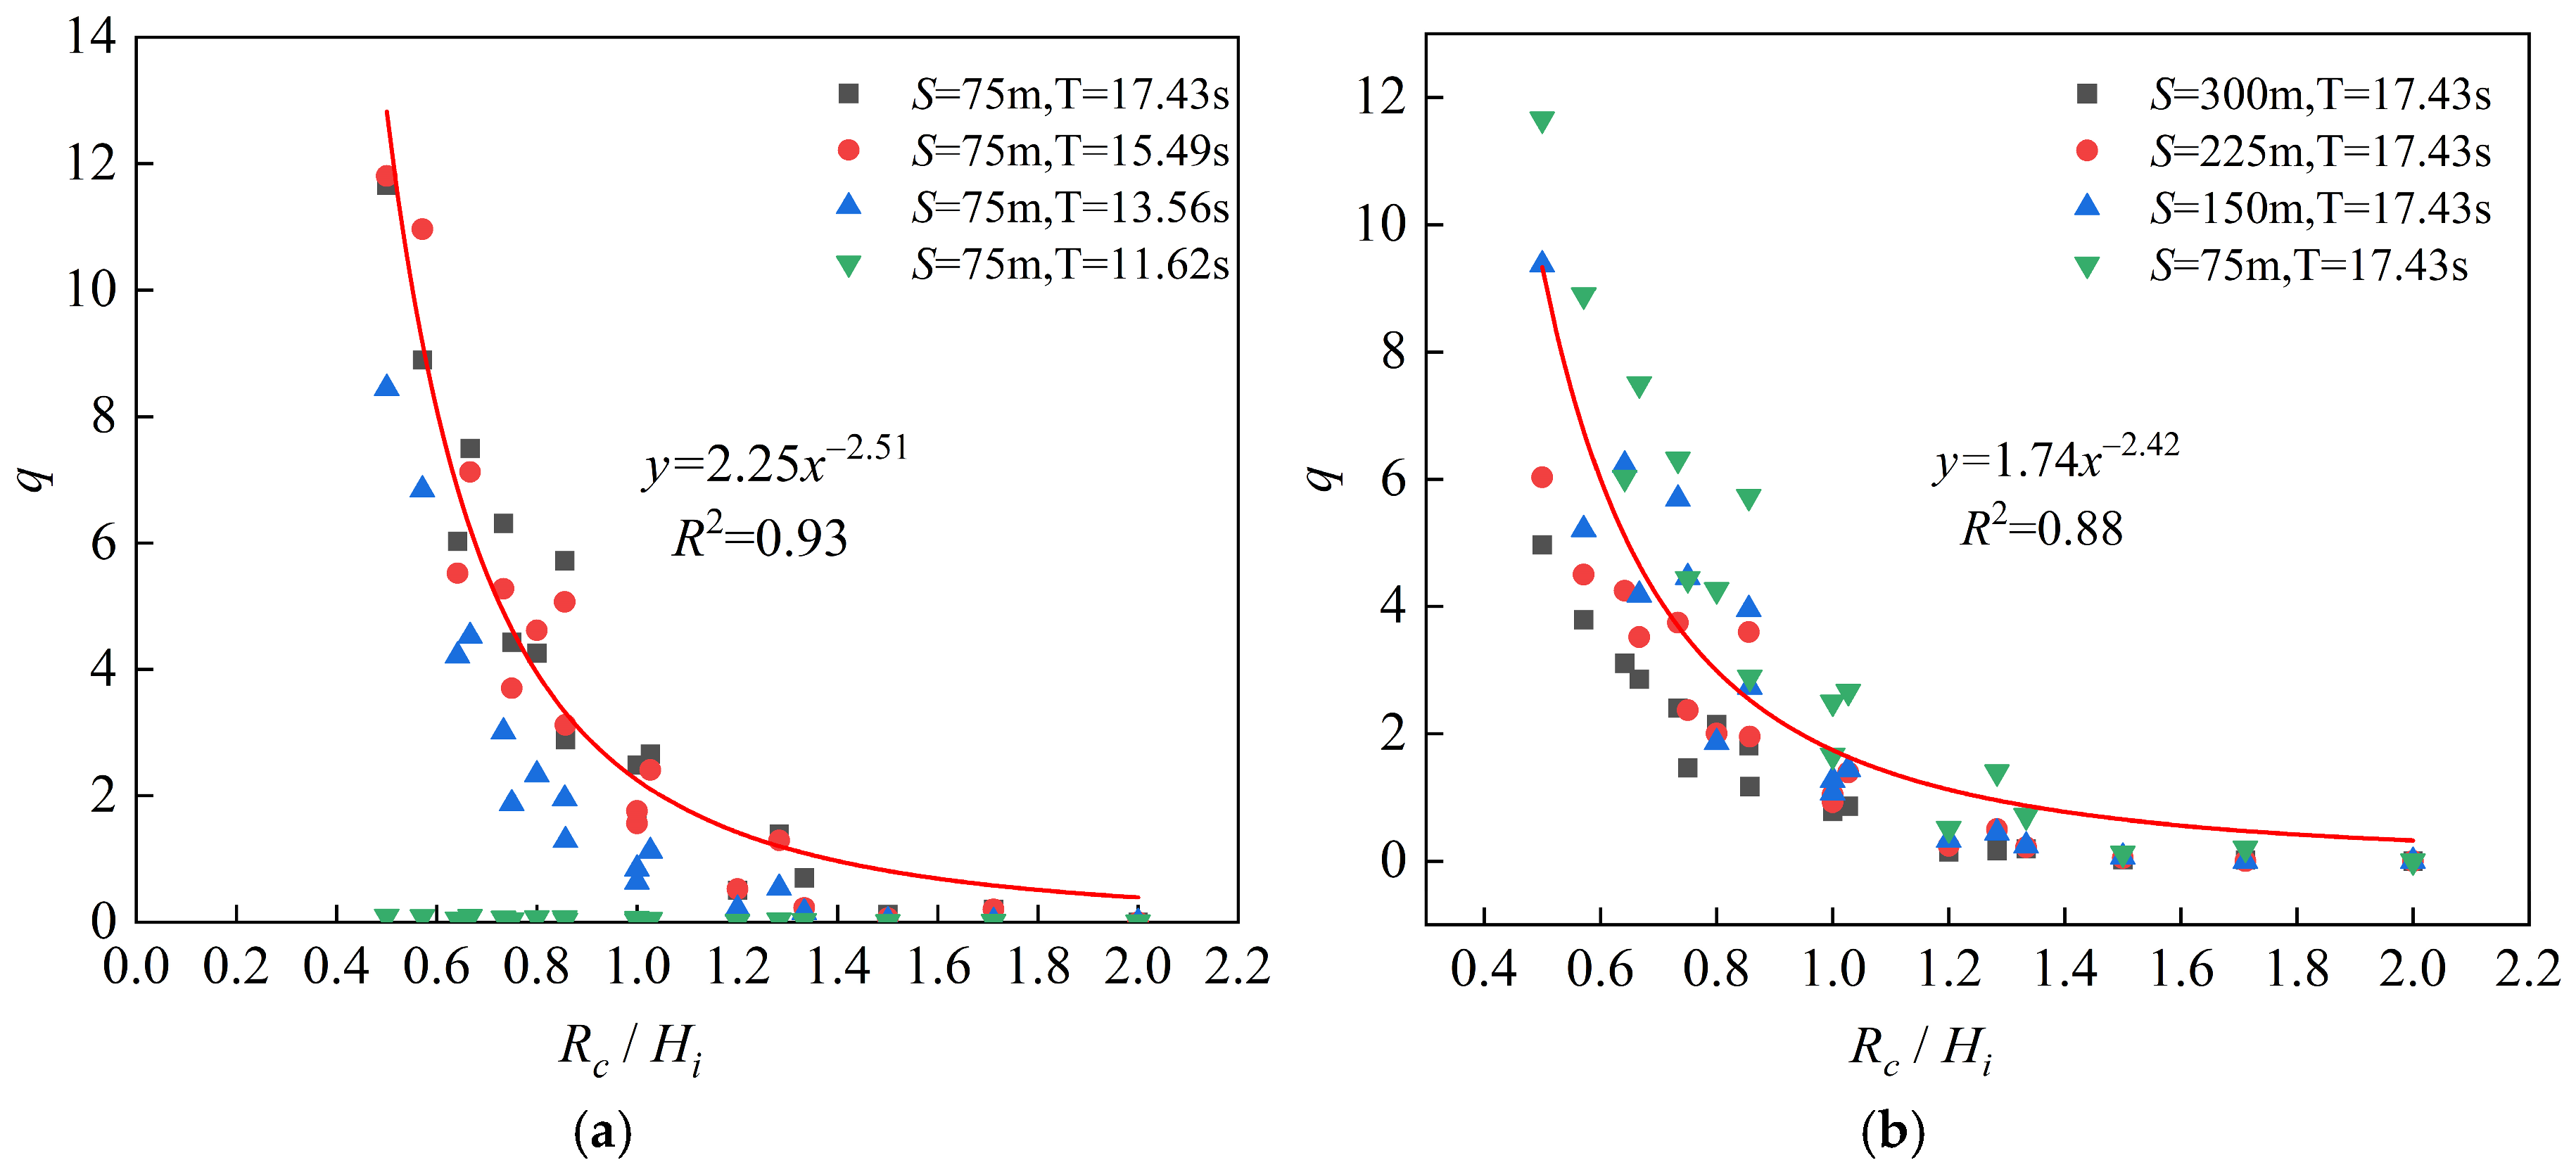
3.1.5. The Influence of Relative Freeboard Height on Overtopping

The distance between the water surface of the reef flat and the top of the seawall of the revetment engineering is defined as the freeboard height Rc, which directly influences the amount of wave overtopping. An analysis was conducted to investigate the impact of the relative freeboard height Rc/Hi on the dimensionless average overtopping volume, under the conditions of a fixed bank protection project position (75 m from the seawall to the edge of the reef), varying incident wave periods, and a constant incident wave period (T = 17.43 s) with different revetment engineering locations. The results of this analysis are presented in Figure 10.
The figure reveals that when the relative freeboard height Rc/Hi > 2, the overtopping volume is zero. Conversely, when Rc/Hi < 2, the dimensionless average overtopping volume decreases exponentially as the relative freeboard height increases.

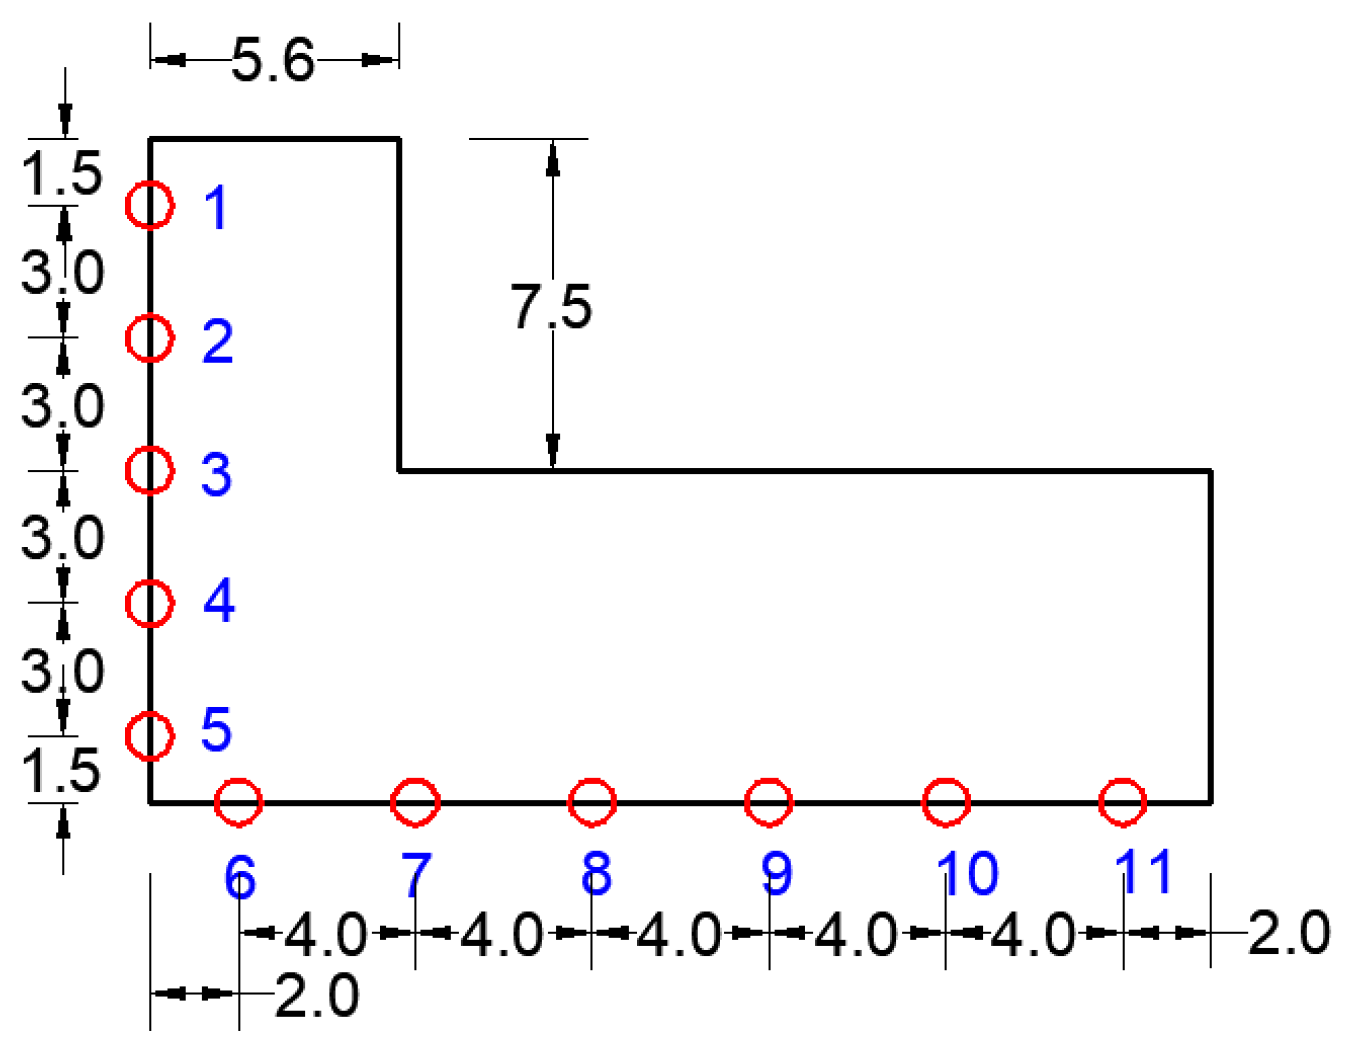
3.2. Analysis of Seawall Wave Pressure

The wave force (peak force) acting on the seawall is a crucial factor influencing the stability of the revetment project and is thus a key consideration in the construction and design of such projects. This experiment primarily focuses on studying and analyzing the impact of various factors, including the incident wave period, wave height, seawall freeboard height, and location of the revetment project, on the wave force (peak force) acting on the seawall.

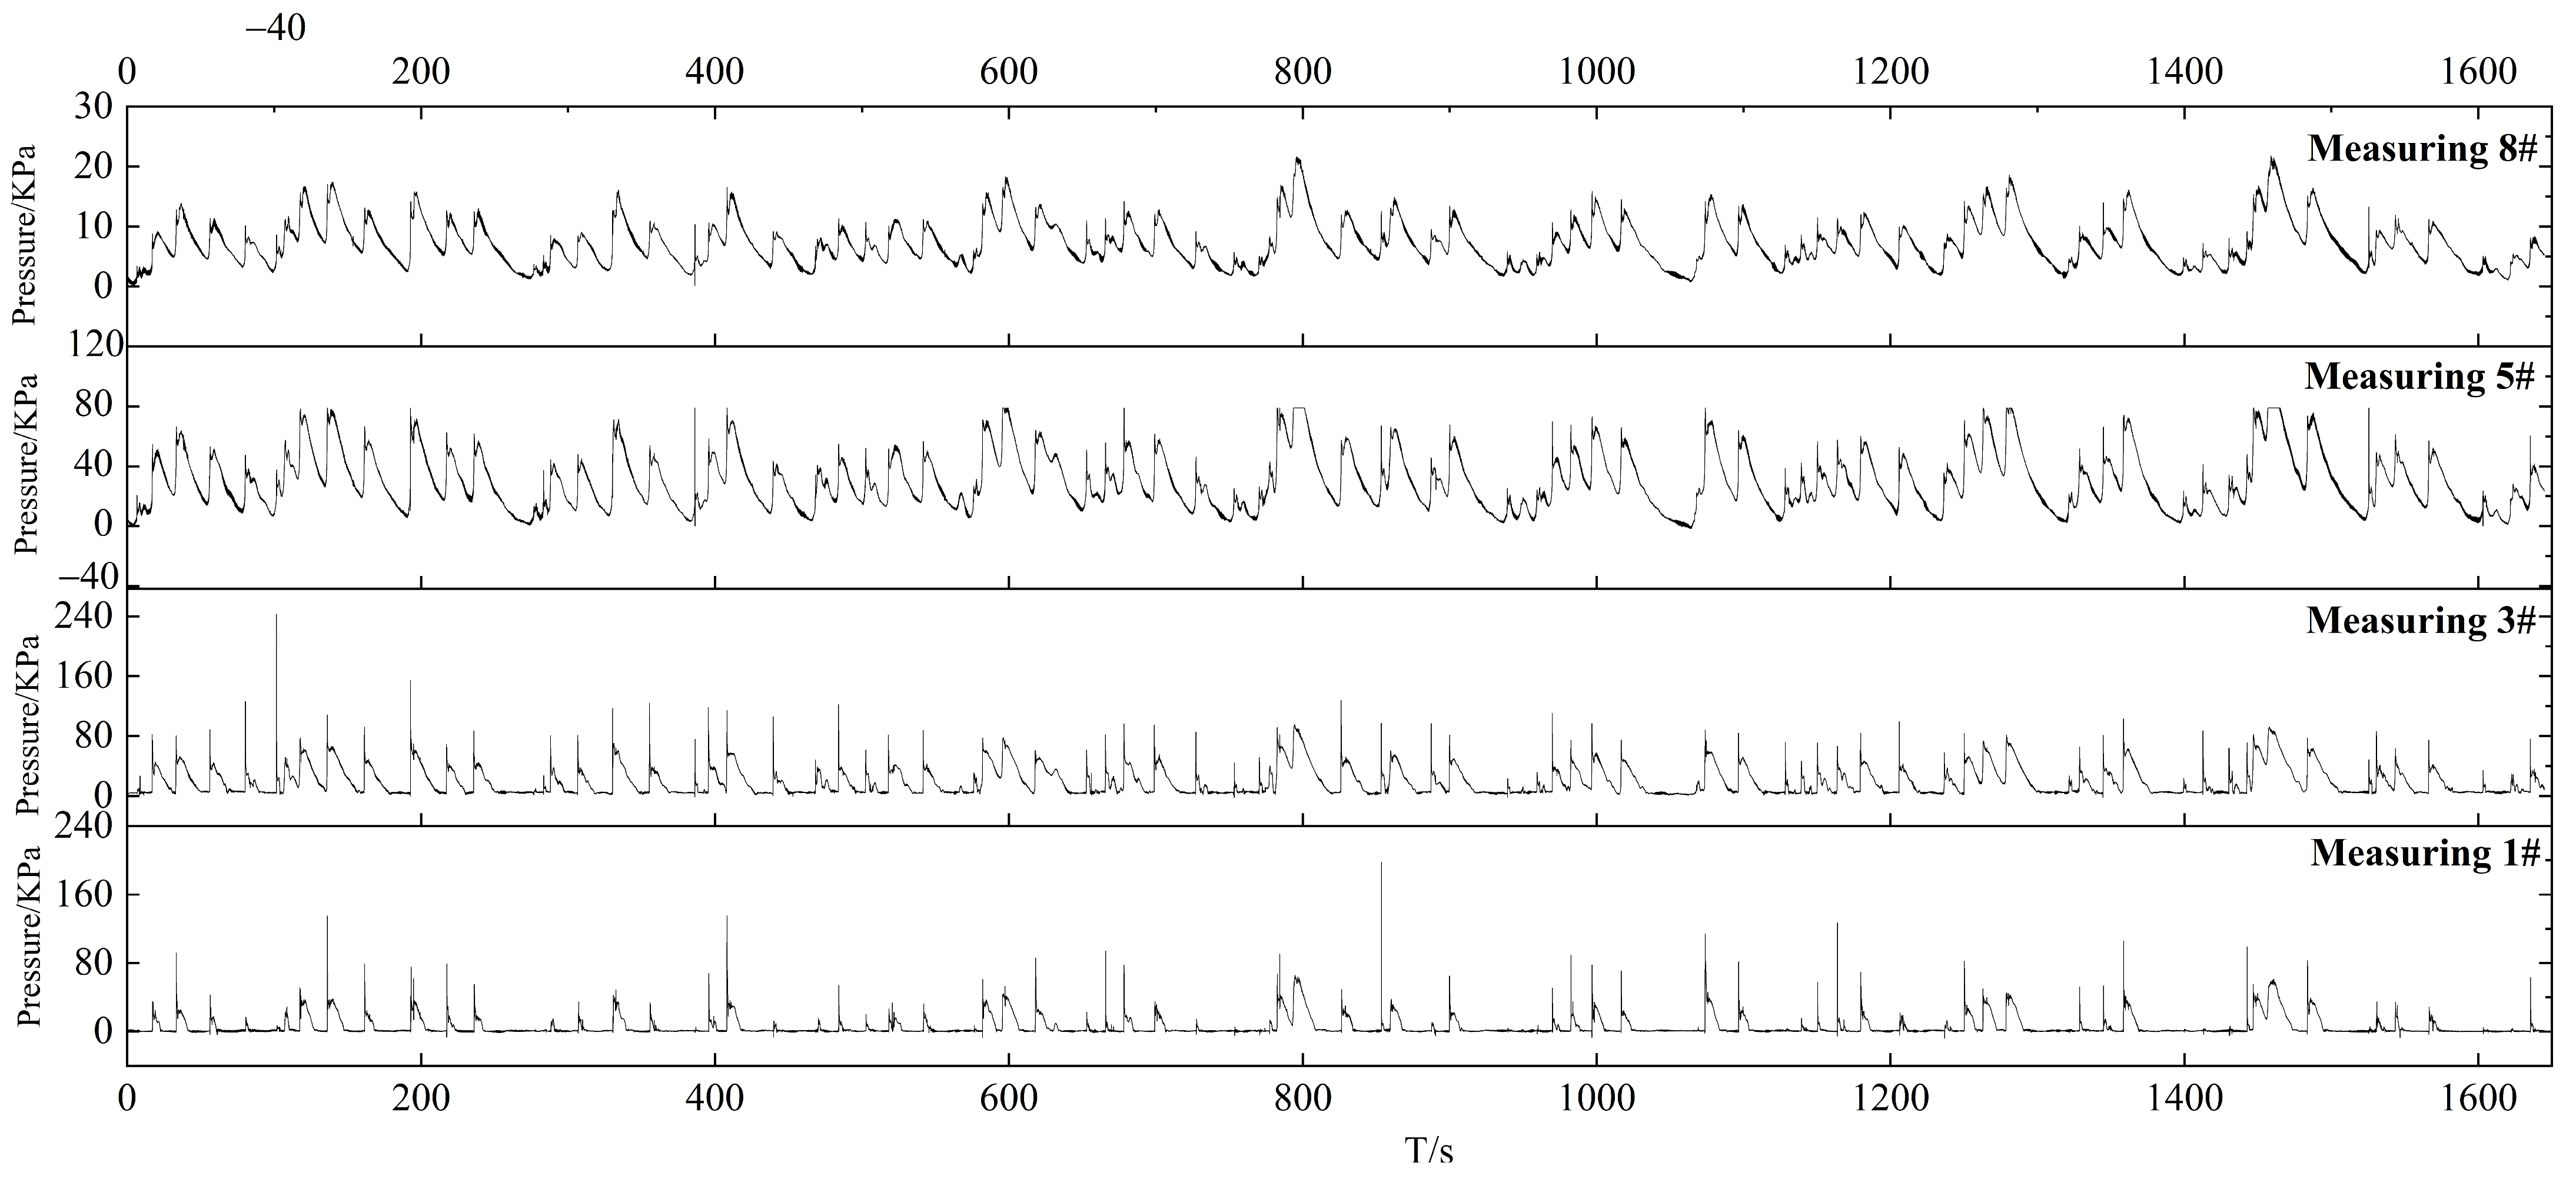
3.2.1. Pressure Varies with Time

Under the conditions of a 3 m water depth on the reef flat, a distance of 225 m between the revetment project and the reef edge, an incident wave height of 12 m, and an incident wave period of 17.43 s, the variation in pressure with time at measuring points 1#, 3#, 5#, and 8# on the seawall was analyzed. Before conducting the pressure measurements, the pressure sensors were calibrated. During the acquisition process, a voltage stabilizer was used to eliminate the acquisition errors caused by voltage fluctuations. Finally, wavelet transform filtering was applied to the collected data to remove noise and ensure data accuracy. The variation in the point pressure is shown in Figure 11.
As is evident from the figure, the pressure at measuring points 1# and 3# on the wave-facing side of the seawall is generally higher, with regular mutations in peak values and a typical distribution of impact pressure. This is attributable to the fact that when the water depth on the reef flat is 3 m, the waves reaching the revetment project induce backwater, which directly impacts the upper measuring points on the wave-facing side of the seawall. Conversely, the overall pressure at measuring points 5 and 8 is lower, exhibiting periodic fluctuations. This is because the water depth on the reef flat is relatively deep, and the measuring points at the bottom of the seawall are consistently submerged. The waves do not directly impact these measuring points, and the fluctuations in water level resulting from the rise and fall of the water primarily influence the wave pressure variations at the bottom measuring points.

3.2.2. The Influence of Incident Wave Height on Wave Pressure

To investigate the impact of incident wave heights on the pressure exerted on the seawall, a specific revetment project was selected for analysis. This project was situated 75 m away from the reef edge, with a reef flat water depth of 3 m and a wave period of 11.62 s. On the wave-facing side of the seawall, measurement points 1#, 3#, and 5# were chosen. Specifically, measurement point 1# was located above the water surface, measurement point 3# was below the water surface, and measurement point 5# was at the lowest end. Additionally, measurement points 6#, 8#, and 10# were selected at the bottom of the seawall. The layout of these measurement points is illustrated in Figure 4. A meticulous examination was conducted to understand how the pattern of the maximum pressure on the surface of the seawall (representing the peak pressure throughout the entire duration of wave interaction) varied under different wave heights, specifically 4.5 m, 6.0 m, 7.5 m, 9.0 m, 10.5 m, and 12 m. This examination is illustrated in Figure 12.
As can be observed in the figure, when solely considering the influence of wave height, the wave pressure on the seawall exhibits an increase as the incident wave height increases.

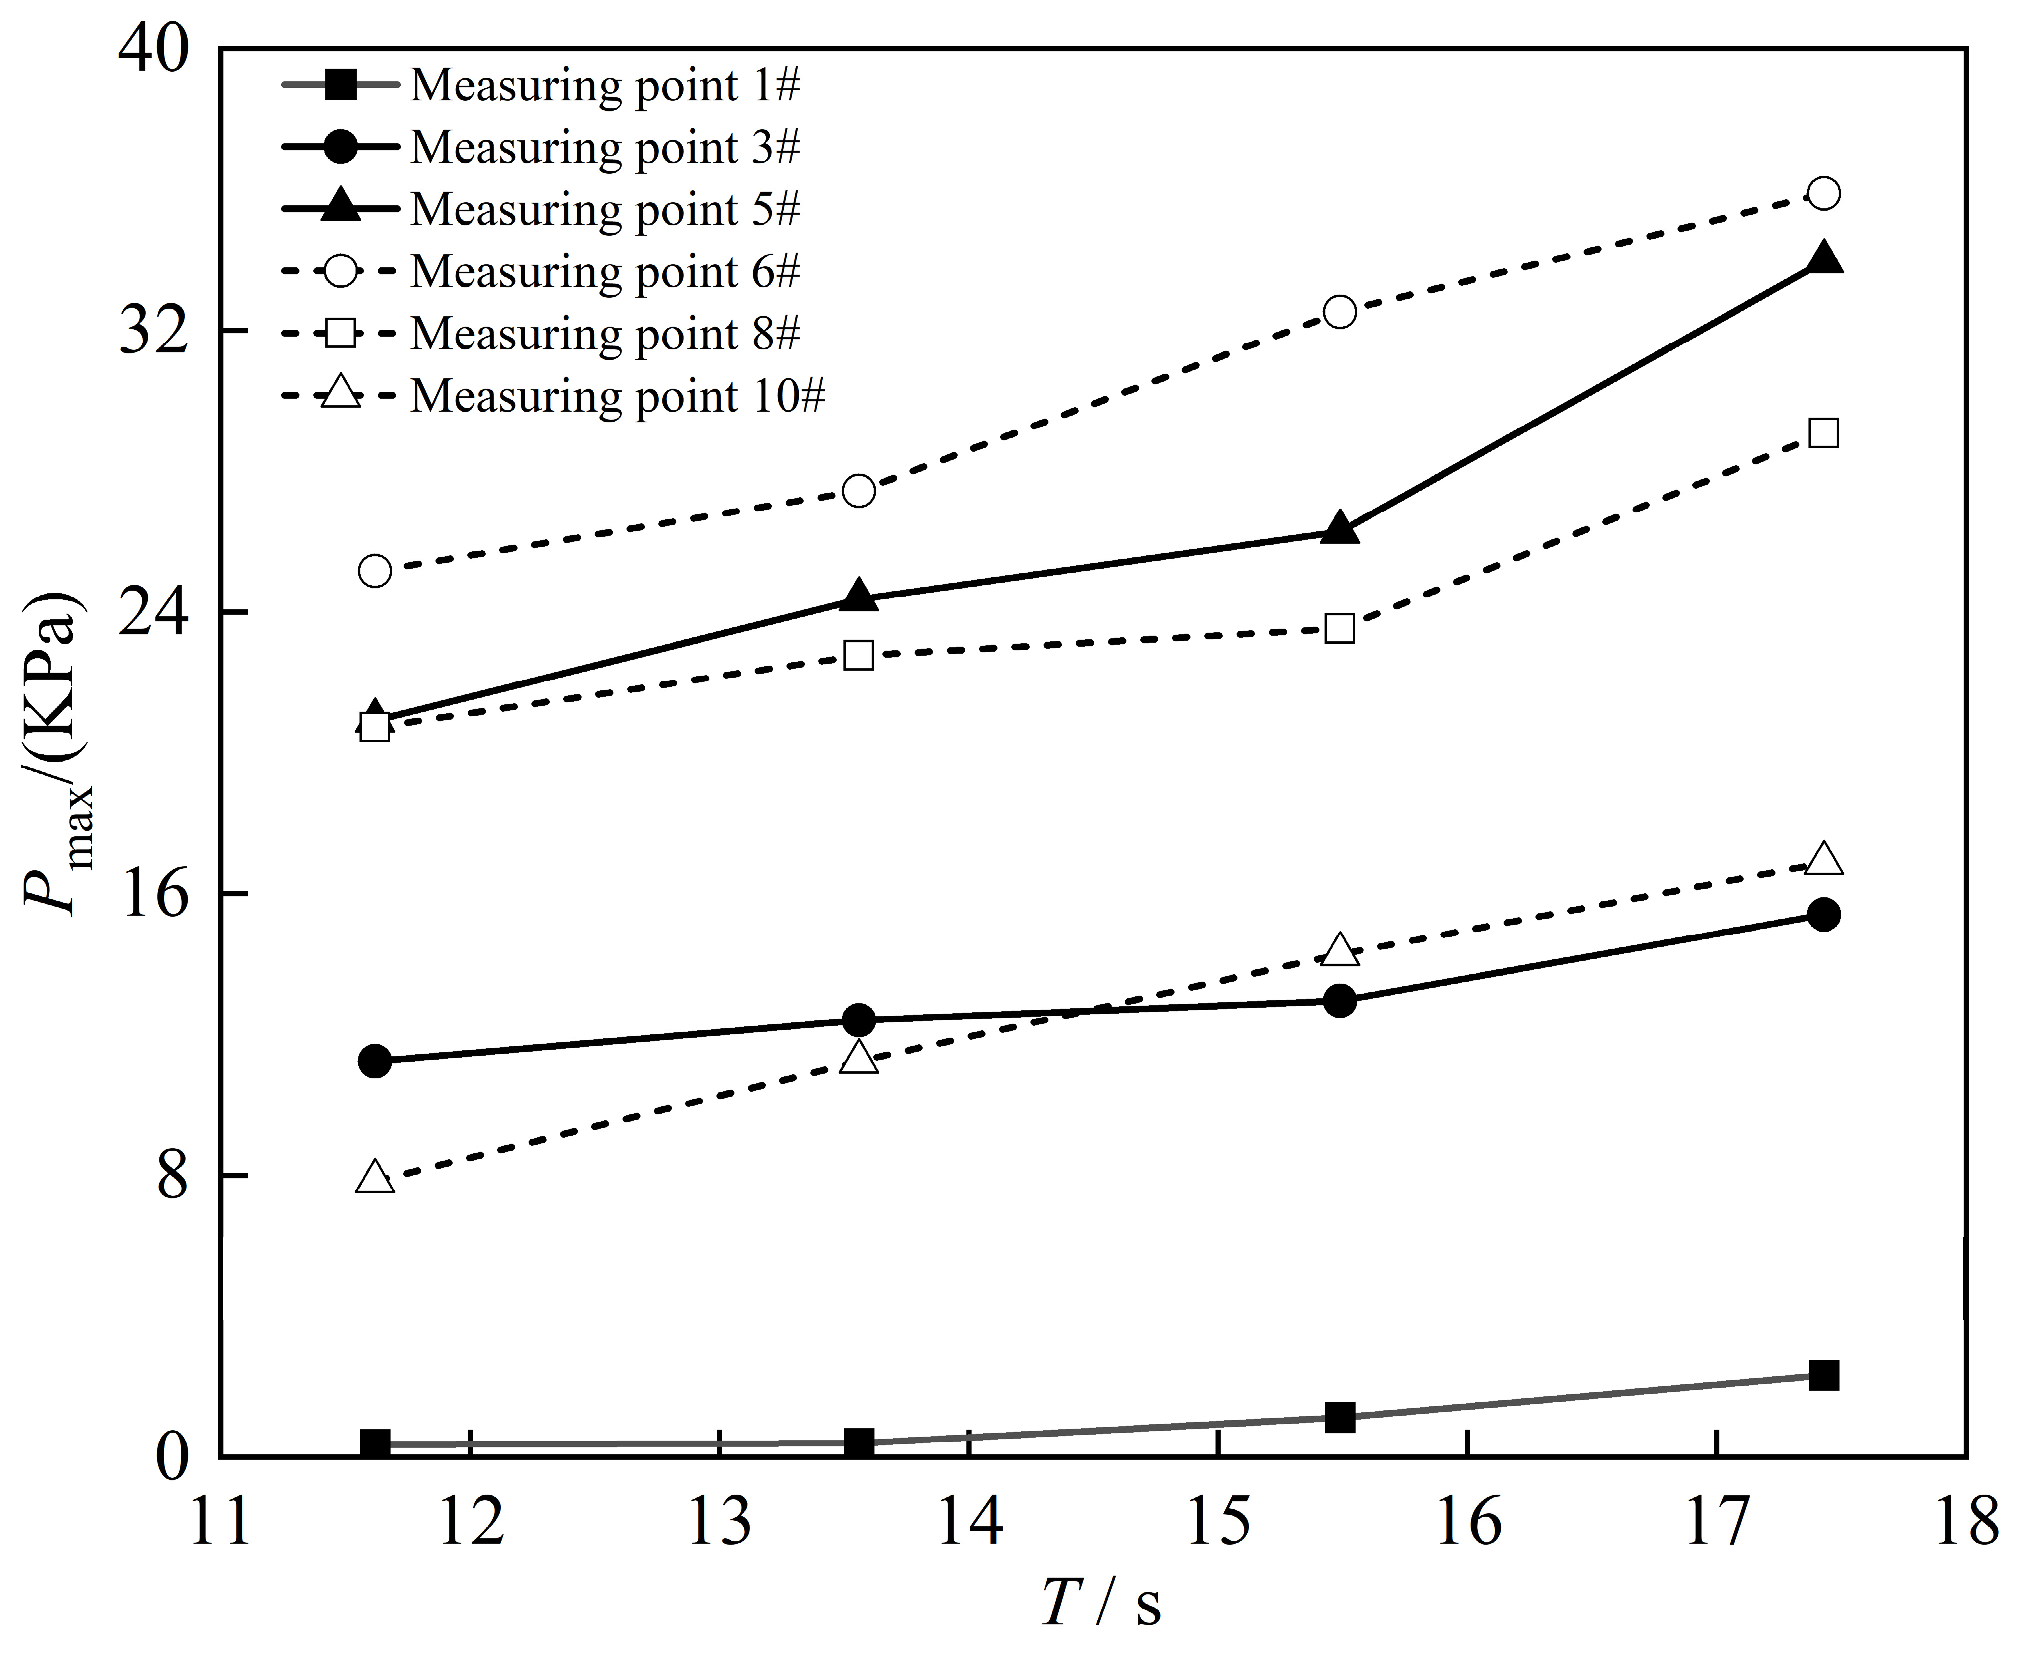
3.2.3. The Influence of Incident Wave Period on Wave Pressure

To investigate the effect of incident wave period on the pressure exerted on the seawall, a specific revetment project was selected for analysis. This project was situated 75 m away from the reef edge, with a reef flat water depth of 3 m and a wave height of 4.5 m. On the wave-facing side of the seawall, measurement points 1#, 3#, and 5# were chosen. Specifically, measurement point 1# was located above the water surface, measurement point 3# was below the water surface, and measurement point 5# was at the lowest end. Additionally, measurement points 6#, 8#, and 10# at the bottom of the seawall were selected. The layout of these measurement points is illustrated in Figure 4. A meticulous examination was conducted to understand how the pattern of the maximum pressure on the surface of the seawall (representing the peak pressure throughout the entire duration of wave interaction) varied under different wave periods, specifically 11.62 s, 13.56 s, 15.49 s, and 17.43 s. This examination is illustrated in Figure 13.
As can be observed in the figure, when solely considering the influence of wave period, the wave pressure on the seawall of the revetment engineering exhibits an increase as the incident wave period increases.

3.2.4. The Influence of Freeboard Height on Wave Pressure

In this experiment, the crest elevation of the seawall remains constant, making variations in water depth the primary factor influencing the freeboard height. To gain a deeper understanding of the effects of freeboard height on wave pressure, a meticulous analysis was conducted on the patterns of variation in the maximum horizontal force and the maximum uplift force (representing the peak wave force throughout the entire duration of wave interaction) per unit width of the seawall. This analysis was conducted under the conditions of three different freeboard heights: 9 m, 7.5 m, and 6 m. These heights corresponded to water depths on the reef flat of 0 m, 1.5 m, and 3 m, respectively, at location 1 of the revetment project. The results of this analysis are shown in Figure 14.
As can be observed in the figure, under the action of waves, both the maximum horizontal force and the maximum uplift force on the seawall exhibit a decrease as the freeboard height of the seawall increases.

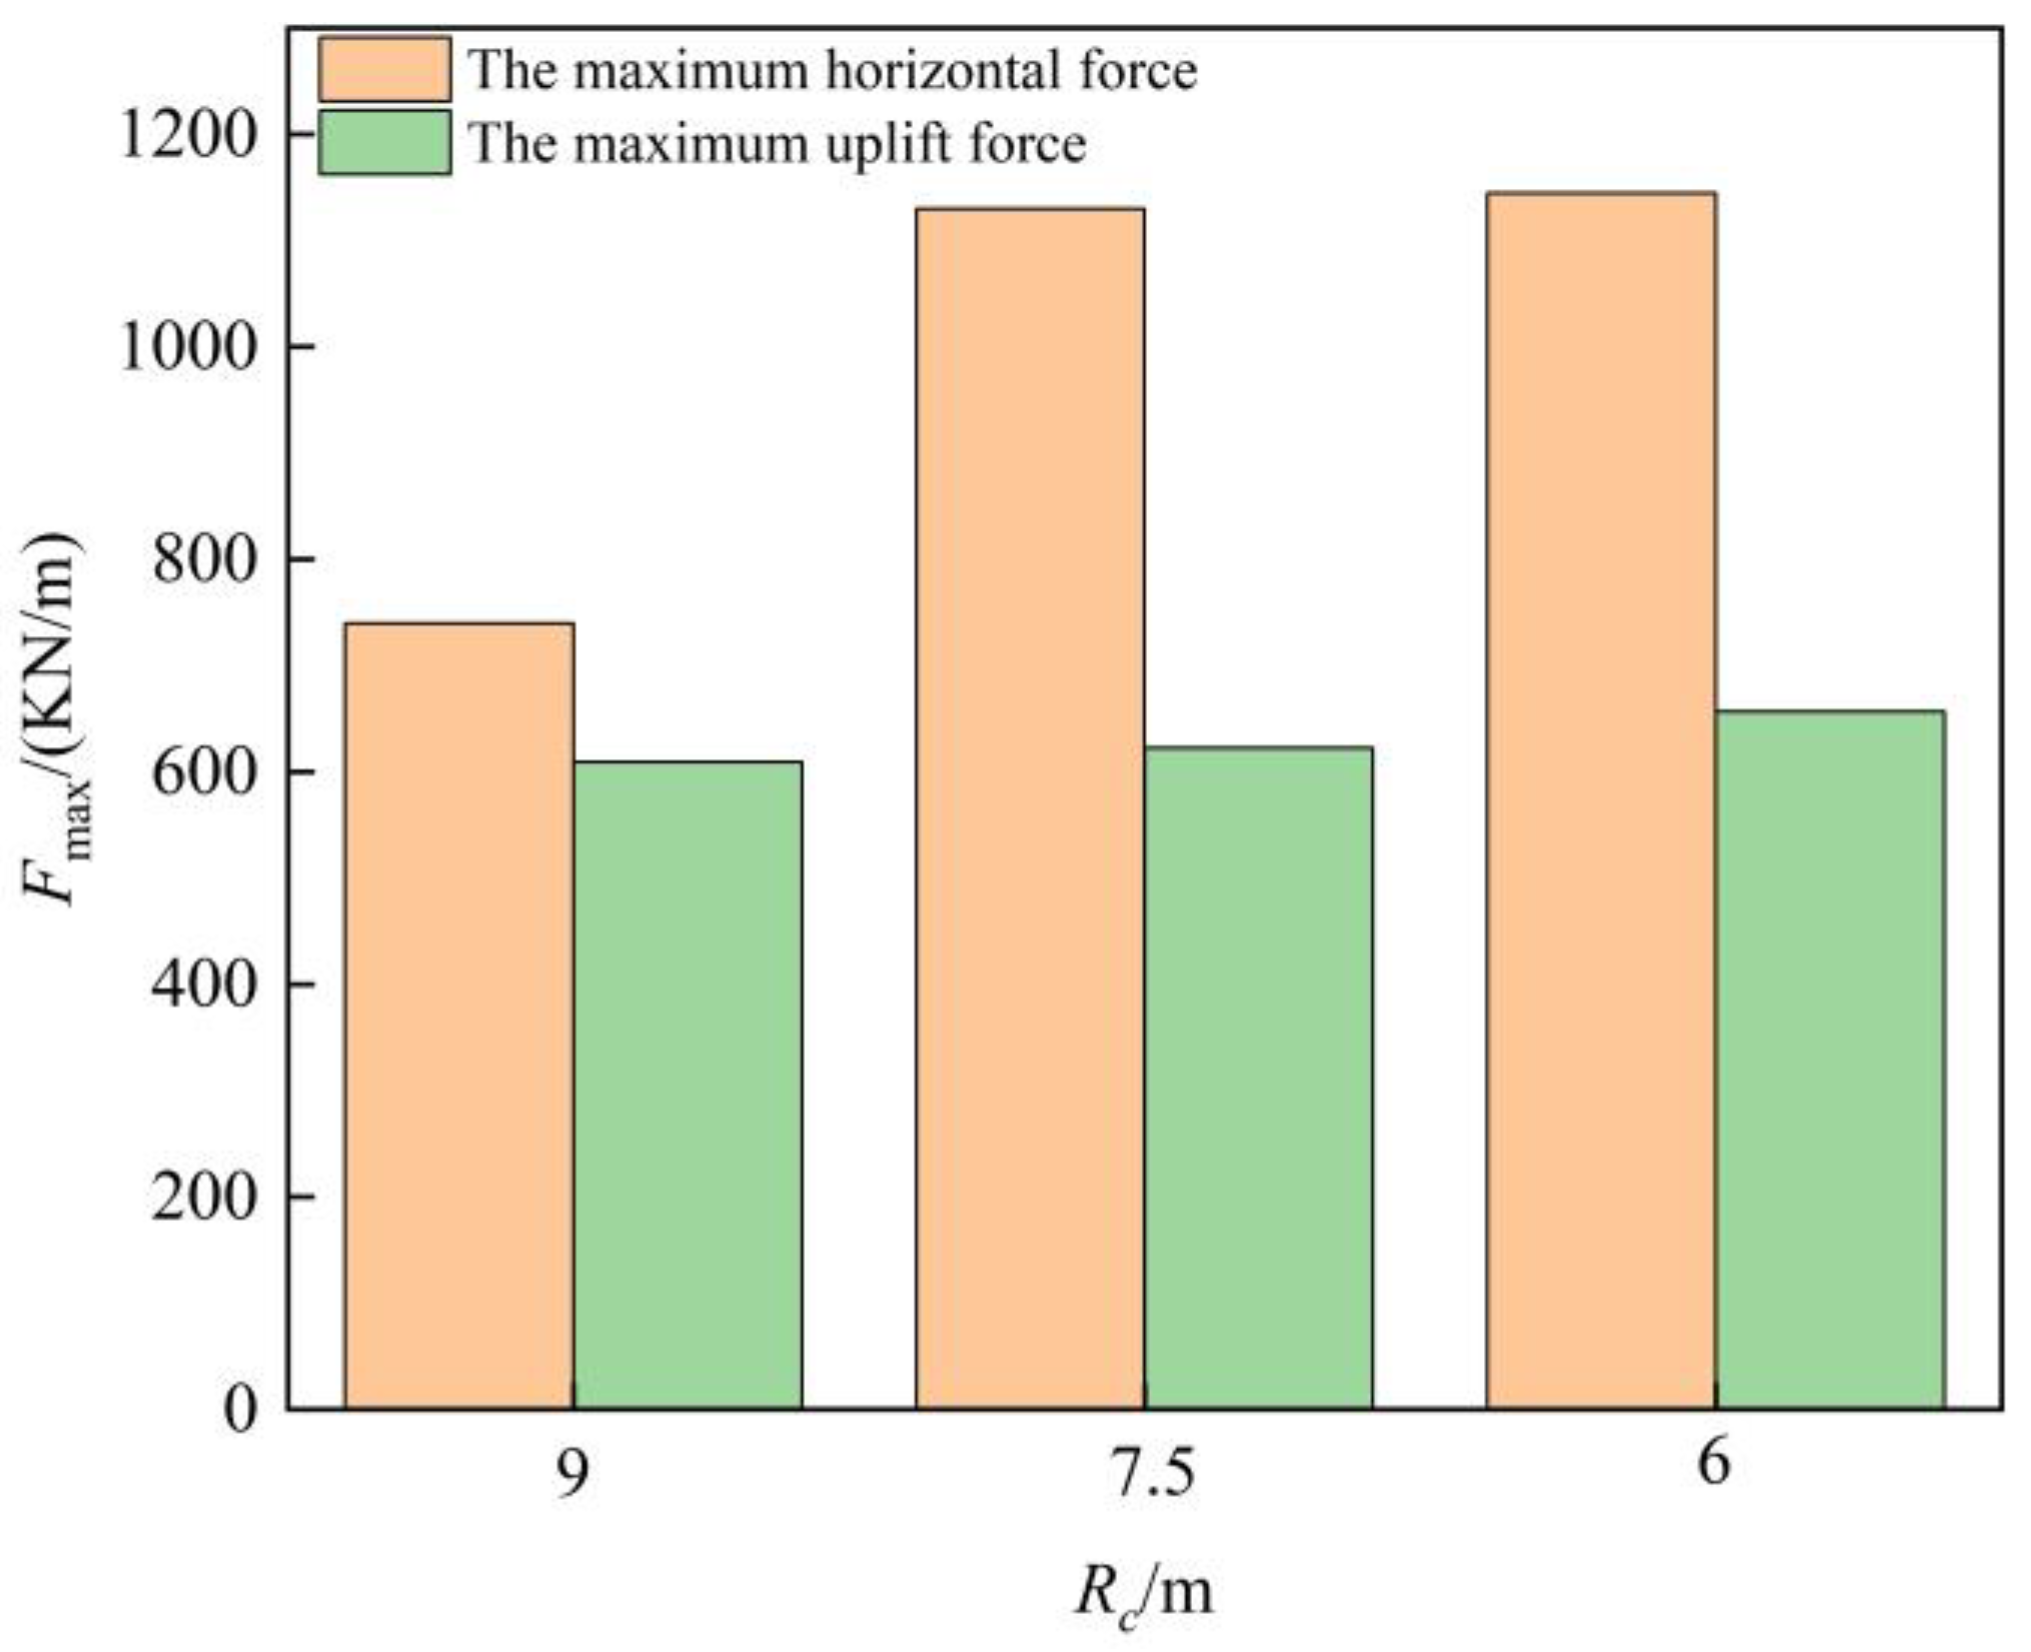
3.2.5. The Influence of the Location of the Revetment Project on Wave Pressure

To investigate the influence of the location of the revetment project on wave pressure, an analysis was conducted on the variation pattern of the maximum horizontal force (representing the maximum wave force throughout the entire process of the wave action) per unit width of the seawall. This analysis was carried out under conditions in which the freeboard heights were 9 m, 7.5 m, and 6 m, and the distances between the revetment project and the reef edge were 75 m, 150 m, 225 m, and 300 m. The results of this analysis are presented in Figure 15.
As can be observed in the figure, under the influence of waves the maximum horizontal force exerted on the seawall diminishes as the distance between the revetment project and the reef edge increases.

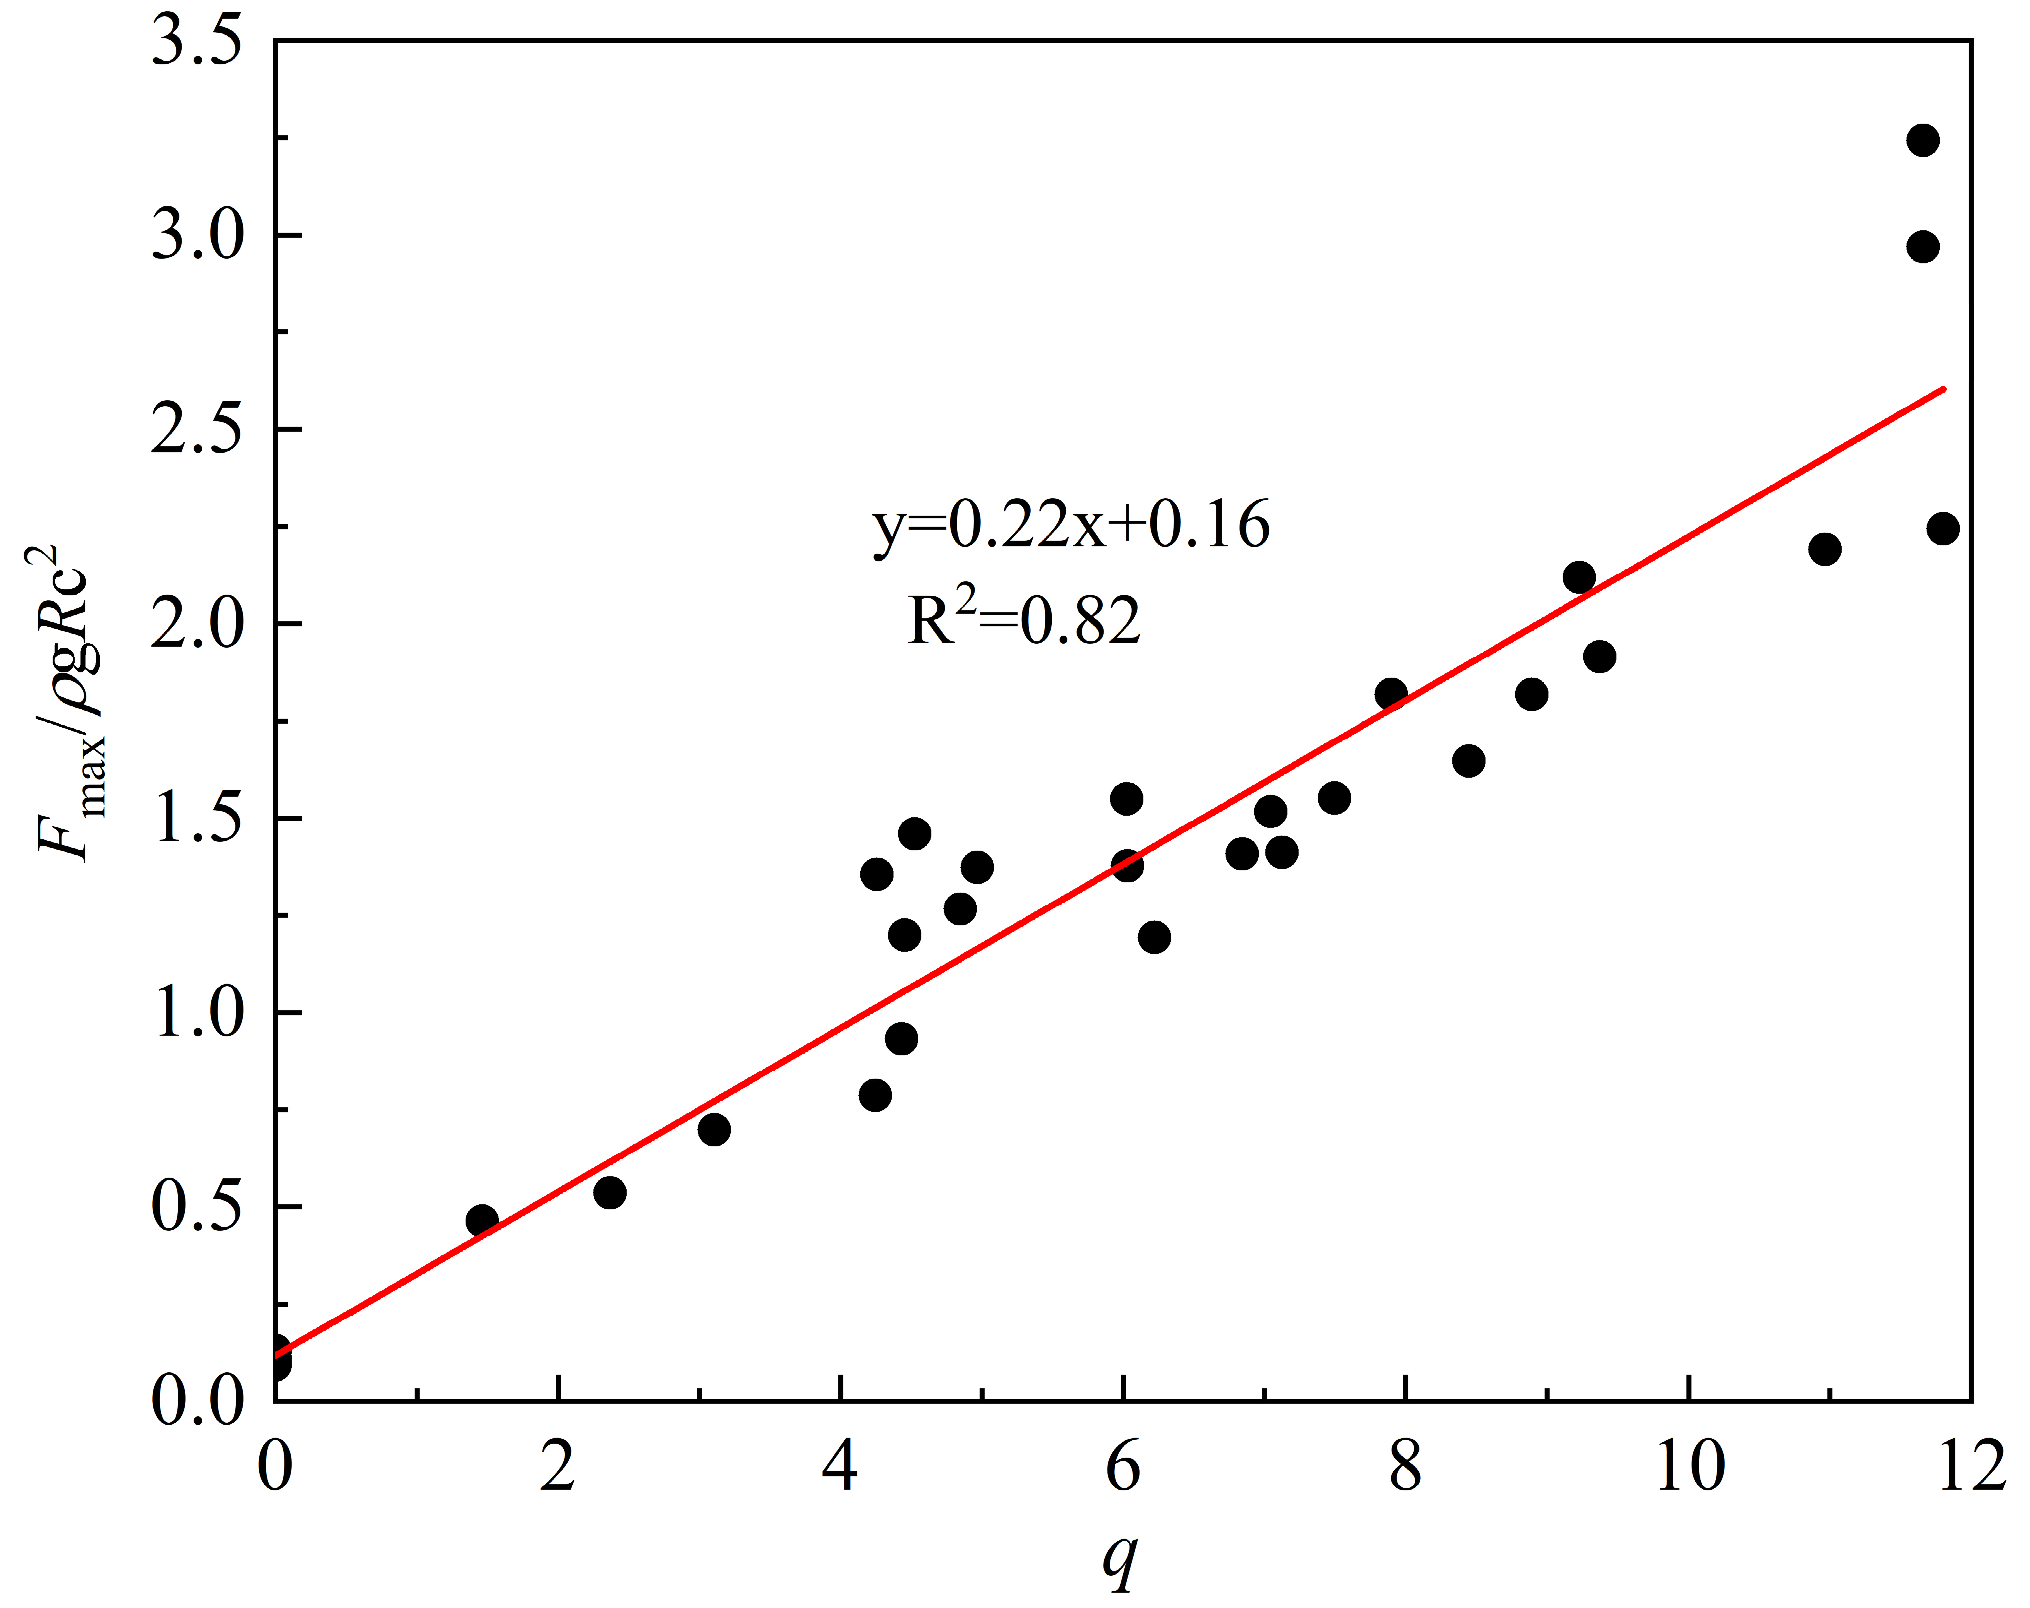
3.2.6. Comprehensive Analysis of Average Wave Overtopping Volume and Seawall Wave Force

Based on the analyses conducted in Section 3.1 and Section 3.2, it is evident that the average overtopping volume of the revetment projects and the wave force acting on the seawall are influenced by various factors, including incident wave height, wave period, freeboard height, and the position of the revetment project. Notably, these factors exhibit similar patterns of variation in terms of their impact on both the average overtopping volume and the wave force. Consequently, to investigate the correlation between the average overtopping volume and the wave force, it is necessary to perform dimensionless processing on both parameters: the average wave overtopping volume and the maximum wave force acting on the seawall. Subsequently, an analysis is carried out to examine the relationship between the dimensionless average wave overtopping volume q ( q = Q / g H i 3 ) and the dimensionless maximum wave force fmax (fmax = Fmax/ρgRc2). The results are presented in Figure 16.
As can be observed in the figures, there exists a linear relationship between the dimensionless average wave overtopping volume and the dimensionless wave force, which can be expressed as
Fmax = Fmax / ρ gRc 2 = 0.22 ( Q / g H i 3 ) + 0.16
The correlation coefficient, R2 = 0.82, along with the comparison between the experimental and calculated values, indicates a strong correlation.
Using neural network technology, Molines [18] proposed calculation formulas for the maximum wave force and wave overtopping volume acting on the seawall of a sloping breakwater, as shown in Equation (2).
fmax = Fmax/0.5ρgCh2 = 3.6 + 0.6log(q)
where Ch is the height of the seawall.
A comparative analysis of Molines’ formula, Equation (2), and the experimental values is presented in Figure 17.
The figure reveals a linear relationship between the wave force and the dimensionless overtopping volume for both Molines’ formula and the formula presented in this study, with the wave force increasing as the overtopping volume increases. However, the wave forces calculated using Molines’ formula are generally greater than the experimental values. The primary reason for this discrepancy is that Molines’ formula is primarily designed for calculating slope breakwater in ordinary marine terrains, whereas this study focuses on revetment projects in a coral reef. Overtopping is primarily caused by wave breaking and run-up, and the wave force on the seawall is mainly due to wave impact. Compared to ordinary marine terrains, wave breaking at the reef edge and water run-up on the reef flat are more intense in coral reefs. Under the same incident wave energy, due to wave breaking and the greater roughness of the reef flat, the water level on the reef flat rises significantly, leading to more overtopping. However, the direct impact on the seawall decreases, and the wave force is mainly caused by fluctuating pressure. Therefore, under the same overtopping conditions, the wave force on the seawall of revetment projects in a coral reef is relatively low.
This indirectly reflects the fact that overtopping and the wave force are the results of the same physical process, namely wave breaking, run-up, and overtopping, and that greater overtopping results in greater forces acting on the seawall. This discovery is of great significance for understanding and predicting the effects of waves on structures. It not only provides a new method for quantifying the impact of wave forces (the maximum wave force acting on the seawall of the revetment project is calculated by measuring the wave overtopping volume) but also offers strong theoretical support for the design and optimization of structures.

4. Discussion

Through physical model experiments, the influence patterns of various factors, including the incident wave period, wave height, freeboard height of the seawall, and the distance between the revetment project and the reef edge, on both the average wave overtopping volume and the maximum wave force acting on the seawall, are investigated. It is observed that both the average wave overtopping volume and the maximum wave force increase with an increase in incident wave height and period, while they decrease with an increase in the freeboard height of the seawall and the distance between the project and the reef edge. A linear relationship is observed between the dimensionless average wave overtopping volume and the dimensionless maximum wave force. Based on the comparison of the research findings in this study with those of Molines [18] and Formentin [19], it can be observed that there exists a linear relationship between the dimensionless mean wave overtopping volume and the dimensionless maximum wave force. However, the studies by Molines and Formentin primarily focused on the wave forces and overtopping on the seawalls of breakwaters in traditional coastal topographies. These studies have poor applicability in coral reef topographies with steep reef edges and long reef flats, resulting in overexaggerated calculation results. Through comparative analysis, it has become evident that calculating the seawall wave force based on overtopping in ordinary marine terrains is not applicable to coral reef terrains. Therefore, the research conducted in this study is necessary. Nonetheless, the experiments in this study were conducted in a small-scale flume, and the experimental results need to be verified through large-scale or prototype testing. Chen Songgui [10,18] studied the variation in the average wave overtopping volume and the wave force acting on the seawall of vertical breakwaters through large-scale wave flume experiments. Large-scale flumes have the advantage of overcoming the scale effect that may occur in the results of smaller flumes. When comparing the findings of this study with those of Chen Songgui’s research, it is evident that the influence of various factors on the average wave overtopping volume and the wave pressure acting on the seawall is essentially consistent. Therefore, both large-scale and small-scale models can model the correlation between the average wave overtopping volume and the wave force acting on the seawall well, making them applicable in practical engineering projects.
This study primarily analyzes the relationship between wave overtopping and wave forces in coral reef revetment projects, with a focus on the variation in wave forces on seawalls. However, the stability of revetment projects is also influenced by the stability of the foundation. Changes in dynamic conditions, such as waves and tides, can affect the transport of coral sand [20,21], thereby impacting the stability of the bank protection foundation. Further exploration into the influence of coral sand transport on revetment stability under different wave dynamic conditions is needed in the future. This study may be used to promote the efficiency of disaster assessment in coral reef revetment engineering, thereby fostering a positive impact on the sustainable development of coral reefs.

5. Conclusions

Through the use of a 1:40 scale physical wave model test, the variation patterns of the wave force and the average wave overtopping in reef island revetment projects were analyzed with respect to factors such as the incident wave period, wave height, freeboard height of the seawall, and the distance between the revetment project and the reef edge. The following conclusions are drawn:
(1)
The average wave overtopping and the wave force on the seawall of the revetment project increase with the increase in incident wave period and wave height.
(2)
The average wave overtopping and the wave force on the seawall of revetment projects are inversely proportional to the freeboard height of the seawall. Specifically, when the relative freeboard height (Rc/Hi) is greater than 2, the wave overtopping is 0. When Rc/Hi is less than 2, the dimensionless average wave overtopping decreases exponentially with the increase in relative freeboard height.
(3)
The average wave overtopping and the wave force on the seawall of revetment projects are directly proportional to the proximity of the revetment project to the reef edge. The closer the revetment project is to the reef edge, the greater the average wave overtopping and the wave force on the seawall.
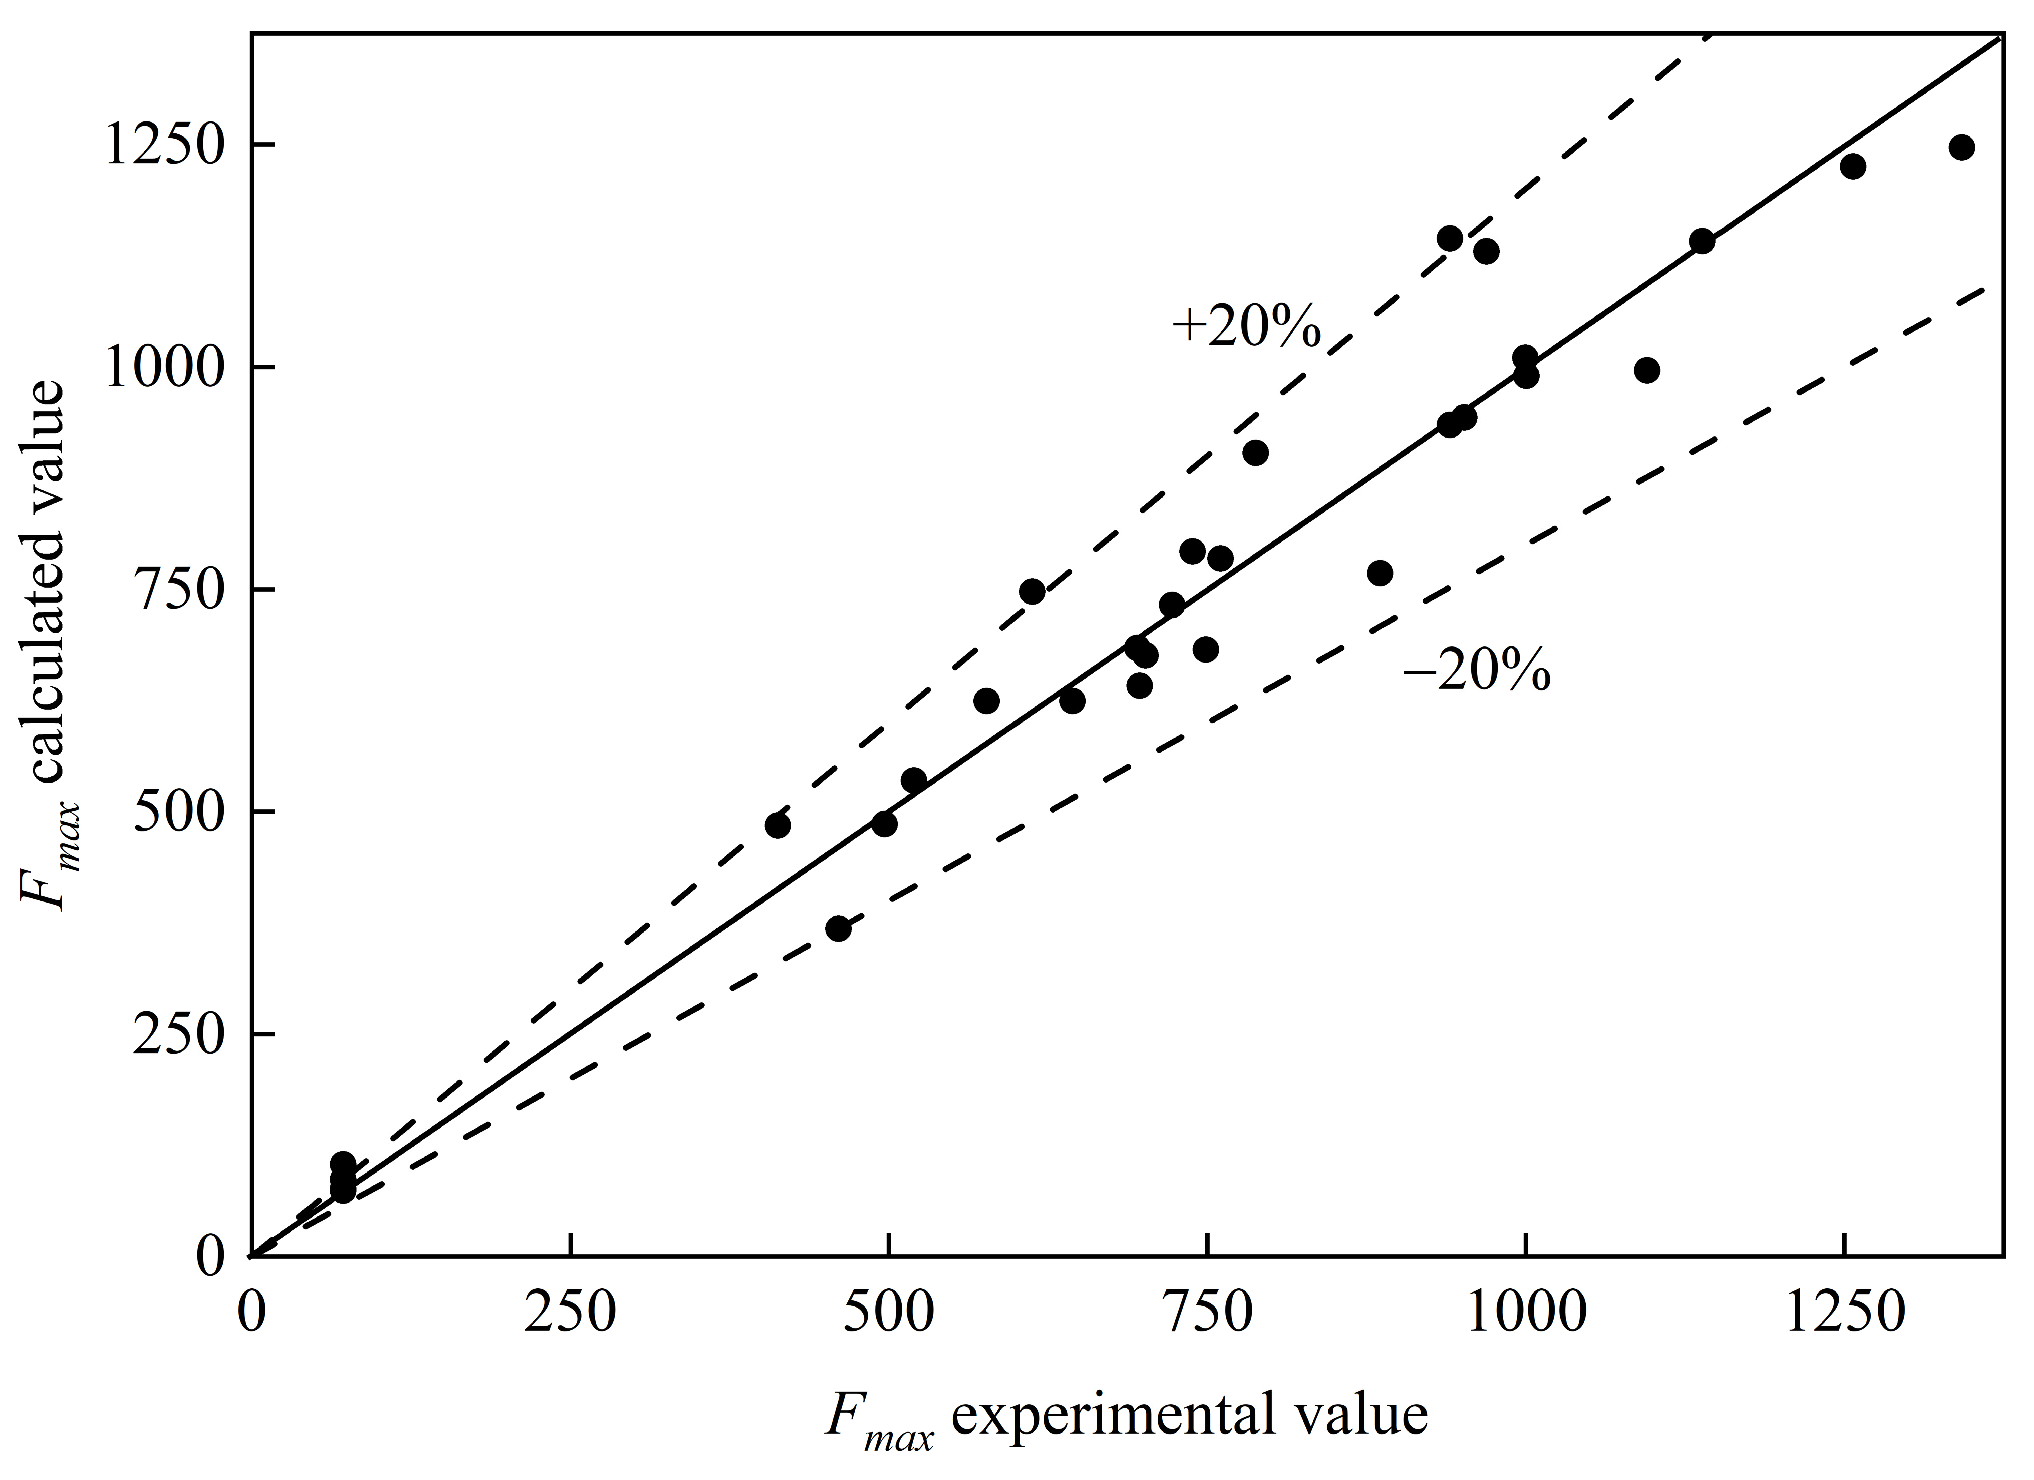
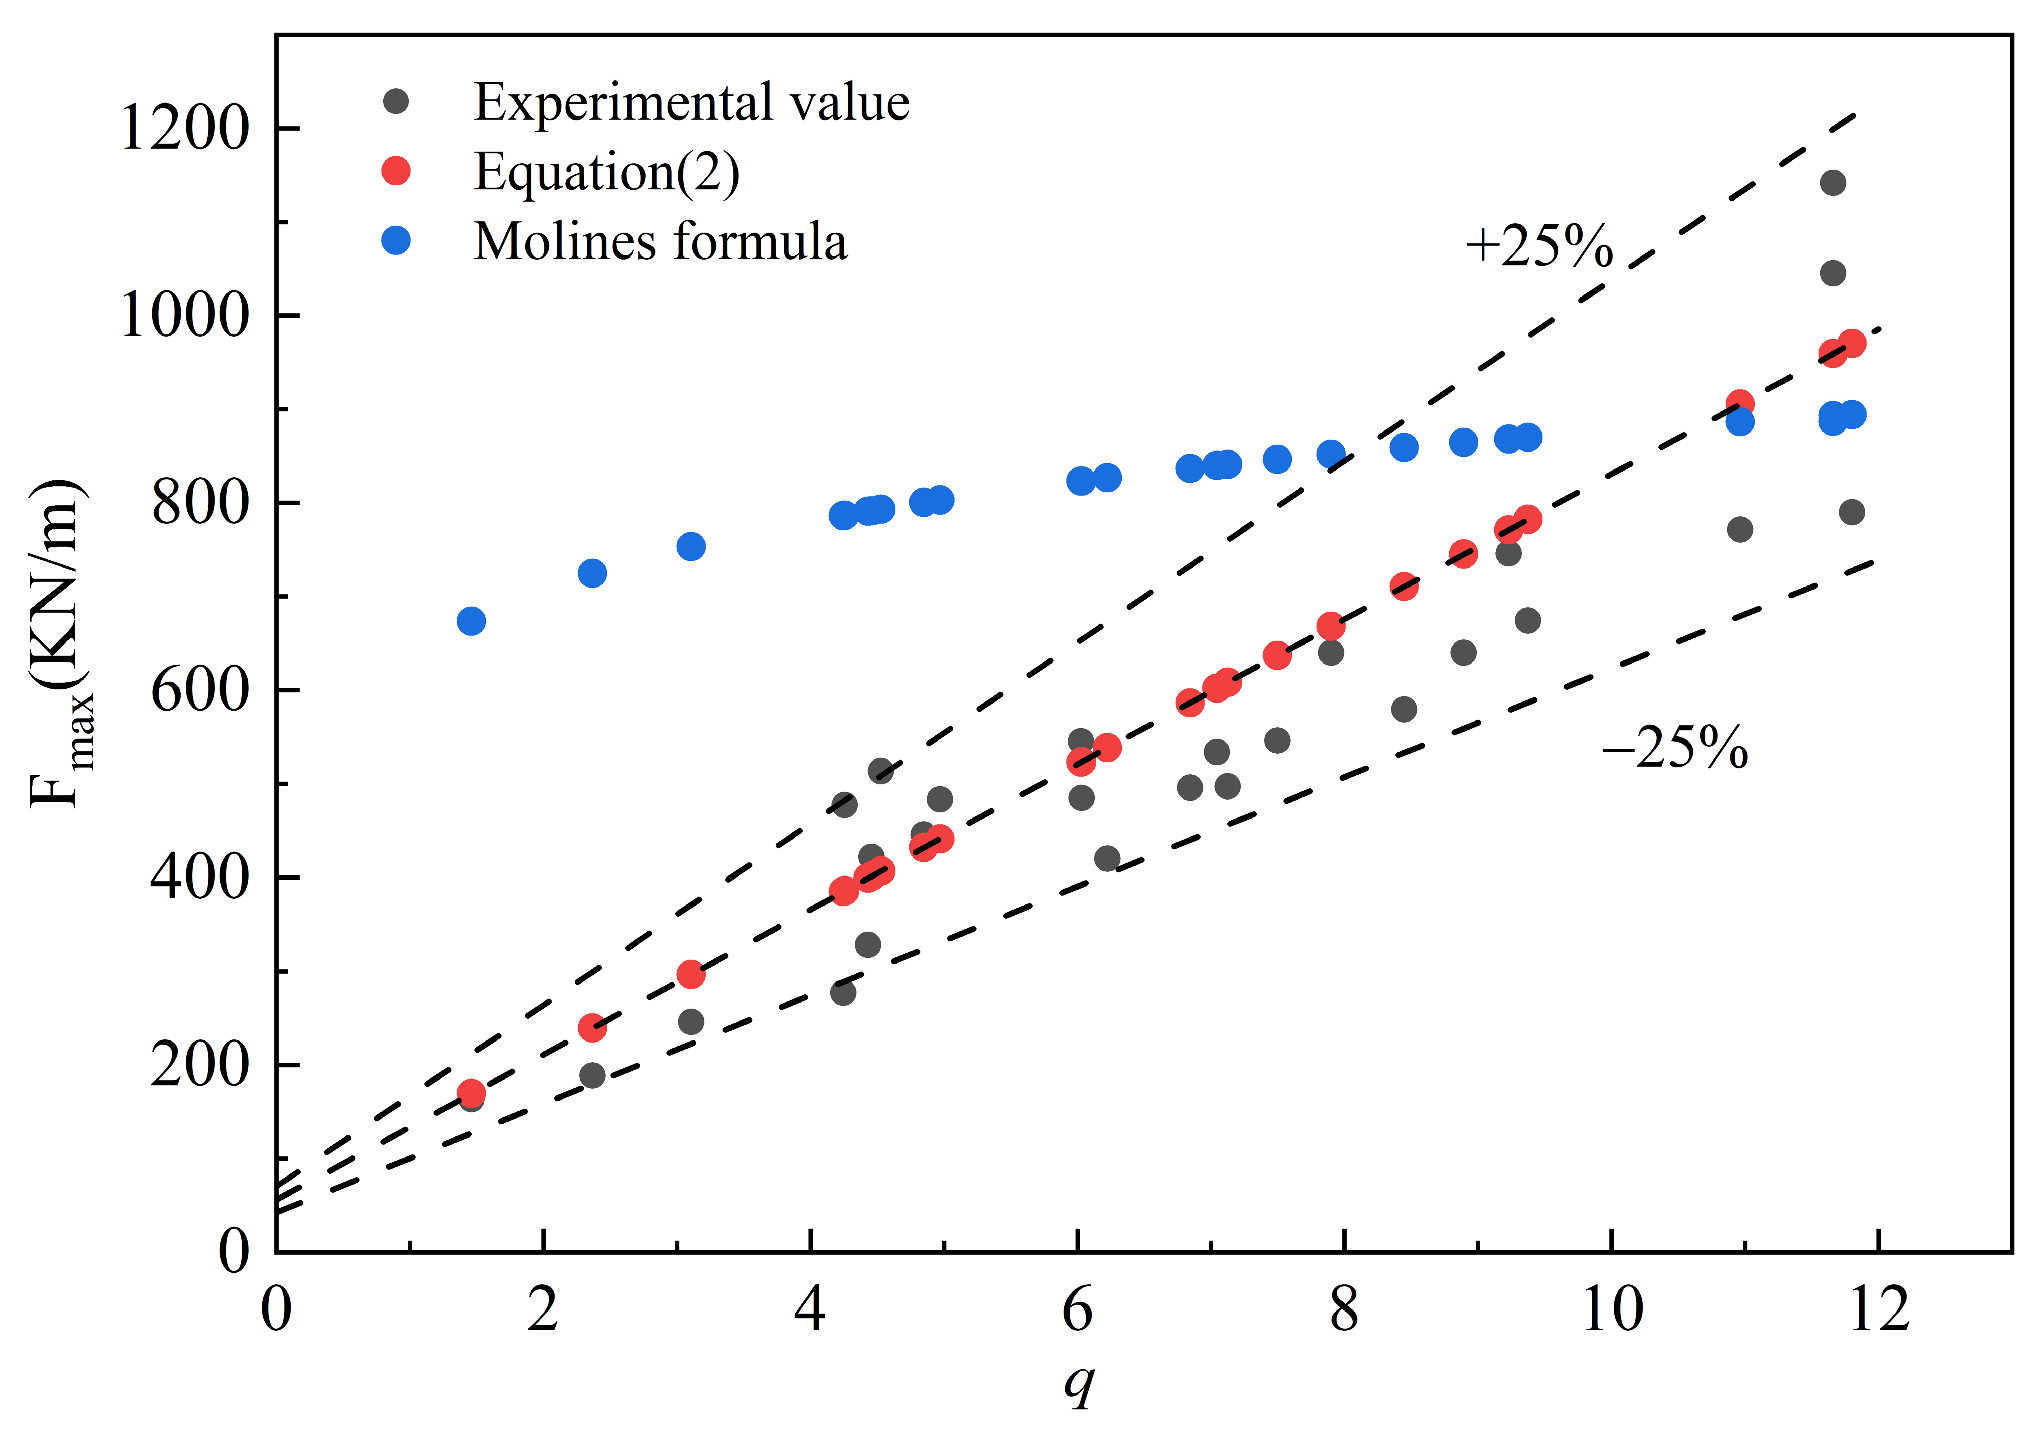
(4)
In coral reef terrains, there exists a linear relationship between the dimensionless mean wave overtopping volume and the dimensionless maximum wave force in revetment projects. The wave force on the seawall can be directly calculated using the overtopping volume, with the calculation formula being as follows: fmax = Fmax/ρgRc2 = 0.22( Q / g H i 3 ) + 0.16.
In the design of reef island revetment projects, the maximum wave force that the seawall can withstand is the most critical factor. However, measuring the wave force in actual projects is very challenging. This study found a strong linear relationship between the average wave overtopping volume and the maximum wave force on the seawall. This discovery provides a new perspective for engineering practice. Firstly, during the design phase of revetment structures, this linear relationship can be utilized to predict wave forces under different wave conditions, thereby optimizing the size and material selection of the structures. Secondly, during the maintenance and management phase of revetment structures, the magnitude of wave forces can be indirectly assessed by monitoring wave overtopping, which facilitates a more convenient and efficient evaluation of revetment stability, reduces costs, and promotes the sustainable development of coral reef revetment projects. Lastly, we will further explore the applicability and accuracy of this linear relationship in different sea areas and climatic conditions in future research, in order to advance its application in a wider range of fields.

Author Contributions

Conceptualization, J.H.; methodology, J.H.; validation, S.C., H.C. and Z.D.; formal analysis, J.H.; investigation, S.C.; resources, S.C.; data curation, Z.Q., Z.D. and Z.N.; writing—original draft preparation, J.H.; writing—review and editing, J.H.; supervision, H.C. and S.C.; project administration, H.C. and S.C.; funding acquisition, S.C. All authors have read and agreed to the published version of the manuscript.

Funding

This research was funded by China National Key R&D Program (2022YFE0113500, 2022RDC2012300), the National Natural Science Foundation of China (no. 52039005, no. 51861165102) and the Research Funds for the Central Universities (no. TKS20230103, no. TKS20240502).

Data Availability Statement

The data in the figures and tables used to support the findings of this study are included in the paper.

Acknowledgments

We are particularly grateful to Guoping Ji for assisting with the experiments.

Conflicts of Interest

The authors declare that they have no conflicts of interest.

References

  1. Pedersen, J. Wave Forces and Overtopping on Seawalls of Rubble Mound Breakwaters. Ph.D. Thesis, Aalborg Universitetsforlag, Aalborg, Denmark, 1996. [Google Scholar]
  2. Nrgaard, J.Q.H.; Andersen, T.L.; Burcharth, H.F. Wave loads on rubble mound breakwater seawalls in deep and shallow water wave conditions. Coast. Eng. 2013, 80, 137–147. [Google Scholar] [CrossRef]
  3. Goda, Y. Estimation of the rate of irregular wave overtopping of seawalls. Rep. Port Harb. Res. Inst. 1970, 9, 3–41. [Google Scholar]
  4. Cecioni, C.; Franco, L.; Bellotti, G. Wave forces on breakwater seawalls: Physical model tests and improvement of prediction. In Proceedings of the International Conference of Coastal Structures, Hannover, Germany, 29 September–2 October 2019. [Google Scholar]
  5. Han, X.; Dong, S. Interaction between medium-long period waves and smoothed mound breakwater with seawall based on experiments and multi-phase simulations. Ocean Eng. 2023, 279, 114576. [Google Scholar] [CrossRef]
  6. Molines, J.; Bayón, A.; Gómez-Martín, M.E.; Medina, J.R. Numerical study of wave forces on seawalls of mound breakwaters with parapets. J. Mar. Sci. 2020, 8, 276. [Google Scholar]
  7. Han, X.; Dong, S.J. Wave Force on the seawall of Rubble Mound Breakwaters at Intermediate Depths. J. Ocean Univ. China 2023, 22, 53–64. [Google Scholar] [CrossRef]
  8. Chen, S.; Chen, H.; Zhao, H.; Zheng, J.; Zhang, C. Experimental study on wave forces acting on seawalls over coral reef terrain in a large flume. J. Hohai Univ. (Nat. Sci.) 2019, 47, 65–70. (In Chinese) [Google Scholar]
  9. Meer, J.W.V.D.; Janssen, J.P.F.M. Wave run-up and wave overtopping at dikes. In Wave Forces on Inclined and Vertical Wall Structures; American Society of Civil Engineers: New York, NY, USA, 1995. [Google Scholar]
  10. Ward, D.L.; Ahrens, J.P. Overtopping Rates for Seawalls; Army Engineer Research and Development Center (ERDC): Vicksburg, MS, USA, 1992. [Google Scholar]
  11. JTS 145-2015; Hydrological Code for Port and Waterway Engineering. Ministry of Transport of the People’s Republic of China: Beijing, China, 2015. (In Chinese)
  12. Xia, Y.; Li, H.; Shen, R. Analysis and research on allowable overtopping criteria for port engineering. Ocean Eng. 2013, 31, 104–109. (In Chinese) [Google Scholar]
  13. Pillai, K.; Etemad-Shahidi, A.; Lemckert, C.J.C.E. Wave overtopping at berm breakwaters: Experimental study and development of prediction formula. Coast. Eng. 2017, 130, 85–102. [Google Scholar] [CrossRef]
  14. Molines, J.; Ripoll, E.; Gómez-Martín, M.E.; Medina, J.R. Individual Wave Overtopping Volumes on Mound Breakwaters. Phys. Model. Coast. Eng. Sci. 2024, 159, 103703. [Google Scholar] [CrossRef]
  15. Yoo, D.-H.; Lee, Y.-C.; Kim, D.-S.; Lee, K.-H. An Experimental Study on the Estimation Method of Overtopping Discharge at the Rubble Mound Breakwater Using Wave-Overtopping Height. J. Navig. Port Res. 2024, 48, 192–199. [Google Scholar]
  16. Chen, S.; Wang, Z.; Zhang, C.; Chen, H.; Zheng, J. Experimental Study on Overtopping of Vertical Breakwaters over Coral Reef Terrain in a Large Flume. Chin. Sci. Bull. 2019, 64, 10. (In Chinese) [Google Scholar] [CrossRef]
  17. Miyaguni, T.; Matayoshi, S.; Nakaza, E.; Uza, T. Wave overtopping rate of a sea-wall on coral reef flat. Jpn. Soc. Civ. Eng. 2010, 24, 951–956. [Google Scholar]
  18. Molines, J.; Herrera, M.P.; Medina, J.R. Estimations of wave forces on seawalls based on wave overtopping rates. Coast. Eng. 2018, 132, 50–62. [Google Scholar] [CrossRef]
  19. Formentin, S.M.; Palma, G.; Zanuttigh, B.J.C.E. Integrated assessment of the hydraulic and structural performance of seawalls on top of smooth berms. Coast. Eng. 2021, 168, 103951. [Google Scholar] [CrossRef]
  20. Li, Y.; Zhang, C.; Song, J.; Chi, S.; Zhao, S.; Qi, H.; Shi, J. Tide-modulated wave characteristics and breaking regimes in the intertidal zone of a dissipative beach. Ocean Eng. 2022, 266, 113055. [Google Scholar] [CrossRef]
  21. Li, Y.; Zhang, C.; Zhao, S.; Qi, H.; Cai, F.; Zheng, J.J. Equilibrium configurations of sandy-muddy transitional beaches on South China coasts: Role of waves in formation of sand-mud transition boundary. Coast. Eng. 2024, 187, 104401. [Google Scholar] [CrossRef]
Figure 1. Wave flume (68 m × 1 m × 1.5 m).
Sustainability 16 09939 g001
Figure 2. Schematic diagram of revetment project structure (unit: m).
Sustainability 16 09939 g002
Figure 3. Experimental arrangement (unit: m).
Sustainability 16 09939 g003
Figure 4. Pressure sensor layout diagram (unit: cm).
Sustainability 16 09939 g004
Figure 5. Average overtopping amount at location 1 of the revetment project at freeboard heights of (a) 9 m; (b) 7.5 m; and (c) 6 m.
Sustainability 16 09939 g005
Figure 6. Average overtopping amount at location 2 of the revetment project at freeboard heights of (a) 9 m; (b) 7.5 m; and (c) 6 m.
Sustainability 16 09939 g006
Figure 7. The influence of freeboard height on the average overtopping amount of revetment project.
Sustainability 16 09939 g007
Figure 8. The influence of revetment project location on the average overtopping amount.
Sustainability 16 09939 g008
Figure 9. The impact of wave steepness on the dimensionless average overtopping volume (a) Rc = 9 m; (b) Rc = 6 m.
Sustainability 16 09939 g009
Figure 10. Effect of relative freeboard height on the dimensionless average overtopping volume (a) S = 75 m; (b) T = 17.43 s.
Sustainability 16 09939 g010
Figure 11. Time series of wave pressure changes.
Sustainability 16 09939 g011
Figure 12. The effect of wave height on wave pressure.
Sustainability 16 09939 g012
Figure 13. The effect of wave period on wave pressure.
Sustainability 16 09939 g013
Figure 14. The effect of freeboard height on wave pressure.
Sustainability 16 09939 g014
Figure 15. The effect of the revetment project location on wave pressure.
Sustainability 16 09939 g015
Figure 16. Relationship between dimensionless average wave overtopping volume and dimensionless wave force.
Sustainability 16 09939 g016aSustainability 16 09939 g016b
Figure 17. Comparison figure of Equation (2), Molines’ formula and experimental values.
Sustainability 16 09939 g017
Table 1. Testing conditions.
Reef Flat Water Depth
h/m
Freeboard Height
Rc/m
Distance Between Revetment Project and Reef Edge S/mWave TypeSignificant Wave Height
Hi/m
Average Period
T/s
0
1.5
3
9
7.5
6
75
150
225
300
Irregular waves
(JONSWAP spectrum)
4.5
6
7.5
9
10.5
12
11.62
13.56
15.49
17.43
Note: Rc (freeboard height) is the height from the top of the seawall of the revetment project to the water surface of the reef flat; S is the distance from the front edge of the seawall in the revetment project to the reef edge; Hi is the significant wave height of the incident waves; T is the average period of the incident waves.
Disclaimer/Publisher’s Note: The statements, opinions and data contained in all publications are solely those of the individual author(s) and contributor(s) and not of MDPI and/or the editor(s). MDPI and/or the editor(s) disclaim responsibility for any injury to people or property resulting from any ideas, methods, instructions or products referred to in the content.

