Article

Evaluation of the Effects of Rainwater Infiltration on Slope Instability Mechanisms

by
Bruna Silveira Lira
1,*,
Olavo Francisco dos Santos Junior
2,
Osvaldo de Freitas Neto
2 and
Maria Natália de Melo Sousa
3
1
Department of Water Resources, Geotechnics and Environmental Sanitation, Technology Center, Federal University of Piauí, Campus Universitário Ministro Petrônio Portella, Av. Universitária, Teresina 64049-550, PI, Brazil
2
Department of Civil and Environmental Engineering, Center for Technology, Federal University of Rio Grande do Norte, Av. Senador Salgado Filho, 300, Natal 59078-970, RN, Brazil
3
School of Engineering, Maringa Higher Education Center (UniCesumar), Av. Pernambuco, 146, Petrolina 56306-425, PE, Brazil
*
Author to whom correspondence should be addressed.
Sustainability 2024, 16(21), 9530; https://doi.org/10.3390/su16219530
Submission received: 18 September 2024 / Revised: 28 October 2024 / Accepted: 29 October 2024 / Published: 1 November 2024
(This article belongs to the Special Issue Environmental Protection and Sustainable Ecological Engineering)

Abstract

:
Mass movements can be caused by factors from different categories, such as geological factors and climate change. From a geological point of view, the soil profile and the geotechnical properties of the materials are crucial in influencing slope instability. From a climate change perspective, rainfall intensity is one of the main triggers of mass movements. Studies related to rainfall infiltration focus on saturated slope zones; therefore, areas of slope stability with infiltration in the unsaturated zone present large gaps. The Brazilian government environmental diagnostics company, the Mineral Resources Research Company (CPRM), identified the municipality of Areia/PB as a danger zone. The region has landslides that occur mostly during the rainy season. Such events lead to the presumption that rainwater infiltration is responsible for the failure of the municipality’s slopes. Thus, the studies proposed in this research aim to determine the influence of precipitation on the stability of the slopes present in the region. The results show that antecedent precipitation has a greater influence on stability, indicating that daily precipitation alone cannot be used as a determinant for landslides. It was concluded that the role of precipitation in slope stability will vary for different locations, with varying surface conditions, variable tropical rainfall, or different microclimatic conditions.

1. Introduction

In the last 20 years, the number of environmental disasters increased due to the intensification of geodynamic, hydrometeorological, and climatic events in many regions or due to the increase in the population living in risk areas [1].
Variations in rainfall affect the infiltration behavior of water into the soil and cause changes in the moisture content of slopes [2]. An increase in soil moisture content on slopes generally leads to an increase in soil weight and decreases in effective stress and soil shear strength, which results in slope vulnerability and possible instability [3]. Most studies [4,5,6] related to rainwater infiltration focus on saturated slope zones, but areas of slope stability with infiltration in the unsaturated zone present large gaps. Due to the complexity of the problems, there is still difficulty in quantifying the effect of rainwater infiltration on slope stability when the slope is unsaturated.
According to [7], the distribution of pore pressure in the unsaturated zone is more complex than in the saturated zone. In the saturated zone, the distribution of pore pressure follows a linear relationship, while in the unsaturated zone, the pore water pressures are lower than the air pressure (negative pressure).
According to [8], the uncertainties associated with negative pressure derive from several factors; thus, the variability of the soil–water characteristic curve that shows the relationship between soil, air, and water pressures can result from different measurement techniques, the number of data points, the measured suction range, and the best-fit equation selected for the regression analysis. In addition, the soil–water characteristic curve can vary with different initial saturated water contents or initial void ratios [2]. All these factors, which can lead to variability in the soil–water characteristic curve, can also result in uncertainty in the estimated shear strength of the unsaturated soil.
Most studies (4; 5; and 6) related to infiltration focus on saturated slope zones, but areas of slope stability with infiltration in the unsaturated zone present large gaps. Due to the complexity of the problem, it is still difficult to quantify the effect of rainwater infiltration on slope stability when in an unsaturated state.
The municipality of Areia, located in the Northeast region of Brazil, has residual soils in its geology, known for having unsaturated characteristics in its macrostructure [9] and presents high-risk areas for landslides in urban areas. The Mineral Resources Research Company (CPRM) identified the risk areas in 2015 and the National Institute of Meteorology (INMET) included the municipality as a danger zone for flooding, landslides, and river overflows due to rain in 2017.
The rugged terrain, with deep and narrow dissected valleys of the municipality, presents landslides triggered by different factors [10]. It is believed that the lack of appropriate analysis of the slope stability of rain-induced landslides played an adverse role in aggravating the problem in the area.
Changes in precipitation due to climate variation and increased urbanization with occupation of hillside areas resulted in the emergence of areas with a risk of landslides in the municipality, representing a danger to the population and infrastructure of the city. Understanding the role of rainfall in the development of mass movements and the rupture mechanisms that occur in the area can result in the reduction in social and economic losses that the municipality experiences as a result of slope instability.
Several studies have been carried out on landslides in urban areas in Brazil, such as those by [11,12,13]. In the Northeast, authors such as [14,15,16,17] carried out studies on the subject in Pernambuco, Alagoas, Bahia, and Rio Grande do Norte, respectively. However, in the literature researched, there is no record of studies that perform the geotechnical characterization and analysis of slope stability combined with the analysis of water infiltration in the municipality of Areia in the state of Paraíba. The importance of the study is to investigate the effect and extent of rainfall in causing landslides in the area and to determine the safety factor before and after the rain, since infiltration can decrease the matric suction and increase the groundwater level of the study area.
Based on the knowledge gaps identified, the main issue can be broken down into the following questions: How do different intensities and durations of rain affect local slopes? What are the effects of rainwater infiltration on the mechanisms of slope instability in the region? What are the possible safety factors for locations with potential risk of landslides during rain events?
The questions pose the following possible hypotheses of this study: rain infiltration at the site leads to the development of positive pore pressure or decreased suction on the surface of the slopes capable of causing their rupture; the stability of the area is related to the available negative pore pressure and the stability analysis can allow municipal authorities and institutions to implement effective preventive measures.
Therefore, the studies proposed in this research aim to determine the influence of precipitation on the stability of two slopes present in the region.

2. Materials and Methods
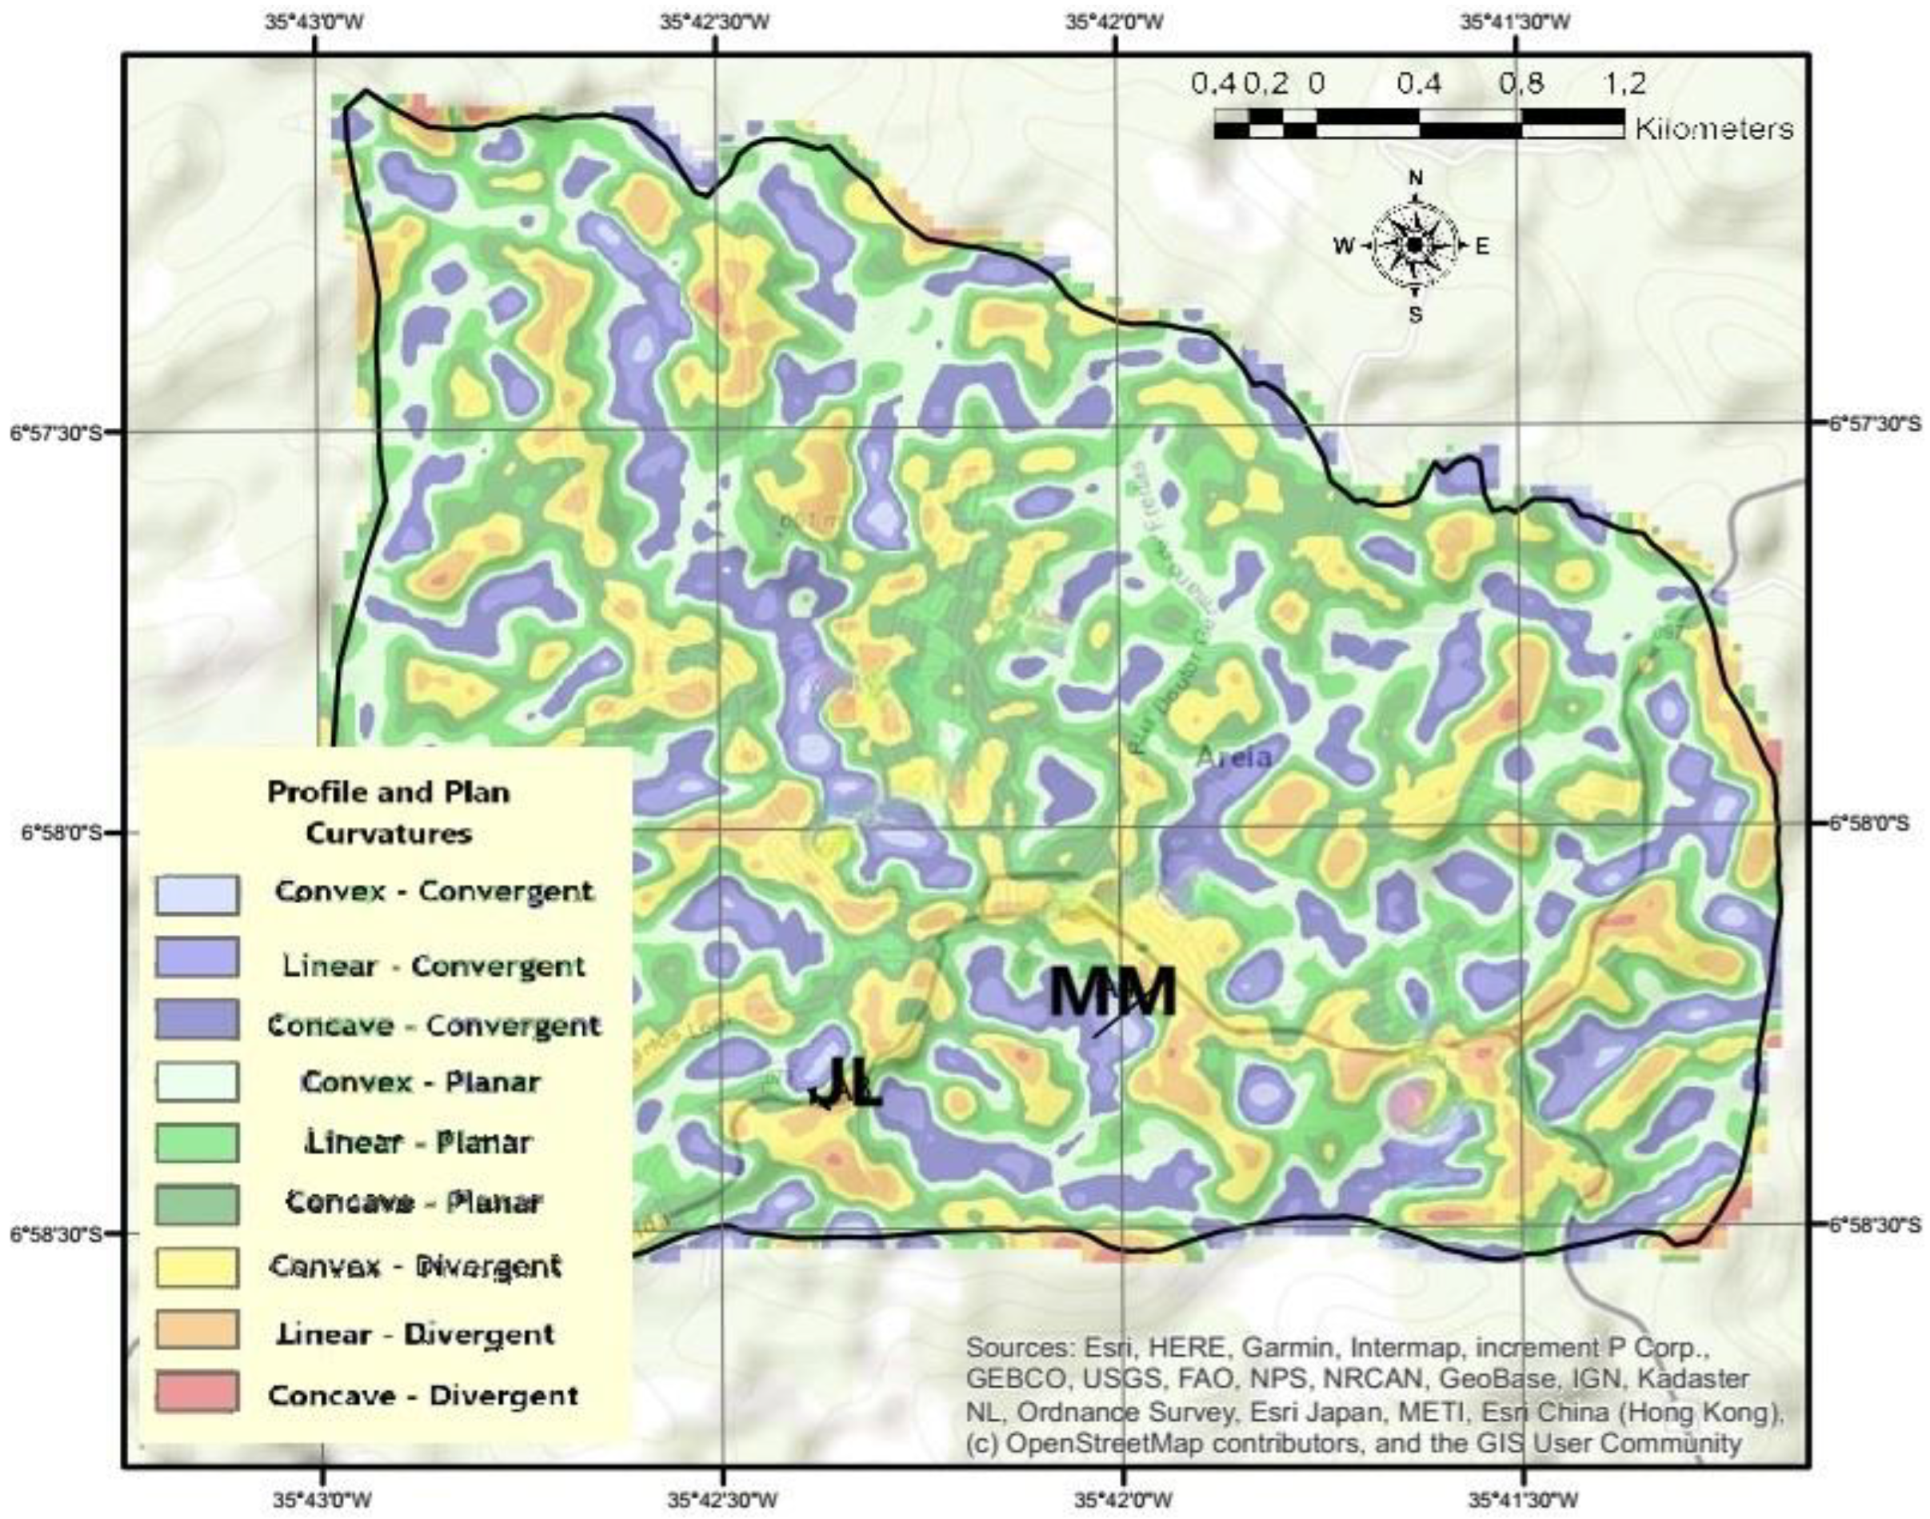
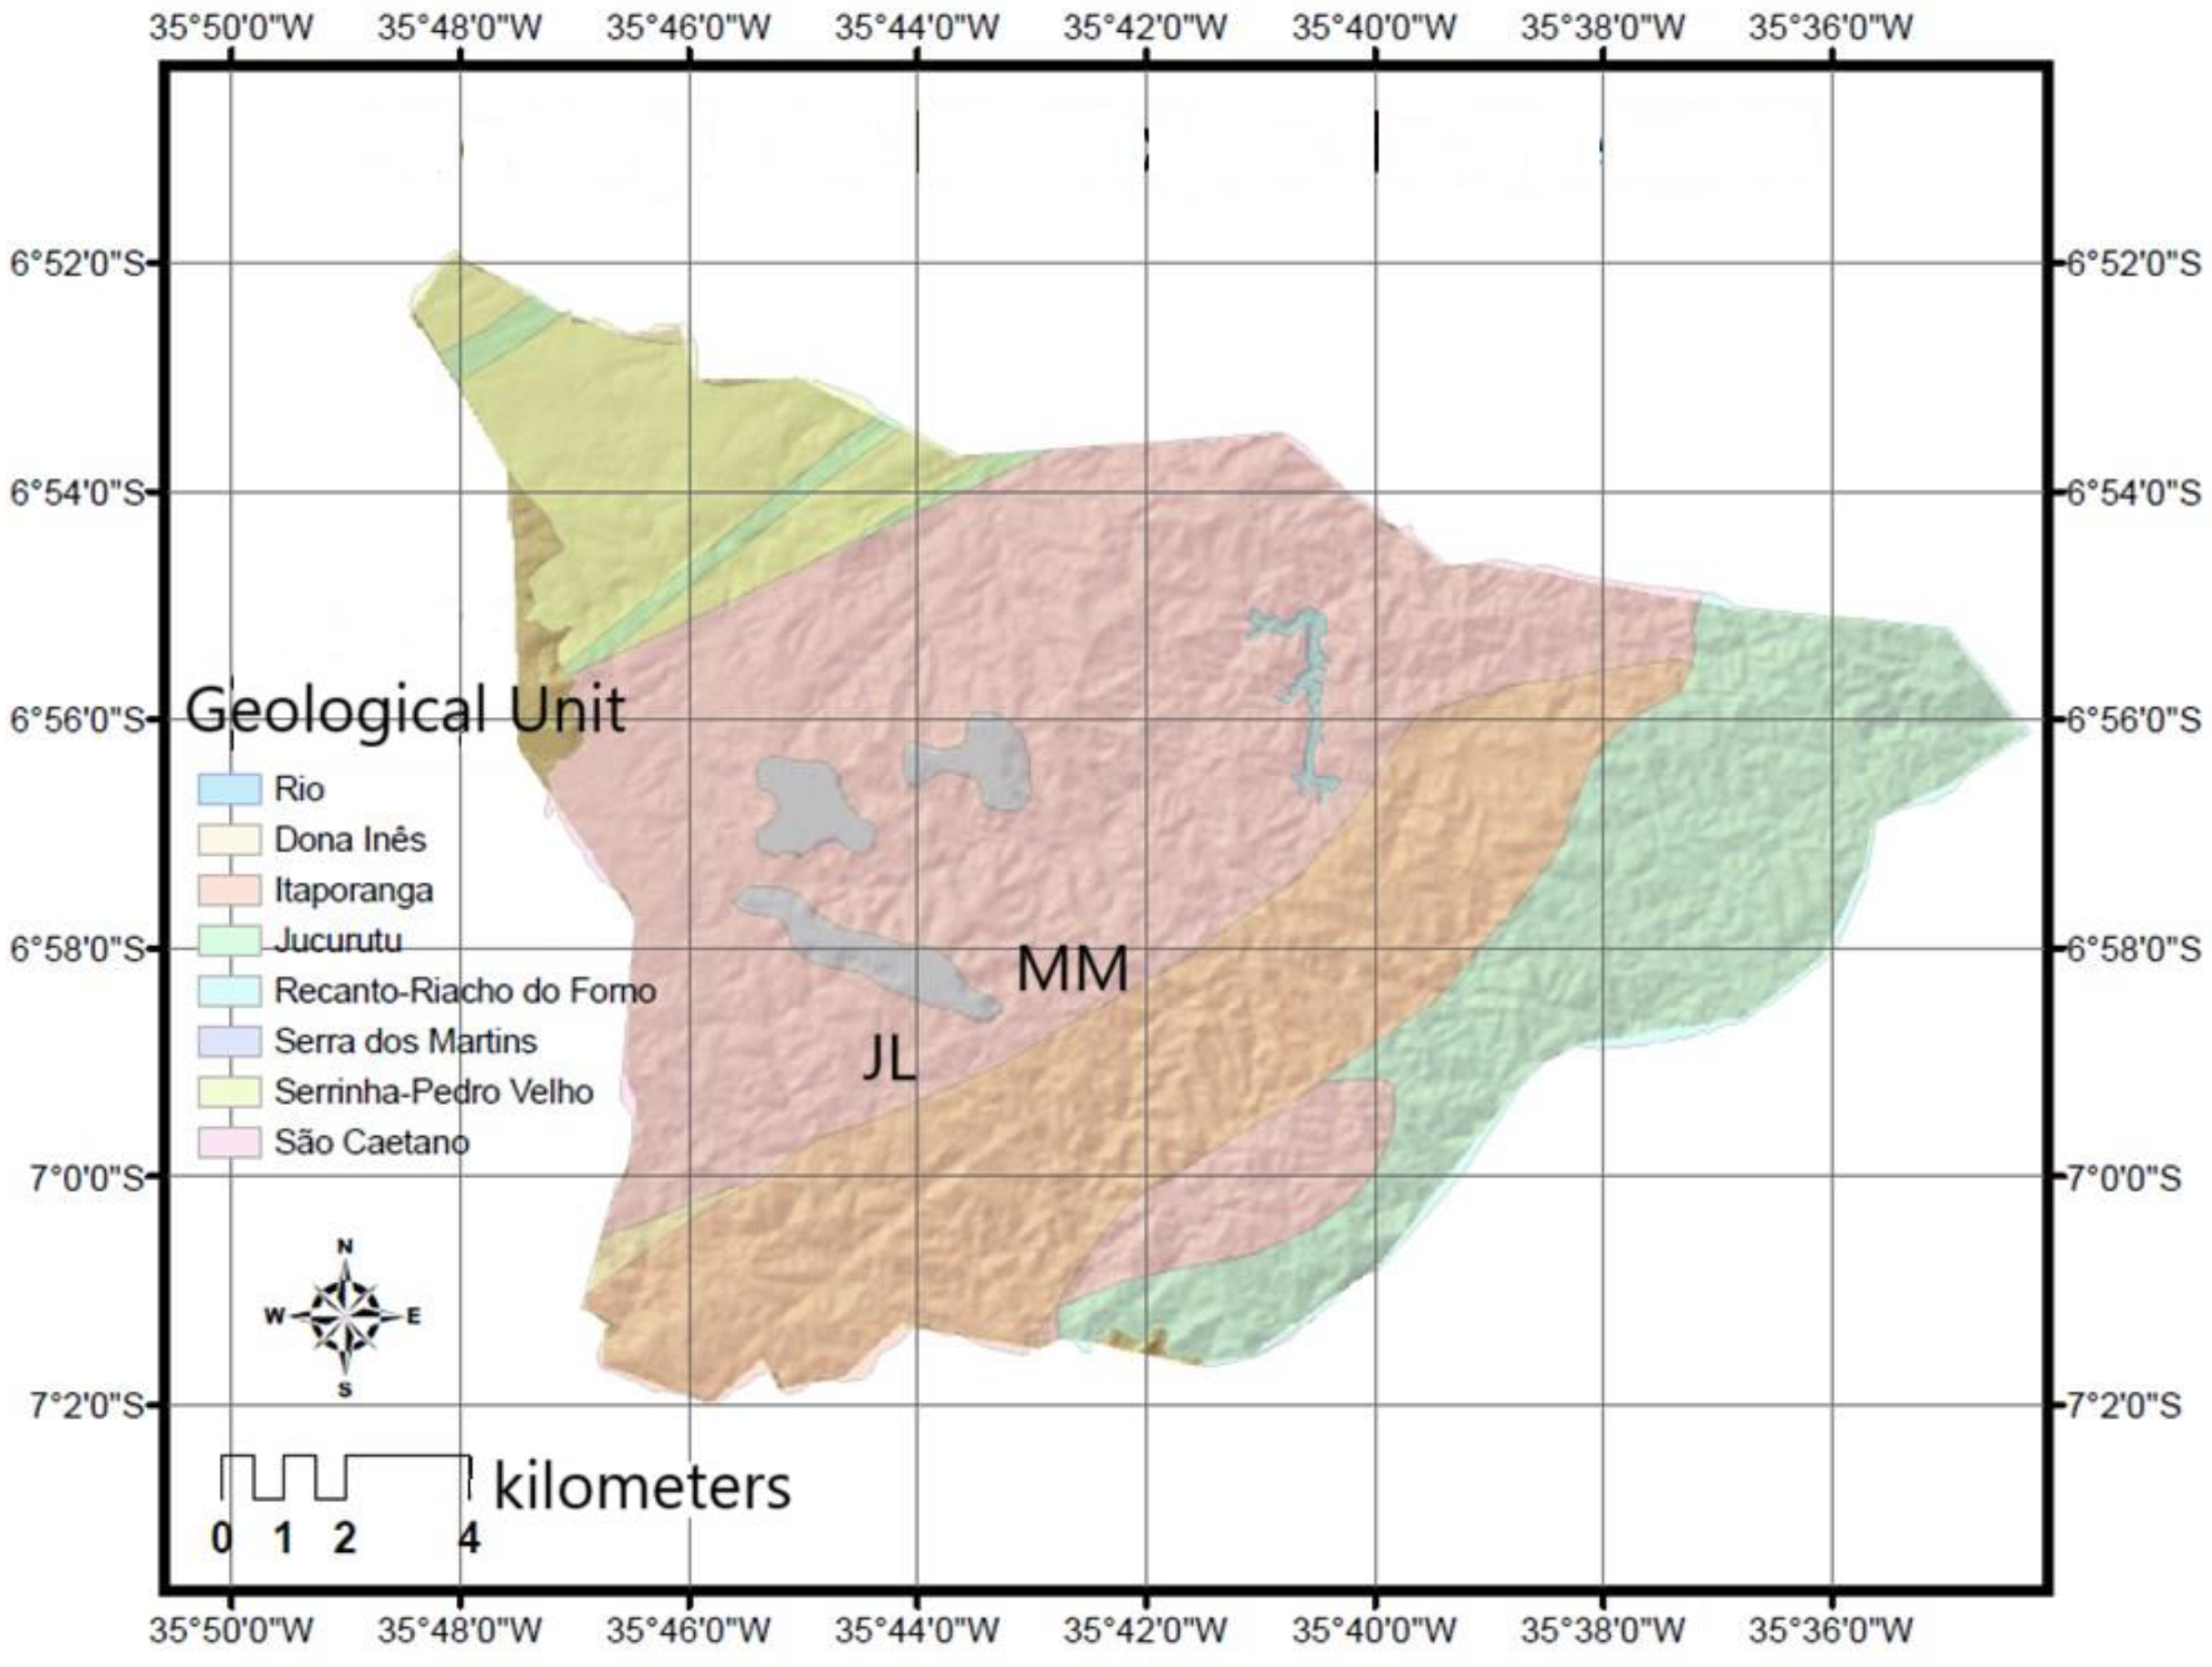
2.1. Study Area

The study was carried out in two areas (MM and JL) located in the municipality of Areia in the state of Paraiba, Brazil (Figure 1) that were considered at risk in a report published by the Brazilian government’s environmental diagnosticagency, Companhia de Pesquisa de Recursos Minerais (CPRM) [18]. An analysis of the geomorphometric characteristics of the areas was carried out to verify the influence of the curvature of the terrain on the stability of the sites when subjected to precipitation.
The selection of the MM and JL areas was based on the comparison between the mapping of areas with high risk potential made by the CPRM and thematic maps prepared with the geomorphometric variables (slope, vertical and horizontal curvature, terrain shape, and altitude) of the municipality.
The maps were created with the geomorphometric variables of the municipality from remote sensing data. The extraction of the geomorphometric parameters was accomplished through digital elevation models (DEMs) produced by the shuttle radar topography mission (SRTM) of the TOPODATA (Geomorphometric Database of Brazil) project. The processing of the digital elevation models and data analysis was accomplished using QGIS software version 3.16.
To analyze the studied areas, their proximity to the urban center of the municipality was observed, where the occurrence of mass movements would cause risks to the safety of people and property. Ref. [19] defines risk as the relationship between the probability of an instability phenomenon occurring and the magnitude of social and/or economic damage to a given group or community.
Since the emergence of mass movements is largely linked to the steepness of the slope in geomorphological environments and very steep slopes are more prone to instability [20], areas with slopes in the order of 45 to 75% were observed based on the slope map. While the curvature map allowed the analysis of the terrain shapes of the areas to verify the influence of the curvature of the terrain on the instability of the site when subjected to precipitation.
The comparison made between the CPRM studies and the analysis of the shape of the areas presented by the thematic maps distinguished two locations (MM and JL) as study areas.
The municipality has a gently undulating to strongly undulating relief (8–45%) across almost its entire length, consisting of a set of hills and mounds, with some areas presenting mountainous reliefs (>45%). The studied areas (Figure 2) present mountainous reliefs with slopes above 45%. The curvature along the slope is characterized by concave–convergent shapes for area MM and rectilinear–planar shapes for area JL (Figure 3). Tendencies towards concentration of surface runoff are observed in the concave portions of the slopes. Considering that water flows increase and concentrate downslope, the increase in water flow enhances the transport of dendritic material, favoring soil shearing, and resulting in the removal and displacement of surface soil particles [21]. A convergent flow trend was observed in the MM area with consequent accumulation of sediments. This characteristic favors mass movement, since the slopes of concentrated flows (convergent) tend to transport larger particles than those moved by diffuse laminar flow (divergent) [22].
The studied areas are located in the São Caetano Complex (MP3sc) geological unit. The São Caetano Complex is the most representative geological unit in the municipality (Figure 4), corresponding to the gneissic (NP1sca) and schistose (NP1scax) units, with the former predominating. The soil of the São Caetano Complex presents metasedimentary and metavolconoclastic sequences. According to [23], metasedimentary rocks are metamorphic rocks that originate from a sedimentary rock, while metavolconoclastic rocks are metamorphic rocks that originate from a volcanic rock composed of fragments or clasts of minerals and pre-existing rocks. According to [24], the São Caetano Complex presents an E-W/NE-SW direction due to the strong structural control of the shear zones. The unit is characterized by medium to fine grain size and gradations to homogeneous biotite gneiss, with easy rupture in planes parallel to the foliation [25].
According to the Brazilian Soil Classification System of the Brazilian Agricultural Research Agency(EMPRAPA), the Municipality of Areia-PB has four pedological classes (Figure 5) represented by Eutrophic Red Argisols, Dystrophic Yellow Latosols, Eutrophic Regolithic Neosols, and Dystrophic Regolithic Neosols. The studied areas are in the Eutrophic Red Argisols class, which have a surface horizon of medium or sandy texture and a subsurface horizon of medium or clayey texture of type B textural (subsurface horizon with higher clay content). The soil is associated with the clay fraction of low activity, or high activity if connected to low base saturation (incomplete action of the ferralitization process) or with an alytic character (aluminum saturation ≥ 50%) [25]. The clay minerals of greatest expressivity in Argisols are iron oxides (goethite and hematite) and kaolinite. According to [26], the kaolinite present in the soils contributes to a greater densification of the structure by presenting particles with a laminar shape that allows their face-to-face adjustment.

2.2. Materials

The parametric analysis of this study takes into account the Brazilian National Standards Organization (ABNT) for physical characterization [27,28,29,30,31]. In this sense, two areas were analyzed, each composed of three layers with different soils: top (MMT and JLT), center (MMC and JLC), and base (MMB and JLB). The basic physical properties and the granulometric distribution of the soil particles are presented in Table 1. The soils were classified as low compressibility silt according to the Unified Classification System, with the exception of the MMT soil, which was classified as a silty sand.
The soil shear strength was evaluated by means of consolidated and undrained triaxial tests based on the ASTM standard [32]. The strength envelopes were determined from the tests carried out under confining stresses of 50 kPa, 100 kPa, 200 kPa, and 300 kPa. The cohesive intercept and friction angle of the soils obtained from the tests and used for the computational modeling are presented in Table 2.
An observation can be made regarding the abrupt reduction in the cohesive intercept from the MMT soil to the MMC soil. The low cohesive intercept of the MMC soil may be the result of a high degree of soil leaching, since the slope has gutters that pass through its center for the drainage of rainwater.

2.3. Simulation of the Rain Infiltration
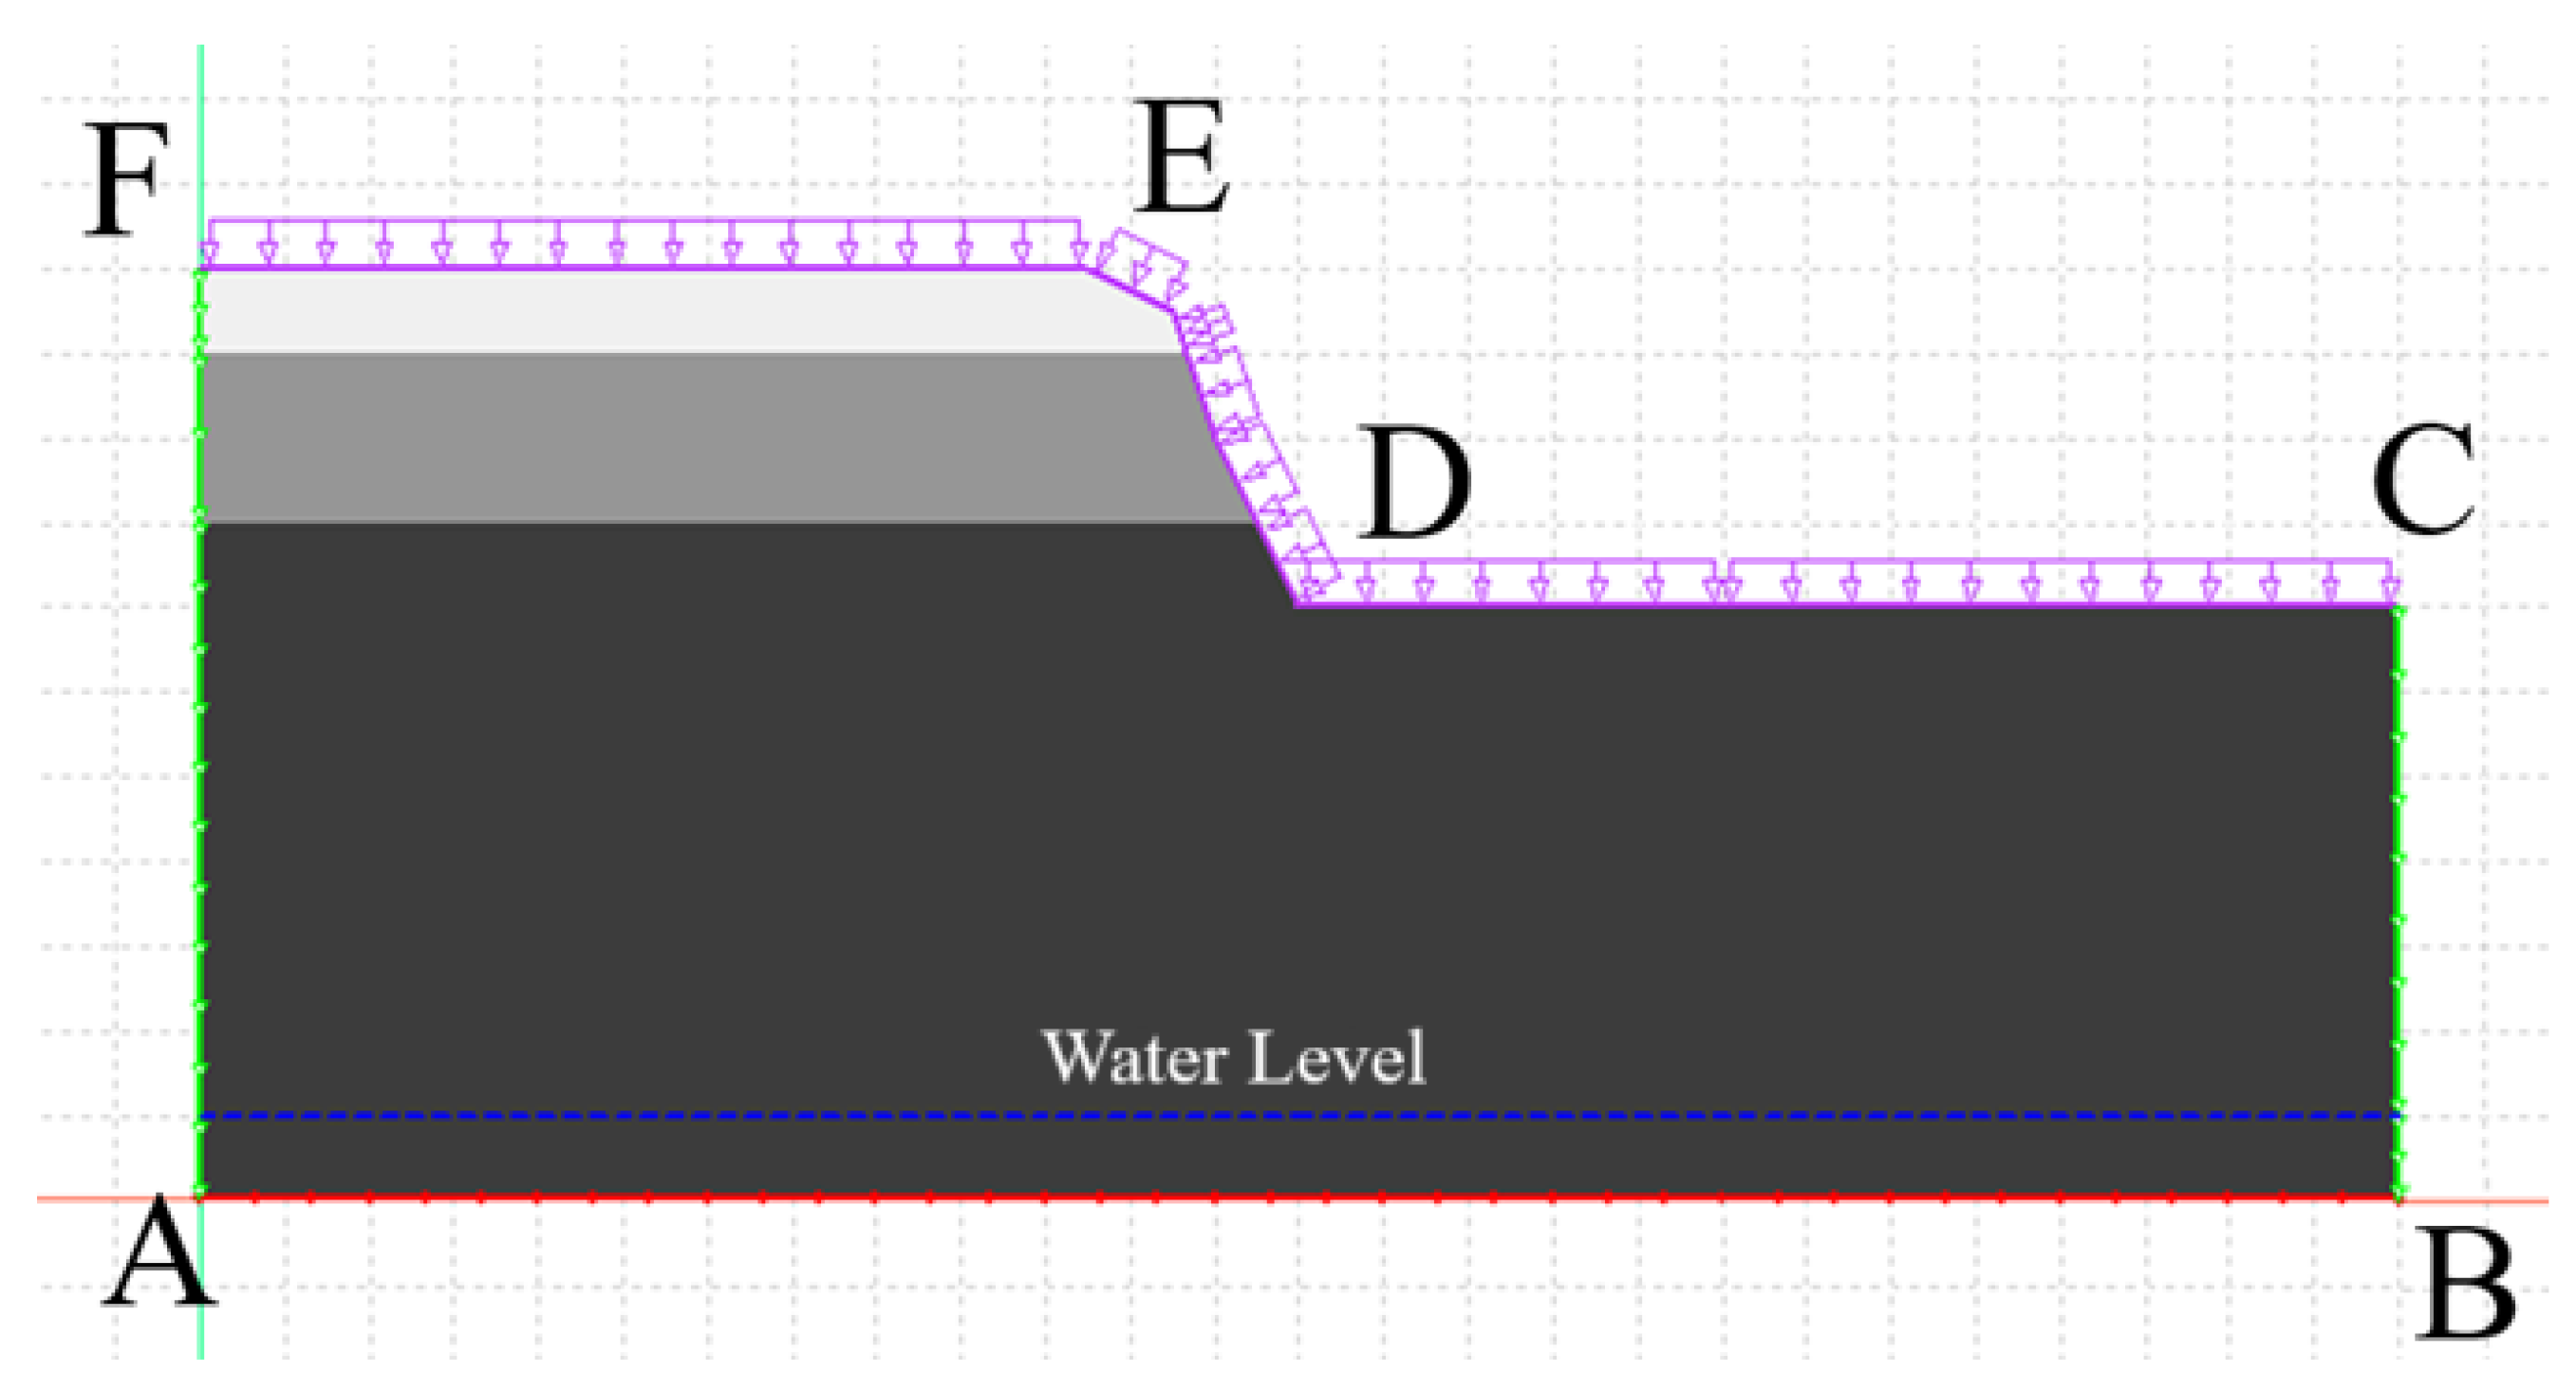
The simulation of rain infiltration was performed using the SEEP/W program version 11.3.0.23668 from the software company GeoSlope International Ltd. Located in Calgary, Canada, which simulates the movement of water or water vapor through saturated and unsaturated porous media. The water flow simulations were performed with transient flow in the soil, taking into account the pore pressures and soil parameters obtained through laboratory tests [33] and the soil retention curve (Figure 6). By performing the suction test using the filter paper method, the water retention curves of the soils on both slopes were obtained. These curves were constructed by the relationship between the matric suction (ψ) versus the gravimetric soil moisture content (w) and fitted by the Fredlund and Xing (FX) model.
SEEP/W allows the determination of the capacity of a porous medium to store and transmit water. Water storage capacity defines the change in stored water mass in response to varying pore water pressure (Equation (1)) and the hydraulic conductivity function describes the capacity of a soil to transmit water in response to energy gradients (Equation (2)).
M w = ( ρ w θ w ) t d x d y d z
m w = ρ w q w d x d z = K w ( u w y + ρ w g y y ) g d x d z
where ρw is the density of water, θw is the water content, qw is the water flow, Kw is the hydraulic conductivity, and g is the acceleration of gravity.
In SEEP/W for saturated and unsaturated media, the water content function characterizes the stored water volumes as a function of the matric suction (φ), which is equivalent to the negative pore pressure if the air pressure is assumed to be zero [34]. The hydraulic conductivity is a function of the volumetric water content and, therefore, indirectly, a function of the pore water pressure. The program estimates the water content function through the modified Kovacs model developed by [35]. The model requires particle size data, including the diameter corresponding to 10% and 60% passing through the grain size curve (i.e., D10 and D60), and the liquid limit. The hydraulic conductivity function is estimated from the results obtained for the saturated hydraulic conductivity and the water retention curve, using the equation proposed by [35] (Equation (3)).
K w φ = K s a t { 1 ( a φ ) n 1   [ 1 + ( a φ ) n   ] m } 2 [ 1 + ( a φ )   n ] m 2
where a′, n, and m are curve-fitting parameters that control the shape of the water content function.
The parametric analysis of this study takes into account the properties of the materials, the intensity of the rain, and the previous moisture condition. In this sense, two areas were analyzed, each composed of three layers with different soils. The analyses covered three scenarios that take into account the effect of the intensity of the rain and the properties of the soil on the safety factor, two scenarios for different durations of the rain intensities, and three more scenarios that incorporate the effect of previous moisture conditions on the stability.
SEEP/W can simulate soil–vegetation–atmosphere transfers across the ground surface using the land–climate interaction (LCI) boundary condition. The LCI boundary condition can be used to compute the water balance and net percolation and simulate real field conditions.
The water flux at the ground surface can be calculated with the mass balance equation (Equation (4)).
q p + q M c o s α + q E + q R = q I
where superscripts on the water fluxes (q) indicate rainfall (P), snow melt (M), infiltration (I), evaporation (E), and runoff (R), and α is the slope angle.
Inputs for the land–climate interaction boundary condition are air temperature, precipitation flux, relative humidity, wind speed, and net radiation, which were made available by the Brazilian government’s environmental diagnostic company, Companhia de Pesquisa de Recursos Minerais (CPRM).

Boundary Conditions

The boundary conditions for the seepage model were defined as shown in Figure 7. The lateral boundaries FA and CB were defined as no-flow boundary conditions. The lower boundary AB was specified as a constant boundary condition with a value equal to the groundwater level and the upper boundary FEDC was specified as a flow condition that varies with various rainfall intensities and durations.
Simulations were performed for rainfall events of 8 mm/h, 4 mm/h, and 2 mm/h with durations of 24 and 72 h each. Flooding was not allowed at the soil surface (FEDC). This meant that when a flux greater than the soil permeability was applied to the upper limit, the infiltration model would not allow pore pressures at the soil surface to increase more than 0 kPa. This simulated real field conditions where excess rainfall at the soil surface is removed from the slope as runoff.
To determine the influence of precipitation prior to the rain event, steady-state and transient conditions were analyzed. The steady-state condition was used to understand what the long-term flow conditions on the slope would be. Therefore, the steady-state solution was used to determine the initial hydrostatic condition of the area.
In the steady state analysis, a constant flow of 458 mm/month was applied based on the largest accumulation of rainfall observed within the historical municipality of Areia in the last 20 years. The historical rainfall data for the location were obtained by the Executive Agency for Water Management of the State of Paraiba.
From the hydrostatic condition results obtained from the steady-state analysis, a first transient analysis was performed with a constant flow of 15 mm/day for 5 days to simulate the precipitation preceding the main rain event. Studies by [36,37,38,39] show that preceding rainfall of 5 days appears to be sufficient to cause landslides.
A second transient analysis was performed using the results of the first one, applying rainfalls of 8 mm/h, 4 mm/h, and 2 mm/h with durations of 24 and 72 h each. These results were used to study how infiltration varied over time in relation to the rainfall applied.

2.4. Stability Analysis

The SLOPE/W program version 11.3.0.23668 from the software company GeoSlope International Ltd. located in Calgary, Canadawas used to perform the stability analyses using the method of [40]. The stability analyses were performed by importing the pore pressure distributions obtained from the infiltration analyses and the results obtained through laboratory tests.
Soil suction or negative water pressures have the effect of adding strength to the soil. The SLOPE/W program offers two ways of modeling the increase in shear strength due to soil suction:
  • Using a constant parameter φb.
  • Using a function of volumetric water content.
In SLOPE/W, φb is treated as a constant value, but in reality, this parameter varies with the degree of saturation. In the capillary zone where the soil is saturated but the pore water pressure is under tension, φb is equal to the friction angle φ′. As the soil desaturates, φb decreases. The decrease in φb is a reflection of the fact that the negative pore water pressure acts over a smaller area. More specifically, φb is related to the soil water characteristic curve. As a better alternative to using φb to model the increase in shear strength due to soil suction, the estimation Equation (5) proposed by [41] is implemented in SLOPE/W:
s = c + σ n u a t a n ϕ + u a u w [ θ w θ r θ s θ r t a n ϕ ]
where θw is the volumetric water content, θs is the volumetric saturated water content, and θr is the residual volumetric water content.
Thus, for the stability analysis in SLOPE/W, the volumetric water content function was specified to be used in the calculation of the suction force based on Equation (5) and the residual volumetric water content at which the suction force becomes zero (Ɵr) to be used in the calculation of unsaturated shear strength.
The SLOPE/W program allows deterministic analysis by means of analytical methods based on the comparison of forces, moments, or stresses that resist the movement of the mass with those that can cause unstable movement (acting forces). The result of the analysis is a factor of safety, defined as the ratio of the shear strength (or, alternatively, an equivalent measure of shear strength or capacity) to the shear stress (or other equivalent measure) required for equilibrium. If the value of the factor of safety is less than 1.0, the slope is unstable. In the deterministic analysis, each parameter is considered as constant in the analysis, disregarding the natural variability of the material characteristics.
The Morgenstern–Price method was selected, since it satisfies the equilibrium of force and moment and uses a force function between slices. SLOPE/W uses a search method to find the lambda value that results in the same factor of safety for moment and force equilibrium. If no common factor of safety can be found, the solution will not converge.

3. Results and Discussion

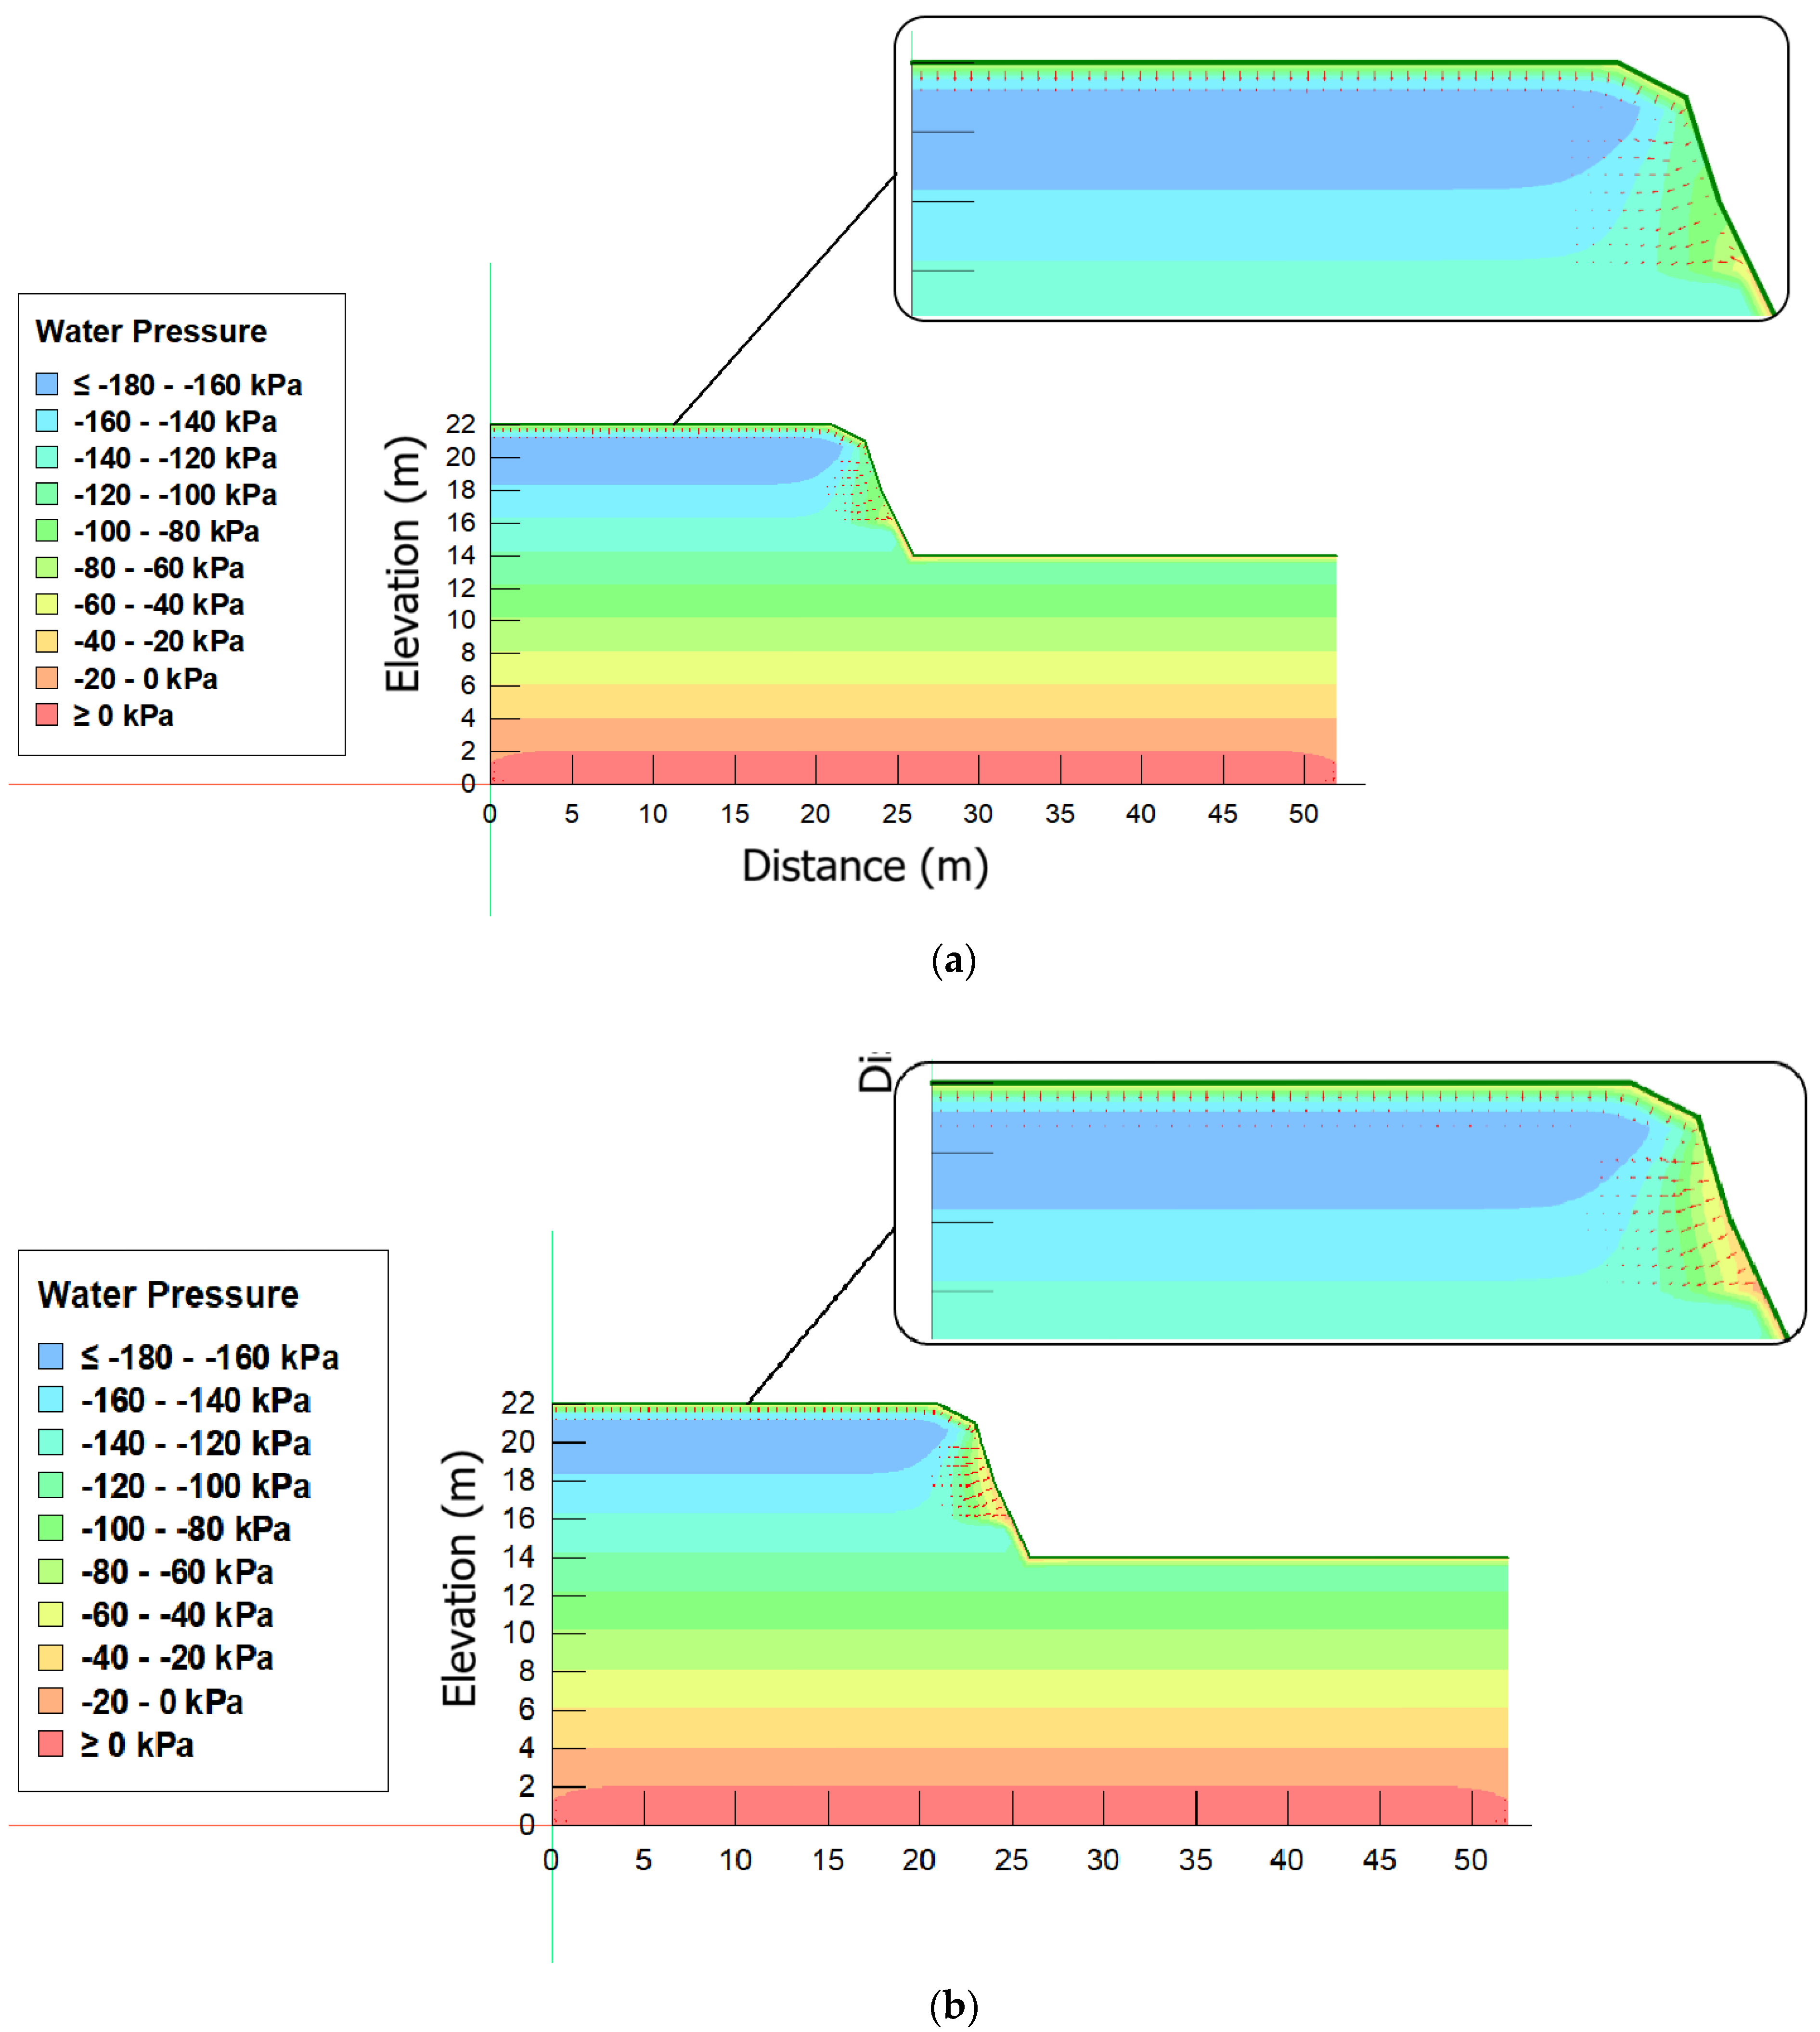
3.1. Precipitation Infiltration Analysis

Since the results obtained for both areas regarding the different intensities are similar, Figure 8 shows a summary of the infiltration modeling results on the fifth day after rainfall events with 24 h (Figure 8a,c) and 72 h (Figure 8b,d) durations and intensities of 8 mm/h, 4 mm/h, and 2 mm/h for areas JL and MM, respectively. The results obtained for both areas are similar, with the flow vectors appearing perpendicular to the pore pressure contours and tending towards vertical flow. The vectors resulting from the various rainfall intensities also showed a similar nature, indicating that the rainfall intensity does not have a significant influence on the flow of water through the pores of the slope. The duration of the rain event had a greater influence on pore pressure when compared to the intensity of the rain. The observed pore pressure contours indicate high values of negative pore pressure within the slope, suggesting a high matric suction capacity of the soils that could contribute to a high safety factor.
The infiltration rates over 5 days on the JL and MM slopes can be seen in the graphs in Figure 9a,b, respectively. The maximum infiltration rate occurred during the rain events with a value of 0.0074 mm3/s/mm2 for the different intensities and durations on the JL slope, while the maximum rate for the different intensities and durations of the rain events was 0.0438 mm3/s/mm2 for the MM slope.
The infiltration rate decreased with the advance of the saturation front for both slopes after the rain event ceased. According to [42], the infiltration rate of water in the soil is high at the beginning of the infiltration process, particularly when the soil is initially very dry, but tends to decrease over time, approaching a constant value, a behavior that can be observed in the graph. The water that infiltrates the soil moves downward under the force of gravity, following the easiest path through the larger pores of the soil, while the smaller surface pores absorb water by capillarity. When the capillary pores on the surface are filled and the absorption capacity is reduced, the infiltration rate decreases.
Figure 10 shows a summary of the infiltration modeling results with moisture conditions preceding the rain event on the fifth day after rain events lasting 24 h (Figure 10a) and 72 h (Figure 10b), respectively, for slopes MM and JL. The behavior of rainwater infiltration was similar for the different intensities of 8 mm/h, 4 mm/h, and 2 mm/h. The flow vectors were perpendicular to the pore pressure contours with a greater tendency towards vertical flow. Similar to the results obtained without antecedent precipitation, the vectors resulting from the various rainfall intensities are of an analogous nature, indicating that the rainfall intensity does not have a significant influence on the flow of water through the slope pores. The duration of the rainfall event also did not have a significant influence on the pore pressure.
Soil moisture conditions with antecedent precipitation influenced the pore pressure contours of rainfall events. Contrary to the contours observed in moisture conditions without previous precipitation, positive pore pressures were observed within the slopes. The increase in pore pressure over time is associated with a decrease in matric suction [43]. The change in values at a high depth generates a significant change in soil strength. Thus, the instability of unsaturated soil can be attributed to the reduction in matric suction associated with rainfall infiltration [44].
For the slope of area MM (Figure 10a), the advance of the wetting front reaches 6 m in depth at the end of the analysis. There is a transition zone between the soils of the center and the base at an elevation of 16 m, where there is an increase in negative pore pressure. While the soil of the center presents positive pore pressure, the soil of the base presents negative pore pressure values. The retention curve (Figure 6) showed that the center soil (MMC) had a higher water retention capacity and greater sensitivity to the presence of water. This characteristic can significantly influence the water flow in the transition zone from the center soil to the base soil.
The possible leaching process suffered by the soil in the center, which has gutters for rainwater drainage, can influence the infiltration of water into the base soil. It is possible that during the leaching process, fine particles belonging to the center soil passed into the base soil, making it less permeable. The slow dissipation of the negative pore pressure of the base soil with the infiltration of rain can be associated with high values of matric suction [43], contributing to greater slope stability [45].
The infiltration rates over 5 days on the JL and MM slopes can be seen in the graph in Figure 11a,b, respectively. The preceding rainfall influenced the infiltration response on both slopes so that both presented lower infiltration rates when compared to the results of the rates without antecedent rainfall. The result can be explained by the reduced absorption capacity of the soil, since the capillary pores may have been filled by water from previous rains [46]. The maximum infiltration rate occurred during rainfall events for both slopes, but at different stages of rainfall. For slope JL, the peak occurred in the first 24 h of rain and a value of 0.000135 mm3/s/mm2 for different intensities and durations of precipitation, while slope MM presented a practically constant rate for different intensities and durations of precipitation with a value of 0.000478 mm3/s/mm2. Similar to the results without antecedent precipitation, the MM slope presented a higher infiltration rate when compared to the JL slope.

3.2. Stability Analysis After Rainfall Events

Figure 12 shows the results of the deterministic stability analyses of the JL and MM slopes without antecedent precipitation for rainfall events lasting 24 h (Figure 12a) and 72 h (Figure 12b).
For the 24 h rain event, the safety factor dropped by 3.37% at the end of 5 days for slope MM with 1.79% occurring during the 24 h of rain for all intensities, while slope JL showed a reduction of 0.98% at the end of 5 days with 0.88% occurring during the 24 h rain event.
For the rain event lasting 72 h, the safety factor showed a drop of 3.78% at the end of the 5 days for slope MM with 3.34% occurring during the 72 h of rain for all intensities, while slope JL showed a reduction of 1.00% at the end of the 5 days with 0.93% occurring during the 72 h rain event.
The duration of the rain events did not significantly influence the reduction in the safety factor. Both the 24 h and 72 h rain events presented safety factor values above 3, indicating that both slopes have a safety factor in favor of stability. With a deep water table, most of the slopes are in a zone of negative pore pressure; this zone increases the effective normal stress on any potential failure surface, thus increasing the shear strength and the safety factor of the slope.
Even though it does not have a significant influence, it is interesting to note that the safety factor continues to decrease even after the rain stops. This behavior indicates that the safety factor decreases due to infiltration and continues to decrease as pore pressures increase with the downward movement of water within the slope.
Figure 13 shows the results of the deterministic stability analyses of the JL and MM slopes with antecedent precipitation for rainfall events lasting 24 h (Figure 13a) and 72 h (Figure 13b).
In the deterministic analysis, the safety factor of slope JL decreased to a value of 1.56 in the 5 days prior to the rain event, while the safety factor of slope MM was reduced to a value of 0.85 by the antecedent precipitation.
After rainfall events lasting 24 h and 72 h, the JL slope showed an increase of 1.26% in the safety factor at the end of the 5 days for all intensities, while the MM slope showed an increase of 8.60% at the end of the 5 days.
The JL slope showed similar behavior for different durations and intensities of rainfall. A slight reduction in the safety factor with rainfall is observed. The lowest factor obtained for the area occurs 24 h after the end of the rainfall event, indicating that the infiltrated water continues to percolate downwards even after the end of the rainfall event. After 48 h, an increase in the safety factor is observed as the pore pressures that accumulated near the soil surface decrease. A drop in the safety factor is observed at 96 h even with the decrease in pore pressures on the slope surface. This behavior may be the result of the advance of the wetting front and the increase in pore pressures inside the slope (Figure 14). According to [47], slope stability problems associated with rainfall infiltration over time show a complex behavior where the position of the critical surface is not fixed, but changes continuously because the progression of the wetting front alters the safety factor with depth. Stability behavior also differs depending on whether the critical surface providing the minimum factor of safety occurs at the base soil or at the interface between the base soil and the intermediate soil.
The JL slope remains stable even during the rain event. The water retention capacity of the soil at higher matric suctions has a significant effect on the factor of safety before the rain event. With the deep phreatic surface, most of the slope is in a zone of negative pore pressure, and this zone increases the effective normal stress on any potential failure surface, thus increasing the shear strength and the factor of safety of the slope.
The MM slope showed similar behavior for different durations and intensities of rain. Unlike the JL slope, the safety factor for MM shows a continuous increase after the rainfall event. This behavior is due to the limit reached by the wetting front. The existence of a transition zone significantly influences the flow of water between the soils of the center and base. Based on the granulometric characteristics, the retention curve, and the possible leaching process, it can be inferred that the soil of the base hinders the advance of the wetting front and increases the pore pressures inside the slope, as a consequence of which there is a constant increase in the safety factor.
The safety factor below 1.00 obtained by the MM slope indicates that the limit equilibrium may have been reached and the slope failure is a possibility for the conditions represented. It is observed that for the soil in the center, the precipitation preceding the rainfall event decreased the matric suction in the slope, causing the soil permeability coefficient to increase, and making the soil more permeable to infiltration. As a result, the shear strength decreases and, consequently, the slope safety factor decreases and recovers after the precipitation stops.
The stability of a slope is reduced by the decrease in the soil shear strength (reduced by pore pressure without any additional suction force) or by the increase in the gravitational driving force (shear stress) caused by external agents [48]. According to [11], in unsaturated soils, infiltration of rainwater results in a reduction in suction and a decrease or even elimination of the cohesive intercept. When the wetting front reaches a critical depth, where the soil strength parameters become smaller than the gravitational driving force and no longer guarantees slope stability, failure occurs.
Studies carried out by [49] on residual soil slopes show that in places where water levels were deep and most landslides occurred in the upper parts of the slopes, the hypothesis of a rise in the water table can be ruled out. Thus, since no water levels were identified on the MM slope, the reduction in the safety factor can be attributed to the advance of the wetting front induced by the infiltration of rainwater to a critical depth of the slope.

3.3. Behavior of the Slopes in Response to Infiltration

The analyses of the JL and MM slopes allowed the evaluation of their responses to precipitation and allowed the correlation of characteristics that had the most significant influence on the behavior of the slopes in response to infiltration.
The results show that rainfall intensity or the amount of rain alone cannot always be indicative of mass movement events. According to [39], attempts to correlate landslide incidences with rainfall patterns alone, rather than assessing the relative importance of parameters such as soil properties, slope geometry, previous rainfall, site infiltration, rainfall intensity, and amount of rain, which are associated with failures, yield results that do not correlate well.
That said, some observations can be made regarding the behavior of the areas based on the parameters (Table 3) obtained on the critical surfaces of the slopes during the rainfall events lasting 24 h and 72 h with antecedent precipitation:
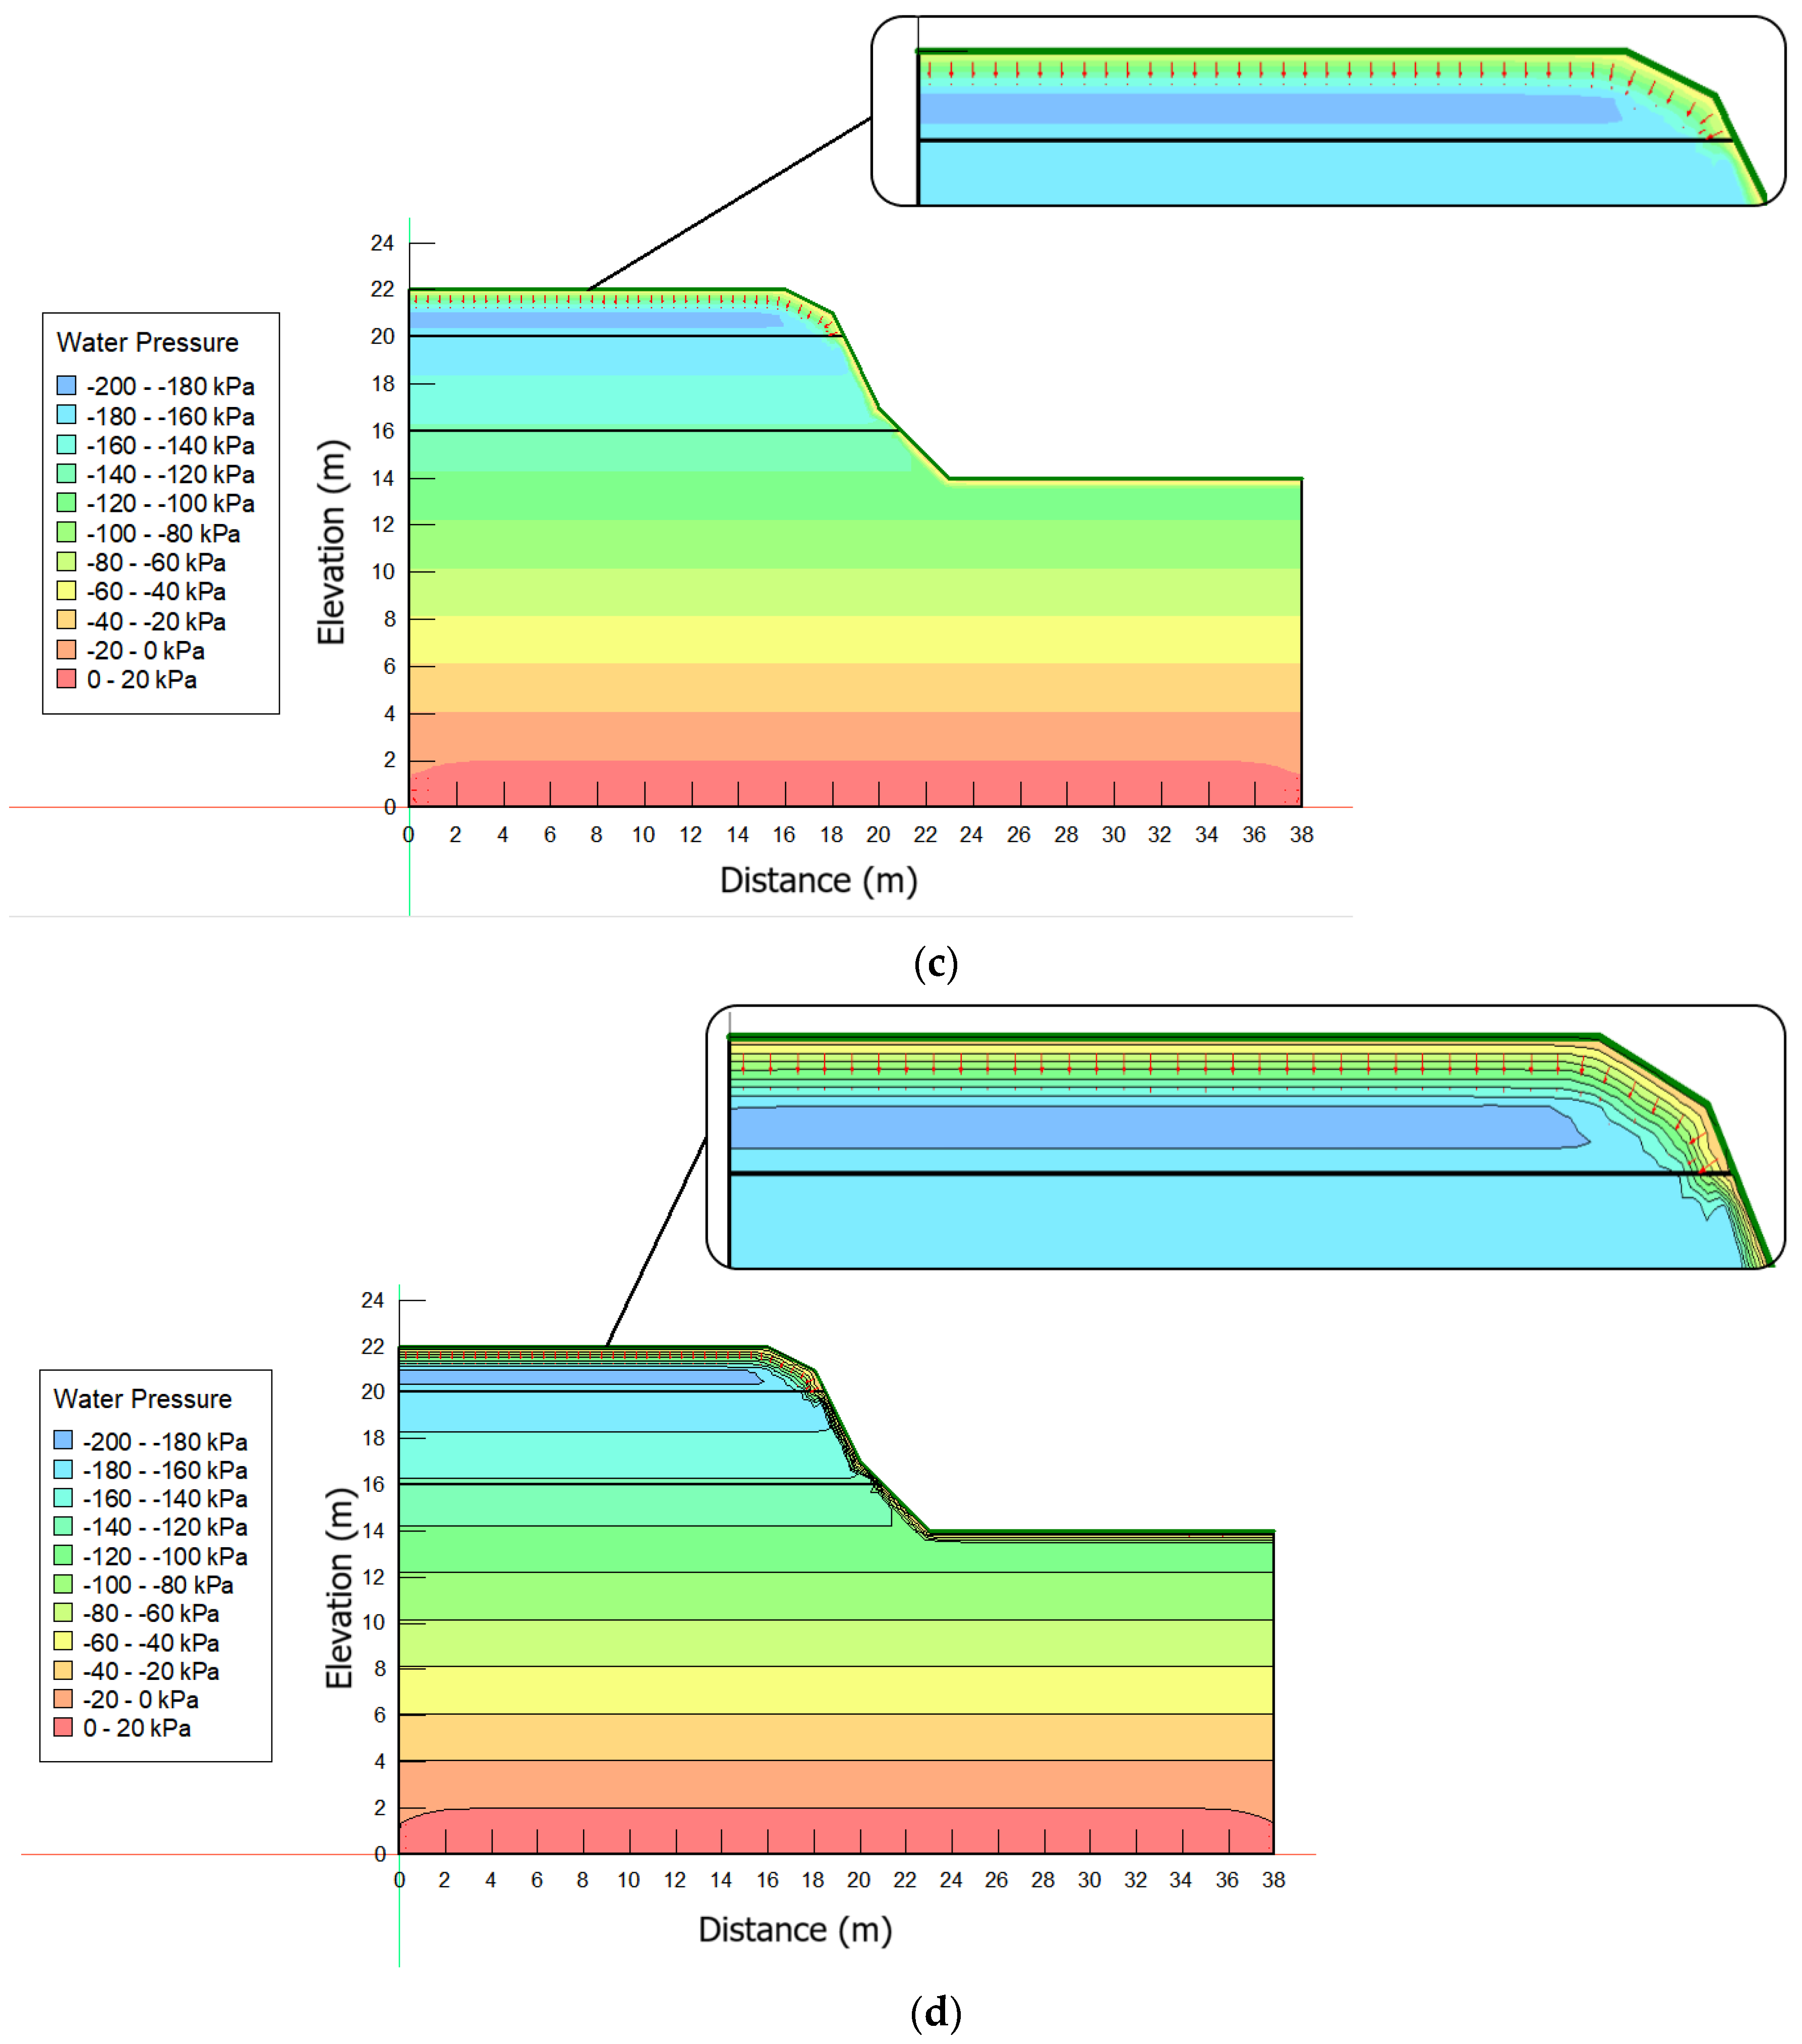
  • For the MM slope, moisture conditions with preceding precipitation influenced the pore pressure contours of rainfall events. Unlike the contours observed in moisture conditions without preceding precipitation, positive pore pressures were observed within the slope. The increase in pore pressure over time is associated with a decrease in matric suction [43]. The change in values at a high depth generates a significant change in soil resistance. Thus, the instability of unsaturated soil can be attributed to the reduction in matric suction associated with rainfall infiltration [44].
  • The MM slope tends to fail in the unsaturated state, since instability is induced only by rain infiltration that generates positive pore pressures along the surface of the site. A similar result was obtained by [50]. For the author, for slopes that presented inclinations greater than the soil friction angle, stability tends to depend greatly on suction. Therefore, the decrease in suction due to rain infiltration can cause slope failure even in the unsaturated state.
  • On the JL slope, rainfall infiltration alone was not sufficient to generate positive pore pressures within the slope and trigger instability. Failure is expected to occur due to the combined effect of rainfall infiltration and rising water tables, which correspond to the development of positive pore pressures together with an increase in the saturation rate within the slope. In a simulation carried out by [51] in Croatia, the slope at the site remained stable during the 167 days of rainfall before the safety factor fell below 1. In the study, although the increase in positive pore pressures along the sliding surface induced failure, ref. [50] found that the unsaturated zone with its storage capacity and low hydraulic conductivity plays the main role in maintaining stability during long periods of rainfall.
  • The rectilinear–planar curvature of the JL slope allowed less accumulation of rainwater on the slope surface, reducing the wetting front along the slope and preventing the disappearance of the suction force. Behavior resulted in a safety factor that is in favor of stability.
  • Tendencies towards concentration and accumulation of surface runoff in the concave-convergent portions of the MM slope contribute to the reduction in suction and favor soil shearing. Behavior could be one of the contributing factors for the safety factor being unfavorable to stability.
Considering that Table 3 also highlighted the importance of slope geometry, in addition to the steepness factor, the geometric shapes of slopes must be addressed as intensifiers of slope stability mechanisms.
The position adopted by [21] is that water flows concentrate and increase downslope, favoring the shearing of soil particles, which intensifies starting from the critical distance at the top of the slope. Considering the dynamics of slopes, ref. [52] highlighted that concave geometric shapes are preferential zones for convergence of water flows, accelerating the rupture between materials of different characteristics. In the concave portions of the slopes, there is a tendency towards concentration of surface runoff, thus the increase in water flow enhances the transport of larger dendritic material [53], thus resulting in the removal and displacement of surface soil particles that could influence the slope stability.

4. Conclusions

Slope stability problems associated with rainfall infiltration over time have shown complex behavior. The position of the critical surface varies with the progression of the wetting front and changes the factor of safety with depth. Stability behavior also differs depending on which soils provide the minimum factor of safety for the critical surface.
Antecedent precipitation appears to have a greater influence on stability than daily precipitation and could be considered a triggering factor for the occurrence of landslides. Daily or threshold precipitation alone cannot be used as a determinant of landslide occurrence, since antecedent precipitation increases soil permeability and subsequent rain events can trigger failure. However, it should be noted that the role of antecedent precipitation in slope stability will not be the same for slopes in different locations that have different soil properties, different surface conditions, variable tropical rainfall, or different microclimatic conditions.
The rectilinear–planar curvature of the JL slope allowed less accumulation of rainwater on the slope surface, reducing the wetting front along the slope and preventing the disappearance of the suction force. This behavior resulted in a safety factor favorable to stability.
Tendencies towards concentration and accumulation of surface runoff in the concave-convergent portions of the MM slope contributed to the reduction in suction and favored soil shearing, which could lead to the safety factor being unfavorable to stability.
This research has been able to identify safety factors for two locations with potential risk of landslides during rain events and the effects of rainwater infiltration on the mechanisms of destabilization of slopes in the region. It is hoped that this research can provide input to the local government in the context of landslide mitigation in the region so that the risks posed by landslides can be minimized for the future.
Even though the results obtained by the data used are related to the conditions of the study area, the principles applied to the research can be used for different regions. Prevention and mitigation of landslides can use concepts and physical principles so that the damage caused by landslides can be minimized.
Future research could attempt to develop a calculation method as to predict rainfall patterns in the future and predicting the stability of slopes exposed to the influence of various natural factors.

Author Contributions

Conceptualization, Olavo Francisco dos Santos Junior and Osvaldo de Freitas Neto; methodology, Bruna Silveira Lira and Maria Natália de Melo Sousa; software, Bruna Silveira Lira and Osvaldo de Freitas Neto; validation, Bruna Silveira Lira, Olavo Francisco dos Santos Junior and Osvaldo de Freitas Neto; formal analysis, Bruna Silveira Lira; investigation, Maria Natália de Melo Sousa; resources, Olavo Francisco dos Santos Junior and Osvaldo de Freitas Neto; data curation, Bruna Silveira Lira and Maria Natália de Melo Sousa; writing—original draft preparation, Bruna Silveira Lira; writing—review and editing, Bruna Silveira Lira; visualization, Bruna Silveira Lira; supervision, Olavo Francisco dos Santos Junior; project administration, Olavo Francisco dos Santos Junior; funding acquisition, Olavo Francisco dos Santos Junior and Osvaldo de Freitas Neto. All authors have read and agreed to the published version of the manuscript.

Funding

We wish to acknowledge the financial support provided by Coordenação de Aperfeiçoamento de Pessoal de Nível Superior, Brazil (CAPES).

Institutional Review Board Statement

Not applicable.

Informed Consent Statement

Not applicable.

Data Availability Statement

All data and materials are available on request from the corresponding authors.

Acknowledgments

All tests were conducted at Federal University of Campina Grande and Federal University of Rio Grande do Norte. We would like to thank the institutions for their valuable help and laboratory assistance.

Conflicts of Interest

The authors declare no conflicts of interest.

References

  1. Assis Dias, M.C.; Saito, S.M.; Alvalá, R.C.S.; Stenner, C.; Pinho, G.; Nobre, C.A.; Fonseca MR, S.; Santos, C.; Amadeu, P.; Silva, D.; et al. Estimation of exposed population to landslides and floods risk areas in Brazil on an intra-urban scale. Int. J. Disaster Risk Reduct. 2018, 31, 449–459. [Google Scholar] [CrossRef]
  2. Cai, J.S.; Yeh, T.C.J.; Yan, E.C.; Tang, R.X.; Hao, Y.H.; Huang, S.Y.; Wen, J.C. Importance of variability in initial soil moisture and rainfalls on slope stability. J. Hydrol. 2019, 571, 265–278. [Google Scholar] [CrossRef]
  3. Liu, J.H.; Chen, Z.M.; He, W. Research of Slope Stability Analysis Considering Rainfall Infiltration. Appl. Mech. Mater. 2012, 204–208, 487–491. [Google Scholar] [CrossRef]
  4. da Costa Teixeira, E.K.; de Azevedo, R.F.; Ribeiro, A.G.C.; Cândido, E.S. Influence of Rainfall Infiltration on the Stability of a Residual Soil Slope. Electron. J. Geotech. Eng. 2011, 15, 1–16. [Google Scholar]
  5. Noor, M.J.; Muda, M.A.; Abdul Rahman, A.S. Rainfall induced slope failure detection using infiltration type slope stability method applying non-linear failure envelope. IOP Conf. Ser. Mater. Sci. Eng. 2019, 513, 012013. [Google Scholar] [CrossRef]
  6. Alessio, P. Spatial variability of saturated hydraulic conductivity and measurement-based intensity-duration thresholds for slope stability, Santa Ynez Valley, CA. Geomorphology 2019, 342, 103–116. [Google Scholar] [CrossRef]
  7. Schnellmann, R. Uncertainties in the Estimation of Unsaturated Shear Strength from Soil-Water Characteristic Curve. Ph.D. Thesis, Nanyang Technological University, Singapore, 2015. [Google Scholar]
  8. Zhai, Q.; Rahardjo, H.; Satyanaga, A.; Dai, G.L.; Du, Y.J. Effect of the uncertainty in soil-water characteristic curve on the estimated shear strength of unsaturated soil. J. Zhejiang Univ. Sci. A 2020, 21, 317–330. [Google Scholar] [CrossRef]
  9. Ibañez, J.P. Modelagem micro-mecânica discreta de solos residuais. Ph.D. Thesis, Universidade Católica do Rio de Janeiro, Rio de Janeiro, Brazil, 2008. [Google Scholar]
  10. Instituto Brasileiro de Geografia e Estatística. Suscetibilidade a Deslizamentos do Brasil; IBGE: Rio de Janeiro, Brazil, 2019.
  11. Futai, M.M. Escorregamentos e desastres naturais. In Desastres: Múltiplas Abordagens; Gunther, W.R., Ciccotti, L., Rodrigues, A.C., Eds.; Elsevier: São Paulo, Brazil, 2017; Volume 1, pp. 97–113. [Google Scholar]
  12. Avelar, A.S.; Netto, A.L.C.; Lacerda, W.A.; Becker, L.B.; Mendonça, M.B. Mechanisms of the Recent Catastrophic Landslides in the Mountainous Range of Rio de Janeiro, Brazil. In Landslide Science and Practice; Margottini, C., Canuti, P., Sassa, K., Eds.; Springer: Berlin/Heidelberg, Germany, 2013. [Google Scholar] [CrossRef]
  13. Santos, J.A. Análise dos Riscos Ambientais Relacionados às Enchentes e Deslizamentos na Favela São José, João Pessoa—PB. Master’s Thesis, Universidade Federal da Paraíba, João Pessoa, Brazil, 2007. [Google Scholar]
  14. Gusmão Filho, J.A.; Jucá, J.F.T.; Silva, J.M.J. Mecanismos dos movimentos dos morros de Olinda. Congresso Brasileiro de Mecânica dos Solos e Engenharia Geotécnica, VIII., 1986, Porto Alegre. In Anais do VIII Congresso Brasileiro de Mecânica dos Solos e Engenharia Geotécnica; ABMS: São Paulo, Brazil, 1986; Volume 7. [Google Scholar]
  15. Marques, J.A.F.; Marques, A.G.; Marques, R.F. Estudos sobre escorregamentos de encostas da formação barreiras de Maceió—AL. In Congresso Brasileiro de Mecânica dos Solos E Engenharia Geotécnica, XVI, Porto de Galinhas. Anais do VIII Congresso Brasileiro de Mecânica dos Solos e Engenharia Geotécnica; ABMS: São Paulo, Brazil, 2012; Volume 7. [Google Scholar]
  16. Campos, L.E.D. Desastres e ações na Bahia. Conferência Brasileira Sobre Estabilidade de Encostas, VI., 2013, Angra dos Reis. In Anais da VI Conferência Brasileira sobre Estabilidade de Encostas; ABMS: Angra dos Reis, Brazil, 2013. [Google Scholar]
  17. Santos, O.F.D., Jr.; Silva Filho, F.C.D. Compressão unidimensional de solos residuais da Formação Potengi. Rev. Tecnol. Fortaleza 2009, 30, 97–103. [Google Scholar]
  18. Elldorf, B.; Melo, R.C. Ação Emergencial para Delimitação de Áreas em Alto e Muito Alto Risco a Inundações e Movimentos de Massa: Areia—PB; Companhia de Pesquisa de Recursos Minerais, Departamento de Gestão Territorial: Brasília, Brazil, 2015.
  19. Riffel, E.S.; Guasselli, L.A.; Bressani, L.A. Disaster associated with mass movements: A literature review. Bol. Goia. Geogr 2016, 36, 285–305. [Google Scholar]
  20. Earle, S. Physical Geology, 2nd ed.; Victoria, B.C., Ed.; BCcampus: Victoria, BC, Canada, 2019. [Google Scholar]
  21. Guerra, A.J.T. Processos erosivos nas encostas. In Geomorfologia: Uma Atualização de Bases e Conceitos; Guerra, A.J.T., Cunha, S.B., Eds.; Bertrand Brasil: Rio de Janeiro, Brazil, 1994; pp. 149–209. [Google Scholar]
  22. Manfré, L.A. Identificação e Mapeamento de Áreas de Deslizamentos Associadas a Rodovias Utilizando Imagens de Sensoriamento Remoto. Ph.D. Thesis, Universidade de São Paulo, São Paulo, Brazil, 2015. [Google Scholar]
  23. Santos, E.J. Dos O Complexo Granítico Lagoa das Pedras: Acresção e Colisão na Região de Floresta (Pernambuco), Província Borborema. São Paulo, 1995. 220 p. 2 mapas. Ph.D. Thesis, Universidade de São Paulo, Instituto de Geociências, São Paulo, Brazil, 1995. [Google Scholar]
  24. Rodrigues, S.W.O.; Medeiros, V.C. Geologia e Recursos Minerais da Folha de Campina Grande, SB.25-Y-C-I, Escala 1:100.000, Estados da Paraíba e Pernambuco; CPRM: Recife, Brazil, 2015; 80p. [Google Scholar]
  25. EMBRAPA. Sistema Brasileiro de Classificação dos Solos, 5th ed.; EMBRAPA: Brasília, Brazil, 2018; 355p. [Google Scholar]
  26. Pereira, T.T.C.; Oliveira, F.S.; Freitas, D.F.; Damasceno, B.D.; Dias, A.C. A mineralogia dos solos tropicais: Estado da arte e relação com o uso e manejo. Geonomos 2020, 28, 1–14. [Google Scholar]
  27. Associação Brasileira de Normas Técnicas. NBR 6457: Amostras de Solo—Preparação Para Ensaios de Compactação e Ensaios de Caracterização; Associação Brasileira de Normas Técnicas: Rio de Janeiro, Brazil, 2016; p. 8. [Google Scholar]
  28. Associação Brasileira de Normas Técnicas. NBR 6458: Grãos de Pedregulho Retidos na Peneira de Abertura 4,8 mm—Determinação da Massa Específica, da Massa Específica Aparente e da Absorção de Água; Associação Brasileira de Normas Técnicas: Rio de Janeiro, Brazil, 2016. [Google Scholar]
  29. Associação Brasileira de Normas Técnicas. NBR 6459: Solo—Determinação do Limite de Liquidez; Associação Brasileira de Normas Técnicas: Rio de Janeiro, Brazil, 2017. [Google Scholar]
  30. Associação Brasileira de Normas Técnicas. NBR 7180: Solo—Determinação do Limite de Plasticidade; Associação Brasileira de Normas Técnicas: Rio de Janeiro, Brazil, 2016. [Google Scholar]
  31. Associação Brasileira de Normas Técnicas. NBR 7181: Solo—Análise Granulométrica; Associação Brasileira de Normas Técnicas: Rio de Janeiro, Brazil, 2018. [Google Scholar]
  32. ASTM D4767-11; Standard Test Method for Consolidated Undrained Triaxial Compression Test for Cohesive Soils. ASTM Standards: West Conshohocken, PA, USA, 2011.
  33. ASTM D 5298-92; Standard Test Method for Measurement of Soil Potential (Suction) Using Filter Paper. ASTM Standards: West Conshohocken, PA, USA, 1992; Volume 15.09, pp. 264–268.
  34. Geoslope International Ltd. Heat and Mass Transfer Modeling with GeoStudio; Geoslope International Ltd.: Calgary, AB, Canada, 2021. [Google Scholar]
  35. Aubertin, M.; Mbonimpa, M.; Bussière, B.; Chapuis, R.P. A model to predict the water retention curve from basic geotechnical properties. Can. Geotech. J. 2003, 40, 1104–1122. [Google Scholar] [CrossRef]
  36. Van Genuchten, M.T. A closed-form equation for predicting the hydraulic conductivity of unsaturated soils. Soil Sci. Soc. Am. J. 1980, 44, 892–898. [Google Scholar] [CrossRef]
  37. Rahimi, A.; Rahardjo, H.; Leong, E.C. Effect of Antecedent Rainfall Patterns on Rainfall-Induced Slope Failure. J. Geotech. Geoenvironmental Eng. 2011, 137, 483–491. [Google Scholar] [CrossRef]
  38. Gariano, S.L.; Guzzetti, F. Landslides in a changing climate. Earth Sci. Rev. 2016, 162, 227–252. [Google Scholar] [CrossRef]
  39. Rahardjo, H.; Satyanaga, A.; Leong, E.C. Effects of Rainfall Characteristics on the Stability of Tropical Residual Soil Slope. In Proceedings of the 3rd European Conference on Unsaturated Soils, Paris, France, 12–14 September 2016. [Google Scholar]
  40. Morgenstern, N.R.; Price, V.E. The analysis of the stability of general slip surface. Geotechnique 1965, 15, 289–290. [Google Scholar] [CrossRef]
  41. Vanapalli, S.K.; Fredlund, D.G.; Pufahl, D.E.; Clifton, A.W. Model for the Prediction of Shear Strength with respect to Soil Suction. Can. Geotech. J. 1996, 33, 379–392. [Google Scholar] [CrossRef]
  42. Cunha, J.L.X.L.; Coelho, M.E.H.; de Albuquerque, A.W.; Silva, C.A.; da Silva, A.B., Jr.; de Carvalho, I.D.E. Water infiltration rate in Yellow Latosol under different soil management systems. Rev. Bras. Eng. Agrícola E Ambient. 2015, 19, 1807–1929. [Google Scholar] [CrossRef]
  43. Abd, I.A.; Fattah, M.Y.; Mekkiyah, H. Relationship between the matric suction and the shear strength in unsaturated soil. Case Stud. Constr. Mater. 2020, 13, 2214–5095. [Google Scholar] [CrossRef]
  44. Oh, W.T.; Vanapalli, S.K.; Qi, S.; Han, Z. Estimation of the variation of matric suction with respect to depth in a vertical unsaturated soil trench associated with rainfall infiltration. In Proceedings of the 3rd European Conference on Unsaturated Soils, Paris, France, 12–14 September 2016. [Google Scholar]
  45. Ghadrdan, M.; Shaghaghi, T.; Tolooiyan, A. The effect of negative excess pore-water pressure on the stability of excavated slopes. Géotech. Lett. 2019, 9, 20–29. [Google Scholar] [CrossRef]
  46. van Oosterhout, M.J. Differences in Soil Water Characteristics of Monoculture Oil Palm Plantations, Agroforestry Oil Palm Plantations and Natural Forest; University of Twente: Enschede, The Netherlands, 2022. [Google Scholar]
  47. Cho, S.E. Probabilistic stability analysis of rainfall-induced landslides considering spatial variability of permeability. Eng. Geol. 2014, 171, 11–20. [Google Scholar] [CrossRef]
  48. Shao, W. Numerical Modeling of the Effect of Preferential Flow on Hillslope Hydrology and Slope Stability. Master’s Thesis, Delft University of Technology, Hongkong, China, 2017. [Google Scholar] [CrossRef]
  49. Vaughan, P.R. Characterizing the mechanical properties of in situ residual soil. In Proceedings of the 2nd International Conference on Geomechanics in Tropical Soils, Singapore, 12–14 December 1988. [Google Scholar]
  50. Gallage, C.; Abeykoon, T.; Uchimura, T. Instrumented model slopes to investigate the effects of slope inclination on rainfall-induced landslides. Soils Found. 2021, 61, 160–174. [Google Scholar] [CrossRef]
  51. Peranić, J.; Jagodnik, V.; Arbanas, Ž. Rainfall infiltration and stability analysis of an unsaturated slope in residual soil from flysch rock mass. In Proceedings of the XVII European Conference on Soil Mechanics and Geotechnical Engineering, Reykjavik, Iceland, 1–6 September 2019. [Google Scholar]
  52. Silva, A.M.D.; Schulz, H.E.; Camargo, P.B.D. Hidrossedimentologia em Bacias Hidrográficas, 2nd ed.; RIMA: São Carlos, Brazil, 2007. [Google Scholar]
  53. Silva Neto, J.C.A. Avaliação da vulnerabilidade à perda de solos na bacia do rio Salobra, MS, com base nas formas do terreno. Geografia 2013, 22, 5–25. [Google Scholar]
Figure 1. Slopes of JL at A3 (a) and MM at A4 (b).
Sustainability 16 09530 g001aSustainability 16 09530 g001b
Figure 2. Slope of the study area.
Sustainability 16 09530 g002
Figure 3. Profile and plan curvatures of the study area.
Sustainability 16 09530 g003
Figure 4. Geological unit of the study area.
Sustainability 16 09530 g004
Figure 5. Pedology of the study area.
Sustainability 16 09530 g005
Figure 6. Soil characteristic curves.
Sustainability 16 09530 g006
Figure 7. Boundary conditions.
Sustainability 16 09530 g007
Figure 8. Infiltration on the fifth day after 24 h (a,c) and 72 h (b,d) rain events.
Sustainability 16 09530 g008aSustainability 16 09530 g008b
Figure 9. Infiltration rates without antecedent precipitation for rain events lasting 24 h (a) and 72 h (b).
Sustainability 16 09530 g009
Figure 10. Infiltration on the fifth day after the rainfall events of 24 h (a) and 72 h (b) with antecedent precipitation.
Sustainability 16 09530 g010
Figure 11. Infiltration rates with antecedent precipitation for the JL (a) and MM (b) slopes.
Sustainability 16 09530 g011
Figure 12. Factor of safety without antecedent precipitation for rainfall events lasting 24 h (a) and 72 h (b).
Sustainability 16 09530 g012
Figure 13. Factor of safety with antecedent precipitation for rainfall events lasting 24 h (a) and 72 h (b).
Sustainability 16 09530 g013
Figure 14. Variation in the critical surface between 72 h (a) and 96 h (b) on the JL slope.
Sustainability 16 09530 g014
Table 1. Physical characterization of the soils.
Analysis MMTMMCMMBJLTJLCJLB
GranulometryClay16%26%36%39%67%53%
Silt19%36%27%16%9%17%
Sand55%35%37%43%24%30%
Gravel10%3%1%2%1%1%
Consistency index% LL394347435051
% PL303132303943
% IP9121513118
Specific gravity of grains (g/cm3)2.692.802.692.602.712.57
Table 2. Cohesive intercept and friction angle of soils.
SoilMMTMMCMMBJLTJLCJLB
ϕ (º)33.1439.2331.3935.1928.5724.27
c’ (kPa)15321111720
Table 3. Parameters on the slopes of critical surfaces.
AreaMMJL
Rainfall duration24 h72 h24 h72 h
Safety factor0.850.851.541.54
Infiltration rate (mm3/s)4.8 × 10−44.8 × 10−49.94 × 10−59.94 × 10−5
Slope (°)63.463.471.671.6
Pore pressure (kPa)11.5911.590.427.76
Friction angle (°)39393535
Cohesive intercept (kPa)3.43.419.719.7
Suction strength (kPa)0.000.0012.3312.33
Hydraulic conductivity (m3/s)1.50 × 10−81.50 × 10−83.84 × 10−93.85 × 10−9
Curvature along the slopeconcave–convergentrectilinear–planar
Disclaimer/Publisher’s Note: The statements, opinions and data contained in all publications are solely those of the individual author(s) and contributor(s) and not of MDPI and/or the editor(s). MDPI and/or the editor(s) disclaim responsibility for any injury to people or property resulting from any ideas, methods, instructions or products referred to in the content.

