Abstract
In the context of the global shift toward sustainable development, ecosystem-based ecological industries have become a critical area of focus for achieving green economic transformation and promoting the harmonious development of both society and the environment. This paper aims to explore the impact of industrial integration on the progression of ecological production within the framework of digitalization, with a particular emphasis on key sectors such as agriculture, forestry, and tourism. Utilizing multi-group data from 284 cities spanning the period 2011 to 2020, the study establishes a relationship between industrial integration and the growth of ecological industries, employing a two-way fixed effects model for analysis. The results demonstrate that industrial integration within ecological sectors significantly fosters sectoral development through two main mechanisms: the extension of industrial value chains and cross-sectoral synergies. Moreover, in the era of the digital economy, digitalization plays a pivotal role in facilitating the integrated development of ecological industries. The study further identifies that digital technology, digital finance, and digital expertise serve as mediating factors in this integration process. It is recommended that future initiatives focus on leveraging digital tools to enhance the integration of ecological industries, thereby advancing industrial growth. Furthermore, China is encouraged to continue promoting the integrated development of ecological industries by supporting the expansion of industrial value chains and fostering intersectoral cooperation. Simultaneously, the role of digitalization should be emphasized, with particular attention to the incorporation of relevant digital components into the industrial integration process moving forward.
1. Introduction
In recent years, ecological industries have gained significant attention from the government. Their development is not only connected to the green transformation of the economy but also to social well-being and environmental health. The development of ecological industries emphasizes the importance of ecosystem services, including provisioning services (e.g., food and water), regulatory services (e.g., climate and water regulation), cultural services (e.g., recreation and spiritual fulfillment), and supporting services (e.g., soil formation and nutrient cycling) [1]. These services contribute directly or indirectly to human well-being, encompassing safety, health, social relationships, and personal development. Ecological industries such as agriculture, forestry, and tourism are highly dependent on ecosystems, including farmland and forests, and their progress serves as a direct indicator of ecological conservation efforts and resource utilization efficiency, particularly in rural regions [2]. With the implementation of China’s targeted poverty alleviation and rural revitalization strategies, the ecological industry has encountered unprecedented growth opportunities. However, significant challenges persist, including a lack of industrial coordination, fragmented systems, decentralized operations, limited technological advancement, and weak awareness of ecological and environmental protection [3].
Industrial integration, recognized as a strategic approach to advancing the ecological industry, provides a means of enhancing the sector’s overall competitiveness and sustainability by promoting cross-sector resource integration and innovative business models. The emergence of digital technologies has introduced a new driving force for industrial integration. Technologies such as the Internet, big data, cloud computing, and artificial intelligence have not only improved production efficiency but have also transformed the management and operational models of ecological industries. Beyond integration and digitalization, a multitude of other factors influence the development trajectory of ecological industries, including policy support, market demand, technological innovation, talent cultivation, capital investment, and consumer preferences. These factors collectively shape various stages of ecological industry development, impacting its growth pace and direction [3,4]. For example, government policies may provide tax incentives, financial subsidies, and enhanced market access for ecological industries, while fluctuations in market demand directly influence the production and sales of ecological products. Technological innovation remains pivotal for industrial upgrading and for increasing the added value of ecological industries [5,6].
In the digital era, the integrated development model of ecological industries is increasingly recognized as a future trend [7]. Digitalization not only enhances the production and management processes of ecological industries but also optimizes resource allocation, improves adaptability, and fosters innovation through data-driven analysis and intelligent decision-making. Moreover, digitalization strengthens the interaction between ecological industries and consumers, raising consumer awareness of ecological issues and encouraging greater participation, thereby contributing to the sector’s sustainable development [6,8].
This study seeks to comprehensively examine the development pathways and mechanisms of industrial integration within ecological industries, with particular emphasis on the transformative role of digitalization. Additionally, it will analyze how other influential factors—such as policies, markets, technology, talent, and capital—collectively shape the future of ecological industries. Through this research, we aim to provide robust theoretical foundations and practical insights to support the sustainable development of ecological industries, thereby promoting the harmonious coexistence of economic growth, societal well-being, and environmental preservation.
2. Literature Review
The ecological industry is a network-evolutionary sector grounded in the principles of ecological and knowledge economies, operating within the constraints of an ecosystem carrying capacity while maintaining efficient economic processes and harmonious ecological functions [9]. It involves the systematic coupling of two or more production systems or processes, enabling multi-level utilization of materials and energy, efficient resource production, and the sustainable development and use of environmental and energy systems [10,11].
Different scholars have diverse interpretations of the concept of the ecological industry, which have been summarized in Table 1. Some argue that it should strictly adhere to ecological principles and ecosystem carrying capacity while also following sound economic practices. Attention has been directed toward reducing the negative environmental externalities of traditional industries through technological innovation, industrial transformation, and upgrading.

Table 1.
Major definition of eco-industry.
Internationally, the ecological industry is often viewed through the lens of “ecosystem services” or “payment for ecosystem services (PES)”. Since the introduction of the concept of Ecological Civilization by the Chinese government, China has developed its own understanding of the ecological industry. On the one hand, in alignment with international conventions, it emphasizes the enhancement of ecosystem service functions, the valuation of ecological products, and the promotion of their industrialization. On the other hand, China’s perspective on ecological systems has expanded beyond forest ecosystems to include agricultural and broader ecological systems, extending the scope of ecological industries to sectors such as forestry, agriculture, animal husbandry, and fisheries.
Ecological industries primarily encompass agriculture, forestry, and other primary sectors, as well as tourism, all of which are closely linked to agriculture and rural areas. Initially, scholars focused primarily on industries centered around agriculture, particularly in relation to rural areas and farmers. However, the development of the ecological industry has only recently garnered significant attention from both academia and industry. Most of these studies focus on how ecological industries should develop better. Moreover, the description of ecological industries has largely remained at a descriptive level, indicating a need for further research into the interconnections between ecology and economics.
Industrial integration is both a trend and a defining characteristic of modern industrial development. It refers to the mutual penetration, intersection, and eventual merging of different industries, whether between or within sectors. This process is driven by technological advancements or deregulation, leading to the blurring or redefinition of traditional industrial boundaries. The emergence of cross-industry business models—marked by crossover, penetration, and integration—has resulted in increased added value. In recent years, scholars, both domestically and internationally, have studied various aspects of industrial integration, including the types [12,13,14], methods [15,16,17], driving forces [18,19,20], identification [21], and effects [22,23] of integration. The key findings can be summarized as follows: industrial integration is a new trend that can significantly enhance industrial development, bridge gaps between regions and industries, and promote the integration of economic growth. In particular, the digital industry has greatly advanced industrial integration, as seen in the rise of emerging industries. These studies, encompassing both case studies and empirical analyses, have expanded from the information sector to industries such as media, finance, culture, sports, tourism, and logistics [24,25,26,27]. Most research agrees that the integration could promote sector development and aims to identify its impact factors and working mechanisms. The rise of the digital economy has introduced new dynamics into industrial integration, attracting increased attention [28,29,30]. Research has generally shown that industrial integration is becoming a trend and can effectively promote industry development. This is mainly reflected in its ability to promote regional market integration, enhance innovation in production technologies, drive the decomposition and reconstruction of value chains, and induce changes in industry functions, forms, organization, and business models, thereby promoting industrial upgrading and improving competitiveness.
In the realm of ecological resources, most research has focused on agriculture, particularly on the application of agricultural resources. Many studies suggest that industrial integration in rural areas can promote economic development and increase farmers’ incomes [31,32,33,34,35]. International research has gradually expanded from agricultural industrialization [34,36]. Generally, multinational studies have demonstrated that agricultural industrialization has contributed to improvements in agricultural efficiency and the growth of farmers’ incomes. The “six-industry” theory is particularly noteworthy. This theory incorporates agriculture into the broader discourse on industrial integration, emphasizing the value chain and industrial structure and advocating for the extension of agricultural production across the primary, secondary, and tertiary sectors to establish a comprehensive industrial chain [37].
Research on the integration of the three rural industries in China is relatively independent [38], with a focus on value chains and industrial structures. It encourages the extension of agriculture into secondary and tertiary sectors, promotes industrial penetration, and aims to build a complete industrial chain [32,34,35,36,37,39,40,41,42,43,44,45,46,47,48,49,50,51,52]. These studies explore topics such as the definition, scope, types, and pathways of rural industrial integration [53,54,55,56,57,58], agricultural industrialization [58], multifunctional agriculture [59,60], modern agriculture [61], integration drivers [62,63], measurement of integration [64,65,66,67], and its effects [68].
Broadly, agricultural industry integration can be classified into five categories: chain extension, functional expansion, technological penetration, integration of planting and breeding, and multi-dimensional compounding [31]. These can be further condensed into two main categories: industrial chain extension and industrial penetration (Figure 1).

Figure 1.
Classification of industrial integration.
With the rise of the digital economy, digitalization has been fully integrated into various industries and is considered to have effectively improved productivity and production relations. For example, the following references show the current development trend of digitization in different sectors, Adopt Virtual Reality in the tourism and Virtual Reality visit. Meanwhile, the relationship between rural industrial integration and digitalization has become increasingly interconnected [59,69]. While most studies affirm the positive impact of digitalization on rural industries, there remains substantial room for further research into the underlying mechanisms, pathways, measurements, effects, predictions, and regulations [70]. Despite growing interest in industrial integration within ecological industries, academic research on this topic remains scarce, and studies addressing the role of digitization are even fewer. Its impact on the ecological industry is just beginning to be explored, and the form and mechanisms of this influence have received limited attention from scholars.
In general, academic research on the ecological industry tends to focus on resource types, particularly in traditional sectors such as agriculture, forestry, and animal husbandry, which are closely tied to specific ecosystems. In the past, attention was focused on the development of the ecological industry from the perspective of the value of ecological products, which laid a foundation for this paper’s research on the utilization of ecological resources. Additionally, studies on industrial development and integration from the perspectives of agriculture, rural revitalization, and the broader rural ecosystem also serve as important foundations for this study. The current approach to ecological resource utilization primarily follows an industrialization model, yet there is an urgent need for a transition from single-sector industries to integrated industries. This transformation requires sustainable and integrated development that balances the protection, development, and utilization of complex ecosystems.
Although these industries are often regarded as underdeveloped, the integration of digitization is anticipated to serve as a critical force in overcoming development bottlenecks. Generally speaking, in ecological industry research, most studies focus on industries derived from single ecosystems, with comparatively less attention given to the integration of different sectors. Notably, there is a significant research gap in exploring the transition from holistic ecosystem protection to the comprehensive utilization of specific ecological resources and the integration of these industries. Moreover, limited research has been conducted on the mechanisms driving and promoting ecological industry integration. In addition, digitization has the potential to revolutionize ecological industries by improving production efficiency, optimizing supply chain management, expanding market access, and enhancing the added value of products. However, there remains a relative lack of research on the role of digitization in the integration of ecological industries, highlighting the need for further exploration in this field.
Future research should concentrate on how digitization can drive the integration of ecological industries and how to establish a policy and institutional framework that supports this process. This includes examining the specific role of digitalization in enhancing the competitiveness of ecological industries, promoting industrial upgrading, and improving their capacity for sustainable development. Furthermore, studies should explore how policy innovation and system design can encourage the adoption and dissemination of digital technologies. Additionally, research should investigate how to improve practitioners’ digital skills through education and training and how to address the complex challenges of ecological industry integration through interdisciplinary collaboration. Such comprehensive research would provide a solid theoretical and practical foundation for the digital transformation and sustainable development of the ecological industry.
3. Theoretical Analysis and Basic Assumptions
3.1. Impacts of Industrial Integration on the Ecological Industry
Industrial chain extension and industrial penetration represent the primary modes for the integrated development of ecological industries and serve as key drivers for enhancing integration value and increasing industrial output, which can be found in Figure 2.

Figure 2.
Industrial integration of industrial chain extension and penetration.
These two mechanisms contribute to the advancement of ecological industries from different perspectives. In terms of industrial chain extension, the primary focus is on developing a comprehensive industrial chain model. Under varying influencing factors, the upstream, midstream, and downstream segments of the industrial chain achieve value addition at each stage, facilitating the upgrading of the entire chain and maximizing overall benefits. This process follows a trajectory from “value initiation” to “value creation” and finally to “value amplification and spillover”. This process is depicted in detail in Figure 3.
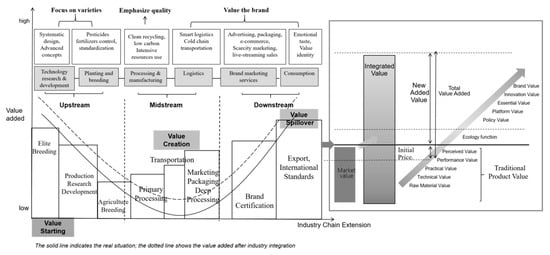
Figure 3.
Value added to the whole ecological industry chain.
The “smile curve” theory, which is widely used to explain the transformation and upgrading of value chains, is also applicable to the ecological sector. Relevant studies have validated the basic characteristics of agricultural smile curves, and this concept can now be applied to ecological industries. Due to increased investment in environmental protection, ecological products tend to be of higher quality, reflected through labels such as organic, low-carbon, green, and other ecological certifications (for instance, products that meet the standards of the “Three Qualities and One Mark”, which include green, organic, and geographical indications, along with branding). As consumer recognition grows, these agricultural products command higher premiums in the market. Moreover, the integration of various elements and industries, such as innovation, platforms, and policies, further enhances value. The smile curve thus extends at both ends and shifts upward, resulting in a more specialized industrial division of labor and a more significant impact on added value. The core of the smile curve lies in the varying added value at different stages. From an input-output perspective, more resources must be allocated to both ends of the curve to ultimately enhance the overall product value. This is particularly evident in agriculture. For instance, agriculture requires increased investment in research and development, market expansion, and brand value enhancement to ultimately boost revenue.
Industrial penetration plays a crucial role in enhancing output value.
First, industrial penetration has accelerated the development of industrial networks, particularly within modern industrial parks and other organizational frameworks, fostering the gradual emergence of ecological industries. This process has been accompanied by continuous advancements in technological capabilities, alongside significant changes in labor organization and inter-enterprise cooperation. Consequently, production costs have been reduced, and resource allocation has been optimized. In this context, the government has played a pivotal role, guiding enterprise development through strategic industrial planning and stimulating agglomeration effects to promote broader industrial growth.
Second, industrial penetration has fostered the emergence of new business models, representing an innovative approach to industrial development. Ecosystem functions have been extensively leveraged, resulting in a greater diversification of products and services [71,72]. The core of these new business models lies in adjusting supply-side outputs to better meet evolving consumer demand. For instance, the expansion of agricultural leisure complexes, forest wellness resorts, and residential accommodations reflects a strategic response to the increasingly diversified needs of consumers. Furthermore, the integration of new technologies and materials has spurred advancements in the processing industry, embedding the ecological industry more deeply within the framework of modern industrialization and improving overall production efficiency. Examples such as bio-agriculture and e-commerce underscore this trend.
In conclusion, the ultimate outcome of industrial chain integration is the establishment of a modern ecological industrial system, which drives the growth of the ecological economy. Notably, the process of industrial integration unfolds in stages, transitioning from an initial, singular industry development model to one characterized by integrated industrial systems. This integration manifests in two key dimensions: first, the expansion of integrated industries from the primary sector into the service and tourism industries, and second, the increasing depth of integration over time. Industrial chain extension and penetration represent two distinct yet complementary pathways of integration, each with varying roles, sequences, and impacts across different regions (Figure 4).
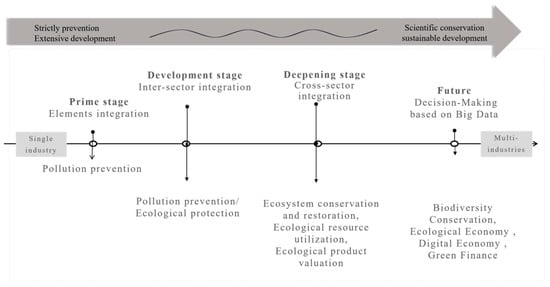
Figure 4.
Process of phased development of industrial integration.
H1.
Industrial integration promotes the development of the ecological industry in two ways: industrial chain extension and industrial penetration.
3.2. Impact of Ecological Protection Policy on the Ecological Industry
Ecological protection policies are designed to promote the harmonious coexistence of economic activities and environmental preservation through the implementation of regulations and standards. While the traditional perspective suggests that stringent environmental regulations may raise operational costs for businesses and impede economic growth, contemporary economic research indicates that such regulations can actually incentivize technological innovation, thereby fostering sustainable economic development. These innovations may encompass the adoption of cleaner technologies, optimization of production processes, and the development of new products, all of which enhance enterprise competitiveness while ensuring compliance with environmental standards.
Through mechanisms such as ecological compensation, governments aim to alleviate the potential economic burden associated with ecological protection and to ensure that such measures are both fair and effective. The strategic use of these policy tools seeks to strike a balance between ecological preservation and economic growth, promoting the efficient use of resources and driving the green transformation of industries.
When assessing the impact of ecological protection policies on economic development, particular attention is paid to their regulatory effects, specifically, how environmental regulations influence the relationship between ecosystem integration and economic growth. Based on existing literature and theoretical frameworks, we propose the following hypothesis:
H2.
Ecological and environmental protection regulation plays a moderator role between ecosystem integration and economic development, especially in promoting technological innovation and improving the efficiency of resource utilization.
3.3. Impact of Digitalization on Ecological Industry Integration
Digitization plays a crucial role in guiding resource allocation, integrating resources, optimizing production and organizational models, and facilitating coordination among various stakeholders. It also influences consumption patterns and platform development [73]. As digitization progresses, the production functions within the ecological industry are being redefined, with technology and information spillover effects becoming increasingly significant. The digital literacy of the industrial workforce has steadily improved, alongside advancements in digital financial infrastructure, enabling more market participants to benefit from inclusive finance. This, in turn, enhances the efficiency of integrating multiple production factors, gradually maximizing the efficiency of factor markets and promoting their transformation [74,75,76,77,78,79,80,81,82,83].
Digitization also affects the development of the ecological industry by promoting the extension of the industrial chain and industrial penetration.
Digitalization enables the formation of comprehensive industrial chains within the ecological sector, linking upstream, midstream, and downstream activities, improving the quality of each segment, and empowering the industry through digital innovations. Ecological production is no longer limited to simple production lines that focus on planting, breeding, processing, and selling low-value-added products. With digital integration, new production and sales models have emerged, such as the “live broadcast product sales-platform sales-hunger marketing” model, which increases the value added across the industrial chain and explores diverse sales pathways.
The Internet also enhances information exchange and product diversification. Digital technologies support production entities by improving digital skills and integrating advanced concepts, technologies, management practices, and organizational structures into the development of extended industrial chains. Additionally, digital finance addresses capital constraints and extends and expands the industrial chain, ultimately increasing product value, reducing costs, and improving efficiency. It mitigates risks, attracts more resources and production factors, strengthens the competitive dynamism within the industry, and elevates the internal structure of the ecological industry to a more advanced level [84].
3.3.1. Digital Technology
The integration and coordination of digital technology with ecological industries can foster a higher level of productivity, significantly influencing both industrial structures and business models [85,86,87,88,89,90]. Digital technology is comprehensively incorporated into various stages of social reproduction related to ecological industries, including cultivation, production, exchange, consumption, circulation, distribution, and redistribution. This deep integration accelerates the development of ecological industries.
Firstly, the application of digital technologies enhances production efficiency throughout the entire life cycle of ecological industries (Figure 5). By leveraging algorithms and digital mechanisms to influence consumer behavior and create new digital consumption scenarios, these technologies enable the precise matching of supply and demand. This, in turn, facilitates rapid and low-cost connections between producers and consumers, thereby reducing the costs associated with search frictions [91]. The frequency of transactions between supply and demand increases, mitigating market uncertainties and complexities [92].
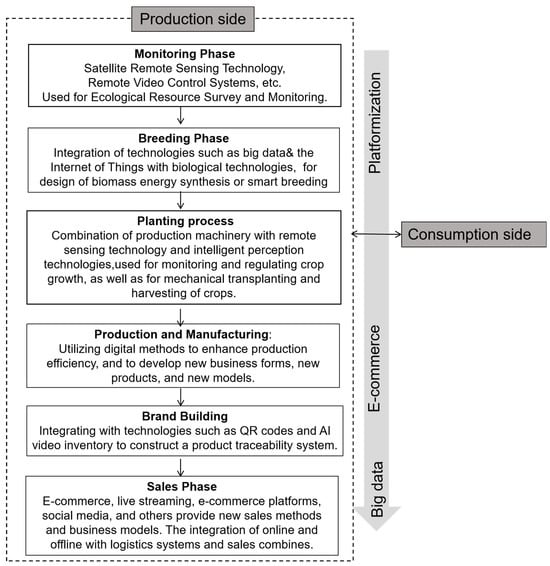
Figure 5.
Digital technology is integrated into both the production side and the consumer side.
Additionally, digital technology stimulates consumer demand for diversified and personalized products, leading to the proliferation of a wide variety of goods in the marketplace and amplifying the long-tail effect in consumer markets. Consumers can connect directly with manufacturers, while small-scale farmers can more easily access markets, enabling real-time adjustments between supply and demand. This ultimately enhances the benefits of economies of scale.
Digital technology also strengthens the links between ecological industries and other sectors, resulting in the emergence of new business models and formats. Increased integration across the primary, secondary, and tertiary industries has led to innovative cross-sector collaborations. For instance, the combination of agriculture and industry introduces advanced productivity and development models from modern industry into the agricultural sector. This deeper industrial integration positions the ecological industry for significant future growth.
3.3.2. Digital Finance
The application of digital finance can provide credit, insurance, and other financial services to the ecological industry, contributing to the expansion of the industry’s scale. This development addresses the financing bottlenecks faced by regions rich in ecological resources, particularly benefiting smaller entities within the ecological industry, such as small-scale farmers, cooperatives, and enterprises, which often occupy a disadvantaged position. Digital finance compensates for the shortcomings in the development of the ecological industry by enabling its supply chain to access more diversified and accurate financial services. These services cater to the various financing and credit needs of the industrial chain, promoting the optimization of the industrial structure. As a result, the long-tail effect of the “Internet +” model is further amplified [93], and financial inclusion is significantly expanded [94].
Moreover, digital data analysis and mining reduce information asymmetry in financial services, lowering costs and improving efficiency. This optimizes the allocation of funds and mitigates the risks faced by the ecological industry [95]. For instance, the use of big data, “Internet +” platforms, and blockchain technology in agricultural insurance enhances transparency and improves management efficiency. Transactions have become more convenient, increasing consumer engagement, overcoming the limitations of geographical distance and ecological resource constraints, expanding the search range for supply and demand information, and promoting urban-rural integration.
The scope of digital financial services has also been further extended to include vulnerable groups, such as underserved farmers, rural cooperatives, and innovation and entrepreneurship entities. Additionally, workers’ skills have improved, leading to the expansion of productive activities [96].
3.3.3. Digital Talent
Digital talent is a core element in the digital transformation of traditional industries, including the ecological industry. In this context, digital talent encompasses individuals with ICT (Information and Communication Technology) expertise, cross-disciplinary professionals who collaborate synergistically with ICT experts, and new-generation farmers with advanced digital literacy. Frontline workers in agriculture, forestry, and animal husbandry increasingly consist of emerging professional farmers and college-educated village officials. Through relevant training, their digital literacy has been steadily improving. With the rise of e-commerce, live streaming, and digital product sales, the ecological industry is becoming more interconnected with consumers, driving an increasing demand for digital talent.
The service sector associated with the ecological industry also requires corresponding digital expertise. In the financial services sector, for instance, digital talent is equipped with knowledge of financial models tailored to the ecological industry, enabling the design of financial products that leverage digital technologies to meet the needs of both enterprises and consumers. Furthermore, the emergence of new business models imposes specific demands on the specialization of talent. In the field of ecotourism, for example, digital professionals must possess diversified skills, such as data analysis, market research, and cross-border collaboration and innovation.
The integration of multiple industries necessitates that digital talent can effectively communicate and collaborate with technical experts, designers, and market professionals, thereby offering products and services that enhance the consumer experience. New-generation farmers are adept at utilizing digital tools like e-commerce and social media, integrating enterprise development with digitalization, and providing more diversified products and services, ultimately leading to higher profitability. Industrial convergence also promotes employment opportunities and income growth, further attracting a greater influx of digital talent.
3.4. Basic Assumptions
Based on this, the following assumptions are made, respectively:
H3:
Ecological industry integration plays an intermediary role through the three elements of digitalization to promote the development of the ecological industry.
H3.1:
The integration of the ecological industry plays an intermediary role through digital technology to promote the development of the ecological industry.
H3.2:
Integration of the ecological industry plays an intermediary role through digital finance and promotes the development of the ecological industry.
H3.3:
Integration of the ecological industry plays an intermediary role through digital talents to promote the development of the ecological industry.
To sum up, we believe that the mechanism of the integrated development of ecological industry can be represented in the following figure (Figure 6):
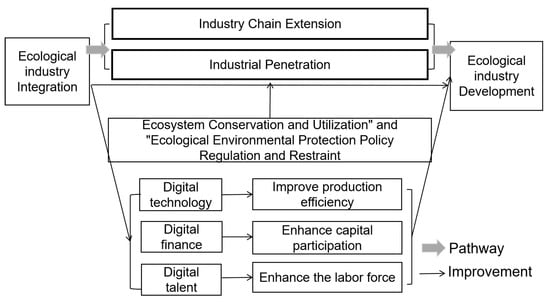
Figure 6.
Path and mechanism of ecological industry integration to promote the improvement of output value.
4. Model and Variables
4.1. Models
To analyze the influence of ecological industry integration degree on the ecological industry, the two-way fixed model is constructed as follows(reasons are shown in Appendix A.1):
where Outpuiit is calculated by using the total output value of ecological industry based on 2011, which is the sum of the output of agriculture, forestry, animal husbandry, fishery and tourism, namely the core explained variable;
In the benchmark regression, Output and related weight were performed using the Entropy method, shown by PCoutpuit; index_Xit represents the degree of integration of the ecological industry, namely the core explanatory variables, including the industrial chain extension ind_extendit, industrial infiltration ind_permeateit and the industrial convergence of integrationit (The total of ind_extendit and ind_permeateit);
α, is the coefficient vector of the control variable, controlit is the control variable, λi is the individual fixed effect that does not change with time, yeart stands for the time-fixed effect, and the εit represents a random perturbation term.
The three elements of digitalization, the application of digital technology, digital talent, and digital finance in the ecological industry, will affect the process of ecological industry integration. Therefore, refer to the research of Jiang et al. the paper built the intermediary effect model [97]:
where medit is the mediator variable; β1 represents the effect of industrial convergence on the mediating variables; γ2 stands for the effect of the mediation variable on the output value, γ1 shows the effect of the fusion on the output value after controlling for the mediation variables.
Environmental regulation could have an interactive effect on output, and it is tested as a regulatory variable to find out how it affects the process of integrating and promoting the output. The most significant impact on the unified protection of the ecological environment in China at present is the policy measures related to it. Policy preference for conservation or development determines the degree of controlling ecological resource utilization. Assuming that environmental regulation has a promoting or weakening impact on the output promoted by industrial integration, refer to Wen et al.’s study (2005) [98], environmental regulation and fusion interaction items were induced, and the regulation effect function was constructed as follows:
Enit means environmental regulation, and other parameters have the same meaning as the main function. When the independent variable is a continuous variable, and the adjustment variable is a categorical variable, we can group the adjustment variable parameters and compare the regression coefficient difference. If the difference is significant, the regulatory effect is significant. For adjustment variables, the environmental regulation is represented by the ratio of the frequency of environmental vocabulary words in prefecture-level cities to the frequency of prefecture-level cities’ government work reports [99].
4.2. Variables
These variables are described by selecting the appropriate indicators and constructing the index system. The basic principles are as follows: (1) the selected indicator system should be able to represent the characteristics of the indicators, and there should be a clear connotation and correlation; (2) the selected indicators should reflect the integration of ecological industries as much as possible; (3) indicators need to be multi-dimensional and independent, and to prevent repeated crossover; and (4) indicators should be operable and measurable. Based on the above, considering the availability and representativeness of the data, the following indicators are selected:
- (1)
- Explanatory variables: the level of industrial integration of ecological industry
The selection of the industrial integration level index refers to the research related to agricultural industry integration. Based on the previous research results [64,100], it is found that there is a group of measures to measure industrial integration [66,101,102,103]. Most of the indicators belong to the provincial level. Most of the indicators related to integration can also be classified into two categories: industrial chain extension and industrial penetration. These measurement indicators can be divided into two categories: total quantity and efficiency. Combined with the research objective, this study constructs the following ecological industry integration evaluation system based on the efficiency category. There are two reasons for selecting efficiency indicators. First, the ecological industry is inherently based on ecological resources. For example, certain protected areas impose restrictions on resource utilization. The goal of the eco-industry is to pursue efficiency improvements, which enhance productivity. The second reason for using efficiency indicators is that many factors, such as ecological resource endowment, population, industrial scale, and transportation infrastructure, vary between cities. Comparing total amounts across cities is less meaningful, making efficiency indicators more appropriate.
Based on the mechanism explanation mentioned above, this study believes that the index of industrial chain extension mainly refers to the upstream, middle reaches, and downstream of the industry, corresponding to the single ecosystem in the ecological industry. For example, agriculture includes agricultural production, crop processing, and agricultural product sales. It mainly includes agriculture, forestry, and tourism related. Industrial penetration mainly refers to the integration of industries corresponding to different ecosystems, such as agriculture and forestry, agriculture, and tourism.
The extension of the industrial chain is represented by the green and sustainable level of the ecological industry, the scale of processing industry operators of unit ecological resources, the mechanization level of unit ecological resources, the proportion of service industry in ecological industry, the proportion of agriculture, forestry, animal husbandry, and fishery population in the total population, and the density of ecological industry service industry entities. The industrial penetration level is represented by the government’s summary of the integration of the primary, secondary, and tertiary industries and the organizational form of the ecological industry.
Specifically, the green and sustainable level of ecological industry is characterized by the “pesticide and chemical fertilizer application amount (10,000 tons)/cultivated land area” and “greening input (ten thousand RMB)/urban area”. The scale of the processing industry of the unit ecological resources is mainly represented by the “main business income of agricultural products processing enterprises above the scale (100 million yuan)/cultivated land area”. The mechanization level of unit ecological resources is characterized by the “total power of agricultural machinery (kw)/cultivated land area”. The proportion of service industry in the ecological industry adopts the “output value of agriculture, forestry, animal husbandry, and fishery service industry (100 million yuan)/the total value of ecological industry”. The main density of the service industry of the ecological industry is measured by the “number of scenic spots (one)/total urban population” and “number of star hotels (one)/total urban population”.
According to the indicators of industrial penetration, it is believed that the integration of the primary, secondary, and tertiary industries is the industrial development direction promoted by governments at all levels in recent years. Therefore, the word frequency related to the integration of the primary, secondary, and tertiary industries in the local government work report represents the basic situation of the integration of the primary, secondary, and tertiary industries, and then represents the industrial penetration. Among them, the indicators related to the integration of primary, secondary, and tertiary industries include “leisure agriculture”, “rural e-commerce”, “agricultural industrial park”, “Internet + agriculture”, “integration of primary, secondary and tertiary industries”, “underforest economy”, “integration of agriculture and tourism”, “integration of forestry and tourism”, and “ecology”. In addition, the organizational form of ecological industry is mainly characterized by the “number of cooperatives/rural population”. The main consideration is that most of these industries are concentrated in agricultural and rural areas, and cooperatives are a very important way of participation in the main industrial organization form.
The weight of each index is determined by the objective right confirmation method (entropy method), and finally, the weighted average of each index is taken to obtain the index. The larger the value of the index is, the higher the integration degree of the ecological industry is.
Where the entropy method is used later, the operation process is consistent with the above content.
- (2)
- Interpreted variable: per capita total output value of ecological industry
There are many indicators that represent the development level of the ecological industry, which can be roughly divided into total type and efficiency type. To ensure the uniformity of the indicators with the explanatory variables, the study believes that the efficiency index is more suitable for comparison and represents the development level of ecological industry in a certain region. Therefore, the total output value of the ecological industry per capita is taken as the explanatory variable. The total output of the direct ecological industry is mainly characterized by the sum of the output value of agriculture, forestry, animal husbandry, fishery, and tourism industries (Agriculture, Forestry, Animal husbandry, Fishery and Tourism). The main reason is that these industries are not only the ones most directly related to the ecosystem but also the cross-industries between GEP and GDP. This represents the level of direct ecological industry and ecological industry.
- (3)
- Control variables
In order to investigate the impact of ecological industry integration on the output value of the ecological industry, other economic and social variables that may affect the ecological output value should be controlled. Ecological resource endowment, Openness to foreign investment, infrastructure level, education level, urbanization level, population scale, population density, government intervention level, and marketization level are selected here.
- (4)
- Data source and processing method
The data sources are as follows: The panel data from 270 cities at the prefecture level and above in China from 2011 to 2020 were used as the study samples. Considering the availability of data, the study sample did not cover Hong Kong, Macao, or Taiwan, excluding cities with severe data loss or changed names, including Sansha, Danzhou, Bijie, Tongren, Haidong, Karamay, Turpan, Hami, Shannan, Lhasa, Xigaze, Qamdo, Nyingchi, and Naqu. The details of this indicator are shown in the following Table (shown in Table 2).
Table 2.
Indicators involved in industrial integration and ecological industry association.
For the explained variables, the output value of agriculture, forestry, animal husbandry, fishery, and tourism, values come from the EPS database.
For explanatory variables: The employed population of agriculture, forestry, animal husbandry, and fishery mainly comes from the China Rural Statistical Yearbook, China City Statistical Yearbook, and Finance Yearbook of China. The number of cooperatives is obtained from the CCAD database. The data on “used pesticide and chemical fertilizer”, “major business income of agricultural product processing enterprises above designated size”, and “the total power of agricultural machinery” comes from Xu’s research [104]. The data on star hotels is mainly from the CEIC database. The data on scenic spots are mainly collected from the tourism directory of the website of the Ministry of Culture and Tourism and the websites of culture and tourism administrations of various provinces and regions, as well as related documents [105]. The greening investment is expressed by the landscaping expenditure and investment in the current year, which is used to represent the extension of the forestry industry chain from the “China City Statistical Yearbook”.
For control variables, the ecological resource data is mainly derived from Yang and Huang’s research at Wuhan University [106].
Some parameters related to natural resources were selected as control variables, including average rainfall, light, Normalized Difference Vegetation Index (NDVI), and green total factor productivity. Among them, the average rainfall data is mainly obtained from the Wang’s research [107]. The light data is mainly from the geographical remote sensing ecological network, and the NDVI vegetation index is mainly from the China annual vegetation index NDVI spatial distribution data set, specifically referring to Zhou’s research [108]. Slope data are mainly obtained from (Wang Xiaohong et al., 2022) [109].
The level of infrastructure is expressed by the road area per capita, which is calculated by the urban road area population ratio. The education level is calculated by the number of students in ordinary institutions of higher learning than the number of registered population at the end of the year. The level of opening-up depends on the total import and export volume/GDP.
Other data such as road area, education level, and urbanization level are from the China city statistical yearbook, China Urban Construction Statistical Yearbook, city statistical yearbook, and EPS database. Missing data in the indicators should first be sought from the National Economic and Social Development Statistical Bulletin. Data that is still missing should be supplemented through linear interpolation and median filling.
Additionally, it is important to highlight the calculation process for urban ecological industry digitalization. The digital technology of the ecological industry is primarily measured by the penetration rate of the urban ecological industry into the Information and Communications Technology (ICT) sector. The financial development level of the ecological industry is similarly expressed through its financial penetration rate into the financial sector. The penetration rate is derived from the direct consumption coefficient of the ecological industry with respect to ICT and the financial sector, based on the input-output tables for 2012, 2015, and 2017, sourced from the CEADs database. The input-output tables, covering 42 national sectors, were reclassified into ecological industries and other sectors. The direct consumption coefficients for the years 2011 to 2020 were calculated using linear interpolation and extrapolation.
Considering the different dimensions of each index and different economic meanings in the index system, the comparability of the original data is poor. We should standardize them before the actual calculation to make them in the same order of magnitude. We use the maximum and minimum standardization methods on the basis of the initial sample data. This method can adjust the initial sample data to a dimensionless value ranging between 0 and 100, and the values in the following years can break the upper and lower bounds of 0 and 100. The standardized algorithm used for the forward indicator is:
where, x is the value to be standardized, is the minimum value of this index at the beginning of the sample, and is the maximum value of this index at the beginning of the sample. The standardized algorithm used for the negative indicator is
The meaning of the symbol in the formula is the same as in the preceding formula. The calculation method for the above variables is further described below (as shown in Table 3).
Table 3.
Description of the variables.
The following table is the descriptive statistics for the relevant variables (Table 4). More details of explanation could be found from Appendix A.2.
Table 4.
Descriptive statistics of the related variables.
5. Results
5.1. Benchmark Regression
According to the results of the two-way fixed effects model, Table 5 (column 1) presents the regression outcomes without control variables, while column 2 includes control variables in the analysis. In both regressions, the estimated coefficient for ecological industry integration is significantly positive, indicating that the integration of ecological industries has indeed fostered industrial development. Specifically, for every 1% increase in the degree of ecological industry integration, industrial development increases by 0.208%.
Table 5.
Benchmark regression.
The integration of ecological industries shares similarities with general industrial integration, with key influencing factors such as reductions in transaction costs, adjustments in supply and demand dynamics, technological innovation, and government deregulation [28,109]. Ecological products are similarly affected by these elements, though the intensity and mechanisms of impact differ. In recent years, the Chinese government has actively promoted industrial integration across both general and ecological sectors.
Industrial integration enhances the output of the ecological industry, with specific factors driving improvements in output during the process. Ecological industry integration is often accompanied by cross-industry knowledge and technology exchanges, which can result in technological innovation and knowledge spillover effects. Additionally, the supply chain has been optimized, with the integration of upstream and downstream resources, leading to improvements in logistics and overall industrial chain performance.
Moreover, ecological industry integration can facilitate the formation of urban industrial clusters, thereby enhancing innovation capacity, reducing transaction costs, and increasing regional competitiveness through agglomeration effects. This development has significantly increased industrial openness and overall profitability, positioning the ecological industry as an important sector for attracting capital investment. By enhancing land value, attracting human resources, and promoting technological progress, the development of the ecological industry has been further advanced.
Industrial integration promotes the output of the ecological industry, with various influencing factors involved in the process. Ecological industry integration is often accompanied by cross-industry knowledge and technology exchanges, which may lead to technological innovation and knowledge spillover effects. The supply chain has also been optimized through the integration of upstream and downstream resources, leading to improved logistics and enhanced performance across the entire industrial chain. Moreover, the integration of ecological industries can facilitate the formation of urban industrial clusters, ultimately strengthening innovation capacity, reducing transaction costs, and enhancing regional competitiveness through the aggregation effect. Industrial integration has significantly increased the degree of industrial openness and comprehensive profitability, positioning the ecological industry as a key sector for attracting capital investment. The development of the ecological industry has been further advanced by enhancing land value, attracting human resources, and promoting technological progress.
The study divides the core variables and examines secondary indicators, specifically the relationship between industrial extension and industrial penetration in relation to the development of the ecological industry. Table 6 illustrates the relationship between industrial extension and the per capita output value of the ecological industry, as well as between industrial penetration and the per capita output value. The results indicate that while industrial extension has a positive impact on the development of the ecological industry, this association is not statistically significant. This suggests that the extension of the industrial chain alone may not fully explain industrial development and highlights the complexity of interactions between the two secondary indicators. It is possible that the lack of a significant association is due to the inclusion of additional variables in the analysis of industrial extension.
Table 6.
Regression results table for the segmented core explanatory variables.
By contrast, the influence of industrial penetration on the development of the ecological industry is both positive and statistically significant. For every 1% increase in the level of industrial penetration, the development of the ecological industry increases by 0.177%.
Compared with the benchmark regression on the primary index, the promotional effect of industrial penetration on the ecological industry is smaller than that of industrial integration. It appears that industrial chain extension plays a supportive role in the overall effect, and its direct impact on industrial development may be overshadowed by the effect of industrial penetration. Alternatively, the relationship between industrial chain extension and industrial development could be influenced by other variables.
From the perspective of industrial chain interactions, there are synergistic effects and economies of scale associated with both industrial chain extension and industrial penetration. On the one hand, industrial penetration can facilitate the sharing of technology, knowledge, and resources, while industrial chain extension provides broader application scenarios for these shared resources. This, in turn, promotes innovation between upstream and downstream industries, as well as across different sectors, fully leveraging the synergistic effects. On the other hand, both industrial chain extension and industrial penetration can further reinforce economies of scale. Additionally, to some extent, industrial chain extension can promote industrial penetration, while industrial penetration can make a positive contribution to the extension of the industrial chain.
In conclusion, the H1 was accepted.
5.2. Endogeneity Test
There may be endogeneity between ecological industry integration and the development of the ecological industry, stemming from two potential sources. First, a bidirectional causal relationship may exist between ecological industry integration and its development. For example, the advancement of the ecological industry can influence its integration, as seen in regions where high levels of ecological and economic development foster an active market, which in turn encourages the formation of diverse business models. Second, unobserved factors may simultaneously affect both the integration and development of the ecological industry.
To address this issue, the study employs an instrumental variable approach. The selection of an appropriate instrumental variable requires two conditions: (1) the variable must have no direct effect on the dependent variables, and (2) there must be a significant correlation between the instrumental variable and the endogenous explanatory variables. The urban-level Normalized Difference Vegetation Index (NDVI) was chosen as the instrumental variable. As a nature-derived measure, NDVI is theoretically sound. Higher vegetation coverage indicates more robust ecological resources, which are closely related to the development of the ecological industry and form the foundation for ecological economic growth. However, in areas with high vegetation coverage, the degree of industrial integration is not necessarily high, and the influence of vegetation on integration is indirect. The calculation results are presented in Table 7.
Table 7.
Results of regression of instrumental variables.
The Kleibergen-Paap rk LM statistic is 19.571, which is statistically significant at the 1% level, leading to the rejection of the null hypothesis of model non-identifiability. The Cragg-Donald Wald F statistic is 17.764, surpassing the Stock-Yogo critical value standard at the 10% level, indicating that the instrumental variable passes the weak instrument identification test.
In column (2) of Table 7, the coefficient for ecological industry integration remains significantly positive, confirming the robustness of the study’s conclusions after accounting for endogeneity.
5.3. Robustness Test
To verify the robustness of the results, several robustness tests were conducted by lagging the control variable by one period, advancing it by one period, excluding sub-provincial cities and municipalities directly under the central government, and employing the Winsorizing method to trim extreme values.
- (1)
- Lagging the control variables by one period: The estimated coefficient was 0.185, which is significant at the 1% level. This result indicates that even with the lagged control variable, ecological industry integration positively promotes the development of the ecological industry.
- (2)
- Advancing the control variables by one period: The estimated coefficient was 0.169, which was also significant at the 1% level. This suggests that, with the control variables advanced by one period, ecological industry integration continues to promote the development of the ecological industry.
For both lagging and advancing the control variables, the empirical conclusions remain valid, with only minor differences in the magnitude of the effect. This reflects the real-world dynamics, where industrial integration exerts varying degrees of influence on ecological industry development across different periods. The main differences are attributed to factors such as policy changes, infrastructure, and overall development environment. It is also noteworthy that the promotion effect of advancing the control variables is lower than that of lagging them, indicating a process of gradual improvement and progress.
- (3)
- Excluding sub-provincial cities and municipalities: Sub-provincial cities and municipalities directly under the central government typically have stronger economic foundations, better infrastructure, and more advanced markets and talent pools than other cities. To further test the robustness of the empirical results, these cities were excluded from the analysis, and a regression was conducted to verify the significance of the findings. The estimated coefficient was 0.203, passing the 1% significance test with a positive coefficient. This reaffirms that ecological industry integration promotes the development of ecological industries, further validating the robustness of the empirical results.
- (4)
- Winsorizing to eliminate extreme values: The Winsorizing method was applied to trim extreme values, eliminating explanatory variables above the 99th percentile and below the 1st percentile. The revised data was then used to re-estimate the model. The results, shown in Table 8, indicate a positive influence coefficient. While the trimming method slightly affects the results, it does not alter the overall trend. The significance of the findings confirms the robustness of the empirical conclusions.
Table 8. Robustness Test.
All four robustness tests yield significant results, confirming that the original benchmark regression is robust.
6. Further Study
6.1. Mediating Test
This section examines the mediating effect of digitalization in the relationship between ecological industry integration and the development of the ecological industry.
The mediating effect is a common assumption in causal analysis. In this study, digitalization promotes industrial integration and increases output, while industrial integration further enhances output. This represents a typical partial mediating effect.
Table 9 presents the mediating effect of digitalization applications in ecological industry integration. In columns 2–4, the coefficients for ecological industry integration are all significant and positive, indicating that the integration of ecological industries significantly promotes their development through digital technology, digital finance, and digital talent.
Table 9.
Test of the mediation effect.
According to column 2, the digitalization indicators—including digital technology, digital finance, and digital human resources—play a crucial role in enabling the integration of ecological industries to foster the development of conventional industries.
Column 3 shows that digital technology serves as a mediating factor in the impact of ecological industry integration on output, with a significance level of 1%. This finding suggests that the integration of ecological industries enhances the per capita total output value of the ecological industry through the application of digital technology.
As indicated in column 4, digital finance also mediates the relationship between integration and output, with the result being significant at the 5% level. This suggests that the integration of ecological industries may indirectly boost output by fostering the development of digital finance.
According to column 5, digital human resources play a mediating role in the effect of ecological industry integration on output, with the result being statistically significant at the 1% level. This indicates that ecological industry integration may indirectly increase output by promoting the development of digital human resources.
In conclusion, the model hypothesis H3 is supported, demonstrating that the integration of ecological industries promotes their development through the mediating effects of the three digitalization elements. Each of these sub-conclusions is also independently verified. Moreover, digitalization, as the driving force of the ecological industry, enhances it by improving energy efficiency, optimizing resource allocation, and increasing management efficiency, thereby accelerating the collaborative digital and green transformation of production models.
6.2. Moderator Effect
As shown in Table 10, the interaction term between industrial integration and environmental regulation is significantly positive at the 10% level, indicating that environmental regulation has an incentive effect effect in this process.
Table 10.
Moderator tests of environmental regulation on industrial integration.
One reason is the technology application and industrial upgrading. With the strengthening of environmental regulation, enterprises, and research institutions are encouraged to develop and adopt more environmental protection technology. These technologies help to improve the efficiency of resource utilization, reduce pollutant emissions, green transformation, and upgrading of traditional industries. Through clean production technology and circular economy models, the innovation and development of the ecological industry are promoted, and its green competitiveness is improved. The other reason is due to the change in market demand. The improvement of environmental regulation or ecosystem conservation policies reflects the enhancement of social awareness of environmental protection, which encourages consumers to be more inclined to choose green products and services, thus stimulating the market demand of the ecological industry and promoting the development of the industry.
To sum up, ecological environment regulation plays a positive role in the process of ecological industry integration, impacting ecological industry output. Therefore, the H2 hypothesis has been verified.
6.3. Heterogeneity Test
This part mainly examines the heterogeneity through four types, mainly including different time periods, different regions, different levels of importance of ecosystems, and different industries.
6.3.1. Heterogeneity Test of Different Periods
The heterogeneity of industrial integration was examined across different periods (Table 11). The results indicate that industrial integration in both periods, 2011–2015 and 2016–2020, positively and significantly influenced the development of the ecological industry. Specifically, from 2011 to 2015, a 1 percentage point increase in the level of industrial integration corresponded to a 1.617% increase in the development of the ecological industry. From 2016 to 2020, this effect increased, with a 1 percentage point rise in industrial integration, leading to a 3.24% growth in the ecological industry.
Table 11.
Results of heterogeneity tests of different periods.
The stronger impact observed in the latter period can be attributed to several factors:
Firstly, the ecological industry itself has encountered new growth opportunities, with the marketization of industrial development further advancing. For instance, according to the “Opinions on Establishing and Improving the Mechanism of Ecological Product Value Realization” issued by the General Office of the Central Committee of the Communist Party of China and the General Office of the State Council, governments at all levels have accelerated the establishment and enhancement of mechanisms for realizing the value of ecological products. This includes promoting the registration of natural resources and the transaction of ecological resources, with the goal of achieving both ecological industrialization and industrial ecology.
Secondly, the ecological industry has benefited from the synergies of multiple policies, such as the Rural Revitalization Strategy and the “Digital China” initiative, which have significantly boosted industrial development and integration. The implementation of the rural revitalization strategy has provided new development opportunities for the ecological industry by promoting agricultural modernization, fostering specialty agriculture, and encouraging rural tourism. These efforts not only strengthen the rural economy but also inject vitality into the ecological industry. Furthermore, consumer demand for environmentally friendly products and services has grown, further driving the integration and development of ecological industries.
Additionally, digital transformation has provided crucial technical support for the ecological industry. The application of technologies such as the Internet of Things, big data, cloud computing, and artificial intelligence has enhanced the intelligence and automation of the ecological industry, optimized resource allocation, and increased the sector’s competitiveness. These advancements have facilitated information sharing and resource integration across industries, thereby improving the efficiency and effectiveness of industrial integration.
6.3.2. Heterogeneity Test of Different Regions
The regional heterogeneity analysis is presented in Table 12. Based on the classification standards of the National Bureau of Statistics, the sample is divided into eastern, central, and western regions to assess the regional heterogeneity in the effects of ecological industry integration. The estimated coefficient for ecological industry integration in the eastern region is 0.143, and in the western region, it is 0.237, both significant at the 1% level. However, the relationship between the degree of integration and ecological industry development in the central region is not statistically significant.
Table 12.
Results of heterogeneity tests of different regions.
The higher coefficient in the western region can be attributed to its significant resource endowment advantage, where ecological resources have played a crucial role in driving the development of the ecological industry. In addition, China’s recent emphasis on the development of its western regions has facilitated industrial integration in these areas. In contrast, the central region’s insignificance can be explained by the multitude of factors influencing industrial integration. The region lacks a distinctive resource endowment and does not possess as unique an industrial structure as the eastern region, which diminishes its significance in this context.
In the eastern region, while industrial integration is relatively high, it also benefits from a favorable environment for sectoral development, further promoting the integration and growth of the ecological industry.
6.3.3. Heterogeneity Tests of Different Eco-Systems
Firstly, cities are classified based on whether they contain National Key Ecosystem Areas (key ecological function zones), and heterogeneity tests are conducted accordingly. As shown in Table 13, industrial integration has varying effects on the ecological industry in the two types of cities. In areas without ecological function zones, a 1% increase in industrial integration results in a 0.229% rise in the level of ecological industry development. In contrast, in cities with ecological function zones, the impact is not significant and shows a negative correlation.
Table 13.
Results of heterogeneity tests of different eco-systems.
This may be due to the stricter environmental protection requirements in regions with ecological function zones, where conservation demands outweigh development potential, making the growth of the ecological industry more challenging. This finding aligns with the conclusion regarding environmental regulation, which also exhibits a trend of negative influence.
Secondly, the paper examines the heterogeneity of agricultural ecosystems. The level of urban agricultural development is categorized based on the total power of agricultural machinery per capita (in megawatts). In cities with a high level of agricultural development, a 1% increase in industrial integration corresponds to a 0.234% increase in the development of the ecological industry. However, in cities with lower levels of agricultural development, this effect is not significant. This difference can be attributed to the fact that agriculture is a core component of ecological industries, characterized by high interconnectivity and a substantial share of the local economy. Cities with more advanced agricultural sectors typically also have higher overall economic development, further enhancing the relationship between industrial integration and ecological industry growth. In contrast, in cities with underdeveloped agricultural sectors, the proportion of agriculture in the economy is less significant, resulting in a weaker relationship between industrial integration and ecological industry development.
6.3.4. Heterogeneity Test of Different Sectors
The ecological industry can be further subdivided into agriculture, forestry, fisheries, animal husbandry, and tourism. As shown in Table 14, a 1% increase in industrial integration results in growth rates of 0.128, 0.160, 0.229, 0.174, and 0.563% for the five sectors, respectively, all significant at the 1% level. The estimated coefficients for the impact of industrial integration on each sector are significantly positive, indicating that the integration of ecological industries effectively enhances the development of these sectors. This suggests that the economic growth derived from higher levels of industrial integration varies across different ecological industries.
Table 14.
Results of heterogeneity tests of different industries.
This demonstrates that, overall, the integration of ecological industries is beneficial to their development, and the integration of different industries can produce a synergistic effect, the so-called “1 + 1 > 2” effect. Additionally, integration has a varying degree of promotion across different sectors. Our analysis is closely tied to the characteristics of the industries themselves, which differ in resource dependence, productivity levels, and the ease of integration. Some sectors, such as tourism, can be integrated with multiple industries. Integration not only enhances coordination within industries but also creates new growth opportunities, driving optimal resource allocation and market expansion. Both enterprises and policymakers should recognize the potential of industrial integration.
Notably, the impact on the tourism industry is the most pronounced, exceeding that of the other sectors. This is consistent with real-world observations, where the integration of ecological industries has led to the emergence of increasingly diverse services and sectors, such as experiential tourism and eco-tourism. These developments significantly enhance the appeal and profitability of the tourism sector, as well as the per capita ecological output.
In the fisheries and livestock industries, improvements in industrial integration have resulted in increased value-added, technological advancements, and optimized resource allocation, driving rapid output growth. While the growth in agriculture and forestry is less pronounced than other sectors, their integration with broader industrial chains still significantly enhances their market value and profit margins. This diversity in outcomes aligns with the varying foundations and levels of integration within each sector, ultimately leading to differentiated impacts on industrial growth.
7. Conclusions
Using prefecture-level panel data from 2011 to 2020, this paper demonstrates the positive impact of industrial integration on the development of the ecological industry and analyzes the effects of industrial chain extension and industrial penetration. The findings reveal that digitalization plays a crucial role in this process. To examine these relationships, a two-way fixed effects model was constructed following a collinearity test, and robustness and mechanism tests were conducted. The results indicate that industrial integration promotes the growth of the ecological industry through both industrial chain extension and industrial penetration, as evidenced by the increase in per capita output of the ecological industry. Additionally, mechanism analysis reveals that digitalization —encompassing digital technology, digital finance, and digital human resources—acts as an intermediary, while environmental regulation plays a moderating role.
The results of this study are highly insightful. It extends the research on industrial integration from fields like manufacturing to the ecological industry, a unique sector facing challenges such as low productivity, balancing conservation and utilization, and a lack of infrastructure and human resources. The study also refines the concept of industrial integration by dividing it into two forms: industrial chain extension and inter-industry penetration. The principle of output value increase is explained through the smile curve and measured using relevant indicators. From a practical standpoint, the study suggests that future enterprises and industries should not rely solely on a single type of ecological resource but instead focus on comprehensive utilization.
In practice, many cases have demonstrated this conclusion and achieved notable economic, social, and environmental benefits. Well-known examples include the “Lishui mountain farming” brand in Zhejiang, among others. For instance, in the exemplary cases of ecological product value realization promoted by the Department of Natural Resources, the integration of eco-industries is encouraged. Additionally, rural revitalization has emphasized the revitalization of rural industries, with sector integration being mentioned multiple times in the government’s annual agriculture policy. In the policy titled Opinions of The General Office of the State Council on Practicing the Big Food Concept and Building a Diversified Food Supply System, the integration of ecological industries is also highlighted from the perspective of food security and human health.
In this regard, this conclusion offers significant insights for both the eco-industry and governments. First, the industry needs to recognize the importance of industrial integration. Going forward, it is crucial to encourage collaboration and interaction across different industries, extend the industrial chain, and promote cross-industry penetration, avoiding the traditional single-industry development model. This will support the integrated development of the primary, secondary, and tertiary sectors. Secondly, the eco-industry should focus on digitalization, particularly in integrating technology, finance, and talent. The impact of digital technology and digital finance on the eco-industry primarily stems from the transfer of high production efficiency from the digital sector to the ecological sector, while talent can facilitate cross-regional project cooperation. Additionally, governments must provide policy and financial support, as ecological products produced by the eco-industry possess certain public attributes. For instance, governments should establish a public trading platform for ecological products, set standards for such products, and enhance training for eco-industry workers.
Looking ahead, China is expected to continue advancing ecological civilization in the economic domain, with particular emphasis on fostering ecological industries to promote the ecological economy. Increased national-level support is anticipated, suggesting that more financial resources will be allocated in the future. Attention should be given to the coordination of various policies to ensure their effectiveness. Moreover, the development of ecological industries hinges on establishing a market mechanism for ecological products and creating a more stable supply-demand relationship, with digitalization playing a pivotal role in this process. With continued policy and technological support, the ecological industry is expected to follow a more integrated and sustainable path of development. Future research can focus on areas such as policy coordination for the integrated development of ecological industries, policy simulations, and case studies. The application of these elements of digitization also faces a series of challenges. For example, digital technology requires significant capital investment and a substantial infrastructure base, making the costs relatively high. Additionally, a robust innovation system is essential. Digital finance is generally underdeveloped in agricultural and rural areas, highlighting the need to promote inclusive finance. The shortage of digital talent, particularly in rural areas, is difficult to address in the short term.
The application of digitization has brought many positive changes, such as improved production efficiency, optimized resource allocation, and enhanced traceability of agricultural products. However, it also comes with challenges, such as issues with technology maturity and reliability, unemployment from automation, and concerns over data security and privacy. These factors should be considered in policy-making and industrial development. This suggests that the impact of digitalization on industrial integration and development is evolving dynamically.
Our research focuses on the mechanisms by which digitalization affects the development of industrial integration, primarily through mediation effects. It also provides explanations for the moderation mechanism of environmental-ecological policies. However, these mechanisms offer only a general analysis of certain paths, demonstrating broad impacts, whether positive or negative. Due to word count limitations, we did not delve into specific details or factors. For instance, we did not examine the specific mechanisms of digitalization, the influence of government policies, or practical experiences and principles at the micro level. These areas are valuable for both theory and practice and should be explored in future research. In-depth case studies and further quantification of these mechanisms can provide a deeper analysis.
Author Contributions
T.L. and J.Y. designed the study, C.L. and X.L. performed the statistical analysis. J.Z. collected the data and polished the language. X.L. drafted the manuscript. All authors have read and agreed to the published version of the manuscript.
Funding
Guangdong Province Philosophy and Social Science Project (GD23XGL089), Basic and Applied Basic Research Foundation, Guangdong (2022A1515110238), and National Natural Science Foundation (42375175).
Institutional Review Board Statement
This study did not require approval from the Institutional Review Board because it involved the analysis of publicly available. No human subjects were involved in the research, and no personal or identifiable information was collected or analyzed.
Informed Consent Statement
Informed consent was obtained from all individual participants included in the study.
Data Availability Statement
All data included in this study are publicly available, which can be found in the reference mentioned in the paper.
Conflicts of Interest
The authors declare no conflict of interest.
Appendix A
Appendix A.1
The Hausman test is typically used to determine whether a fixed-effects model or a random-effects model is more appropriate. If the test suggests a fixed-effects model, it should be chosen.
- Collinearity Test
The VIF test was used to assess whether collinearity exists in the model. Generally, it is believed that when the VIF (variance inflation factor) exceeds 10, or strictly greater than 5, collinearity is present. From the table below, the VIF values for all variables are less than 5, and the tolerance (1/VIF) is strictly greater than 0.2. The average VIF is 2.34, with the highest value being 4.7 for population density (pop_den), indicating no multicollinearity problem.
Table A1.
VIF test results.
Table A1.
VIF test results.
| Variables | VIF | 1/VIF |
|---|---|---|
| pop_den | 4.7 | 0.212882 |
| pop | 4.16 | 0.240282 |
| urbanization | 3.22 | 0.310462 |
| farmland | 3.11 | 0.321852 |
| integration | 2.3 | 0.435545 |
| forest | 2.06 | 0.485656 |
| goV | 1.69 | 0.591515 |
| education | 1.65 | 0.605104 |
| water_area | 1.54 | 0.649057 |
| road | 1.3 | 0.769263 |
| open | 1.27 | 0.789248 |
| market | 1.1 | 0.906853 |
| Mean VIF | 2.34 | |
- Choice of Random Effects and Fixed Effects
The Hausman test is used to compare the estimates of fixed effects (FE) and random effects (RE) to determine which model is more suitable for the data. The fixed-effects model is appropriate if the individual effects are related to the explanatory variables, while the random-effects model is more efficient if the individual effects are independent of the explanatory variables. The Hausman test helps determine whether individual effects are associated with explanatory variables, guiding the choice between a fixed-effects model and a random-effects model.
The Hausman test results indicate that for H1, the random-effects model is appropriate (if the individual effects are independent of the explanatory variables, RE is the better model). The fixed-effects model is appropriate (if the individual effects are related to the explanatory variables, FE is the better model).
If the test statistic and p-value are 0.0000, significantly less than 0.05 (commonly using a 5% significance level), we can reject the null hypothesis that the random-effects model fits the data. Therefore, based on the Hausman test results, the individual effects are associated with the explanatory variables, indicating that the fixed-effects model (FE) is more appropriate.
Specifically, the estimates for variables such as integration, forest, farmland, water_area, and population (pop) varied significantly between the two models, indicating notable differences in their explanatory power. For example, the coefficient for farmland in the fixed-effects model was 0.7184752, compared to 0.0794641 in the random-effects model, a difference of 0.6390111, highlighting the large variation and further supporting the use of the fixed-effects model. While the coefficients for some variables, such as forest and urbanization, showed smaller differences between the two models, the overall test results still indicate that the fixed-effects model better captures individual differences. Additionally, the substantial variation in estimates for certain variables, like farmland and population, suggests significant individual heterogeneity in explaining the development of ecological industries.
In conclusion, the fixed-effects model (FE) is more appropriate for this study’s data. Since there is a correlation between individual effects and explanatory variables, the fixed-effects model better mitigates the influence of individual effects on the estimates, providing more consistent results.
Table A2.
Hausman test results.
Table A2.
Hausman test results.
| Coefficient | sqrt(diag(V_b − V_B)) Std.err. | |||
|---|---|---|---|---|
| (b) | (B) | (b − B) | ||
| FE | RE | Difference | ||
| integration | 0.5784431 | 0.5573237 | 0.0211195 | 0.0075583 |
| forest | 0.0351612 | 0.0393916 | −0.0042303 | 0.0528793 |
| farmland | 0.7184752 | 0.0794641 | 0.6390111 | 0.1446577 |
| water_area | −0.1965225 | 0.0959134 | −0.2924359 | 0.0711893 |
| open | −0.0000896 | −0.002032 | 0.0019425 | 0.0023433 |
| road | 0.0748163 | 0.0798889 | −0.0050726 | 0.012045 |
| education | 1.542078 | 1.956193 | −0.4141156 | 0.7388108 |
| urbanization | −0.1663572 | −0.1589181 | −0.0074391 | 0.0796067 |
| pop | 0.4337712 | −0.1746916 | 0.6084627 | 0.1056205 |
| pop_den | −0.0240501 | 0.0996541 | −0.1237042 | 0.0471795 |
| goV | −0.0070165 | −0.0074635 | 0.000447 | 0.000871 |
| market | 0.0385697 | 0.0588222 | −0.0202525 | 0.0028398 |
b = Consistent under He and Ha; obtained from xtreg. B = Inconsistent under Ha, efficient under HO; obtained from xtreg. Test of HO: Difference in coefficients not systematic. chi2(12) = (b − B)′[(V_b − V_B)−1](b − B) = 53.94. Prob > chi2 = 0.0000. (V_b − V_B is not positive definite).
Appendix A.2. Data Descriptive Statistics
The data presented in this paper include 2970 observations, covering several key variables related to the development of urban ecological industries. These variables include the output value of urban ecological industries, as well as the output value of agriculture, forestry, animal husbandry, fishery, tourism, and other sectors. Additionally, they encompass the level of ecological industry integration, digital technology, and digital finance. A detailed description of these variables and an interpretation of the basic statistical results will follow.
The average natural logarithm of per capita ecological industry output was 9.3978, with a standard deviation of 0.588. This indicates that while the per capita output of the ecological industry varies across cities, the overall level is relatively concentrated. The industry shows a positive development trend in per capita output, with relatively small gaps between cities. However, there are significant regional differences in agricultural output per capita, with some cities showing very low values. Forestry, overall, exhibits low per capita output, with particularly low contributions in certain cities. The per capita output of animal husbandry fluctuates greatly; some cities perform well, but the overall level remains low. Fisheries contribute more in coastal cities, but overall output is low, especially in in-land areas. Tourism makes a notable contribution in some cities, with clear regional disparities, and a few cities show outstanding performance in this sector.
For the ecological industry integration and development indicators, the overall performance is strong, with some cities showing a relatively high integration index, indicating effective collaboration between the ecological industry and other sectors. The extension of the industrial chain varies significantly across cities, with some excelling in promoting the expansion of the ecological industrial chain. The construction and development of integrated sup-porting facilities also vary greatly, but overall, cities have performed well in advancing these facilities.
In terms of natural resource variables, woodland and grassland areas vary significantly across cities, with some cities having abundant ecological resources. The cultivated land area is relatively balanced among cities, with less variation compared to forest land. Water areas are evenly distributed, with some cities being relatively rich in water resources.
For openness, infrastructure, and other indicators, the degree of openness varies greatly across cities, with a few cities having a higher level of openness. Per capita road area differs among cities, with some having relatively well-developed infrastructure. Educational resources are unevenly distributed, being concentrated in certain cities. The level of urbanization also varies significantly, with the urbanization rate being relatively high in the more developed eastern regions.
In terms of ecological industry digitization and related variables, there are significant differences in the application of digital technology, with a few cities having a high level of technology adoption. The use of digital finance in the ecological industry also varies, with some cities at a low level, indicating the need for further development in this area. The digital talent reserve differs greatly between cities, with some having a rich pool of digital talent.
In other aspects, vegetation coverage is generally good, and most cities have a strong ecological foundation. The proportion of government fiscal expenditure in GDP varies significantly across cities, with some cities allocating a relatively high proportion of public budget expenditure.
From the above descriptive statistics, it is evident that there are significant regional differences in the development of urban ecological industries and related fields. Cities differ in terms of ecological industry integration, natural resources, infrastructure, and digitalization levels.
References
- Wang, J.N.; Wang, Z.K.; Xie, G.H.; Ma, G.X.; Wang, X.H.; Zhao, Y.H. A Framework Research of Theory and Its Practice of the Fourth Industry of Ecological Products. Chin. J. Environ. Manag. 2021, 13, 5–13. [Google Scholar]
- Gao, X.L.; Lin, Y.Q.; Xu, W.H.; Ouyang, Z.Y. Research progress on the value realization of ecological products. Acta Ecol. Sin. 2020, 40, 24–33. [Google Scholar]
- Li, X.Y.; Wang, Y.F.; Liu, C.X. The Value Realization Mechanism of Ecological Products in China: Basic Logic, Influence Factors and Realization Path. Environ. Prot. 2023, 51, 36–40. [Google Scholar] [CrossRef]
- Zhang, L.B.; Yu, H.Y.; Hao, C.Z. Practice Model and Path of Ecosystem Product Value Realization. Res. Environ. Sci. 2021, 34, 1407–1416. [Google Scholar]
- Zhang, W.M.; Zhang, X.D. The Capitalization of Ecological Resources: An Explanatory Framework. Reform 2019, 299, 122–131. [Google Scholar]
- Li, Y.S. Ecological industrialization management and the value realization of ecological products. Res. Social. Chin. Charact. 2018, 4, 84–90. [Google Scholar]
- Chen, Q.R.; Chen, B.; Xie, H.L.; Wu, M.Y.; Song, G.W. Digital Empowering Ecological Product Value Realization: Basic Logic and Typical Paths. China Land. Sci. 2023, 37, 116–127. [Google Scholar]
- Hu, Y.; Li, Y.S. Expanding the Path to Realize the Value of Eco-Products Through Digitalization. Environ. Prot. 2023, 51, 17–20. [Google Scholar]
- Wang, R.S.; Yang, J.X. Industrial Ecology and Transition to Eco-industry. World Sci-Tech. RD 2000, 5, 24–31. [Google Scholar]
- Chen, X.L. Analysis on the development of ecological industry. Macroecon. Manag. 2008, 6, 60–62. [Google Scholar]
- Li, Z. The theoretical perspective of the development of ecological industry and the basic idea of the construction of Poyang Lake Ecological Economic Zone. J. Poyang Lake 2009, 1, 18–24. [Google Scholar]
- Uekusa, M. Industrial integration of information and communication industry. China Ind. Econ. 2001, 19, 24–27. [Google Scholar]
- Hacklin, F.; Raurich, V.; Marxt, C. Implications of technological convergence on innovation trajectories: The case of ICT industry. Int. J. Innov. Technol. Manag. 2005, 2, 313–330. [Google Scholar] [CrossRef]
- Xing, W.; Ye, X.; Kui, L. Measuring convergence of China’s ICT industry: An input–output analysis. Telecommun. Policy 2011, 35, 301–313. [Google Scholar] [CrossRef]
- Stieglitz, N. Digital dynamics and types of industry convergence: The evolution of the handheld computers market. In The Industrial Dynamics of the New Digital Economy; Edward Elgar Publishing: Cheltenham, UK, 2003; pp. 179–208. [Google Scholar]
- Hacklin, F.; Marxt, C.; Fahrni, F. An evolutionary perspective on convergence: Inducing a stage model of inter-industry innovation. Int. J. Technol. Manag. 2010, 49, 220–249. [Google Scholar] [CrossRef]
- Curran, C.-S.; Bröring, S.; Leker, J. Anticipating converging industries using publicly available data. Technol. Forecast. Soc. Change 2010, 77, 385–395. [Google Scholar] [CrossRef]
- Lee, G.K.-F. The Competitive Consequences of Technological Convergence in an Era of Innovations: Telephony Communications and Computer Networking, 1989–2001; University of California: Berkeley, CA, USA, 2003. [Google Scholar]
- Hacklin, F.; Marxt, C.; Fahrni, F. Coevolutionary cycles of convergence: Will” NBT” become the next ICT? In Proceedings of the PICMET’07-2007 Portland International Conference on Management of Engineering & Technology, Portland, OR, USA, 5–9 August 2007; pp. 246–258. [Google Scholar]
- Doganova, L.; Eyquem-Renault, M. What do business models do?: Innovation devices in technology entrepreneurship. Res. Policy 2009, 38, 1559–1570. [Google Scholar] [CrossRef]
- Pennings, J.M.; Puranam, P. Market convergence & firm strategy: New directions for theory and research. In Proceedings of the ECIS Conference: The Future of Innovation Studies, Eindhoven, The Netherlands, 21–23 September 2001. [Google Scholar]
- Niedergassel, B.; Curran, C.-S.; Leßing, M.; Leker, J. What drives partners in industry-academia cooperation? A special consideration of reducing uncertainty through computational chemistry. Int. J. Technol. Intell. Plan. 2007, 3, 331–342. [Google Scholar] [CrossRef]
- Cameron, G.; Proudman, J.; Redding, S. Technological convergence, R&D, trade and productivity growth. Eur. Econ. Rev. 2005, 49, 775–807. [Google Scholar]
- Hacklin, F.; Marxt, C.; Fahrni, F. Coevolutionary cycles of convergence: An extrapolation from the ICT industry. Technol. Forecast. Soc. Change 2009, 76, 723–736. [Google Scholar] [CrossRef]
- Duysters, G.; Hagedoorn, J. Organizational modes of strategic technology partnering. J. Sci. Ind. Res. 2000, 59, 640–649. [Google Scholar]
- Lee, G.K. The significance of network resources in the race to enter emerging product markets: The convergence of telephony communications and computer networking, 1989–2001. Strateg. Manag. J. 2007, 28, 17–37. [Google Scholar] [CrossRef]
- Benner, M.J.; Ranganathan, R. Divergent reactions to convergent strategies: Investor beliefs and analyst reactions during technological change. Organ. Sci. 2013, 24, 378–394. [Google Scholar] [CrossRef]
- Ma, J. A Review of Theoretical Research on Industrial Convergence. Econ. Perspect. 2002, 5, 78–81. [Google Scholar]
- Zhou, Z.H. Research on industrial convergence in the process of informatization. Econ. Perspect. 2002, 6, 58–62. [Google Scholar]
- Rosenberg, N. Technological change in the machine tool industry, 1840–1910. J. Econ. Hist. 1963, 23, 414–443. [Google Scholar] [CrossRef]
- NDRC. Research on Promoting the Integration of Primary, Secondary, and Tertiary Industries in Rural Areas of China. Rev. Econ. Res. 2016, 4, 3–28. [Google Scholar]
- Zhao, X.; Shi, B.F.; Ge, Q.E.; Wu, B.; Zhao, M.J. Promoting Revitalization through Integration: The Income Increase Effect of New Type of Agricultural Operating Entities Participating in Industrial Integration. J. Manag. World 2023, 39, 86–100. [Google Scholar]
- Wang, Y.; Huang, H.; Liu, J.; Ren, J.; Gao, T.; Chen, X. Rural Industrial Integration’s Impact on Agriculture GTFP Growth: Influence Mechanism and Empirical Test Using China as an Example. Int. J. Environ. Res. Public Health 2023, 20, 3860. [Google Scholar] [CrossRef]
- Casini, L.; Contini, C.; Romano, C. Paths to developing multifunctional agriculture: Insights for rural development policies. Int. J. Agric. Resour. Gov. Ecol. 2012, 9, 185–203. [Google Scholar] [CrossRef]
- Preschitschek, N.; Curran, C.-S.; Leker, J. The importance of access to resources in a setting of industry convergence: The case of agriculture and chemistry. In Proceedings of the 2011 Proceedings of PICMET’11: Technology Management in the Energy Smart World (PICMET), Portland, OR, USA, 31 July–4 August 2011; pp. 1–9. [Google Scholar]
- Râmniceanu, I.; Ackrill, R. EU rural development policy in the new member states: Promoting multifunctionality? J. Rural Stud. 2007, 23, 416–429. [Google Scholar] [CrossRef]
- Trelogan, H.C.; Davis, J.H.; Goldberg, R.A. A Concept of Agribusiness. J. Mark. 1957, 22, 221. [Google Scholar] [CrossRef]
- Ma, X.H. Promoting the In-depth Integration Development of Primary, Secondary, and Tertiary Industries in Rural Areas. China Coop. Econ. 2015, 2, 43–44. [Google Scholar]
- Kong, X.Z. Cooperatives are the Core Entities of the Integration of the Three Industries. China Coop. Econ. 2018, 5, 38. [Google Scholar]
- Liu, T.S.; You, S.Q. Promoting Rural Revitalization through Industrial Prosperity: From the Perspective of Agriculture and Agricultural Rural Services. Xinjiang State Farms Econ. 2019, 11, 16–25. [Google Scholar]
- Wen, T.J.; Yang, Z.; Zhang, J.N. The Way to Achieve Industrial Prosperity in the Strategy of Rural Revitalization. Adm. Reform 2018, 8, 26–32. [Google Scholar]
- Naruto, I. Regional Production Vitality and the Sixth-Industrialization of Agriculture; 21st Century Rural Publishing House: Tokyo, Japan, 1998. [Google Scholar]
- Marsden, T.; Sonnino, R. Rural development and the regional state: Denying multifunctional agriculture in the UK. J. Rural Stud. 2008, 24, 422–431. [Google Scholar] [CrossRef]
- Chen, X.W.; Zhang, T.Y.; Jia, F. Industry convergence as a strategy for achieving sustainable development of agricultural complex: The case of Sandun-Lanli in China. Bus. Strategy Environ. 2020, 29, 2679–2694. [Google Scholar] [CrossRef]
- Yang, G.; Zhou, C.; Zhang, J. Does the synergy among agriculture, industry, and the service industry alleviate rural poverty? Evidence from China. Appl. Econ. Lett. 2023, 30, 1417–1421. [Google Scholar] [CrossRef]
- He, L.S.; Li, S.X. Industrial Amalgamation and Agriculture Development. Jinyang Acad. J. 2005, 1, 37–40. [Google Scholar]
- Guo, T.M. New Understanding of Industrial Integration and the Path of New Type Industrialization. Southeast Acad. 2005, 1, 71–75. [Google Scholar]
- Guo, J.; Zhang, X.R.; Kong, X.Z. The Convergence of Primary, Secondary and Tertiary Industries and Farmers’ Income Generation: One Case Study of Convergence of Primary, Secondary and Tertiary Industries in Rural Areas of Henan Province. Issues Agric. Econ. 2019, 3, 135–144. [Google Scholar]
- Li, Z.; Wang, D.Y. Construction and Evaluation of Convergence of Primary, Secondary, and Tertiary Industries. Acad. J. Zhongzhou 2017, 9, 54–59. [Google Scholar]
- Shen, W.L.; Jie, B.; Ton, P.N.; Hu, X.H.; Liu, J.Y. Industry convergence in rural tourism development: A China-featured term or a new initiative? Curr. Issues Tour. 2018, 20, 2453–2457. [Google Scholar] [CrossRef]
- Liu, Y.J.; Zhang, M.C.; Cao, Q.; Wang, E.; Zou, B.K. Can Integration of Agriculture and Tourism Promote Rural Green Development?—Empirical Evidence from 152 Cities in China. Agriculture 2023, 13, 405. [Google Scholar] [CrossRef]
- Kong, X.Z. Industry Prosperity as the Foundation of Rural Revitalization. Rural Financ. Res. 2018, 2, 9–13. [Google Scholar]
- Cao, Z. Brief Discussion on the Practical Approaches to the Deep Integration of Primary, Secondary, and Tertiary Industries in Rural Areas. Rural Econ. 2022, 12, 98–100. [Google Scholar]
- Jiang, C.Y. Innovation-Led Integration Development of Primary, Secondary, and Tertiary Industries in Rural Areas. China Rural Sci. Technol. 2015, 11, 15. [Google Scholar]
- Jiang, C.Y. The Paths and Key Points of Promoting Industrial Integrated Development among Primary, Secondary and Tertiary. Acad. J. Zhongzhou 2016, 5, 43–49. [Google Scholar]
- Zhang, X.Y.; Wang, X.L. The Path and Development of Rural Industrial Integration in China from the Perspective of the Sixth Industry: A Discussion on the Enlightenment of Japan’s Sixth Industry Development. Guizhou Soc. Sci. 2023, 1, 152–160. [Google Scholar]
- Chen, X.Y.; Cheng, C.M. The Route of Three Industries Integration under the Strategy of Rural Revitalization: Logical Inevitability and Empirical Judge. Issues Agric. Econ. 2018, 11, 91–100. [Google Scholar]
- Sun, Z.Y. Path Transformation in Agricultural Industrialization: Industrial Convergence and Industrial Clustering. Econ. Surv. 2005, 4, 37–39. [Google Scholar]
- Bhagat, P.R.; Naz, F.; Magda, R. Artificial intelligence solutions enabling sustainable agriculture: A bibliometric analysis. PLoS ONE 2022, 17, e0268989. [Google Scholar] [CrossRef] [PubMed]
- Zhang, Y.B. Industrial Convergence and Interaction in the Vision of Agricultural Modernization and Its Path. Reform 2015, 2, 98–107. [Google Scholar]
- Jiang, R.Q. Research on the Optimization of Agricultural Industrial Structure in Jiangxi Based on Industrial Integration; Nanchang University: Nanchang, China, 2013. [Google Scholar]
- Geum, Y.; Kim, M.-S.; Lee, S. How industrial convergence happens: A taxonomical approach based on empirical evidences. Technol. Forecast. Soc. Change 2016, 107, 112–120. [Google Scholar] [CrossRef]
- Kim, N.; Lee, H.; Kim, W.; Lee, H.; Suh, J.H. Dynamic patterns of industry convergence: Evidence from a large amount of unstructured data. Res. Policy 2015, 44, 1734–1748. [Google Scholar] [CrossRef]
- Chen, H.X.; Lei, J. Measurement of the integration level of rural primary, secondary and tertiary industries and characterization of temporal and spatial coupling. China Soft Sci. 2021, S1, 357–364. [Google Scholar]
- Duan, H.B.; Zeng, F.S. Basic Types and Promoting Strategies of Integrating Agriculture with Related Industrie. Hunan Agric. Sci. 2014, 10, 67–69. [Google Scholar]
- Li, X.W.; Xu, S.B. Rural Industrial Integration: Measurement and Spatial Distribution Pattern. Chin. J. Agric. Resour. Reg. Plan. 2021, 42, 60–74. [Google Scholar]
- Liang, J.; Chen, X.J.; Yang, X. An Empirical Study on the Integration of Cultural Industry and Tourism Industry in Guangxi. Guangxi Soc. Sci. 2014, 3, 28–32. [Google Scholar]
- Liang, J.W. Analysis of the Pathways for Modern Agricultural Development in China: An Explanatory Framework Based on Industry Convergence Theory. Truth Seek. 2010, 3, 69–73. [Google Scholar]
- Naryozen, I. Recommendations for China’s rural economic development strategy. In Proceedings of the Sino-Japanese Modern Agricultural Innovation, Weihai, China, 14 November 2008; p. 4. [Google Scholar]
- Lin, X.Y. Research on Status and Prospects of Rural Industrial Integration Development—A Digital Economy Perspective. J. Guangdong Agric. Ind. Bus. 2023, 39, 7–12. [Google Scholar]
- Lu, Y.; Liu, M. The Division of Labor and Extension of Value Chains in China’s Agricultural Industry: An Analysis Based on the Smile Curve Theory. Contemp. Econ. 2013, 3, 116–118. [Google Scholar]
- Chang, J. The Process, Path, and Mechanism of Rural Restructuring Driven by Tourism under the Perspective of Rural Revitalization: A Case Study of Baoshancun, Chengdu. Sichuan Agric. Sci. Technol. 2022, 6, 15–19. [Google Scholar]
- Xiao, J.Y.; Zheng, X.M. Path Selection for the Integration of China’s Tourism Industry. Macroeconomics 2011, 11, 72–78. [Google Scholar]
- Zhang, S.F.; Wei, X.H. Does Information and Communication Technology Reduce Enterprise’s Energy Consumption—Evidence from Chinese Manufacturing Enterprises Survey. China Ind. Econ. 2019, 2, 155–173. [Google Scholar]
- Chen, Y.B.; Qiu, Q.S.; Liu, Y.F.; Qin, Q.M.; Li, T.; Shu, X.X. The ‘4+1′ Model for Precision Planning of Agricultural Power Distribution Networks. Rural Electr. 2019, 27, 40–41. [Google Scholar]
- Chen, Y.M. Mechanism Innovation for the Integrated Development of Digital Economy and Rural Industry. Issues Agric. Econ. 2021, 12, 81–91. [Google Scholar]
- Han, X.D.; Yang, H.L.; Zheng, F.T. Informatization Development of New Agricultural Management Subjects in the Context of Rural Revitalization. Reform 2018, 10, 120–130. [Google Scholar]
- Li, H.Y. Formation Mechanism and Implementation Path of Digital Agricultural Innovation Ecosystems. Agric. Econ. Issues 2022, 49–59. [Google Scholar]
- Ma, S.Z.; Hu, Z.X. Does Digital Finance Affect Labor Mobility?—A Micro Perspective Based on China’s Migrant Population. Economics 2022, 22, 303–322. [Google Scholar]
- Wang, J.D.; Tong, N.N. Research on the synergistic linkage mechanism between data and other factors of production in the context of digital economy. E-Gov. 2020, 3, 22–31. [Google Scholar]
- Xia, X.L.; Chen, Z.; Zhang, H.L.; Zhao, M.J. High-quality agricultural development: Digital empowerment and paths to realization. China Rural Econ. 2019, 12, 2–15. [Google Scholar]
- Xiao, R.C. The Inner Mechanism and Practical Strategies of Big Data for Promoting Rural Revitalization. Zhongzhou Acad. J. 2019, 12, 48–53. [Google Scholar]
- Yin, H.D.; Huo, P.; Wang, S.G. Digital transformation of agriculture and rural areas: Reality characterization, influence mechanism and promotion strategy. Reform 2020, 12, 48–56. [Google Scholar]
- Zhang, Y.P.; Luan, J. Digital Economy Enabling Rural Revitalization: Theoretical Mechanisms, Constraints and Paths to Advancement. Reform 2022, 5, 79–89. [Google Scholar]
- He, L.H.; Wang, F.; Wang, Z.M. How will the Digital Economy Drive China’s Rural Revitalization? Inq. Into Econ. Issues 2022, 4, 1–18. [Google Scholar]
- Shen, F.W.; Ye, W.X. Digital Rural Construction: A Strategic Choice to Realize the Revitalization of High-quality Rural Areas. J. Nanjing Agric. Univ. (Soc. Sci. Ed.) 2021, 21, 41–53. [Google Scholar]
- Kong, F.B.; Cheng, W.J.; Xu, C.Y. Doesthe Development of Digital Economy Improve the Value Transformation Efficiency of Forest Ecological Products: An Empirical Analysisin Lishui, Zhejiang Province. China Rural Econ. 2023, 5, 163–184. [Google Scholar]
- Wang, X.L.; Peng, Y.H.; Shi, D.J. Promoting the Value Realization of Quasi-Public Forest Ecological Products: Key Challenges, Solutions and Practical Exploration: From the Digital Empowerment Perspective. Ecol. Econ. 2024, 40, 220–227. [Google Scholar]
- Wen, T.; Chen, Y.M. Research on the Digital Economy and Agriculture and Rural Economy Integration: Practice Pattern, Realistic Obstacles and Breakthrough Paths. Issues Agric. Econ. 2020, 7, 118–129. [Google Scholar]
- Zhang, X.D.; Tang, L.; Zhang, Y.L.; Zhang, L.Q. Realization of Ecological Product Value and Digital Rural Revitalization. Constr. Sci. Technol. 2023, 21, 10–12. [Google Scholar]
- Li, S.X.; Wang, T.M.; Wu, Y.F. Information Friction in the Digital Economy: Insights from Information Economics. J. Beijing Jiaotong Univ. (Soc. Sci. Ed.) 2021, 20, 12–22. [Google Scholar]
- Shen, M.H.; Zhang, B.B. A Review of the Transaction Cost Theor. J. Zhejiang Univ. (Humanit. Soc. Sci.) 2013, 43, 44–58. [Google Scholar]
- Su, Q.; Meng, N.N. The Practical Operation of County Inclusive Financial Development: Taking Lankao County in Henan Province as an Example. Reform 2018, 1, 149–159. [Google Scholar]
- Wang, X.H.; Zhang, Y.; Hu, D.C. Digital Finance for High-Quality Agricultural and Rural Development: A Study of Typical Cases, Realistic Dilemmas, and Mechanism Innovation. J. Jiangnan Univ. (Humanit. Soc. Sci. Ed.) 2021, 20, 18–32. [Google Scholar]
- Wang, G.Z.; Jiang, G.H. A Study on the Innovative Model of “Agricultural Value Chain + Internet Finance”: A Case Study Debt of Agriculture and Farms. Rural Econ. 2017, 4, 49–55. [Google Scholar]
- Liu, C.G.; Luo, W.Y. Internet Use and Financial Exclusion of Farm Households—An Empirical Study Based on CHFS2013. Econ. Survey 2019, 36, 141–148. [Google Scholar]
- Jiang, T. Mediating Effects and Moderating Effects in Causal Inference. China Ind. Econ. 2022, 5, 100–120. [Google Scholar]
- Wen, Z.L.; Ye, B.J. Analyses of Mediating Effects: The Development of Methods and Models. Adv. Psychol. Sci. 2014, 22, 731–745. [Google Scholar] [CrossRef]
- Zhang, J.P. Financial Development, Environmental Regulations and Green Economic Transition. J. Financ. Econ. 2021, 47, 78–93. [Google Scholar]
- Li, Z. Construction and Evaluation of Convergence of Primary, Secondary, and Tertiary Industries: A Case Study in Beijing. Chin. J. Agric. Resour. Reg. Plan. 2019, 40, 111–120. [Google Scholar]
- Chen, C.B.; Li, S.; Tian, Y. Integration of three industries in rural China and its provincial comparative analysis. Trans. Chin. Soc. Agric. Eng. 2021, 37, 326–334. [Google Scholar]
- Yang, B.B.; Wei, J.; Zong, Y.X.; Wang, J.Q. Measurement of the Level of Rural Industrial Integration. Stat. Decis. 2022, 38, 125–128. [Google Scholar]
- Yang, Y.L. Evaluation and Driving Factors of the Integrated Development of Rural Industries—Based on the Empirical Anlysis of Heilongjiang Province; Northeast Agricultural University: Harbin, China, 2020. [Google Scholar]
- Xu, X. Measurement, Regional Difference and Dynamic Evolution of Rural Revitalization Level in China. J. Quant. Tech. Econ. 2022, 39, 64–83. [Google Scholar]
- Feng, F.; Cui, L.H. High-speed Rail Operation and Tourism in the HSR Site City: “Engine” or “Corridor”? Econ. Manag. 2020, 42, 175–191. [Google Scholar]
- Yang, J.; Huang, X. The 30 m annual land cover dataset and its dynamics in China from 1990 to 2019. Earth Syst. Sci. Data 2021, 13, 3907–3925. [Google Scholar] [CrossRef]
- Wang, Y.F. Influence and effect of China’s pilot low-carbon city initiative on urban green total factor productivity growth. China Popul. Resour. Environ. 2021, 31, 78–89. [Google Scholar]
- Zhou, T.; Liu, H.; Gou, P.; Xu, N. Conflict or Coordination? measuring the relationships between urbanization and vegetation cover in China. Ecol. Indic. 2023, 147, 109993. [Google Scholar] [CrossRef]
- Wang, X.H.; Li, X.T.; Zhang, S.P. Does the multicenter spatial structure promote high-quality urban development?—Empirical evidence from the prefecture-level city level in China. Chin. Popul. Resour. Environ. 2022, 32, 57–67. [Google Scholar]
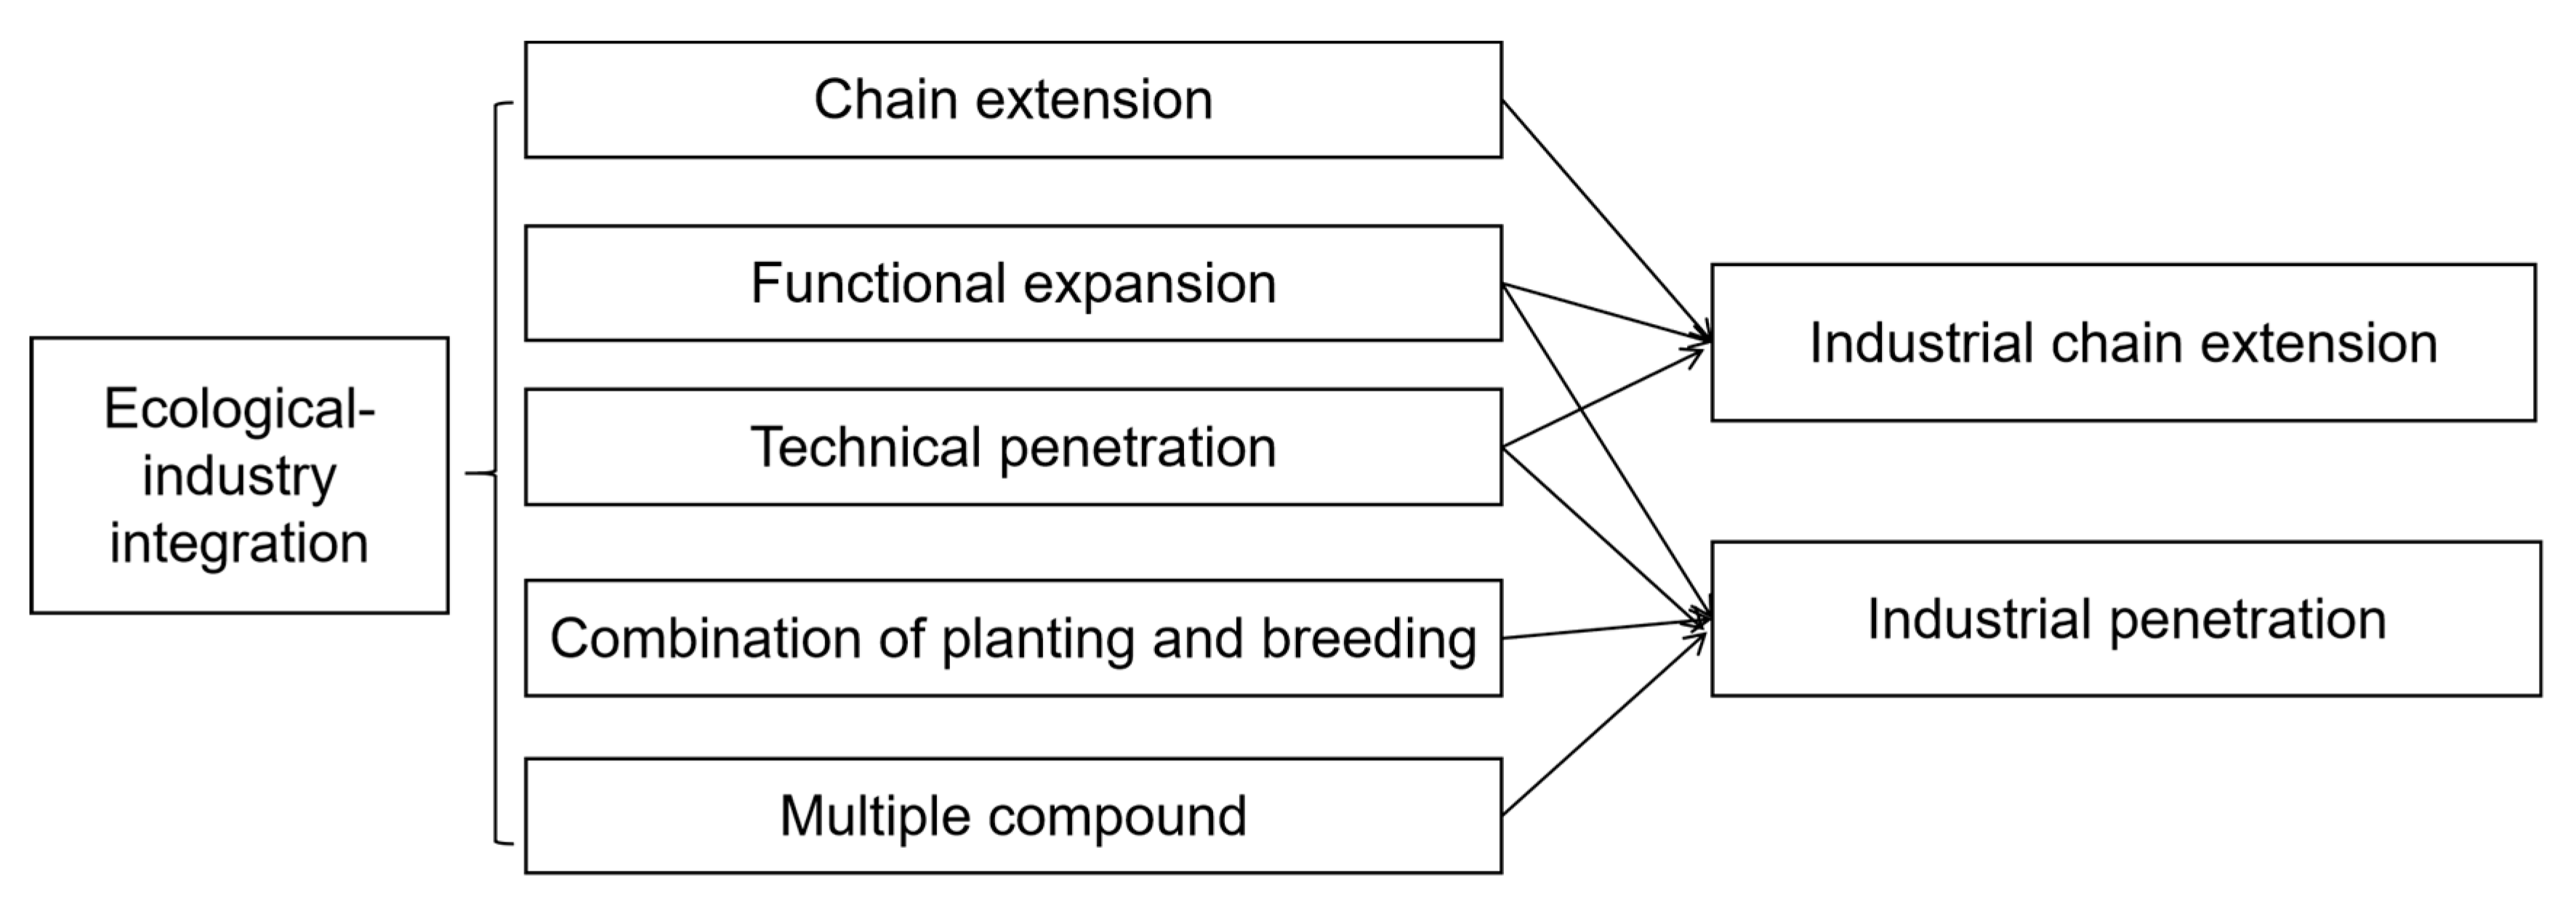
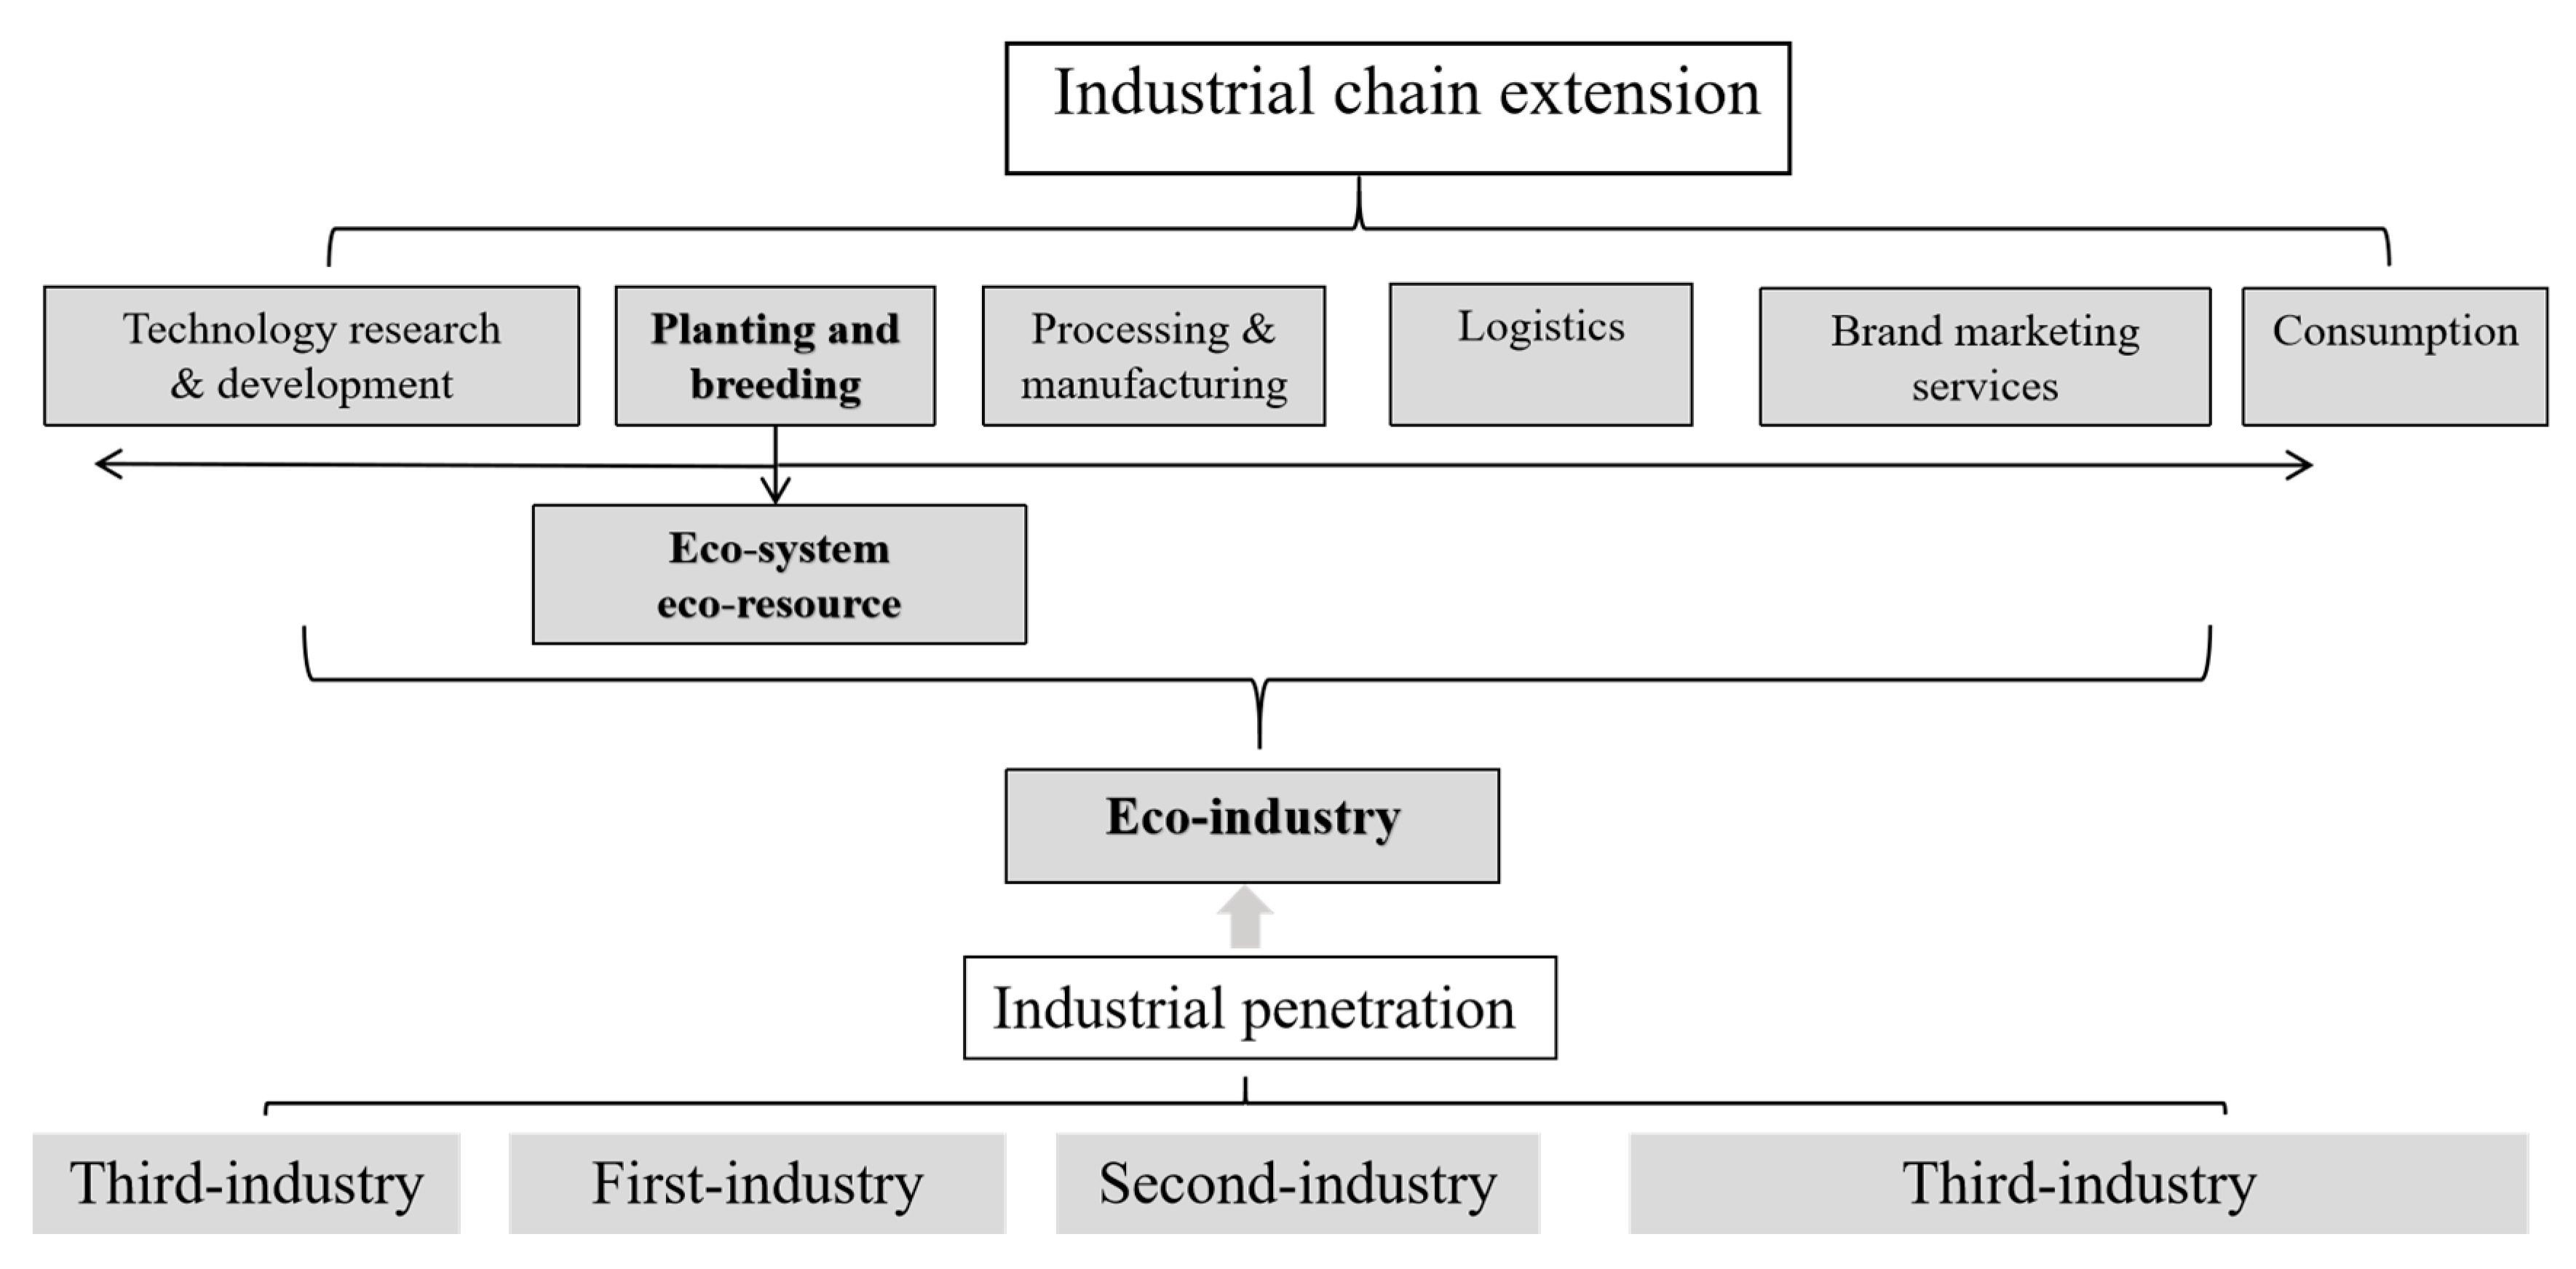

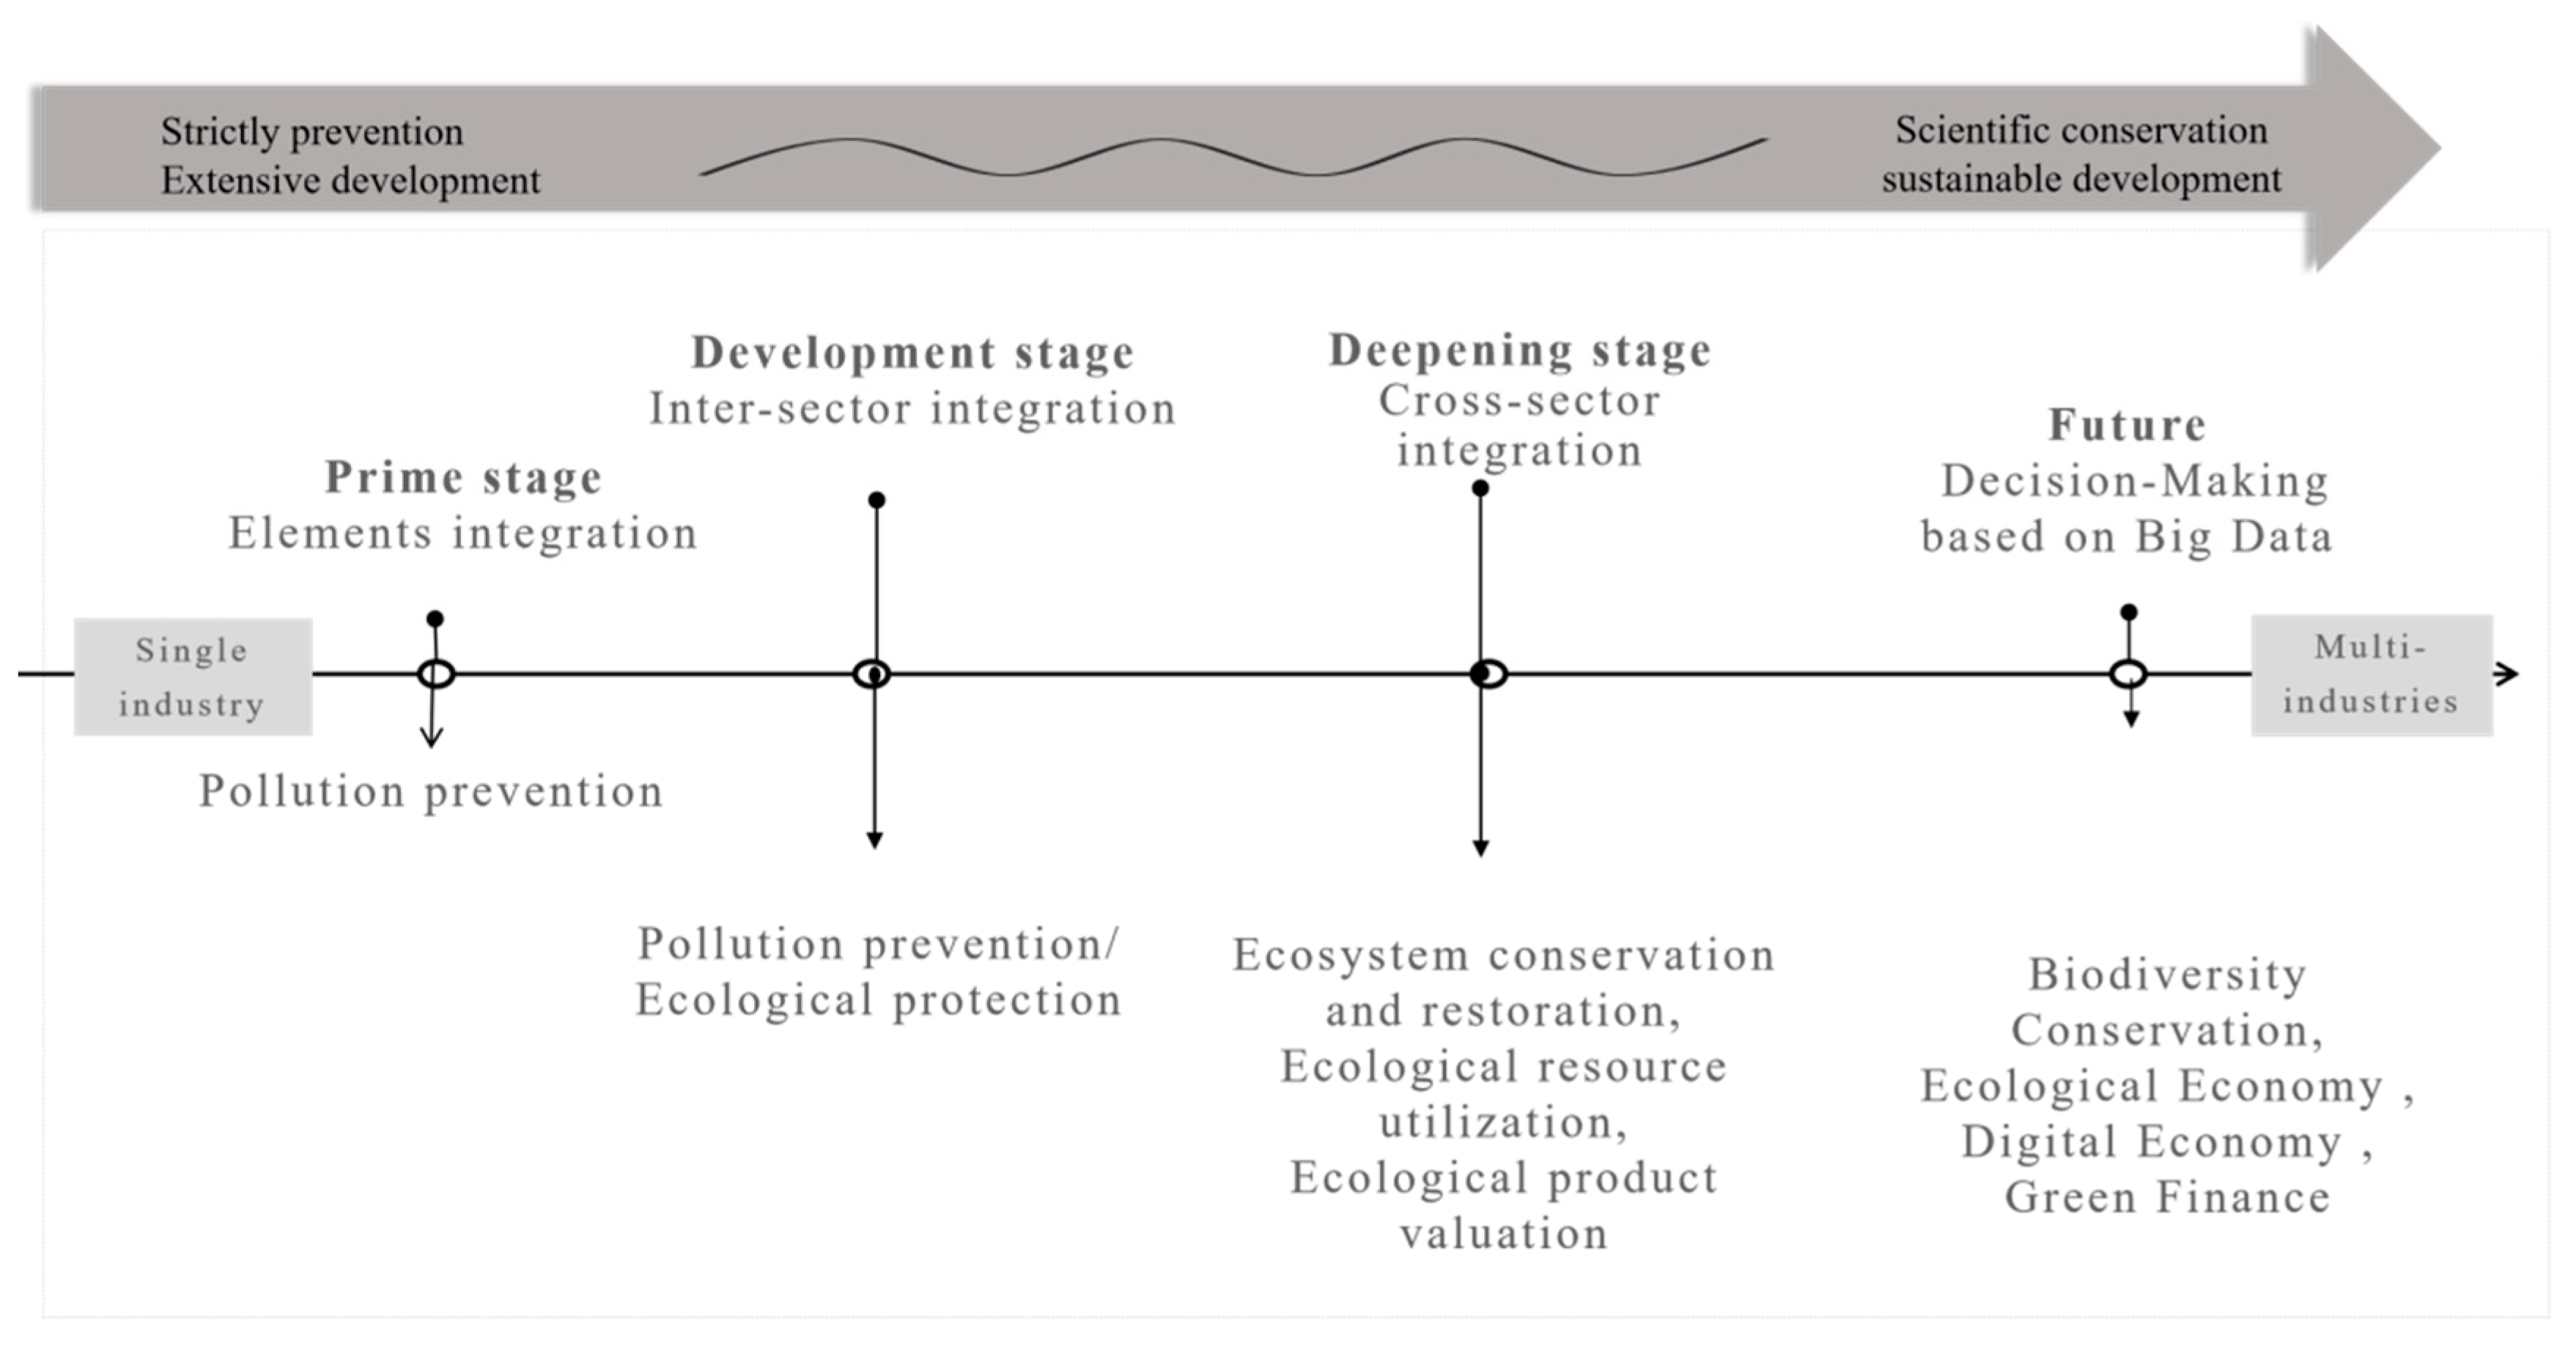
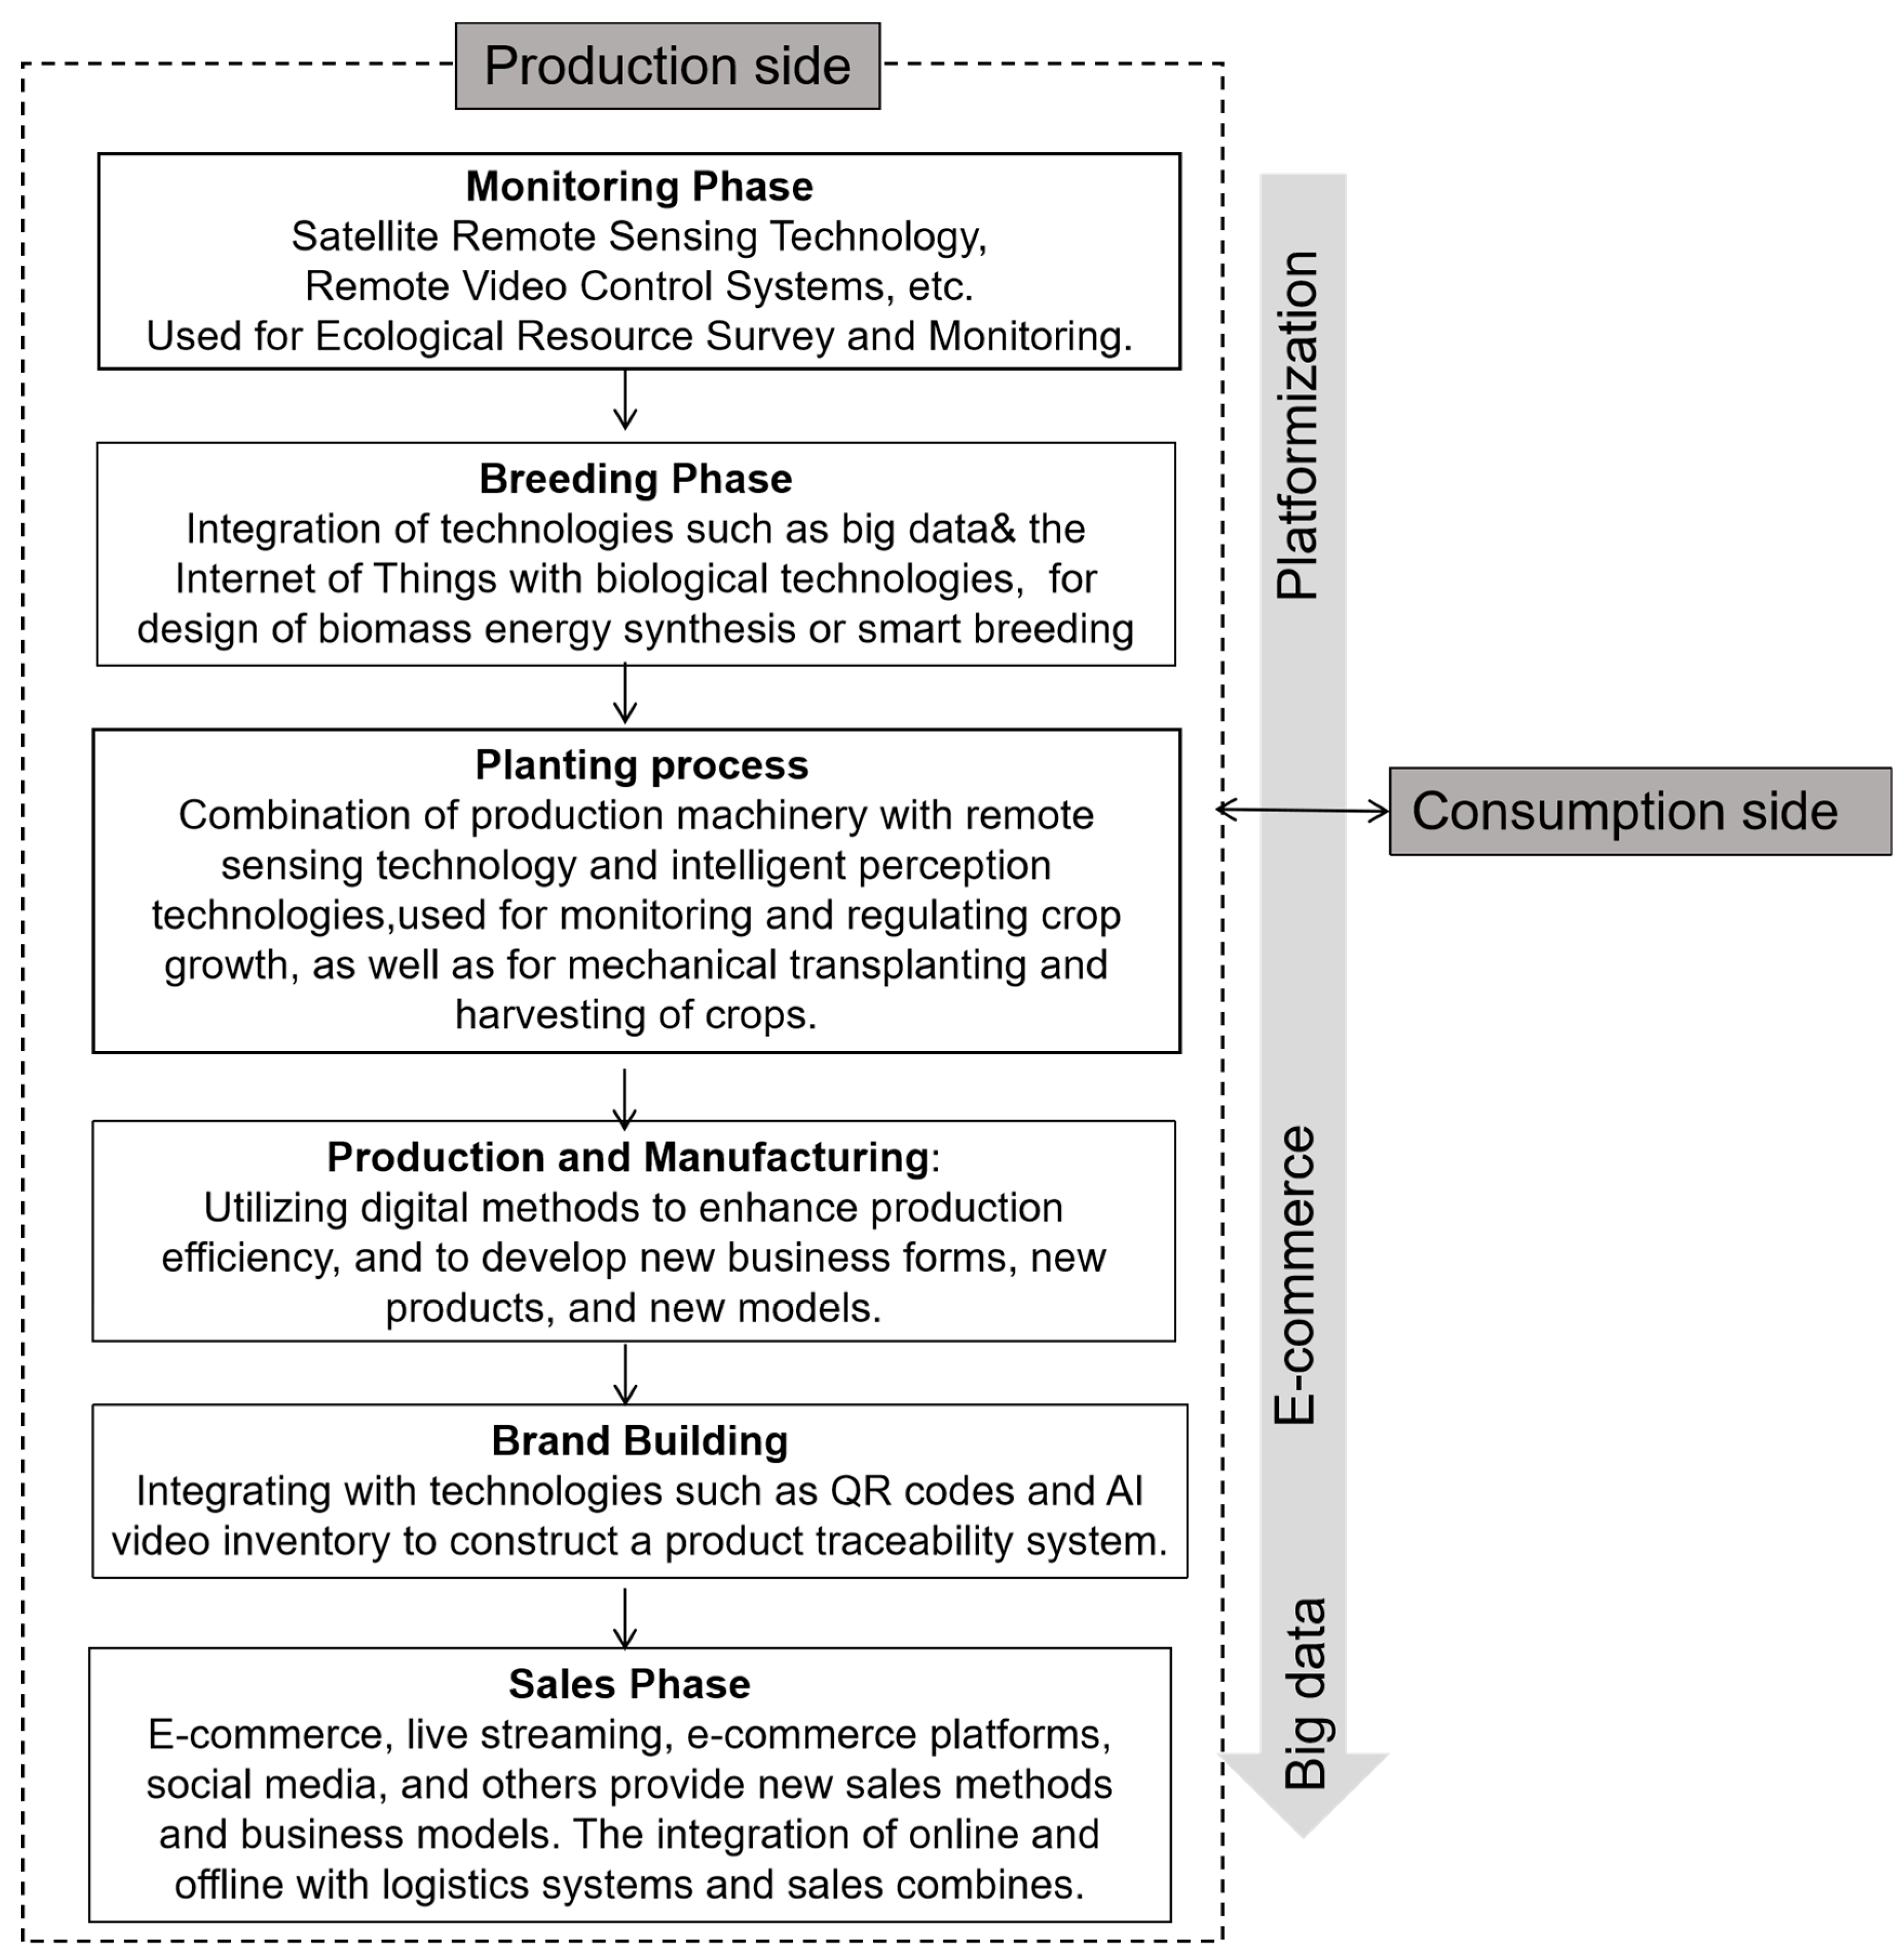
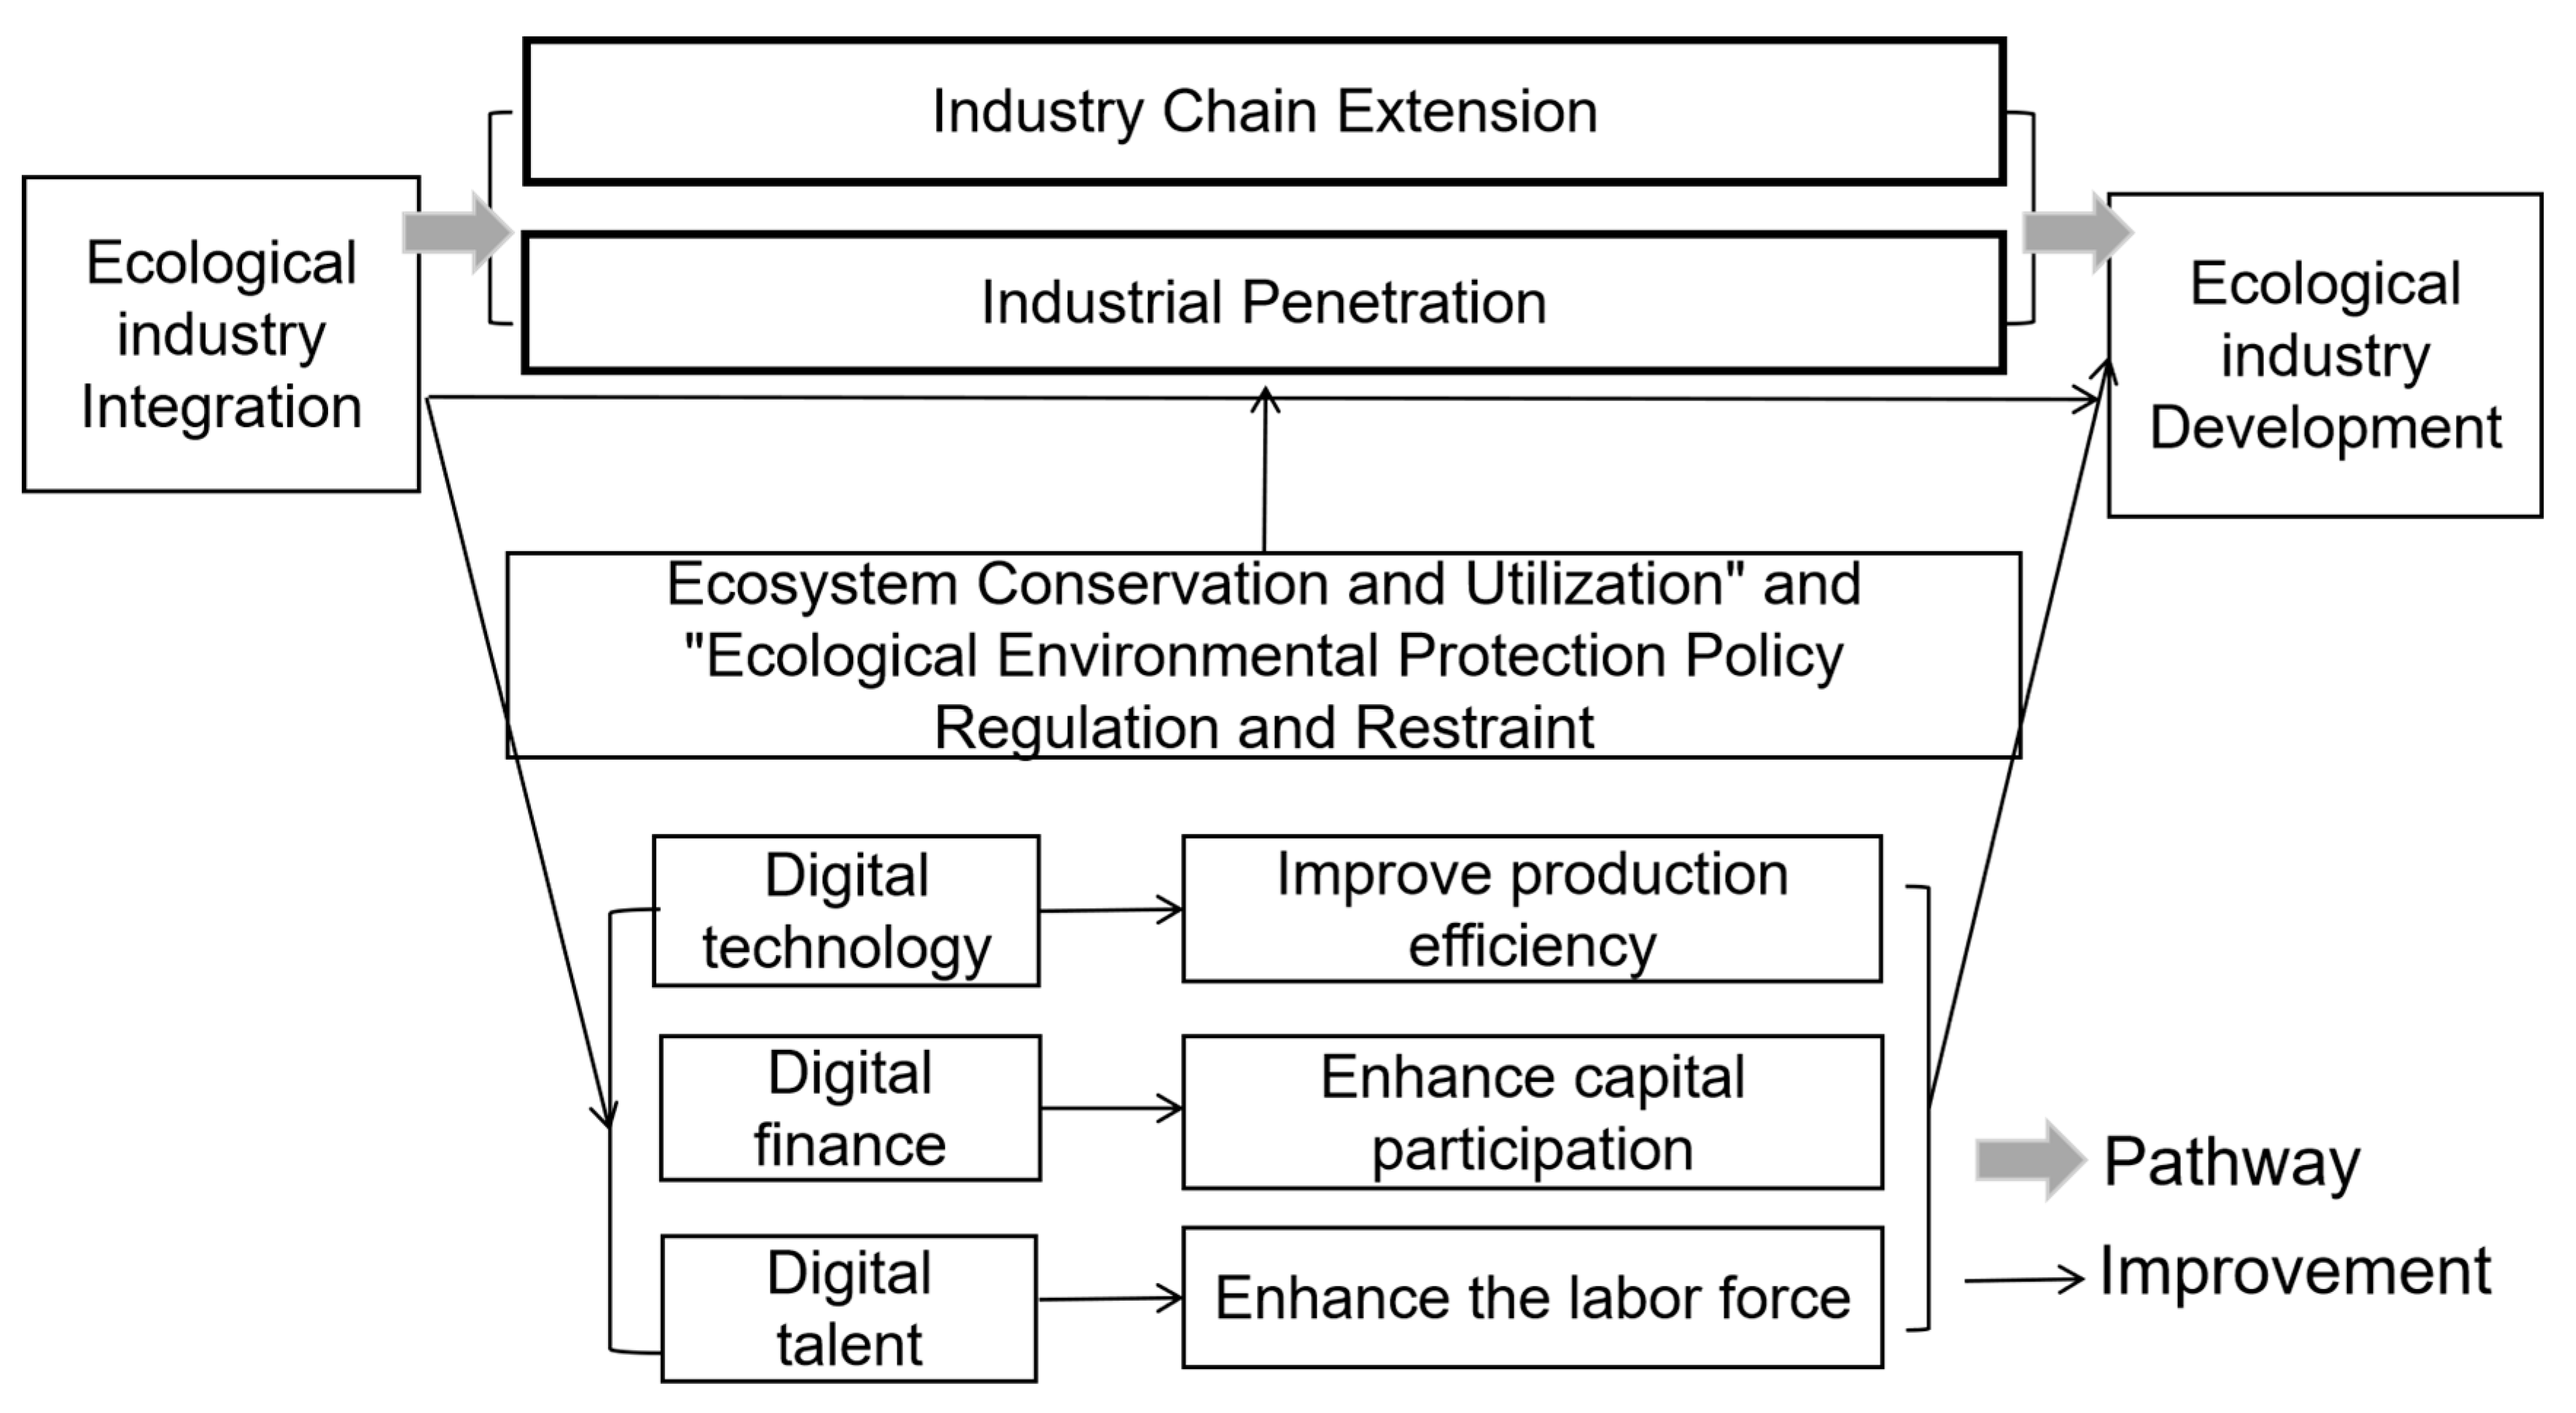
Disclaimer/Publisher’s Note: The statements, opinions and data contained in all publications are solely those of the individual author(s) and contributor(s) and not of MDPI and/or the editor(s). MDPI and/or the editor(s) disclaim responsibility for any injury to people or property resulting from any ideas, methods, instructions or products referred to in the content. |
© 2024 by the authors. Licensee MDPI, Basel, Switzerland. This article is an open access article distributed under the terms and conditions of the Creative Commons Attribution (CC BY) license (https://creativecommons.org/licenses/by/4.0/).