1. Introduction
The rapid urbanization and development of Kazakhstan in recent decades have brought significant changes to its cities and regions, necessitating an extensive approach to evaluate and ensure the quality of life for urban residents. As the ninth-largest country by land area, Kazakhstan faces unique challenges in managing its diverse urban landscapes, from the densely populated southern regions to the vast, sparsely populated northern and central areas. The concept of urban sustainability has gained increasing importance globally, with cities striving to balance economic growth, social well-being, and environmental protection [
1,
2]. This effort aligns with Sustainable Development Goal (SDG) 11, which focuses on making cities and human settlements inclusive, safe, resilient, and sustainable [
3].
In this study, we define sustainability as the ability of urban systems to meet present needs without compromising the ability of future generations to meet their own needs. This encompasses economic viability, social equity, and environmental protection, reflecting the interdependent nature of these dimensions in promoting long-term urban livability.
Quality of life is a key dimension of sustainability, encompassing various factors that contribute to the well-being of individuals and communities. As noted by the OECD [
4], quality of life is inherently multidimensional, involving both material and subjective well-being, and is increasingly used as a framework for assessing the sustainability of urban environments. The extensive literature, including works by Costanza [
5] and Veenhoven [
6], highlights how quality of life is closely related to sustainability efforts. In urban studies, Marans and Stimson [
7] emphasize that elements such as public transport, crime rates, healthcare, and education significantly influence quality of life, aligning with the key sustainability indicators used in this study.
To ensure a coherent and comprehensive assessment, we carefully selected our sustainability indicators based on established frameworks and the relevant literature. Our metrics, including air pollution data, average salary, population, crime rates, entertainment facilities, GDP per capita, education levels, household spending, life expectancy, medical institution availability, school availability, public transport, and unemployment rates, reflect the interconnected nature of urban systems. For instance, economic indicators like GDP per capita are linked to social factors such as educational attainment, which in turn influence healthcare outcomes. This interconnectedness is crucial for understanding urban sustainability as a holistic concept.
In Kazakhstan, this balance is particularly crucial given the country’s historical reliance on extractive industries and its ambitious goals for diversification and modernization. To evaluate the sustainability of various regions, this study employs the Analytic Hierarchy Process (AHP), a structured technique developed by Thomas L. Saaty [
8]. The AHP method is widely used for decision-making and involves decomposing a complex problem into a hierarchy of sub-problems, each of which can be analyzed independently [
9,
10,
11].
This study aims to develop a set of aggregated sustainability indicators tailored to Kazakhstan’s urban areas. By analyzing a broad range of factors, including environmental quality, economic performance, and social well-being, the goal is to provide an in-depth view of urban livability across the country’s regions. Key indicators include air pollution data, average salary, population, crime rates, entertainment facilities, GDP per capita, education levels, household spending, life expectancy, medical institution availability, school availability, public transport, and unemployment rates. The resulting work encompasses 19 regions and cities, including newly formed regions such as Abai, Jetisu, and Ulytau, alongside established urban centers like Astana, Almaty, and Shymkent. By examining these diverse indicators, this study reveals variations in urban sustainability performance across different regions, highlighting the unique challenges and strengths of each area. The study encompasses 19 regions and major cities, including the following:
Newly formed regions: Abai, Jetisu, and Ulytau
Established regions: Akmola, Aktobe, Almaty, Atyrau, West Kazakhstan, Jambyl, Karaganda, Kostanay, Kyzylorda, Mangystau, Pavlodar, North Kazakhstan, Turkistan, and East Kazakhstan
Major cities: Astana, Almaty, and Shymkent
By analyzing indicators such as air quality, economic performance, educational attainment, healthcare access, and infrastructure development across these diverse areas, the goal is to provide a thorough overview of urban sustainability in Kazakhstan. This research contributes to the growing body of studies in the literature on urban sustainability indicators, with a specific focus on the unique challenges and opportunities present in a rapidly developing, post-Soviet environment. The findings of this study will not only provide valuable insights for policymakers and urban planners in Kazakhstan but also offer a methodology that could be adapted for similar assessments in other developing countries experiencing rapid urbanization and regional reorganization.
2. Methodology Approach
Urban sustainability encompasses economic, social, and environmental dimensions to improve the quality of life in cities. Recent studies highlight the necessity of developing robust sustainability indicators to assess urban performance effectively [
12]. Indicators such as air quality, economic health, and social well-being are critical for understanding and improving urban livability [
13]. In this study, the selection of indicators was guided by internationally recognized frameworks such as the European Smart Cities Framework and the Reference Framework for Sustainable Cities (RFSC). These frameworks offer a structured approach to integrating key dimensions of sustainability, including economic, environmental, and social factors, while allowing for adaptation to the specific urban context of Kazakhstan.
An important and often challenging aspect of many multi-criteria decision-making (MCDM) models is the process of assigning weights to various criteria. This step is significant and warrants careful consideration, as the determination of these weights plays an important role in shaping the outcomes of MCDM analyses [
14]. Some researchers chose not to compare things in pairs at all. Instead, they used simpler ways to make decisions. These easier methods include the simple scoring model [
15] and a special method called ELECTRE III [
16]. These simpler methods help researchers avoid the complicated process of comparing every option to every other option. The Analytic Hierarchy Process (AHP) is a decision-making tool that structures complex problems into a hierarchy of simpler sub-problems. This method allows for systematic comparison and prioritization of criteria, making it particularly useful for urban sustainability assessments [
3,
8]. AHP has been successfully applied in various research works to evaluate and integrate multiple criteria into decision-making processes [
17,
18].
The selection of the 16 sustainability indicators used in this study was driven primarily by data availability. While indicators such as water quality, soil quality, and waste management are indeed critical for sustainability assessments, reliable data for these environmental metrics were not available for all regions in Kazakhstan. As a result, air quality was selected as the primary environmental indicator, given its importance and data availability in urban contexts. This limitation underscores the need for future research that incorporates a broader range of environmental indicators as more data become accessible.
The remaining indicators, including average salary, GDP per capita, education levels, public transport, and crime rates, were chosen based on their relevance to quality of life and their alignment with international frameworks. These indicators reflect the key dimensions of sustainability: economic, social, infrastructure, and healthcare. They offer a comprehensive, although data-constrained, view of urban sustainability in Kazakhstan.
Sustainable Development Goal (SDG) 11 emphasizes the need for sustainable urban planning and management, which is necessary for addressing the challenges posed by rapid urbanization and environmental changes. Sustainability indicators provide essential data for evaluating urban systems and guiding policy decisions. Effective urban planning relies on indicators that reflect diverse aspects of sustainability, including environmental quality, economic performance, and infrastructure development [
19,
20]. The selection and application of these indicators are important for accurate and actionable sustainability assessments.
Kazakhstan’s rapid urbanization presents unique challenges for sustainability, influenced by historical reliance on extractive industries and ongoing efforts towards economic diversification [
21]. Recent research emphasizes the need for context-specific sustainability indicators to address the country’s urban development challenges effectively [
22].
3. Data Aggregation Approach
3.1. Indicator Selection
The selection of indicators for this study was guided by the European Commission’s approach to city initiatives, which emphasizes the integration of economic, social, environmental, and infrastructure factors in assessing urban sustainability [
1]. To develop aggregated sustainability indicators for evaluating quality of life in urban areas, a data-driven approach was employed, incorporating 16 diverse indicators across several key dimensions: economic, educational, infrastructure, crime level, ecological, healthcare, and social factors. The selection of these indicators was based on the availability of reliable data at the regional level, which allowed for comprehensive cross-regional comparisons. Although important metrics such as water quality and walkability could have further enriched the analysis, they were excluded due to the lack of consistent, region-specific data. In certain cases, proxies such as car ownership were used to reflect aspects like urban mobility and walkability. These 16 indicators provide a holistic view of urban sustainability and quality of life in Kazakhstan’s regions and major cities, as outlined in
Table 1. Future research may incorporate additional metrics such as water pollution and equitable access to public spaces, should more comprehensive data become available, thereby enhancing the robustness of urban sustainability assessments.
This table categorizes the indicators used in the study to evaluate different dimensions of regional sustainability.
3.2. Data Collection
The 16 indicators used in this study were sourced from various authoritative organizations for the year 2022, as detailed in
Figure 1, and published by the Bureau of National Statistics of Kazakhstan [
23]. To ensure transparency and reproducibility, the data acquisition and cleaning process was executed through a reusable data pipeline available on GitHub.
3.2.1. Data Pipeline Architecture
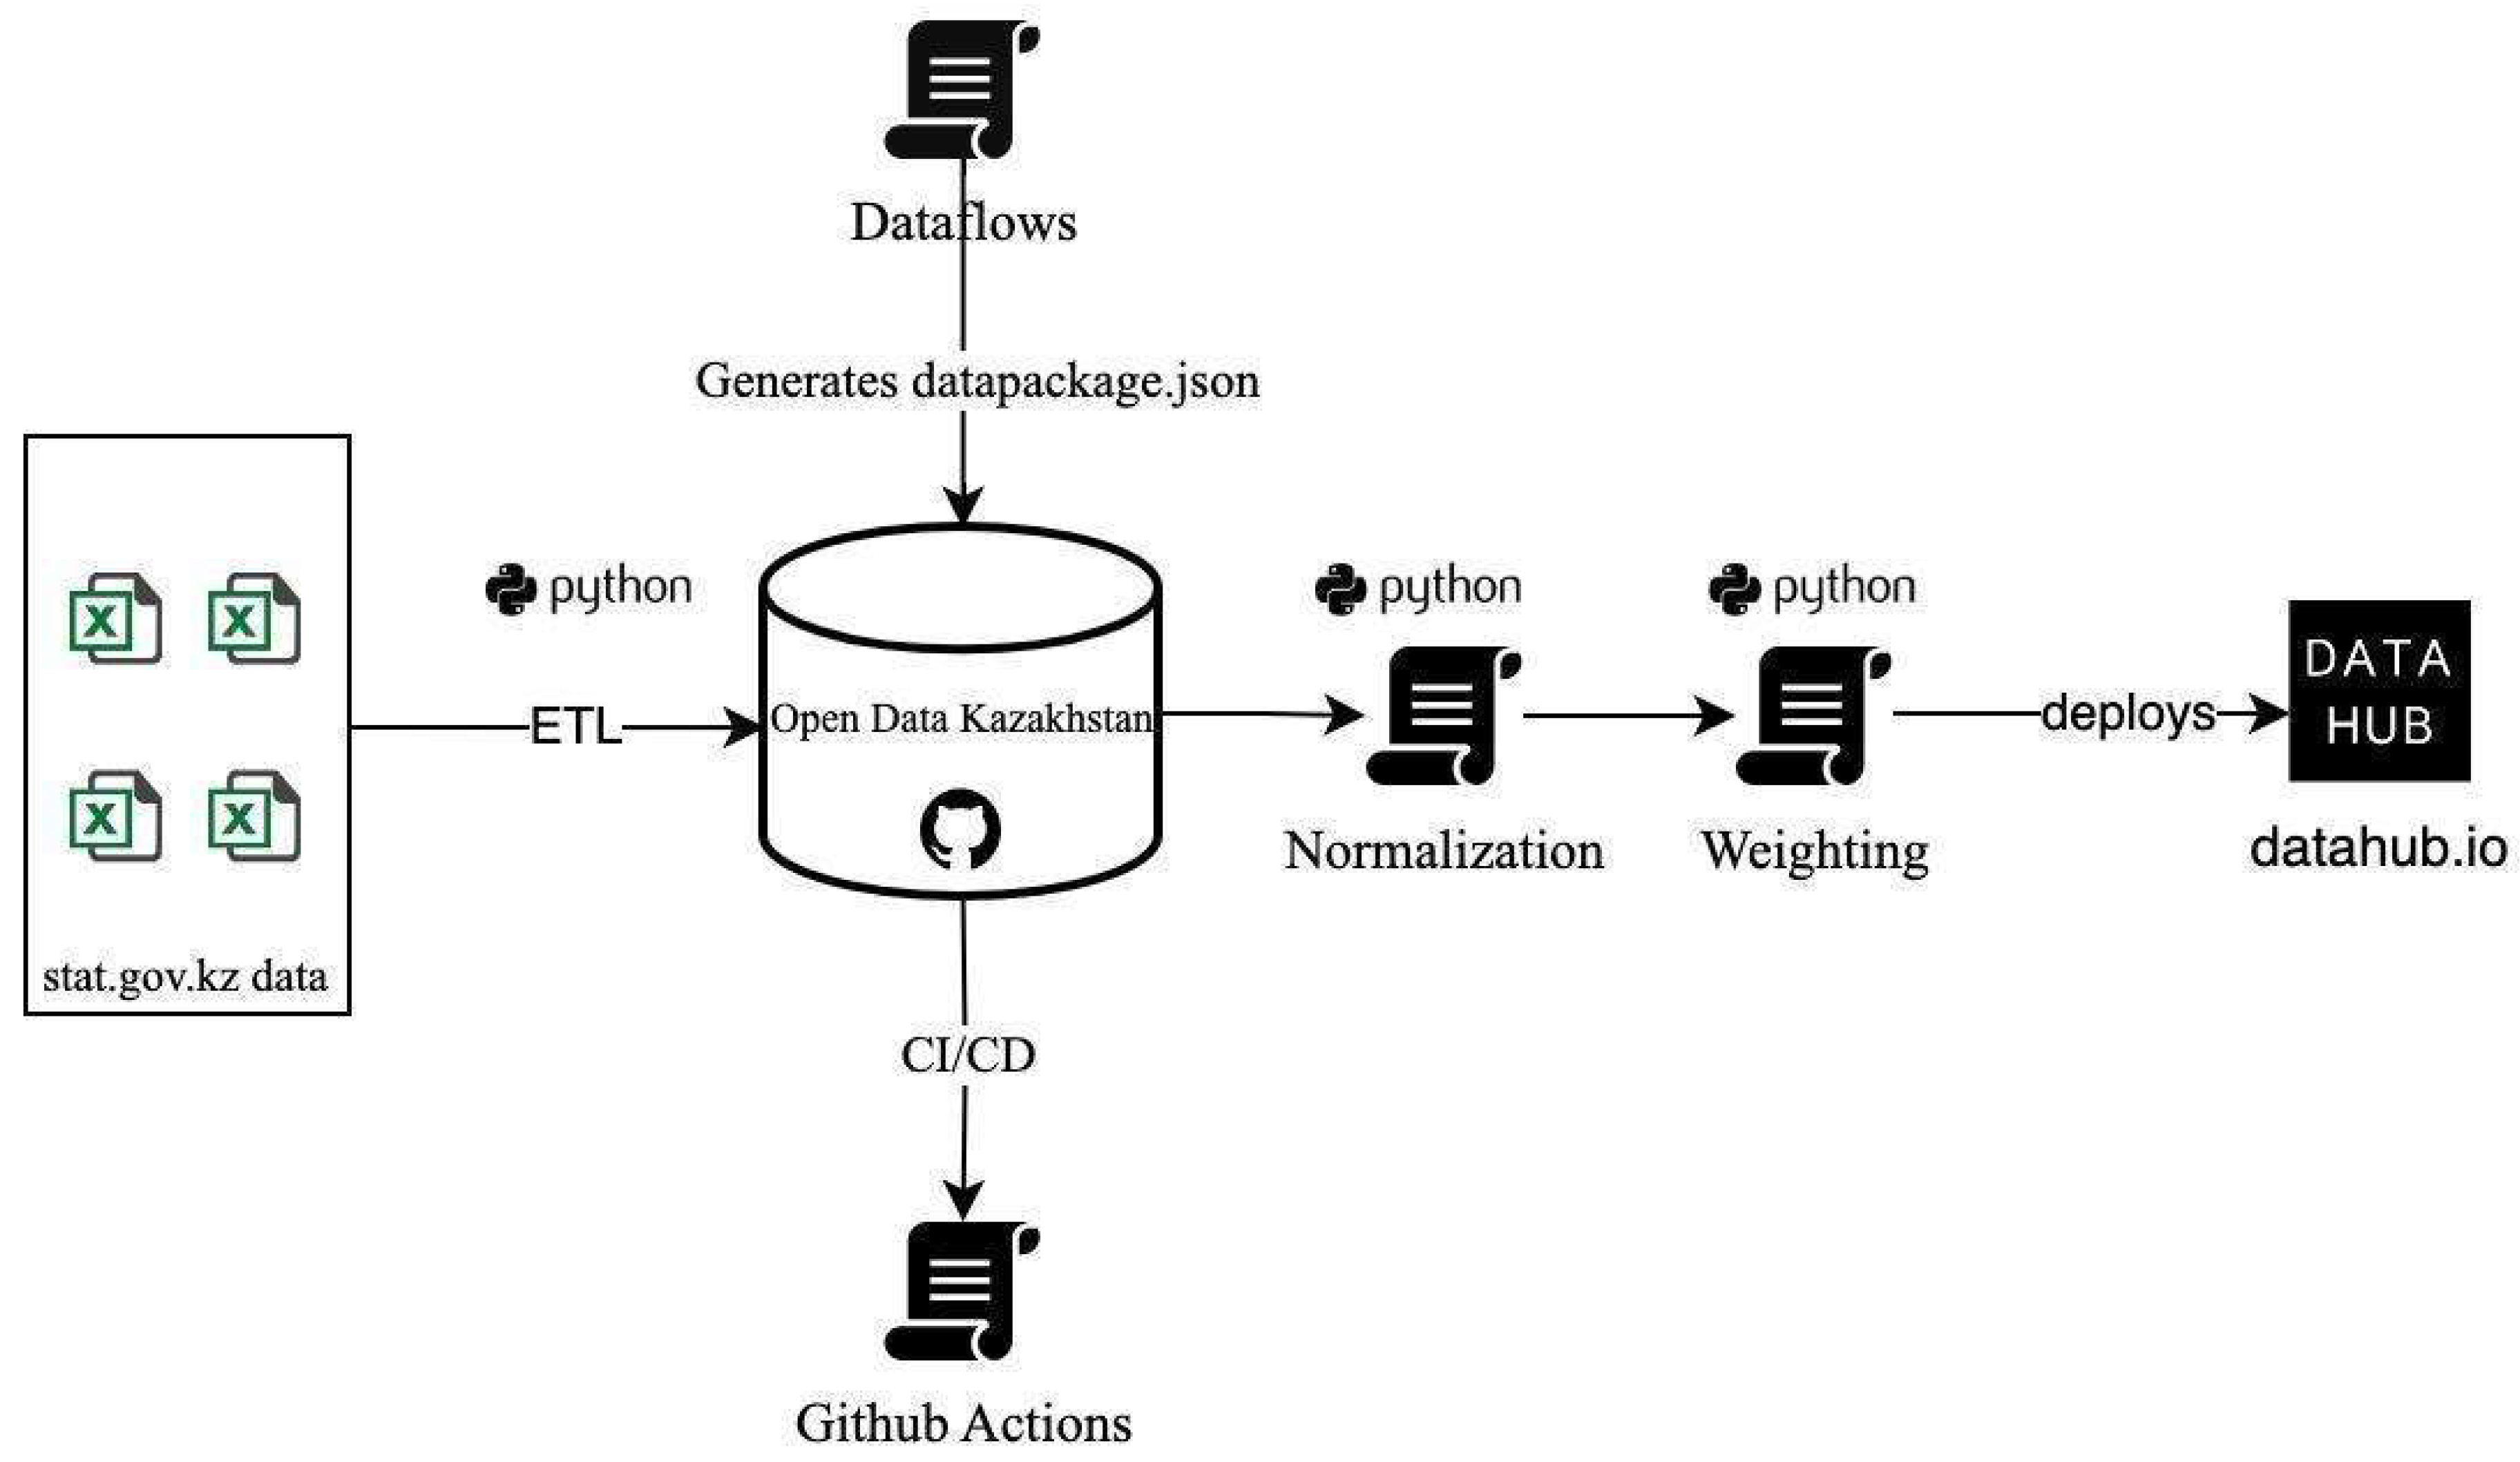
The data acquisition, cleaning, and transformation processes were implemented using a reusable data pipeline architecture, as illustrated in
Figure 1.
The pipeline utilizes various technologies and tools to streamline and automate the data handling workflow, adhering to modern data engineering practices [
24]:
Data Sources: Raw data were sourced from Excel files containing city-level statistics published by the Bureau of National Statistics of Kazakhstan.
ETL: Python scripts were employed to extract, transform, and load the data from each source separately since they have a different structure and naming convention, and filling in missing values was necessary in order to use them in future steps.
Dataflows: The Dataflows.io platform [
25] was used to orchestrate and create a machine-readable datapackage.json file, describing the cleaned and integrated dataset according to frictionless data specifications [
26].
Open Data Kazakhstan: The normalized data were deployed to the Open Data Kazakhstan platform [
27], a centralized repository for structured data access.
CI/CD: Continuous integration and deployment practices, powered by GitHub Actions, automated the data publication process to Open Data Kazakhstan with each update to the underlying sources.
Normalization: Python scripts were employed to combine all datasets into the main dataset and apply MaxMin calculation.
Weighting: In this step, equal and environmental weighting is applied because global weights and sustainability scores are calculated.
DataHub: Publication of datasets using the DataHub Cloud platform [
28] was necessary to visualize and share the results of the work.
This modern data pipeline architecture promotes transparency, reproducibility, and automation in the data management process. It leverages open-source tools while adhering to emerging standards for frictionless and open data publishing [
29].
3.2.2. Data Specification
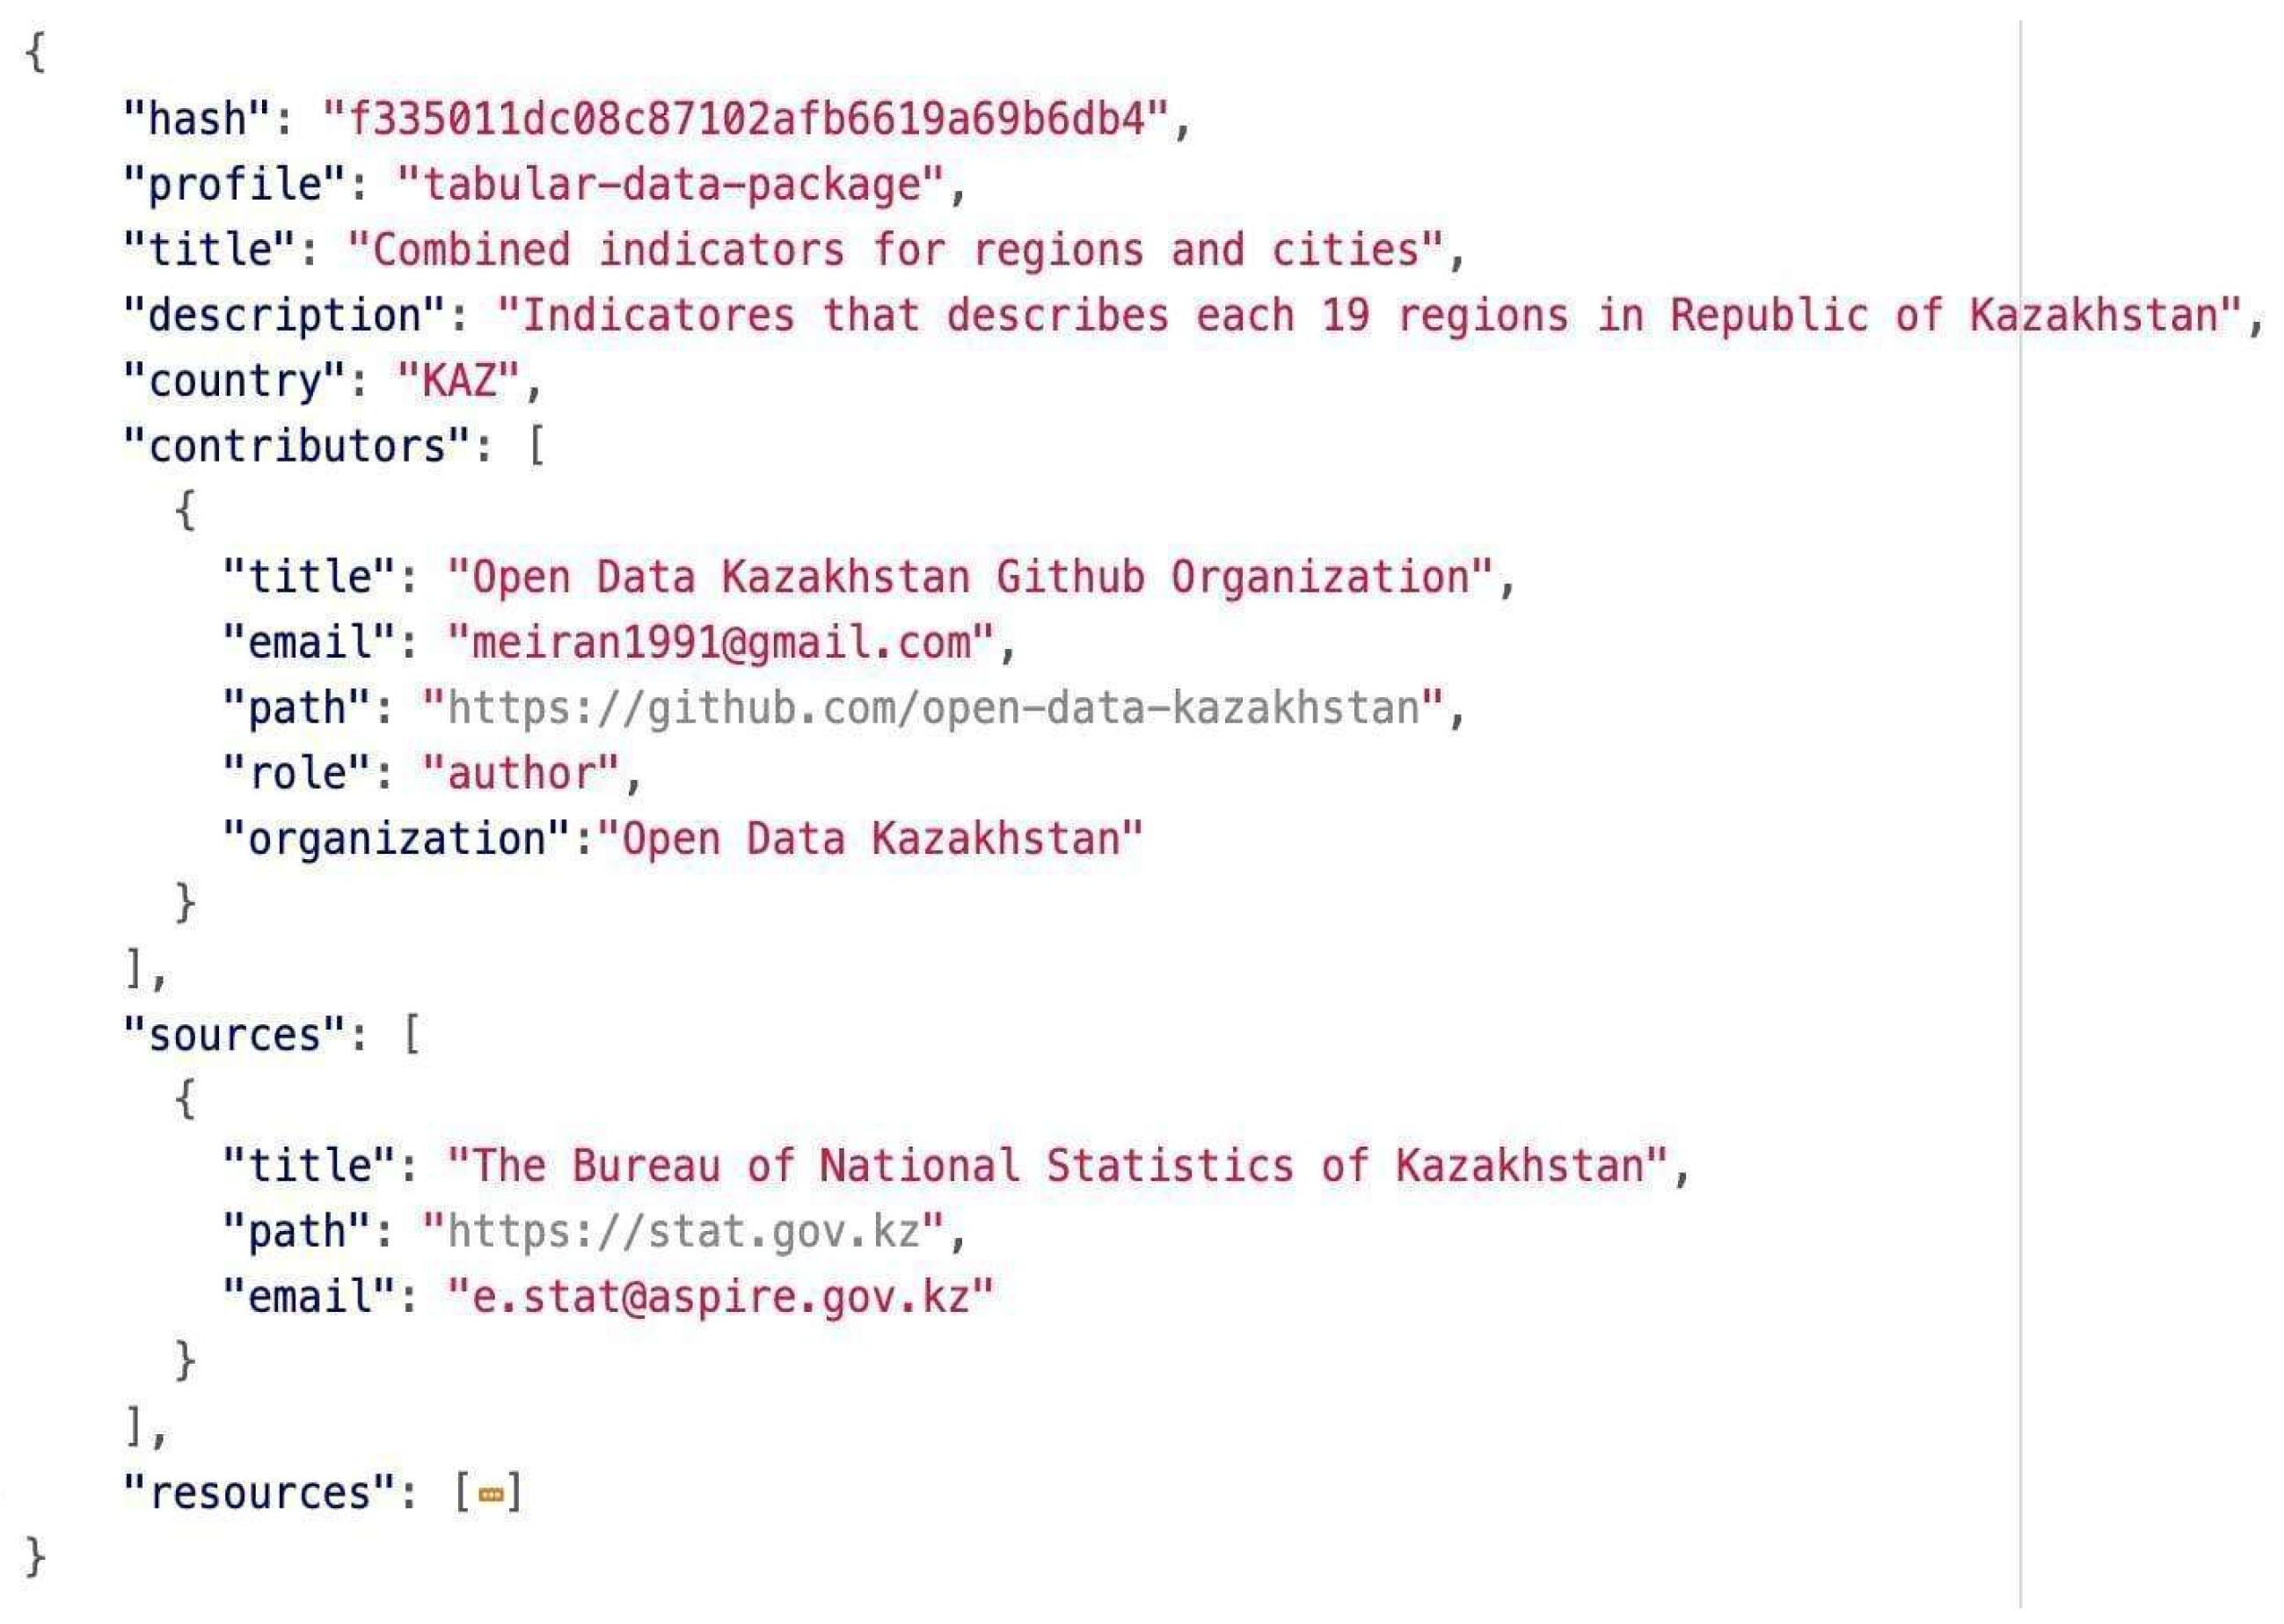
The pipeline leverages the data package specification from the Open Knowledge Foundation [
30] to represent disparate data sources in a unified, machine-readable format. The data package is a containerized way to describe and package data, including metadata like the sources, licenses, and column descriptions in
Figure A1.
Within the data package, each indicator data source was defined using a table schema adhering to the table schema specification. These schemas provide a robust way to describe tabular data, defining columns, data types, constraints, and other attributes. The table schemas acted as rigorous data dictionaries for documenting and validating the input data in
Figure A2.
3.2.3. Data Cleaning
The data cleaning step involves automated harvesting of information from designated web portals and databases. Following this, the nomenclature harmonization step ensures consistency by standardizing naming conventions across diverse data sources. The format unification step then converts heterogeneous data into a unified CSV format, facilitating collaborative research, large-scale analytics, and effortless data sharing. Missing data imputation is performed using the k-nearest neighbors (KNN) algorithm with k = 5 to estimate and fill in missing values. The deduplication step identifies and removes redundant entries to maintain data integrity. This is followed by the data package formulation step, which creates a structured data package adhering to established specifications. Finally, the cross-validation step implements table schema constraints to detect and rectify inconsistencies across multiple data sources.
3.2.4. Missing Data
Missing data imputation was performed using the k-nearest neighbors (KNN) algorithm, a method that leverages the intrinsic relationships within the dataset [
31]. This approach was applied specifically to numerical columns, with the parameter n_Neighbours set to 5.
The KNN imputation algorithm operates on the principle of estimating missing values based on the k most similar complete data points in the feature space. For each data point with missing values, the algorithm identifies the k-nearest neighbors with complete data. The proximity is determined by using a distance metric, typically Euclidean distance in multidimensional space. The missing value is then imputed by calculating either the mean or median of the corresponding values from these k-nearest neighbors.
In the implementation, k = 5 was set, indicating that each missing value was estimated based on the five nearest complete data points within the dataset.
The selection of KNN imputation over simpler techniques such as mean or median imputation was driven by its ability to capitalize on the correlations between features, thereby providing more contextually relevant estimates for missing values. This method is particularly effective when missing data exhibit spatial or regional patterns, as it preserves the local structure of the data [
32].
Furthermore, KNN imputation offers several advantages in the preprocessing pipeline: it maintains the statistical properties of the dataset more effectively than global imputation methods; it is adaptable to various data distributions without requiring explicit modeling; and it can handle both continuous and categorical variables, although the focus was on numerical columns.
By employing KNN as a robust imputation strategy, the goal was to maximize the retention of information from the original dataset before proceeding with normalization steps. This approach helps to minimize bias and preserve the inherent relationships within the data, thereby enhancing the reliability of the subsequent analysis.
3.3. Data Visualization
To present our input datasets, a data portal [
33] was built using a markdown way of generating a rich dynamic data platform using Datahub Cloud which was filled with all indicators including original and cleaned data with table and graphical views for demonstration in
Figure 2,
Figure 3,
Figure 4 and
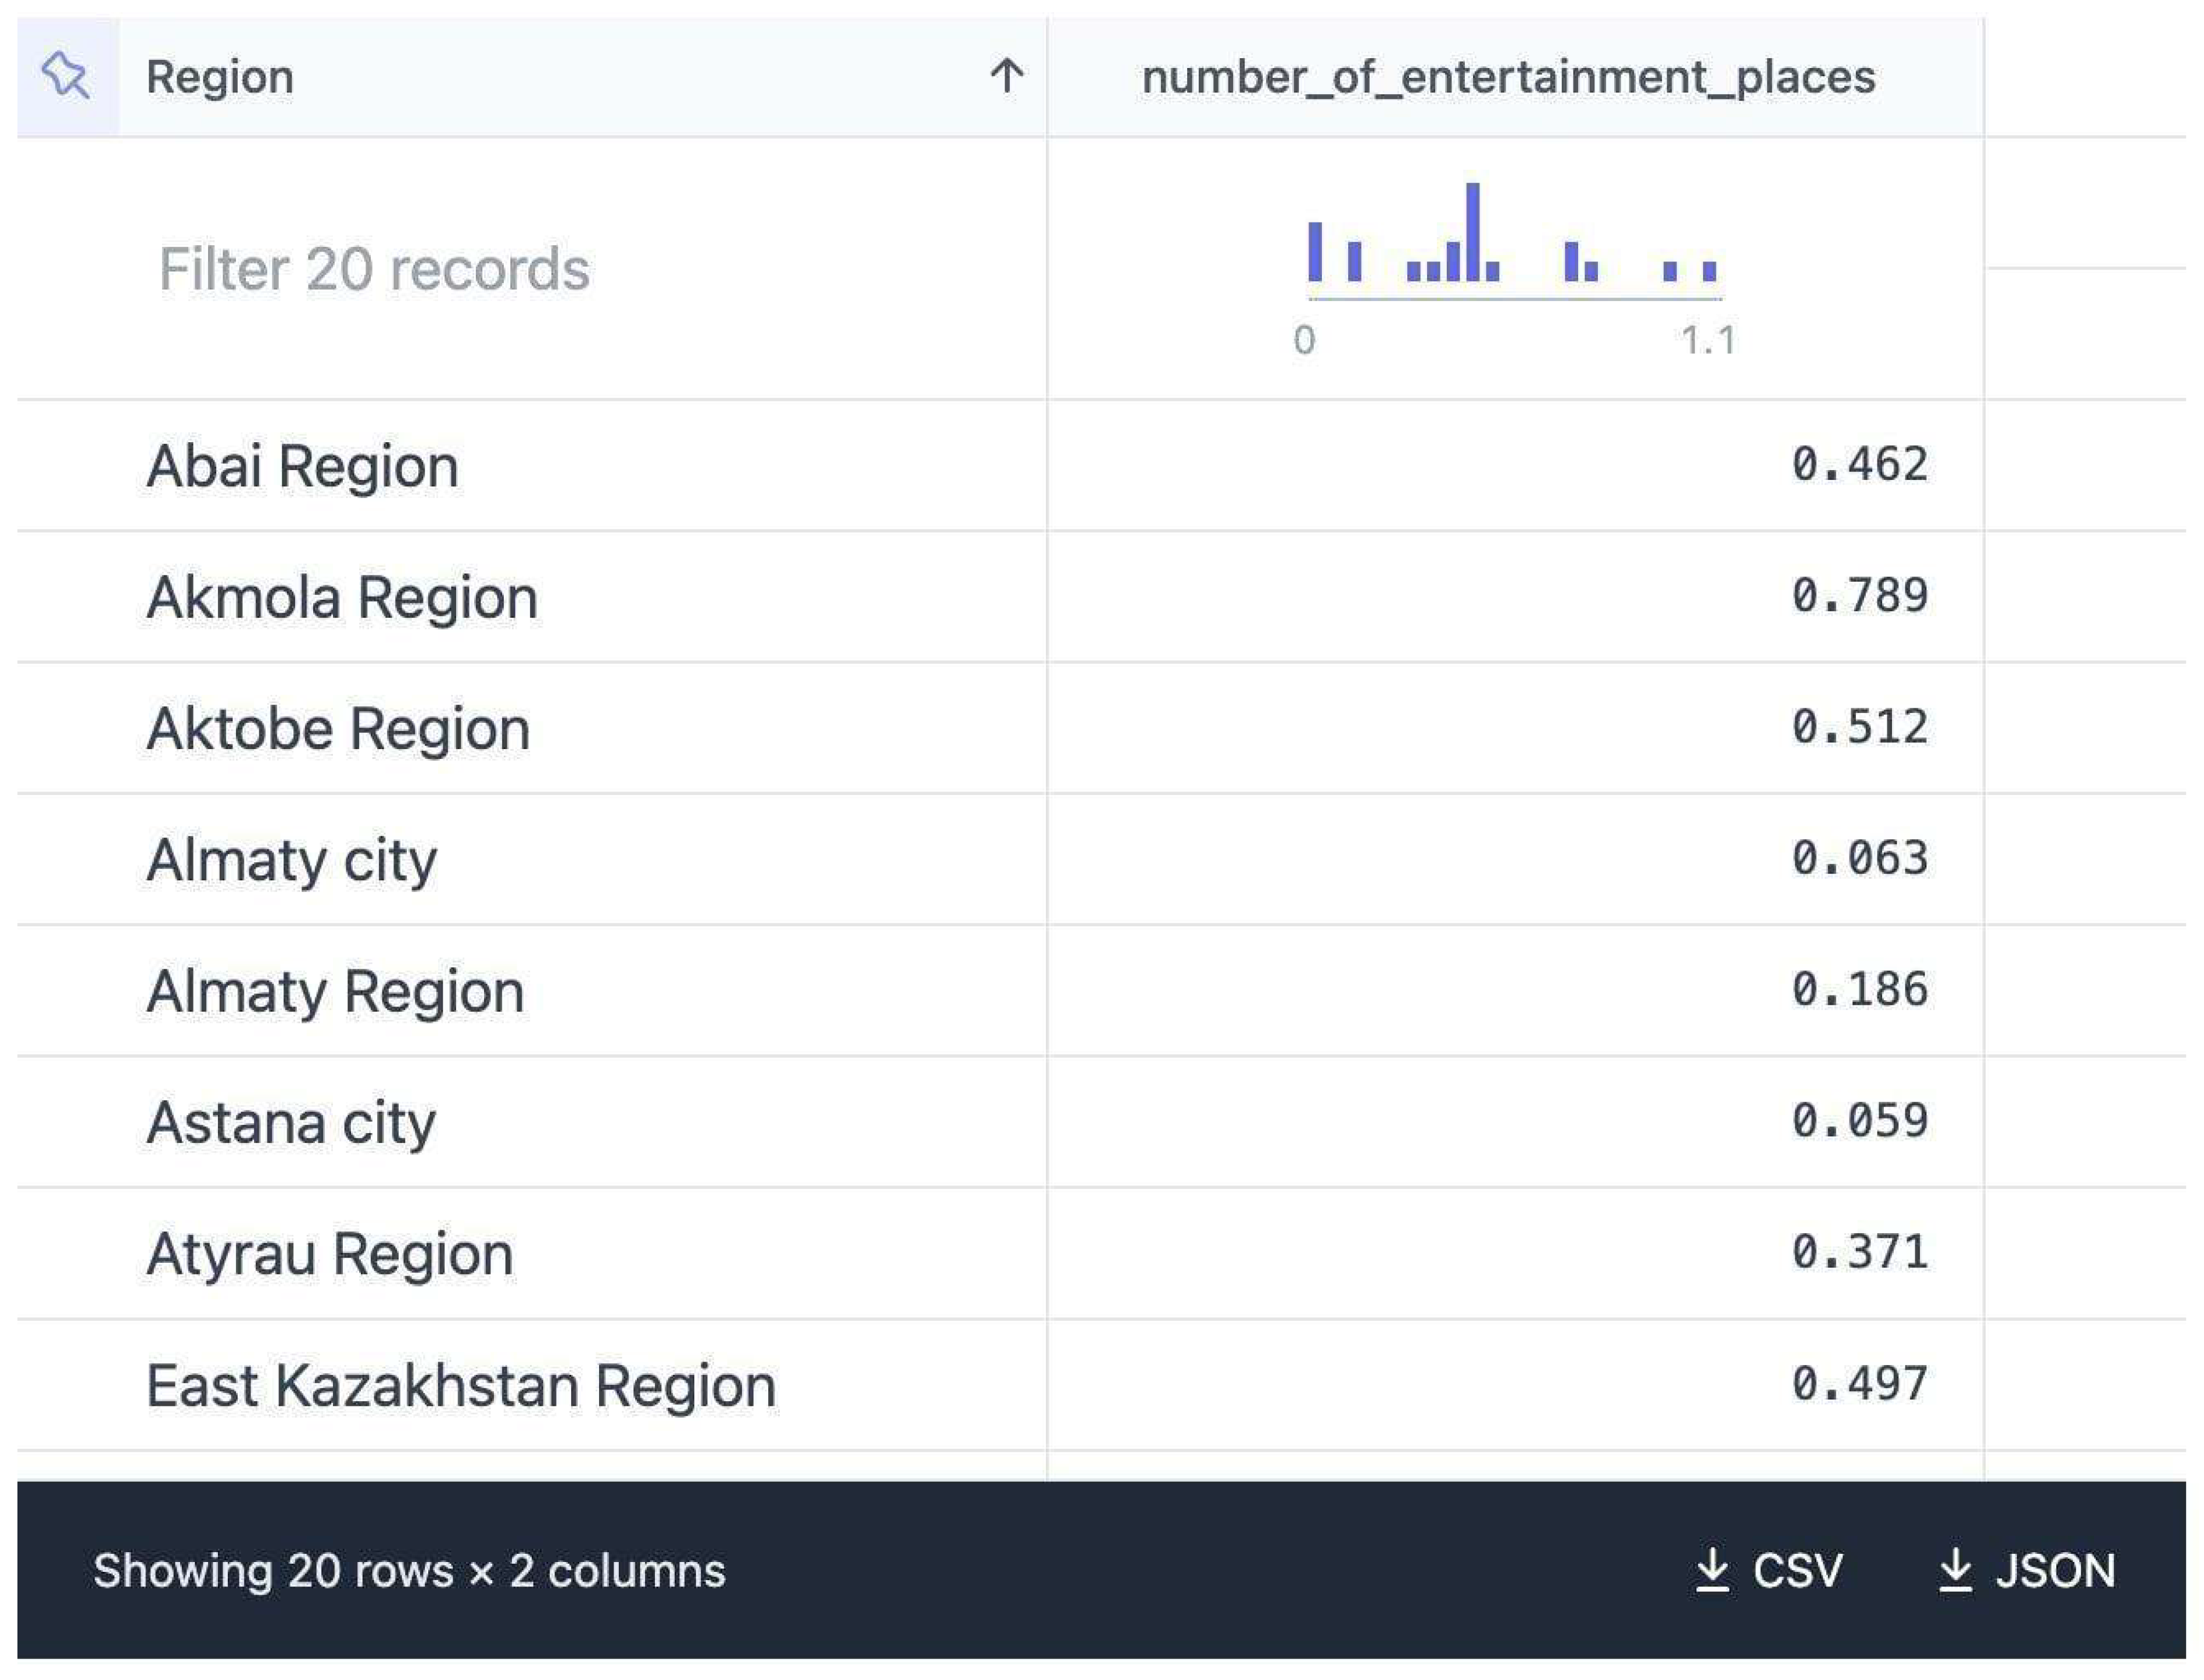
Figure 5 as follows. This will help other researchers and analysts to use datasets for any other work. In addition, we included information about data packages, their sources, and scripts. It is publicly available, and all data can be downloaded in csv and json formats for further analysis.
In this figure, data are shown in a tabular format and can be filtered and downloaded in csv and json formats.
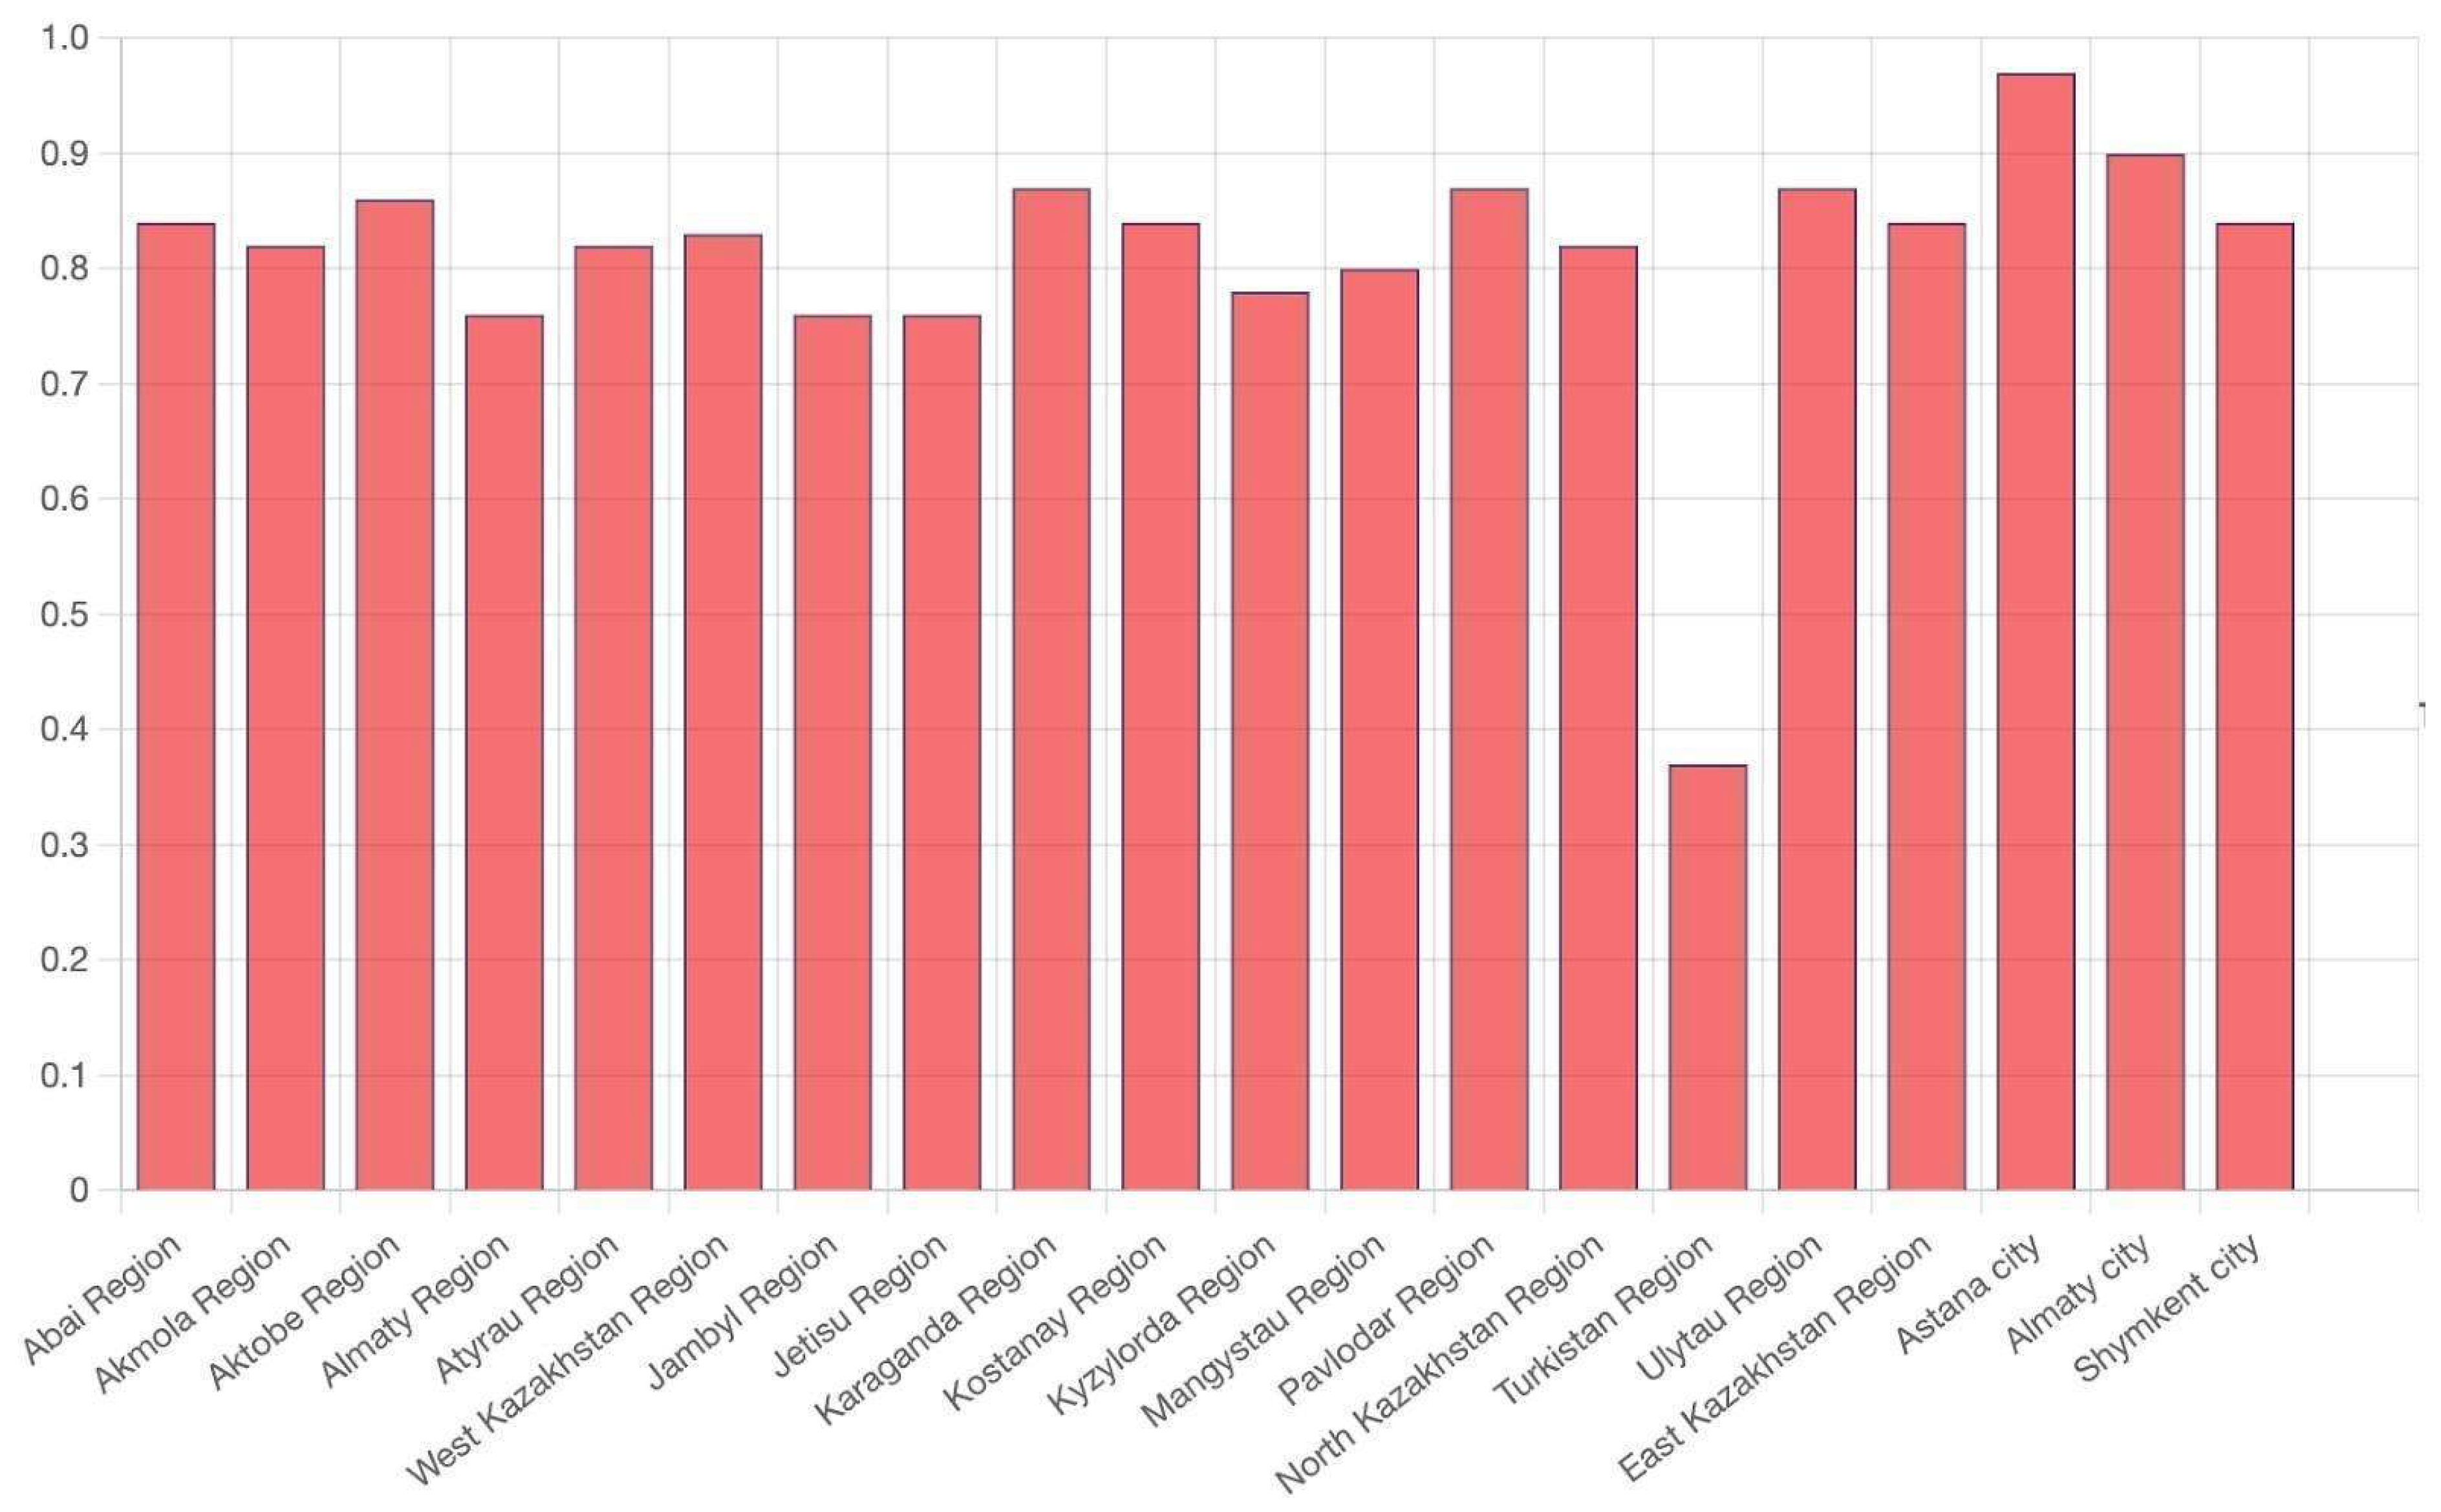
The above diagrams are helpful for visually comparing and analyzing data from each source. Also, it is the part of the portal that presents data beautifully and nicely. Other diagrams and related data can be found in the data portal, under the data section.
3.4. Data Normalization
Normalization is an important preprocessing step in data analysis, ensuring that data across different scales are standardized to a common range. This standardization is essential for enabling accurate comparisons and analyses, particularly when dealing with diverse indicators such as socio-economic factors or environmental metrics which can vary significantly in their ranges. There are several normalization methods that solve these standardization tasks. One of the popular techniques is using Z-score normalization, also known as standard score normalization, which transforms data based on their means and standard deviations. The formula is
where
X is the actual value,
μ is the mean, and
σ (sigma) is the standard deviation.
Z-score normalization is useful when the data follow a Gaussian (normal) distribution. It is often used in statistical analyses where the distribution’s shape is important [
34]. Another method that is less commonly used is Decimal Scaling Normalization where precision is critical. In this case, it scales data by moving the decimal point of values. The number of decimal points moved depends on the maximum absolute value in the dataset [
35].
Here, j is the smallest integer such that max < 1.
When it comes to skewed data, log transformation is used to apply the logarithm function to data. It is beneficial for reducing skewness and making data more normally distributed.
The +1 ensures that zero values are handled properly.
Given these options, Min-Max normalization is chosen for its simplicity and effectiveness in scaling data to a uniform range of [0, 1], facilitating straightforward comparisons across diverse indicators.
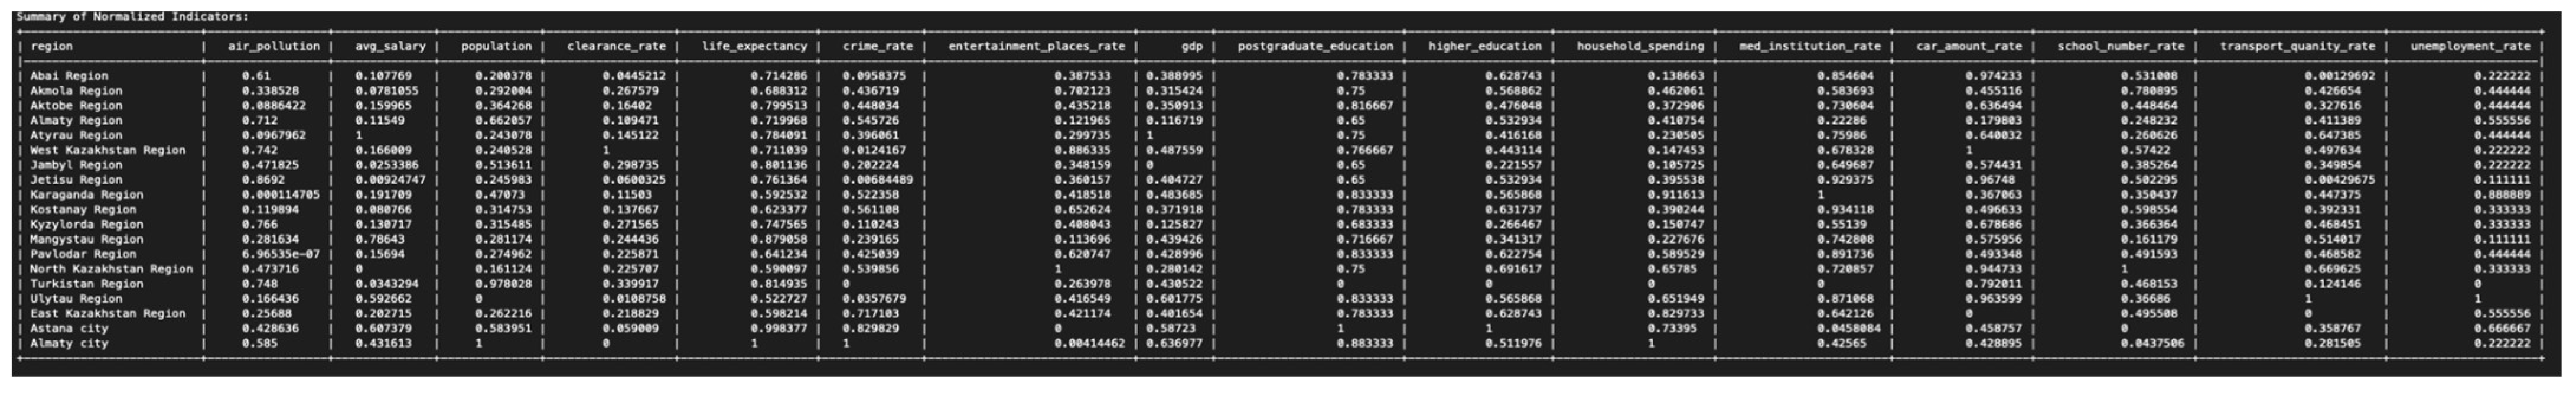
After the collection and cleaning processes, data normalization was carried out to ensure comparability across different indicators and regions. This step is vital due to the varying scales and units of measurement of the selected indicators. To standardize the diverse set of sustainability indicators, the Min-Max scaling method was employed. This technique scales all numeric variables to a fixed range of 0 to 1.
Min-Max scaling was used for its ability to preserve relationships among the original data without centering them, which is particularly advantageous for zero-inflated indicators. This method produces values between 0 and 1, facilitating the combination of indicators in subsequent analysis stages [
36]. Min-Max scaling offers a robust approach for normalizing the diverse set of features, ensuring that all variables contribute proportionally to the final analysis without introducing artificial zero values or altering the underlying distribution of zero-inflated data [
37]. Furthermore, this scaling technique maintains the relative distances between data points, which is essential for preserving the interpretability of the indicators and their relationships [
38]. The bounded range of [0, 1] resulting from Min-Max scaling also provides a standardized approach for comparing and aggregating different indicators, enhancing the overall consistency and interpretability of the composite indices [
39,
40].
The normalization process involved the following steps:
- 3.
Applying the Inverse Formula for Desirable Lower Values. For indicators where a lower value is more desirable (e.g., unemployment rate or crime rate), the inverse formula was applied:
During the normalization process, several indicators required special treatment due to their unique characteristics or distribution. These special considerations were crucial in ensuring that the normalized data accurately reflected the sustainability aspects being measured.
- (a)
GDP Per Capita: Significant disparities in GDP per capita were observed across regions, with some urban areas (particularly oil-rich regions and major cities) exhibiting substantially higher values. A logarithmic transformation was first applied to reduce the impact of extreme values and create a more normal distribution [
42]. Following the log transformation, standard Min-Max scaling was used. This approach enabled the capture of relative economic output across regions without disproportionately penalizing areas with lower GDP due to factors such as industrial composition.
Table 2 shows a subset of 5 out of the 19 total rows of GDP data for various regions. It includes the original GDP values, the logarithmic transformation of the GDP data, and the normalized GDP values using logarithmic transformation for better comparability across regions.
- (b)
Air Pollution Data: Given the critical nature of air quality in urban sustainability, a piecewise normalization approach was implemented based on the World Health Organization (WHO) guidelines. Thresholds were set according to the WHO air quality standards for PM2.5 and PM10. For values below the WHO guideline, a linear scale from 0 to 0.5 was used. For values exceeding the guideline, an exponential scale from 0.5 to 1 was applied. This method highlights the increasing health risks associated with higher levels of air pollution [
43].
Table 3 shows a subset of 5 out of the 19 total rows of air pollution data for various regions. It includes the original air pollution values, along with the results of Min-Max normalization and piecewise WHO normalization methods for comparison.
- (c)
Crime Rates: Crime rates varied significantly across regions, with some areas reporting markedly higher rates. To account for population differences, the crime rate per 100,000 inhabitants was first calculated. Subsequently, a square root transformation was applied to the rates before performing Min-Max scaling [
44]. This transformation mitigated the impact of extreme values while still capturing meaningful differences in safety across regions.
Table 4 shows that using only crime amounts for normalization is insufficient, and the proposed approach provides more concrete results.
This table shows a subset of 5 out of the 19 total rows of crime rate data for various regions. It includes the crime rate per 100,000 inhabitants, along with the results of Min-Max normalization using both the crime amount and square root transformation methods.
- (d)
Life Expectancy: Due to the relatively small range of life expectancy values, the minimum value was set to a global lower benchmark (e.g., 65 years) rather than the observed minimum in Kazakhstan [
45]. This approach provides perspective for Kazakhstan’s performance on a global scale and allows for more meaningful differentiation between regions.
Table 5 presents a subset of 5 out of the 19 total rows of life expectancy data for various regions. It includes the original life expectancy values, along with the results of Min-Max normalization and global lower benchmark normalization for comparison.
These special considerations in the normalization process ensure that each indicator is treated appropriately given its unique characteristics and distribution. This nuanced approach allows for a more accurate representation of urban sustainability across Kazakhstan’s diverse regions and cities.
It is important to note that while Min-Max scaling is effective for these purposes, it can be sensitive to outliers. This limitation was addressed by carefully examining extreme values during the data cleaning phase and assessing their validity in relation to each sustainability indicator.
This normalized dataset forms the foundation for subsequent analyses of urban sustainability and quality of life in Kazakhstan. By standardizing the diverse indicators, fair comparisons can now be made across different aspects of sustainability, allowing for the identification of strengths and areas for improvement in each urban area.
6. Results
As an output of this research, a data portal also was developed, which serves all information and data from this study. The data portal includes detailed descriptions of each sustainability indicator as well as their respective data sources in
Figure 10.
The data portal features a dedicated section for the sustainability scoring methodology, which includes the required information on each indicator. For each indicator, the portal provides detailed descriptions, corresponding graphs, and data tables. Users can also directly download the data in various file formats. Additionally, it has a metadata section that offers thorough documentation on the data sources, descriptions, and any scripts used in the analysis.
6.1. Overview of Regional Performance
The sustainability scores for the regions of Kazakhstan were calculated using two different weighting methods: equal weighting and environmental importance weighting. This approach enables a more thorough understanding of regional performance across various sustainability indicators.
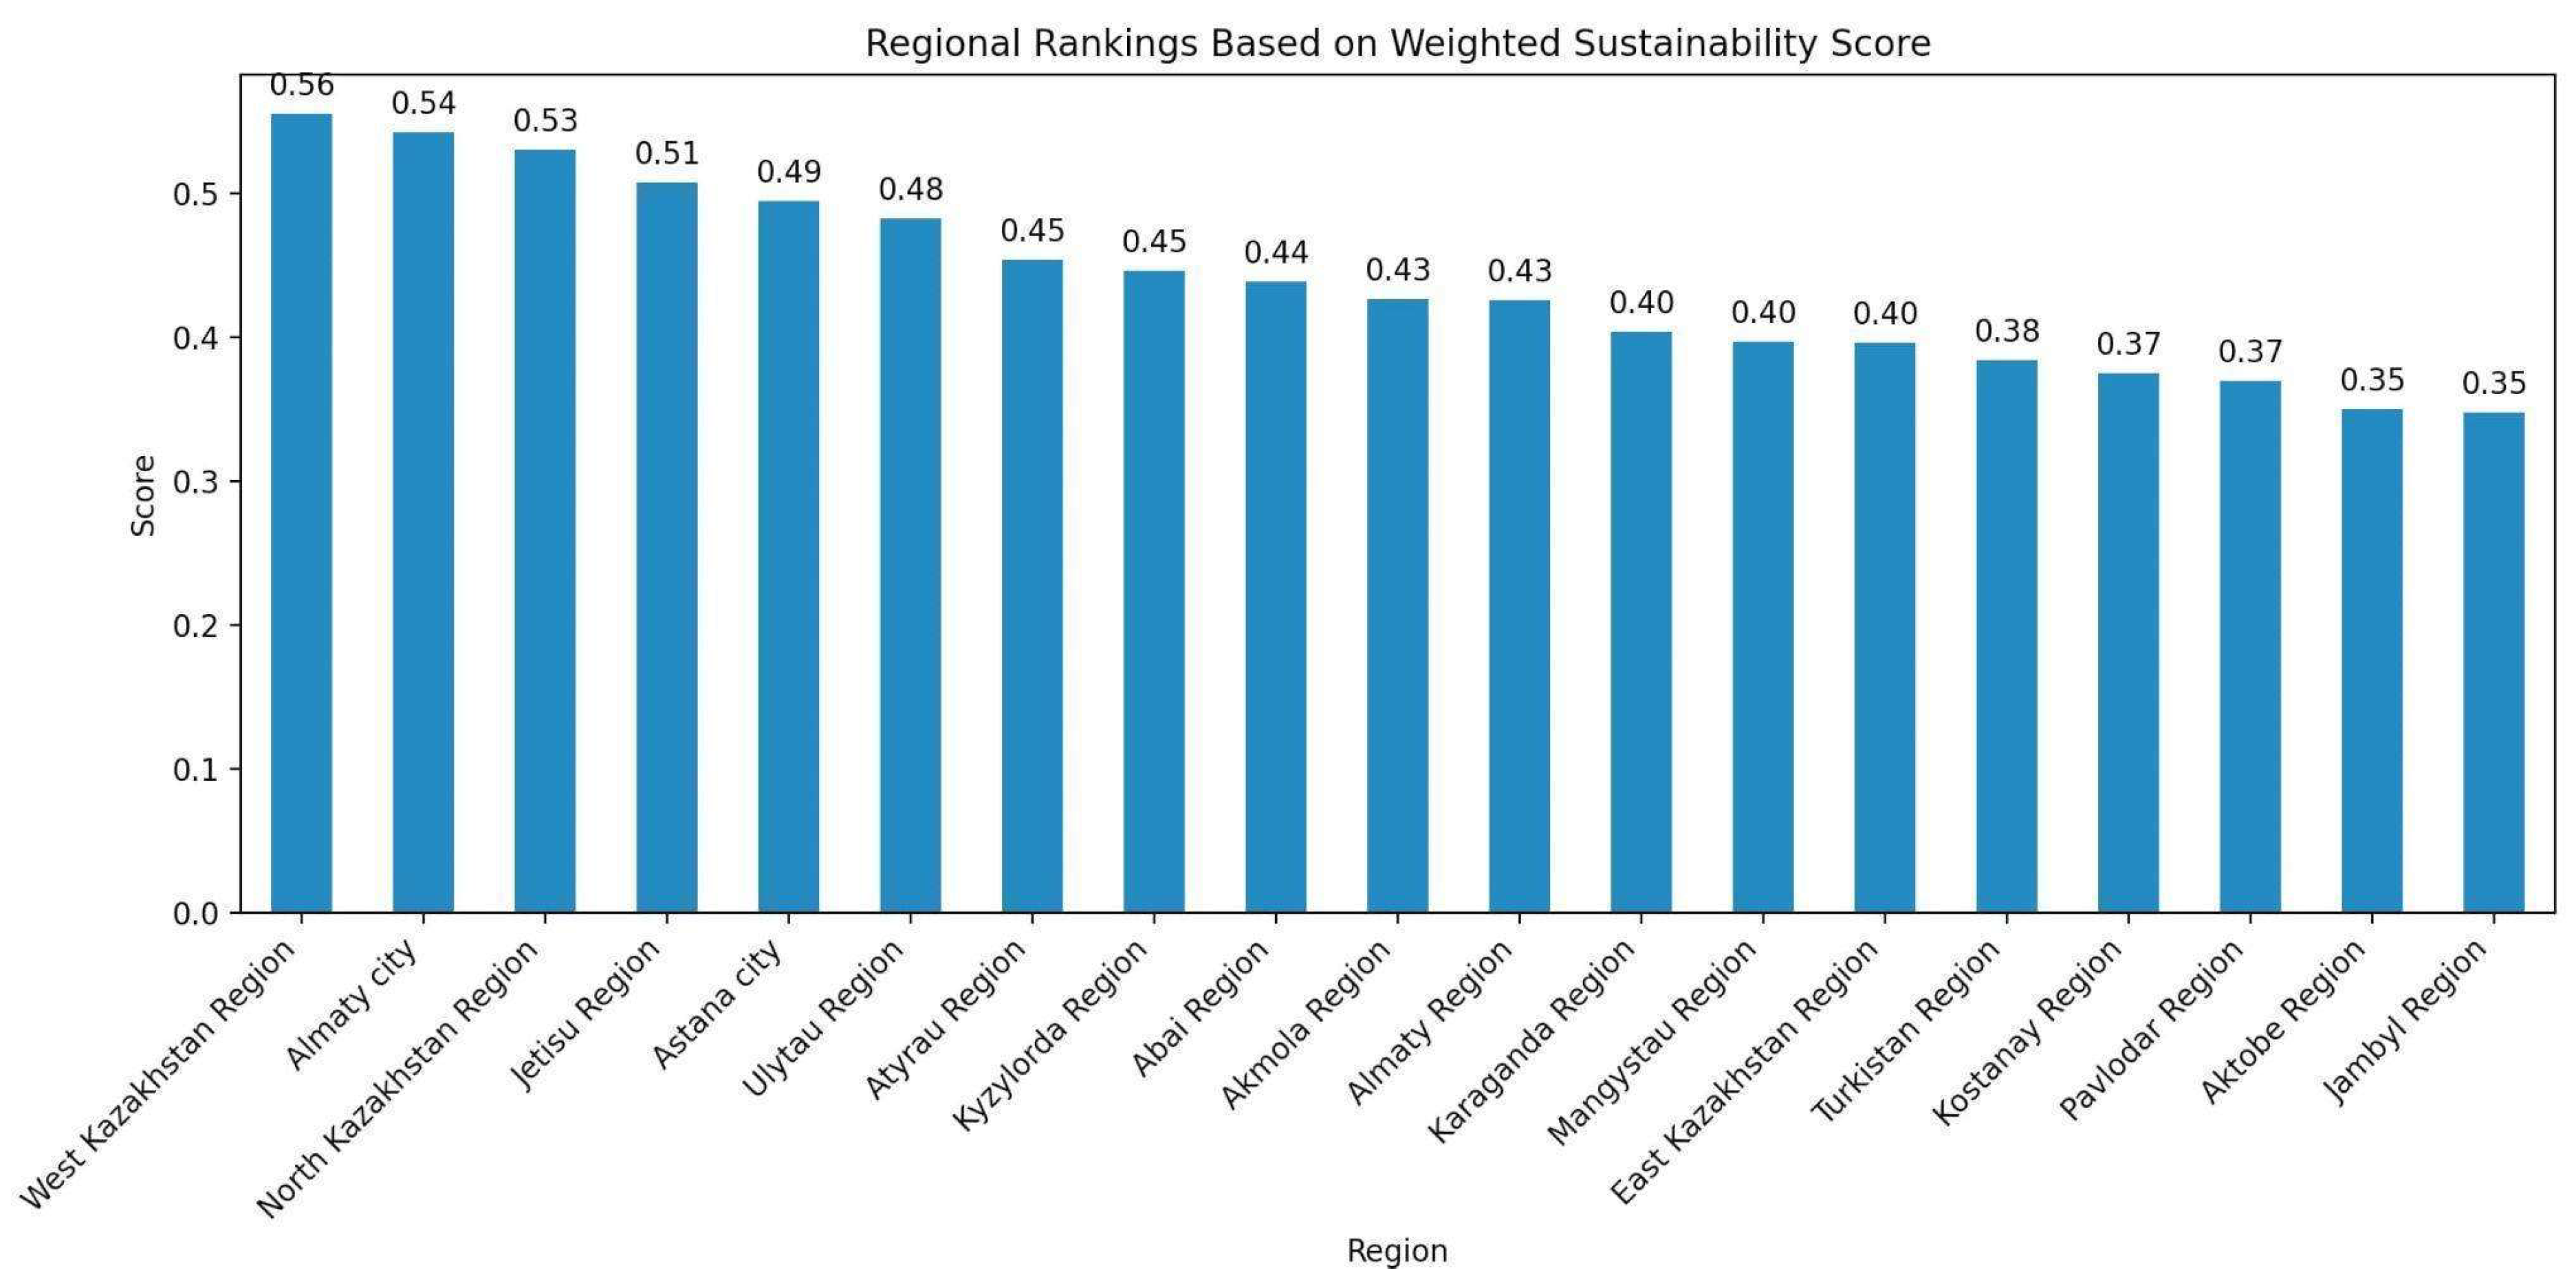
Under the equal weighting method in
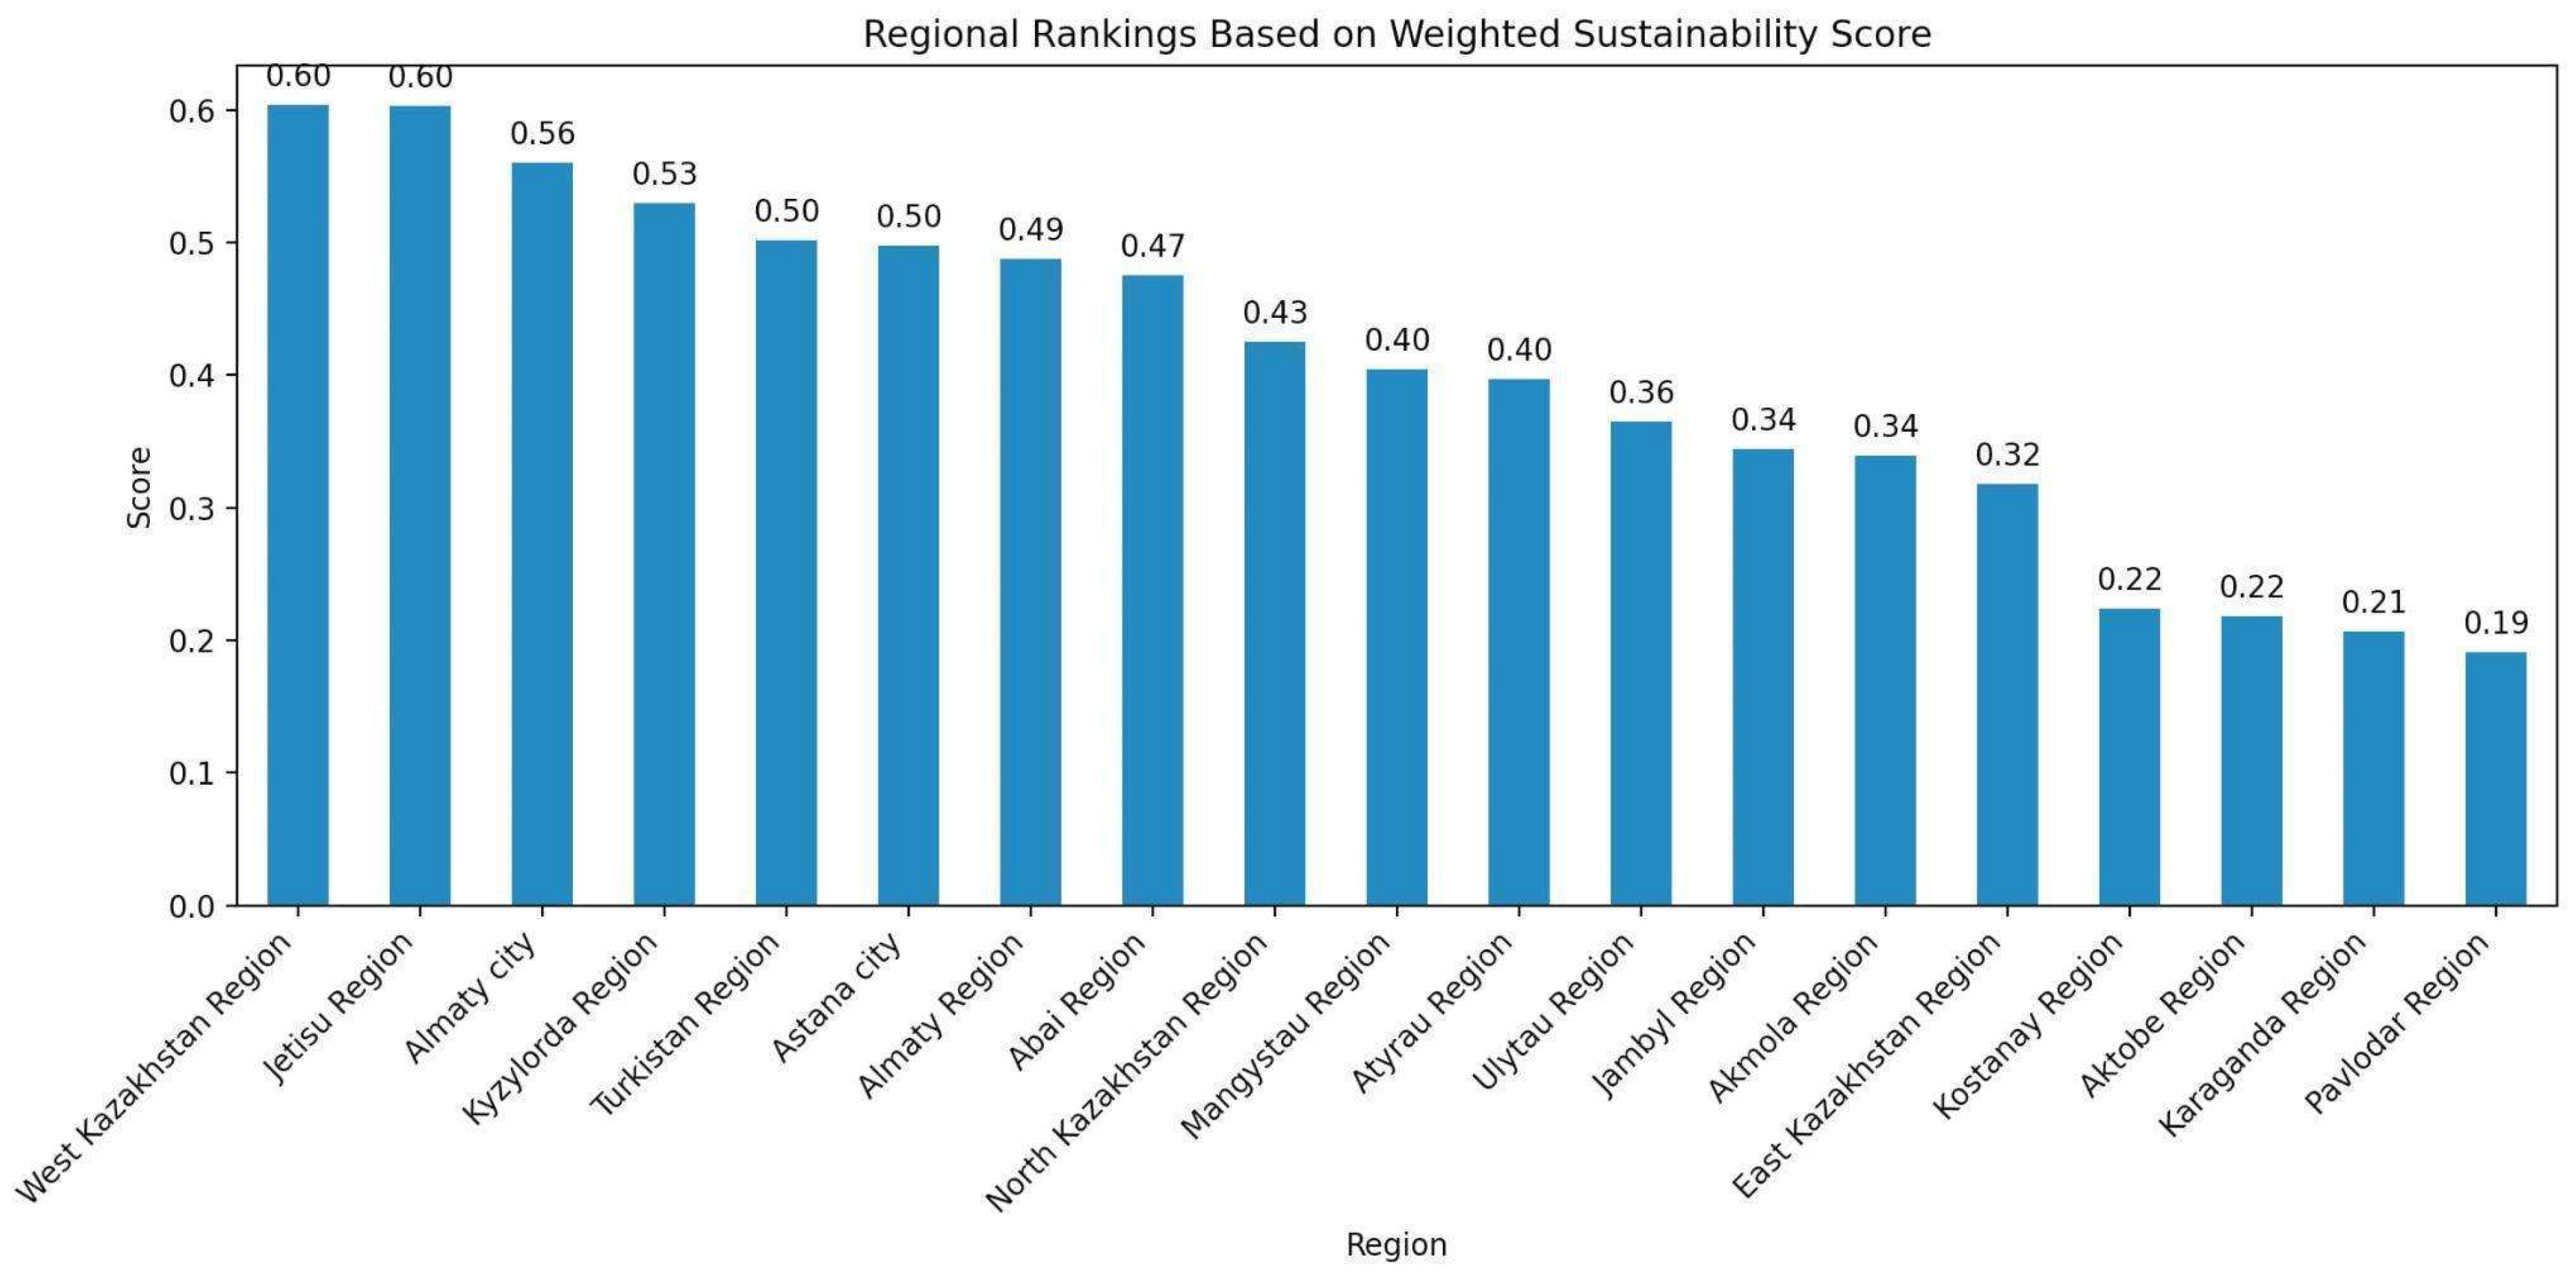
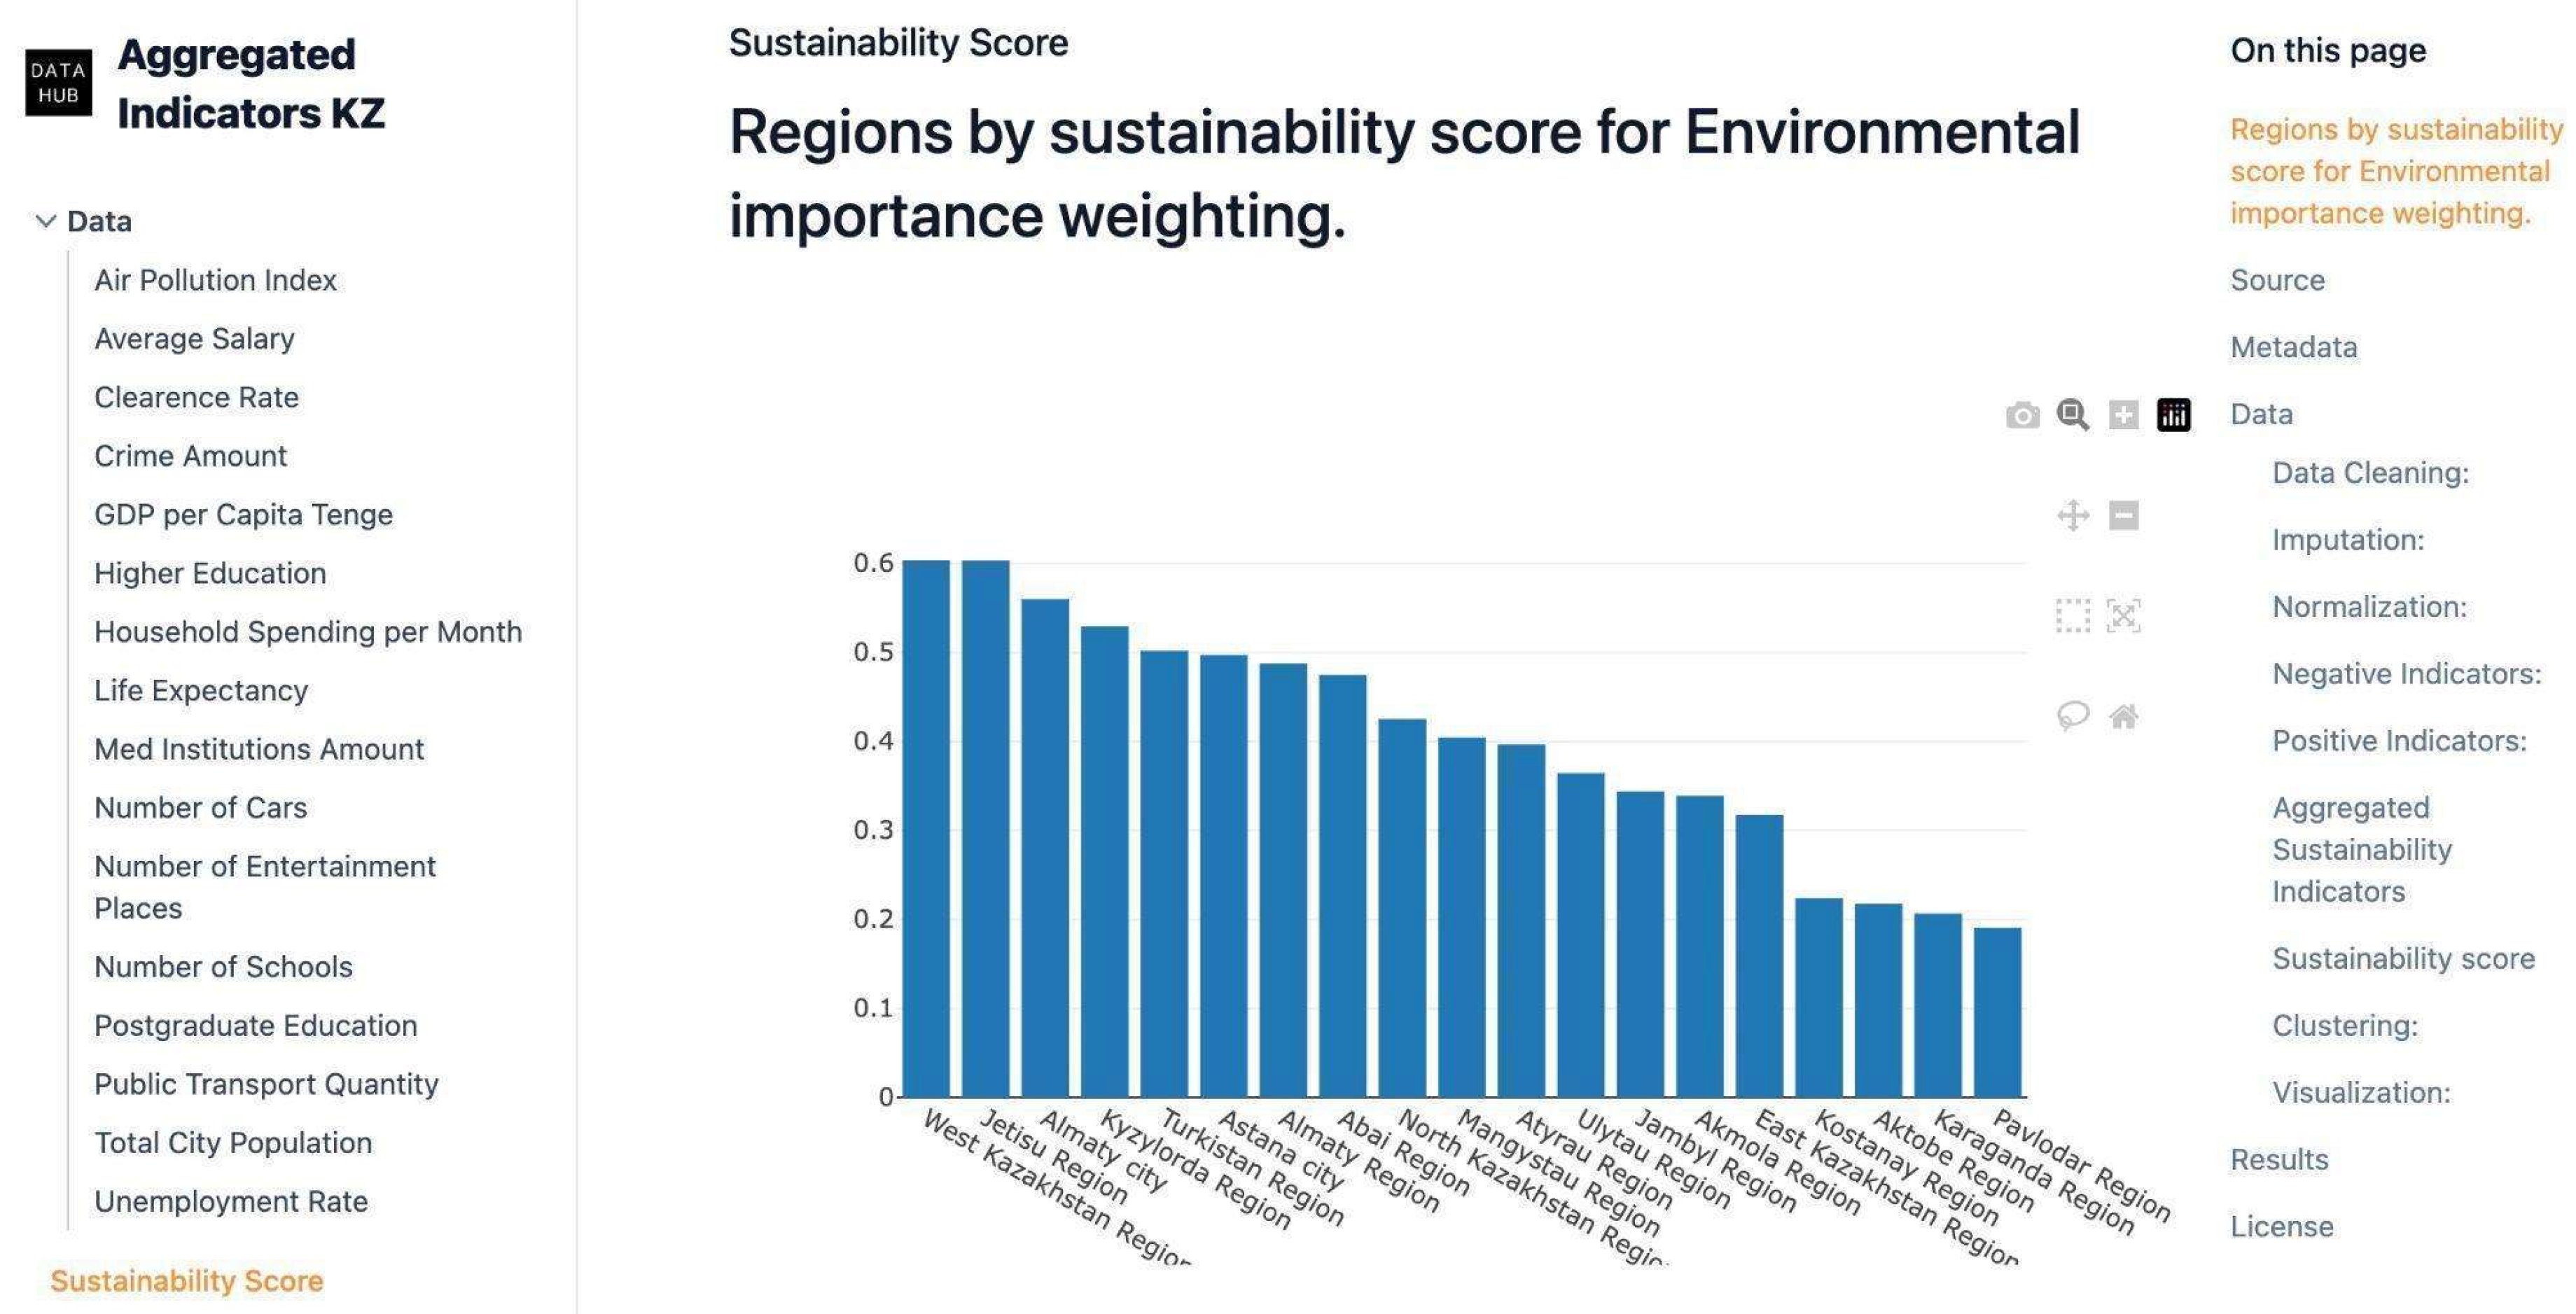
Figure 6, the top-performing regions are West Kazakhstan Region (0.5554), Almaty city (0.5427), North Kazakhstan Region (0.5309), Jetisu Region (0.5075), and Astana city (0.4945). When environmental factors are given more importance in
Figure 8, the ranking changes: West Kazakhstan Region (0.6035), Jetisu Region (0.6033), Almaty city (0.5598), Kyzylorda Region (0.5293), and Turkistan Region (0.5018)
West Kazakhstan Region maintains its top position in both weighting scenarios, indicating its strong overall performance across various sustainability indicators. The region excels particularly in clearance rate (1.0), entertainment place rate (0.8863), and car amount rate (1.0), suggesting a balanced approach to economic, social, and environmental factors.
The differences in rankings between the two weighting methods highlight the impact of environmental factors on overall sustainability scores. For instance, Jetisu Region and Kyzylorda Region rank higher when environmental factors are given more weight, possibly due to their better performance in air quality and other environmental indicators.
Regions that consistently perform well across both weighting methods, such as West Kazakhstan, Almaty city, and Jetisu Region, demonstrate a more balanced approach to sustainability, addressing economic, social, and environmental concerns effectively.
6.2. Comparative Analysis of Major Cities
This section examines the sustainability performance of three major Kazakhstan cities, Almaty, Astana, and Shymkent (part of Turkistan Region), based on the dataset analysis.
Almaty achieved an equal weighting score of 0.5427 and an environmental weighting score of 0.5598. The city excels in several areas, with a population rate of 1.0, a life expectancy rate of 1.0, and a postgraduate education rate of 0.8833. However, Almaty faces challenges regarding the crime rate with a score of 1.0, indicating the highest rate, and the school number rate which is 0.0438.
Astana recorded an equal weighting score of 0.4945 and an environmental weighting score of 0.4970. The city’s strengths include postgraduate and higher education equally with a score of 1.0, a life expectancy rate of 0.9984, and a relatively high GDP rate of 0.5872. Areas for improvement in Astana include the entertainment place rate with a score of 0.0 and the school number rate with a score of 0.0.
While specific data for Shymkent are not isolated, Turkistan Region, which includes Shymkent, demonstrated an equal weighting score of 0.3843 and an environmental weighting score of 0.5018. The region’s strengths are population and car amount with rates of 0.9780 and 0.7920, respectively. Challenges for Turkistan Region include postgraduate education, higher education, and unemployment rates with a rate of 0.0.
In terms of economic indicators, Almaty demonstrates the highest scores in average salary and household spending, with Astana following closely. Turkistan Region shows comparatively lower scores in these areas. In addition, quality of life in Almaty is in the lead in terms of life expectancy, with Astana following closely. All three cities perform well in this indicator. Almaty exhibits the best air quality among the three cities, contributing to its higher score when environmental factors are weighted more heavily. However, when it comes to social issues, Almaty faces challenges with high crime rates, while Turkistan Region, including Shymkent, struggles with unemployment and education.
Each major city has its strengths and challenges in terms of sustainability. Almaty shows a good balance between quality of life, economic factors, and environmental performance but faces social challenges. Astana excels in education and economic indicators but lags in some urban development aspects. Shymkent (as part of Turkistan Region) shows strong population growth and relatively good environmental performance but faces significant challenges in education, employment, and economic indicators. These insights can help policymakers focus on specific areas for improvement in each city to enhance overall sustainability performance. For instance, Almaty could focus on crime reduction, Astana on improving urban amenities and school infrastructure, and Shymkent on enhancing education and employment opportunities.
6.3. Patterns in Newly Formed Regions
Kazakhstan has recently undergone administrative reforms, resulting in the creation of new regions. Let us examine the patterns in these newly formed regions: Abai Region shows strengths in the car amount rate, which is 0.9742, and the medical institution rate, which is 0.8546. However, it struggles with the transport quantity rate (0.0013), and the clearance rate is 0.0445. Jetisu Region performs well in medical institution and car amount rates with rates of 0.9294 and 0.9675, respectively. Its main challenges are in transport quantity, whose rate is 0.0043, and average salary, whose rate is 0.0092. Ulytau Region excels in transport quantity with a rate of 1.0 and an unemployment rate of 1.0, indicating the lowest unemployment. However, it has the lowest population score and a low clearance rate with scores of 0.0 and 0.0109.
These newly formed regions show diverse patterns of sustainability. Jetisu Region stands out with high scores in both weighting methods, suggesting a good balance across various sustainability dimensions. Abai and Ulytau regions show more pronounced differences between equal and environmental weighting, indicating areas for potential improvement in environmental factors.
6.4. Key Findings of Sustainability Dimensions
Environmental and social indicators reveal diverse patterns across Kazakhstan’s regions. In terms of air quality, Pavlodar Region stands out as the cleanest, with an impressive score of 0.9999. In stark contrast, Karaganda Region grapples with the most severe air pollution, scoring a mere 0.0001. Vehicle density, a potential contributor to air pollution, is lowest in West Kazakhstan and Abai Regions, scoring 1.0 and 0.9742, respectively, suggesting these areas may benefit from lower vehicle-related emissions.
Life expectancy, a key indicator of overall health and well-being, shows that urban areas are taking the lead. Almaty city tops the list with a perfect score of 1.0, closely followed by Astana city at 0.9984. This urban advantage in longevity highlights potential disparities in healthcare access and quality of life between urban and rural areas.
The social landscape presents a mixed picture. Turkistan Region boasts the lowest crime rate, scoring a perfect 0.0, indicating a high level of public safety. However, it simultaneously faces significant challenges in higher education access, scoring 0.0 and lagging far behind other regions. Conversely, Almaty city, while offering excellent educational opportunities, grapples with the highest crime rate, scoring 1.0 on this measure. Astana city leads in higher education access with a score of 1.0, underscoring the concentration of educational resources in urban centers.
Economic indicators reveal significant disparities across regions in Kazakhstan. Atyrau Region emerges as the economic powerhouse, boasting both the highest average salary and the highest GDP, scoring 1.0 on both measures. In contrast, North Kazakhstan Region lags behind with the lowest average salary, while Jambyl Region has the lowest GDP, both scoring 0.0 on these respective metrics.
The employment landscape also shows regional variations. Ulytau Region demonstrates the strongest performance in terms of employment, with the lowest unemployment rate at 1.0. On the other end of the spectrum, Turkistan Region faces the greatest employment challenges, recording the highest unemployment rate of 0.0.
These stark contrasts in economic performance across regions underscore the need for targeted development strategies to address regional disparities and promote more balanced economic growth throughout the country.
Regional disparities in Kazakhstan are further highlighted by variations in social infrastructure and services.
The North Kazakhstan Region emerges as a leader in certain aspects of social amenities. It boasts the highest rate of entertainment venues, scoring a perfect 1.0, which suggests a vibrant social scene. Interestingly, this region also leads in the density of schools, again with a top score of 1.0, indicating a strong emphasis on educational infrastructure.
In contrast, Astana city, despite being the capital, presents a different picture. It scores 0.0 for both entertainment places and school density, the lowest among all regions. This unexpected finding might reflect the rapid urban growth outpacing the development of social infrastructure, or it could indicate a need for updated measurement methods in fast-growing urban areas.
Healthcare accessibility shows its own pattern of regional variation. Karaganda Region stands out with the highest rate of medical institutions, scoring 1.0. At the other end of the spectrum, Turkistan Region faces significant challenges in healthcare access, scoring the lowest at 0.0.
Transportation infrastructure also varies considerably across regions. Ulytau Region leads with the highest transport quantity rate, scoring 1.0, which suggests good mobility options for its residents. In contrast, East Kazakhstan Region scores the lowest at 0.0, potentially indicating challenges in transportation access.
There is significant variation in air quality across regions, with some factors performing exceptionally well while others struggle. Social factors: While some regions excel in life expectancy, there are notable disparities in crime rates and access to higher education. Economic factors: There is a wide gap in economic performance, particularly in average salaries and GDP, indicating uneven economic development across regions. Infrastructure: The disparities in entertainment, medical facilities, schools, and transport suggest varying levels of infrastructure development and potentially different priorities in regional planning.
These findings highlight the complex nature of sustainability across Kazakhstan’s regions. While some areas excel in certain dimensions, they may lag in others. This suggests a need for targeted policies that address specific weaknesses in each region while maintaining their strengths. The data also underscore the importance of balanced development across all sustainability dimensions to achieve overall regional sustainability.
7. Discussion
7.1. Interpretation of Results
The findings of this study align with the European Commission’s emphasis on the importance of sustainable urban development. Regions that scored highly on sustainability indicators also reflect the successful implementation of city initiatives as outlined by the European Commission. The application of the AHP method in this study provides a robust framework for assessing regional sustainability. Consistent with other research utilizing AHP for multi-criteria decision-making, the findings underscore the method’s effectiveness in capturing the relative importance of diverse sustainability indicators. The sustainability analysis of Kazakhstan’s regions reveals a complex and varied development landscape across the country.
Several key points emerge from the findings. Regional disparities are evident, with significant differences in sustainability performance among regions. Some areas excel in certain dimensions while lagging in others, suggesting that development has not been uniform across the country. The impact of weighting is highlighted by the difference in rankings between equal weighting and environmental weighting methods, emphasizing the pivotal role of environmental factors in overall sustainability. Regions such as Jetisu and Kyzylorda experienced notable improvements in their rankings when environmental factors were given more weight.
An urban–rural divide is observed, with major cities like Almaty and Astana generally performing well across multiple indicators, particularly in economic and social dimensions. However, these cities also face unique challenges, including higher crime rates and air pollution. The performance of newly formed regions, such as Abai, Jetisu, and Ulytau, varies considerably, indicating that administrative reforms may take time to produce uniform results in terms of sustainability.
Sectoral strengths and weaknesses are apparent, with different regions showing distinct performance patterns across environmental, social, economic, and infrastructure dimensions. This suggests the need for tailored approaches for sustainable development to address specific regional needs and conditions.
7.2. Implications for Urban Planning and Policy
Based on the findings, several implications for urban planning and policy in Kazakhstan can be drawn. Policymakers should focus on region-specific interventions that address the particular weaknesses of each area while leveraging existing strengths. There is a need to promote more balanced development across all sustainability dimensions. For instance, regions that perform well economically but lag in environmental or social indicators should prioritize improvements in these areas.
Given the significant impact of environmental factors on overall sustainability scores, greater emphasis should be placed on environmental protection and sustainable resource management across all regions. The disparities in infrastructure indicators highlight the need for a more equitable distribution of resources for schools, healthcare facilities, and transportation networks.
Regions heavily dependent on single industries, such as oil-rich Atyrau, should focus on economic diversification to ensure long-term sustainability. Additionally, addressing crime rates and improving access to higher education should be priorities, particularly in regions that are lagging in these areas.
7.3. Comparison with International Benchmarks
While this study focuses on internal comparisons within Kazakhstan, it is important to consider how these results might compare internationally. Environmental performance in Kazakhstan, particularly regarding air quality, may fall short of international standards. Many regions exhibit high levels of air pollution, a challenge commonly faced by rapidly developing countries.
The disparity in economic indicators across regions is typical in developing countries. However, the gap between the highest and lowest-performing regions in Kazakhstan may be wider compared to more economically uniform countries. In terms of social indicators, life expectancy in the best-performing regions is competitive, but the variation across regions and issues with crime rates in certain areas may need attention compared to international standards.
Infrastructure development disparities across regions are prevalent in many developing countries but may be more pronounced in Kazakhstan due to its extensive territory and relatively low population density in some areas.
7.4. Limitations of the Study
While this analysis provides valuable insights, several limitations should be acknowledged. The study relies on available data, which may not capture all aspects of sustainability and could contain gaps or inconsistencies across regions. The weighting methodology used two approaches, equal and environmental, but alternative weighting schemes might yield different results, as the choice of weights can significantly impact the final rankings.
This study offers a snapshot of sustainability at a single point in time; a longitudinal study would provide insights into trends and the effectiveness of policies over time. The chosen indicators, while extensive, may not cover all aspects of sustainability, and some important factors might be missing due to data limitations.
The regional level of analysis may obscure variations within regions, especially in larger or more diverse areas. Additionally, the study does not account for historical, cultural, or geographical factors that could influence sustainability outcomes but are difficult to quantify. While some international comparisons were attempted, a more rigorous benchmarking against other countries would offer a clearer understanding of Kazakhstan’s global standing in terms of regional sustainability.
Despite these limitations, this study provides a valuable foundation for understanding regional sustainability in Kazakhstan and can serve as a basis for more targeted research and policy development in the future.
8. Conclusions and Recommendations
8.1. Summary of Key Findings
This study offers a thorough analysis of sustainability across Kazakhstan’s regions, revealing several key insights: significant variations in sustainability performance exist among the regions, with some areas excelling in specific dimensions while lagging in others. Environmental factors play a vital role in overall sustainability, as evidenced by the changes in rankings when environmental factors were given more weight. Major cities like Almaty and Astana generally performed well across multiple indicators but faced unique challenges such as higher crime rates and air pollution. Different regions show distinct patterns of performance across environmental, social, economic, and infrastructure dimensions, indicating the need for tailored approaches to sustainable development. The performance of recently created regions varies considerably, suggesting that administrative reforms may take time to yield uniform results in terms of sustainability. There are significant gaps in economic performance across regions, particularly in average salaries and GDP, indicating uneven economic development. Disparities in entertainment, medical facilities, schools, and transport suggest varying levels of infrastructure development across regions.
8.2. Policy Recommendations
Targeted regional development should involve implementing strategies specific to each region that address particular weaknesses while leveraging existing strengths. This could include customized economic incentives, environmental regulations, or social programs tailored to regional needs [
47,
48].
Environmental prioritization is essential given the significant impact of environmental factors on overall sustainability. This involves prioritizing environmental protection and sustainable resource management across all regions, which may include stricter emissions controls, investment in renewable energy, and sustainable urban planning.
Balanced economic development requires promoting economic diversification, especially in regions heavily dependent on single industries. Encouraging the growth of small and medium enterprises and investing in education and training programs can support emerging sectors and reduce reliance on dominant industries [
49,
50].
Infrastructure equalization necessitates the development of a national infrastructure plan aimed at reducing disparities in access to healthcare, education, and transportation across regions. Targeted investments in underserved areas and the use of technology to enhance access to services can help achieve more equitable infrastructure distribution [
51,
52].
Social cohesion initiatives should focus on addressing crime rates and improving access to higher education, particularly in regions lagging in these areas. This might involve community policing programs, investment in local educational institutions, and scholarships for students from underperforming regions.
Urban sustainability necessitates the development of plans for major cities that address issues like air pollution, crime, and urban sprawl. Green city initiatives, smart city technologies, and community engagement programs can be integral components of a broad strategy to enhance urban sustainability [
53].
Cross-regional collaboration should be encouraged to promote knowledge sharing and resource pooling between high-performing and low-performing regions, fostering more balanced development across the country.
Finally, establishing a national sustainability monitoring system is recommended to regularly assess and report on regional performance across all sustainability dimensions [
54].
8.3. Suggestions for Future Research
To build upon this study and deepen the understanding of regional sustainability in Kazakhstan, several areas for future research are suggested. Longitudinal studies should be conducted to track changes in sustainability indicators over time, allowing for the assessment of policy impacts and long-term trends. Intra-regional analysis is needed to investigate sustainability patterns within regions to understand local variations and identify micro-level factors influencing outcomes. Complementary qualitative research can provide deeper insights into contextual factors, cultural influences, and local perspectives on sustainability.
Further, policy impact assessments are essential to evaluate the effectiveness of specific sustainability policies and initiatives at both regional and national levels. International benchmarking with countries that have similar geographical or economic characteristics can offer valuable insights from international best practices. Investigating the potential impacts of climate change on regional sustainability and developing adaptive strategies will also be crucial.
Lastly, exploring sustainability trade-offs, such as balancing economic growth with environmental protection, will aid in developing systems for managing these competing interests. Developing and testing innovative indicators to better capture aspects unique to Kazakhstan’s situation is recommended. Research on effective stakeholder engagement methods and the role of emerging technologies in promoting sustainability, including smart city solutions, renewable energy technologies, and digital governance tools, should also be pursued.
The AHP method, as developed by Thomas L. Saaty, has proven to be an invaluable tool for evaluating regional sustainability. The structured approach of AHP allows for a thorough assessment that can guide policymakers in making informed decisions about urban development. This study offers a solid foundation for understanding regional sustainability in Kazakhstan. By addressing identified challenges, leveraging regional strengths, and pursuing the suggested areas for further research, Kazakhstan can make significant progress towards more balanced and sustainable development across its regions. Achieving sustainability will require ongoing commitment, adaptive policies, and collaborative efforts from all levels of government, businesses, and civil society. As cities continue to grow, the importance of sustainable urban development becomes increasingly critical. The European Commission’s initiatives emphasize the need for a coordinated approach to sustainability, and this study provides a strategy for assessing and enhancing regional sustainability.


 ,
, 


