Abstract
In recent years, with the increase in greenhouse gas emissions, global warming has created a series of complex ecological challenges. Colleges and universities are still in the exploratory stage of constructing low-carbon campuses. This study takes the campus of Zhejiang Ocean University as the research object and obtains carbon emission data from it based on the emission coefficient method by visiting the site and issuing a questionnaire survey. A total of 246 questionnaires were collected in this study, which were quantitatively analyzed to further understand the composition of the carbon emission structure of universities and put forward the corresponding energy-saving and emission-reducing suggestions. This study actively responds to the national call for energy saving and emission reduction and aims to provide a data reference as well as scientific support for the construction of a low-carbon campus. The results show that in 2021, the carbon emissions of Zhejiang Ocean University were 3.39 × 10⁷ kg, of which direct carbon emissions were 3.34 × 10⁵ kg, accounting for 0.99% of the total carbon emissions; indirect carbon emissions were 1.50 × 10⁷ kg, accounting for 44.33% of the total; and other indirect carbon emissions were 1.85 × 10⁷ kg, accounting for the remaining 54.68%. Also, this study found that individuals in colleges and universities pay attention to carbon emissions, but it is difficult for them to maintain a low-carbon approach in daily life. Based on the results of the analysis, this study proposes a series of effective measures to reduce carbon emissions at the campus of Zhejiang Ocean University, unite students in colleges and universities, and fully implement the concepts of energy saving, emission reduction, and sustainable development in college life.
1. Introduction
Since the Industrial Revolution, soaring carbon dioxide emissions have accelerated global warming, leading to increasing temperatures, rising sea levels, and extreme weather events worldwide. These changes pose significant threats to both human survival and ecosystem sustainability, making climate change a challenge of paramount importance. Consequently, reducing carbon emissions is imperative for establishing a green, low-carbon economic system in China. Committed to the Paris Agreement, by 2030, China aims to reduce carbon dioxide emissions per unit of Gross Domestic Product by more than 65% compared to 2005. This target supports the “dual-carbon” goal, which is essential for China’s socialist modernization and for advancing green industrialization and urbanization. Prioritizing low-carbon industries and lifestyles is essential for mitigating climate change.
Universities, as hubs of research and social activity, play a pivotal role in carbon reduction efforts. A large number of students, faculty, and other staff gather inside universities, and they are active places for scientific research and social activities, making them ideal places for research related to carbon emission strategies and energy-saving behaviors [1]. By leading in carbon reduction practices, universities can influence broader societal change, promoting a low-carbon ethos among students, faculty, and staff. As global attention to climate change issues grows, universities worldwide are increasingly recognizing the important role they play in managing carbon emissions. For instance, a university in Colombia has quantified its campus carbon footprint using the UNE-ISO 14064–1 and WRI/WBCSD GHG Protocol standards, successfully identifying various emission sources [2]. These internationally standardized carbon footprint assessment tools, like CO2UNV, can effectively assist universities in formulating and optimizing carbon reduction strategies [3]. Universities in Europe and the Americas are also actively engaging in carbon management practices. For example, the University of the Basque Country in Spain conducted a comprehensive assessment of its environmental and social footprint, proposing measures to optimize campus energy management and raise social awareness. Shanghai Jiao Tong University, through a systematic design framework, has achieved a zero-carbon goal for its campus, further exploring smart energy management and the use of renewable energy [4].
Our study of Zhejiang Ocean University exemplifies this approach by investigating its carbon footprint, identifying emission sources, and formulating emission reduction strategies. This research provides new ideas and research cases for the theoretical study of low-carbon campus planning and construction, providing a quantitative basis for the construction of the campus carbon emission calculation model [5], and it also guides practical initiatives to instill energy-saving habits in students. By integrating sustainability principles into daily life, universities can drive societal progress toward a greener future.
The global focus on carbon emissions, coupled with China’s advocacy for low-carbon initiatives, has elevated universities’ awareness of their carbon footprint. In response, many institutions have begun assessing their campus emissions, recognizing the need to quantify and mitigate their environmental impact. This trend aligns with the broader effort to address climate change and achieve sustainability goals. The carbon footprint, a component of the ecological footprint approach, serves as a metric to represent the forest capacity required to offset CO2 emissions. Central to this concept is the average forest carbon sequestration stock (AFCS), a key parameter calculated based on the net carbon sequestration capacity of a forest ecosystem [6,7]. This metric provides a valuable tool for universities to assess their carbon emissions and identify opportunities for reduction. Carbon footprint represents the carbon dioxide emissions directly and indirectly generated by a person or a group [8], focusing on the amount of CO2, CH4, and other greenhouse gases emitted by people during various social activities, usually expressed in units of mass or area [9]. However, there is scholarly disagreement about the system boundary of carbon footprint accounting and the types of greenhouse gases included. According to Wiedmann et al. [10], carbon footprint refers to the amount of CO2 emitted during the life cycle of a product or service. Hertwich et al. [11] regard carbon footprint as all greenhouse gas emissions generated by final consumption and its production process. Peters [12] expands the definition to encompass emissions from production, consumption, and land use within a specific time frame and region, considering factors such as land use and surface reflectivity. Carbon footprint is an important measure of an individual’s or organization’s impact on the environment and helps to assess and reduce greenhouse gas emissions. However, due to inconsistencies in accounting methods, it is difficult to compare and analyze data from different universities. Although solutions have been proposed, they lack a clear purpose. Universities, as large institutions with significant resource consumption, play a pivotal role in addressing climate change. By assessing their carbon footprint, they can identify areas where emissions are high and implement effective strategies to reduce them. However, a significant challenge in comparing and analyzing data from different universities lies in the inconsistencies in carbon footprint accounting methods. Different institutions may adopt varying approaches and boundaries for their assessments, making it difficult to make meaningful comparisons. To address this issue, there is a need for standardized accounting frameworks that can be universally applied across universities. In this context, our study aims to contribute to the existing research by providing a comprehensive assessment of campus emissions using a standardized accounting method. We aim to compare our findings with those from other universities, highlighting the similarities and differences in their carbon footprints. Furthermore, our study seeks to identify innovative strategies that can be implemented by universities to reduce their carbon emissions and achieve sustainability goals. By bridging the gap between existing research and practical implementation, we hope to pave the way for more effective climate action in the academic sector.
The evaluation methods of the carbon footprint mainly include the “bottom-up” whole-life carbon emission accounting method and the “top-down” input–output method. The whole-life cycle carbon emission accounting method includes the carbon emission accounting of all industries or links. The evaluation results are highly accurate, but they require more work and material resources [13], which is not suitable for the macro carbon accounting of campuses. The input–output method has clear accounting boundaries [14] and is suitable for the carbon accounting of the economic system, but it presents certain limitations for the carbon accounting of campuses [15]. It faces certain limitations in data collection and processing. These include the lag in data collection, inconsistencies and varying reliability across different databases, errors due to sector aggregation, limitations in the scope of accounting, and reliance on high-technical-requirement accounting models. Moreover, existing studies have key gaps in micro-level accounting, real-time data analysis, handling of data uncertainty, technological development and application, and scenario analysis methods. According to the national greenhouse gas inventory guidelines, the emission factors of corresponding activity data are constructed for different emission sources [16], and the product of activity data and emission factors are used as the estimated carbon emission value of the research object [17,18]. At present, the emission factor method is also the most commonly used in carbon accounting research at home and abroad, and it is also used as the basis for the compilation of relevant inventories internationally [19]. The emission method is simple, fast, and reliable and is suitable for studying the overall carbon emissions of campuses [20].
This paper focuses on the study of carbon emissions at Zhejiang Ocean University, employing the emission coefficient method along with surveys and questionnaires to explore strategies for low-carbon campus construction and carbon reduction. The study begins by highlighting the global and Chinese demand for carbon emission reduction, emphasizing the crucial role that universities play in this area. The research objectives include calculating the carbon emissions of Zhejiang Ocean University, analyzing the sources of these emissions, and providing recommendations for building a low-carbon campus. This study uses the emission coefficient method to quantify carbon emissions across different scopes. This research carries significant theoretical and practical implications, offering new perspectives on carbon emission studies in universities. It proposes measures such as energy-saving renovations, improving resource utilization efficiency, and raising awareness of energy conservation. Furthermore, this study provides practical guidance for low-carbon campus construction and student involvement in sustainable development, encouraging students to reduce the use of disposable products and optimize energy usage habits.
2. Materials and Methods
2.1. Project Site
The study area is Zhejiang Ocean University, located in Zhoushan, in Zhejiang Province, an archipelago in southeastern China. Zhoushan is located in the northeastern part of Zhejiang Province, with the East China Sea to the east and Hangzhou Bay to the west. The university was jointly established by the Ministry of Natural Resources and the People’s Government of Zhejiang Province and is one of the key universities in Zhejiang Province. Zhoushan is surrounded by the sea on all sides, belonging to the monsoon oceanic climate of the southern edge of the northern subtropical zone, with four distinct seasons, monsoon periods (with prevailing northerly winds in fall and winter and prevailing southerly winds in spring and summer), warm winters, and cool summers. It is windy all year round, with many sea mists in the spring and many typhoons in the summer and fall, and its common catastrophic weather events include typhoons, cold tides, and persistent cloudy rains with a long duration. Due to its location in the south, winter temperatures are relatively high. These climatic conditions determine that the energy consumption for heating Zhejiang Ocean University in the winter is small compared to that in the northern region of China. The average annual temperature is 16.7 °C. Due to the large amount of greenhouse gases emitted into the environment, the global temperature is generally increasing, and the average annual temperature in Zhoushan has been rising year by year since the 1990s, so it is necessary to monitor its carbon emissions. The study of the campus carbon emissions of this university is representative of the study of campus carbon emissions in some southeastern coastal locations.
Zhejiang Ocean University covers a total area of 1.47 × 10⁶ square meters (including 4.8 × 10⁵ square meters of sea area). The campus is well equipped, with facilities including teaching buildings, laboratories, libraries, office buildings, canteens, and dormitories. The building area of the campus is 534,000 square meters, and the energy consumption of the building is dominated by the use of electricity. The number of students on the campus is about 15,959, including undergraduates, postgraduates, and international students, and the number of teaching staff members is 1563. In summary, Zhejiang Ocean University, as a higher education institution with a relatively diverse carbon emission structure, is a good representative to study carbon emission accounting in colleges and universities.
2.2. Campus Carbon Emissions Data Acquisition and Survey
The organizational boundaries are the buildings and facilities within the spatial boundaries of the Xincheng Campus of Zhejiang Ocean University, including teaching office buildings, libraries, student dormitories, commercial streets, and other structures, with the data referring to the year 2021. There are various types of greenhouse gases in campus emissions, including carbon dioxide and other gases, but carbon dioxide (CO2) is the most significant contributor to campus carbon emissions. Therefore, the analysis focuses primarily on CO2 emissions. Based on the meaning of operational boundaries, campus carbon emissions are categorized into the following three categories:
Scope 1: Direct emissions occurring within the school’s geographic boundary, categorized as stationary source combustion, mobile source combustion, and fugitive emissions.
Scope 2: Indirect emissions associated with incoming electricity and heat consumed by activities within the school’s geographic boundaries.
Scope 3: Indirect emissions other than those in Scope 2, which are indirect emissions resulting from activities within the school but occurring outside the school. Examples include emissions from transportation that is not owned by the university and carbon emissions from personal energy use at the university. The Scope 3 emissions are not reported in other economy sections (food processing or chemical industry—e.g., plastic production, clothes manufacturing, etc.)
Under the Greenhouse Gas Protocol, the operational boundaries must consider Scope 1 and Scope 2, with Scope 3 being optional. Scope 3 emissions are generally difficult to estimate accurately, but because they are typically large, they have a significant impact on the school’s total carbon footprint. Therefore, if a school’s carbon footprint is to be fully assessed, data need to be collected and calculated for Scope 3 emissions in addition to Scope 1 and Scope 2 emissions. This will enable a more accurate measurement of the impact of schools on climate change and the development of more low-carbon scientific strategies and measures. Some of the Scope 3 factors were considered in this study, so the carbon emissions per capita may be higher than in some other higher education institutions.
Table 1 shows the carbon emission sources at the Zhejiang Ocean University campus.

Table 1.
Classification table of carbon emission sources at the Zhejiang Ocean University campus.
In Zhejiang Ocean University, the main ways to consume campus electricity are indoor lighting, dormitory building living electricity, basic public facilities, experimental facilities in the experimental building, and part of the cafeteria’s induction cooker. Natural gas is mainly consumed in the cafeteria, the experimental building, etc. Water is mainly consumed by the water heater, laboratories, campus irrigation, and some projects. Table 2 shows the types of GHG emissions corresponding to the common emission sources on campus. The carbon emissions from students’ and staff’s personal energy consumption mainly include clothing, food, housing, transportation, and usage. Using energy consumption data statistics and questionnaire recovery and analysis, this study carries out carbon emission statistics and accounting analysis, discusses the results on the premise of having a comprehensive understanding of the energy consumption and carbon emission environment of the study area, and offers suggestions for the construction of a low-carbon campus. This study mainly carried out the following tasks:
Table 2.
Carbon emission data inventories visited and researched.
- (1)
- Carbon emission data collection for Zhejiang Ocean University was conducted by visiting the logistics department and distributing questionnaires. The data included three levels: (1) Scope 1: Data on fossil energy usage from cafeterias and other sources, which were obtained by visiting the logistics department. (2) Scope 2: Data such as campus electricity usage, which were obtained by visiting the logistics department. (3) Scope 3: Data on campus water consumption, paper usage, and laboratory chemical consumption, which were obtained from the logistics department, and students’ and staff’s carbon emissions in terms of clothing, food, housing, transportation, and usage, which were obtained through the distribution of recycling questionnaires.
- (2)
- Accounting for the carbon emission data of Zhejiang Ocean University. In the carbon footprint assessment of university- and college-related research, the more commonly used method is the emission factor method. The formula used is CO2 emissions = consumption × unit emission factor, where the unit of consumption can be the area, the mass, etc., namely the unit emission factor for the CO2/unit. This study adopts the emission factor for the default emission factor, which can be obtained by professional organizations engaged in relevant research and national and international authorities.
- (3)
- Finally, based on the results of the data analysis, energy-saving and emission-reducing optimization programs are proposed for Zhejiang Ocean University. This will allow the university to analyze the loopholes and energy-saving potential of energy-saving and emission reduction work in the school, formulate corresponding energy-saving programs, and carry out more targeted low-carbon environmental protection actions.
In this study, data on fossil energy use, water consumption, and electricity consumption at Zhejiang Ocean University were obtained from the university’s Logistics Service Center. Under the leadership of the instructor and seeking the help of the teachers in the logistics department of the school, the management staff of each building were visited. The statistics of the logistics department, the experience assessment, the survey, and other data needed for the research were collected. The list of the data collected for this research is shown in Table 2.
The data obtained from the logistics department include the usage of natural gas, water, and electricity on campus, which belong to Scope 1, Scope 2, and part of Scope 3. The other part of Scope 3 is the carbon emissions generated by personal energy use in colleges and universities, which are often ignored. In this study, the personal carbon emissions of students and staff, including clothing, food, housing, transportation, and usage, were obtained by issuing recycling questionnaires. We used random sampling techniques to select participants, which helps ensure that the sample is representative of the population. We divided the population into subgroups (strata) based on relevant characteristics and sampled from each stratum to ensure proportional representation. An unbalanced sample ratio between teachers and students can introduce bias into the results. Therefore, the selection of the sample should be based on the ratio of faculty to academics on campus as much as possible. We conducted a preliminary check of the collected data to exclude responses that are obviously illogical, such as incomplete answers or questionnaires that are clearly filled in randomly. We chose to remove questionnaires that contained missing values. We ensured that the responses were logically consistent, for example, checking for values that were beyond a reasonable range for variables such as age.
A total of 246 questionnaires were distributed, 231 to students and 15 to faculty members. The survey questions can be used to roughly calculate the individual carbon emissions of colleges and universities and understand the group’s awareness of low-carbon emission reduction.
The questionnaire was divided into 3 parts.
The first part asked for personal information, mainly including the gender and identity of the sample.
The second part of the questionnaire was about carbon emissions related to clothing, food, housing, and transportation. It asked about the average number of clothes purchased by the sample and the average amount of laundry detergent used; the carbon emissions from personal diet; the commuting and traveling habits of individuals; and the frequency of using disposable chopsticks, packing boxes, and plastic bags in daily life.
The third part was about each individual’s knowledge of carbon emissions and the importance they place on it, as well as their views and opinions of the university’s efforts to reduce them.
The content of the questionnaire can be found in the Appendix A.
2.3. Campus Carbon Emission Data Accounting
The emission coefficient method is a viable method for calculating carbon emissions based on the principle that carbon emissions from each carbon source are equal to the consumption of an item multiplied by the unit emission factor () [21]. CF is the carbon emissions from each carbon source, Q is the consumption of an item, and EF is the unit emission factor. In this formula, activity levels quantify the activities that generate carbon emissions within the boundaries of an organization and can be determined by using statistical data, questionnaires, etc. Emission factors are the carbon emissions corresponding to each unit of activity level and are usually determined and used according to national and international standards.
In this study, the emission coefficient method was used to calculate the carbon emissions of Zhejiang Ocean University, which initially requires determining the activity levels of each carbon emission source within the university, such as energy use and water use. Then, the carbon emissions corresponding to each activity are calculated by selecting appropriate emission factors according to national and international standards. Finally, the carbon emissions from each source are totaled to provide the total carbon emissions of the university. Using this method, the carbon emission status of the university can be revealed objectively and accurately, providing a scientific basis for the formulation of low-carbon development strategies.
In the process of determining carbon emissions in colleges and universities, relevant carbon emission factor data have to be obtained from professional organizations engaged in relevant research and national and international authorities. The main carbon emission factors used in this study are shown in Table 3.
Table 3.
Data on carbon emission factors for common colleges and universities.
3. Results
As described above, the campus carbon emissions are divided into direct emissions (Scope 1), indirect emissions (Scope 2), and other indirect emissions (Scope 3). The specific carbon emission data on the campus were collected, then screened and cleaned. Next, based on the carbon emission factors, the emission coefficient method was used to calculate the emissions of each carbon emission source and to compare and analyze the size and causes. The data obtained from the visit to the logistics service center of Zhejiang Ocean University can be collated to list some of the kinds of energy consumption on the campus of Zhejiang Ocean University in 2021(Table 4).
Table 4.
Energy consumption of part of the campus of Zhejiang Ocean University in 2021.
According to the characteristics of the daily life of the campus population, the individuals present at the university campus were divided into students and staff, and the data collected from the questionnaires were collated to reveal the average consumption of carbon emissions per capita generated by the daily life of students and that generated by the daily life of the staff. Table 5 shows the consumption of carbon emissions per capita from students’ daily lives; Table 6 shows the consumption of carbon emissions per capita from the daily life of faculty and staff.
Table 5.
Consumption of carbon emissions per capita from students’ daily lives.
Table 6.
Consumption of carbon emissions per capita from the daily life of faculty and staff.
3.1. Accounting for Carbon Emissions at Zhejiang Ocean University
3.1.1. Accounting for Scope 1
With the progress of technological development, the direct emission of greenhouse gases from the combustion of fossil fuels no longer occupies the dominant position of carbon emissions from colleges and universities. Moreover, since there are no school buses or official vehicles on the campus of Zhejiang Ocean University, the carbon emissions from burning gasoline account for a smaller share than those from natural gas combustion, and, besides, teachers and students usually walk to and from classes, which reduces carbon emissions from transportation. Therefore, this study used the carbon emissions from natural gas combustion to represent the carbon emissions data of Scope 1. Natural gas combustion on college campuses is concentrated in the cafeterias due to college campus restrictions that prevent students from cooking in their dormitories. The data in Table 4 show that in 2021, the amount of natural gas used in the new campus of Zhejiang Ocean University was 1.52 × 10⁵ cubic meters. Based on the emission coefficient method, the direct carbon emissions were calculated as 3.34 × 10⁵ kg (Table 7).
Table 7.
Accounting for carbon emissions from natural gas flaring at Zhejiang Ocean University in 2021.
3.1.2. Accounting for Scope 2
The data in Table 4 show that in 2021, the electricity consumption of the Xincheng Campus of Zhejiang Ocean University was 1.91 × 10⁷ kWh. Based on the emission factor method, the indirect carbon emissions were calculated as 1.50 × 10⁷ kg (Table 8).
Table 8.
Accounting for carbon emissions from electricity consumption at Zhejiang Ocean University in 2021.
Today, the functional consumption of energy within the school is mainly focused on electricity and heating, replacing the previous energy-consuming and highly polluting coal-fired energy. Electricity consumption is closely related to human social activities and is one of the main sources of campus carbon emissions. At present, China is still dominated by thermal power generation, and the carbon emission factor of electricity is high. The school building area and the number of people directly affect the consumption of electricity, and the campus expansion and the growth in the number of students will increase indirect carbon emissions year by year. In Zhejiang Ocean University, building energy consumption involves dormitories, cafeterias, teaching buildings, experimental buildings, etc. Electricity consumption has become the main part of building energy consumption, and saving electricity has become an urgent issue [22,23,24,25].
Dormitory electricity, due to the constraints of the objective conditions of the dormitory, is limited to lighting electricity and low-power electrical appliances. High-power electrical facilities for air conditioning are the main kind of air-conditioning power consumption related to the seasonal temperature, and this kind of consumption is therefore mainly concentrated in the winter and summer seasons.
3.1.3. Accounting for Scope 3
According to the data in Table 4, in 2021, the water consumption of the Xincheng Campus of Zhejiang Ocean University was 5.60 × 10⁸ kg. Based on the emission coefficient method, the carbon emissions were calculated as 5.20 × 10⁵ kg (Table 9). Table 10 shows the carbon emissions per capita generated by students per year; Table 11 shows the Carbon emissions per capita generated by faculty and staff per year. Figure 1 shows the carbon emissions per capita per year for campus individuals.
Table 9.
Accounting for carbon emissions from water consumption at Zhejiang Ocean University in 2021.
Table 10.
Carbon emissions per capita generated by students per year.
Table 11.
Carbon emissions per capita generated by faculty and staff per year.
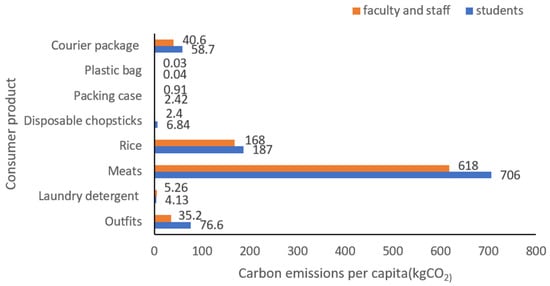
Figure 1.
Carbon emissions per capita per year for campus individuals.
Analyzing the carbon emission accounting table of students and faculty and staff, it can be found that among clothing, food, and use, carbon emissions due to daily diet account for a larger proportion, and diet dominates in carbon emissions due to personal behavior. This is primarily due to the substantial greenhouse gas emissions generated in food production (especially during livestock farming), the consumption of energy and production of waste in food processing and packaging, the significant energy expenditure associated with long-distance transportation and distribution of food, the additional emissions produced by the decomposition of one-third of the world’s food waste, the increased carbon footprint from transportation and storage due to the diversification of food choices as a result of globalization, the rise in energy consumption by the catering service industry, and the increase in dining out and food delivery services. To reduce carbon emissions related to diet, individuals can contribute by reducing their consumption of meat and dairy products, avoiding food waste, choosing local and seasonal foods, supporting sustainable agriculture, and minimizing dining out [26,27,28,29,30,31,32].
Comparing the per capita carbon emission data of faculty members and university students, there is little difference in the use of laundry detergent and diet. However, there are significant differences in the number of clothes purchased, the use of disposable tableware, and the consumption of courier packaging. The average carbon emissions of college students in these areas are higher than those of faculty and staff. In today’s highly developed commodity economy, college students’ consumption is dramatically diversified, and they are more interested in the pursuit of quality of life, which is somehow separated from the mere necessity of living. The booming development of various Internet platforms in recent years has had a great stimulating effect on the increase in both the online and offline consumption of college students, and the expansion of college students’ consumption will be accompanied by new carbon emission characteristics as the carbon emission landscape of this group changes.
In terms of dining, with the growing food delivery industry, takeaway food has rapidly taken over the market with its rich choices and convenience, and an increasing number of people are choosing to order takeaway, which has led to the consumption of large quantities of disposable chopsticks and disposable packing boxes. Unlike the lifestyles of college students in the past, in recent years, many college students do not limit themselves to eating in centralized cafeterias but choose more convenient ways of eating, such as takeout or packaged cafeteria food, which leads to high carbon emissions per capita from disposable chopsticks and disposable packing boxes among college students.
Online shopping with express delivery has become an important way to satisfy college students’ daily shopping needs. Online shopping can better adapt to the diverse needs of college students, including a strong desire for consumption, sensitivity to trends, limited economic level, and other shopping characteristics. However, compared with general offline shopping, the growth of the e-commerce industry is bound to produce carbon emissions in express packaging [19].
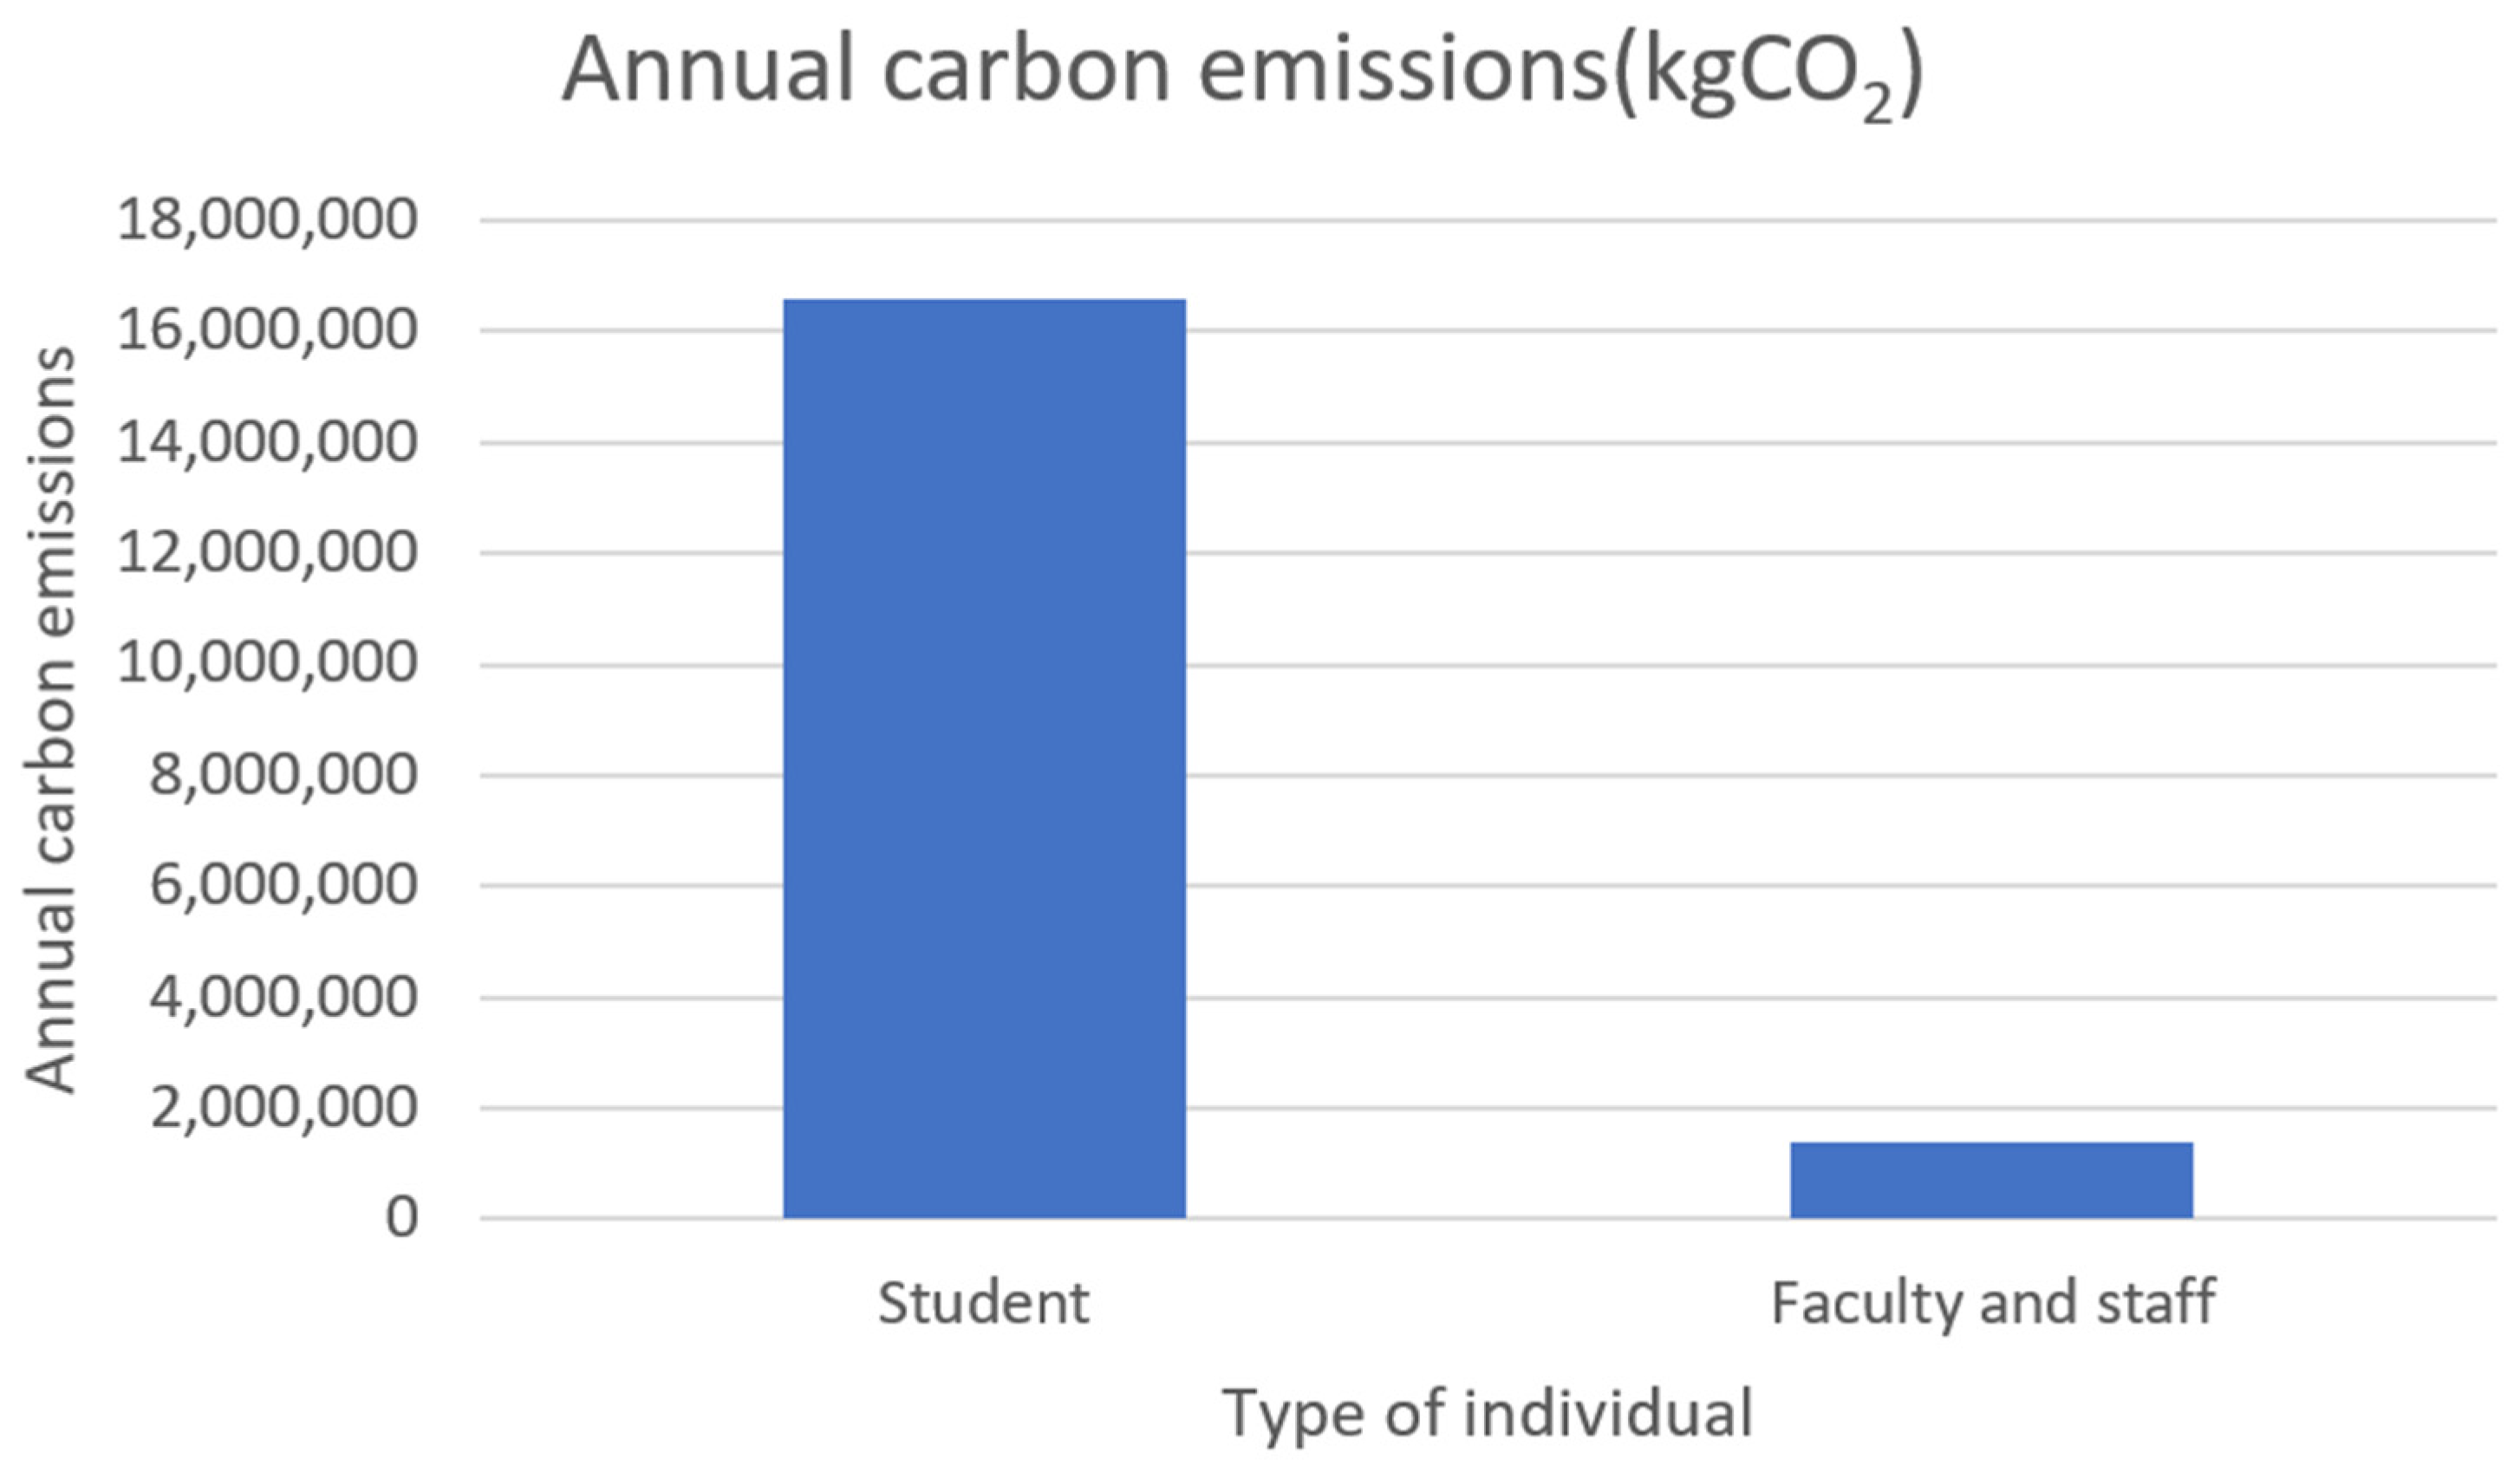
The questionnaire survey revealed the carbon emissions from personal energy use behavior in the university are 1.80 × 10⁷ kg (Table 12). By adding the carbon emissions from individual behavior to t carbon emissions from water consumption, the carbon emissions of scope 3 is calculated to be 1.85 × 10⁷ kg. Figure 2 shows the total annual carbon emissions from individual behavior in Zhejiang Ocean University.
Table 12.
Total annual carbon emissions from individual behavior in higher education.
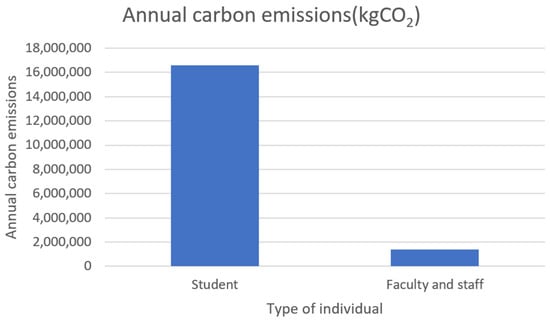
Figure 2.
Total annual carbon emissions from individual behavior in Zhejiang Ocean University.
Because it is not a mandatory requirement to account for Scope 3 carbon emissions in the context of international climate policymaking and at the enterprise level, data collection barriers constitute an important obstacle to consistently accounting for these emissions, which are often overlooked, even though they usually constitute the majority of carbon emissions.
3.1.4. Analysis of the Carbon Emission Structure
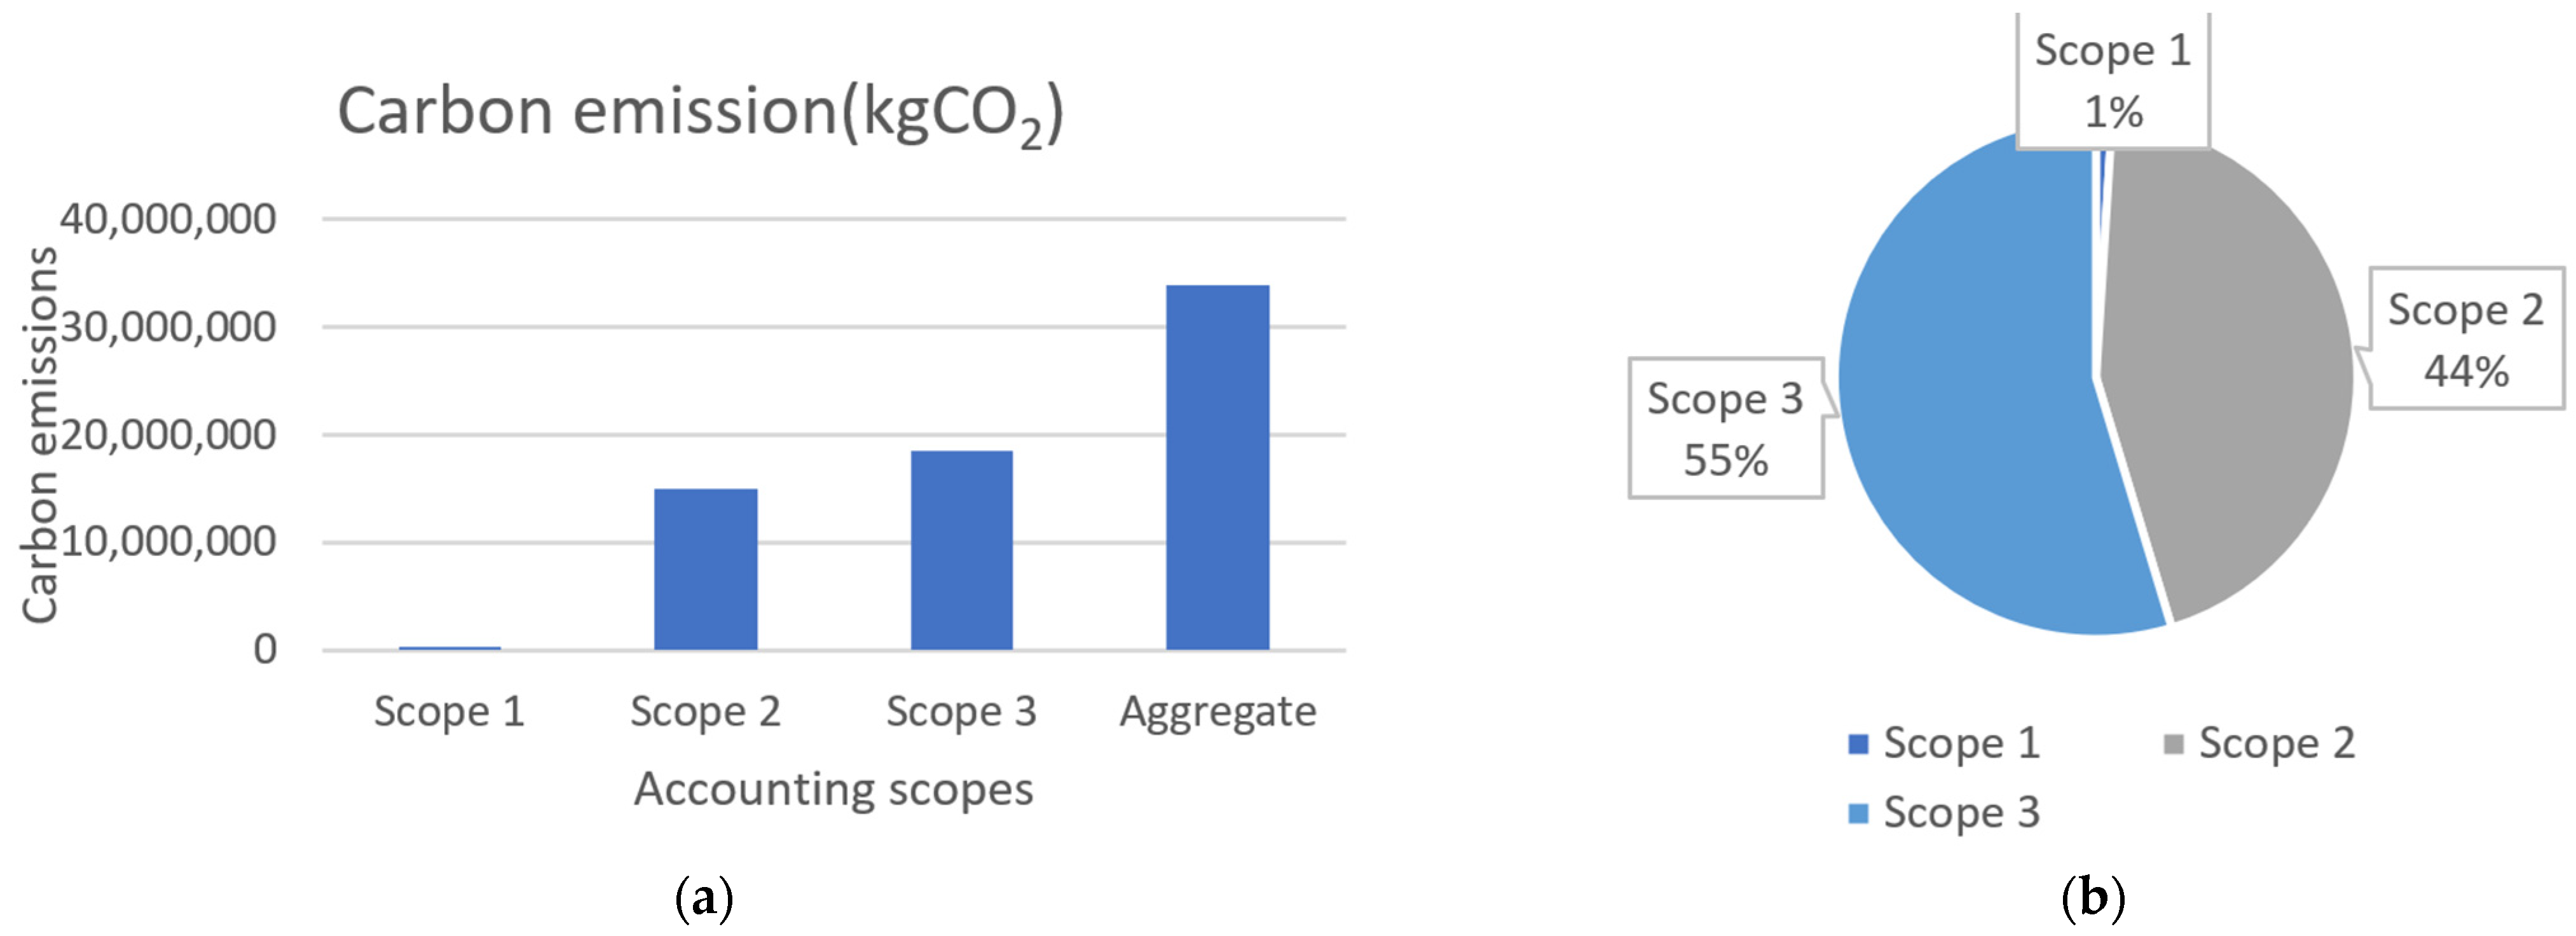
Integrating the above accounting results, the total carbon emissions of Zhejiang Ocean University in 2021 was 3.39 × 10⁷ kg (Table 13), and the carbon emissions of Scope 3 accounted for the highest proportion at 54.68%, which shows that individual carbon emissions are very important and should not be ignored when accounting for regional carbon emissions. The carbon emissions of Scope 2 also accounted for a large proportion at 44.33%, which shows that campus electricity consumption is an important factor affecting the carbon emissions of universities and colleges. The carbon emissions of Scope 1 were small compared with Scope 2 and Scope 3, accounting for only 0.99% of the total carbon emissions, indicating that the direct carbon emissions from fossil energy combustion and natural gas use are no longer the dominant factor affecting regional carbon emissions (Figure 3). The relatively small share of carbon emissions from campus operations and the large share of carbon emissions from individuals suggest that people’s low-carbon lifestyles and consumption patterns are key to changing the carbon footprint. Therefore, we need to highlight the implementation of people-related low-carbon strategies to radically reduce carbon emissions and achieve sustainable development. Only by strengthening awareness and education, guiding teachers and students to widely adopt low-carbon and environmentally friendly lifestyles, and by taking strong actions can we truly reduce our carbon footprint and establish a low-carbon and green learning environment.
Table 13.
Proportion of carbon emissions for different scopes at Zhejiang Ocean University.
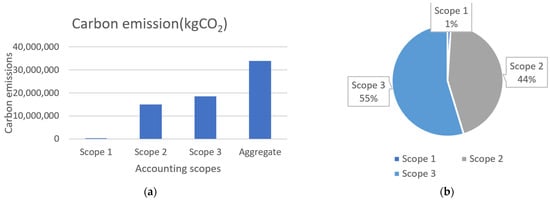
Figure 3.
Carbon emission proportions of different scopes at Zhejiang Ocean University. (a) carbon emissions for different scopes at Zhejiang Ocean University; (b) Proportion of carbon emissions for different scopes at Zhejiang Ocean University.
3.2. On the Development and Analysis of Knowledge and Attitudes Toward Building a Low-Carbon Campus
By analyzing the results of the questionnaire related to the understanding of carbon emissions, it is clear that individuals in colleges and universities only have a partial understanding of carbon emissions. Among the 246 students and staff who participated in the questionnaire survey, 15.85% said they did not know about carbon emissions, and 36.59% said they had a relatively good understanding of them. Moreover, 74.39% believed that it was necessary to assess carbon emissions in colleges and universities. Most individuals pay some attention to carbon emissions, and 70.73% said that they pay attention to energy saving and emission reduction in their daily lives. However, based on the actual research and accounting, it was found that individual carbon emissions remain high, and the use of a large number of disposable chopsticks and packing boxes did not correspond to the conclusion that “most people said that they pay attention to energy saving and emission reduction in their daily lives”.
When answering the question about the factors affecting a low-carbon lifestyle, many people said that there is still a lack of awareness about low-carbon behaviors and that these may cause inconvenience on some occasions. The analysis shows that most people on college campuses are aware of low-carbon behaviors but do not have a strong desire to practice low-carbon living, so they usually choose more convenient lifestyles. Improving individual low-carbon behavior awareness is an indispensable part of building a low-carbon campus, and therefore, the construction of such a campus has a long way to go.
4. Conclusions
4.1. Conclusions of This Study
Accounting for organizational carbon emissions is an initial trend that will contribute to the dissemination of low-carbon ideas and the adoption of measures that are consistent with national environmental commitments. The role of universities in spearheading environmental action in their region is crucial. This study analyzed the carbon emission data of the Xincheng Campus of Zhejiang Ocean University, and the analysis provides a relatively clear understanding of the composition of Zhejiang Ocean University’s carbon emissions.
In 2021, the carbon emissions of Zhejiang Ocean University were 3.39 × 10⁷ kg, of which the direct carbon emissions (Scope 1) were 3.34 × 10⁵ kg, accounting for 0.99% of the total carbon emissions; the indirect carbon emissions (Scope 2) were 1.50 × 10⁷ kg, accounting for 44.33% of the total carbon emissions; and the other indirect carbon emissions (Scope 3) were 1.85 × 10⁷ kg, accounting for 54.68% of the total carbon emissions. Scope 3 carbon emissions contributed the most to total emissions, which shows that other indirect carbon emissions are large and should be emphasized. Campus carbon emissions are closely related to the daily behavior and habits of teachers and students at school and their awareness of energy saving. The energy consumption, mobility, and eating habits of the school and its students and teachers all have an impact on carbon emissions. While Scope 3 represents the highest emissions, any environmentally friendly actions aimed at reducing Scope 1 and 2 emissions will help improve the institution’s environmental performance.
The combination of individual life trajectories and forms of campus operations comprises the entire distribution structure of carbon emissions, which, in turn, affects the region’s carbon emission data. At the individual behavioral level, there are a variety of inherent factors, such as behaviors that are not in line with the low-carbon concept, consumption habits, and wastefulness of vacant resources, which will have a direct impact on the carbon emission data. At the level of campus operations, the main manifestation is the use of water, electricity, and natural gas, with the highest consumption and low utilization of electricity as the core factor. Therefore, optimizing campus operations, improving energy use efficiency, and actively guiding teachers and students in developing energy-saving, low-carbon, and environmentally friendly habits and behaviors are of great significance in reducing carbon emissions and achieving environmentally sustainable development.
4.2. Suggestions for Improvement
Regions with low total and per capita carbon emissions share a common feature: they have taken strong measures to address climate-related problems. This proactive approach is also necessary at the micro-level of a university campus. By calculating and analyzing the carbon emissions at Zhejiang Ocean University, it becomes clear that a significant amount of carbon dioxide, potentially hundreds or thousands of tons, may be emitted annually, causing substantial environmental harm. Therefore, based on the data analysis and considering the university’s characteristics, we propose energy-saving and emission-reducing measures to align with national goals of carbon neutrality and carbon peaking.
To effectively reduce carbon emissions from individual behaviors on university campuses, a range of policies and management strategies can be implemented. For instance, promoting green transportation by optimizing campus bus systems and providing shared bicycle services can reduce the use of private cars. Campus buildings should adopt energy-efficient designs and utilize smart energy management systems to improve energy efficiency while increasing green spaces on campus to enhance carbon sequestration. University cafeterias can reduce food waste and offer more local and organic food options, and educational and awareness campaigns can enhance the environmental consciousness of students and staff. The promotion of paperless offices and teaching practices is also an effective way to reduce carbon emissions.
Looking at long-term trends, it is anticipated that universities will increasingly adopt clean energy sources, such as solar and wind power, to decrease reliance on fossil fuels. Technological advancements, particularly in energy conservation and clean technologies, will further drive improvements in energy efficiency. Government policies on carbon emission restrictions and incentives, such as carbon pricing, regulatory standards, and investments in research and development, will further encourage universities to take more aggressive measures to reduce emissions.
The implementation of these strategies and policies will help universities reduce carbon emissions from individual behaviors, contribute to the achievement of long-term carbon neutrality goals, and create a more sustainable and environmentally friendly living environment on campus. Clarifying the overall strategic orientation of the construction and operation of university campuses can effectively enhance the low-carbon level of universities from top to bottom. At the macro level, this includes intelligent regulation of campus resources or energy use, refurbishment and improvement of energy-consuming buildings, and appeals to individuals to reduce the waste of daily necessities. At the micro level, it involves strengthening the utilization of electricity and energy, reducing the number of energy-consuming transportation lines, and changing the mode of transportation. Additionally, improving the efficiency of energy utilization and lowering the level of energy consumption can also effectively reduce carbon emissions from the campus.
As mentioned, electricity is a major issue in terms of carbon emissions from buildings. At Zhejiang Ocean University, measures such as reminding students to turn off lights and fans and training on electricity conservation can significantly reduce electricity consumption. Other helpful approaches include strengthening the construction of canteens and other living facilities, promoting energy-saving practices, using high-efficiency cooking systems, and employing new technologies to recycle heat for water heating.
Given the large population density and centralized teaching and living areas on campuses, which consume a lot of energy, increasing the proportion of solar energy facilities and fully developing renewable energy sources can replace non-renewable energy and meet the needs of the campus community. Strengthening the publicity about personal behavior in relation to carbon emissions is crucial, and raising personal awareness of emission reduction is necessary. Reducing the use of disposable supplies and adopting low-carbon traveling habits in daily life can contribute to energy saving and emission reduction. Low-carbon campus construction relies on individual efforts, and a low-carbon lifestyle should not remain just a verbal aspiration. Conducting online and offline surveys to assess students’ understanding of dual-carbon and low-carbon emissions and providing them with a deeper understanding through various forms of publicity can expand their low-carbon awareness.
Although campuses may have high carbon emissions, collective action can lead to significant mitigation measures. It is necessary to call on the entire campus community to take practical action to control carbon emissions for green energy saving and emission reduction, responding to the national call for ecological environment protection and directing efforts toward the global environment and future human development. Backward emission reduction measures and low carbon absorption are common problems on Chinese campuses. In the future, administrators should consider the impact of climate, population, and lifestyle factors and develop low-carbon campuses in terms of management and construction, energy efficiency improvement, campus greening, and strengthening of carbon emission awareness.
To effectively reduce individual behavioral carbon emissions on campus, future research can explore improving carbon emission calculation methods and applying smart technologies to enhance campus carbon emission monitoring. Researchers can develop more refined carbon emission calculation models, utilize machine learning algorithms to enhance predictive accuracy, and employ big data analysis to identify key sources and trends of carbon emissions. Internet of Things (IoT) technology can be used to deploy various sensors and smart devices to monitor campus energy consumption and carbon emissions in real time. The establishment of a digital twin framework can create a virtual replica of the campus to optimize energy usage through simulation and analysis, and the development of an intelligent carbon monitoring platform can centrally track and manage campus carbon emissions. Advancing interdisciplinary research that combines knowledge from environmental science, data science, architecture, and other fields will contribute to the development of comprehensive carbon emission solutions. Strengthening cooperation with technology companies to leverage the latest smart technologies to improve monitoring efficiency and accuracy is also an important direction for future research. By employing these methods, future studies can provide universities with more effective tools and strategies to achieve carbon emission reduction and sustainable campus development [33,34,35,36,37,38].
Author Contributions
Conceptualization, X.L.; Methodology, X.L.; Validation, H.C. and S.Z.; Resources, X.L.; Data curation, X.L.; Writing—original draft, X.L.; Writing—review &editing, H.C. and S.Z.; Visualization, X.L.; Supervision, H.C.; Project administration, S.Z.; Funding acquisition, S.Z. All authors have read and agreed to the published version of the manuscript.
Funding
This research was funded by the National Key R&D Program of China (No. 2019YFD0901204); and the Fundamental Research Funds for Zhejiang Provincial Universities and Research Institutes (No. 2021JD006); Higher Education Curriculum Reform Program of Zhejiang Education Bureau (No. 440; No. 122).
Institutional Review Board Statement
The study was approved by the Institutional Review Board (or Ethics Committee) of College of Marine Science and Technology, Zhejiang Ocean University (protocol code ZJOUMSATC20240908 and 8 September 2024 of approval).
Informed Consent Statement
Not applicable.
Data Availability Statement
The data that support the findings of this study are available from the corresponding author upon reasonable request.
Conflicts of Interest
The authors declare no conflicts of interest.
Appendix A
Table A1.
Personal behavior carbon emissions questionnaire of Zhejiang Ocean University.
Table A1.
Personal behavior carbon emissions questionnaire of Zhejiang Ocean University.
| 1. Name: | |
| 2. Gender: | □Male □Female |
| 3. Identity: | □Student □Faculty or staff □Others |
| 4. Average number of clothes purchased per quarter (three months)? | □0–2 □3–5 □6–8 □8–10 □more than 10 |
| 5. On average, how many grams of laundry detergent or liquid laundry detergent are used per week? | □20 □50 □100 □150 □200 □250 □300 |
| 6. Average daily meat intake in grams? | □50 □100 □150 □200 □300 □more than300 |
| 7. How many grams of food do you consume per day on average? | □50 □100 □150 □200 □300 □more than 300 |
| 8. How many disposable chopsticks do you use per week on average? | □0–3 □4–7 □8–14 □more than 14 |
| 9. How many disposable packing boxes do you use per week on average? | □0–4 □5–7 □8–10 □11–14 □more than 14 |
| 10. How many plastic bags do you use per week on average? | □0–5 □6–10 □10–15 □more than 15 |
| 11. What is your average weekly number of express delivery? | □0–2 □3–5 □6–8 □9–12 □more than 12 |
| 12. What is your usual mode of transportation? | □Bicycle □Private car □Bus □Taxi □Walking □Shared bicycle □Electric bicycle |
| 13. How many hours per week do you use the above transportation? | □0 □1 □2 □3 □4 □5 □6 |
| 14. Do you know about carbon emissions? | □ Don’t know □ General □ Know □ Very concerned |
| 15. Do you think it is necessary to assess the carbon emissions of universities? | □Necessary □General □Not necessary □Indifferent |
| 16. Do you pay attention to energy saving and emission reduction in your daily life? | □Yes □No |
| 17. What do you think is the main source of your daily carbon emissions? | □Clothing □Food □Living □Working □Use |
| 18. What factors affect energy saving and emission reduction in your daily life? | □ Lack of low carbon awareness □ Inconvenience caused by low carbon life □ Influence of surrounding environment □ Lack of corresponding management measures in school □ Others |
| 19. What do you think are the obstacles to building a low-carbon campus? | |
| 20. Your opinion on energy saving and emission reduction on campus? |
References
- Li, X.; Tan, H.; Rackes, A. Carbon Footprint Analysis of Student Behavior for a Sustainable University Campus in China. J. Clean. Prod. 2015, 106, 97–108. [Google Scholar] [CrossRef]
- Cano, N.; Berrio, L.; Carvajal, E.; Arango, S. Assessing the Carbon Footprint of a Colombian University Campus Using the UNE-ISO 14064–1 and WRI/WBCSD GHG Protocol Corporate Standard. Environ. Sci. Pollut. Res. 2023, 30, 3980–3996. [Google Scholar] [CrossRef] [PubMed]
- Valls-Val, K.; Bovea, M.D. Carbon Footprint in Higher Education Institutions: A Literature Review and Prospects for Future Research. Clean Technol. Environ. Policy 2021, 23, 2523–2542. [Google Scholar] [CrossRef]
- Wang, L.; Yan, X.; Fang, M.; Song, H.; Hu, J. A Systematic Design Framework for Zero Carbon Campuses: Investigating the Shanghai Jiao Tong University Fahua Campus Case. Sustainability 2023, 15, 7975. [Google Scholar] [CrossRef]
- Deng, Y. Research on Low-Carbon Campus Planning Strategy Based on the Analysis of Students’ Energy Use Behavior: A Case Study of Southwest University of Science and Technology. Master’s Thesis, Southwest University of Science and Technology, Mianyang, China, 2021. [Google Scholar]
- Mancini, M.S.; Galli, A.; Niccolucci, V.; Lin, D.; Bastianoni, S.; Wackernagel, M.; Marchettini, N. Ecological Footprint: Refining the Carbon Footprint Calculation. Ecol. Indic. 2016, 61, 390–403. [Google Scholar] [CrossRef]
- Wackernagel, M.; Rees’s, W. Our Ecological Footprint; New Society Publishers: Jackson, TN, USA, 1996; pp. 54–55. [Google Scholar]
- Guo, R.; Tian, Y. Low-carbon Oriented Methodology of Energy-related Carbon Accounting and Its Application in Camp. J. TongJi Univ. 2015, 43, 1361–1366. [Google Scholar]
- Geng, S. Preliminary Study on Low-carbon Campus Planning—Taking Shenyang Jianzhu University as an Example. Ecol. Environ. 2015, 35, 43–47. [Google Scholar]
- Wiedmann, T.; Minx, J. A Definition of ‘Carbon Footprint’. Ecol. Econ. Res. Trends 2008, 1, 1–11. [Google Scholar]
- Hertwich, E.G.; Peters, G.P. Carbon Footprint of Nations: A Global, Trade-Linked Analysis. Environ. Sci. Technol. 2009, 43, 6414–6420. [Google Scholar] [CrossRef]
- Peters, G.P. Carbon Footprints and Embodied Carbon at Multiple Scales. Curr. Opin. Environ. Sustain. 2010, 2, 245–250. [Google Scholar] [CrossRef]
- Kirchain, R., Jr.; Gregory, J.; Olivetti, E. Environmental life-cycle assessment. Nat. Mater. 2017, 16, 693–697. [Google Scholar] [CrossRef] [PubMed]
- Dong, H.; Geng, Y. Study on Carbon Footprint of the Household Consumption in Beijing Based on Input-Output Analysis. Resour. Sci. 2012, 34, 494–501. [Google Scholar]
- Cao, S.; Xie, G. Tracking Analysis of Carbon Footprint Flow of China’s Industrial Sectors. Resour. Sci. 2010, 32, 2046–2052. [Google Scholar]
- Cong, J.; Zhu, J.; Chen, N.; Liu, X. Comparison and case analysis of carbon emission accounting methods for urban energy consumption in China—Based on the perspective of ‘emission factor’ and ‘activity level data’ selection. Urban Problems. 2014, 3, 5–11. [Google Scholar] [CrossRef]
- Du, Y. CO2 emission of Zhejiang and Guizhou province by the method of emission factor (IPCC) from 2005 to 2012. Environ. Prot. Technol. 2024, 21, 5. [Google Scholar] [CrossRef]
- Zhu, S.; Cai, B.; Zhu, J.; Gao, Q. The main content and insights of 2019 refinements to IPCC 2006 Guidelines. Clim. Chang. Res. 2018, 14, 86–94. [Google Scholar]
- Luo, T.; Yue, Q.; Yan, M.; Cheng, K.; Pan, G. Carbon Footprint of China’s Livestock System—A Case Study of Farm Survey in Sichuan Province, China. J. Clean. Prod. 2015, 102, 136–143. [Google Scholar] [CrossRef]
- Ju, Y.; Chen, Y. Calculation of carbon emissions in building operation stage—Research on emission coefficient method based on carbon emission factor. Sichuan Build. Sci. 2015, 41, 175–179. [Google Scholar]
- He, D.; Li, C.; Qin, F.; Zheng, W. Campus carbon accounting based on emission coefficient method. J. Xi’an Polytenchnic Univ. 2022, 36, 78–83. [Google Scholar] [CrossRef]
- Cheng, M.; Gao, Y.; Zhang, S.; Zeng, D. Study on behaviors of campus-oriented carbon footprints. Environ. Eng. 2013, 31, 681–684. [Google Scholar] [CrossRef]
- Zhu, Q.; Li, F.; Qian, Z. A survey of canteen food waste and its carbon footprint in universities national wide. J. Arid. Land Resour. Environ. 2020, 34, 49–55. [Google Scholar] [CrossRef]
- Lou, J. A Study on the Carbon Footprint Assessment of Students’ Campus Behavior in Undergraduate Universities in Qinghai Province under the Perspective of Ecological Civilization. Master’s Thesis, QingHai Normal University, Xining, China, 2022. [Google Scholar]
- Zhao, J. Studies on the Energy-saving Evaluation System of Campus Building from the Perspective of Carbon Footprint. Master’s Thesis, Beijing Jiaotong University, Beijing, China, 2019. [Google Scholar]
- Wu, X.; Liu, Y.; Ren, Y. Research on carbon footprint index system computation and emission reduction strategies in universities: Taking Northwest University as an example. Environ. Sci. Technol. 2019, 42, 187–193. [Google Scholar] [CrossRef]
- Zhao, R.; Yang, W.; Ma, L.; Zhang, Z.; Wang, L. Analysis of Carbon Footprint Accounting and Carbon Emissions Reduction Potential in North China University of Water Resources and Electric Power. J. North China Inst. Water Conserv. Hydroelectr. Power 2013, 34, 112–116. [Google Scholar] [CrossRef]
- Cui, P.; Zhou, S. Research on carbon emission accounting and carbon neutral path in Chinese universities-literature analysis based on 2008–2021 database. China Univ. Sci. Technol. 2022, 10, 33–39. [Google Scholar] [CrossRef]
- Shuqin, C.; Minyan, L.; Hongwei, T.; Xiaoyu, L.; Jian, G. Assessing Sustainability on Chinese University Campuses: Development of a Campus Sustainability Evaluation System and Its Application with a Case Study. J. Build. Eng. 2019, 24, 100747. [Google Scholar] [CrossRef]
- Valls-Val, K.; Bovea, M.D. Carbon Footprint Assessment Tool for Universities: CO2UNV. Sustain. Prod. Consum. 2022, 29, 791–804. [Google Scholar] [CrossRef]
- Estoque, R.C. Complexity and Diversity of Nexuses: A Review of the Nexus Approach in the Sustainability Context. Sci. Total Environ. 2023, 854, 158612. [Google Scholar] [CrossRef]
- Rao, Z.; Chen, S.; Lun, I.; Shen, L.; Yu, A.; Fu, H. Energy Flexibility Characteristics of Centralized Hot Water System in University Dormitories. Build. Simul. 2023, 16, 641–662. [Google Scholar] [CrossRef]
- Amaral, A.R.; Rodrigues, E.; Gaspar, A.R.; Gomes, Á. How Organizational Constraints Undermine Sustainability Actions in a University’s Campuses: A Case Study. J. Clean. Prod. 2023, 411, 137270. [Google Scholar] [CrossRef]
- Amaral, A.R.; Rodrigues, E.; Gaspar, A.R.; Gomes, Á. Lessons from Unsuccessful Energy and Buildings Sustainability Actions in University Campus Operations. J. Clean. Prod. 2021, 297, 126665. [Google Scholar] [CrossRef]
- Kourgiozou, V.; Commin, A.; Dowson, M.; Rovas, D.; Mumovic, D. Scalable Pathways to Net Zero Carbon in the UK Higher Education Sector: A Systematic Review of Smart Energy Systems in University Campuses. Renew. Sustain. Energy Rev. 2021, 147, 111234. [Google Scholar] [CrossRef]
- Idundun, E.; Hursthouse, A.S.; McLellan, I. Carbon Management in UK Higher Education Institutions: An Overview. Sustainability 2021, 13, 10896. [Google Scholar] [CrossRef]
- Bueno, G.; De Blas, M.; Pérez-Iribarren, E.; Zuazo, I.; Torre-Pascual, E.; Erauskin, A.; Etxano, I.; Tamayo, U.; García, M.; Akizu-Gardoki, O.; et al. The Environmental and Social Footprint of the University of the Basque Country UPV/EHU. J. Clean. Prod. 2021, 315, 128019. [Google Scholar] [CrossRef]
- Li, R.; Zhao, R.; Xie, Z.; Xiao, L.; Chuai, X.; Feng, M.; Zhang, H.; Luo, H. Water–Energy–Carbon Nexus at Campus Scale: Case of North China University of Water Resources and Electric Power. Energy Policy 2022, 166, 113001. [Google Scholar] [CrossRef]

Disclaimer/Publisher’s Note: The statements, opinions and data contained in all publications are solely those of the individual author(s) and contributor(s) and not of MDPI and/or the editor(s). MDPI and/or the editor(s) disclaim responsibility for any injury to people or property resulting from any ideas, methods, instructions or products referred to in the content. |
© 2024 by the authors. Licensee MDPI, Basel, Switzerland. This article is an open access article distributed under the terms and conditions of the Creative Commons Attribution (CC BY) license (https://creativecommons.org/licenses/by/4.0/).