4.1. Model Fit Tests for and Analysis of National Identity Perception Types
The results of the latent class analysis conducted on the 2012 survey data are presented in
Table 4.
In
Table 4, from Class 2 to Class 8, as noted by the asterisks, some classes include population shares below 5%. The entropy values, which range from 0.76 to 0.79, indicate a reasonable level of classification accuracy, with Class 8 showing the highest entropy value, suggesting better classification clarity. The AIC decreases as we move from Class 2 to Class 8, suggesting that adding more classes might improve the model fit. However, practical considerations such as the interpretability and manageability of the model, along with the inclusion of smaller classes (indicated by * for classes under 5%), also need to be considered. Like the AIC, the BIC decreases consistently from Class 2 through Class 4, indicating an improving model fit with the addition of each class. However, beyond Class 4, the BIC values begin to increase, suggesting that adding further classes may not enhance the model’s explanatory power but rather introduces unnecessary complexity. After a comprehensive evaluation of these indices, it is concluded that the optimal number of groups for the 2012 data, considering model fit and class size, appears to be three. Class 3 was selected based on a comprehensive evaluation of indices, including model fit. To elucidate the characteristics of this class, an analysis of the estimated class conditional probabilities was performed. The results, alongside the classes’ population shares for each class, are depicted in
Figure 1.
As shown in
Figure 1, Class 1 places an overwhelming emphasis on familial ties as the core of Korean identity, marked by high probabilities of 0.96 for having a Korean father and 0.90 for having a Korean mother in the Ethnic category. Such high values indicate that genealogy is paramount in defining belonging within this class. Additionally, this class values feeling Korean highly, integrating emotional identification with ancestry. Compared to other classes, this one is characterized by its strong reliance on direct lineage to define identity, contrasted by significantly lower values in civic-related aspects like having Korean citizenship and contributing to Korea’s societal development. In consideration of these characteristics, Class 1 has been named the “Ethnic Identity” type, with 19% of the population identifying with this perspective.
Class 2 scores exceptionally high across nearly all aspects of cultural engagement and civic responsibilities, with perfect scores (1.00) in feeling Korean and respecting Korean political institutions and laws, highlighting a holistic integration of ethnic and civic dimensions of identity. Furthermore, Class 2 stands out for its all-encompassing approach, not only focusing on ethnic roots but also heavily emphasizing the importance of civic duties and cultural practices, which is markedly different from the Class 1, which focuses predominantly on lineage. Taking into account these traits, Class 2 is designated as the “Ethnocultural Civic Identity” type, representing 69% of the population that aligns with this viewpoint. Prioritizing civic aspects of identity, Class 3 is characterized by high probabilities in respecting Korean political institutions and laws (0.80), feeling Korean (0.81), and having Korean citizenship (0.79), underscoring a definition of identity based on civic participation and legal recognition rather than ethnic origins. Unlike the other two classes, this places minimal emphasis on ethnic roots, as indicated by very low probabilities for having a Korean father (0.01) and a Korean mother (0.06). This class views civic duties and legal status as more central to Korean identity. Considering these characteristics, Class 3 has been classified as the “Civic Identity” type, encompassing 12% of the population that subscribes to this perspective.
The latent class analysis, based on the data collected from the 2015 survey, was conducted to identify distinct subgroups within the population. The detailed results of this analysis, including class membership probabilities and relevant statistical indicators, are presented in
Table 5.
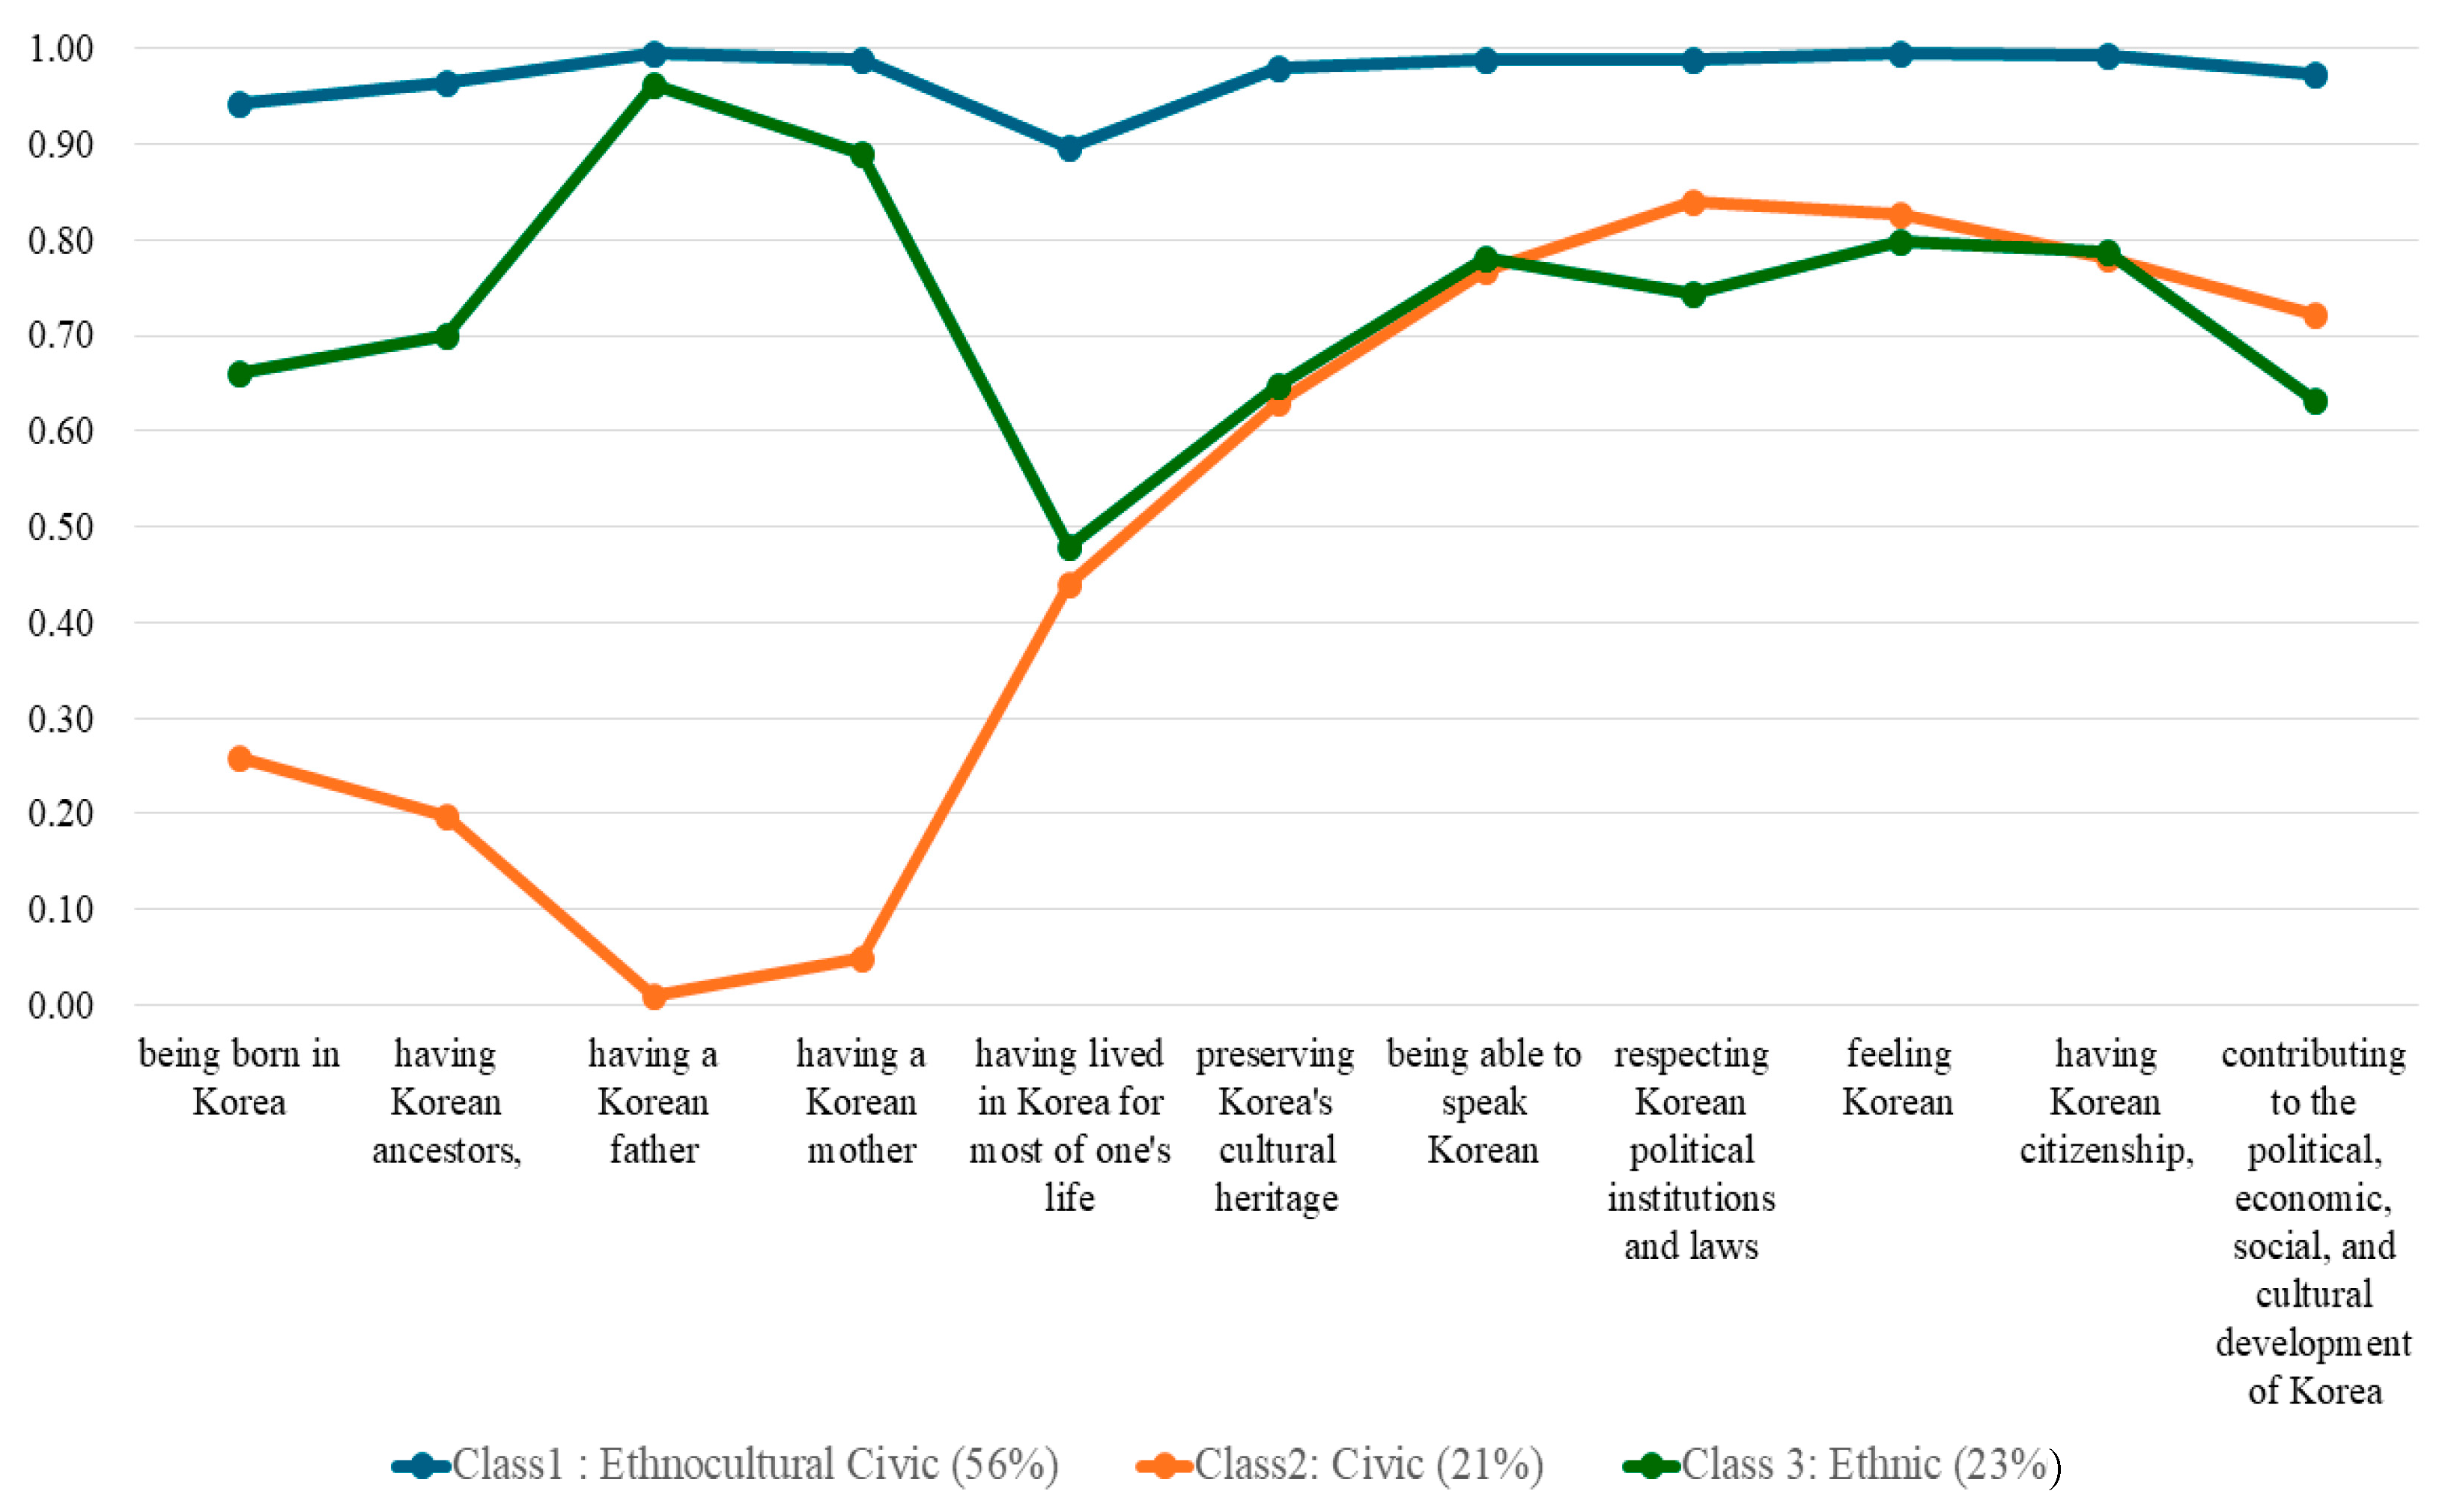
Considering the AIC, BIC, and entropy values, along with the inclusion of classes with population shares below 5%, it is concluded that three classes are optimal for the 2015 data. This configuration strikes a balance between statistical efficiency and practicality, ensuring that the model is both interpretable and statistically justified without risking overfitting. The analysis examined the estimated class conditional probabilities to better understand the defining features of each class. The findings, along with the proportion of the population represented by each class, are illustrated in
Figure 2.
The 2015 latent class analysis of perceptions regarding what constitutes a “true Korean” reveals a structure that closely mirrors the findings from the 2012 study. Once again, three distinct identity classes emerge, reinforcing the continuity of key national identity perceptions among Korean adults. These classes are identified as Ethnocultural Civic, Civic, and Ethnic, reflecting a nuanced blend of ethnic and civic criteria in defining Korean identity. The largest class in 2015, much like in 2012, is the “Ethnocultural Civic Identity” type, which comprises approximately 56% of respondents. The second class, the “Civic Identity” type, comprising 21% of respondents, focuses on more civic-based criteria such as having Korean citizenship and respecting political institutions. Finally, the “Ethnic Identity” type makes up about 23% of the sample, emphasizing ethnic and biological ties, such as being born in Korea and having Korean ancestry. Overall, the 2015 analysis demonstrates a strong continuity with the 2012 findings, with little variation in the proportions or defining characteristics of each identity class.
The latent class analysis performed using the 2018 survey data aimed to identify various subgroups within the population. The comprehensive findings of this analysis, such as the probabilities of class membership and key statistical metrics, are outlined in
Table 6.
Based on the data from
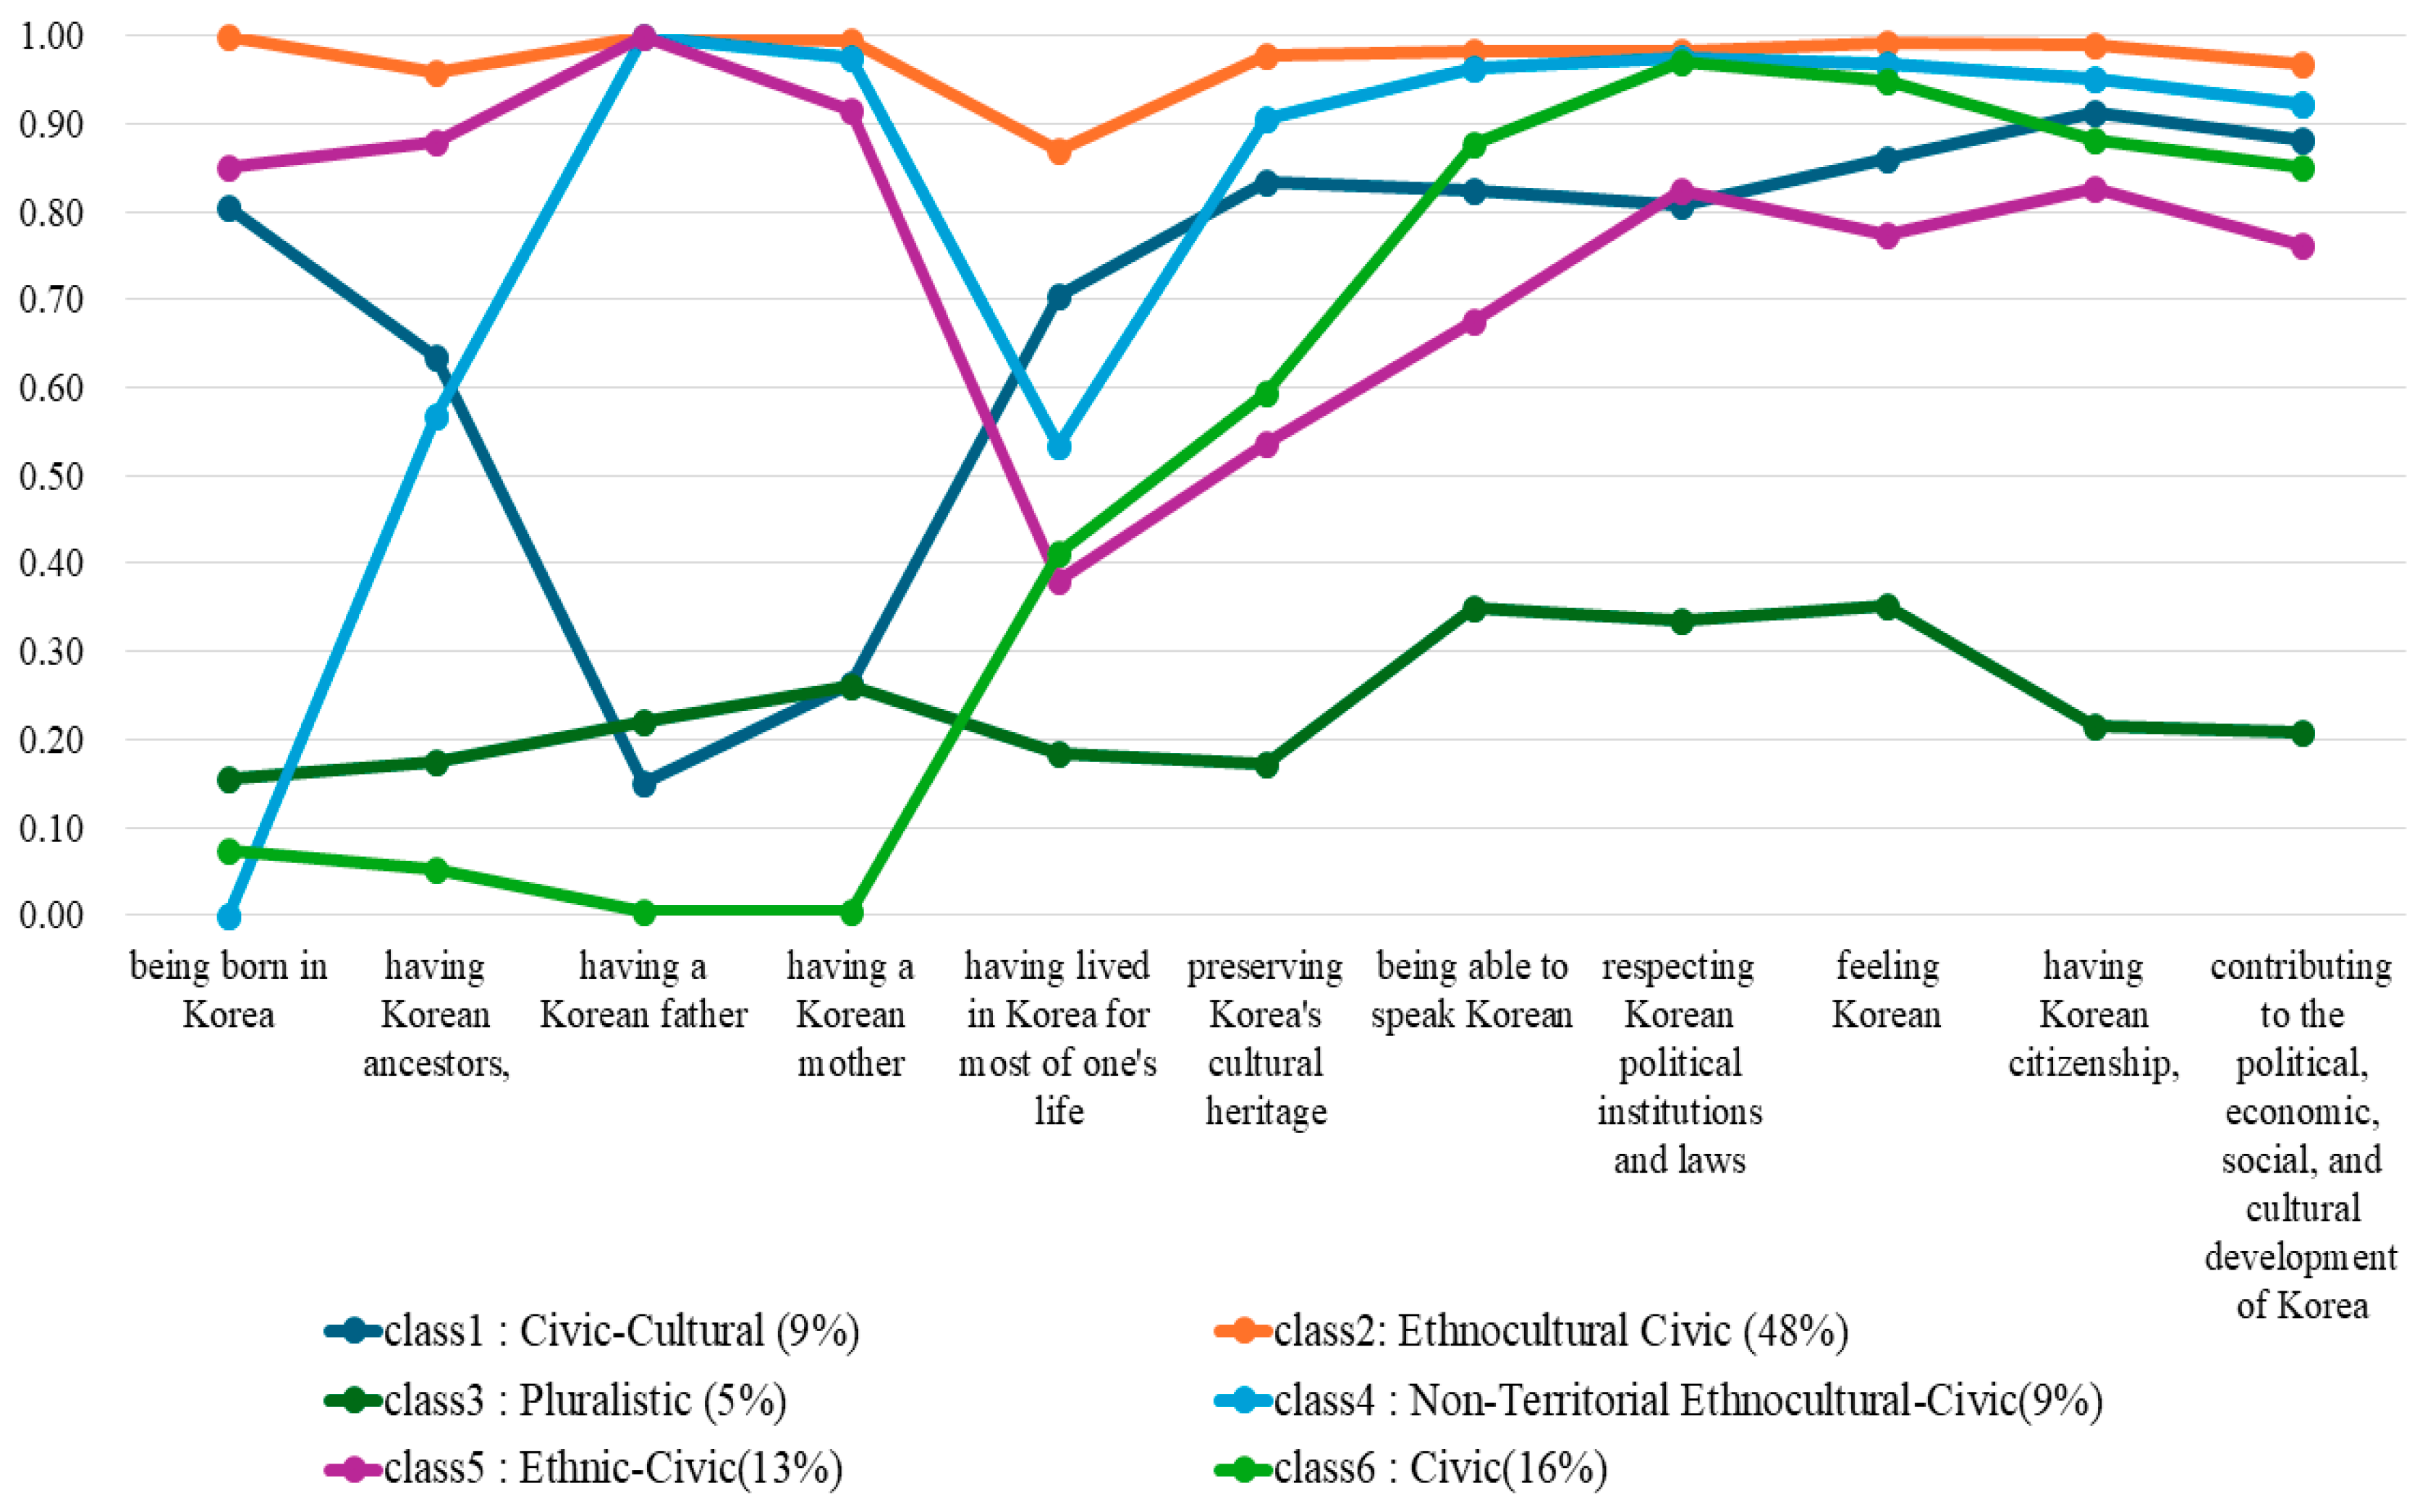
Table 6, which presents the statistical indices and model fit tests for 2018, the optimal number of groups is determined to be six. This decision balances achieving low values of the AIC and BIC—indicative of a good model fit—with maintaining high entropy values, thereby ensuring the model’s interpretability and statistical justification without introducing unnecessary complexity or risk of overfitting. Notably, Classes 7 and 8, marked by asterisks, include classes with population shares below 5%. These smaller classes may not significantly enhance the model’s explanatory power or practical applicability due to their limited size. The analysis explored the estimated class conditional probabilities to gain deeper insight into the key characteristics of each group. The results, together with the population distribution for each class, are shown in
Figure 3.
Class 1 emphasizes preserving Korea’s cultural heritage (0.83), being able to speak Korean (0.83), and especially values having Korean citizenship (0.91). Although they do not strongly prioritize ethnic markers such as having Korean parents, their focus on citizenship and cultural identity makes them more aligned with a national identity rooted in civic responsibility and cultural belonging. This class represents a form of nationality where cultural participation and legal status (citizenship) are central, rather than pure ethnic descent. The term “Civic-Cultural Identity” better captures their emphasis on both civic and cultural elements in defining Korean identity.
Class 2 is similar to the “Ethnocultural Civic Identity” type identified in the 2012 and 2015 analyses. This group emphasizes both ethnic and civic markers, combining a strong sense of cultural heritage with active civic participation as core elements of Korean national identity.
Class 3 exhibits the lowest emphasis on any single factor of identity. They score 0.00 for being born in Korea and have low scores for ethnic markers like having Korean ancestors (0.18). Moreover, they place minimal importance on having Korean citizenship (0.22), showing that neither ethnic nor civic markers are central to their definition of being a “true Korean.” In previous studies [
2,
3,
8,
9], the group that does not prioritize specific criteria for national identity has been labeled as pluralists. In this study, reflecting the concept from previous research [
2,
3,
8,
9], Class 3 has been designated as the “Pluralist Identity Type”. This label reflects the group’s tendency to notprioritize specific criteria for national identity, aligning with the pluralist perspective. This approach fosters a more inclusive view of identity, embracing a variety of criteria without placing greater importance on any single one.
Class 4 strongly values key elements of Korean identity, such as preserving cultural heritage (0.91), respecting political institutions (0.96), and feeling Korean (0.97). They also place considerable emphasis on having Korean parents (father: 1.00, mother: 0.98), making ethnic lineage an important part of their identity. However, unlike other classes such as Class 2, they do not prioritize territorial markers like being born in Korea (0.00) or having lived in Korea for most of their life (0.54). Their identity is shaped by a non-territorial approach, where civic and cultural participation outweigh geographic origins. The label “Non-Territorial Ethnocultural Civic Identity” captures their blend of ethnic and civic identity, while deemphasizing the significance of birthplace and residency.
Class 5 places significant importance on both ethnic and civic markers. They highly value having Korean parents (father: 1.00, mother: 1.00), emphasizing ethnic lineage as a core aspect of identity. At the same time, they prioritize civic responsibilities, such as contributing to Korea’s development (0.76) and preserving cultural heritage (0.82). Unlike groups that heavily favor one dimension over the other, this class strikes a balance between ethnic roots and civic participation. The label “Ethnic-Civic Identity” captures their dual focus on both ethnic descent and active civic engagement.
Class 6 closely aligns with the “Civic Identity” type identified in the 2012 and 2015 analyses. Like its predecessors, this group places a strong emphasis on civic responsibilities and contributions to society, prioritizing factors such as respecting political institutions and contributing to the nation’s development, while placing less importance on ethnic or cultural markers. The population distribution across the classes is as follows: 9% for Class 1, 48% for Class 2, 5% for Class 3, 9% for Class 4, 13% for Class 5, and 16% for Class 6.
The latent class analysis conducted on the 2021 survey data sought to uncover different subgroups within the population. The detailed results of this analysis, including class membership probabilities and important statistical figures, are presented in
Table 7.
Based on the data from
Table 7, which presents statistical indices and model fit tests for the year 2021, both the AIC and BIC exhibit a consistent downward trend from Class 2 through Class 8, indicating an improving model fit with the addition of more classes. However, while entropy values are consistently high from Class 2 through Class 6, demonstrating good classification accuracy, they begin to slightly decline from Class 7 onwards. This decrease, along with the smaller population shares in Classes 7 and 8, suggests that adding more than six classes may not substantially improve the model’s explanatory power or practical applicability. Considering these factors, it is concluded that six classes represent the optimal configuration for the 2021 data. The analysis examined the estimated class conditional probabilities to gain a deeper understanding of the defining characteristics of each group. The findings, along with the population distribution for each class, are presented in
Figure 4.
In the 2021 analysis, as illustrated in
Figure 4, six distinct clusters were derived. Among these, Classes 1 through 5 display characteristics consistent with those identified in the 2018 data, indicating stability and continuity in the civic and ethnocultural dimensions of national identity across the two periods. These groups, previously labeled in the 2018 study, retain their defining features and thus have been named similarly to their counterparts from earlier analyses.
Class 1 (Civic) emphasizes civic identity over ethnic lineage, while Class 2 (Non-Territorial Ethnocultural Civic) blends civic and cultural elements without focusing on territory. Class 3 (Pluralistic) maintains a balance between civic and ethnic-cultural factors, Class 4 (Ethnocultural Civic) highlights cultural heritage and civic identity, and Class 5 (Ethnic) centers on ethnic heritage as the primary marker of identity. However, the emergence of Class 6 in the 2021 analysis represents a notable divergence from the previous years’ patterns (2012, 2015, 2018). The emergence of Class 6 signals an emerging trend that ties national identity more closely to territorial and cultural dimensions.
Class 6, labeled “Territorial-Cultural Identity”, places significant emphasis on being born in Korea (0.95) as a primary marker of identity, alongside having Korean ancestors (0.83) and feeling Korean (0.84). The label “Territorial-Cultural Identity” aptly captures the balance between ancestral heritage and the lived experience of being born in Korea, reflecting an identity that is rooted in both territorial and cultural narratives. While these attributes are often associated with ethnicity, they primarily reflect a sense of cultural continuity rather than a strictly ethnic identity. The emphasis on Korean ancestry symbolizes the transmission of cultural values, traditions, and practices passed down through generations, ensuring the preservation of a shared heritage. Similarly, the notion of “feeling Korean” extends beyond ethnic markers, representing a deep emotional and cultural immersion in the norms, customs, and collective history of Korea. This identity is strongly grounded in the experience of growing up in Korean society and maintaining a lived connection to the nation’s cultural legacy. This conceptualization of identity may also apply to the children of Korean-Chinese, commonly referred to as Joseonjok, or Korean-Russians, known as Koryoin, who are born in Korea. These individuals might blend their ancestral heritage with contemporary cultural engagement, reflecting both their lineage and their immersion in Korean society.
As illustrated in
Figure 4, Class 1 (Civic) represents 15%, Class 2 (Non-Territorial Ethnocultural Civic) 12%, Class 3 (Pluralistic) 5%, Class 4 (Ethnocultural Civic) 48%, Class 5 (Ethnic) 15%, and the newly emerging Class 6 (Territorial-Cultural) accounts for 6% of the population.
4.2. Summary of Analysis Results: Yearly Comparison
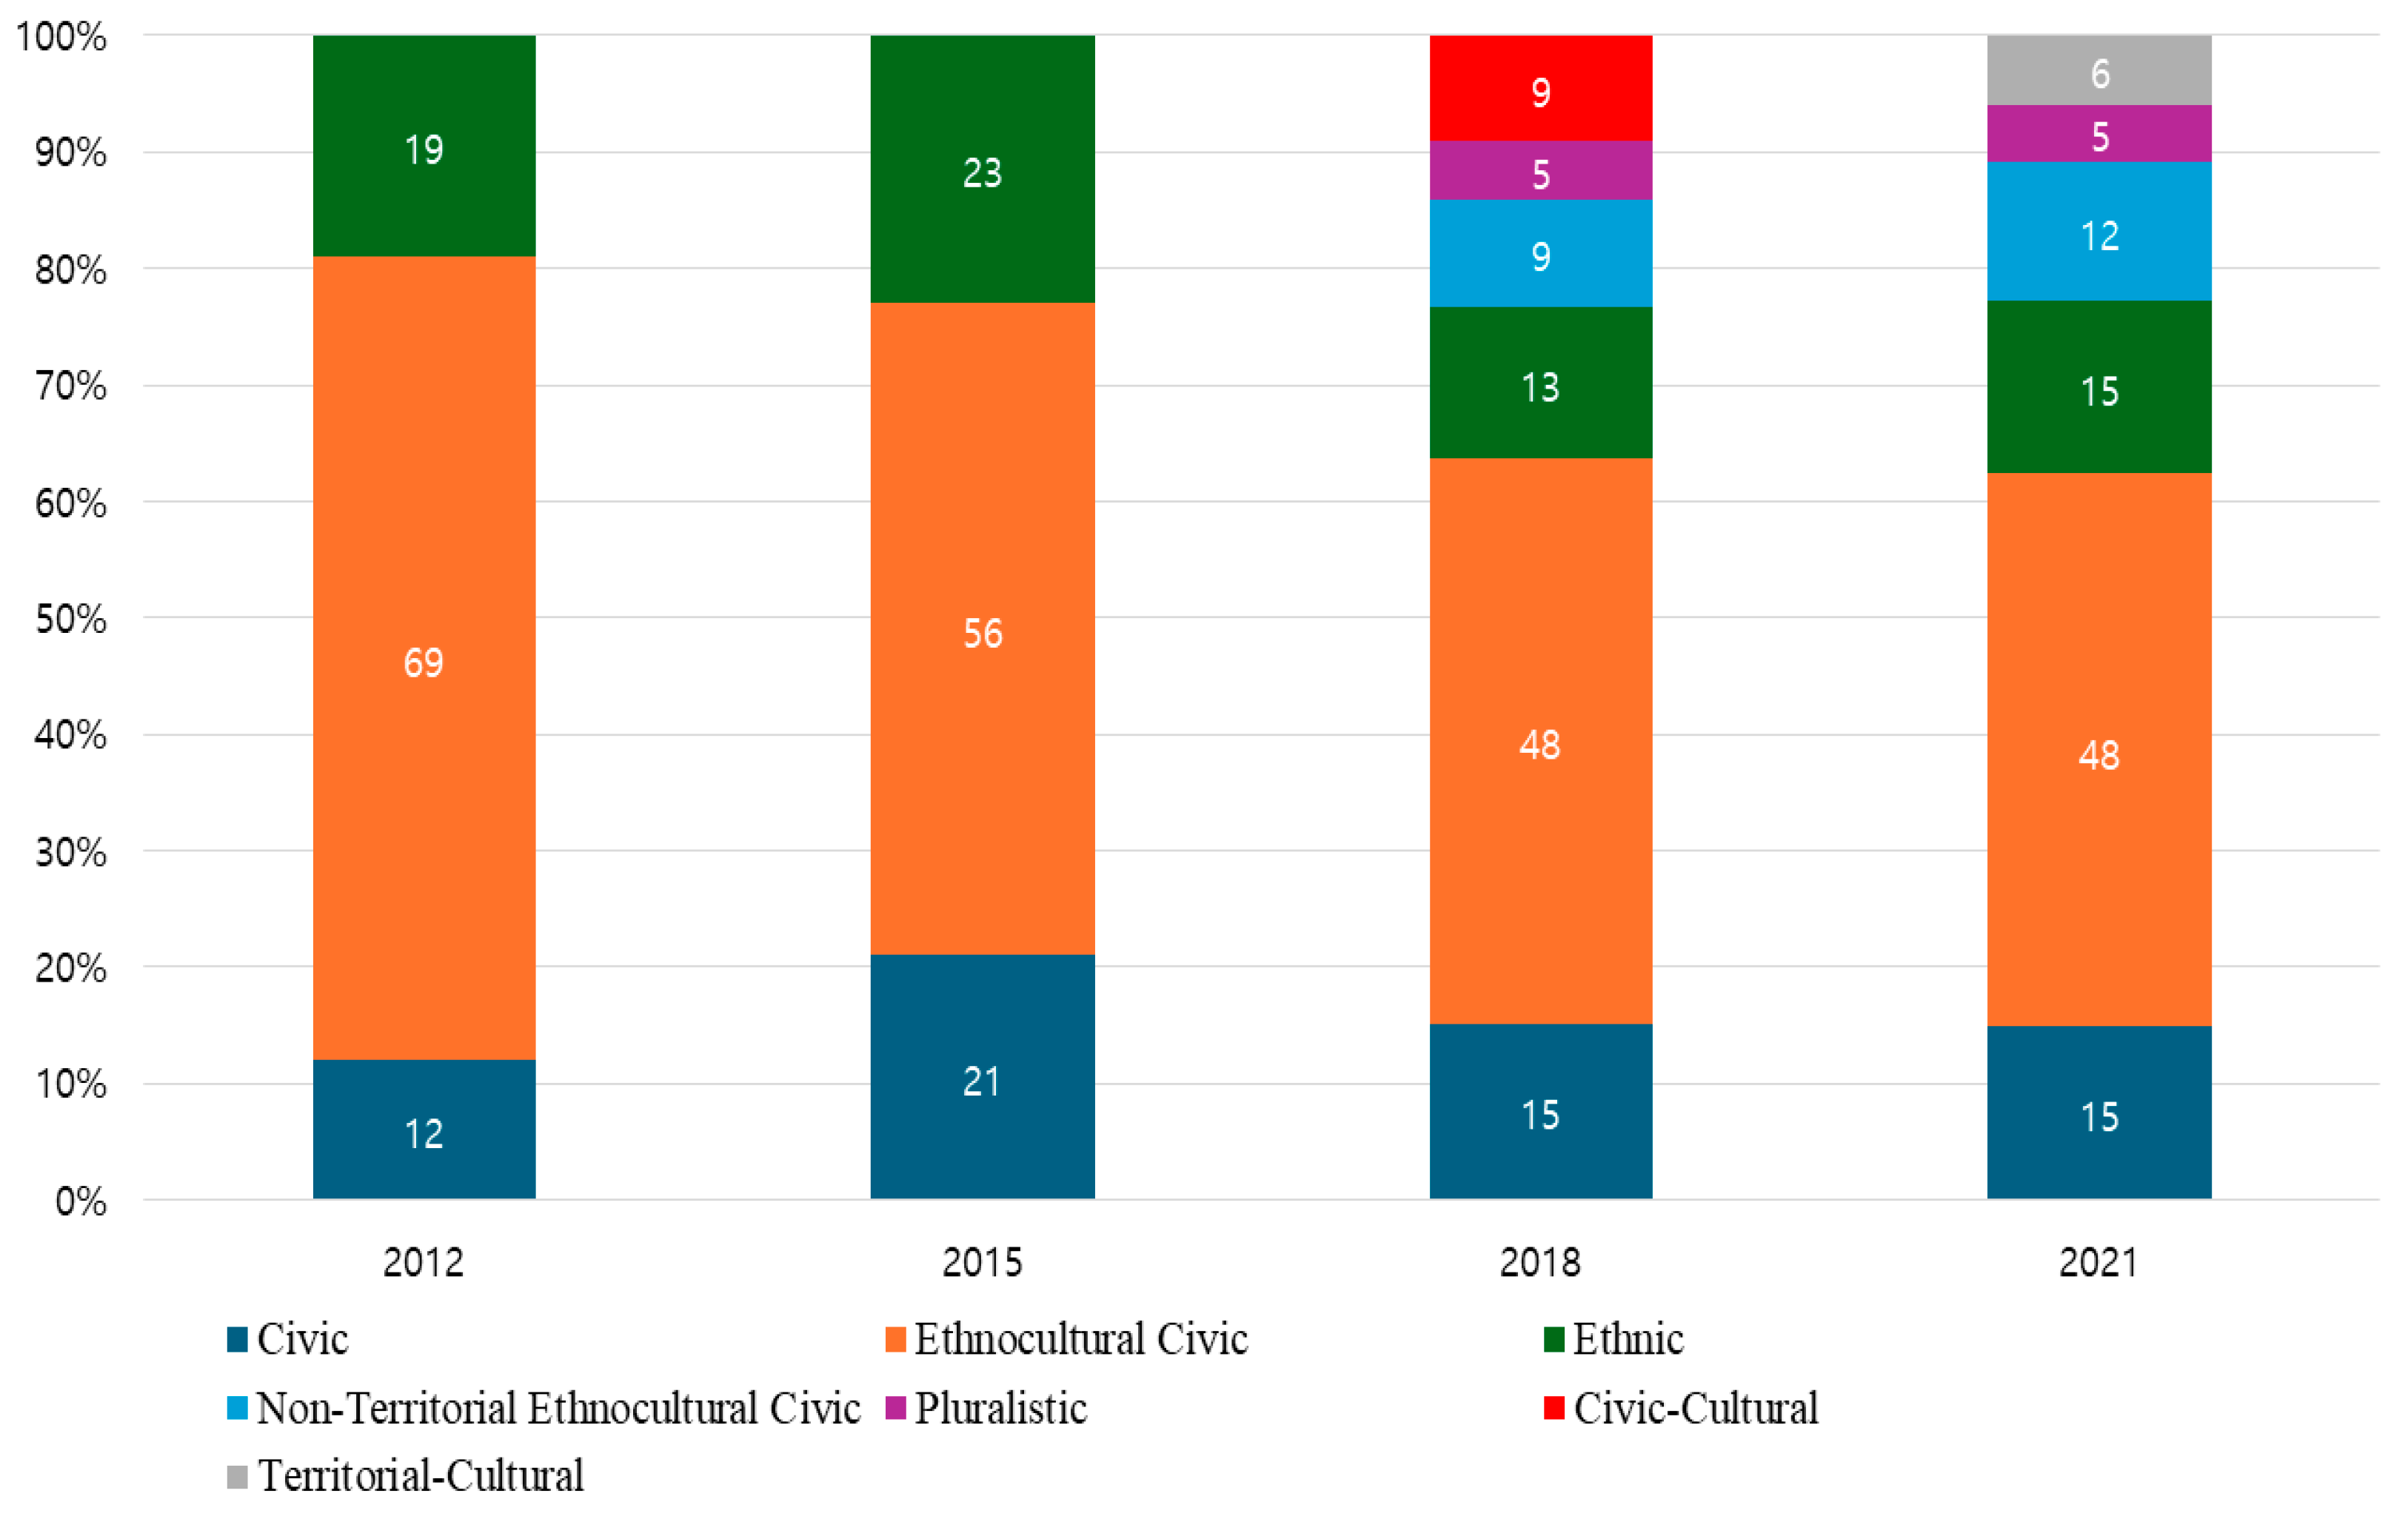
Figure 5 presents a comprehensive analysis of the data from 2012 to 2021, detailing the evolving trends in national identity across these years. This longitudinal overview captures significant shifts in the way various identity groups have developed and interacted over time.
The distribution of identity classes from 2012 to 2021, as shown in
Figure 5, reveals significant shifts in how people understand and define national identity. In 2012, the Ethnocultural Civic class was dominant, representing 69% of the population. However, by 2015 the proportion of this group had decreased significantly to 56%, indicating a decline in the emphasis on traditional ethnocultural components. By 2018, this group continued to shrink, falling to 48%, where it stabilized through 2021, reflecting an ongoing but less pronounced importance of ethnocultural identity.
Similarly, the Ethnic class, which focused primarily on ethnic lineage as the core of national identity, also underwent notable changes. In 2012, 19% of the population belonged to this class, which grew slightly to 23% by 2015. However, by 2018 there was a sharp drop to 13%, showing a declining emphasis on ethnic identity. The Ethnic class recovered slightly in 2021, rising to 15%, but it remained much smaller than in earlier years.
The Civic class, emphasizing citizenship and political engagement, showed a contrasting trend. In 2012, it accounted for only 12% of the population, but by 2015 this group had grown significantly to 21%. The class’s size decreased slightly in 2018 to 15% and remained stable at 15% in 2021, indicating consistent but moderate importance.
New groups began to emerge starting in 2018, as reflected in
Figure 5. The Non-Territorial Ethnocultural Civic class, which did not exist in 2012 or 2015, appeared for the first time in 2018, representing 9% of the population. This class reflects a growing recognition of cultural and political identity that is not tied to specific geographic boundaries. By 2021, this class expanded to 12%, indicating an increasing number of people who view being a “true Korean” as cultural and political, yet independent of territorial constraints. This implies that being a “true Korean” is based on cultural and political identity rather than being tied to a specific geographical or territorial boundary. In other words, their sense of Korean identity is not limited to physical or national borders but is instead shaped by shared cultural values, traditions, or political beliefs. This reflects a broader, more flexible view of national identity.
Similarly, the Pluralistic class also emerged in 2018, accounting for 5% of the population. This class represents a more inclusive and flexible perspective on national identity, blending civic, cultural, and ethnic elements. It remained stable at 5% in 2021, suggesting that while it is a small group, the pluralistic view of identity has maintained its relevance.
Another new class, the Civic-Cultural group, also appeared in 2018, comprising 9% of the population. This class represents individuals who integrate both civic participation and cultural heritage into their understanding of national identity. However, by 2021 this class had disappeared, possibly indicating that individuals had shifted their understanding of the relationship between civic and cultural elements, or that they had merged with other groups with more defined identities.
Finally, in 2021 a new class, the Territorial-Cultural class, emerged for the first time, representing 6% of the population. This class reflects a rising importance of geographic and cultural belonging, suggesting that national identity is increasingly being viewed through the lens of territoriality.
Overall, the trends reveal a decline in the dominance of both ethnocultural and ethnic identities, with a corresponding rise in more flexible and civic-oriented understandings of national identity. The emergence of new classes, such as the Non-Territorial Ethnocultural Civic, Pluralistic, and Territorial-Cultural classes, highlights the growing complexity of national identity in the modern era, with various factors—civic, cultural, ethnic, and territorial—all playing a role. The shifts suggest that national identity is no longer defined by a single dimension but is rather a blend of multiple influences that reflect the changing social and political landscape.


