Article

Spatiotemporal Variability of Soil Erosion in the Pisha Sandstone Region: Influences of Precipitation and Vegetation

1
Yinshanbeilu National Field Research Station of Steppe Eco-Hydrological System, China Institute of Water Resources and Hydropower Research, Beijing 100038, China
2
Desert Science and Engineering College, Inner Mongolia Agricultural University, Hohhot 010018, China
3
Institute of Water Resources for Pastoral Area, Ministry of Water Resources, Hohhot 010020, China
*
Authors to whom correspondence should be addressed.
Sustainability 2024, 16(21), 9313; https://doi.org/10.3390/su16219313
Submission received: 4 September 2024 / Revised: 19 October 2024 / Accepted: 20 October 2024 / Published: 26 October 2024

Abstract

:
The Pisha sandstone area, situated in the upper and middle reaches of the Yellow River in China, is characterized by severe soil and water erosion, making it one of the most critical regions on the Loess Plateau. The rugged terrain and exposed bedrock complicate management efforts for this area, posing challenges for accurate forecasting using soil erosion models. Through an analysis of terrain, vegetation, and precipitation impacts on soil erosion, this study offers theoretical support for predicting soil erosion within the exposed Pisha sandstone area of the Loess Plateau. This has substantial implications for guiding water and soil conservation measures in this region. Focusing on China’s exposed sandstone area within the Geqiugou watershed, temporal and spatial changes in vegetation cover and land use from 1990 to 2020 were analyzed. The result shows that, from 1990 to 2020, the grassland area has exhibited a consistent downward trend, with successive reductions of 64.86% to 59.46%. The area of low vegetation cover witnessed a significant decline of 59.29% in 2020 compared to that in 1990. The moderate erosion area decreased from 84.52 to 57.17 km2. The significant reduction in soil and water loss can be attributed to the expansion of forest and grassland areas, with the implementation of the Grain for Green project serving as a key policy driver for facilitating this expansion. This study provided a good example of combining rainfall with vegetation coverage to fast estimation soil erosion. A mathematical relationship between the vegetation rainfall coupling index (RV) and soil erosion was established with strong fitting effects, enabling estimation of the soil erosion volume under varying slope conditions within Pisha sandstone areas. The main focus of future soil and water conservation in the Pisha sandstone area should be on effectively managing the channel slope and minimizing exposed bedrock areas through a combination of slope cutting, the application of anticorrosive materials, and the implementation of artificial vegetation planting.

1. Introduction

The ecological conservation and high-quality development of the Yellow River Basin is one of the most important strategies in China [1]. Since the end of the last century, China has implemented the Grain for Green project (GFGP), which has significantly changed the vegetation coverage status and land-use structure of the upper and middle reaches of the Yellow River. As a result, the vegetation coverage and ecological quality have been greatly improved [2,3]. Many research studies have proved that the process of soil erosion processes on the Chinese Loess Plateau is intimately linked with rainfall, vegetation cover, and land-use patterns [4,5,6]. And, almost uniquely, on a mesa north of the Loess Plateau, the slope on both sides of the river is laced with red and white bare bedrock. These areas have shallow soil layers and shallowly buried bedrock, with a low quartz content and high montmorillonite and calcite content in the bedrock mineral composition [7]. This makes the bedrock prone to water absorption, swelling, and weathering, resulting in widespread exposure of the bedrock and exacerbating soil and water turnover [8]. This area is also called exposed Pisha sandstone area and it lies within the triangle formed by Inner Mongolia and Shanxi and Shaanxi Provinces. The exposed Pisha sandstone region will be a focal area for future land and moisture content maintenance planning and investment in China. Therefore, identifying the driving factors of soil erosion change whether it can really provide information and data support for formulating effective soil erosion prevention and control measures. For some parts of the government, managers and decision-makers need to not only understand the numerical features of the intensity of soil erosion but also to identify the most influencing and important factors for soil erosion [9]. Then these factors should be prioritized when formulating policies and implementing specific management measures. Therefore, studying the coupled impacts of precipitation and botany on ground denudation under different topographical conditions can provide important scientific support for future vegetation construction and water and soil loss control in the Yellow River.
In the realm of water erosion modeling, the Universal Soil Loss Equation (USLE) and the Revised Universal Soil Loss Equation (RUSLE) models have gained widespread acceptance due to their streamlined structure and compatibility with GIS [10]. The RUSLE model has been extensively utilized in various regions of the world; for instance, P. Thapa evaluated impacts on Dolakha using the RUSLE model [11]. Aiello quantified the amount of soil erosion rate by the RUSLE model in the large heterogeneous semi-agricultural Bradano River basin in southern Italy [12]. Galdino evaluated the effects of land use, management, and conservation practices on soil erosion in the pasturelands of Goiás State and the Federal District using the RUSLE model [13]. Tang et al. employed RUSLE to compute soil erosion in the Yanggou small watershed of the Loess Plateau [14], while another study by Qin. et al. delved into a novel RUSLE slope-length algorithm and its application in evaluating soil erosion in this region [15]. Additionally, Xu et al. leveraged an enhanced RUSLE model to analyze the dynamic sediment transport characteristics of the Yellow River [16]. Previous work has shown that the topography and land-use types are key factors which affect the soil properties’ variability at the catchment scale in the loess hilly area [17,18,19]. But some experts argue that for a specific watershed, rainfall intensity is the main factor affecting the soil erosion [20], while others argue that landscape evolution is the main cause of soil erosion [21]. In fact, different positions in the gully area have different phenomena of vegetation cover. And further, they even represent disparate patterns of water and sediment processes. However, the Pisha sandstone area differs from the loess area in that on account of the complex impact of topography, bedrock, soil, and vegetation elements, predicting soil erosion in exposed Pisha sandstone areas being extremely challenging. Several experts who have conducted research from the perspectives of soil hydraulics and slope stability have also verified distinct water flow patterns at the interface between rocks and soil, as well as their influence on slope stability [22,23]. Some research scientists have also been trying to use a combination of geostatistics and landscape ecology to analyze the dimensional prediction and uncertainty of soil denudation [24,25], and the results have implications for this research. The key and most urgent problems in the current soil erosion of Pisha sandstone research are those of identifying dominant factors, such as determining how rainfall, runoff, and vegetation affect the soil loss of Pisha sandstone.
To sum up, the utilization of the RUSLE model in the Pasha sandstone area is currently limited. The characteristics of vegetation cover and land-use change in the study area from 1990 to 2020 are analyzed in this paper. By integrating rainfall, vegetation, and soil data, the RUSLE model factors were enhanced for improved accuracy. Additionally, a mathematical relationship between the coupling index of vegetation and rainfall (RV) and soil erosion was established. The objective of this study is to investigate the correlation between soil erosion and rainfall and vegetation in the Pisha sandstone area, while establishing an evaluation index using the RV index for a simplified and rapid assessment of soil erosion.

2. Research Methods

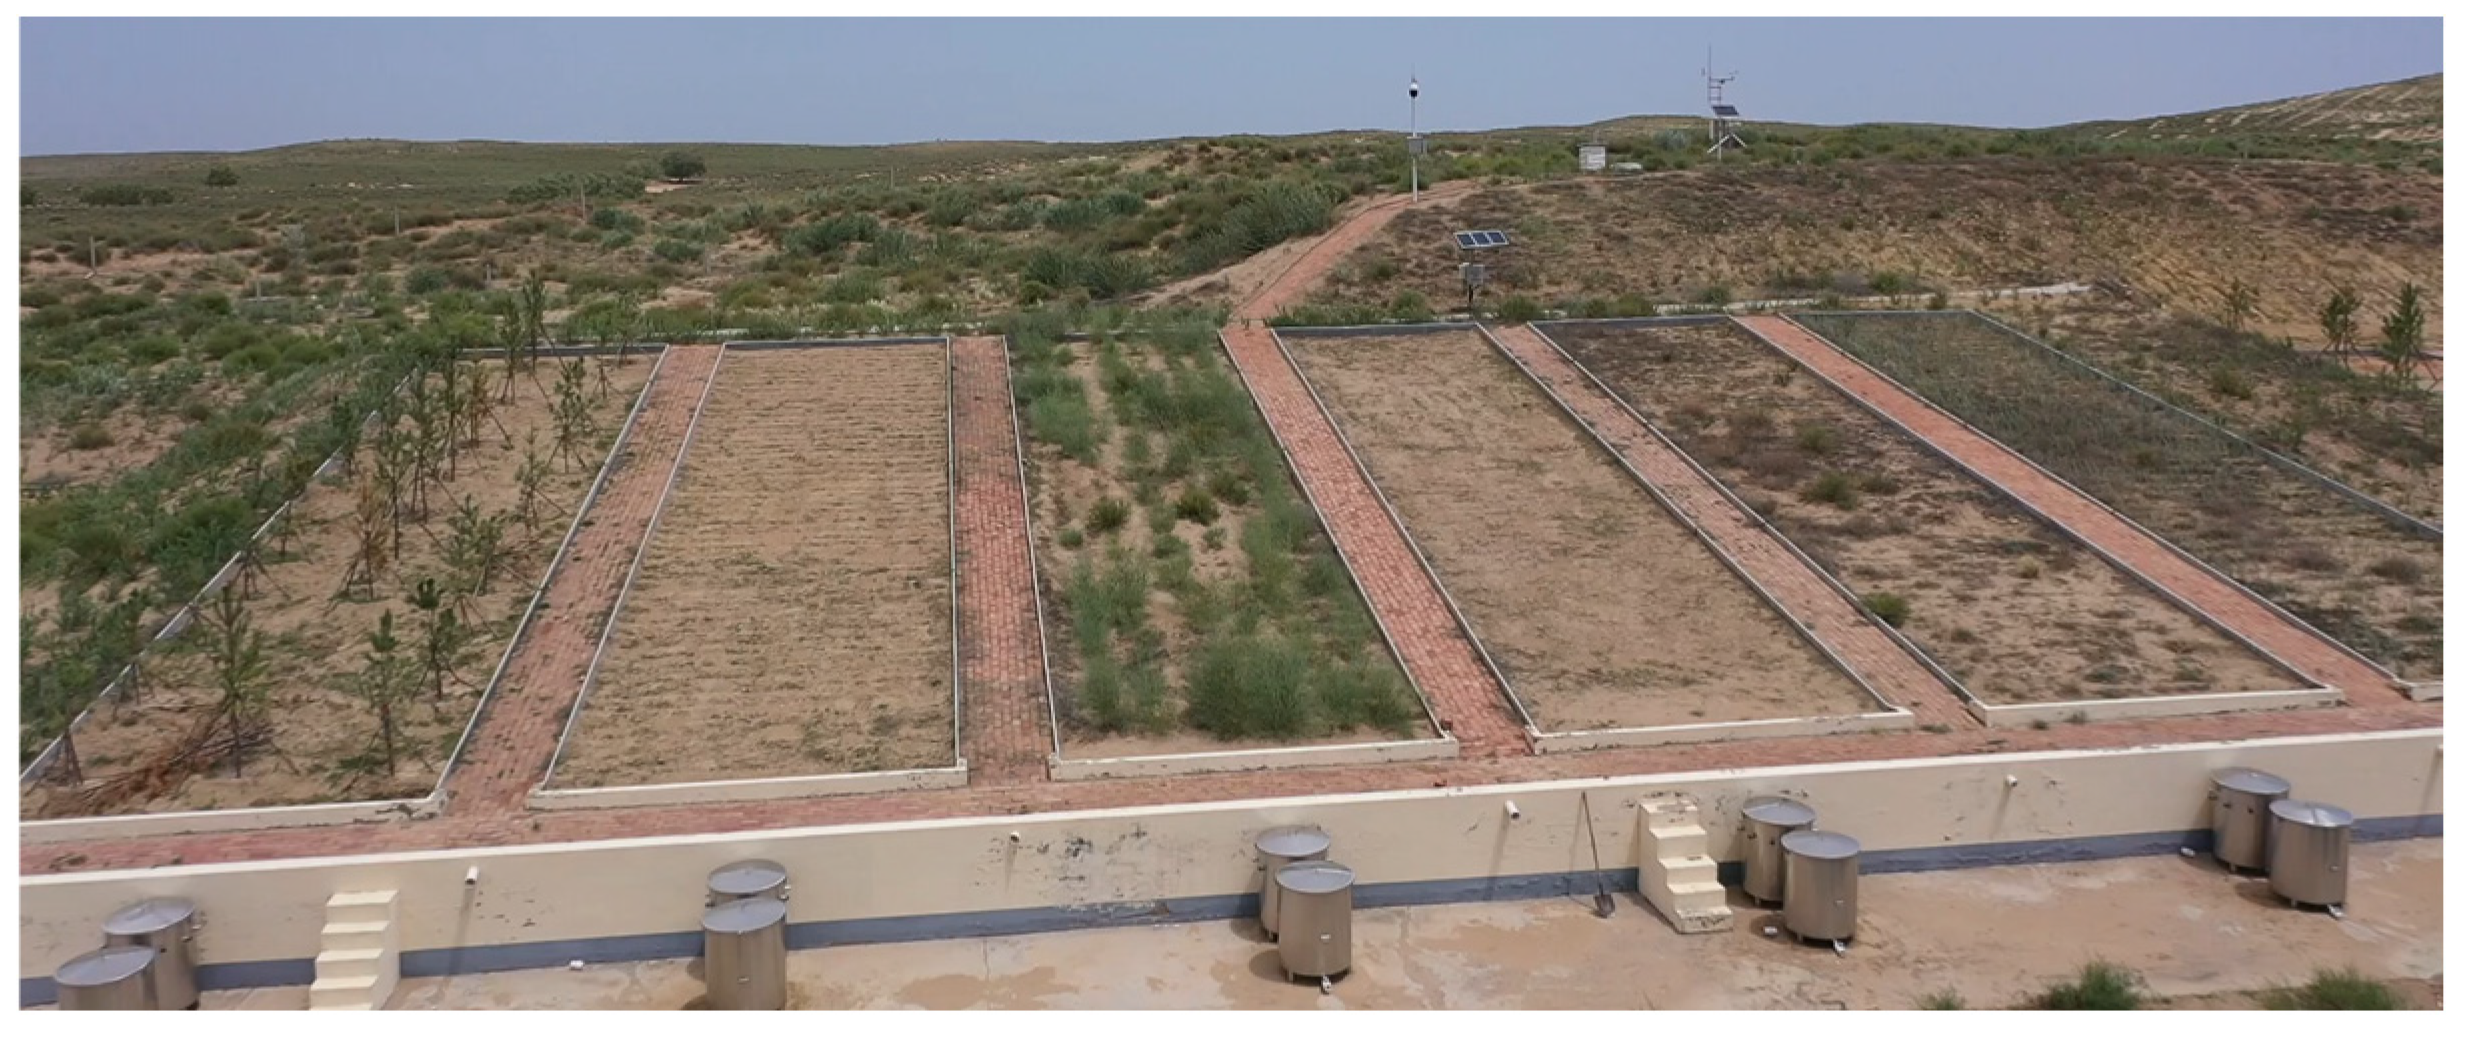
2.1. Overview of the Research Site

This study focuses on the Geqiugou Basin (Figure 1), situated in the middle reaches of the Huanghe River within the Huangfuchuan watershed under the jurisdiction of Zhungeer County, Ordos City, China. The geographical coordinates range from 110°31′ to 110°35′ E and from 39°46′ to 39°48′ N. The elevation varies between 1110 and 1300 m, covering a watershed area of 224 km2 with a north–south-oriented terrain. The climate is representative of a typical middle subtropical continental climate characterized by an extended winter and dry season, along with a brief summer featuring warm temperatures. Annual precipitation amounts to approximately 388.3 mm, concentrated mostly in June through September, peaking at 107.9 mm in July followed by 97.4 mm in August. Monthly average temperatures range from −10.6 °C to 23.4 °C, with four months experiencing sub-zero temperatures annually; July records the highest monthly temperature. Evaporation within this region totals around 1965 mm annually—approximately five times higher than precipitation—with peak evaporation occurring in May at 330 mm followed by June at 279 mm. The predominant soil types are loess and calcareous soil characterized by a thin topsoil layer overlying relatively loose quartz sandstone weathering material or semi-weathered parent rock; some areas may feature exposed parent rock surfaces rich in lime content with sandy soil and sandy loam textures prevailing. The primary land-use categories in the study area include grassland, forest, farmland, bare land, construction land, and water bodies. Vegetation primarily comprises Pinus tabuliformis, Platycladus orientalis, Caragana korshinskii, and Hippophae rhamnoides; herbaceous plants include Leymus chinensis, Salsola nitraria, and Heteropappus altaicus.

2.2. Data Sources

The basic data in this study include the land-use/cover data from 1990~2020, vector diagrams of administrative boundaries of Chinese cities, digital elevation DEM, normalized difference vegetation index (NDVI), meteorology, soil type, and physical and chemical properties. Specifically, land-use data were gained from a remote-sensing interpretation of Landsat4-5TM/Landsat8OLI images with a resolution of 30 m and clouds smaller than 2% which were downloaded from the geospatial data cloud (http://www.gscloud.cn/, accessed on 20 February 2023). NDVI data were acquired through waveband calculation by using remote-sensing images. Data of multiple meteorological factors, including monthly precipitation, average air temperature, average wind velocity, and sunshine, came from the National Science and Technology Infrastructure Platform National Earth System Science Data Center (http://www.geodata.cn, accessed on 20 February 2023). The rainfall data also include the precipitation data observed by the 4 weather stations (HOBOU30) set up within the study area from 2012 to 2020. Data about soil types and physical and chemical properties came from the global soil database HWSD provided by the National Scientific Data of Qinghai-Tibet Plateau (https://data.tpdc.ac.cn, accessed on 20 February 2023), which covered 11 terms of soil general information and 34 soil properties.

2.3. Forecast of Soil Denudation

Hydraulic denudation data are calculated based on the extracted vegetation cover, slope length factors, and actual rainfall and soil physicochemical properties in the research site using the RUSLE model. The calculation is mainly carried out using the optical grating calculator function in ArcGIS version 10.7 software, with the equation as follows:
A = R × K × LS × C × P
where A is the average annual soil loss (t ha−1 y−1); R is the precipitation erosivity element (MJ mm ha−1 h−1 y−1); K is the soil corrodibility element; LS is the slope length and slope element; C is the botanical coverage and management factor; P is the land and moisture content maintenance surveying element.
As applied in previous research in Pisha sandstone areas, the classical R-factor calculation method in the RUSLE model is used. Based on the existing rainfall records in the research area, the average annual rainfall erosivity of the watershed can be calculated using the I30 of rainfall [24,25,26]. The numeration equation is as follows:
  R = E I 30
E =   e I 30
e   = 0.119 + 0.0873 log 10 I h           I h 76   m m / h 0.283           I h > 76   m m / h
I h = P t   ×   60
where E is total energy of the storm (mJ ha−1), I30 is the maximum 30 min rainfall intensity in a rainstorm (mm h−1), e is raindrop kinetic energy per unit of rainfall (mJ ha−1 mm), and Ih is the rainfall intensity (mm h−1).
This study adopts the Shirazi formula method, and the soil data required for K-factor modeling were obtained from the 2017 soil census data of Junge County, encompassing comprehensive information on soil type, texture, aggregate composition, and other relevant factors. The erodibility K-factor is calculated using the Shiraz model [27,28], with the formula as follows:
K = 7.954   ×   0.0017 + 0.0494   ×   exp 0.5   ×   log GMD   + 1.675 0.6986 2
where K is the soil erodibility factor; GMD is the geometric mean diameter of the granule group, obtained through field sampling and subsequent sieve analysis using the Yoder method.
The LS factor is generated by vectorizing the topographic map into DEM, extracting the slope length L-factor using the cumulative flow method, and extracting the slope factor S based on the technology in favor of Liu Baoyuan et al. [29], which is appropriate for the northwest region.
S =       10.8 s i n θ + 0.03 θ < 5 ° 16.8 s i n θ 0.5 5 ° θ < 10 ° 21.9 s i n θ 0.96 θ 10 °
L =   λ 22.1 m
m   = 0.2 θ < 1 ° 0.3   1 ° θ < 3 0.4 3 ° θ < 5 0.5 θ > 5 °
where S is the gradient element, θ is the slope, L is the gradient length element, and λ is the gradient length
The C-factor is calculated using the empirical formula of vegetation coverage of the Huangfuchuan River watershed [28,29]. VC was calculated using the NDVI index.
The classification standard for vegetation coverage is as follows: areas with less than 10% vegetation coverage are categorized as bare land, those with 10–30% coverage are classified as low coverage, those with 30–45% coverage are considered to have moderate low coverage, those with 45–60% coverage are considered to have moderate coverage, and areas with more than 60% vegetation coverage are classified as high coverage [30].
C =   0.992 e 0.0344 V
VC = N D V I N D V I min N D V I max N D V I min
where V is the vegetation coverage (VC), NDVImin is the NDVI value with a cumulative probability of 5%, and NDVImax is the NDVI value with a cumulative probability of 90%.
The value of the P factor ranges from 0 to l, where a value approaching 0 indicates good conservation practice and a value approaching l indicates poor conservation practice [31]. According to field observations, the cultivated land in the study area without any significant conservation support practices such as contouring or terracing. To neglect the P factor from soil erosion estimation, P equals l as suggested by Wischmeier and Smith [10].
The calculated erosion modulus is graded as follows: <1000 (t km−2 yr−1) for low erosion, 1000~2500 (t km−2 yr−1) for slight erosion, 2500~5000 (t km−2 yr−1) for moderate erosion, 5000~8000 (t km−2 yr−1) for high erosion, and 8000~15,000 (t km−2 yr−1) for severe erosion [32].
This study analyzes the coupling connection between precipitation and vegetation [33]. The present study utilized data from soil and water loss monitoring stations established by the Erdos Municipal Water Resources Bureau in the research area. Four different slope test areas were included (Figure 2), with gradients of 5°, 10°, 15°, and 25° respectively. Each group consisted of a total of fifteen monitoring sites characterized by varying vegetation coverage percentages: 10%, 30%, 40%, 50%, and 60% respectively.
The numeration equation is as follows:
R ^ i = R i / R ¯ N ^ i = N i / N ¯
where Ri and Ni represent the rainfall and VC values of the i-th year or the multi-year average rainfall and VC values, respectively; R ^ i and N ^ i represent the standardized rainfall and VC values using multi-year or multi-year average values, with a value of 1 representing the multi-year average rainfall and VC.
For the exposed Pisha sandstone area, holding other factors constant, the more rainfall there is, the greater the soil and water loss will be, showing a positive correlation; the better the vegetation cover, the smaller the soil and water loss, showing a negative correlation. Therefore, the construction of the vegetation cover–rainfall coupling index is as follows:
R V i = R ^ i N ^ i
where R V i represents the coupling index value of the i-th year; R ^ i and N ^ i represent the standardized rainfall and VC values using multi-year or multi-year average values. When the value of R V i is 0, it is clear that the erosive effect of rainfall and the inhibitory effect of VC are both at the average level of a certain year; when the value of R V i is greater than 0, it indicates that the erosive effect of rainfall is in a relatively dominant position, and the inhibitory effect of vegetation is in a relatively secondary position; when the value of R V i is less than 0, it represents that the inhibitory effect of VC is in a relatively dominant position, and the erosive effect of rainfall is in a secondary position.

3. Temporal and Spatial Changes in Land Use and Vegetation Cover in the Study Area

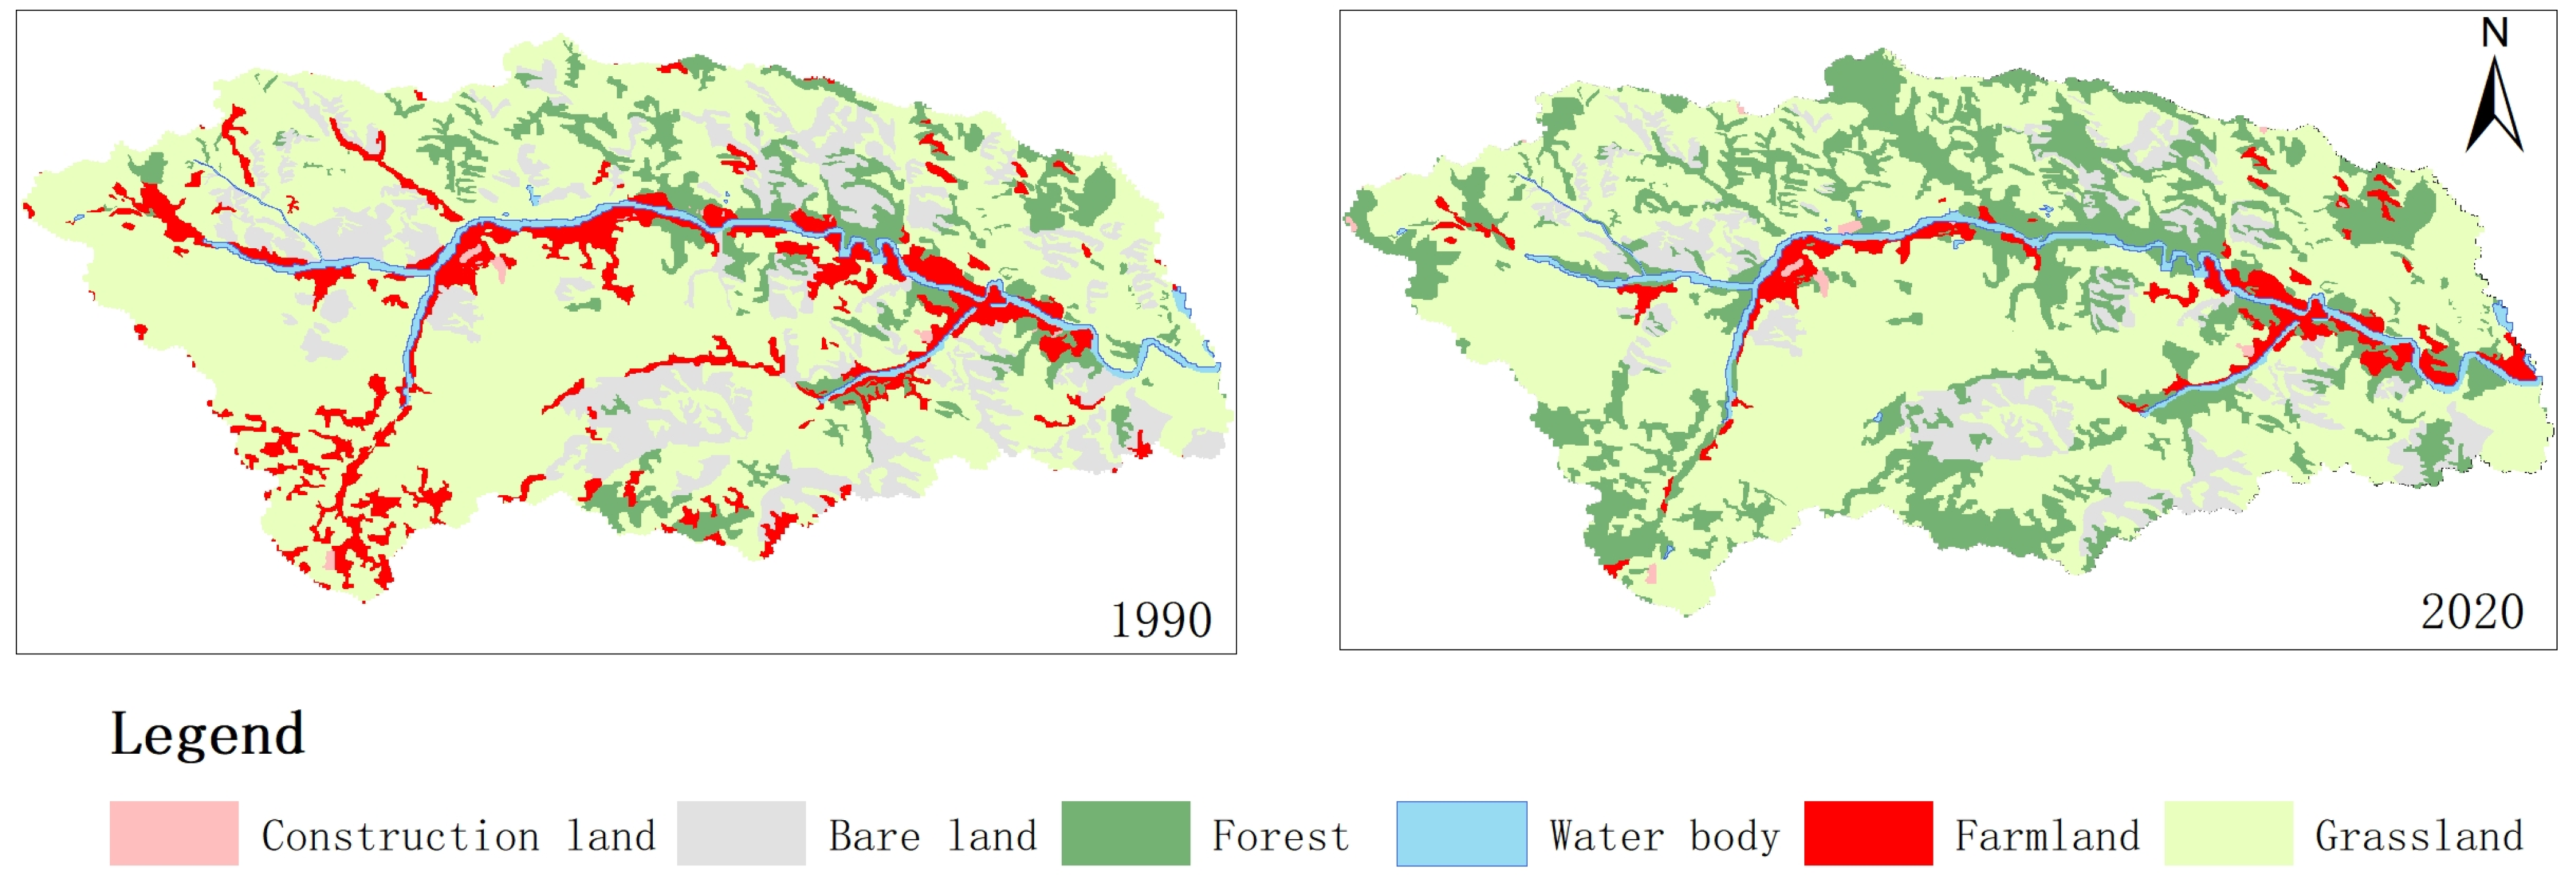
3.1. Analysis of Spatial-Temporal Dynamic Changes in Land Use in the Study Area

Figure 3 shows that from 1990 to 2020, the grassland area has exhibited a consistent downward trend from 1990 to 2020, with successive reductions of 64.86% to 66.02%, 61.25%, 59.72%, and finally settling at 59.46%. The arable land area experienced a significant decrease, declining from 10.26% to 3.99%. The amount of bare land has also decreased, dropping from 12.96% to 11.37%, and then further down to 10.55% and 9.35%. The forest land, on the other hand, experienced a gradual increase from 9.27% to 12.04%, 18.89%, 22.19%, and eventually 24.43%. However, waterbodies and construction land have changed little over the past 30 years.
According to the official reports published by the government of the study area, China has implemented extensive ecological restoration projects in the upper and middle reaches of the Yellow River basin, as well as initiatives for preventing and controlling Beijing–Tianjin sandstorms and establishing three north shelterbelts over the past three decades. The first phase of the GFGP was implemented in 1999 within the research area, resulting in a substantial decrease in cultivated land and a significant increase in forested areas by 2000. These changes have led to significant alterations in the land-use structure within the research area. Therefore, the implementation of this project can be identified as the primary policy factor driving these transformations.

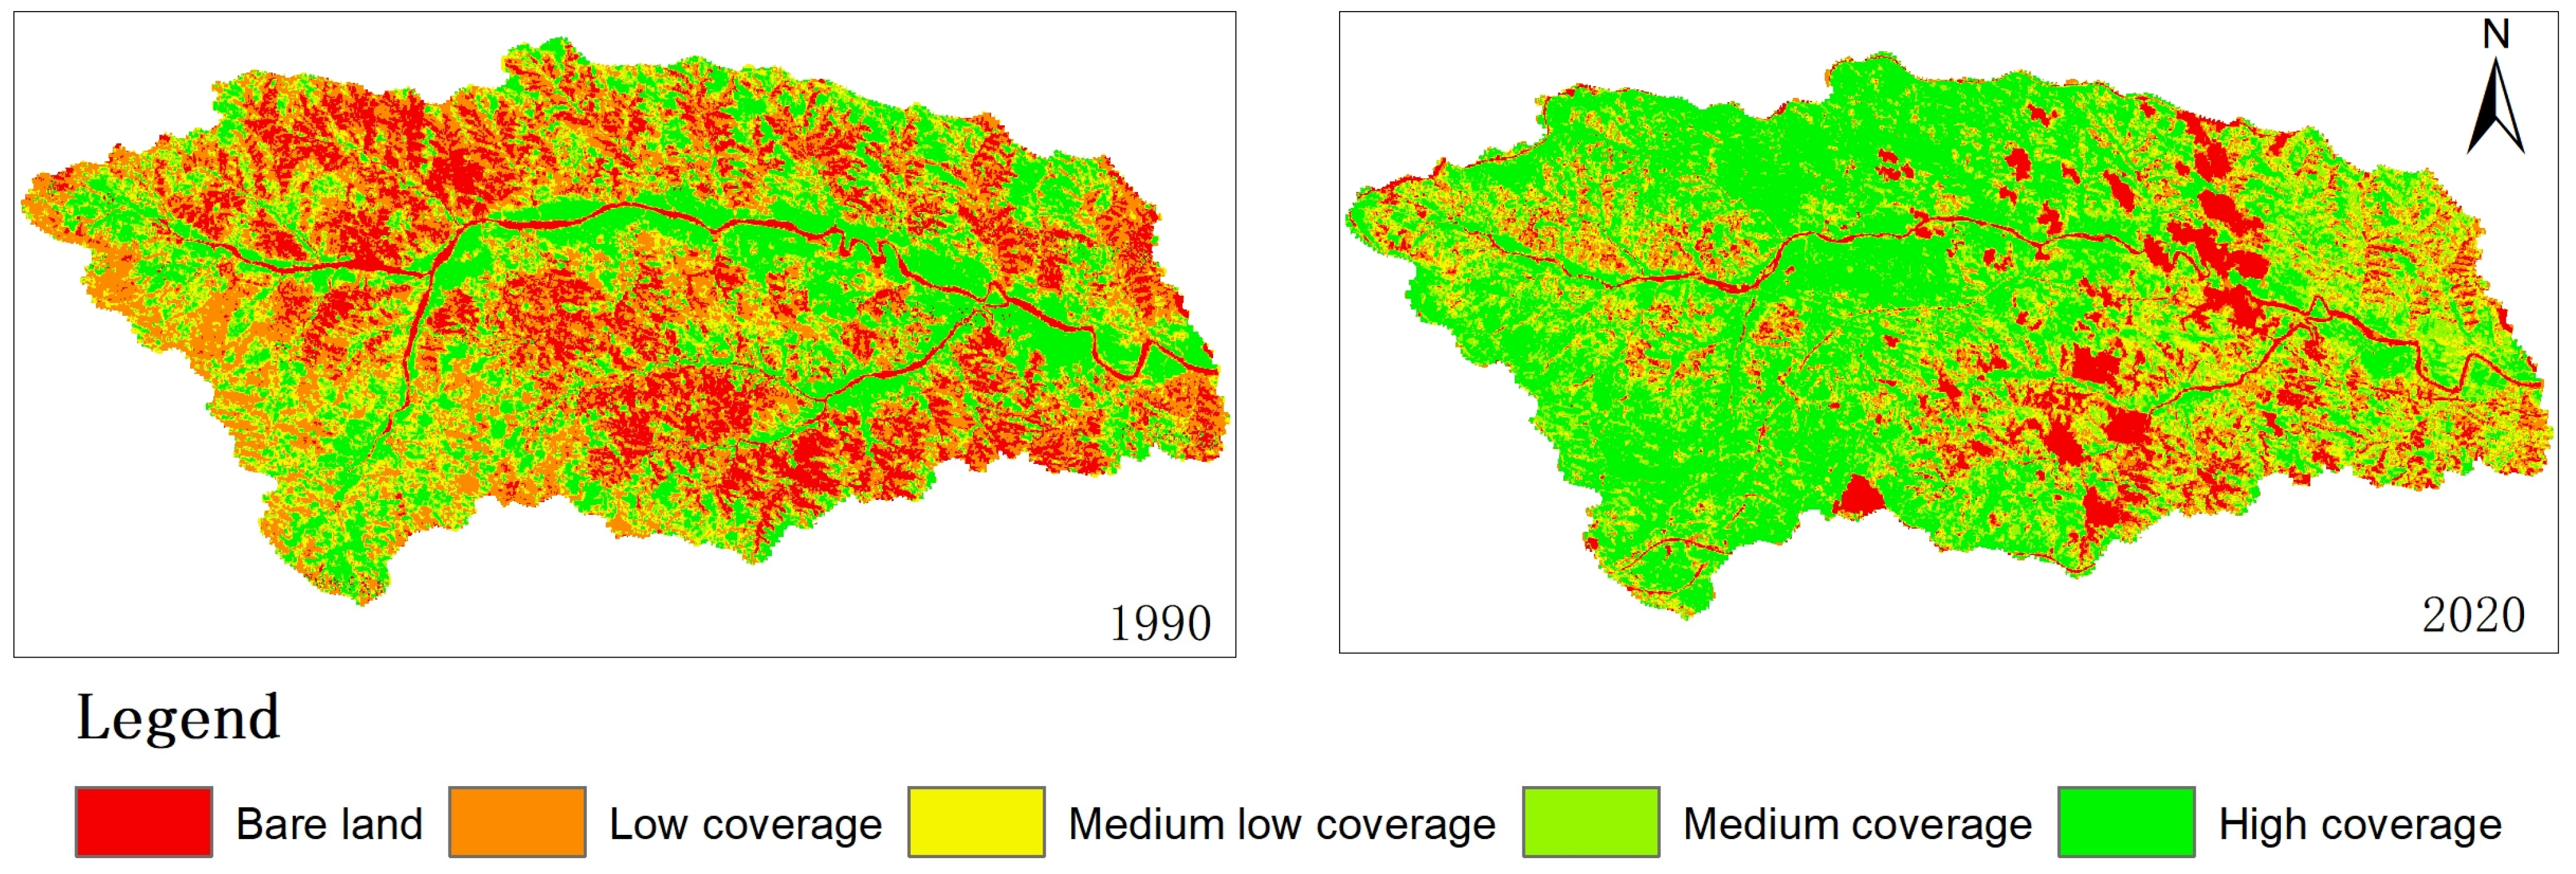
3.2. Temporal and Spatial Dynamic Changes in Vegetation Cover in the Study Area

Figure 4 and Table 1 show that in 1990, the land area with low vegetation coverage was measured at 130.67 km2, while the land area with medium-to-high vegetation coverage amounted to 74.36 km2. By 1995, the land area with low vegetation coverage decreased to 121.19 km2, whereas the land area with medium-to-high vegetation coverage increased to 80.75 km2. In 2000, the land area with low vegetation coverage further declined to 80.86 km2, while the land area with above medium vegetation coverage expanded significantly to reach 117.03 km2. In 2010, a total area of 86.89 km2 of land exhibited low or no vegetative cover, compared to an extent of medium and high vegetative cover spanning across an area of approximately 110.39 km2. The year of 2015 witnessed a decrease in low-coverage areas 82.65 km2 and an increase in areas characterized by medium and high vegetative cover 113.68 km2. In 2020, the land area with low vegetation coverage and below will amount to 63.19 km2, while the area with medium-to-high vegetation coverage will reach 139.90 km2.
From 1990 to 2000, there was an upward trend in vegetation coverage within the study area, resulting in a gradual decrease in bare land and areas with low vegetation cover due to extensive greening efforts. Between 2000 and 2010, there was a tendency for vegetation coverage to decline as bare land and areas with low cover increased. This may be attributed to relatively limited ecological restoration projects during this period and frequent production and development activities that led to vegetation destruction in certain regions. However, from 2010 onwards, there has been a noticeable trend in increasing vegetation coverage. In summary, the vegetation coverage in the study area exhibited a consistent upward trend from 1990 to 2020, with a notable reduction of 59.29% in low and below coverage land areas compared to 1990. Additionally, there was an increase of 1.88 times in land areas characterized by medium height or above.
Based on previous studies and analyses in the study area, numerous research studies have confirmed that climate change was the primary factor influencing vegetation coverage in China prior to the implementation of the Grain for Green program (before 1999) [34]. Following the first phase of the conversion project, a significant portion of cultivated land with slopes exceeding 15 degrees underwent transformation into woodland or grassland, accompanied by extensive artificial vegetation planting. As a result, there was a substantial reduction in bare land and low-cover wasteland from 2000 to 2010. The research shows that climate change was responsible for 45.78% of NDVI variation, while human activities were responsible for 54.22% [35]. Moreover, China implemented another project called the spring grazing prohibition project in 2006 which effectively safeguarded the greening and growth of grassland vegetation during springtime while facilitating vegetation recovery. In 2014, the implementation of the second phase of the Grain for Green program further augmented artificial vegetation coverage.

4. Temporal and Spatial Variation of Soil Erosion in the Study Area

The hydraulic erosion grade in the study area from 1990 to 2020 is depicted in Figure 5 and Table 2. In 1990, the predominant hydraulic erosion intensity was moderate, with an area of moderate erosion covering 84.52 km2, accounting for 37.69% of the basin area. This was followed by an area of intense and above erosion spanning 55.59 km2, representing 24.79% of the basin area. Low erosion covered an area of 40.02 km2, accounting for 22.44% of the total area, while slight erosion encompassed an additional 44.09 km2, constituting approximately 17.84% of the basin’s extent. In comparison to these figures, by the year 1995, medium hydraulic erosion remained dominant within the study region with a coverage of 74 km2 (32.98%). However, the areas experiencing high and severe erosions significantly decreased to 31.84 km2 (14.19%) of the basin’s expanse. Low and slight erosion increased to 59.9 km2 (26.75%) and 58.48 km2, respectively (26.01%).
In 2000, the hydraulic erosion intensity in the study area was predominantly characterized by moderate erosion, covering an area of 70.99 km2, which accounted for 31.67% of the basin’s total area. This was followed by a slight erosion zone spanning 63.13 km2, representing 28.16% of the basin’s area, and another low erosion zone encompassing 62.92 km2, accounting for 28.07% of the basin’s extent. By contrast, in 2005, slight erosion began to dominate the study area with an expansive coverage of 74.43 km2 (33.21% of the basin), while moderate erosion occupied an area of 66.44 km2 (29.64% of the basin). Additionally, there was a low erosion region measuring at approximately 64.90 km2 (28.92% of the basin). The remaining portion consisted of intense erosion activity spanning across an expanse measuring about 18.45 km² or equivalently accounting for roughly 8.23% of the basin area.
In 2010, the area experiencing slight erosion was 86.36 km2, accounting for 38.53% of the basin’s total area. The moderate erosion area covered 62.31 km2, representing 27.79% of the basin’s total area. In 2015, the study area witnessed slight erosion covering an area of 84.23 km2, which accounted for 38.53% of the basin’s total area. The moderate erosion zone encompassed an extent of 52.31 km2, equivalent to 23.33% of the basin’s total area. In 2015, the slight erosion region in the study area measured at approximately 84.23 km2 and constituted about 37.58% of the basin area. The area covered by moderate erosion was approximately 58.44 km2, accounting for about 26.07 % of the basin area. By 2020, the extent of slight erosion in the study area was 84.61 km2, representing approximately 37.72% of the basin area. Meanwhile, the area influenced by moderate erosion amounted to 57.17 km2, equivalent to 25.48% of the total basin area.
Previous data from the Loess Plateau corroborate the research findings of this paper. Relevant studies indicate that since 1990, certain regions on the plateau have experienced a 54% reduction in farmland area, an increase in vegetation coverage from 21% to 69%, and a decrease in average soil erosion from 8000t to 1848t [36]. Experts and scholars utilized the SWAT model and RUSLE model for estimating basin-scale erosion rates, yielding congruous outcomes [37]. These aforementioned data align with the results presented in this paper regarding augmented vegetation coverage and diminished soil erosion. Field investigations further validate that after two decades of project implementation, there has been a substantial enhancement in surface vegetation richness and coverage, along with the effective mitigation of surface erosion during extreme rainstorms [38,39].

5. Analysis of the Effects of Vegetation and Rainfall on Soil Erosion

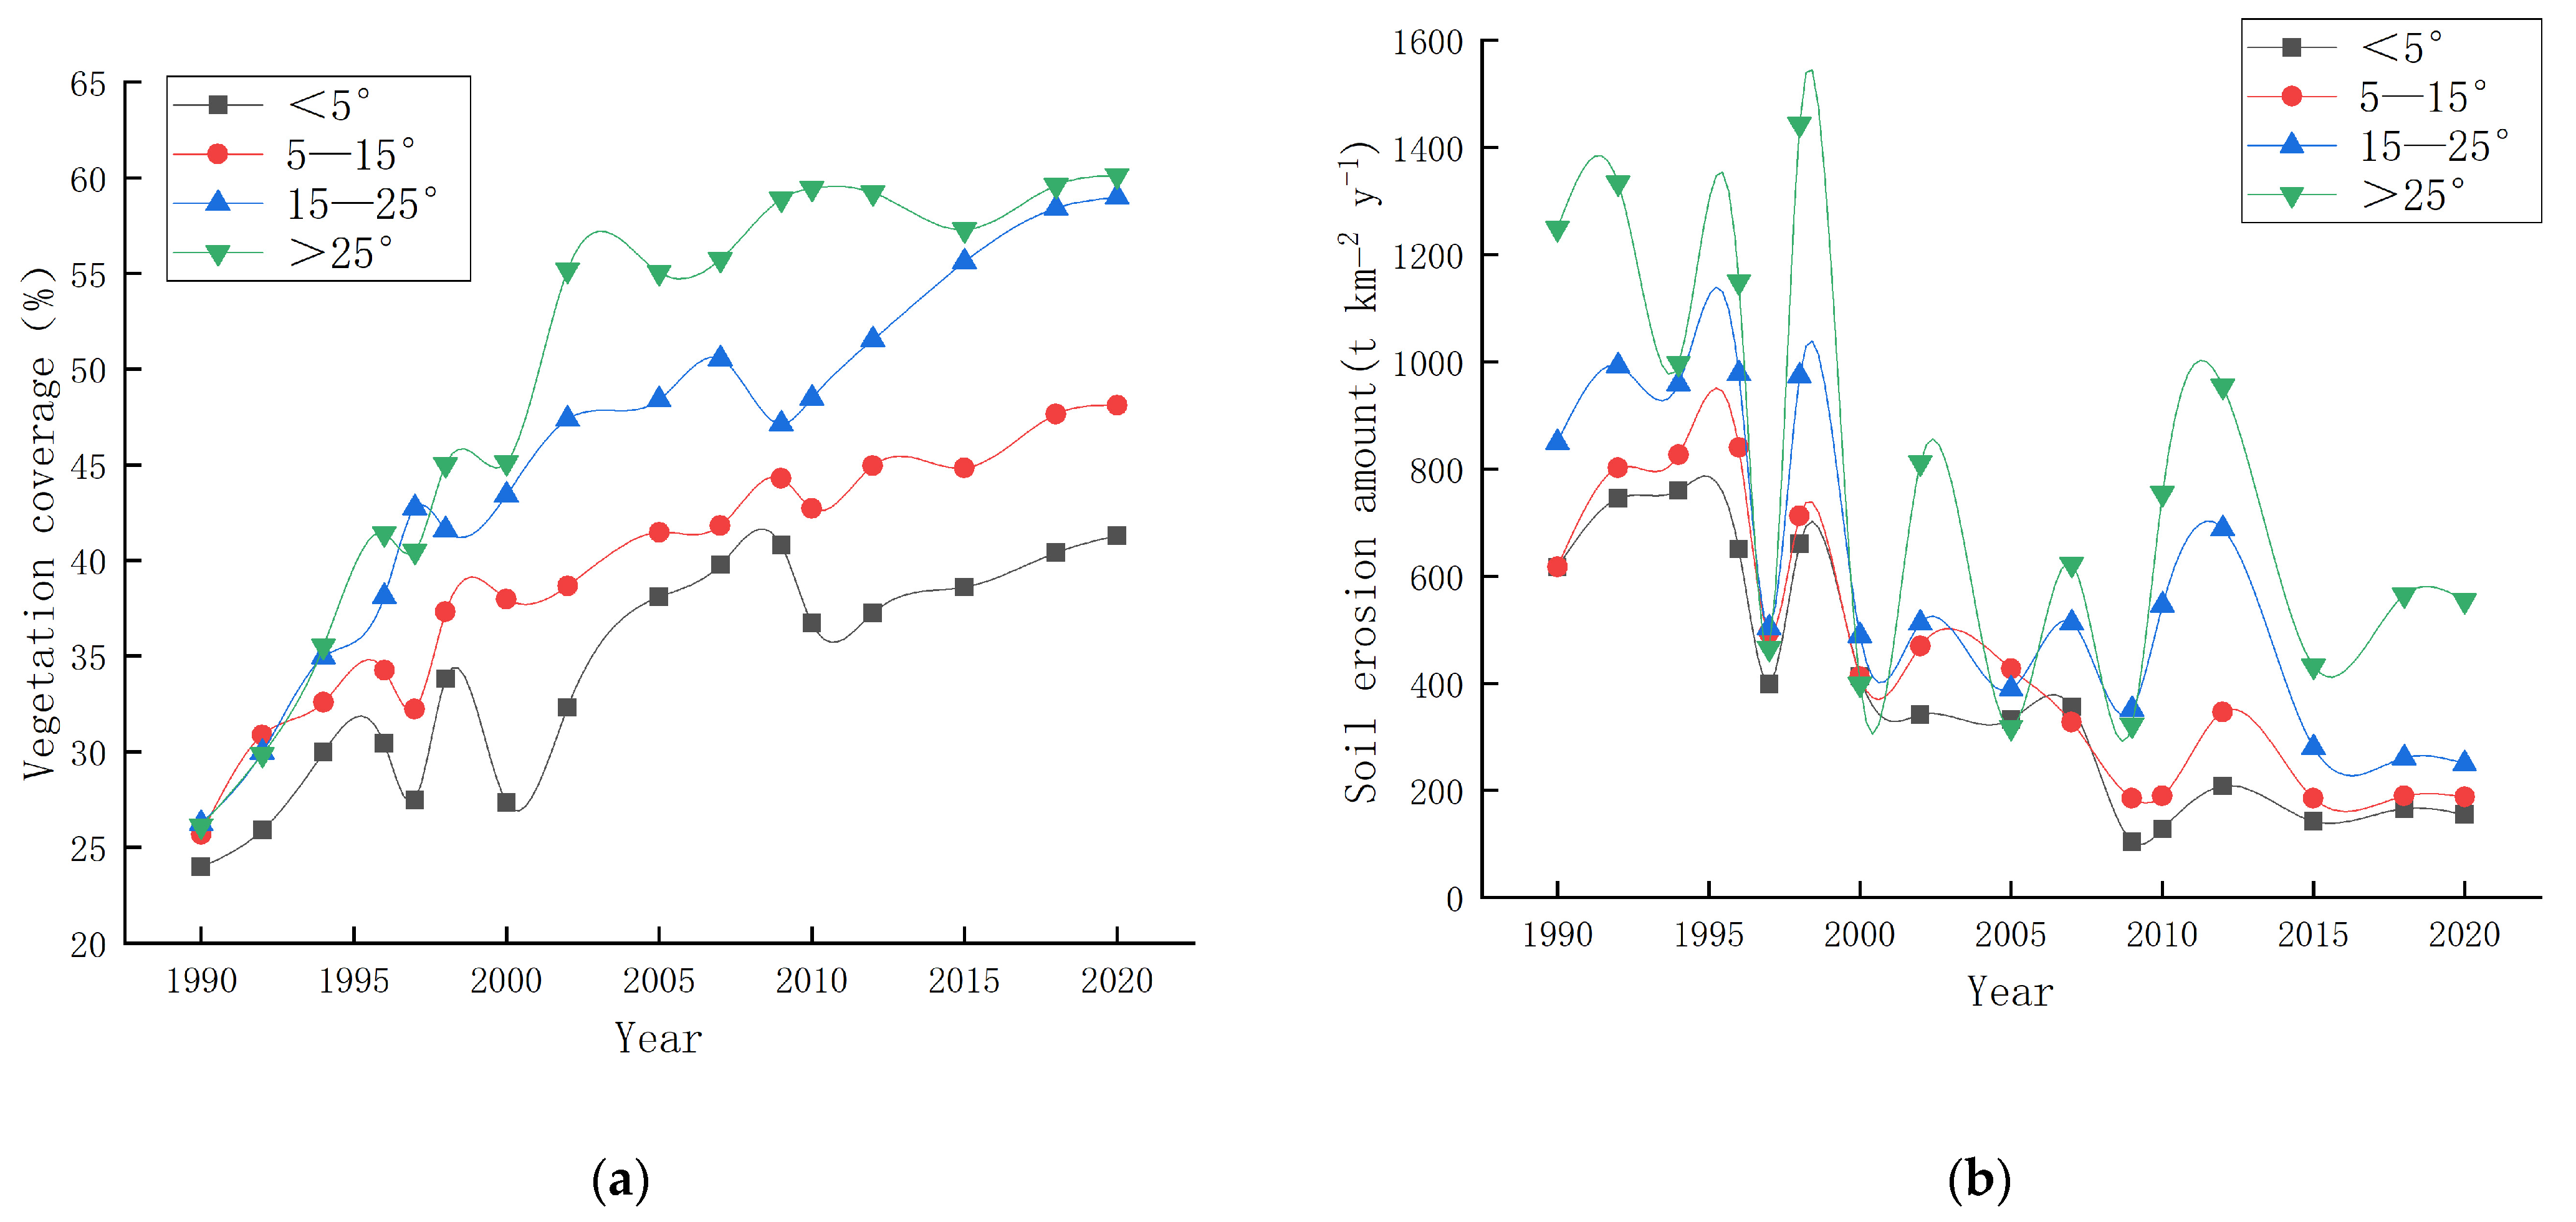
5.1. The Influence of Vegetation and Slope on Soil Erosion

The results of previous studies have demonstrated the temporal and spatial patterns of vegetation coverage and soil erosion in the study area. However, further data analysis is necessary to explore the interrelationships among vegetation, precipitation, topographic factors, and soil erosion. Figure 6a illustrates the variation in vegetation coverage over time under different slope conditions. While vegetation coverage increases over time for all slope conditions, it is less conducive to vegetation survival on steeper slopes exceeding 25 degrees, resulting in significantly lower vegetation coverage compared to gentler slopes. Figure 6b depicts the soil erosion volume under varying slope conditions, showing notably higher levels on slopes exceeding 25 degrees than on milder slopes. When examining the relationship between vegetation coverage and soil erosion volume under different slope conditions (Figure 6c), a U-shaped trend emerges as soil erosion decreases with increasing vegetation coverage when the slope is less than 15 degrees. Conversely, when the slope exceeds 15 degrees, there is an initial decrease in soil erosion.

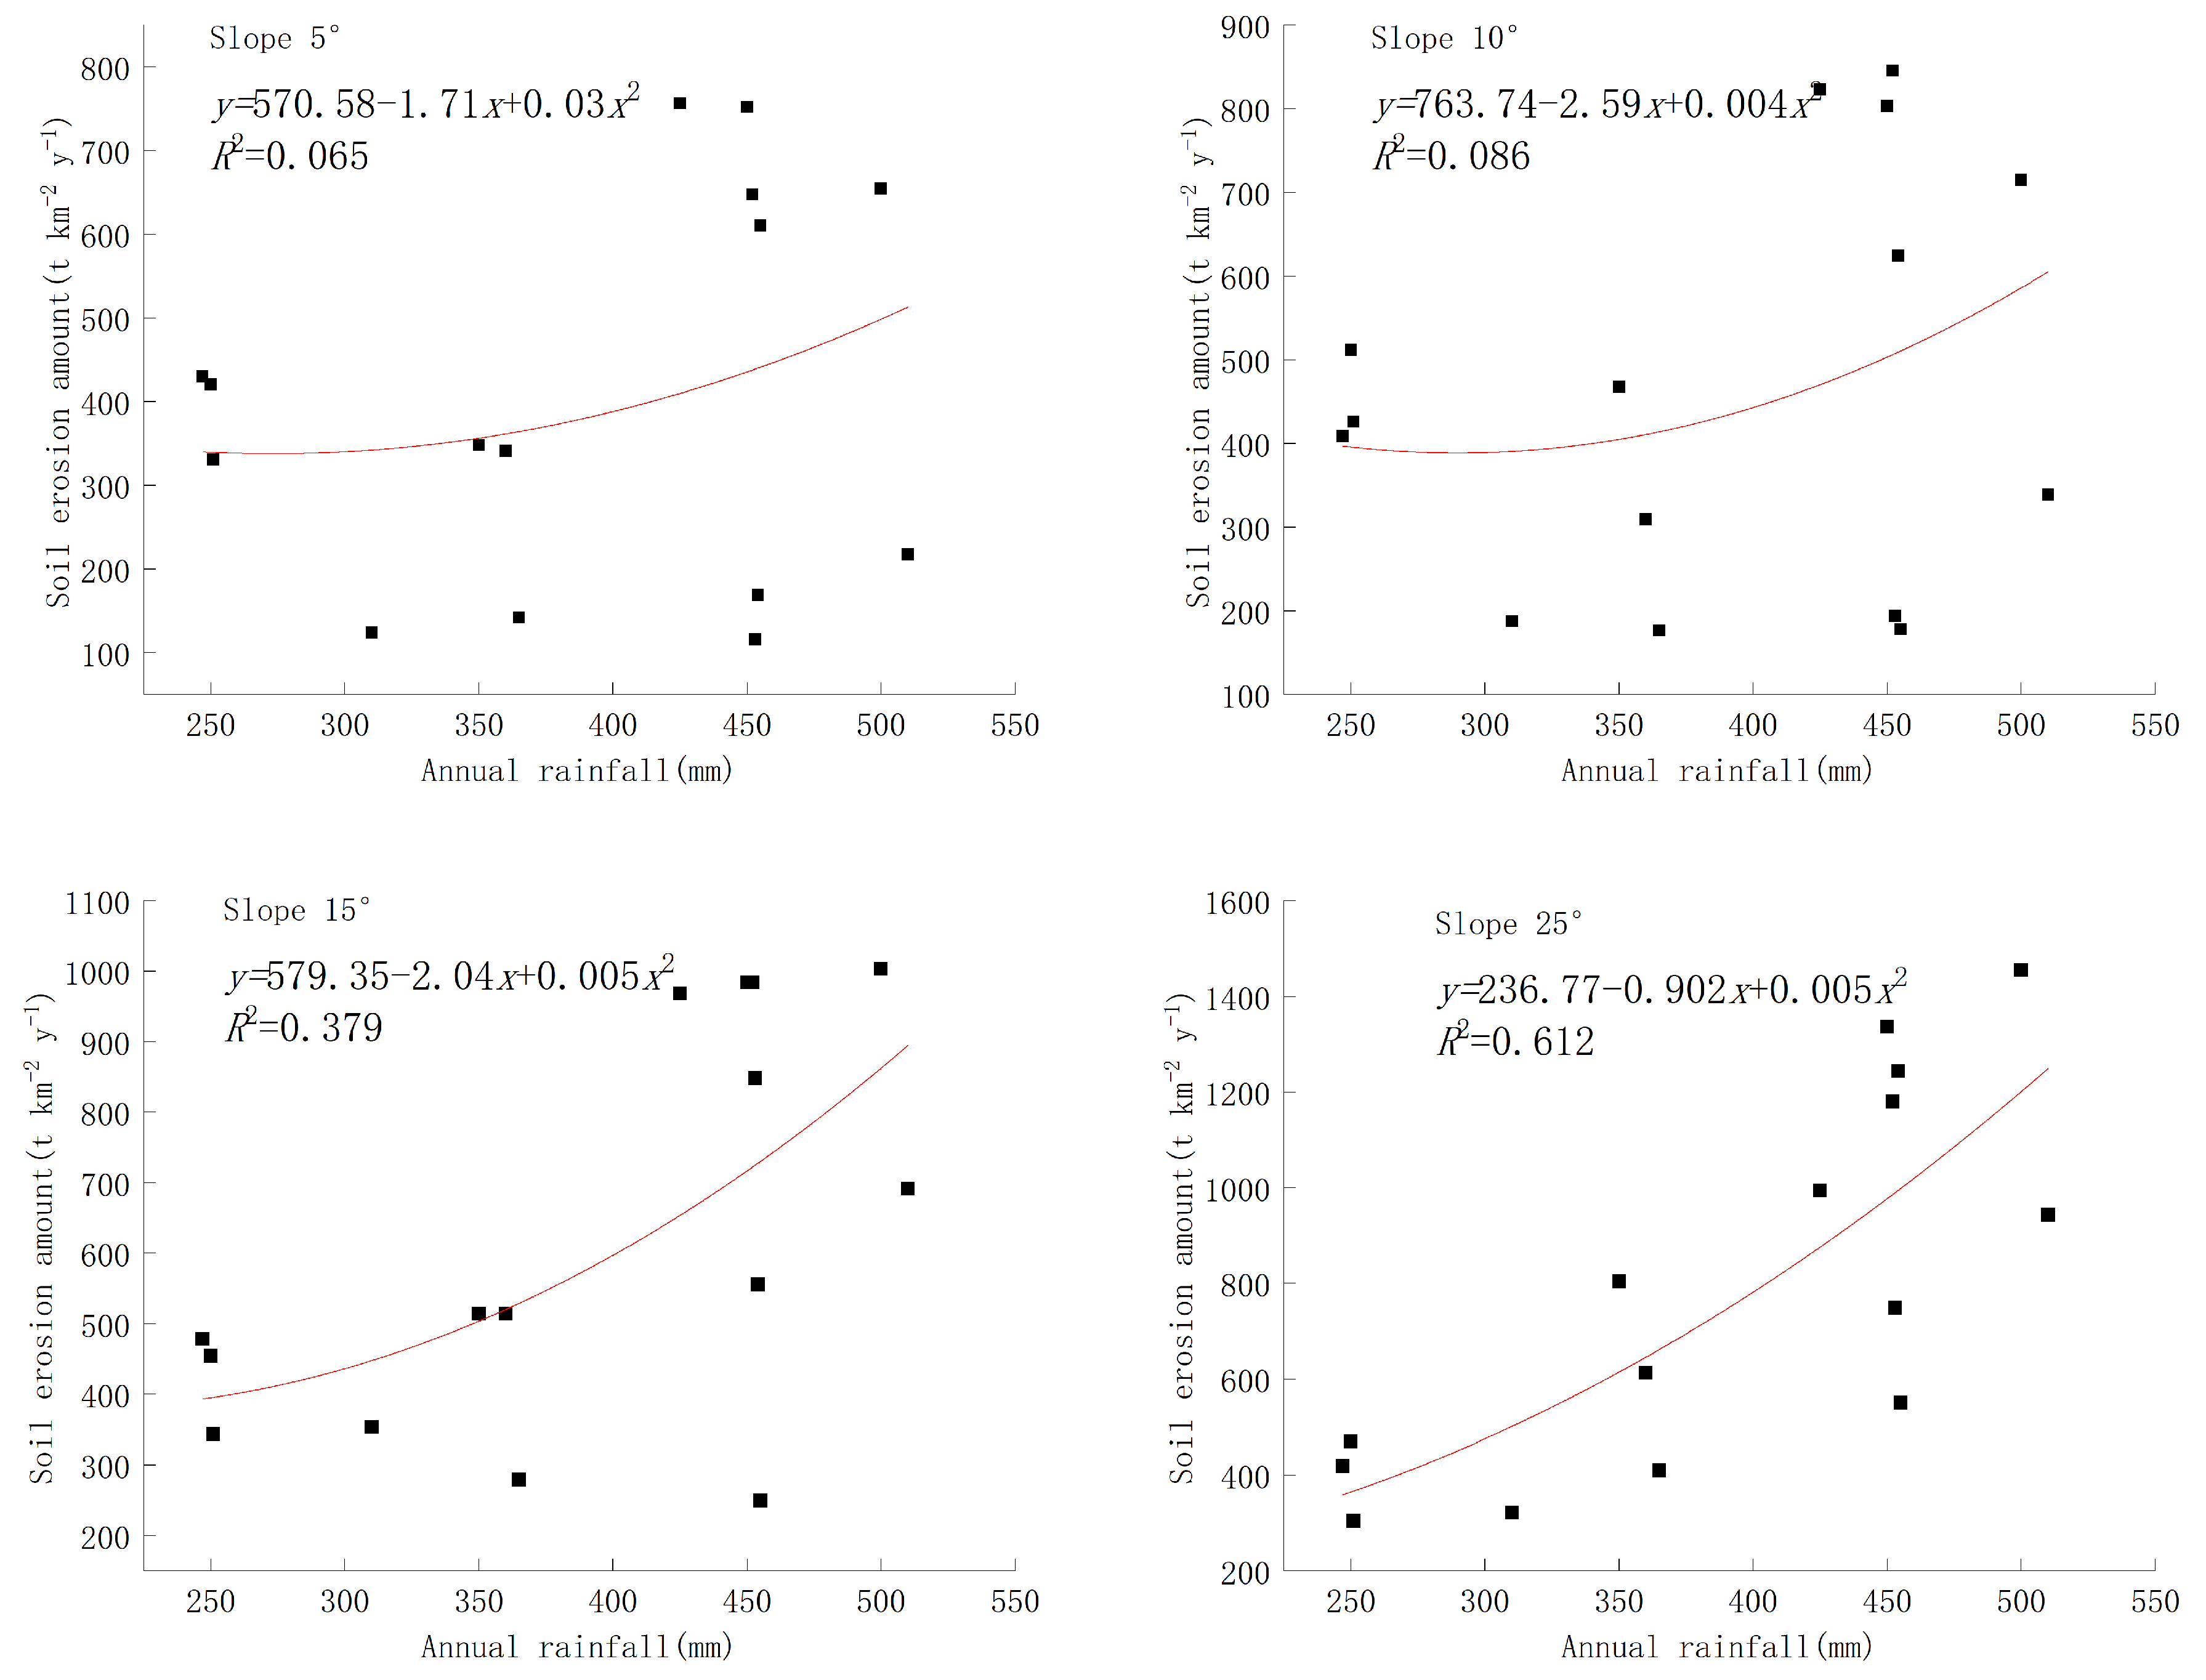
5.2. The Impact of Slope and Rainfall on Soil Erosion

Figure 7 illustrates the correlation between rainfall and soil erosion at varying degrees of slope. For slopes less than 15°, there is no discernible mathematical relationship between rainfall and soil erosion. Conversely, for slopes exceeding 15°, soil erosion escalates with increasing rainfall intensity. According to the data analysis, areas with milder slopes are more conducive to vegetation growth due to their gentler terrain. Consequently, in regions with gentle slopes (less than 15 degrees), the soil erosion volume exhibits minimal correlation with slope and is primarily influenced by vegetation cover. As the slope surpasses 15°, vegetation cover gradually diminishes, amplifying the impact of the slope on soil erosion. Therefore, establishing a relationship solely based on rainfall and soil erosion in the Loess Plateau area would be constrained by varying slopes and compromise the accuracy of the mathematical model.

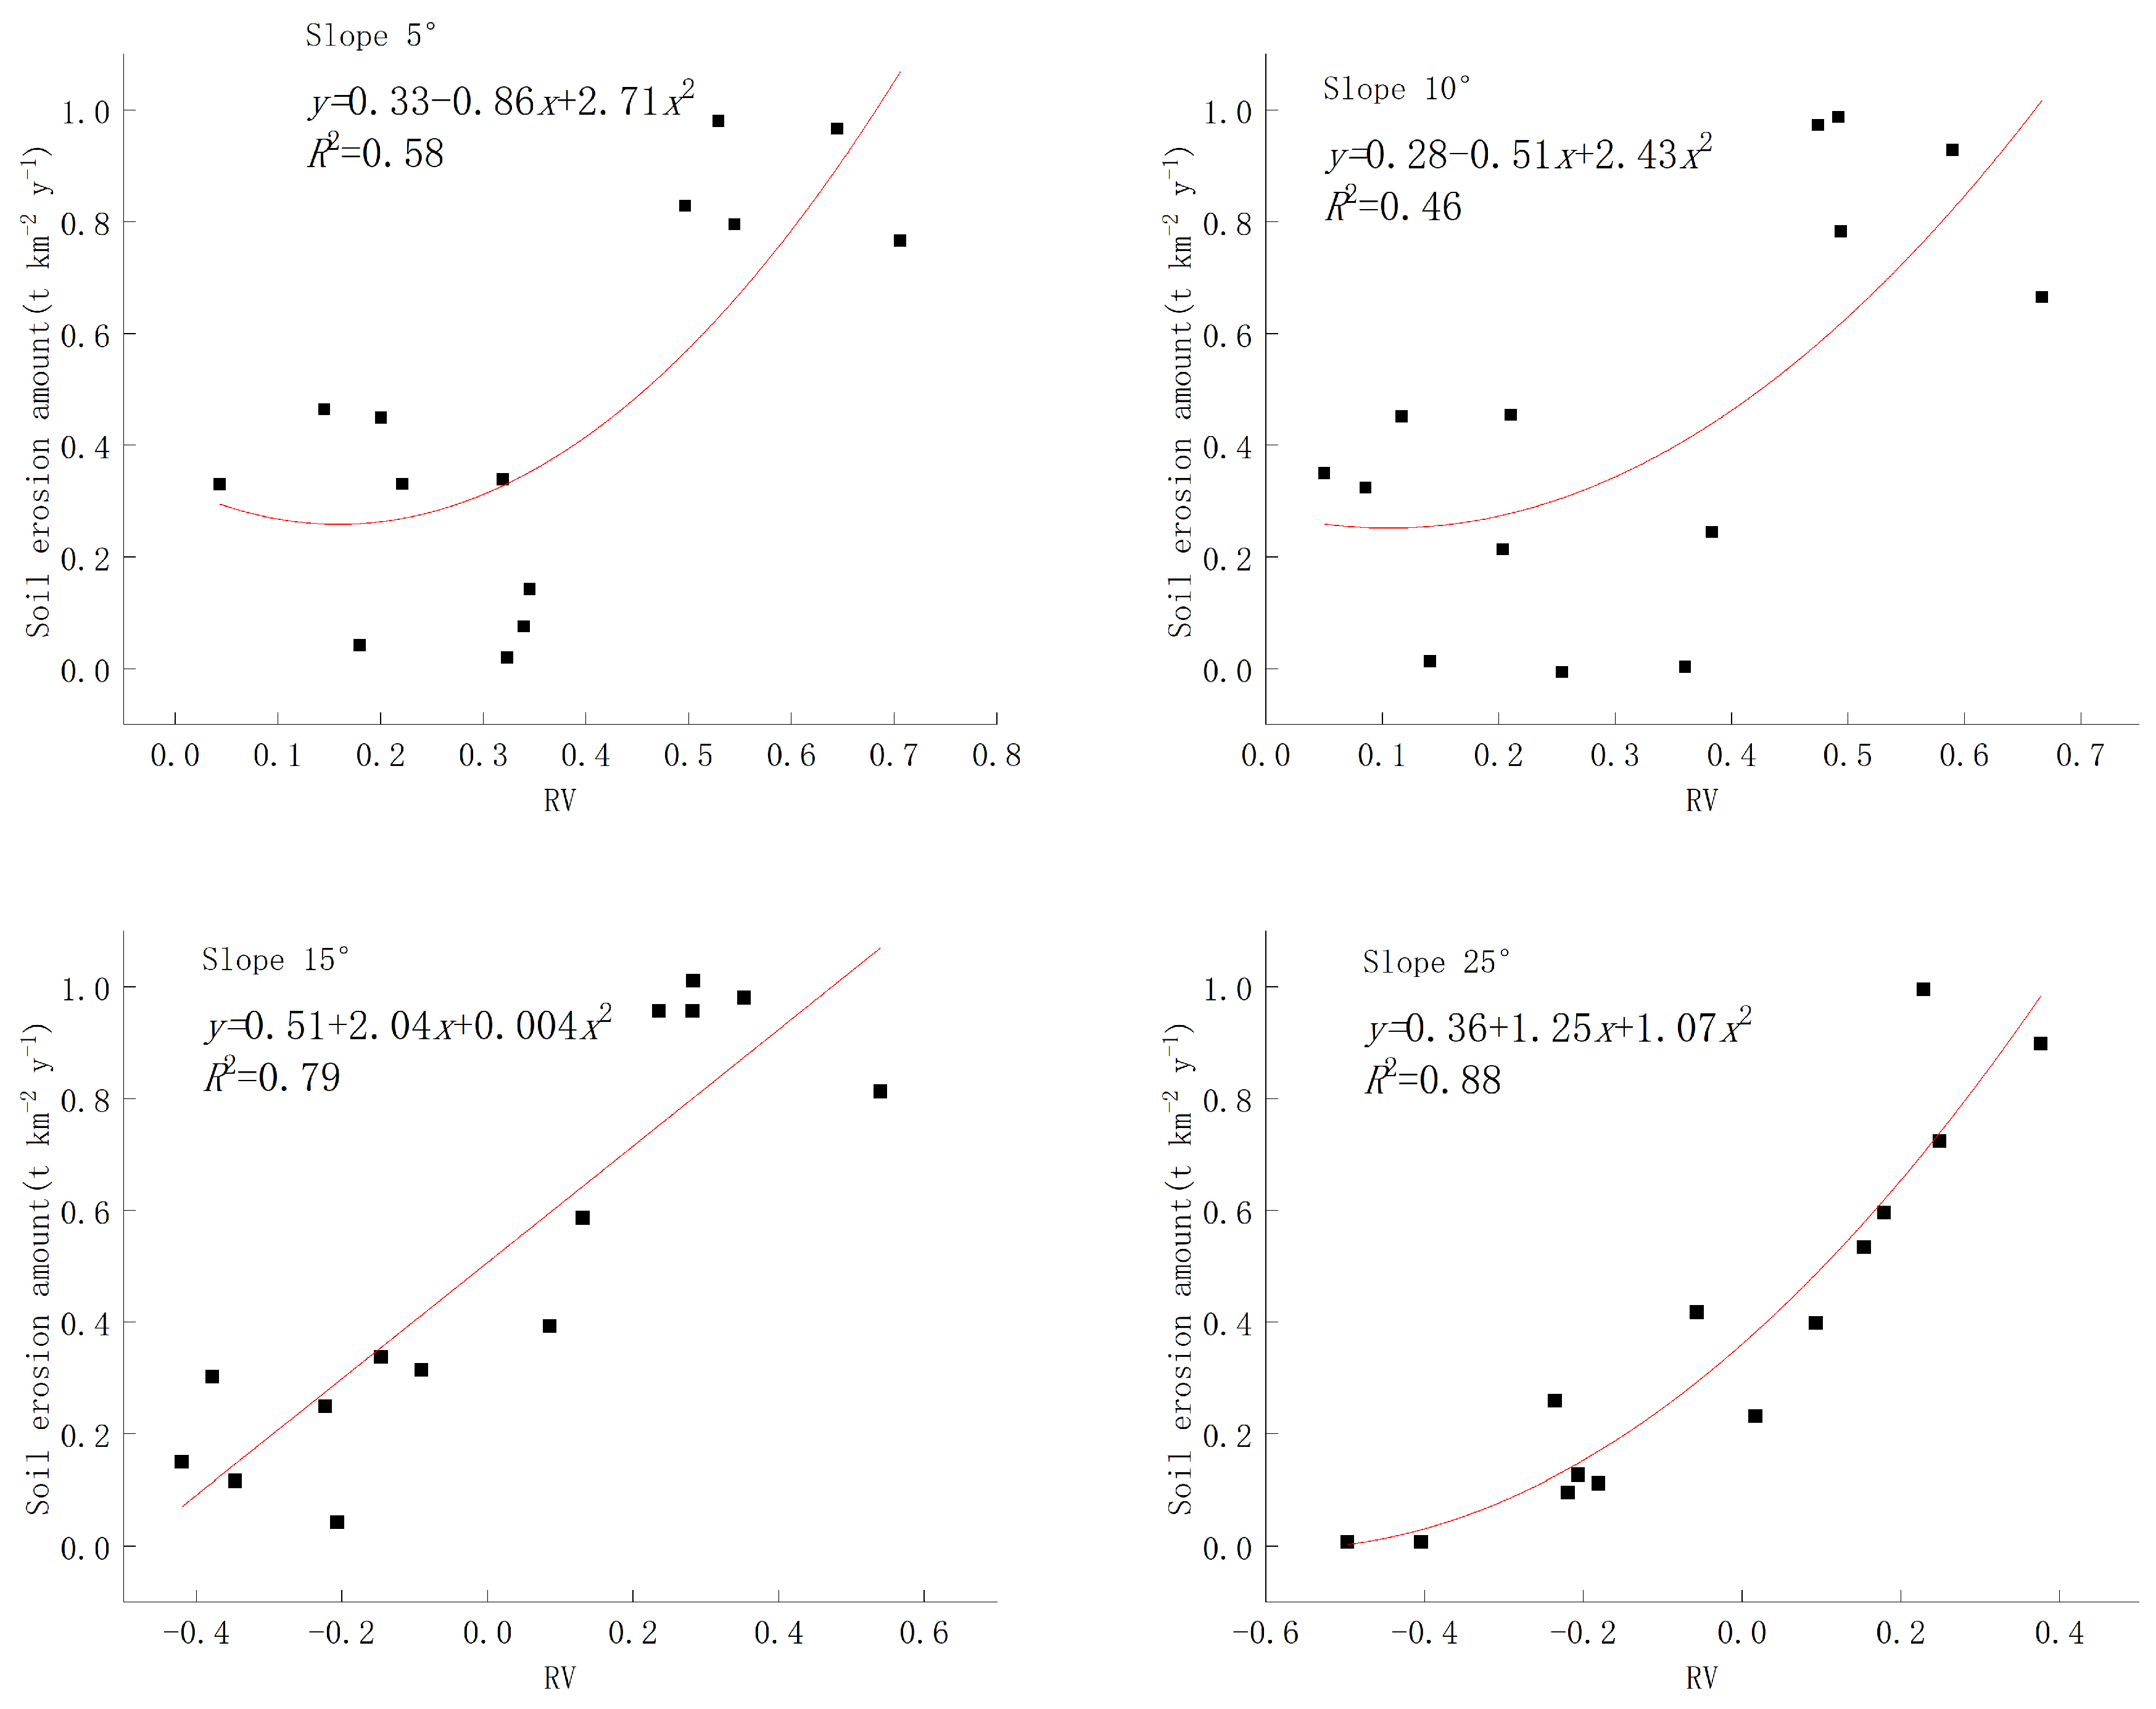
5.3. The Impact of Vegetation and Precipitation on Soil Erosion

Figure 8 illustrates the correlation between the composite index of rainfall–vegetation for different slopes and soil erosion. The functional relationship between the rainfall–vegetation index and soil erosion is well demonstrated for all four slopes, indicating that soil erosion increases with an increase in the RV index. However, it is noteworthy that for slopes with an inclination of less than 15 degrees, the variation in soil erosion amplitude remains relatively stable as a function of the RV index, suggesting a stronger influence of vegetation on soil erosion compared to rainfall. In contrast, for slopes exceeding 15 degrees, the curve steepens; when the slope exceeds 25 degrees, it approaches linearity. This observation suggests that on steep slopes, rainfall exerts a more pronounced impact on soil erosion than vegetation.

6. Discussion

China is among the regions most severely affected by soil erosion globally, and concurrently, it ranks as one of the nations with the highest investment in soil erosion control [40,41,42]. Over the past three decades, China has undertaken extensive and sustained efforts to establish artificial vegetation on the Loess Plateau. Previous research findings have demonstrated that since the initiation of the farmland-to-forestry policy in 1999, approximately 4.1 × 10⁶ ha of degraded land have been converted into forests, shrubs, and grasslands. This transformation has resulted in an annual reduction of 1.4 × 10⁹ m3 of runoff and a decrease of 3.6 × 10⁸ tons of sediment transport [43,44,45]. The study area is situated in the northern region of the Loess Plateau, where research outcomes also validate a significant increase in forested areas over the past three decades alongside a decline in bare land and wasteland. In conjunction with the policy factors identified within this study area, China’s Water Conservancy Department initiated large-scale sea buckthorn forest planting in 1991; a substantial reduction in sloped farmland occurred in 2000; ecological migration efforts commenced in 2008; and extensive restoration work was carried out on degraded grassland starting from 2010. These combined factors have led to alterations in land-use types and an augmentation of vegetation coverage within this study area [46]. Research findings also indicate a reduction in soil erosion within the Loess Plateau region, with rates decreasing from 1013 t·km−2·a in 1991–1995 to 595 t·km−2·a in 2011–2015. Most areas exhibit minor soil erosion, while high-intensity soil erosion is primarily concentrated in the northeastern hilly gully area [47]. Nevertheless, there are still localized instances of low-coverage areas and moderate or severe soil erosion areas, particularly on steep gully slopes where exposed bedrock impedes vegetation growth. While policies such as reforestation and ecological resettlement can effectively mitigate water erosion in the region, their impact is primarily observed in areas with gentle topography and human-induced water erosion. They are less effective in addressing water erosion resulting from geological and natural factors. Therefore, for future water erosion control efforts in the Pisha sandstone area, it is recommended to implement engineering measures such as slope cutting, netting, and the application of anti-erosion materials. From a policy perspective, farmers are encouraged to engage in moderate development activities in lightly eroded areas by cultivating economic forests, establishing grass fields, and creating grazing areas [48,49].
The RUSLE model is widely utilized globally; however, the input parameters of the RUSLE model necessitate field validation data. Consequently, in most instances, these parameters are estimated through alternative methods. For instance, Hakan proposed a novel approach to estimate the C factor based on his field validation data obtained from southern Turkey [50]. Othman conducted tests using remote-sensing techniques to evaluate multiple combinations of the RUSLE method [51]. Benaiche employed analytic hierarchy processes, fuzzy Boolean modeling, and an improved RUSLE for analysis purposes. Fallah introduced modifications by incorporating the snowmelt runoff erosion factor (SR) to enhance accuracy by modifying the R factor within the model [52]. The primary objective of this study is to establish a RUSLE model for the Pisha sandstone area, which integrates rainfall and vegetation index to assess the impact of the RUSLE model on soil erosion. The findings demonstrate that the model effectively simulates changes in soil erosion within the experimental area. However, despite yielding satisfactory simulation results, there are areas for improvement and enhancement in future research. The distinguishing characteristic of the Pasha sandstone area lies in its exposed bedrock and the spatially varied distribution of vegetation, both of which exert a significant influence on soil erosion. The study of Zhu et al. in the hematite sandstone area revealed three types of vegetation patterns—uniform, agglomerative, and random—depending on the slope gradient and exposed bedrock [53,54]. Consequently, under similar rainfall conditions, erosion is more likely to occur on steep slopes. This investigation established a correlation between the rainfall–vegetation index and soil erosion by utilizing the index’s applicability in red sandstone areas; however, it only considered four slope gradients. Subsequent studies should further refine the slope gradients and incorporate the influence of slope length and direction. Pal et al. emphasize that land use and mud barrages play crucial roles in soil erosion modeling. While this study successfully incorporates land-use change simulation, it fails to consider the influence of mud barrages [55]. Notably, from 1990 to 2010, both terrace areas and barrage numbers increased significantly within the study area; these data are essential for the accurate estimation of soil erosion and should be taken into account in subsequent studies. Furthermore, it is important to note that gully erosion, net sedimentary zones, and vertical wall areas are not accounted for by RUSLE methodology. Given that the Loess Plateau exhibits complex landforms with numerous gullies capable of carrying substantial sediment loads during extreme heavy rainfall events into rivers, it is imperative to acknowledge these limitations inherent in current models’ ability to estimate gully erosion.

7. Conclusions

This study focuses on the Pisha sandstone area of the upper and middle reaches of the Yellow River, analyzing the temporal evolution of vegetation coverage and land use in representative watersheds over the past three decades, while employing RUSLE to calculate soil erosion. A remarkable increase in forest and decrease in arable land from 1990 to 2020 were revealed in the study area. The area of low vegetation cover witnessed a significant decline of 59.29% in 2020 compared to that in 1990. The moderate erosion area decreased from 84.52 to 57.17 km2. The significant reduction in soil erosion can be attributed to the expansion of forest and grassland areas, with the implementation of the Grain for Green project being the primary policy factor driving the increase in forest and grassland areas. Additionally, we have developed a model for estimating soil erosion based on the rainfall–vegetation coupling index (RV) for varying slopes, and the observed and simulated amount of soil erosion showed consistent agreement, suggesting acceptable modeling results.
The research findings of this study demonstrate that the degree of soil and water erosion in most Pisha sandstone areas is effectively controlled at a moderate level. The primary focus for future soil and water conservation lies in managing ditch slopes and minimizing exposed bedrock areas. It is important to note that artificial vegetation alone cannot sufficiently mitigate soil and water loss in this region; thus, it is recommended to integrate engineering measures such as slope cutting and the application of anti-corrosive materials with vegetation-based approaches. From a policy perspective, farmers are encouraged to engage in sustainable development activities within lightly eroded zones by promoting economic afforestation, establishing grasslands, and creating pastoral areas.

Author Contributions

Data curation, Z.Y., J.G. and F.Q.; Funding acquisition, Z.Y.; Methodology, Z.Y., Y.L., X.W. and L.L.; Project administration, F.Q.; Validation, Z.Y., J.G. and X.L.; Writing—original draft, Z.Y. and J.G.; Writing—review and editing, Z.Y. All authors have read and agreed to the published version of the manuscript.

Funding

This research was supported by the National Key Research and Development Program of China (No. 2023YFF1305104), National Natural Science Foundation project (42307463), Open Project of the Key Laboratory of Soil and Water Conservation on Loess Plateau, Ministry of Water Resources (WSCLP202302), Inner Mongolia Autonomous Region Science and Technology Plan Project (2021GG0052), Inner Mongolia Autonomous Region “Science and Technology to Prosper Mongolia” Action Key Project (2022EEDSKJXM003), and the Ordos City Science and Technology Plan Project “Research on Intelligent Soil and Water Conservation Technology in the Typical Watershed of the Pisha Sandstone Area in the Upper Reaches of Kuye River”.

Institutional Review Board Statement

Not applicable.

Informed Consent Statement

Not applicable.

Data Availability Statement

The original contributions presented in the study are included in the article, further inquiries can be directed to the corresponding author.

Conflicts of Interest

The authors declare no conflict of interest.

References

  1. Wang, T. Soil Erosion Is Influenced by Grain for Green Policy in Loess Plateau Area of Northern Shaanxi, China. Int. J. Environ. Prot. Policy 2015, 3, 129–136. [Google Scholar] [CrossRef]
  2. Xu, F.; Li, Y. The Evaluation Indexes System of Comprehensive Effect of the Project of Returning Grazing Land to No Grazing Land and a Case Study. Chin. J. Grassl. 2008. [Google Scholar] [CrossRef]
  3. Zhang, X.; Zhang, L.; Zhao, J.; Rustomji, P.; Hairsine, P. Responses of streamflow to changes in climate and land use/cover in the Loess Plateau, China. Water Resour. Res. 2008, 44. [Google Scholar] [CrossRef]
  4. Bai, X.; Jia, X.; Zhao, C.; Shao, M.A. Artificial forest conversion into grassland alleviates deep-soil desiccation in typical grass zone on China’s Loess Plateau: Regional modeling. Agric. Ecosyst. Environ. 2021, 320, 107608. [Google Scholar] [CrossRef]
  5. Zhou, Z.; Shangguan, Z.; Zhao, D. Modeling Vegetation Coverage and Soil Erosion in the Loess Plateau Area of China. Ecol. Model. 2006, 198, 263–268. [Google Scholar] [CrossRef]
  6. Ito, A. Simulated impacts of climate and land-cover change on soil erosion and implication for the carbon cycle, 1901 to 2100. Geophys. Res. Lett. 2007, 34. [Google Scholar] [CrossRef]
  7. Yang, Z.; Qin, F.; Yu, X.; Li, Y.; Ren, X. Relationship between Soil Particle Size and Fractal Dimension under Different Forests of a Small Watershed in the Feldspathic Sandstone Region. Chin. J. Soil Sci. 2019, 50, 829–832. [Google Scholar]
  8. Yang, Z.; Qin, F.; Zhang, X.; Li, X.; Niu, X.; Liu, L. Environmental interpretation of herb species diversity under different site types of Hippophae rhamnoides forest in feldspathic sandstone region. Acta Ecol. Sin. 2018, 38, 5132–5140. [Google Scholar] [CrossRef]
  9. Wang, F.; Mu, X.; Li, R.; Fleskens, L.; Stringer, L.C.; Ritsema, C.J. Co-evolution of soil and water conservation policy and human–environment linkages in the Yellow River Basin since 1949. Sci. Total. Environ. 2015, 508, 166–177. [Google Scholar] [CrossRef]
  10. Wischmeier, W.H.; Smith, D.D. Predictiing Rainfall Erosion Losses, a Guide to Conservation Planning; U.S. Department of Agriculture, Agriculture. Handbook No. 537; US Government Publishing Office: Washington, DC, USA, 1978.
  11. Thapa, P. Spatial Estimation of Soil Erosion Using RUSLE Modeling: A case study of Dolakha District, Nepal. Environ. Res. 2020, 9, 15. [Google Scholar] [CrossRef]
  12. Aiello, A.; Adamo, M.; Canora, F. Remote sensing and GIS to assess soil erosion with RUSLE3D and USPED at river basin scale in southern Italy. CATENA 2015, 131, 174–185. [Google Scholar] [CrossRef]
  13. Galdino, S.; Sano, E.E.; Andrade, R.G.; Grego, C.R.; Nogueira, S.F.; Bragantini, C.; Flosi, A.H.G. Large-scale Modeling of Soil Erosion with RUSLE for Conservationist Planning of Degraded Cultivated Brazilian Pastures. Land Degrad. Dev. 2016, 27, 773–784. [Google Scholar] [CrossRef]
  14. Tang, Q.; Xu, Y.; Bennett, S.J.; Li, Y. Assessment of soil erosion using RUSLE and GIS: A case study of the Yangou watershed in the Loess Plateau, China. Environ. Earth Sci. 2015, 73, 1715–1724. [Google Scholar] [CrossRef]
  15. Qin, W.; Guo, Q.; Cao, W.; Yin, Z.; Yan, Q.; Shan, Z.; Zheng, F. A new RUSLE slope length factor and its application to soil erosion assessment in a Loess Plateau watershed. Soil Tillage Res. 2018, 182, 10–24. [Google Scholar] [CrossRef]
  16. Xu, Z.; Zhang, S.; Zhou, Y.; Hou, X.; Yang, X. Characteristics of watershed dynamic sediment delivery based on improved RUSLE model. CATENA 2022, 219, 106602. [Google Scholar] [CrossRef]
  17. Streeter, R.T.C.N.A. Assessing spatial patterns of soil erosion in a high-latitude rangeland. Land Degrad. Dev. 2020, 31, 2003–2018. [Google Scholar] [CrossRef]
  18. Mokrech, M.; Drake, N.; Wainwright, J. Uncertainty modelling and error propagation in a spatial soil-erosion model. Hydrol. Process. 2010, 527–534. [Google Scholar]
  19. Bonilla, C.A.; Norman, J.M.; Molling, C.C. Water Erosion Estimation in Topographically Complex Landscapes: Model Description and First Verifications. Soil Sci. Soc. Am. J. 2007, 71, 1524–1537. [Google Scholar] [CrossRef]
  20. Huo, J.; Yu, X.; Liu, C.; Chen, L.; Zheng, W.; Yang, Y.; Tang, Z. Effects of soil and water conservation man-agement and rainfall types on runoff and soil loss for a sloping area in North China. Land Degrad. Dev. 2020, 31, 2117–2130. [Google Scholar] [CrossRef]
  21. Petlušová, V.; Hreško, J.; Mederly, P.; Moravčík, M.; Petluš, P. Spatial distribution of soil depth in relation to slope as a consequence of erosion-accumulation processes in loess lowland hills of Slovakia. Folia Oecologica 2024, 51, 196–207. [Google Scholar] [CrossRef]
  22. ur Rehman, Z.; Khalid, U.; Ijaz, N.; Mujtaba, H.; Haider, A.; Farooq, K.; Ijaz, Z. Machine learning-based intelligent modeling of hydraulic conductivity of sandy soils considering a wide range of grain sizes. Eng. Geol. 2022, 311, 106899. [Google Scholar] [CrossRef]
  23. Ijaz, N.; Ye, W.; ur Rehman, Z.; Dai, F.; Ijaz, Z. Numerical study on stability of lignosulphonate-based stabilized surficial layer of unsaturated expansive soil slope considering hydro-mechanical effect. Transp. Geotech. 2022, 32, 100697. [Google Scholar] [CrossRef]
  24. Tian, P.; Zhao, G.; Mu, X.M.; Wen, Z.; Wang, F. A modified RUSLE model to estimate sediment yield in the Huangfuchuan watershed. Resour. Sci. 2015, 37, 832–840. [Google Scholar]
  25. Zhou, P.; Meng, J.J. The Temporal and Spatial Variability Relationship of Soil Water Erosion and Land Use Type in 0rdos during the Period of 1988–2000. J. Nat. Resour. 2009, 24, 1706–1717. [Google Scholar]
  26. Wang, Z.L.; Li, Z.H.; Ma, Z.; Zhi, Y.B.; Zhang, B.W.; An, S.Q. Area division of sensitivity to water-caused soil loss in ecologically functioning areas of Dongshenq, Erdos. Acta Ecol. Sin. 2009, 29, 484–491. [Google Scholar]
  27. Shirazi, M.A.; Boersma, L. A unifying quantitative analysis of soil texture. Soil Sci. Soc. Am. J. 1984, 48, 142–147. [Google Scholar] [CrossRef]
  28. Shi, P.; Liu, B.; Zhang, K.; Iin, Z.P. Study on soil erosion process and model. Resour. Sci. 1999, 21, 11–20. [Google Scholar]
  29. Liu, B.Y.; Nearing, M.A.; Risse, L.M. SIope gradient effects on sotep sIopes. Trans. ASAE 1994, 37, 1835–1840. [Google Scholar] [CrossRef]
  30. Wang, Y.; Kong, X.; Zhao, C.; Yao, G.; Guo, K. Analysis of the Spatial-Temporal Pattern Change of Vegetation Coverage on the Loess Plateau from 2000 to 2020. J. Soil Water Conserv. 2022, 36, 130–137. [Google Scholar]
  31. Demirci, A.; Karaburun, A. Estimation of soil erosion using RUSLE in a GIS framework: A case study in the Buyukcekmece Lake watershed, northwest Turkey. Environ. Earth Sci. 2011, 66, 903–913. [Google Scholar] [CrossRef]
  32. Hall SI190-2007; Soil Erosion Classification and Grading Standards. Ministry of Water Resources of the People’s Republic of China: Beijing, China; China Water Resources and Hydropower Press: Beijing, China, 2008.
  33. Zhang, X.; Qin, F. Coupling relationship of precipitation and vegetation and its influence for sediment vield in Pisha sandstone area. Geogr. Res. 2016, 35, 513–524. [Google Scholar]
  34. Li, G.; Sun, S.; Han, J.; Yan, J.; Liu, W.; Wei, Y.; Lu, N.; Sun, Y. Impacts of Chinese Grain for Green program and climate change on vegetation in the Loess Plateau during 1982–2015. Sci. Total Environ. 2019, 660, 177–187. [Google Scholar] [CrossRef]
  35. Shi, S.; Yu, J.; Wang, F.; Wang, P.; Zhang, Y.; Jin, K. Quantitative contributions of climate change and human activities to vegetation changes over multiple time scales on the Loess Plateau. Sci. Total. Environ. 2020, 755, 142419. [Google Scholar] [CrossRef]
  36. He, L.; Guo, J.; Zhang, X.; Liu, B.; Guzmán, G.; Gómeza, J.A. Vegetation restoration dominated the attenuated soil loss rate on the Loess Plateau, China over the last 50 years. CATENA 2023, 228, 107149. [Google Scholar] [CrossRef]
  37. Yang, K.; Liu, C. Evaluation of land-use change effects on runoff and soil erosion of a hilly basin the Yanhe River in the Chinese Loess Plateau. Land Degrad. Dev. 2018, 29, 1211–1221. [Google Scholar] [CrossRef]
  38. Wang, Z.-J.; Jiao, J.-Y.; Rayburg, S.; Wang, Q.-L.; Su, Y. Soil erosion resistance of “Grain for Green” vegetation types under extreme rainfall conditions on the Loess Plateau, China. CATENA 2016, 141, 109–116. [Google Scholar] [CrossRef]
  39. Kou, M.; Jiao, J.; Yin, Q.; Wang, N.; Wang, Z.; Li, Y.; Yu, W.; Wei, Y.; Yan, F.; Cao, B. Successional Trajectory Over 10 Years of Vegetation Restoration of Abandoned Slope Croplands in the Hill-Gully Region of the Loess Plateau. Land Degrad. Dev. 2014, 27, 919–932. [Google Scholar] [CrossRef]
  40. Xia, X.L.C. Dynamic changes in soil erosion risk and its driving mechanism: A case study in the Loess Plateau of China. Eur. J. Soil Sci. 2021, 72, 1312–1331. [Google Scholar] [CrossRef]
  41. Zhao, G.; Mu, X.; Han, M.; An, Z.; Gao, P.; Sun, W.; Xu, W. Sediment yield and sources in dam-controlled watersheds on the northern Loess Plateau. Catena 2017, 149, 110–119. [Google Scholar] [CrossRef]
  42. Cheng, P.; Wu, L.; Zhang, H.; Zhou, J. Inclusion of root water absorption and reinforcement in upper bound limit stability analysis of vegetated slopes. Comput. Geotech. 2024, 169, 106227. [Google Scholar] [CrossRef]
  43. Bai, R.; Wang, X.; Li, J.; Yang, F.; Shangguan, Z.; Deng, L. The impact of vegetation reconstruction on soil erosion in the Loess plateau. J. Environ. Manag. 2024, 363, 121382. [Google Scholar] [CrossRef]
  44. Zhang, K.; Li, Y.; Yu, Z.; Yang, T.; Xu, J.; Chao, L.; Ni, J.; Wang, L. Xin’anjiang Nested Experimental Watershed (XAJ-NEW) for Understanding Multiscale Water Cycle: Scientific Objectives and Experimental Design. Engineering 2022, 18, 207–217. [Google Scholar] [CrossRef]
  45. Zhao, Y.; Li, J.; Li, P. The Precipitation-Recycling Process Enhanced Extreme Precipitation in Xinjiang, Chi-na. Geophys. Res. Lett. 2022, 50, e2023GL104324. [Google Scholar]
  46. Li, Y.; Xie, Z.; Qin, Y.; Sun, Y. Temporal-Spatial Variation Characteristics of Soil Erosion in the Pisha Sandstone Area, Loess Plateau, China. Pol. J. Environ. Stud. 2019, 28, 2205–2214. [Google Scholar] [CrossRef]
  47. Jin, F.; Yang, W.; Fu, J.; Li, Z. Effects of vegetation and climate on the changes of soil erosion in the Loess Plateau of China. Sci. Total. Environ. 2021, 773, 145514. [Google Scholar] [CrossRef]
  48. Shen, X.; Bai, X.; Zhao, C.; Tan, Q.; Luo, G.; Li, C.; Ran, C.; Zhang, S.; Xiong, L.; Liao, J.; et al. Global response of soil biodiversity to climate and land use changes. J. Clean. Prod. 2024, 471, 143381. [Google Scholar] [CrossRef]
  49. Mahmood, K.; Kim, J.M.; Ashraf, M. The effect of soil type on matric suction and stability of unsaturated slope under uniform rainfall. KSCE J. Civ. Eng. 2016, 20, 1294–1299. [Google Scholar] [CrossRef]
  50. Tanyaş, H.; Kolat, Ç.; Süzen, M.L. A new approach to estimate cover-management factor of RUSLE and validation of RUSLE model in the watershed of Kartalkaya Dam. J. Hydrol. 2015, 528, 584–598. [Google Scholar] [CrossRef]
  51. Othman, A.A.; Ali, S.S.; Scheytt, T. Comparison between multi RUSLE-SDR models for estimation of reservoir sedimentation: A case study of Dokan Lake Basin, Iraq–Iran. Environ. Earth Sci. 2024, 83, 1–20. [Google Scholar] [CrossRef]
  52. Benaiche, M.; Mokhtari, E.; Engel, A.B. Identification of soil erosion-susceptible areas using revised universal soil loss equation, analytical hierarchy process and the fuzzy logic approach in sub-watersheds Boussellam and K’sob Algeria. Environ. Earth Sci. 2024, 83, 34.1–34.17. [Google Scholar] [CrossRef]
  53. Zhu, Z.; Li, L.; Zhang, S.; Zhang, P.; Ren, Y.; Zhang, Y. Dynamic simulation study of soil erosion intensity on slopes with different vegetation patterns in pisha sandstone area. Ecol. Model. 2024, 491, 110665. [Google Scholar] [CrossRef]
  54. Mahgoub, M.; Elalfy, E.; Soussa, H.; Abdelmonem, Y. Relation between the soil erosion cover management factor and vegetation index in semi-arid basins. Environ. Earth Sci. 2024, 83, 1–13. [Google Scholar] [CrossRef]
  55. Pal, D.; Galelli, S.; Tang, H.; Ran, Q. Toward improved design of check dam systems: A case study in the Loess Plateau, China. J. Hydrol. 2018, 559, 762–773. [Google Scholar] [CrossRef]
Figure 1. Geographical location of the study site.
Sustainability 16 09313 g001
Figure 2. The field for monitoring soil and water loss in Ordos City.
Sustainability 16 09313 g002
Figure 3. Interannual change characteristics of ground utilization form in the study area from 1990 to 2020.
Sustainability 16 09313 g003
Figure 4. Spatial distribution map of VC in the watershed.
Sustainability 16 09313 g004
Figure 5. Spatial distribution map of the hydraulic erosion modulus.
Sustainability 16 09313 g005
Figure 6. Relationship between vegetation coverage and soil erosion under different slopes. (a) The vegetation coverage of various slopes from 1990 to 2020. (b) The soil erosion amount of various slopes from 1990 to 2020. (c) The correlation between vegetation coverage and soil erosion under varying slope conditions.
Sustainability 16 09313 g006aSustainability 16 09313 g006b
Figure 7. Relationship between annual rainfall and soil erosion at different gradients.
Sustainability 16 09313 g007
Figure 8. Relationship between RV and soil erosion at different gradients.
Sustainability 16 09313 g008
Table 1. Classification proportion of vegetation coverage in the study area from 1990 to 2020.
Erosion Intensity1990
Proportion
1995
Proportion
2000
Proportion
2005
Proportion
2010
Proportion
2015
Proportion
2020
Proportion
Bare land42.74 38.10 27.42 26.68 26.76 25.96 22.13
Low coverage87.93 83.09 53.44 48.09 60.13 56.70 41.06
Medium-low coverage19.19 22.28 26.33 28.96 26.94 27.89 30.13
Medium coverage22.72 25.60 40.13 42.67 37.31 41.30 51.10
High coverage51.64 55.15 76.90 77.81 73.08 72.38 79.80
Table 2. Classification proportion of soil erosion intensity in the study area from 1990 to 2020.
Erosion Intensity1990
Proportion
1995
Proportion
2000
Proportion
2005
Proportion
2010
Proportion
2015
Proportion
2020
Proportion
Low erosion40.02 59.90 62.92 64.90 72.12 78.12 80.77
Slight erosion44.09 58.48 63.13 74.43 86.36 84.23 84.61
Moderate erosion84.52 74.00 70.99 66.44 62.31 58.44 57.17
High erosion54.99 30.37 26.43 18.45 3.13 3.13 1.64
Severe erosion0.60 1.47 0.75 0.01 0.30 0.30 0.03
Disclaimer/Publisher’s Note: The statements, opinions and data contained in all publications are solely those of the individual author(s) and contributor(s) and not of MDPI and/or the editor(s). MDPI and/or the editor(s) disclaim responsibility for any injury to people or property resulting from any ideas, methods, instructions or products referred to in the content.

