Article

Mechanical Properties and DEM-Based Simulation of Double-Fractured Sandstone Under Cyclic Loading and Unloading

1
School of Civil Engineering and Architecture, Anhui University of Science and Technology, Huainan 232001, China
2
State Key Laboratory for Fine Exploration and Intelligent Development of Coal Resources, China University of Mining and Technology, Xuzhou 221116, China
*
Author to whom correspondence should be addressed.
Sustainability 2024, 16(20), 9000; https://doi.org/10.3390/su16209000
Submission received: 23 September 2024 / Revised: 13 October 2024 / Accepted: 14 October 2024 / Published: 17 October 2024
(This article belongs to the Section Sustainable Engineering and Science)

Abstract

In response to the challenges posed by long-term cyclic loading and unloading in underground rock engineering, this study systematically investigates the macro- and meso-mechanical response mechanisms of fractured rock masses under cyclic loading conditions. We performed graded cyclic loading–unloading tests on parallel double-fractured sandstone samples with varying spatial distribution configurations. These tests were integrated with digital image correlation (DIC) technology, fractal dimension analysis, and discrete element method (DEM) numerical simulations to analyze the mechanical properties, deformation characteristics, crack propagation features, and meso-fracture mechanisms of the fractured rock masses. The findings indicate that the diverse spatial distribution characteristics of the double fractures exert a significant influence on the loading–unloading processes, surface deformation fields, and fracture states of the rock. Cyclic loading leads to an increase in the fractal dimension of the fractured samples, resulting in more intricate and chaotic crack propagation patterns. Furthermore, DEM simulations reveal the impact of fracture spatial configurations on the force chain distribution within the rock bridges. The equivalent stress nephogram effectively represents the stress field distribution. This offers valuable insights for predicting meso-fracture trends in rocks. This paper comprehensively integrates both experimental and numerical simulation methodologies to deliver a thorough analysis of the complex mechanical behavior of fractured rock masses under cyclic loading conditions, with direct relevance to engineering applications such as mine excavation and slope stabilization.

1. Introduction

In recent years, there has been a notable increase in the mining intensity associated with large mining heights and extra-thick coal seams, which has been accompanied by a corresponding rise in overall mining activity [1]. This trend induces movements within the rock mass and alters the stress and fracture fields of the strata. Fractures, as weak planes within the rock mass, are susceptible to damage under external loads, including those caused by transportation, mechanical vibrations, blasting, seismic waves, and mining disturbances [2]. Such damage causes complex phenomena, including reduced strength, increased deformation, and crack propagation. These phenomena may further precipitate engineering accidents, such as collapses in coal mines and instability in the surrounding rocks of roadways. As a result, numerous researchers have undertaken uniaxial, biaxial, and triaxial compression tests on rocks that contain two-dimensional and three-dimensional prefabricated cracks [3,4,5,6]. Their goal is to elucidate the mechanisms of crack propagation under various loading conditions.
With the ongoing intensification of global underground space engineering construction and resource extraction, the investigation of the mechanical response mechanisms of geotechnical materials subjected to cyclic loading has become essential. In coal mining, for example, deeper extraction depths lead to tectonic movements that form joints and fractures within deep strata. The cyclic stresses from mining activities promote fracture propagation, causing deformation and instability in surrounding rocks [7,8]. Given this context, the examination of fatigue damage characteristics and the laws governing crack evolution in fractured rock masses under cyclic loading is of considerable importance for engineering applications. Li et al. [9] conducted uniaxial cyclic loading tests on sandstone with fractures at varying angles to investigate the deformation characteristics and evolution patterns of rock energy indices in relation to peak load and crack angle. Ju et al. [10] designed Stepped Cyclic Loading and Unloading (SCLU) triaxial tests with different stress paths to analyze the mechanical behavior of fractured rocks in cold regions under cyclic loading, with a focus on mechanical responses, including strength, deformation, and failure modes. Zhao et al. [11] performed uniaxial cyclic loading tests on rock samples with various prefabricated fixed angles, examining stress-strain curves, mechanical properties, and failure characteristics.
In order to delve deeper into the instability mechanism of flawed rock masses and the propagation laws of cracks, digital image correlation (DIC) technology, fractal dimension, and numerical simulations are gradually being applied. DIC technology is a non-contact measurement technique based on image analysis, which is utilized to ascertain the deformation and displacement of materials or structures subjected to external forces. This method employs a randomly distributed speckle pattern on the surface of the sample and computes the displacement and strain fields by comparing images captured before and after deformation. The technique offers high accuracy, full-field measurement capabilities, and robust adaptability [12]. Liu et al. [13,14] utilized DIC to investigate the mechanical response of granite samples featuring blunt V-notches under varying effect loading conditions, extracting the notch fracture toughness from the displacement field data obtained. Xing et al. [15] employed DIC to identify microcrack zones and to measure the displacement and strain fields at the fracture tip. The fractal characteristics and fractal dimension have proven to be of significant value in describing and characterizing rock fracture networks, emerging as one of the most effective methods for quantitatively analyzing such networks [16]. Sui et al. [17] employed fractal geometry theory to elucidate shale fracture patterns. They demonstrated that the fractal dimension of fracture networks serves as a critical indicator for guiding the development of shale fracturability models. Their findings indicate a positive correlation between the complexity of fractures and shale fracturability, suggesting that more complex fracture networks are associated with enhanced shale fracturability. Mecholsky et al. [18] identified a relationship between the fractal dimension of fracture surface morphology and material toughness. In their investigation of the dynamic evolution of rock fractures during coal seam mining, Yang et al. [19] introduced fractal dimension and fracture entropy as quantitative parameters to characterize the spatio-temporal evolution characteristics of mining-induced fractures. They established a mathematical model linking fracture length and fractal dimension, thereby providing a scientific foundation for the quantitative analysis of fracture morphology. Pavičić et al. [20] conducted a systematic study on the fractal characteristics of dolomite fractures in Croatia. Numerical simulations offer models that incorporate multi-scale information to simulate the mechanical response of fractured rock masses under complex loading conditions. Compared to complex and costly laboratory or field tests, numerical simulations provide benefits such as better reproducibility and lower costs. Within the framework of the discrete element method (DEM), rock materials are conceptualized as comprising a series of interacting particles, which effectively accommodates the crack propagation process within the rock mass. This characteristic renders the DEM particularly advantageous for simulating the fracture processes and particle movements of geomaterials, leading to its preference among researchers. Niu et al. [21] investigated the effect of elliptical defects on rock failure under ultrasonic vibration conditions, conducting both ultrasonic vibration experiments and numerical simulations on rocks with various orientations of elliptical defects. Zhao et al. [22] performed numerical simulations to examine the effects of filled fractures on the geometric parameters (width, depth, and area) of the failure zone surrounding circular holes. Zhang et al. [23] explored the initiation, propagation, and coalescence of cracks in samples with open defects. They found that many crack types observed in simulations closely resembled those seen in actual tests.
Numerous engineering failures are associated with the propagation and coalescence of cracks in rock bridges that possess inherent natural defects [24]. These phenomena progressively diminish the structural strength and significantly reduce the stability of engineering structures. Understanding these natural defects is critical for accident prevention and ensuring structural safety. A particular focus is needed on crack propagation mechanisms and coalescence patterns within rock bridges. The spatial distribution of defects affects the trajectory, speed, and orientation of cracks within rock bridges. These factors directly influence the likelihood of rock mass failure and determine fracture morphology characteristics. Examples include slope failures resulting from rock bridge penetration at Xiaowan Hydropower Station in China (Figure 1a). Other examples are the interaction between gentle and steep cracks (Figure 1b) and the progression of fractures on high mountain rock faces (Figure 1c).
Currently, research on fractured rock masses under cyclic loading primarily focuses on factors such as fracture inclination, fracture length, fracture quantity, rock bridge inclination, and rock bridge length. However, studies examining the spatial distribution characteristics of fractures remain relatively limited. Furthermore, existing analyses tend to emphasize the strength and deformation parameters of fractured rocks, along with their macroscopic failure modes. Although these studies have contributed to a better understanding of the mechanical behavior and macroscopic manifestations of rocks, they still exhibit limitations in revealing the microscopic mechanisms and dynamic processes involved in crack propagation. In light of these limitations, this paper explores the characteristics of fracture failure and instability mechanisms in rock masses featuring different spatial distribution structures of double fractures under cyclic loading. Section 2 outlines the engineering background and provides a detailed account of the experimental procedures. Section 3 analyzes variations in the strength, deformation modulus, and irreversible strain of fractured rocks throughout the loading–unloading process, and employs DIC technology to obtain the evolution of the rock surface deformation field. Fractal dimension analysis is also applied for the quantitative analysis of crack propagation. In Section 4, the DEM is employed to establish a prefabricated fractured rock model, facilitating an exploration of the meso-fracture mechanisms within the rock.

2. Test Plan

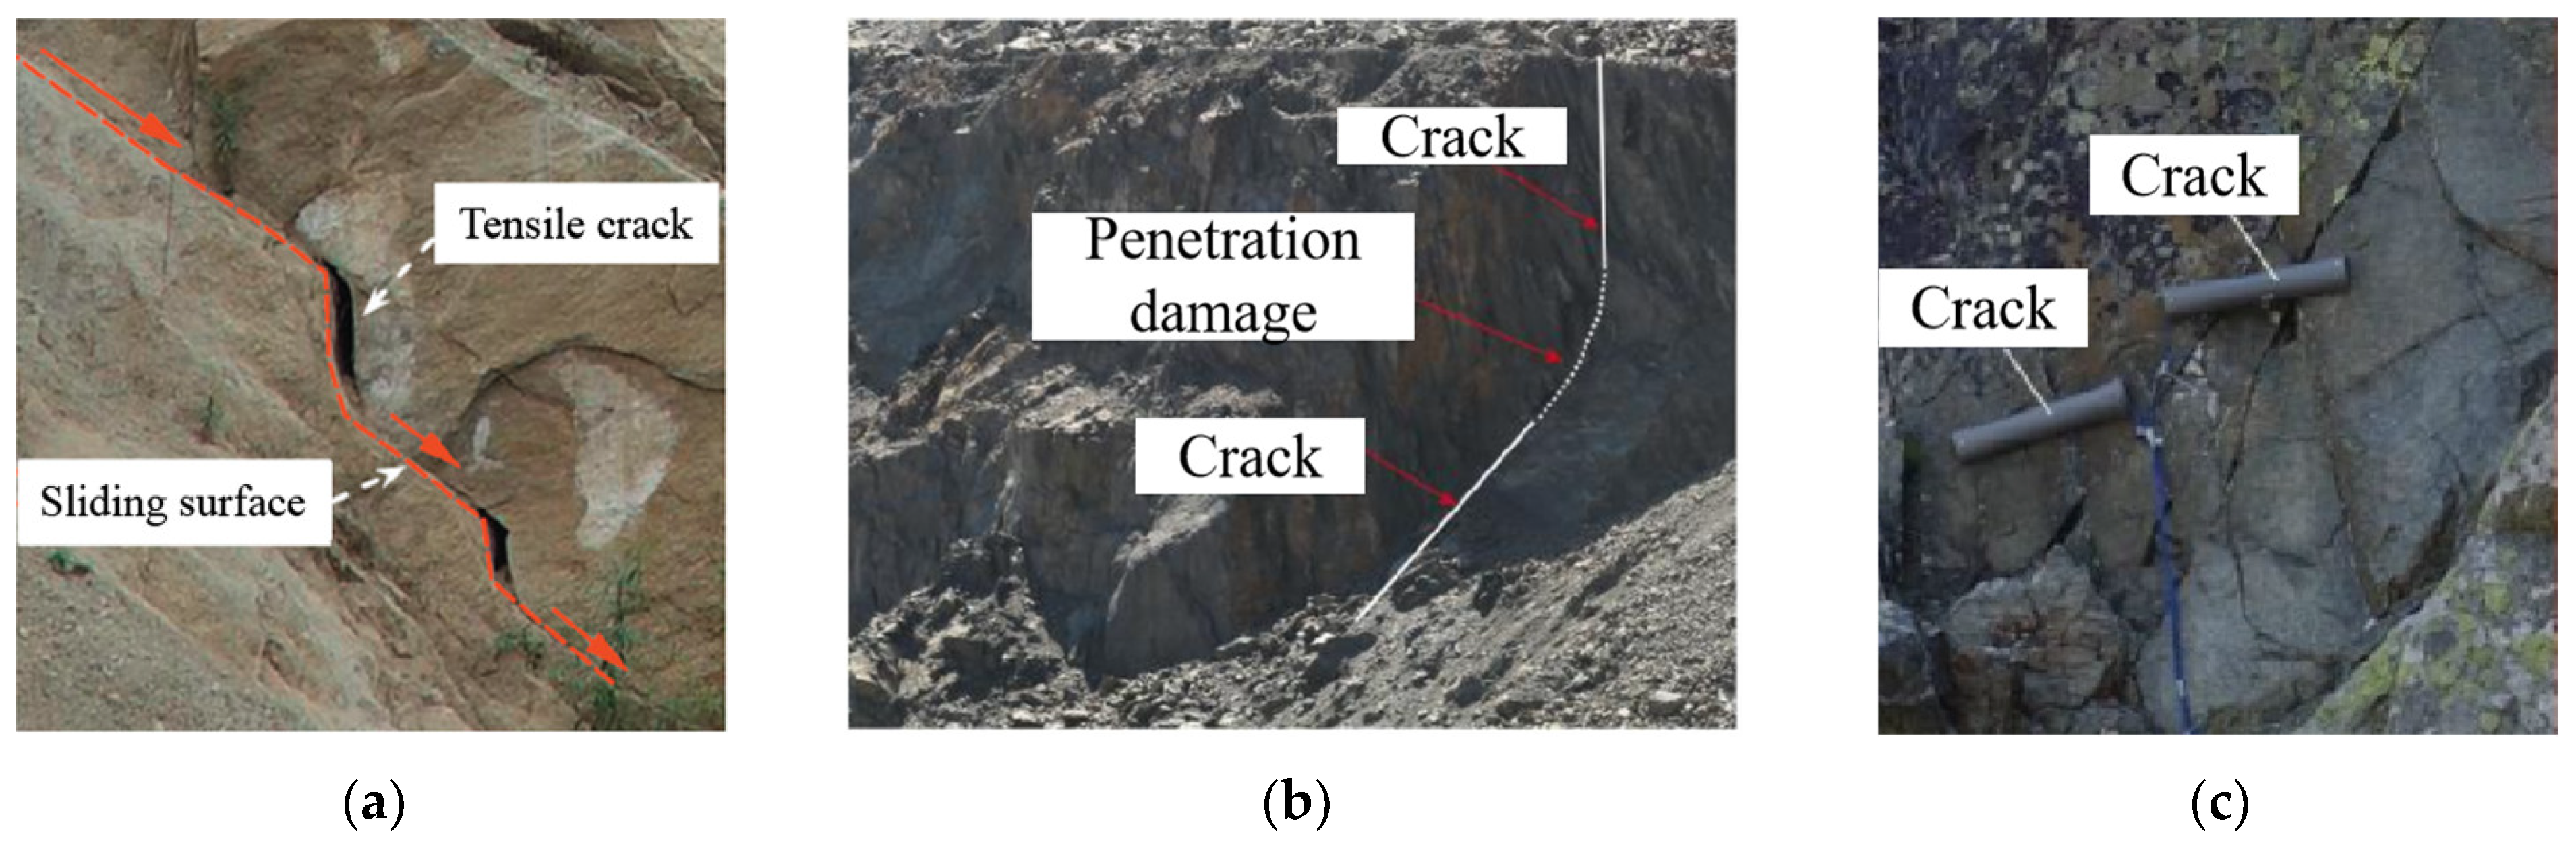
2.1. Engineering Background

Mine rock slopes containing joints and fractures frequently exhibit a step-like failure mode of instability. The stability of these slopes is predominantly controlled by the interaction between structural planes (e.g., joints, fractures) and rock bridges (i.e., intact rock regions between adjacent structural planes). The distribution of penetrating fractures within the slope is intricate. Engineering disturbances such as mining and slope excavation disrupt the original natural stress equilibrium, leading to significant stress concentration at the tips of the joints. This stress concentration facilitates the initiation and propagation of cracks around the rock bridges, often forming continuous sliding surfaces that can result in local or overall instability of the slope. During mining operations, disturbance loads from blasting vibrations and mechanical operations elicit different response mechanisms in fracture structures with varying spatial distribution characteristics. These disturbances may either accelerate fracture propagation or contribute to the stability of the structures, further complicating the assessment of slope stability. A schematic of a jointed slope is depicted in Figure 2.

2.2. Sample Processing and Test Procedure

Figure 3 depicts the planar distribution of double fractures. Three types of parallel double-fracture samples, characterized by varying spatial distributions, have been prepared: the parallel upper-lower structure, the parallel left-right structure, and the parallel coplanar structure, designated as R1, R2, and R3, respectively. All other variables have been controlled to maintain consistency, with the prefabricated fractures having a length of 15 mm, a width of 2 mm, and an inclination angle of 45°. The vertical distance between the rock bridges is also maintained at 15 mm, with the inclination angle of the rock bridges set at 45°.
Sample Preparation and Testing:
(1)
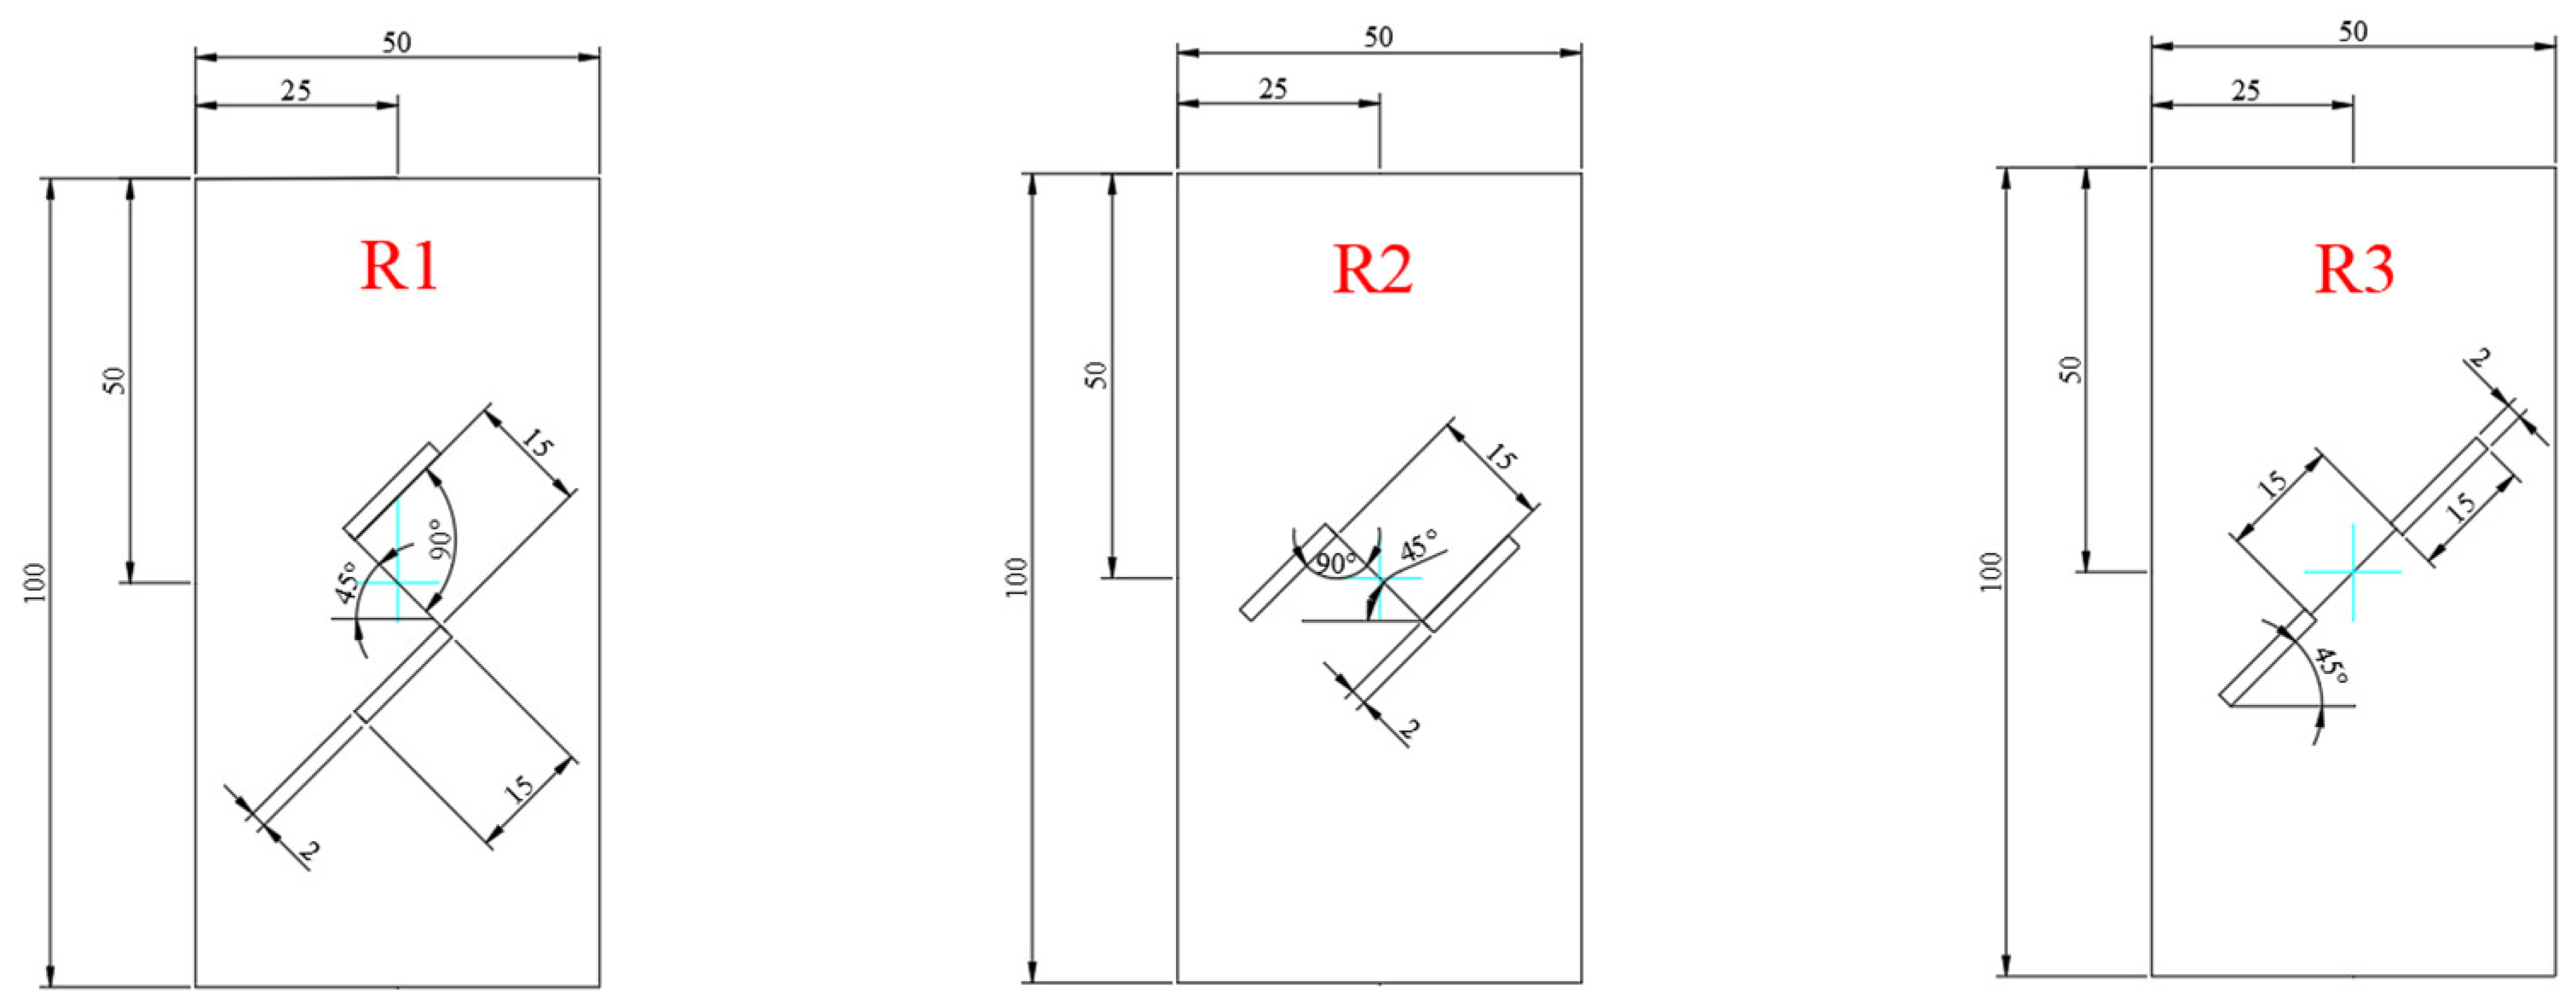
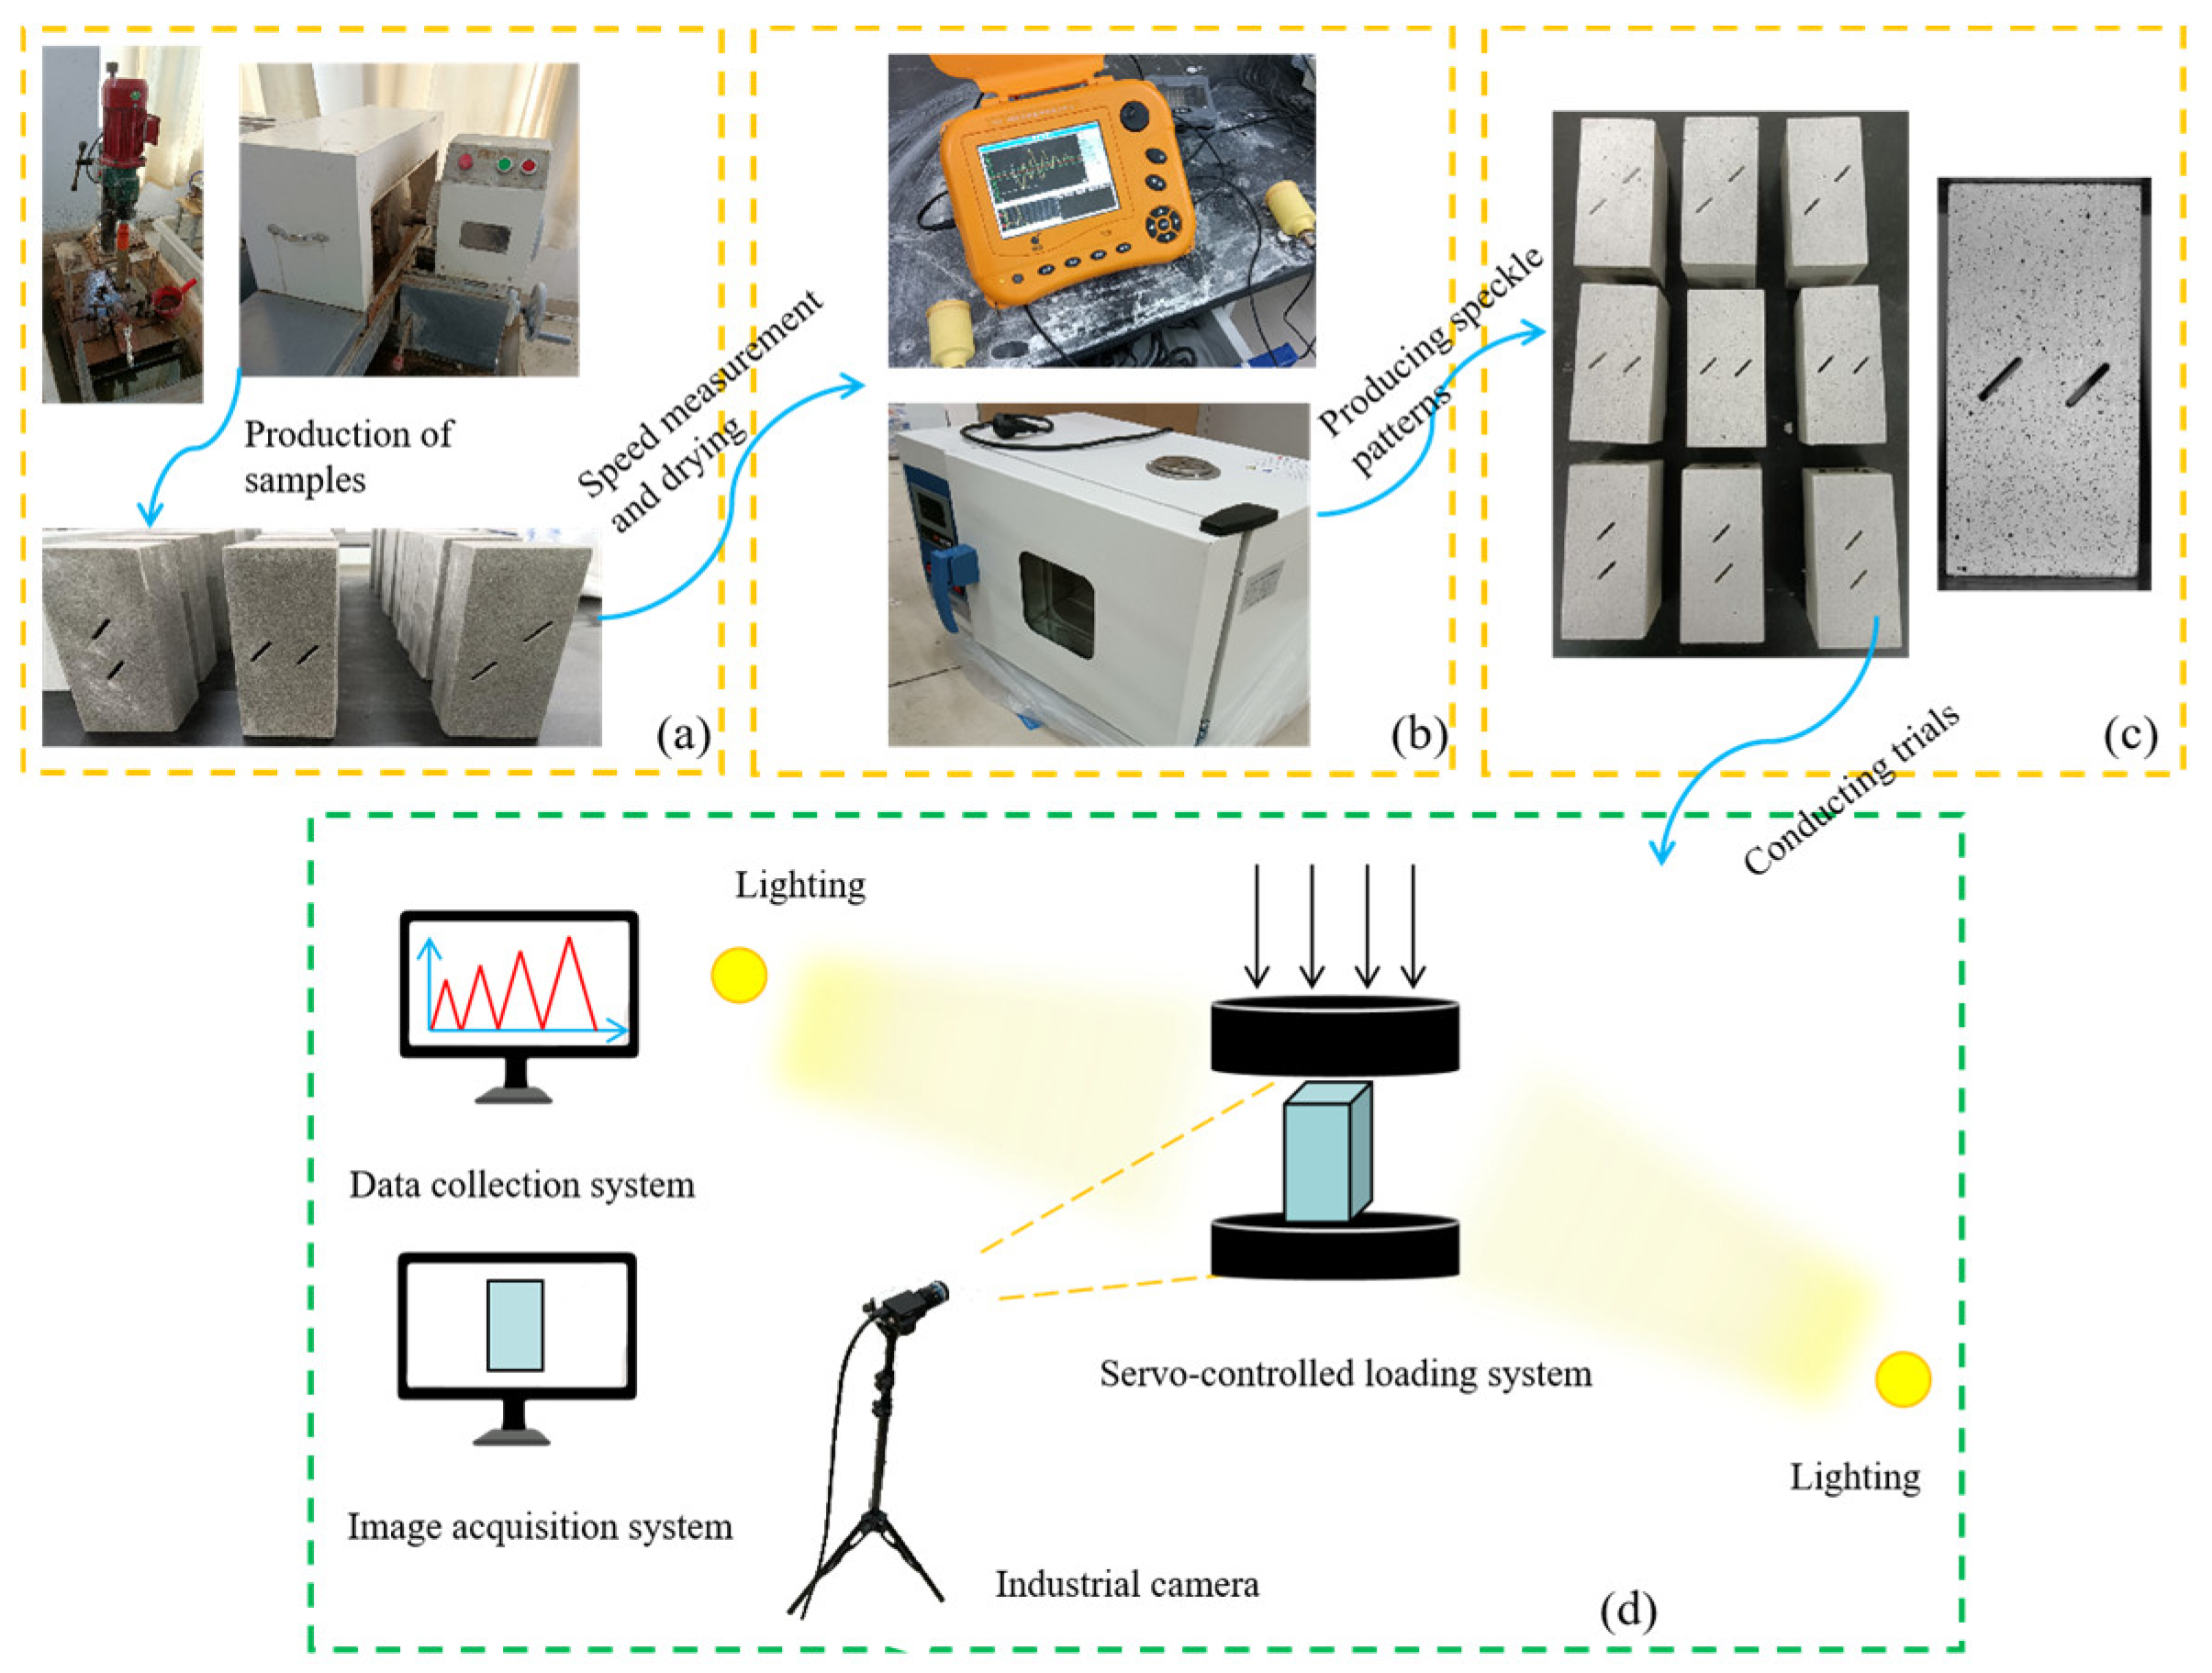
The cores are extracted, sectioned, and polished from Qing sandstone rock masses sourced from the western mining regions of China to yield cuboid-shaped rock samples measuring 50 mm × 50 mm × 100 mm. Prefabricated fractures are generated utilizing a wire cutting technique (Figure 4a).
(2)
The samples are subjected to screening and drying processes utilizing an ultrasonic velocity meter and an oven (Figure 4b).
(3)
A thin layer of white paint is applied to the samples, and after drying, black paint is subsequently sprayed to produce a speckled pattern (Figure 4c).
(4)
Uniaxial compression tests and graded cyclic loading–unloading tests are performed on the samples utilizing a testing machine equipped with displacement-controlled loading. Both the loading and unloading rates are established at 0.06 mm/min. A GrayPoint industrial camera is employed to record the testing process, facilitating subsequent analysis using DIC technology. The camera provides a resolution of up to 9.1 megapixels and a capture rate of up to 9 frames per second (Figure 4d).

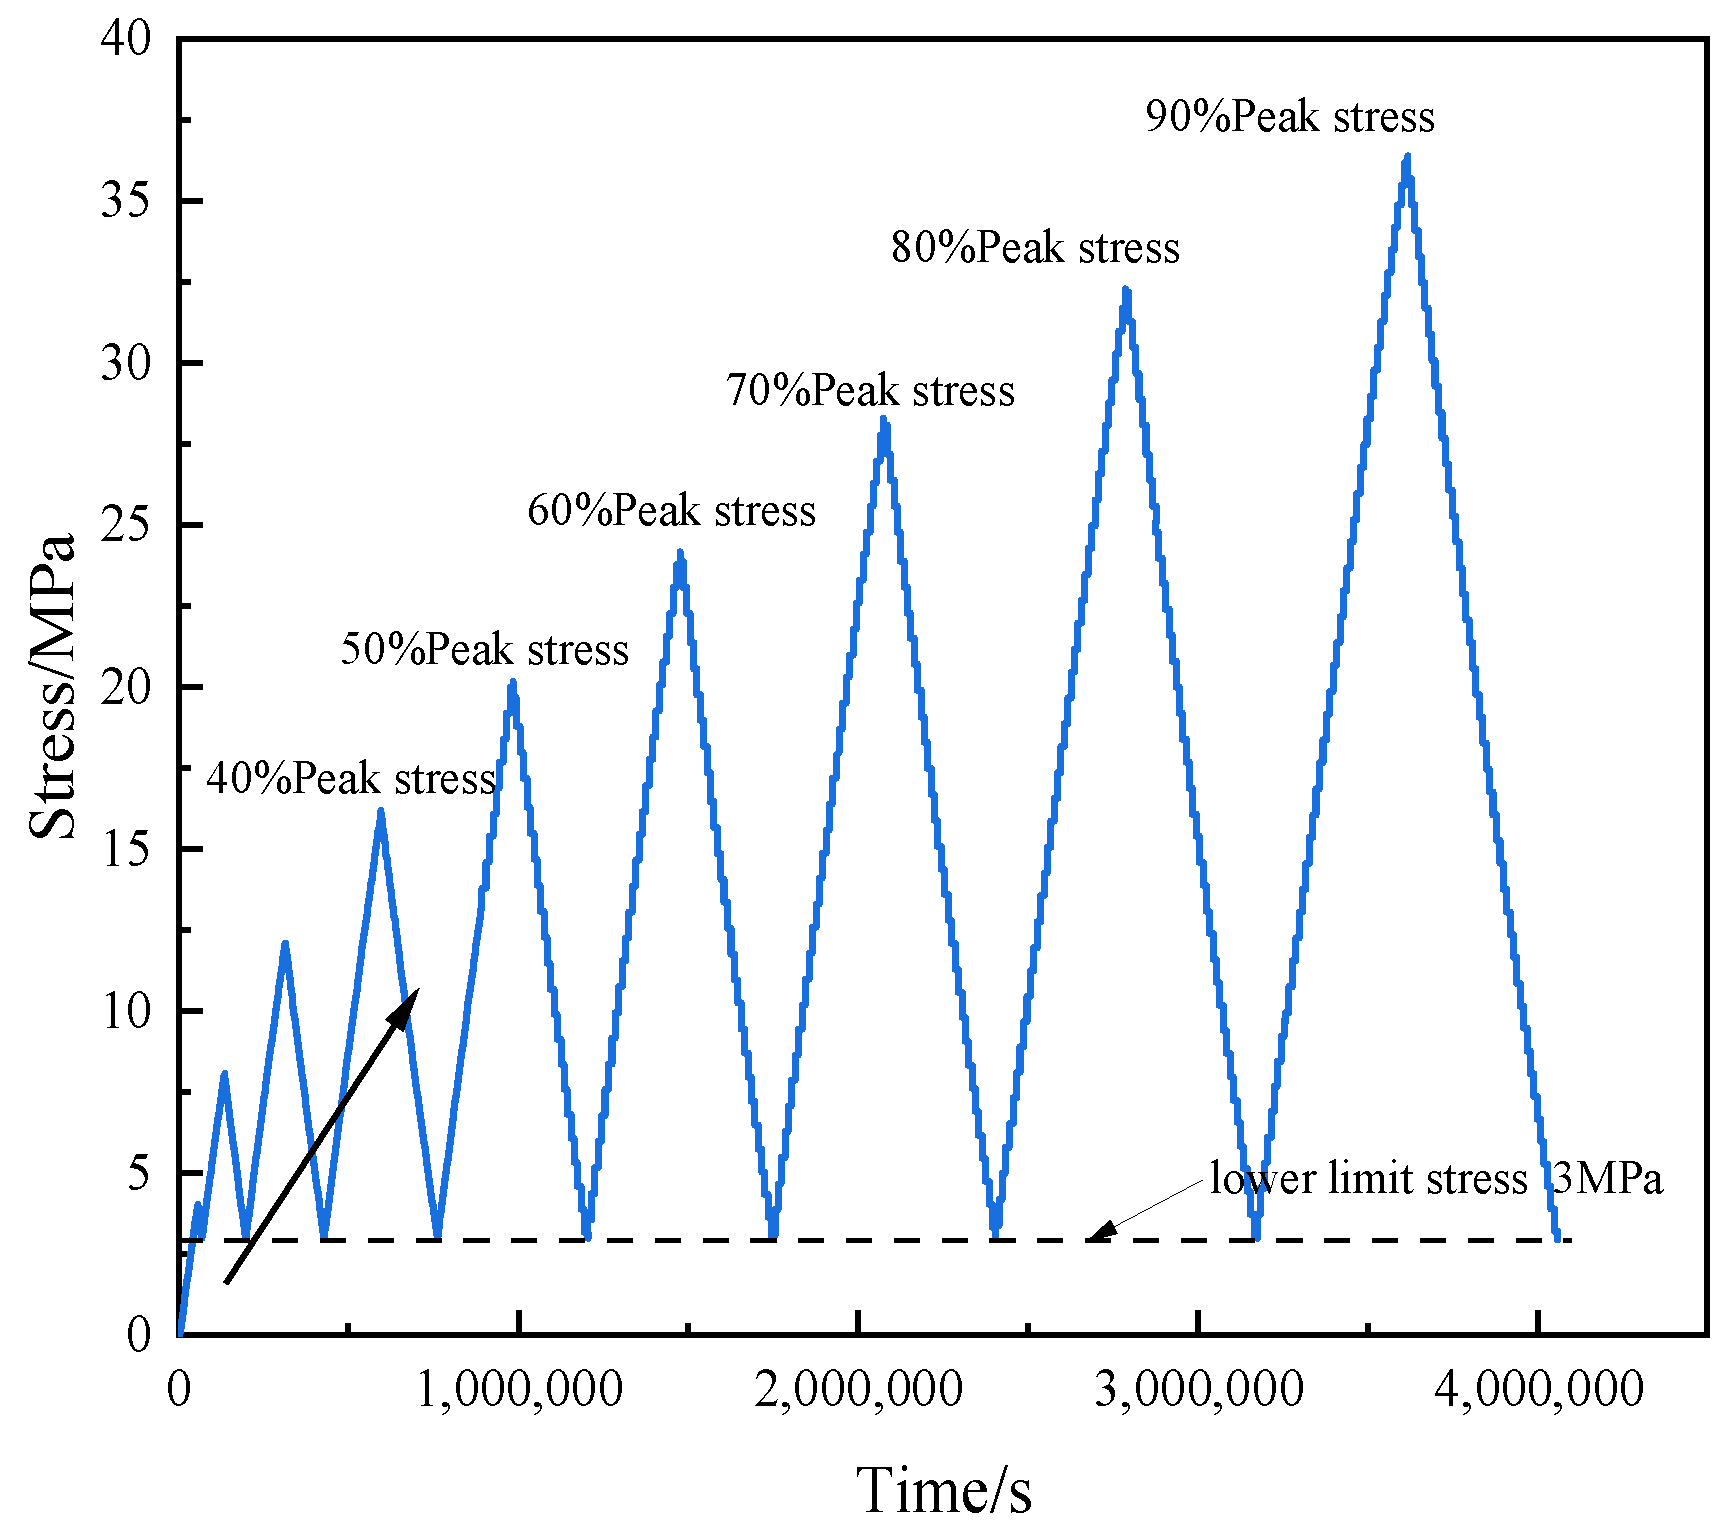
2.3. Cyclic Loading and Unloading Test

Firstly, a uniaxial compression test should be conducted on the fractured samples to determine the average compressive strength. Following this, graded cyclic loading and unloading tests will be performed on 3 types of fractured samples, encompassing a total of 9 loading and unloading cycles. The upper limit stresses for these cycles are established at 10%, 20%, 30%, 40%, 50%, 60%, 70%, 80%, and 90% of the average uniaxial compressive strength, while the lower limit stress is consistently maintained at 3 MPa. The stress path for the loading and unloading processes is illustrated in Figure 5.

3. Experimental Results and Analysis

3.1. Analysis of Mechanical Properties of Samples

The cyclic loading and unloading test is designed to characterize the mechanical behavior of rock masses subjected to repeated applications and removals of stress. This testing methodology facilitates an understanding of the fatigue properties and cumulative damage effects associated with the rock masses. Table 1 outlines the compressive strengths of three types of fractured samples as determined through both uniaxial compression tests and cyclic loading and unloading tests.
The data in Table 1 indicate that the various spatial distribution structures of double fractures significantly impact the compressive strength of the samples. The average uniaxial compressive strengths for sample types R1, R2, and R3 are recorded as 49.216 MPa, 33.6 MPa, and 35.946 MPa, respectively. Notably, the average strength of type R1 is the highest, while type R3 exhibits a marginally greater strength than type R2. Under conditions of cyclic loading, the average strengths of the final loading segment for sample types R1, R2, and R3 are 48.592 MPa, 32.625 MPa, and 36.792 MPa, respectively. When compared to the uniaxial compression results, the differences observed are minimal, and the cyclic loading and unloading curves remain intact. This result suggests that the graded cyclic loading and unloading methodology is effectively applicable in the investigation of fractured rock masses.
During the cyclic loading and unloading process, the deformation modulus associated with loading and unloading serves as a critical parameter that indicates the rock’s capacity to withstand deformation. Repeated cycles of loading and unloading may induce plastic deformation within the sample, referred to as irreversible strain, the underlying principle of which is depicted in Figure 6.
To investigate the mechanical properties of three types in parallel double-fractured sandstones, data on the deformation modulus and irreversible strains during both loading and unloading phases were collected for statistical analysis (Figure 7).
Figure 7a,b depicts the variation in the loading and unloading deformation modulus for three fractured samples as the number of cycles increases. The data indicate that, during the early to mid-stages of the loading and unloading process, both the loading and unloading deformation modulus exhibit an upward trend with increasing cycle numbers, indicative of a cyclic hardening phenomenon. Notably, during the initial 1~2 cycles (excluding the first unloading deformation modulus, which displays pronounced nonlinear characteristics), a significant increase in the deformation modulus is observed. In the mid-to-late stages of the loading and unloading process, the rate of increase in the modulus diminishes. Furthermore, the loading deformation modulus for each sample decreases during the final cycle, while the unloading deformation modulus remains consistently higher than the loading deformation modulus throughout the entire loading and unloading process. Similar cyclic hardening phenomena have been documented in Wang et al. [28], Wang et al. [29], and Yang et al. [30], concerning fractured rock masses, coal bodies, and composites subjected to cyclic loading. A comprehensive review of these studies suggests that the observed phenomena can be attributed to several factors: in the early stages, the application of external load facilitates the compaction of internal pores and micro-fractures, thereby enhancing the rock’s resistance to deformation. Subsequently, as the sample’s density increases significantly, the corresponding increase in modulus becomes relatively modest. The observed decrease in the loading deformation modulus during the 10th cycle is attributed to the fractured sample reaching its peak strength, which results in substantial alterations in the stress field surrounding the pre-existing fractures, ultimately leading to a deterioration of the rock’s mechanical properties. Additionally, the continuous plastic deformation of the sample throughout the loading and unloading process may prevent certain fractures from reopening during the unloading phase, resulting in an increased stiffness of the sample. Consequently, the unloading deformation modulus of the same sample is higher than its loading deformation modulus.
Furthermore, the irreversible strains of samples R1-3, R2-4, and R3-3 exhibited increases from 0.397%, 0.328%, and 0.368% to 0.556%, 0.447%, and 0.507%, respectively, corresponding to increments of 0.159%, 0.119%, and 0.139%. The growth rate was highest for sample R1-3 and lowest for sample R2-4. This observation suggests that the plastic deformation of the fractured samples progressively increased, leading to the gradual accumulation of fatigue damage. Notably, the smallest increment in irreversible strain for sample R2-4 resulted in its deformation modulus being marginally higher than that of samples R1-3 and R3-3 during the loading and unloading processes. Interestingly, as previously mentioned, the average strength of R2-type samples was the lowest. This phenomenon may be attributed to the spatial distribution of parallel left-right structured fractures, which facilitates the transmission of external forces. During the loading and unloading processes, a greater number of natural micro-fractures within the rock were compacted and closed. However, this distribution also complicates the stress field between the double fractures, thereby weakening the bearing capacity of the rock mass. In summary, the varying spatial distribution structures of double fractures significantly impact the mechanical properties of rocks. To further elucidate their mechanical response mechanisms under cyclic loading, the surface deformation field of the rocks will be examined in the subsequent sections.

3.2. Analysis of Deformation Characteristics and Crack Propagation Features in Samples

As signs of sample damage become increasingly apparent at the peak stage, understanding the patterns of crack propagation during this phase is essential for predicting rock failure trends and implementing targeted protective measures [31]. A DIC analysis was conducted to assess the surface displacement and strain fields of the fractured samples at the peak stage, under both monotonic loading and cyclic loading–unloading conditions. Figure 8a,b illustrates the horizontal and vertical displacement fields of the sample, respectively, while Figure 8c,d depicts the principal strain field and shear strain field of the sample, respectively. For DIC, the conventions for displacement and strain are such that tension is regarded as positive and compression is regarded as negative.
In Figure 8, the spatial distribution of double fractures leads to differentiated displacement and strain fields within the samples. In sample R1-1, upon reaching peak stress, a different horizontal displacement stratification is observed along the locations of the double fractures, accompanied by the emergence of tensile strain concentration zones at the tips of these fractures, with values exceeding 0.05%. The maximum shear strain recorded is 0.008%. Similarly, in the cyclic loading mode, sample R1-3 demonstrates a higher tensile strain compared to shear strain, suggesting that the initial failure of R1-type samples is predominantly governed by tensile cracking. The displacement and strain contours of samples R2-2 and R3-3 have not exhibited significant alterations, indicating that these samples retain a certain degree of ductility under specific loading conditions. In sample R2-4, a pronounced change in the horizontal displacement field is observed at the rock bridge, while the vertical displacement field displays stratification. The tensile strain concentration zone is situated at the tips of the fractures, whereas the shear strain field at the rock bridge is notably strong and negative (indicative of compression). This suggests that the rock bridge in R2-4 is likely to fail due to the propagation of compressive-shear cracks, which would substantially diminish the rock’s bearing capacity. The displacement contours of sample R3-1 reveal a clear separation in displacement on either side of the parallel coplanar double fractures, indicating that the sample is predisposed to undergo left-right peeling along the coplanar fractures. The maximum tensile strain at the far tips of the double fractures in R3-1 is 0.04%, while the shear strain is only 0.006%, suggesting that failure at the far tips is primarily driven by tensile cracking. However, the shear strain near the tips of the fractures on both sides of the rock bridge exceeds 0.01%, indicating that the failure at the rock bridge will be affected by a combination of tensile and shear cracks.
Utilizing DIC technology, this study illustrated the displacement and strain fields of the rock at its peak stage, thereby revealing the subtle changes that occur when the rock is subjected to extreme pressure. To further validate the direct correlation between the deformation contours and the rock’s failure state, this study analyzed the crack propagation characteristics associated with the final fracture morphology of the samples. Building upon previous research regarding the initiation mechanisms at prefabricated crack tips [32,33], the major branching crack types that develop and coalesce within the rock are wing cracks or anti-wing cracks (tensile cracks), secondary inclined cracks (shear cracks), and secondary coplanar cracks (compressive-shear cracks), as illustrated in Figure 9. In the following sections, the primary cracks in the fully failed samples will be distinguished and numbered, with ‘T’ representing tensile cracks and ‘S’ representing shear or oblique shear cracks.
In Figure 10, the final fracture morphology of the samples exhibits a strong correlation with the deformation field observed at the peak stage, indicating that different loading modes significantly impact the crack propagation characteristics of the rock mass. For R1-type samples, failure is primarily characterized by the presence of tensile wing cracks or opposing wing cracks. In the case of R1-1, multiple tensile cracks (T-1 to T-4) emanate from the ends of the upper fissure, accompanied by a secondary tilt crack (S-1) that traverses the sample. The rock bridge region sustains minimal damage. Conversely, in R1-3, the failure pattern becomes increasingly irregular. However, the rock bridge remains unpenetrated, with tensile cracks continuing to predominate. Interestingly, the T-4 crack, which originates from the lower fissure tip, transitions into S-1 upon approaching the vicinity of the upper fissure tip, likely due to the complex interactions within the stress field. R2-type samples demonstrate a combined tensile-shear failure mechanism, wherein the fracture of the rock bridge is predominantly impacted by shear cracks. In R2-4, the intersection of two secondary tilt cracks (S-3 and S-4) located between the double fissures results in the penetration of the rock bridge. Finally, R3-type samples exhibit similar failure patterns, characterized by tensile cracks that extend along the direction of maximum principal stress at the far tips. The fracture of the rock bridge in these samples is governed by a combination of both tensile and shear cracks.
In summary, during engineering construction within environments characterized by multi-fracture and multi-jointed rock formations, it is imperative to monitor the deformation of the fractured rock body resulting from cyclic disturbances in a timely manner. Additionally, appropriate reinforcement measures should be implemented based on the geometric distribution characteristics of the multi-fracture network.

3.3. Fractal Dimension of Samples

Fractal dimension serves as a critical parameter for characterizing the complexity and self-similarity inherent in fractal structures. The principles of fractal theory can effectively delineate the distribution of complex cracks. To quantitatively assess the complexity of crack propagation paths, the fractal box-counting dimension D is introduced. The process for calculating the box-counting dimension is illustrated in Figure 11. Firstly, the crack propagation image of the sample is extracted, followed by binarization and color inversion. The image is then partitioned using an equivalent grid with a side length of r. Certain grid cells contain portions of the crack, while others remain unoccupied. As the side length of the grid decreases, the quantity of non-empty grid cells increases correspondingly. The number of non-empty grid cells is N(r). The equation for calculating D is presented as follows:
D = lim r 0 log N r log r
By calculating the corresponding N(r) values for various grid sizes r and conducting a linear regression analysis on a double logarithmic coordinate system, Equation (2) can be expressed as follows:
logN r = C D log r
where C represents the intercept and D represents a negative slope, which is associated with the box-counting fractal dimension.
Figure 12 depicts the fractal dimensions of fractured samples subjected to two loading conditions. Specifically, Figure 12a,c,e illustrates the fractal dimensions under uniaxial compression, while Figure 12b,d,f represents the fractal dimensions under cyclic loading and unloading conditions. Accompanying each fitting line, to the left and below, are images of the samples following binarization processing. This study emphasizes the analysis of the propagation of newly formed cracks. Therefore, pre-existing fractures have been excluded from consideration.
In Figure 12, the fractal dimensions of the fractured samples are elevated under conditions of cyclic loading and unloading in comparison to those subjected to monotonic loading. Specifically, the fractal dimensions for samples R1-1, R2-2, and R3-1 under monotonic loading are recorded as 1.302, 1.38, and 1.409, respectively. In contrast, the fractal dimensions for samples R1-4, R2-4, and R3-3 under cyclic loading and unloading are 1.430, 1.415, and 1.419, respectively. The interpretation of fractal dimension suggests that a higher value indicates a more complex crack propagation process. This phenomenon can primarily be attributed to the continuous accumulation of fatigue damage and the resultant increase in plastic deformation within the sample due to cyclic loading. During the post-peak stage, the stress field within the rock undergoes more pronounced changes, thereby complicating and disordering the crack propagation process. Furthermore, a comparison of the crack propagation paths for identical sample types under both loading conditions reveals that the variation in fractal dimension is relatively minor for samples exhibiting parallel coplanar structures (R3-1, R3-3). In conjunction with the observations in Figure 10, the primary failure modes under both conditions exhibit notable similarities. Conversely, for samples characterized by parallel upper-lower structures (R1-1, R1-3), the crack propagation paths demonstrate more significant discrepancies. This suggests that the different spatial distribution characteristics of parallel double fractures play a critical role in affecting the initiation and propagation of new cracks.

4. DEM Numerical Simulation

Considering that DIC technology and fractal dimension primarily focus on the analysis of rock surfaces, the incorporation of DEM numerical simulation technology is particularly essential for elucidating the meso-scale dynamic evolution of fracture mechanisms in rock masses under loading conditions. The DEM not only simulates the interactions among internal particles or elements within the rocks but also comprehensively captures the entire process of microcrack initiation, propagation, and the subsequent macroscopic fracture.
The constitutive model employed in this study is the parallel bond model, which is particularly appropriate for granular bonded materials, including rock and concrete. This model establishes bond contacts between particles, facilitating the transmission of forces and moments. When the normal or tangential contact forces surpass the bond strength, tensile or shear failures may ensue, leading to the rupture of bonds and the formation of micro-fractures. The schematic representation of this principle is depicted in Figure 13.
A comprehensive rock model matching the dimensions of the laboratory test has been developed, consisting of a total of 73,630 particles and 272,628 contact bonds. The micro-parameters of this model are continuously calibrated through a “trial-and-error” approach, with the final results summarized in Table 2. To assess the validity of these micro-parameters, comparisons are made between the experimental and simulated stress-strain curves, as well as the failure modes (Figure 14). Utilizing the established micro-parameters, a numerical model of doubly fractured rock is constructed. The methodology for generating prefabricated fractures involves initially creating wall elements at designated locations, subsequently removing the particles within those walls, and finally eliminating the wall elements after the formation of contact bonds. During the loading phase of the model, the loading plate is regulated to apply force at a constant velocity, with a displacement loading rate of 0.01 m/s. Due to variations in damping, the loading rate in the simulation differs from that observed in the laboratory tests. However, the chosen value remains within the range of quasi-static loading rates. During the unloading phase, the loading plate ceases to apply force, and reloading is initiated once the stress decreases to the lower limit stress. Uniaxial compression and cyclic loading–unloading numerical simulations are conducted independently, with the R1-type sample serving as a case study for verification (Figure 15).
In Figure 14, the DEM encounters challenges in accurately replicating the inherent microcracks present in rocks due to the formation of bonds through additional bonding parameters. Consequently, when the crack compaction stage is not taken into account [35], the peak stress and elastic modulus derived from both laboratory tests and numerical simulations are approximately equivalent, with only minor differences observed in the failure modes. This observation further supports the validity of the micro-parameters employed in the model. Figure 15 indicates that the peak stress of the R1-type sample subjected to monotonic loading in the numerical simulation is 45 MPa, which is slightly lower than the value in Table 1. The external stress envelope generated during the cyclic loading–unloading simulation closely aligns with the monotonic loading curve. Furthermore, the failure modes and micro-fracture distributions observed under both loading conditions in the numerical simulation exhibit a strong resemblance to the fracture patterns of samples R1-1 and R1-4. This demonstrates that the DEM is capable of effectively simulating the mechanical characteristics of doubly fractured samples under loading conditions.

4.1. Sample Micro-Fracture Mechanism

The rock bridge region plays a pivotal role in elucidating the complex interaction mechanisms among multiple fractures, with its coalescence and subsequent failure being critical factors that can instigate the instability and failure of compromised rock formations. To examine the micro-fracture mechanisms present in fractured rock masses characterized by varying spatial distribution attributes, an analysis of the force chain field and micro-fracture distribution within the rock bridge region of the sample at its peak stage is undertaken. Figure 16a depicts the force chain field in the X-Z plane of the rock bridge region at the peak stage, where the direction of the arrows denotes the vector orientation of the contact forces, and the color of the arrows indicates the magnitude of these forces. Figure 16b presents the distribution of micro-fractures within the sample at the peak stage, with green flakes symbolizing the micro-fractures. Figure 16c illustrates the interactions between double fractures.
The force chain field pertains to the pathways and network structures through which particles convey forces via mutual contact. It delineates the strength and distribution of contact forces within the model. The formation of micro-fractures indicates the failure of bonding links between particles. In Figure 16, at the peak stage, the prefabricated fracture in the upper section of the R1-type sample experiences compression and deformation, while the lower fracture remains largely intact. Strong contact forces are predominantly concentrated on both sides of the double fractures, with sparse force chains present between them and no micro-fractures occurring in the rock bridge. This observation suggests that, under external forces, an effective bearing surface initially develops at the upper fracture, prompting particles to mobilize and transmit forces laterally across the fracture. Due to the stress shielding effect, the contact forces in the rock bridge region are significantly lower than those in areas directly subjected to external loads. This implies that the rock columns flanking the double fractures are primarily responsible for load-bearing. In Figure 10, the damage within the rock bridge is relatively minor, and the interaction mechanism between the fractures is weak. Consequently, the cracks in type R1 predominantly manifest as tensile cracks originating from the tips of the prefabricated fractures. In contrast, for R2-type and R3-type samples, the rock bridges are directly subjected to external forces and are affected by stress concentrations at the fracture tips. The presence of dense force chains within the rock bridge indicates that a substantial number of particles are engaged in transmitting forces and moments, resulting in significant alterations to the stress field. Strong contact forces exhibiting opposing directions emerge between the double fractures, suggesting a tendency for mutual dislocation among particles. This condition is conducive to shear failure within the rock bridge, leading to the formation of numerous micro-fractures and ultimately resulting in a loss of bearing capacity of the rock. This phenomenon aligns closely with the failure conditions observed in the rock bridges of R2-type and R3-type samples (Figure 10).

4.2. Equivalent Stress Contour Plots

To provide a more comprehensive understanding of the micro-fracture trends observed in the samples, an investigation into the rock stress field is undertaken. In the three-dimensional DEM, researchers frequently utilize variations in the Z-direction stress to characterize the distribution of the stress field. However, this methodology is limited in scope. Therefore, this paper introduces the concept of equivalent stress to facilitate a qualitative analysis of the stress state within the three-dimensional model. The corresponding equation is presented as follows:
σ ¯ = 1 2 ( σ x σ y ) 2 + ( σ y σ z ) 2 + ( σ x σ z ) 2 + 6 ( τ xy 2 + τ yz 2 + τ xz 2 )
The fully squared equation can be expressed in the following expanded form:
σ ¯ = σ x 2 + σ y 2 + σ z 2 σ x σ y σ y σ z σ x σ z + 3 ( τ xy 2 + τ yz 2 + τ xz 2 )
where σ ¯ represents the equivalent stress (MPa); σ x   σ y   σ z represents the normal stress (MPa); and τ xy   τ xz   τ yz represents the shear stress (MPa).
The previously mentioned equivalent stress equation should be integrated into a programming language and applied within the numerical simulation to observe the stress distribution of the sample during the peak phase of cyclic loading. Ultimately, this process will yield a stress contour plot for the central slice of the sample (X-Z cross-section, where Y = 0), as illustrated in Figure 17.
In Figure 17, the stress at the rock bridge of the R1-type sample approaches zero, whereas the stress on both sides of the double fractures remains relatively high. The stress concentration areas, as observed in the slice, exhibit an “X”-shaped distribution that extends towards both ends of the sample. This pattern suggests that cracks are likely to propagate from both sides of the preformed fractures towards the ends. In the case of the R2-type sample, a significant stress concentration zone develops at the location of the rock bridge, ultimately resulting in its penetration failure; this concentration zone tends to expand from the rock bridge. Similarly, the R3-type sample demonstrates stress concentration at the rock bridge location, with additional stress concentrations appearing at the upper right and lower left ends of the sample. The stress levels above and below the preformed fractures are minimal, which leads to the propagation of cracks primarily along the trajectory of the parallel coplanar structure.
To assess the accuracy of this method, the micro-fracture location data from the fully damaged samples were extracted, and a Gaussian kernel function was employed to compute the micro-fracture density. In Figure 18, the variations in color intensity represent the micro-fracture density, with warmer tones indicating a higher density of micro-fractures.
In Figure 18, the distribution of micro-fracture density in the R1-type sample predominantly exhibits a reverse wing-like pattern, extending from both sides of the upper fracture down to the bottom of the sample. Notably, no penetration failure is observed at the rock bridge. In contrast, the R2-type sample demonstrates that the micro-fractures on either side of the double fractures penetrate through the sample, resulting in penetration failure of the rock bridge due to the accumulation of a significant number of micro-fractures. For the R3-type sample, the micro-fractures primarily propagate along the trajectory of the double fractures within the parallel coplanar structure, ultimately leading to penetration through the sample.
Figure 17 and Figure 18 indicate that the equivalent stress contour plots of the samples align closely with the stress chain field and the distribution of micro-fracture density. This alignment indicates that the equivalent stress contour plots effectively represent the stress field distribution within the three-dimensional numerical model, thereby offering a reliable method for predicting mesoscopic fracture trends in geological materials.

5. Discussion

Based on a comprehensive analysis of laboratory experiments and numerical simulations, this study examines the effect of fractured rock masses with varying spatial distribution characteristics on underground space engineering construction under cyclic loading conditions. A notable alteration in the crack propagation pattern of R1-type samples occurs when the loading mode transitions from monotonic to cyclic loading and unloading. Specifically, the initial pyramid-like extension from the top to the bottom evolves into a large-scale extension along both sides of the double fractures, extending to the ends of the rock. This transformation is accompanied by significant fluctuations in the fractal dimension. This phenomenon may be attributed to a change in the mechanical mechanism, which modifies the stress distribution surrounding the upper primary load-bearing fracture (Figure 16a). Although high stress concentrations on both sides of the double fractures do not lead to the complete coalescence of the rock bridge, they exacerbate the mutual effect of stresses at the tips on the same side of the fractures. In the case of R3-type samples, their different parallel coplanar structure results in the formation of a “stress-acting plane” at the double fractures. Consequently, there are minimal fundamental changes in the crack propagation path despite variations in external loads, leading to only slight differences in the fractal dimension. In light of the findings presented, corresponding measures should be adopted for different fracture structures during the excavation of deep underground caverns and slope-protection management. For vertical fracture structures affected by high-stress directions, a primary assessment of damage on both sides of the fractures is essential. In contrast, for horizontal fracture structures, the focus should be on the coalescence of the rock bridge. For parallel coplanar structures, timely reinforcement should be applied in the direction of the maximum principal stress at the far tips of the fractures.
The primary limitations of this study are as follows: first, due to the constraints of current experimental conditions, a true triaxial test, which would better simulate the underground stress environment has not been conducted. This will be addressed in subsequent research. Secondly, the parallel fracture structure examined in this study is relatively idealized, given the complexity of natural environments. Despite this simplification, the structure still provides valuable insights. In the future, more realistic model tests of fractured rock masses that closely replicate actual engineering conditions will be undertaken. Additionally, in this study, the fractal dimension was solely employed to analyze crack propagation on the rock surface, which presents a somewhat limited perspective. Future research could involve analyzing multiple fractal characteristics using techniques such as Nuclear Magnetic Resonance (NMR), Scanning Electron Microscopy (SEM), Acoustic Emission (AE), or CT scanning to extract three-dimensional images of crack propagation for fractal analysis.

6. Conclusions

This study examines the mechanical properties, deformation characteristics, crack propagation behavior, and mesoscopic fracture mechanisms of double-fractured sandstone samples with varying spatial distributions under cyclic loading. The key results are summarized as follows:
(1)
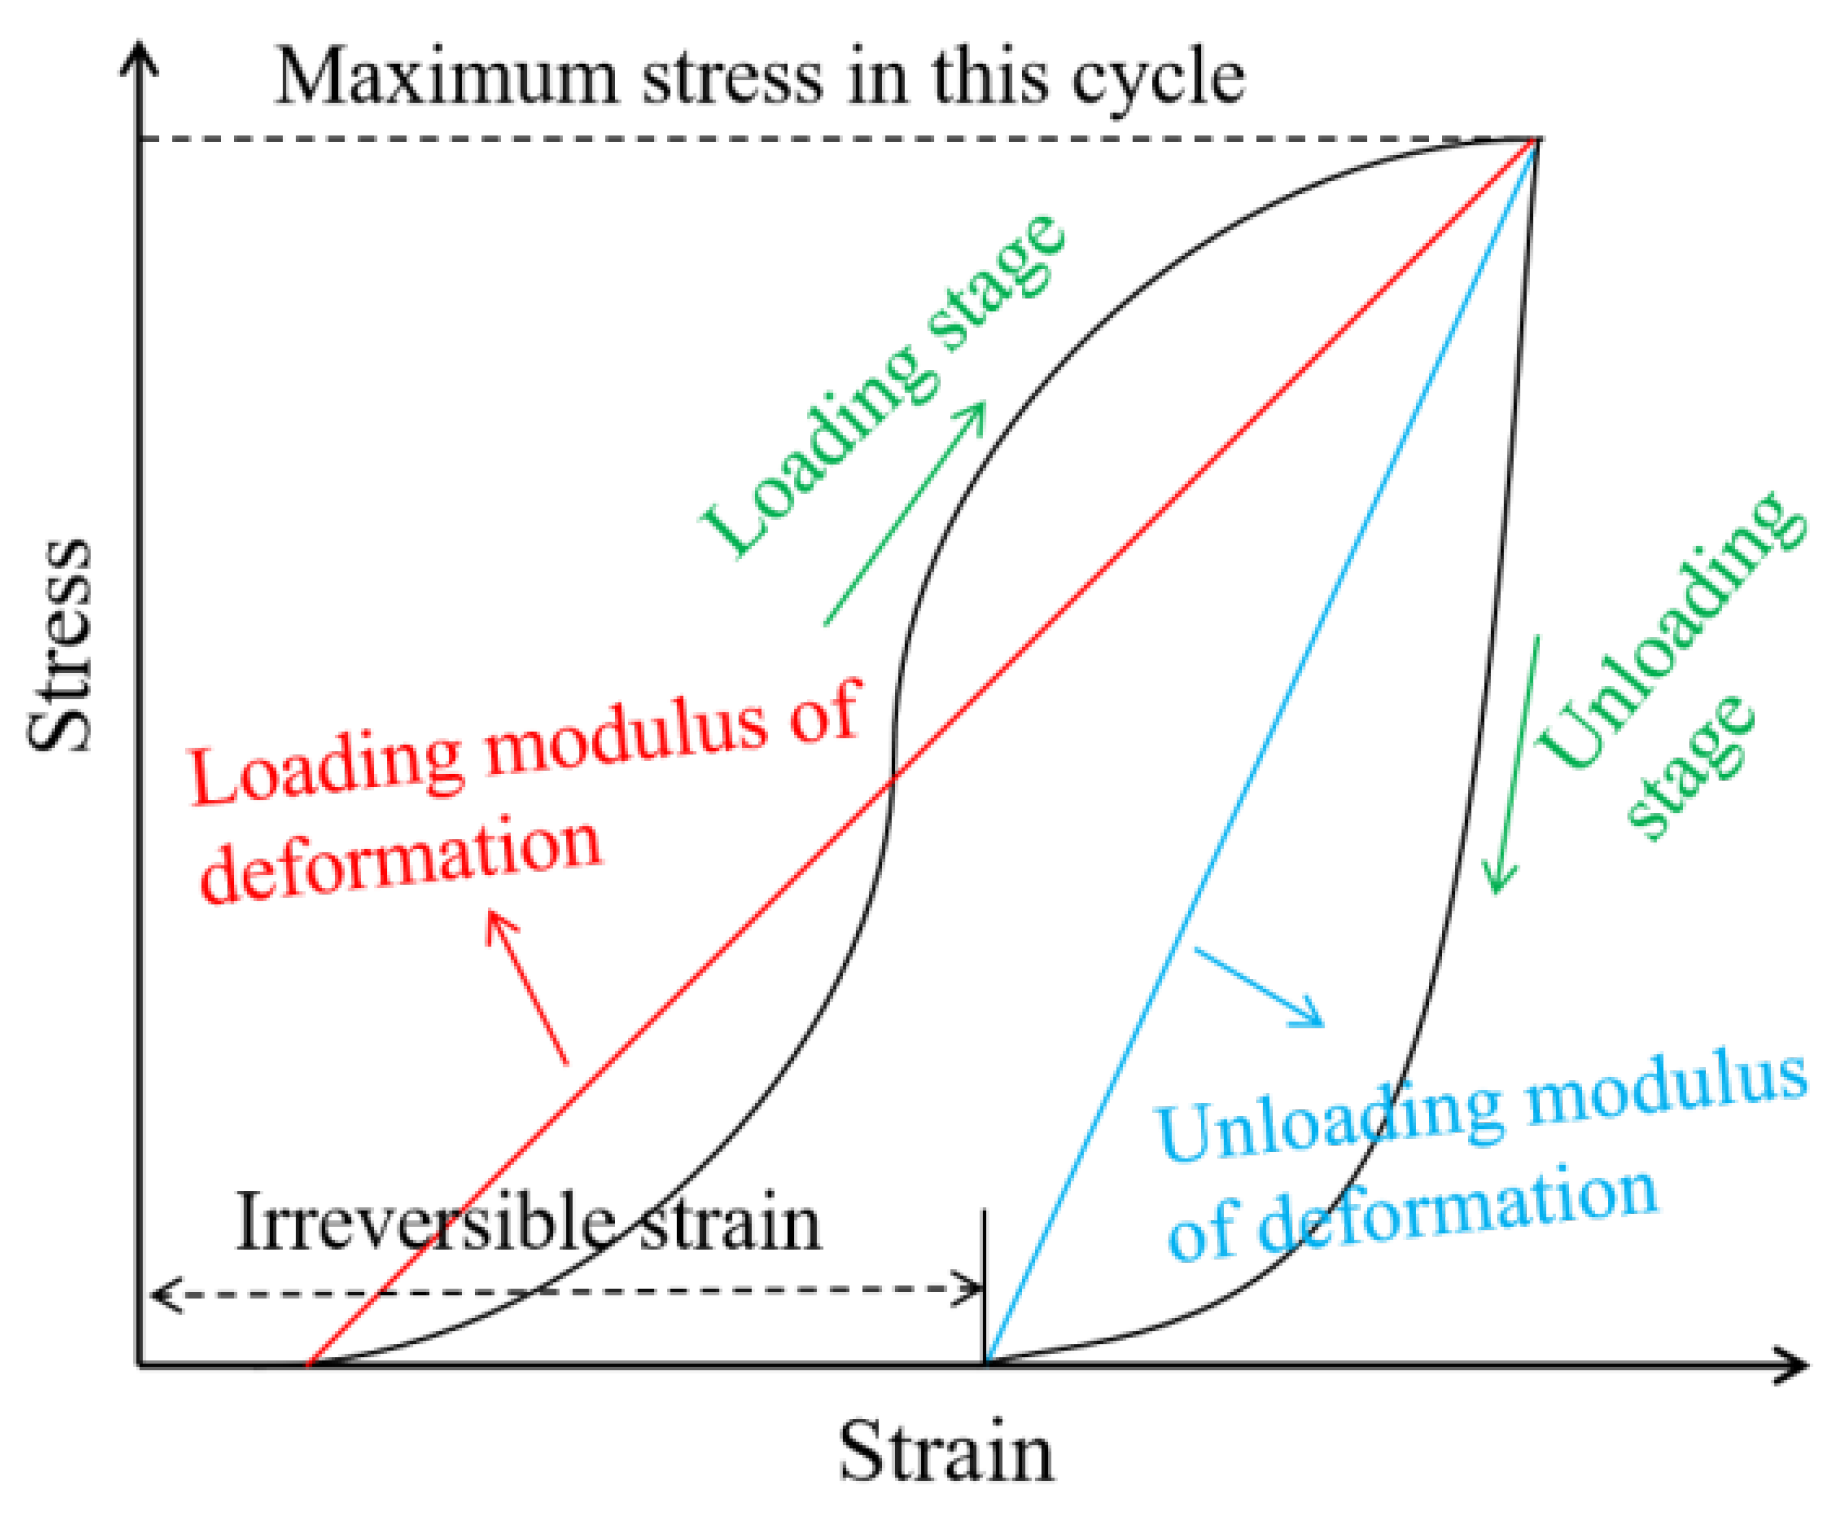
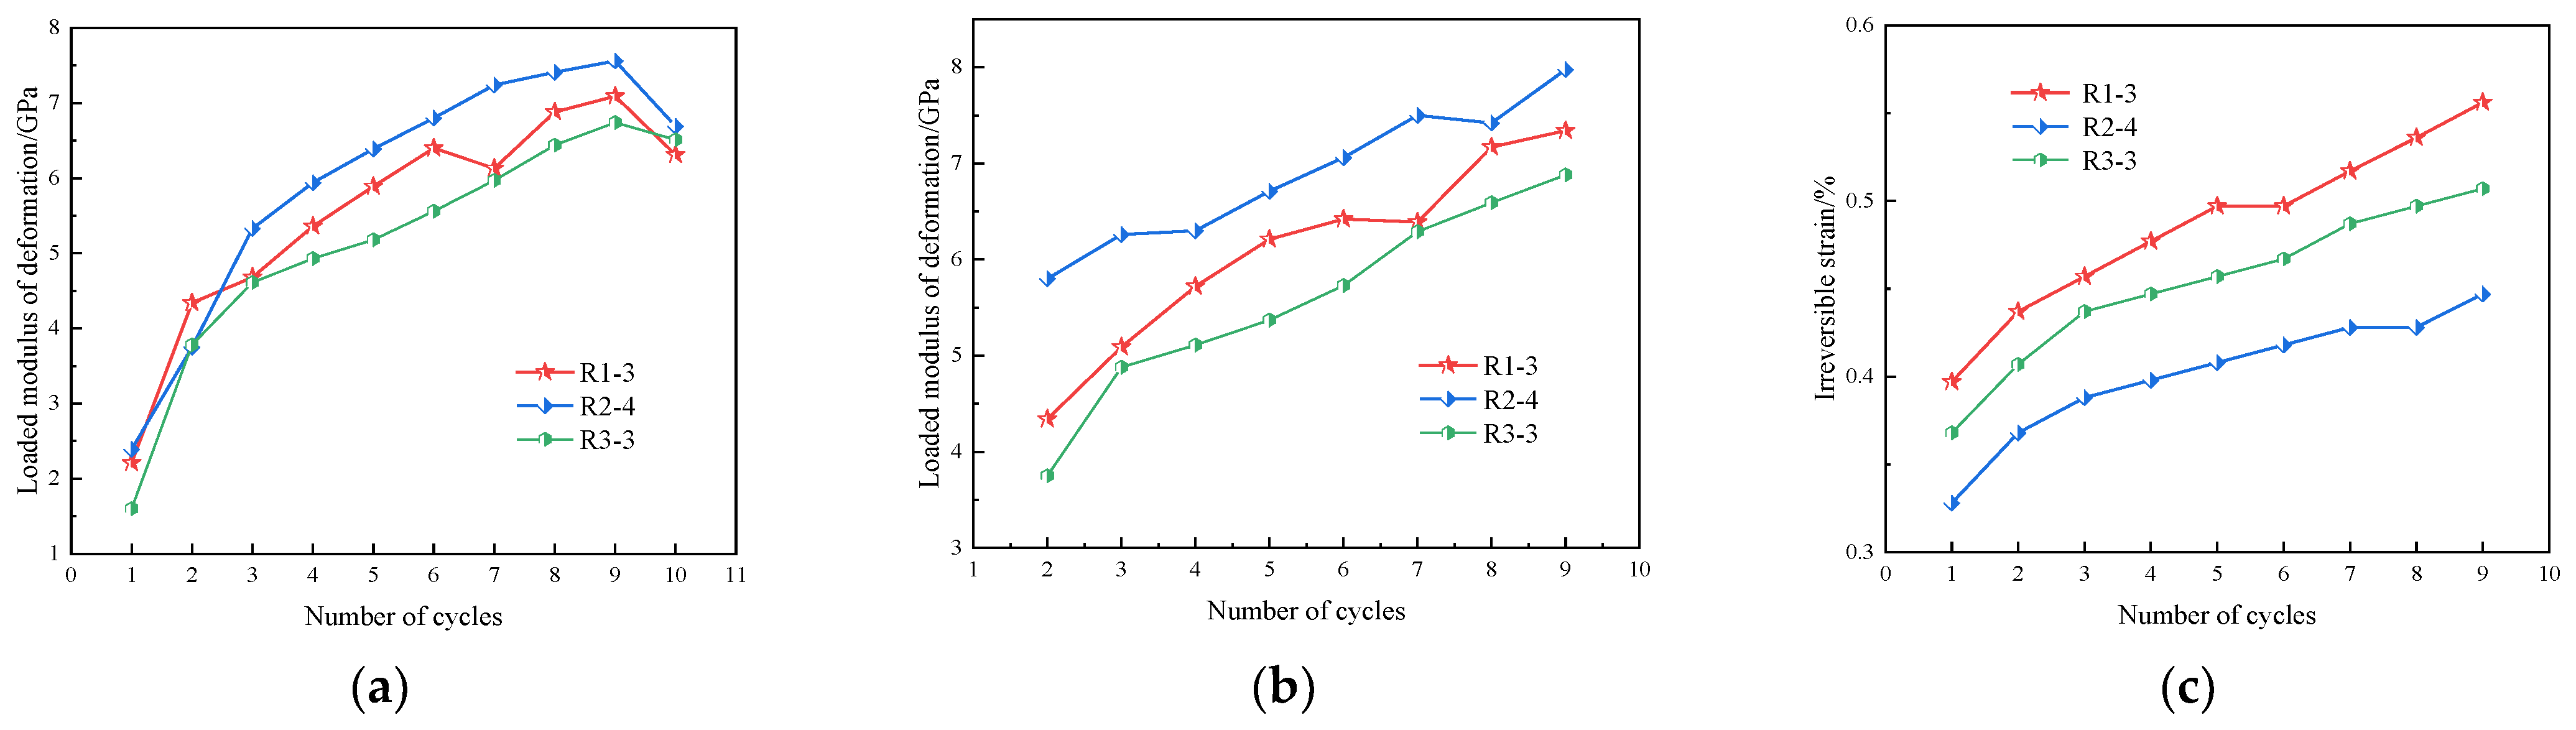
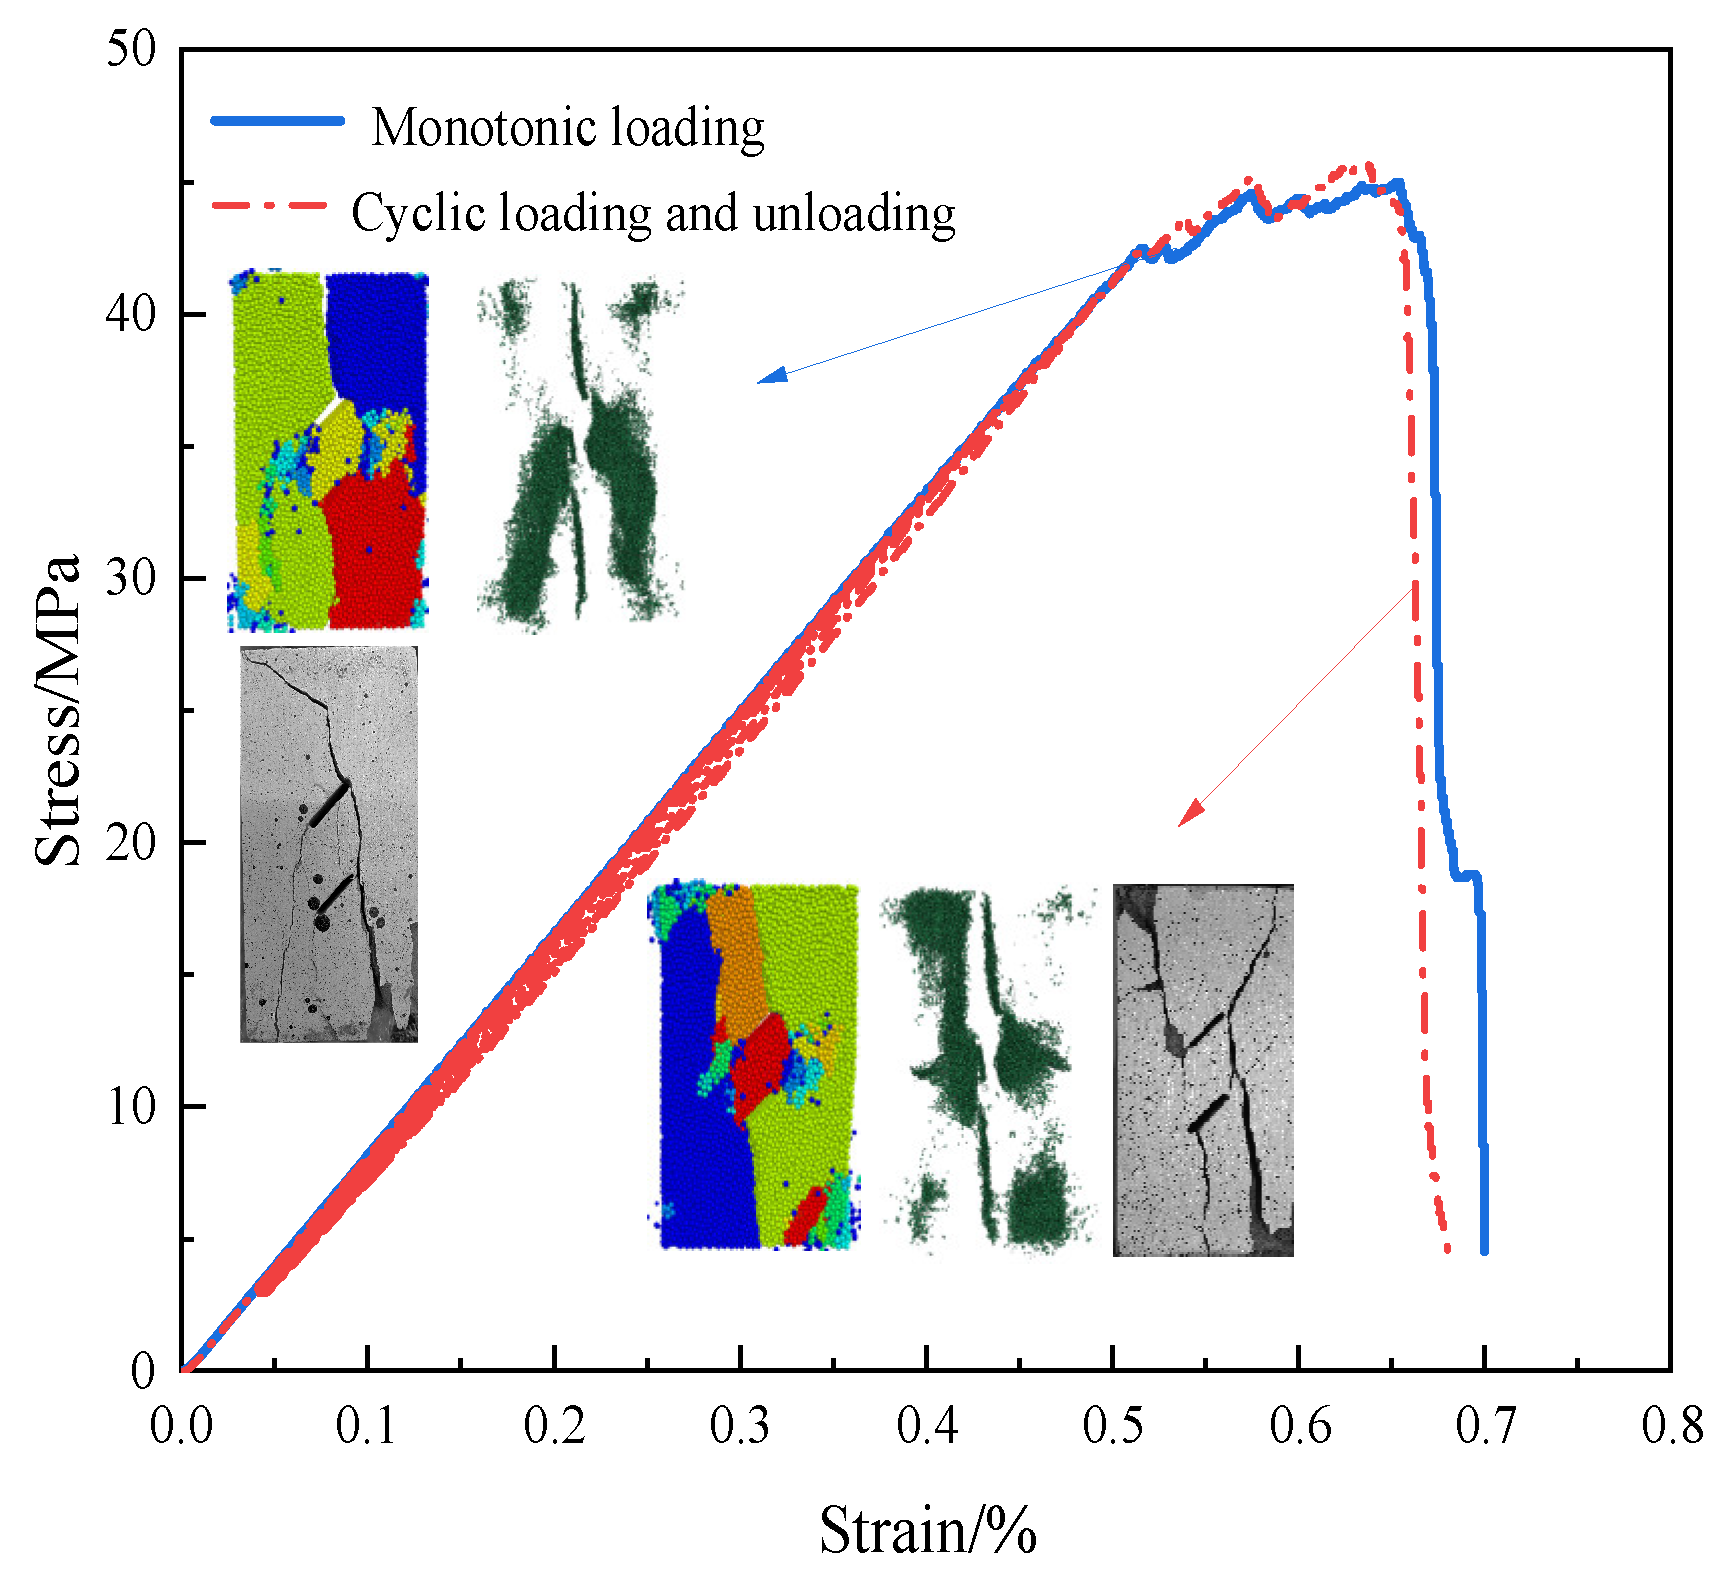
During the loading and unloading process of rocks, a cyclic strengthening phenomenon is observed, characterized by a continuous increase in the deformation modulus in the early and middle stages. Due to the compaction of fractures, the unloading deformation modulus is generally higher than the loading modulus. Among the samples, the one with parallel upper and lower structures (R1) exhibits the highest strength. In contrast, the sample with parallel left and right structures (R2) displays a higher susceptibility to stress concentration and through-going failure in the rock bridges due to its double-fracture arrangement, which is more conducive to the transmission of external forces. This leads to a weaker load-bearing capacity of the rock mass.
(2)
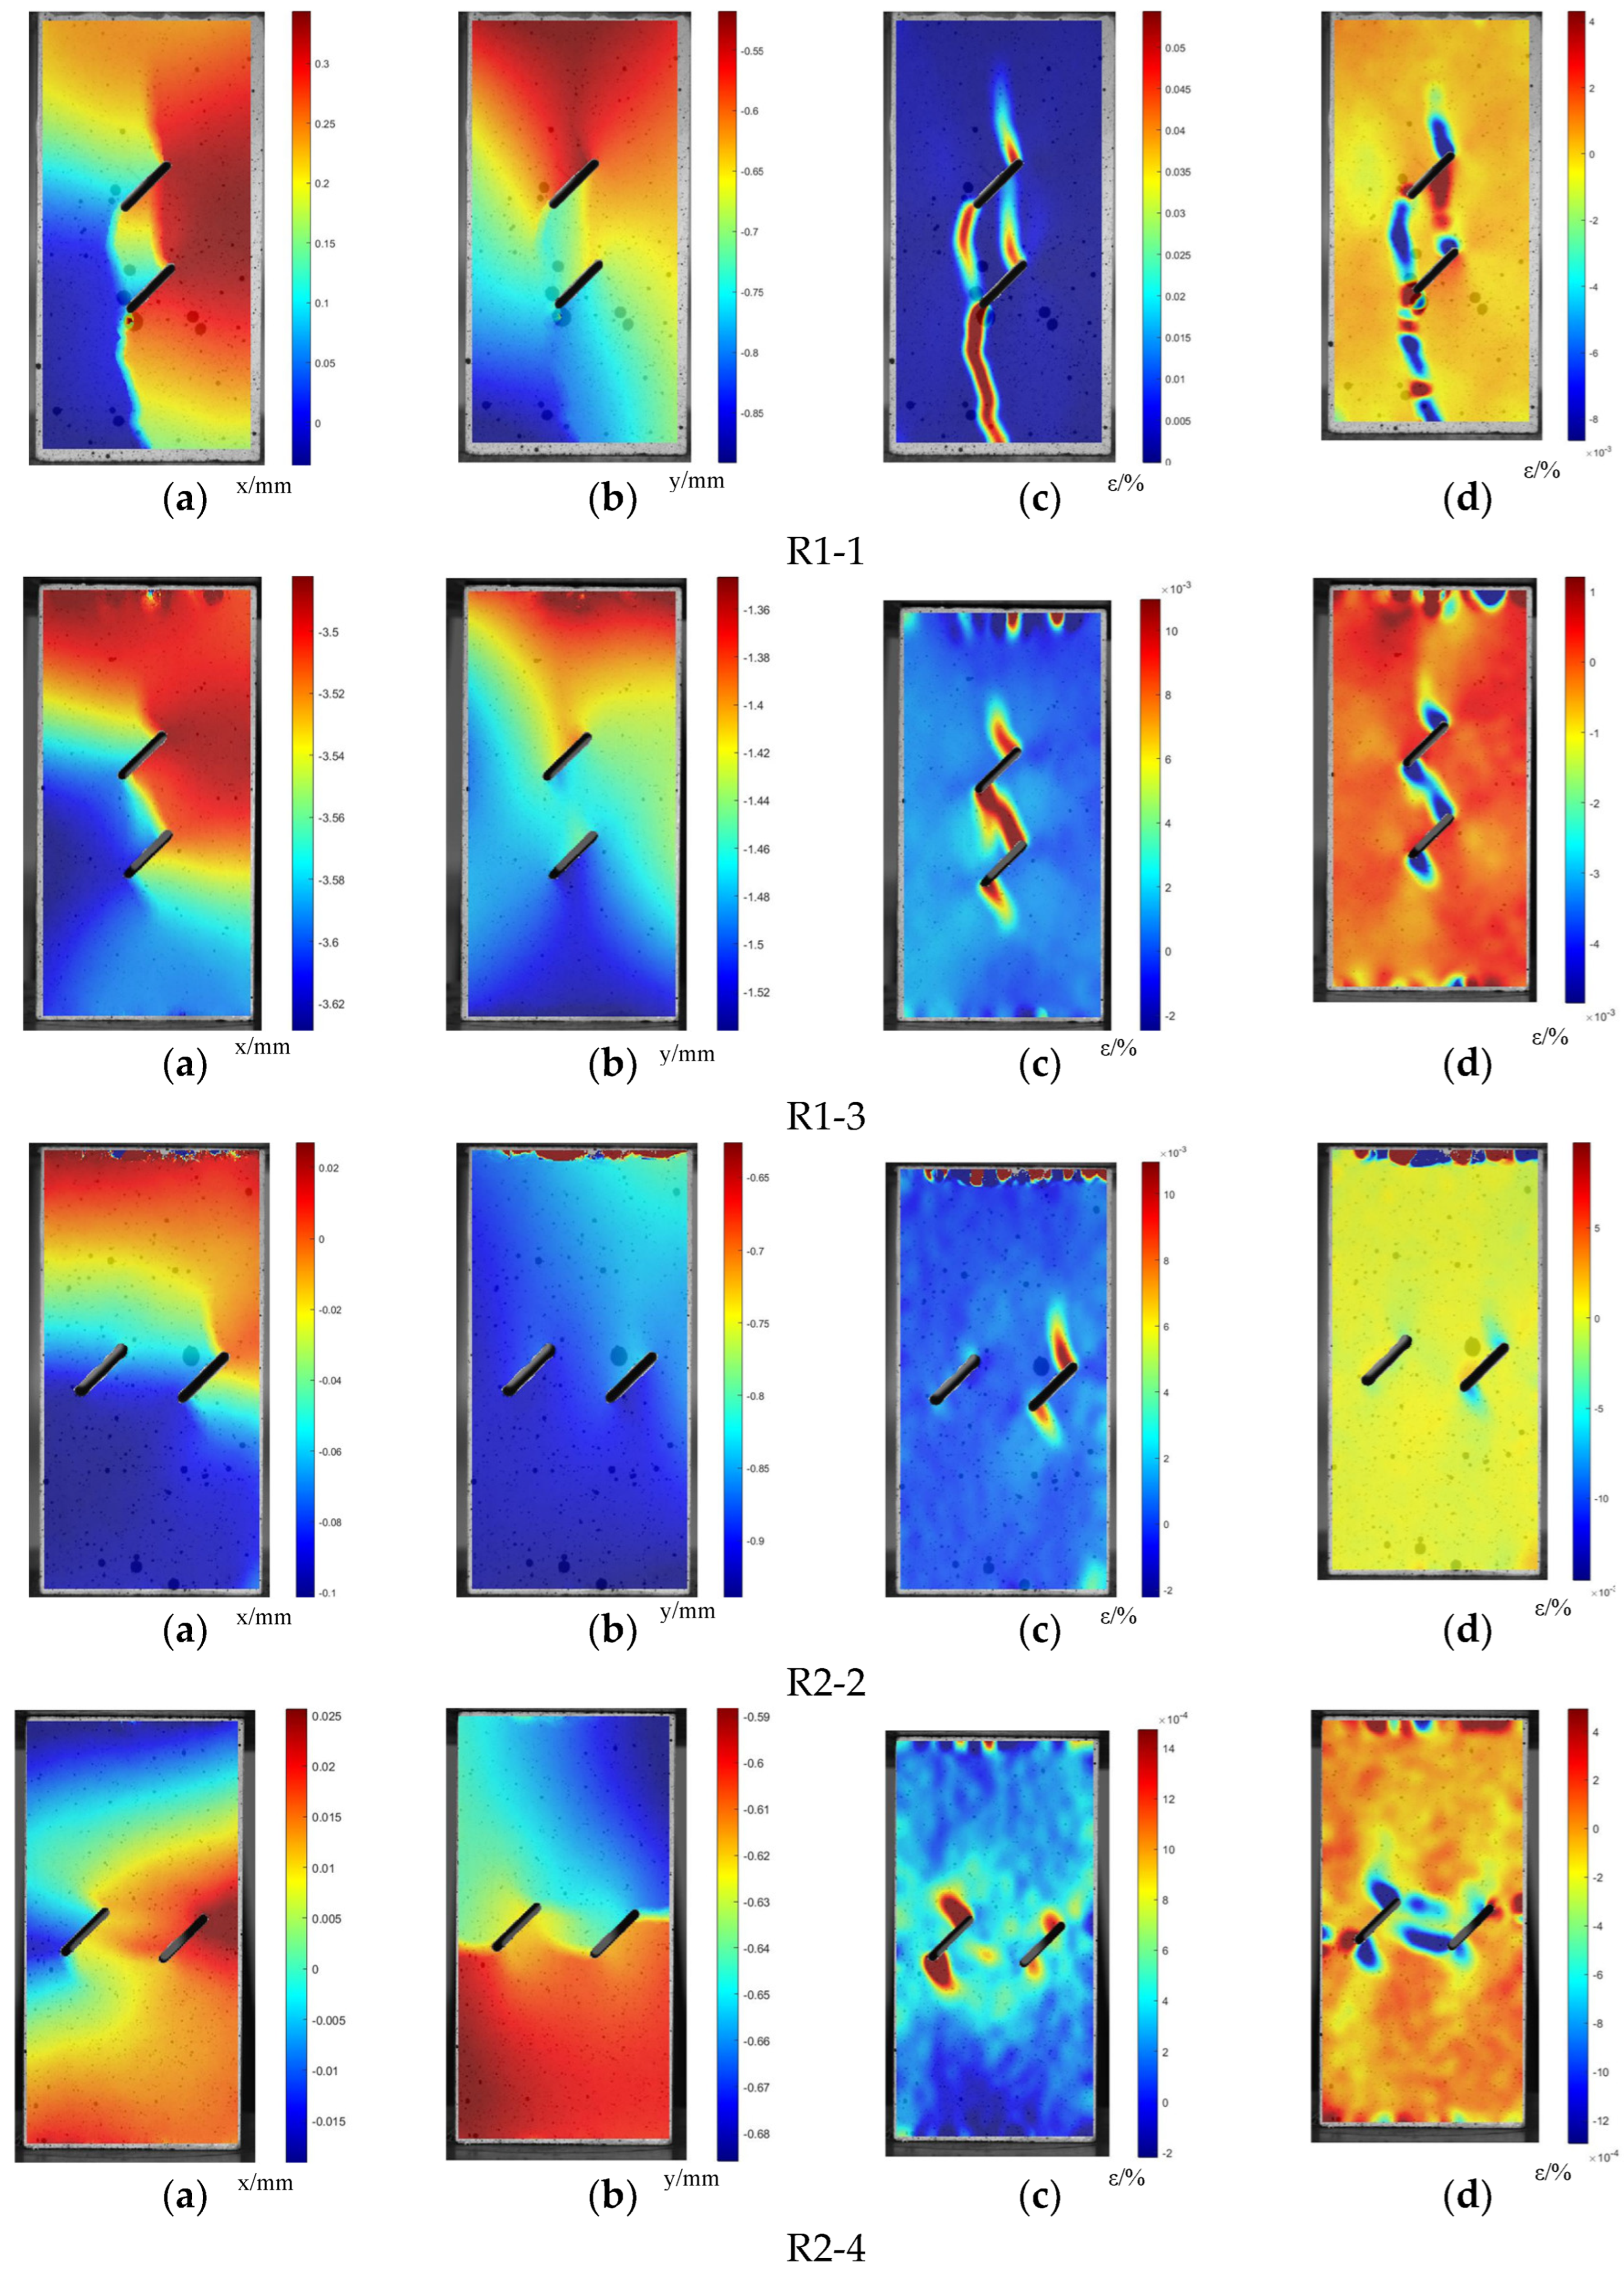
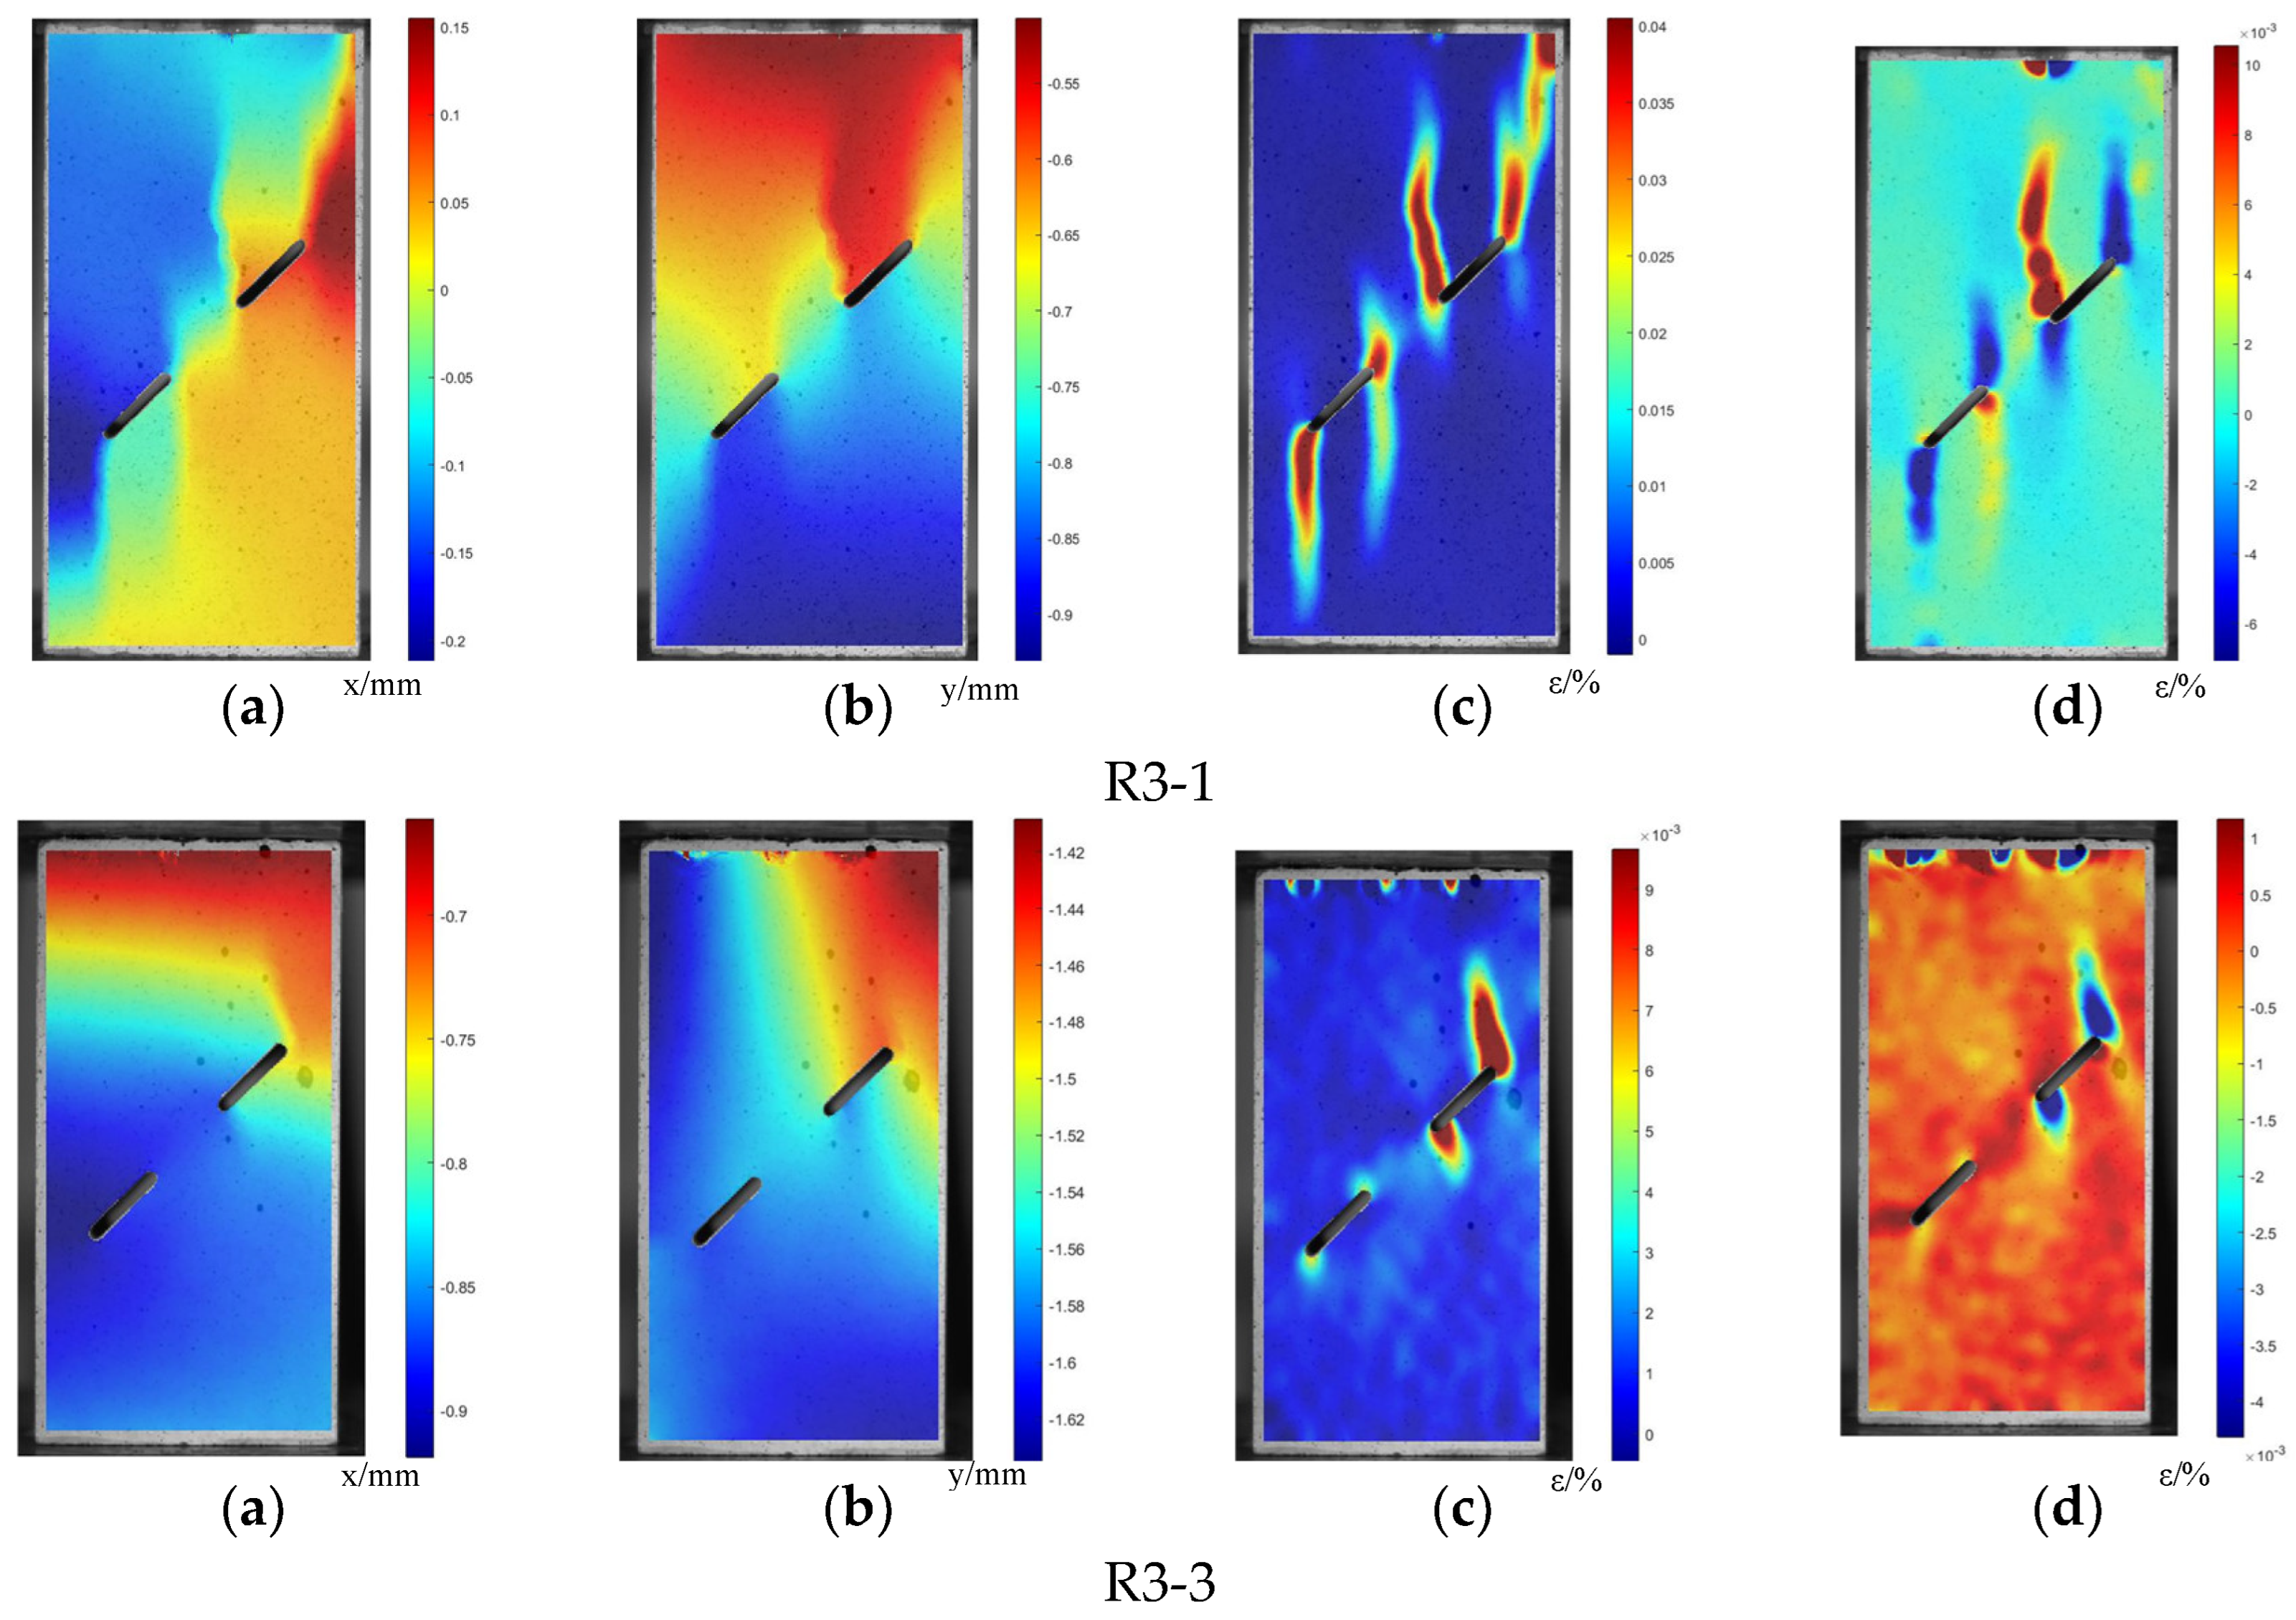
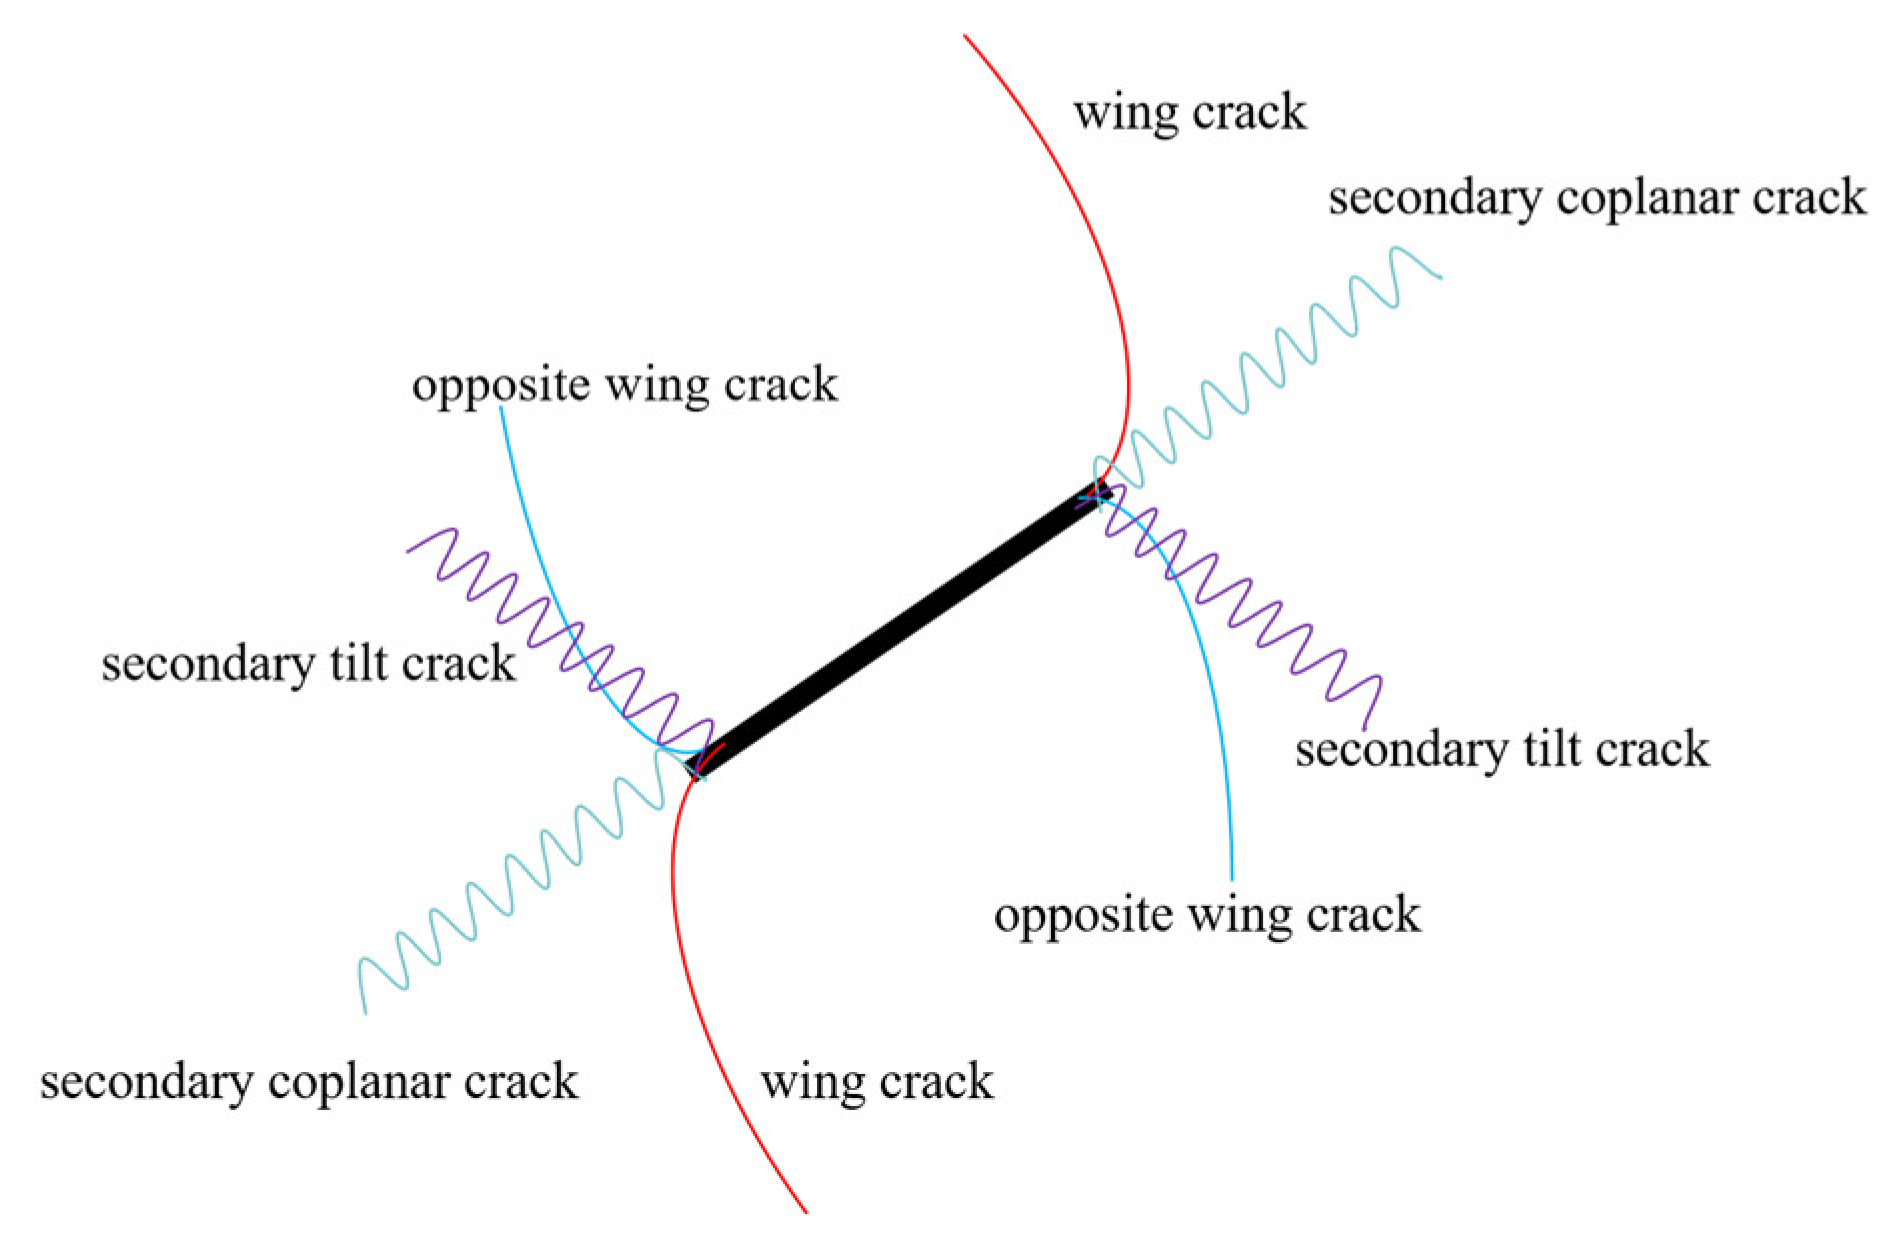
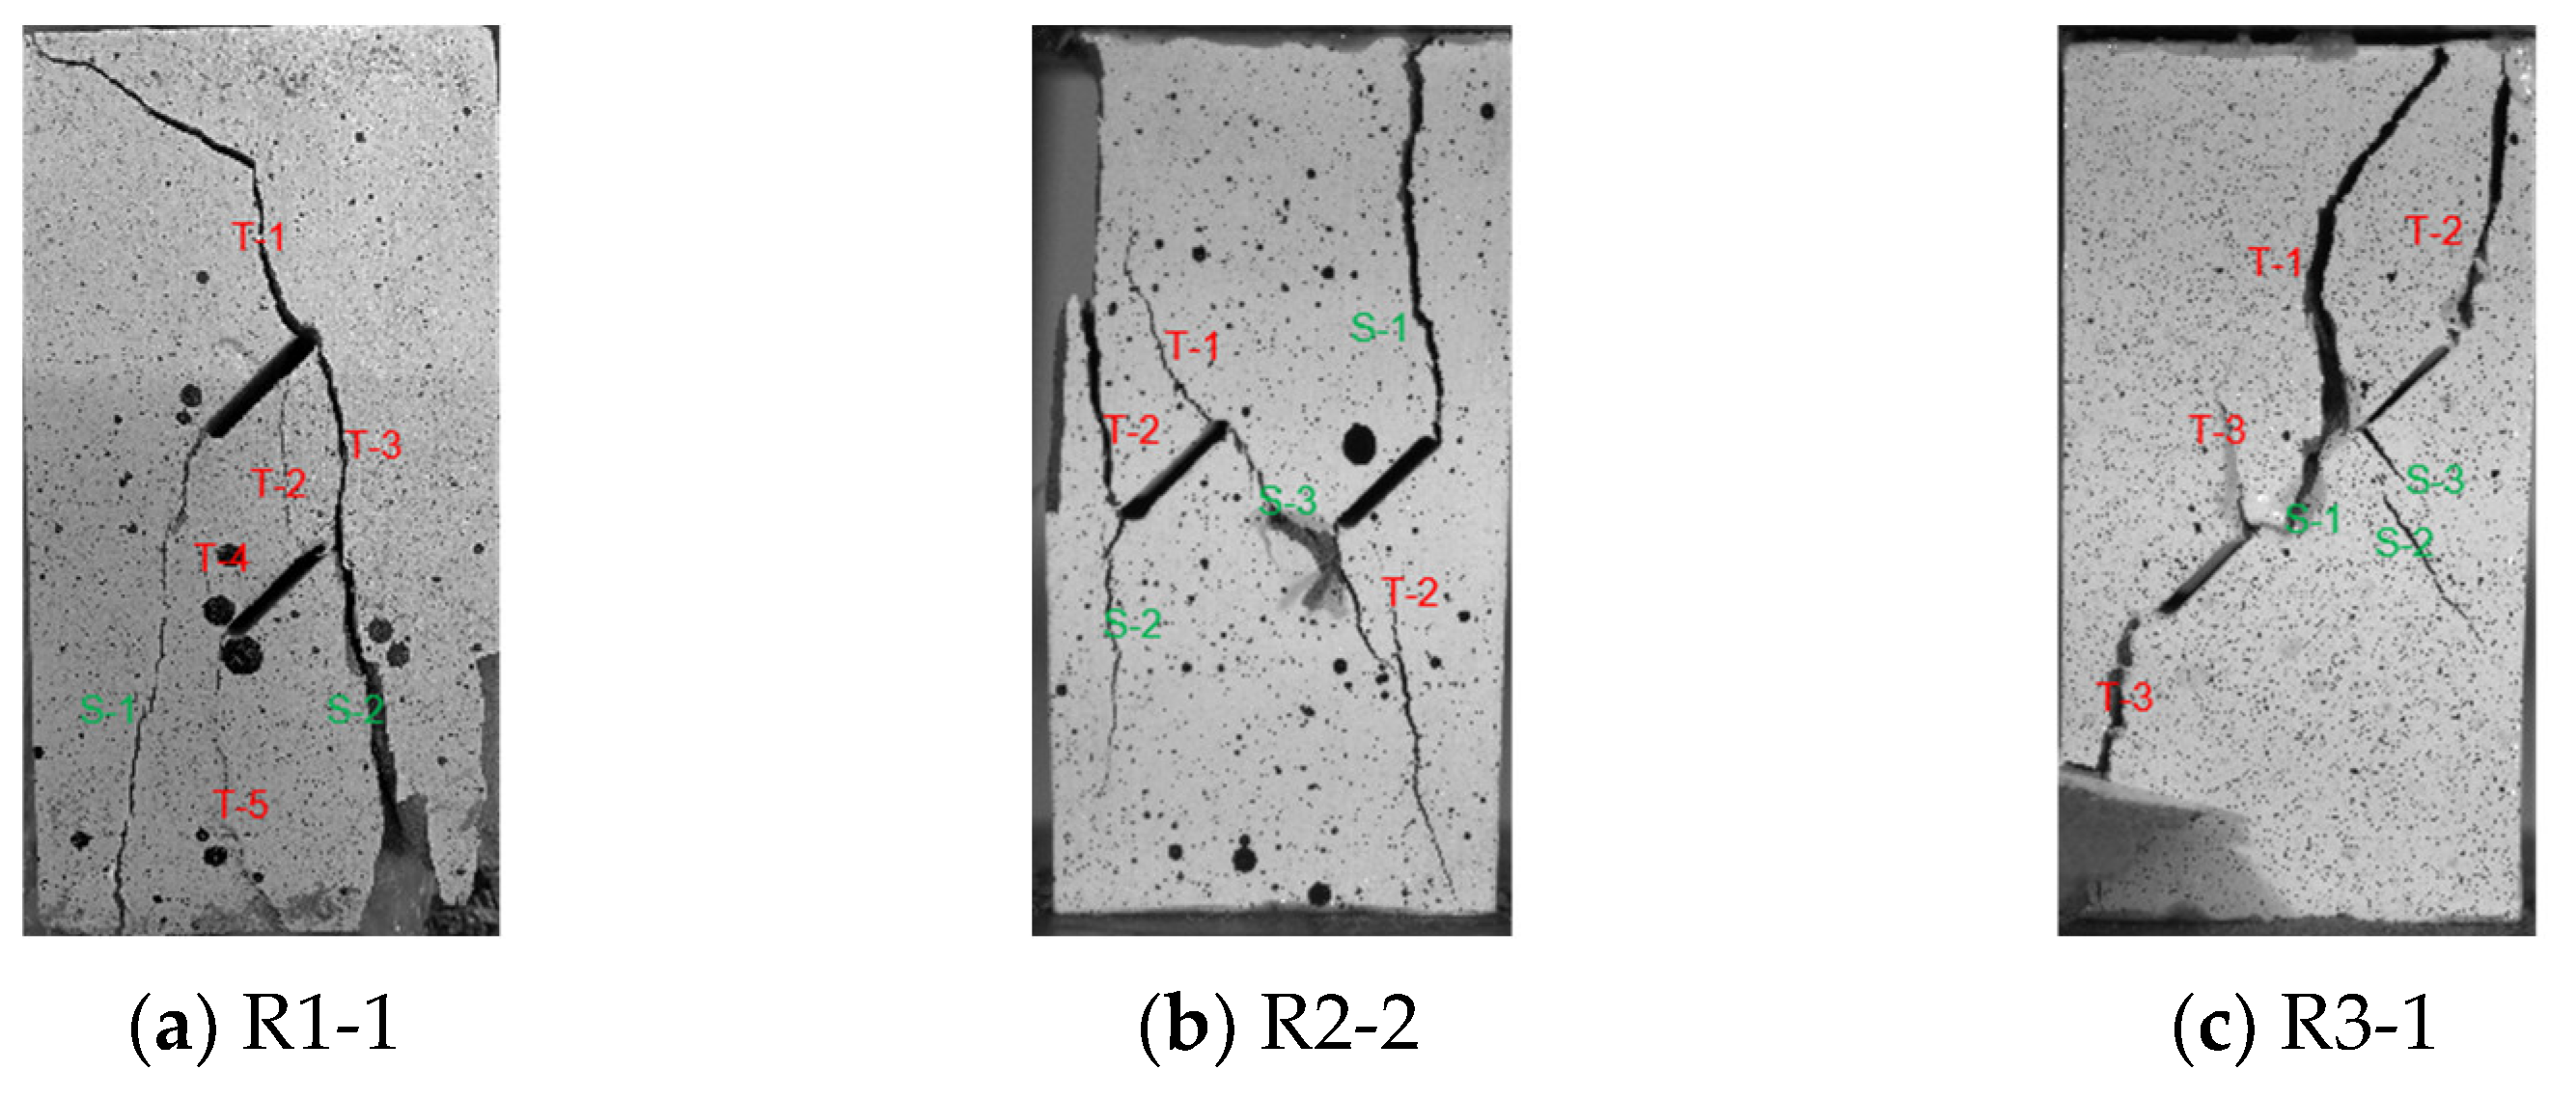
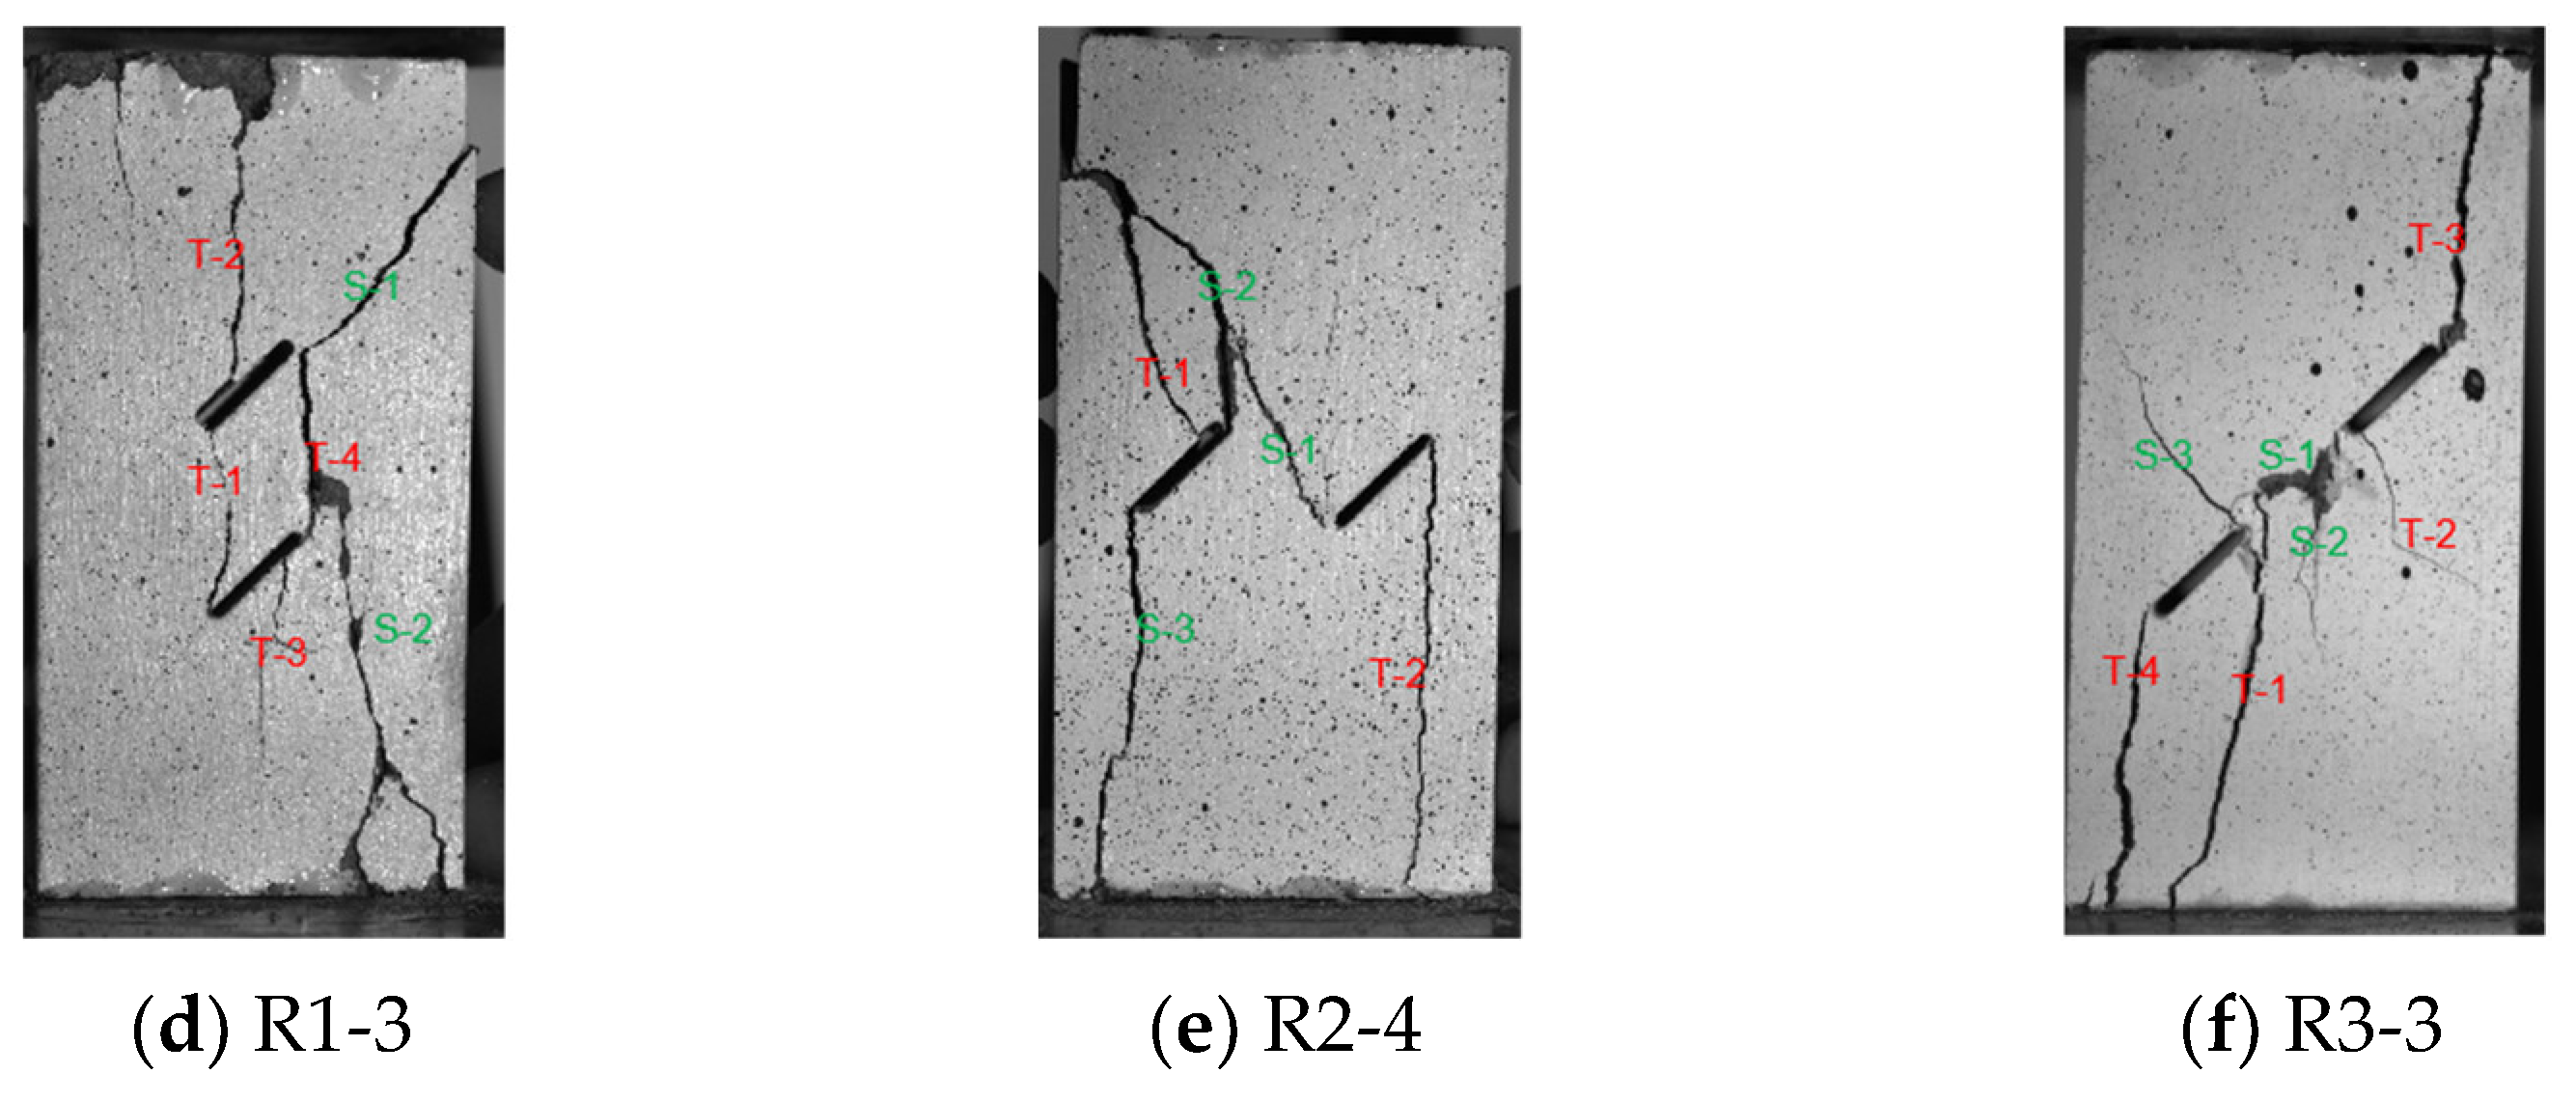
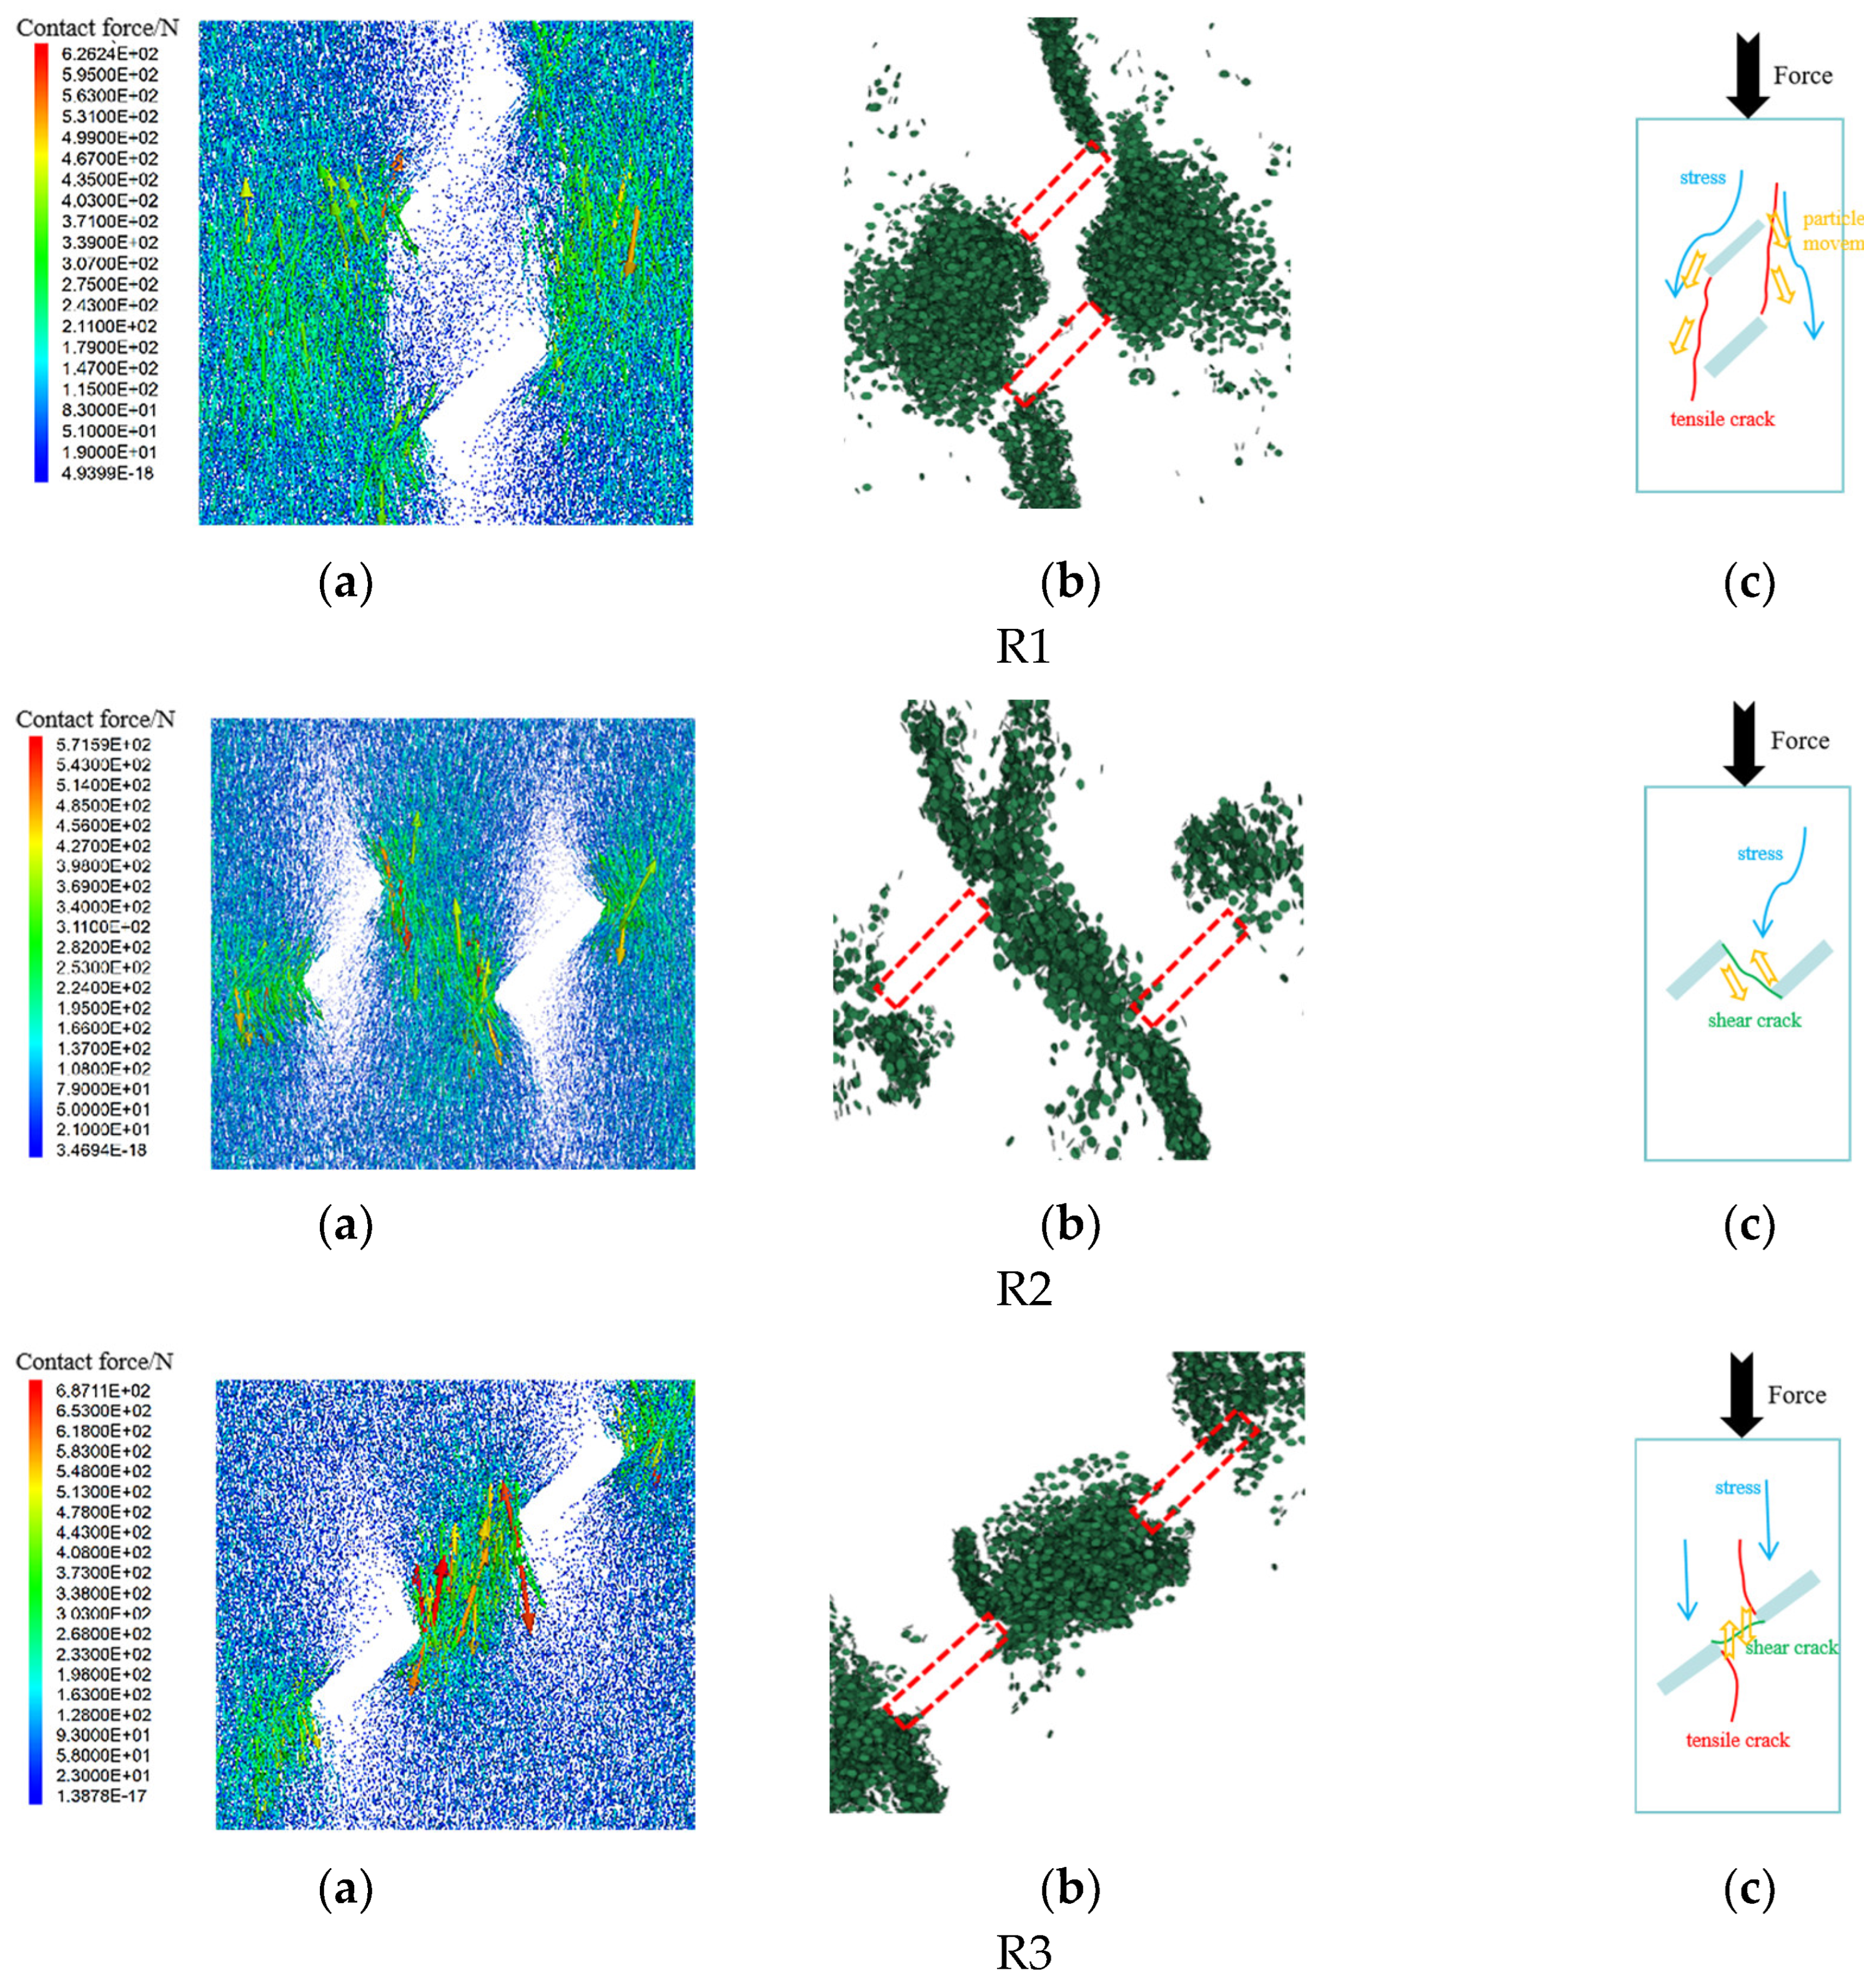
The fracture failure mechanisms of sandstone with doubly fractured structures in different spatial distributions were revealed through digital image correlation (DIC) technology and crack propagation characteristics. In R1-type samples, the initial failure was primarily driven by tensile wing cracks or anti-wing cracks, with tensile strains significantly exceeding shear strains, while the rock bridge remained intact. In contrast, R2 samples displayed a combination of tensile-shear failure, characterized by a pronounced shear strain field within the rock bridge region, where the failure was predominantly governed by shear cracks. In R3 samples, tensile cracks initiated at the far tip, extending along the direction of the maximum principal stress. The coalescence of the rock bridge in these samples was jointly dominated by tensile-shear cracks.
(3)
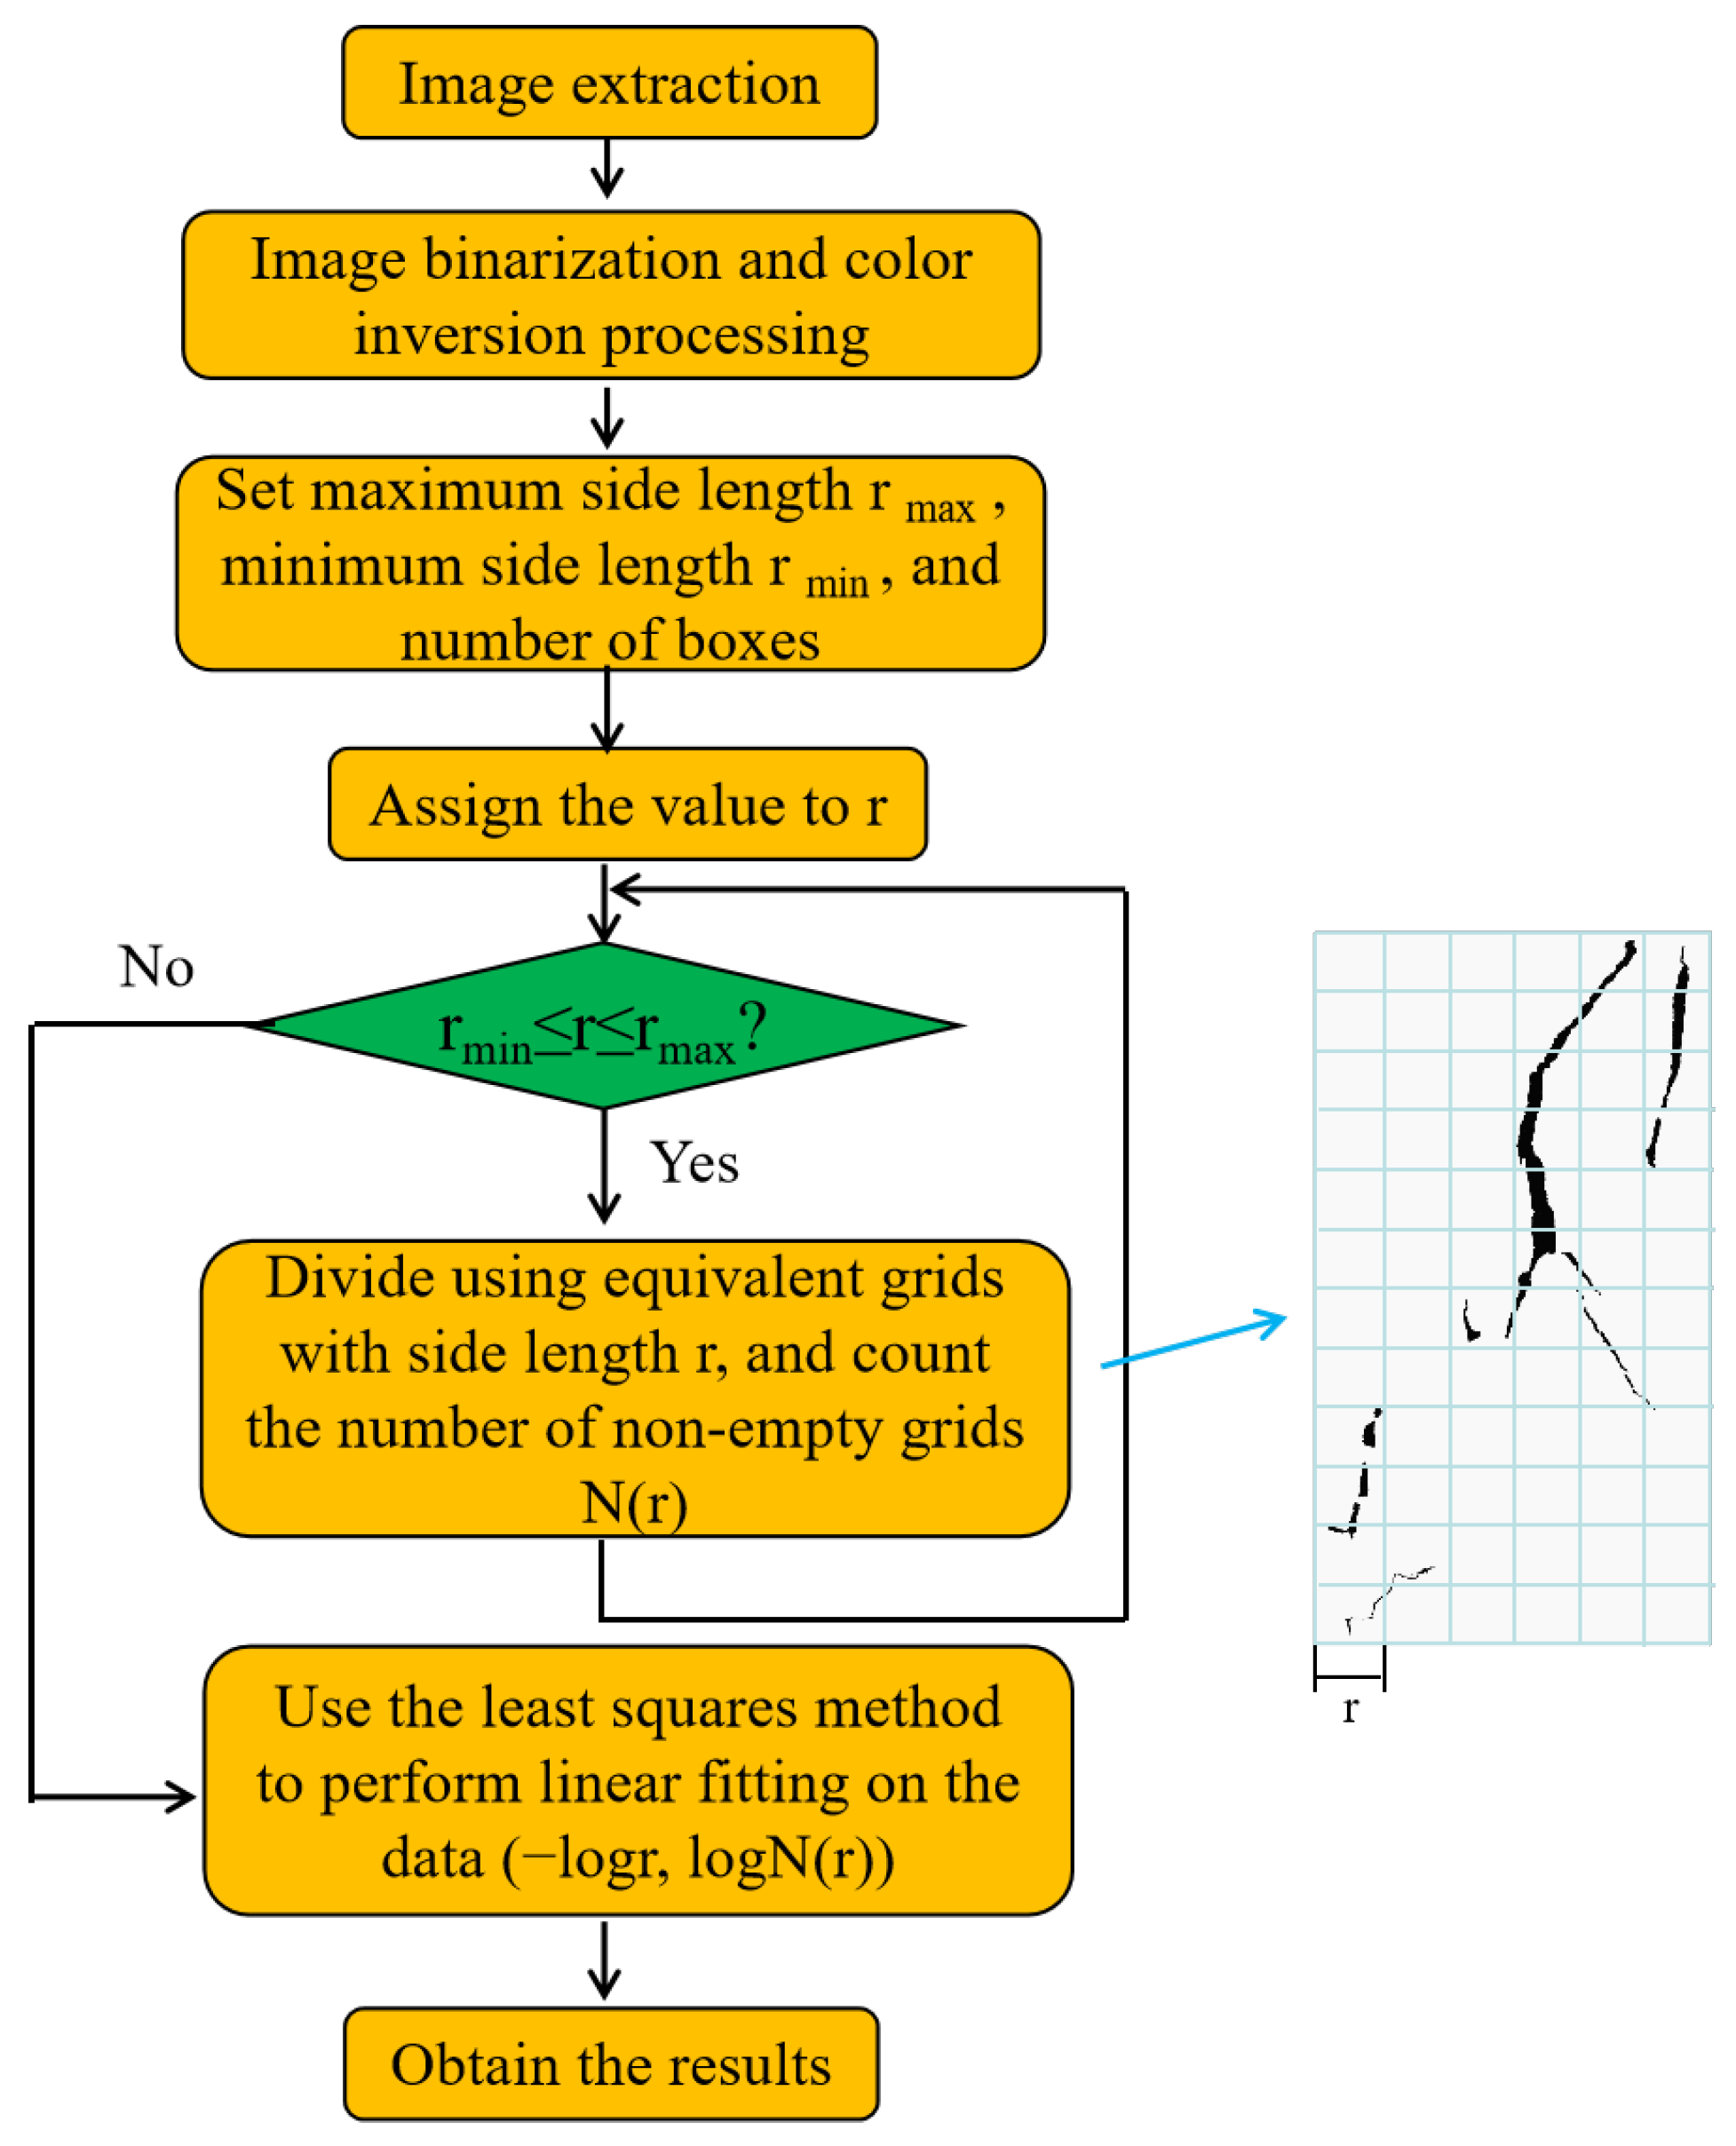
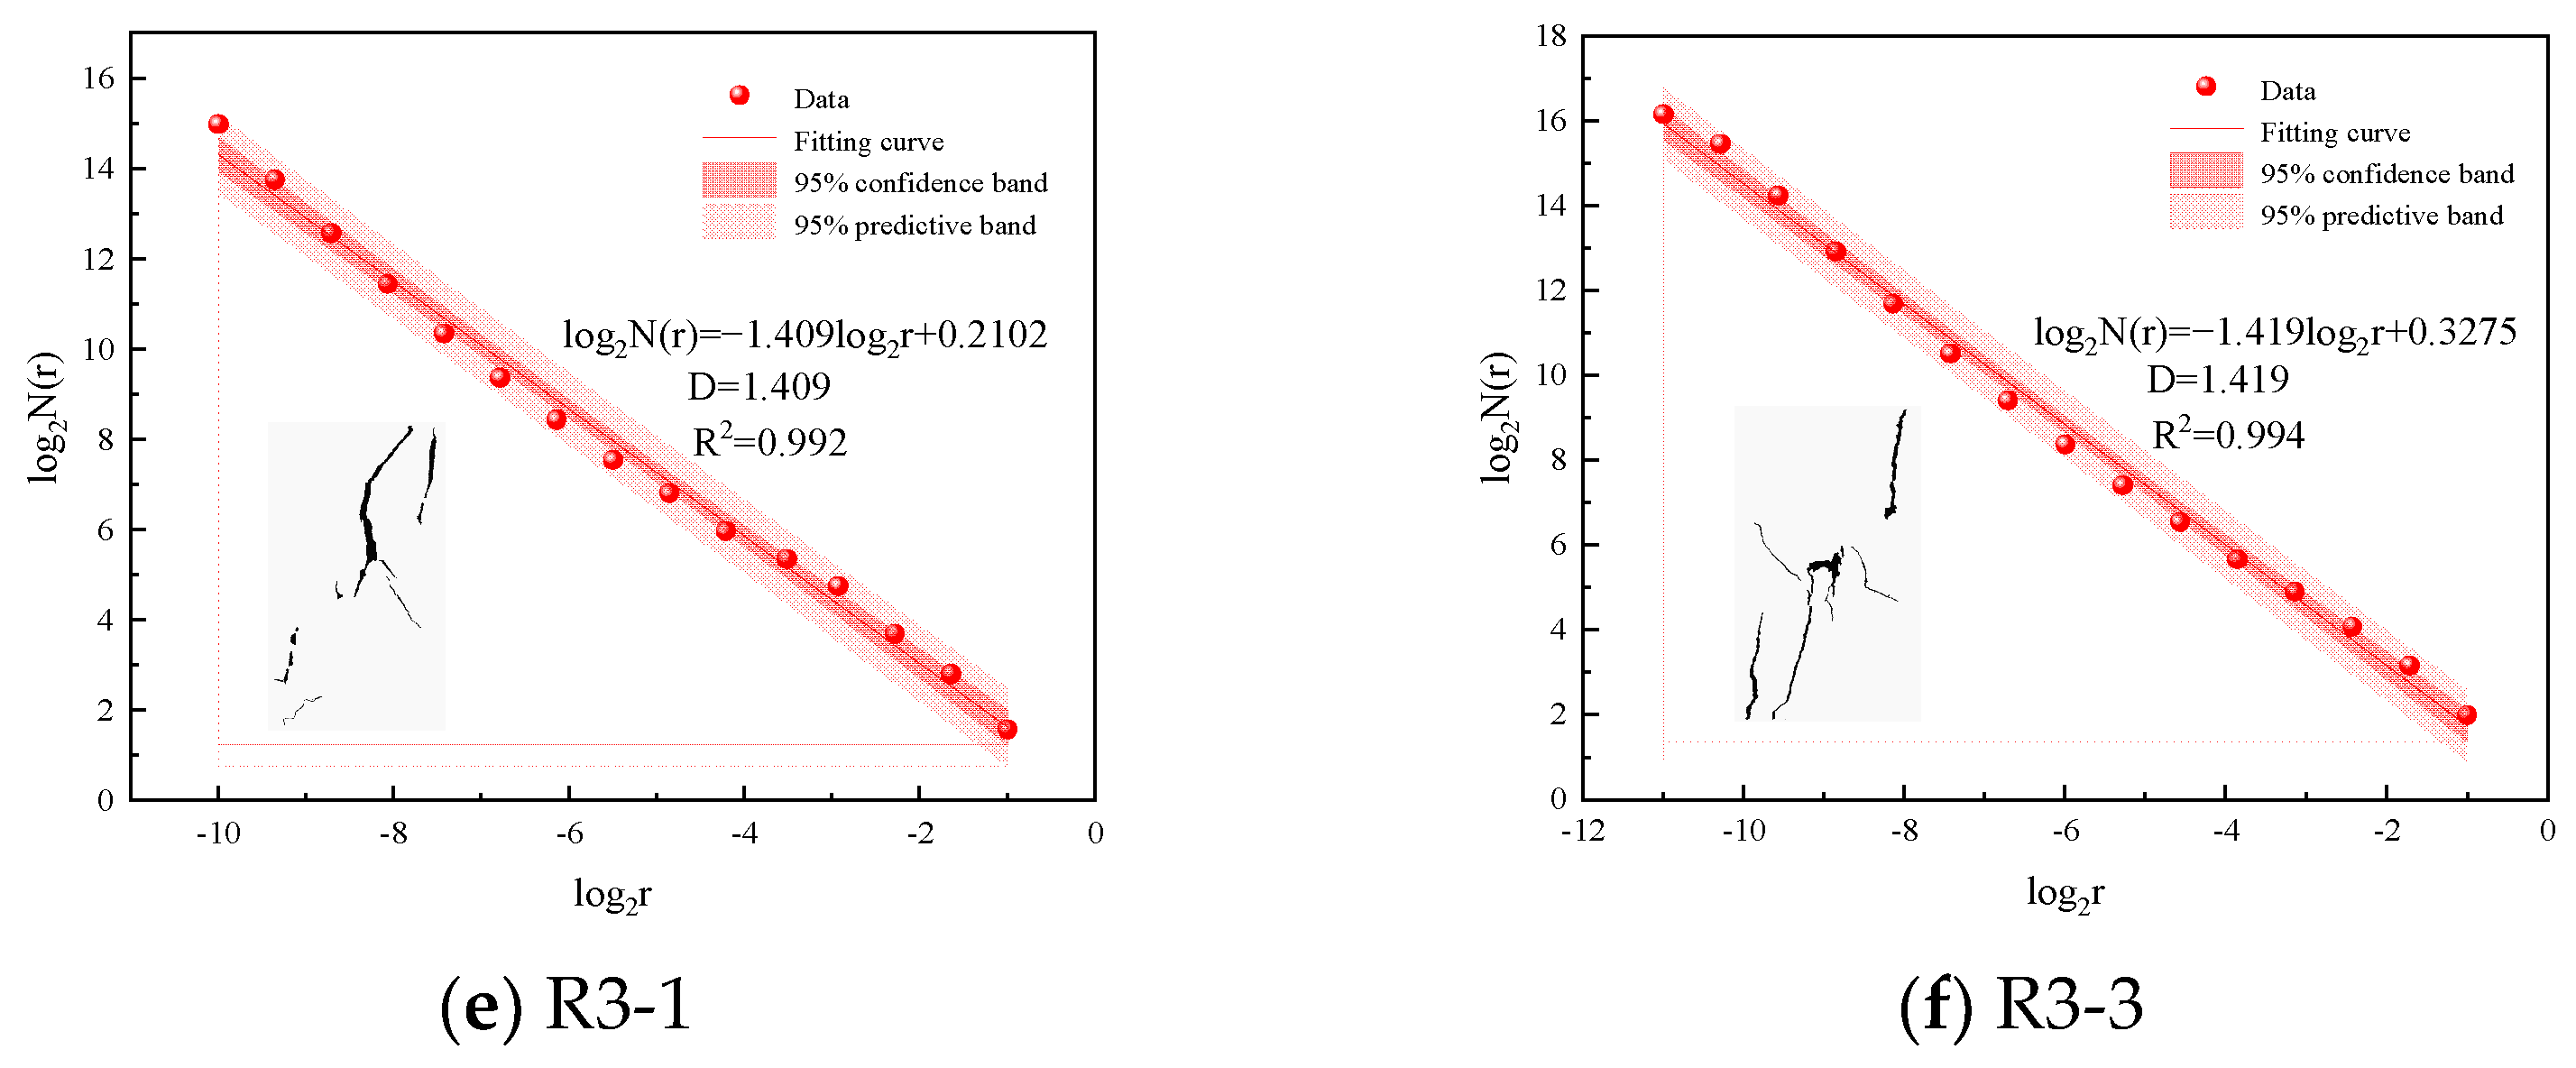
In comparison to monotonic loading, cyclic loading introduces repeated disturbances and cumulative fatigue damage, which significantly influence the initiation and propagation paths of new cracks. This process results in a notable increase in the fractal dimension of the fractured samples. The most substantial change in fractal dimension is observed in R1 samples, indicating increased complexity and disorder in crack propagation. In contrast, the cracks in R3 samples predominantly propagate along the pre-existing weak planes of the fractures, leading to relatively smaller changes in fractal dimension.
(4)
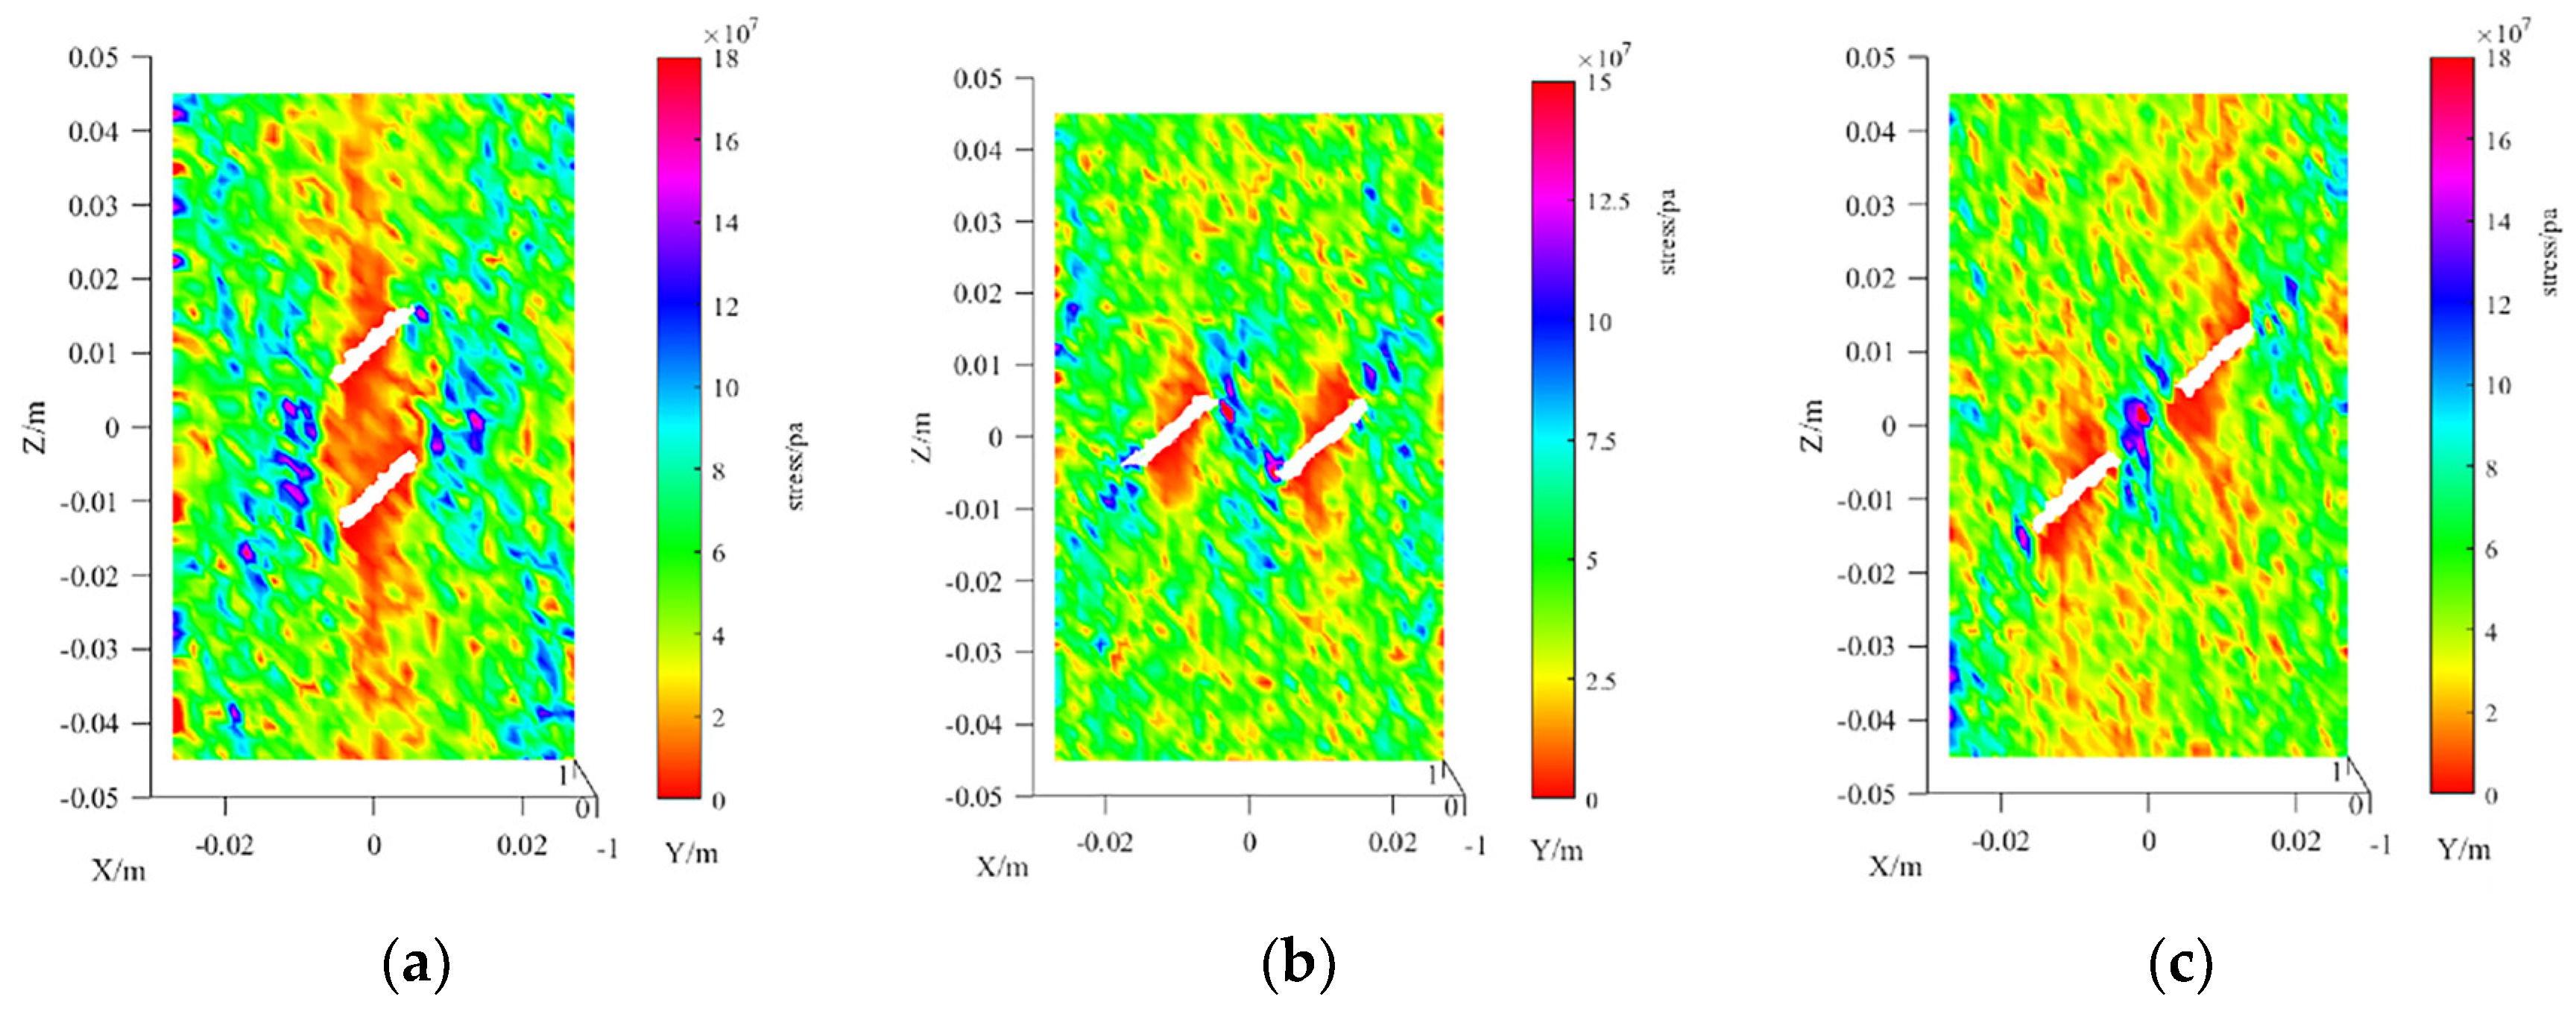
A numerical model of fractured rock was constructed using the discrete element method (DEM) to explore the mesoscopic failure mechanisms of the samples. The analysis of the force chain field and microcrack distribution reveals that an effective bearing surface develops at the upper fracture in R1 samples, while the stress shielding effect results in sparse force chains within the rock bridge region, resulting in reduced damage. Conversely, R2 and R3 samples exhibit significant stress field variations within the rock bridge, with pronounced particle dislocations, rendering them more susceptible to shear failure and crack coalescence. Furthermore, the equivalent stress contour plots provide a detailed visualization of the stress field distribution, which corresponds closely to the microcrack density maps, offering a reliable method for predicting mesoscopic failure patterns in fractured rocks.
(5)
This paper systematically studies the behavior of fractured rock samples under cyclic loading, advancing the understanding of the deformation and failure mechanisms of these masses, particularly as they are influenced by factors such as gravitational forces and engineering-induced disturbances. These insights gained from this research offer a theoretical framework for assessing the stability of and preventing disasters in multi-jointed rock slopes.

Author Contributions

L.S., investigation, experiment, software, formal analysis, validation, writing—original draft; P.L., resources, writing—review and editing, supervision, data curation; C.P., resources, writing—review and editing, supervision; P.J., writing—review and editing. All authors have read and agreed to the published version of the manuscript.

Funding

This research is funded by the Open Research Fund of The State Key Laboratory of Coal Resources and Safe Mining, CUMT (No. SKLCRSM22KF017), and Geological Environment and Underground Space Engineering Research Center of Jiangxi Province (No. JXDHJJ2022-07) and National Natural Science Foundation of China (No. 52304075).

Institutional Review Board Statement

Not applicable.

Informed Consent Statement

Not applicable.

Data Availability Statement

The data supporting the findings of this study are available from the corresponding author upon reasonable request.

Conflicts of Interest

The authors declare no conflicts of interest or personal relationships that could have influenced the research presented in this paper.

References

  1. Li, C.; Liu, N.; Liu, W.; Feng, R. Study on Characteristics of Energy Storage and Acoustic Emission of Rock under Different Moisture Content. Sustainability 2021, 13, 1041. [Google Scholar] [CrossRef]
  2. Zou, Q.L.; Chen, Z.H.; Zhan, J.F.; Chen, C.M.; Gao, S.K.; Kong, F.J.; Xia, X.F. Morphological evolution and flow conduction characteristics of fracture channels in fractured sandstone under cyclic loading and unloading. Int. J. Min. Sci. Technol. 2023, 33, 1527–1540. [Google Scholar] [CrossRef]
  3. Zhou, X.P.; Wang, Y.T.; Zhang, J.Z.; Liu, F.N. Fracturing behavior study of three-flawed samples by uniaxial compression and 3D digital image correlation: Sensitivity to brittleness. Rock Mech. Rock Eng. 2019, 52, 691–718. [Google Scholar] [CrossRef]
  4. Zhou, X.P.; Fu, L.; Ju, W.; Berto, F. An experimental study of the mechanical and fracturing behavior in PMMA sample containing multiple 3D embedded flaws under uniaxial compression. Theor. Appl. Fract. Mech. 2019, 101, 207–216. [Google Scholar] [CrossRef]
  5. Liu, X.W.; Liu, Q.S.; Liu, B.; Zhu, Y.G.; Zhang, P.L. Failure Behavior for Rocklike Material with Cross Crack under Biaxial Compression. J. Mater. Civ. Eng. 2019, 31, 06018025. [Google Scholar] [CrossRef]
  6. Yang, S.Q.; Jiang, Y.Z.; Xu, W.Y.; Chen, X.Q. Experimental investigation on strength and failure behavior of pre-cracked marble under conventional triaxial compression. Int. J. Solids Struct. 2008, 45, 4796–4819. [Google Scholar] [CrossRef]
  7. Wang, Z.H.; Sun, W.C.; Shui, Y.T.; Liu, P.J. Mining-induced stress rotation trace and its sensitivity to face advanced direction in kilometer deep longwall panel with large face length. J. China Coal Soc. 2022, 47, 634–650. [Google Scholar]
  8. Zhang, C.; Zhang, L. Permeability Characteristics of Broken Coal and Rock Under Cyclic Loading and Unloading. Nat. Resour. Res. 2019, 28, 1055–1069. [Google Scholar] [CrossRef]
  9. Li, X.; Yao, Z.; Huang, X.; Liu, X.; Fang, Y.; Xu, Y. Mechanical Properties and Energy Evolution of Fractured Sandstone under Cyclic Loading. Materials 2022, 15, 6116. [Google Scholar] [CrossRef]
  10. Zhang, L.; Niu, F.; Liu, M.; Luo, J.; Ju, X. Mechanical Behavior of Cracked Rock in Cold Region Subjected to Step Cyclic Loading. Geofluids 2022, 2022, 6220549. [Google Scholar] [CrossRef]
  11. Zhao, Y.; Li, Q.; Zhang, K.; Yang, Y.; Gu, X. Effect of fissure angle on energy evolution and failure characteristics of fractured rock under uniaxial cyclic loading. Sci. Rep. 2023, 13, 2678–2687. [Google Scholar] [CrossRef]
  12. Wu, T.H.; Zhou, Y.; Wang, L.; Sun, J.H.; Zhao, H.; Sun, Z. Mesoscopic study of interaction mechanism between circular hole and fissures in rock under uniaxial compression. Rock Soil Mech. 2018, 39, 463–472. [Google Scholar]
  13. Liu, W.; Cheng, W.; Liu, X.F.; Zhang, Z.Q.; Yue, Z.W.; Yang, L.Y.; Shen, A. Effects of Loading Rate and Notch Geometry on Dynamic Fracture Behavior of Rocks Containing Blunt V-Notched Defects. Rock Mech. Rock Eng. 2024, 57, 2501–2521. [Google Scholar] [CrossRef]
  14. Liu, W.; Hu, C.; Li, L.; Zhang, X.; Peng, L.; Qiao, Y.; Yue, Z. Experimental study on dynamic notch fracture toughness of V-notched rock samples under impact loads. Eng. Fract. Mech. 2022, 259, 108109. [Google Scholar] [CrossRef]
  15. Xing, Y.; Huang, B.; Ning, E.; Zhao, L.; Jin, F. Quasi-static loading rate effects on fracture process zone development of mixed-mode (I-II) fractures in rock-like materials. Eng. Fract. Mech. 2020, 240, 107365. [Google Scholar] [CrossRef]
  16. Sui, L.; Wang, H.; Wu, J.; Zhang, J.; Yu, J.; Ma, X.; Sun, Q. Fractal Description of Rock Fracture Networks Based on the Space Syntax Metric. Fractal Fract. 2022, 6, 353. [Google Scholar] [CrossRef]
  17. Sui, L.; Ju, Y.; Yang, Y.; Yang, Y.; Li, A. A quantification method for shale fracability based on analytic hierarchy process. Energy 2016, 115, 637–645. [Google Scholar] [CrossRef]
  18. Mecholsky, J.J.; Passoja, D.E.; Feinberg-Ringel, K.S. Quantitative analysis of brittle fracture surfaces using fractal geometry. J. Am. Ceram. Soc. 2010, 72, 1–12. [Google Scholar] [CrossRef]
  19. Yang, B.; Liu, Y. Application of Fractals to Evaluate Fractures of Rock Due to Mining. Fractal Fract. 2022, 6, 96. [Google Scholar] [CrossRef]
  20. Pavičić, I.; Duić, Ž.; Vrbaški, A.; Dragičević, I. Fractal Characterization of Multiscale Fracture Network Distribution in Dolomites: Qutcrop Analogue of Subsurface Reservoirs. Fractal Fract. 2023, 7, 676. [Google Scholar] [CrossRef]
  21. Niu, Z.J.; Wang, X.F.; Zhang, L.; Wang, J.Y.; Chang, Z.C.; Qian, C.L.; Chen, X.Y. Investigation into the Failure Characteristics and Mechanism of Rock with Single Eliptical Defects under Ultrasonic Vibrations. Fractal Fract. 2024, 8, 261. [Google Scholar] [CrossRef]
  22. Zhao, Z.H.; Suo, Y.F.; Zhang, L.; Wang, J.; Zhao, X.G.; Liu, B.; Zhao, Y.Y.; Zhang, S. Effect of pre-existing infilled fracture on characteristics of failure zones around circular opening. Comput. Geotech. 2024, 169, 106228. [Google Scholar] [CrossRef]
  23. Zhang, X.P.; Wong, L. Cracking process in rock-like material containing a single flaw under uniaxial compression: A numerical study based on parallel bonded-particle model approach. Rock Mech. Rock Eng. 2012, 45, 711–737. [Google Scholar]
  24. Zhou, X.P.; Zhang, J.Z.; Yang, S.Q.; Berto, F. Compression-induced crack initiation and growth in flawed rocks: A review. Fatigue Fract. Eng. Mater. Struct. 2021, 44, 1681–1707. [Google Scholar] [CrossRef]
  25. Huang, D.; Cen, D.F.; Ma, G.W.; Huang, R.Q. Step-path failure of rock slopes with intermittent joints. Landslides 2015, 12, 911–926. [Google Scholar] [CrossRef]
  26. Zhong, Z. Study on the Failure Mechanism of Rock Bridges in a Jointed Rock Slope and Evaluation on Its Stability. Ph.D. Thesis, Chongqing University, Chongqing, China, 2019. [Google Scholar]
  27. Draebing, D. Identification of rock and fracture kinematics in high alpine rockwalls under the influence of elevation. Earth Surf. Dynam. 2021, 9, 977–994. [Google Scholar] [CrossRef]
  28. Wang, S.H.; Wang, Z.H.; Wang, K.Y.; Zhuang, X.P. Evolution Law of Elastic Modulus of Sandstone with Double Fissures Under Cyclic Loading. J. Northeast. Univ. Nat. Sci. 2020, 41, 282–286. [Google Scholar]
  29. Wang, L.; Zhong, H.; Fan, H.; Zou, P.; Shang, R.H.; Jing, K. Mechanical characteristics and crack evolution law of gas-bearing coal under cyclic loading. Coal Sci. Technol. 2024, 52, 90–101. [Google Scholar]
  30. Yang, R.Z.; Xu, Y.; Liu, J.X.; Ding, J.F.; Cheng, L. Static compression behavior and stress-strain relationship of rigid-flexible combinations under cyclic loading-unloading. Chin. J. Rock Mech. Eng. 2023, 42, 4216–4236. [Google Scholar]
  31. Wang, L.; Shang, R.H.; Zhu, C.Q.; Liu, H.Q.; Yuan, Q.P.; Li, S.B.; Chen, L.P. Study on the influence of rock bridge dip angle and mineral structure on coal damage and failure at three-dimensional scale. Chin. J. Rock Mech. Eng. 2024, 9, 1–17. [Google Scholar]
  32. Cheng, H.; Zhou, X.P.; Zhu, J.; Qian, Q.H. The effects of Crack Openings on Crack Initiation, Propagation and Coalescence Behavior in Rock-Like Materials Under Uniaxial Compression. Rock Mech. Rock Eng. 2016, 49, 3481–3494. [Google Scholar] [CrossRef]
  33. Bobet, A. The initiation of secondary cracks in compression. Eng. Fract. Mech. 2000, 66, 187–219. [Google Scholar] [CrossRef]
  34. Tan, X.; Hu, Y.G.; Yin, X.; Cao, W.G. Macro-micro scale tensile strength correlations for particle-DEM based rock models. Chin. J. Mech. 2024, 56, 1411–1425. [Google Scholar]
  35. Shi, Z.M.; Li, J.T.; Wang, J.; Chen, J.C.; Lin, H.; Cao, P. Experimental and numerical study on fracture characteristics and constitutive model of sandstone under freeze-thaw-fatigue. Int. J. Fatigue 2023, 166, 107236. [Google Scholar] [CrossRef]
Figure 1. (a) Step-like slope failure at Xiaowan Hydropower Station Reservoir [25]; (b) fracture surface in the main mining zone of the Baiyunebo Iron Mine [26]; (c) mountain slope with multiple fractures [27].
Sustainability 16 09000 g001
Figure 2. Simplified representation of multi-jointed rocky slopes.
Sustainability 16 09000 g002
Figure 3. Schematic of double-fracture planar distribution.
Sustainability 16 09000 g003
Figure 4. Sample preparation and test procedure. (a) sample preparation; (b) speed measurement and drying; (c) production of speckle; (d) experimental process.
Sustainability 16 09000 g004
Figure 5. Loading and unloading stress path.
Sustainability 16 09000 g005
Figure 6. Principle analysis of deformation modulus and irreversible strain during loading and unloading.
Sustainability 16 09000 g006
Figure 7. Changes in deformation modulus and irreversible strain under cyclic loading–unloading conditions: (a) loading deformation modulus; (b) unloading deformation modulus; (c) irreversible strain.
Sustainability 16 09000 g007
Figure 8. Displacement and strain fields of samples under cyclic loading–unloading conditions: (a) horizontal displacement field; (b) vertical displacement field; (c) principal strain field; (d) shear strain field.
Sustainability 16 09000 g008aSustainability 16 09000 g008b
Figure 9. Major branching cracks at tips of prefabricated fractures.
Sustainability 16 09000 g009
Figure 10. Final fracture patterns of rock samples.
Sustainability 16 09000 g010aSustainability 16 09000 g010b
Figure 11. Calculation process of D.
Sustainability 16 09000 g011
Figure 12. Fractal dimensions of samples under monotonic and cyclic loading–unloading conditions.
Sustainability 16 09000 g012aSustainability 16 09000 g012b
Figure 13. Schematic of parallel bond model principle [34].
Sustainability 16 09000 g013
Figure 14. Comparison between laboratory test and numerical simulation results.
Sustainability 16 09000 g014
Figure 15. Comparison of stress-strain curves and damage modes for numerically simulated R1-type sample under 2 loading conditions.
Sustainability 16 09000 g015
Figure 16. Sample analysis of meso-scale fracture mechanism: (a) X-Z plane force chain field; (b) micro-fracture distribution; (c) schematic of fracture interaction.
Sustainability 16 09000 g016
Figure 17. Equivalent stress contour plot (a) R1; (b) R2; (c) R3.
Sustainability 16 09000 g017
Figure 18. Micro-fracture density distribution of sample (a) R1; (b) R2; (c) R3.
Sustainability 16 09000 g018
Table 1. Compressive strength of three types of fractured rock samples.
Uniaxial Compression Test Sample NumberCompressive Strength (MPa)Average Value (MPa)Cyclic Loading and Unloading Test Sample NumberCompressive Strength (MPa)Average Value (MPa)
R1-148.47649.216R1-346.86448.592
R1-249.956R1-450.32
R2-134.29833.6R2-331.76832.625
R2-232.902R2-433.482
R3-136.63235.946R3-333.13236.792
R3-235.26R3-440.452
Table 2. Fine-scale parameters.
Minimum Particle Radius (mm)Maximum Particle Radius (mm)Density (kg/m3)Particle Effective Modulus (GPa)Particle Stiffness RatioParticle Friction Coefficient
0.00090.001223606.51.50.3
Parallel Bond Effective Modulus (GPa)Parallel Bond Stiffness RatioParallel Bond Normal Strength (MPa)Parallel Bonding Cohesion (MPa)Angle of Internal Friction for Parallel Bonding (°)
6.51.539.52545
Disclaimer/Publisher’s Note: The statements, opinions and data contained in all publications are solely those of the individual author(s) and contributor(s) and not of MDPI and/or the editor(s). MDPI and/or the editor(s) disclaim responsibility for any injury to people or property resulting from any ideas, methods, instructions or products referred to in the content.

