
Impact of the Coupling Coordination Degree of Human Capital and Infrastructure on High-Quality Economic Development: Empirical Evidence from Chinese Cities


Abstract
1. Introduction
2. Literature Review
2.1. HC and Economic Development
2.2. INFRA and Economic Development
2.3. HC, INFRA, and Economic Development
3. Theoretical Analysis and Research Hypotheses
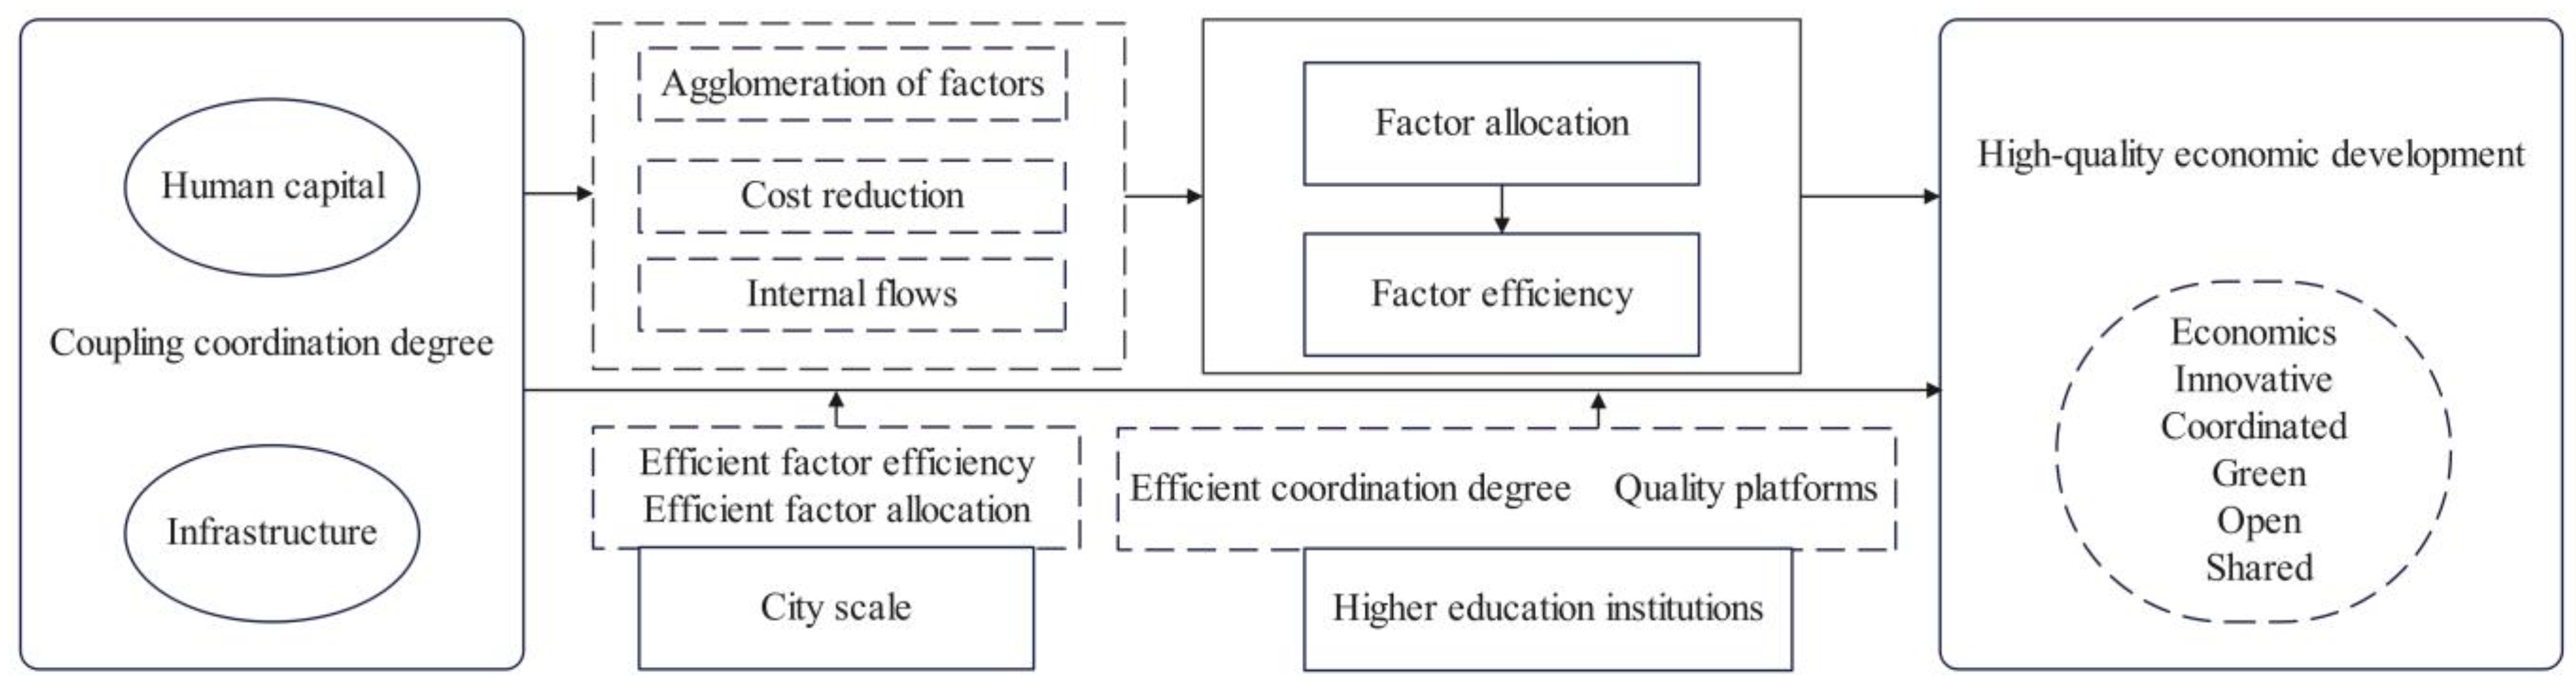
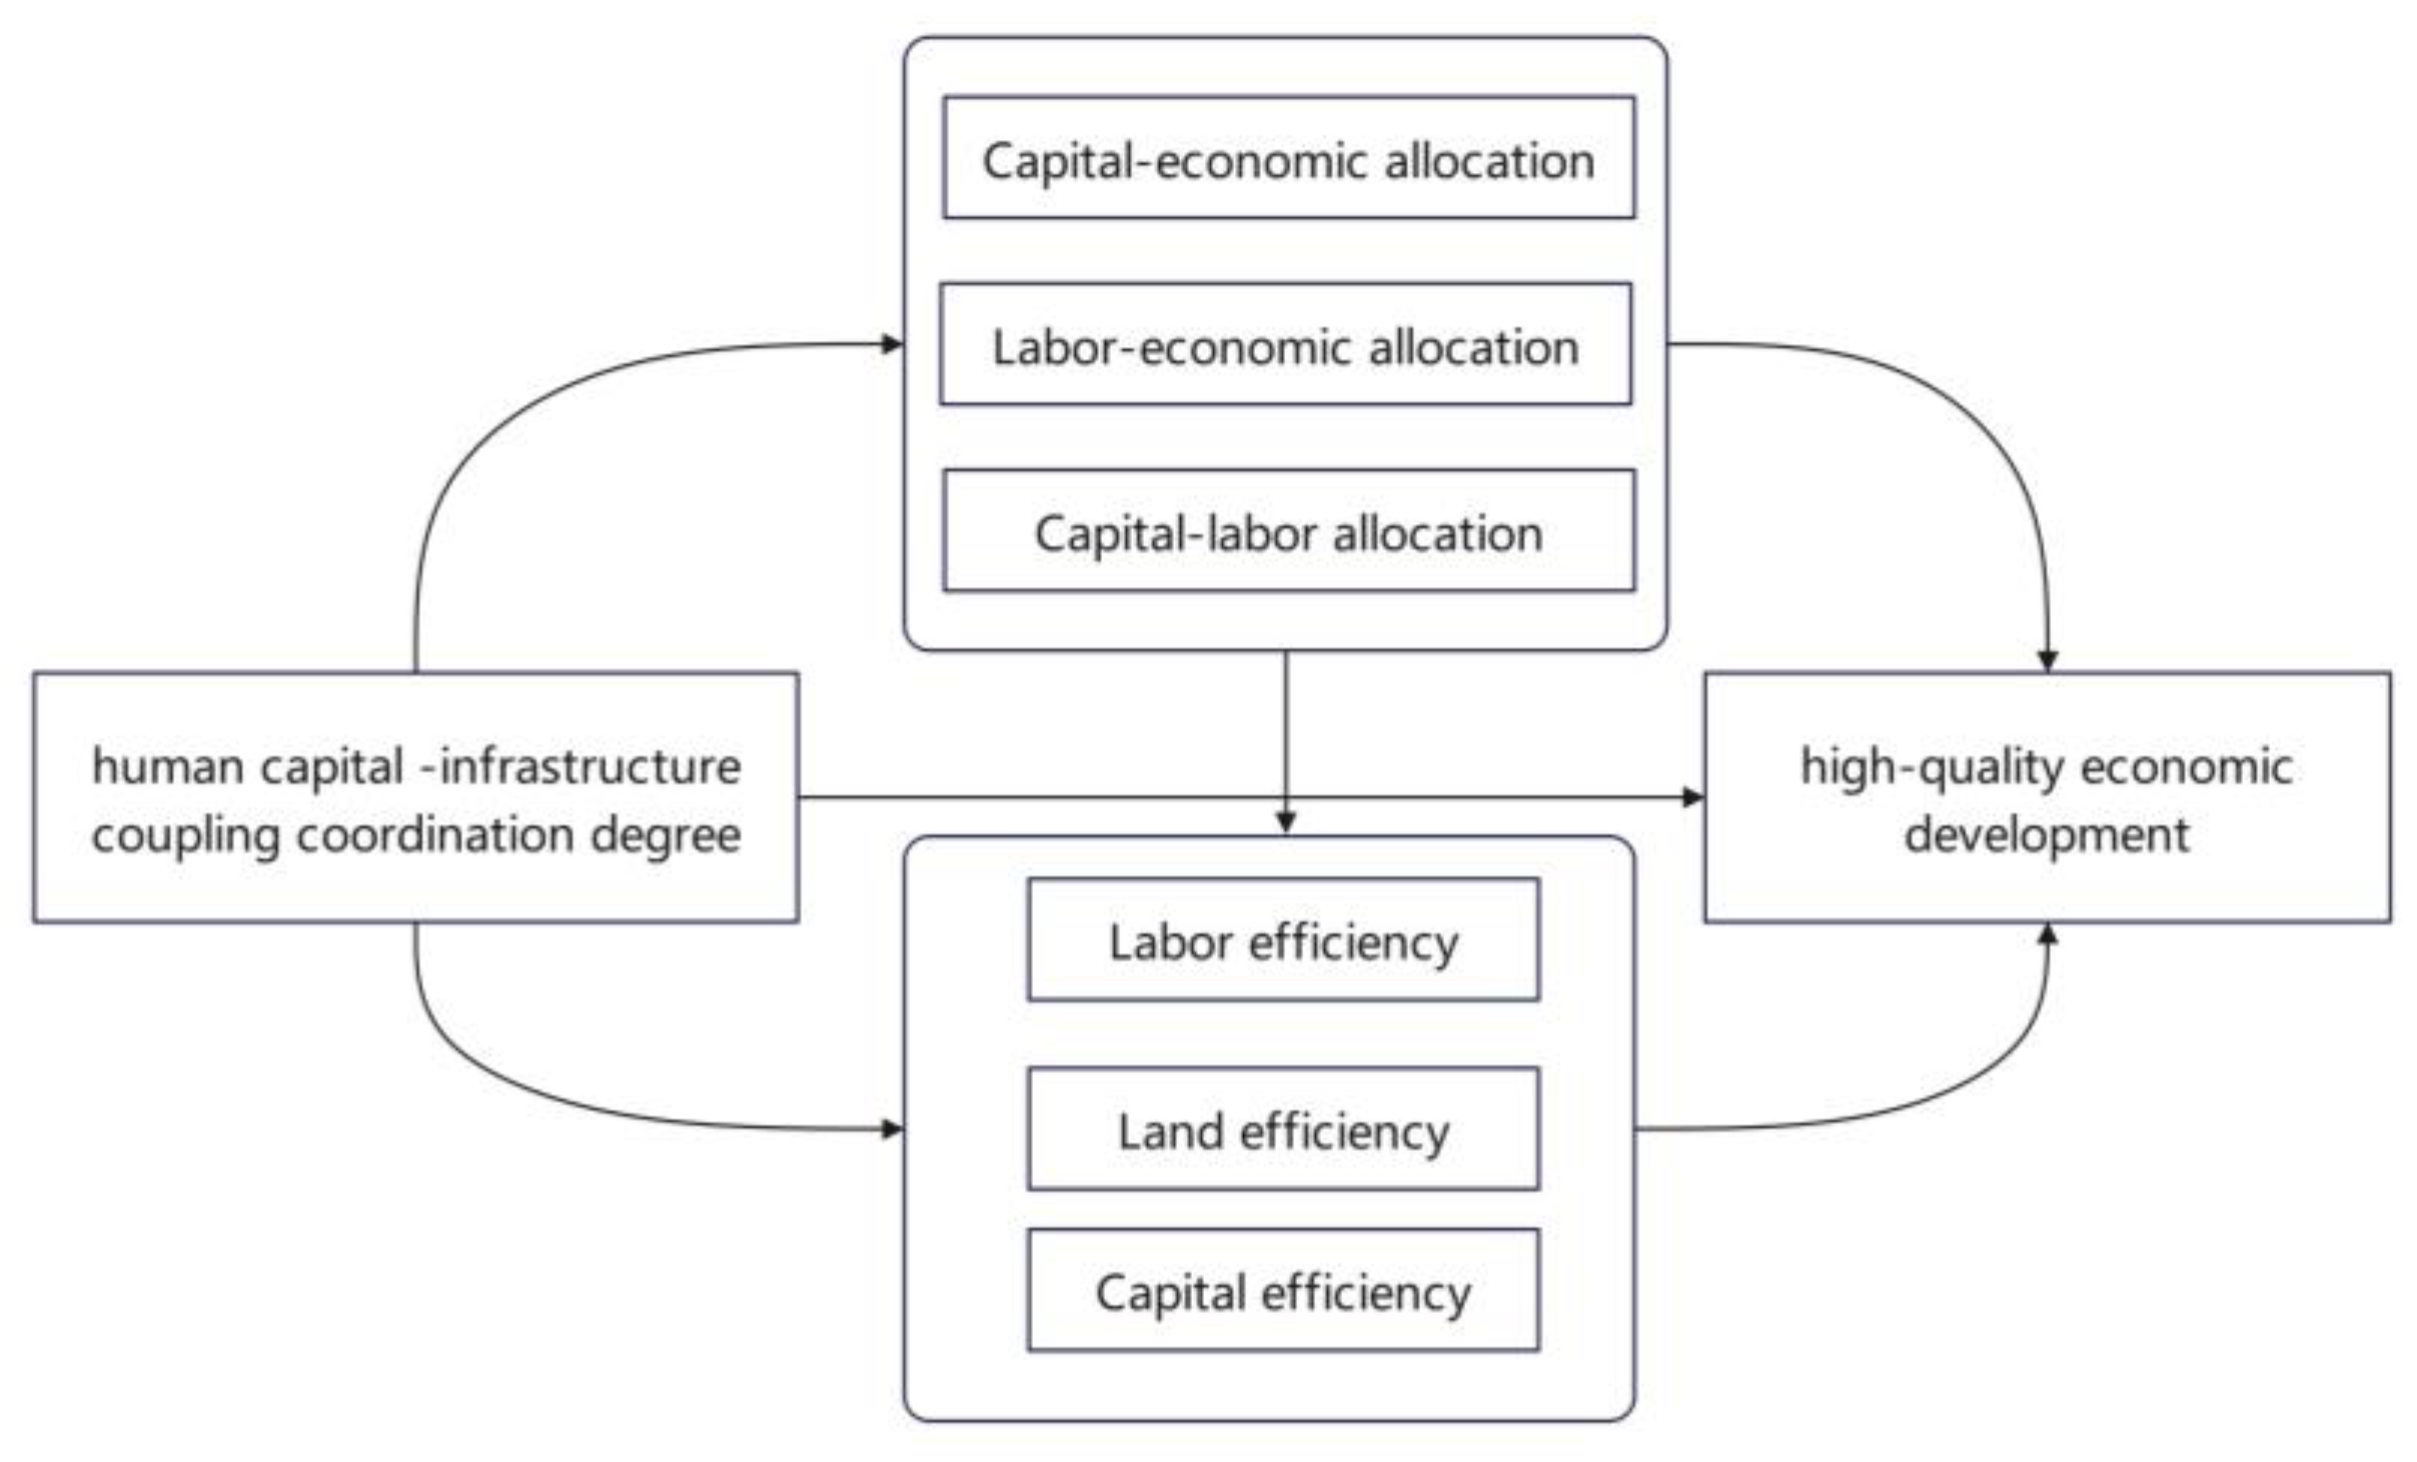
3.1. The Influence Mechanism of HC-INFRA CCD on HQED
3.2. Threshold Effects of CS
3.3. HEI Threshold Effects
4. Methodology and Data
4.1. Indicators
4.1.1. HC and INFRA
4.1.2. HQED
4.2. Research Model
4.2.1. TOPSIS Model
4.2.2. Optimized CCDM
4.2.3. Benchmark Regression Model
4.2.4. Threshold Models
4.2.5. PM
4.3. Data Description
5. Empirical Results and Analysis
5.1. Benchmark Regression
5.2. Threshold Effect Analysis
5.2.1. Threshold Estimation
5.2.2. Analysis of Threshold Effect Results
5.3. Robustness Tests
5.3.1. Endogeneity Testing
5.3.2. Other Robustness Tests
5.4. Mechanism Testing
5.4.1. Model Fit Test
5.4.2. Analysis of PM Results
6. Conclusions and Policy Recommendations
6.1. Conclusions
6.2. Policy Recommendations
- (1)
- Optimize all aspects of HC and improve regional INFRA construction. To optimize HC, first, increase support for education and technical training to improve the overall worker quality. Second, strengthen subsidies for talent introduction and improve welfare benefits to enhance regional attractiveness to quality HC. For INFRA construction, the government should coordinate the spatial structure of INFRA construction based on regional characteristics such as population distribution and industrial development. The development of functional INFRA should also be strategically coordinated to avoid weakening the role of the economy due to the associated short-term effects.
- (2)
- Promote the coordinated development of HC and INFRA. Policymakers should rationally allocate financial resources and guide the flow of social funds according to development gaps between HC and INFRA in the region. This can efficiently leverage their synergistic effects to promote regional HQED.
- (3)
- Continuously deepen the reform of higher education and improve the quality of HEI construction. As HEI is a talent training base, the government should carefully manage and oversee the system of higher education talent training, developing scientific and comprehensive talent training programs for different disciplines and specialties. Policymakers should also fully understand current and future labor market demand and improve programs to develop students’ corresponding professional capabilities. In addition, the government should build an effective platform for cross-border cooperation; strengthen the integration and development of the higher education industry, academia, and research; and promote universities’ participation in fields of regional economic management and enterprise technological innovation. This approach will fully rationalize the contact between university resources and high-quality capital, technology, and other elements; improve the conversion rate of scientific research; and enhance the promotion of HQED.
6.3. Research Limitations
Author Contributions
Funding
Institutional Review Board Statement
Informed Consent Statement
Data Availability Statement
Conflicts of Interest
References
- Wang, Y. Changes Unseen in a Century, High-Quality Development, and the Construction of a New Development Pattern. J. Manag. World 2020, 36, 1–13. [Google Scholar] [CrossRef]
- Hong, Y.; Liu, W.; Song, H. Spatial Econometric Analysis of Effect of New Economic Momentum on China’s High-Quality Development. Res. Int. Bus. Financ. 2022, 61, 101621. [Google Scholar] [CrossRef]
- Jie, Y.; Lan, J. Dynamic Linkages between Human Capital, Natural Resources, and Economic Growth—Impact on Achieving Sustainable Development Goals. Heliyon 2024, 10, e33536. [Google Scholar] [CrossRef] [PubMed]
- Zhong, W.; Zheng, M. The Logic and Effect of Capital Matching, Innovation Cultivation to Drive High-Quality Development of Regional Economy. J. Shenzhen Univ. Humanit. Soc. Sci. 2022, 39, 63–72. [Google Scholar]
- Wu, S.; Tang, J.; Li, M.; Xiao, J. Digital Economy, Binary Factor Mismatch and Sustainable Economic Development of Coastal Areas in China. Heliyon 2024, 10, e26453. [Google Scholar] [CrossRef] [PubMed]
- Hsieh, C.T.; Klenow, P.J. Misallocation and Manufacturing TFP in China and India. Q. J. Econ. 2009, 124, 1403–1448. [Google Scholar] [CrossRef]
- Wadley, D. Technology, Capital Substitution and Labor Dynamics: Global Workforce Disruption in the 21st Century? Futures 2021, 132, 102802. [Google Scholar] [CrossRef]
- Yang, Z.; Pan, Y. Human Capital, Housing Prices, and Regional Economic Development: Will “Vying for Talent” through Policy Succeed? Cities 2020, 98, 102577. [Google Scholar] [CrossRef]
- Daido, K.; Tabata, K. Public Infrastructure, Production Organization, and Economic Development. J. Macroecon. 2013, 38, 330–346. [Google Scholar] [CrossRef]
- Ren, B.; Li, Y. The Determinants of the Quality of Productive Forces in the High Quality Development of Economy and the Path to Improve Them. Econ. Rev. J. 2018, 07, 27–34. [Google Scholar] [CrossRef]
- Prenzel, P.; Iammarino, S. Labor Force Aging and the Composition of Regional Human Capital. Econ. Geogr. 2021, 97, 140–163. [Google Scholar] [CrossRef]
- Zhou, Q.; Qi, Z.P. Urban Economic Resilience and Human Capital: An Exploration of Heterogeneity and Mechanism in the Context of Spatial Population Mobility. Sustain. Cities Soc. 2023, 99, 104983. [Google Scholar] [CrossRef]
- Yu, Z.; Lanre Ridwan, I.; Irshad, A.U.R.; Tanveer, M.; Khan, S.A.R. Investigating the Nexuses between Transportation Infrastructure, Renewable Energy Sources, and Economic Growth: Striving towards Sustainable Development. Ain Shams Eng. J. 2023, 14, 101843. [Google Scholar] [CrossRef]
- Sun, Y.; Cui, Y. Evaluating the Coordinated Development of Economic, Social and Environmental Benefits of Urban Public Transportation Infrastructure: Case Study of Four Chinese Autonomous Municipalities. Transp. Policy 2018, 66, 116–126. [Google Scholar] [CrossRef]
- Lin, B.; Chen, Y. Will Economic Infrastructure Development Affect the Energy Intensity of China’s Manufacturing Industry? Energy Policy 2019, 132, 122–131. [Google Scholar] [CrossRef]
- Khan, H.; Khan, U.; Jiang, L.J.; Khan, M.A. Impact of Infrastructure on Economic Growth in South Asia: Evidence from Pooled Mean Group Estimation. Electr. J. 2020, 33, 84–91. [Google Scholar] [CrossRef]
- Qi, X.; Wang, B.; Gao, Q. Environment, Social and Governance Research of Infrastructure Investment: A Literature Review. J. Clean. Prod. 2023, 425, 139030. [Google Scholar] [CrossRef]
- Sahn, D.E.; Alderman, H. The Effects of Human Capital on Wages, and the Determinants of Labor Supply in a Developing Country. J. Dev. Econ. 1988, 29, 157–183. [Google Scholar] [CrossRef]
- Jing, C.B.; Zhou, W.Q.; Qian, Y.G. Spatial Disparities of Social and Ecological Infrastructures and Their Coupled Relationships in Cities. Sustain. Cities Soc. 2022, 86, 104117. [Google Scholar] [CrossRef]
- Huang, J.; Li, W.; Guo, L.; Hall, J.W. Information and Communications Technology Infrastructure and Firm Growth: An Empirical Study of China’s Cities. Telecommun. Policy 2022, 46, 102263. [Google Scholar] [CrossRef]
- Li, W.; Wang, X.; Hilmola, O.-P. Does High-Speed Railway Influence Convergence of Urban-Rural Income Gap in China? Sustainability 2020, 12, 4236. [Google Scholar] [CrossRef]
- Wan, J.; Xie, Q.; Fan, X. The Impact of Transportation and Information Infrastructure on Urban Productivity: Evidence from 256 Cities in China. Struct. Chang. Econ. Dyn. 2024, 68, 384–392. [Google Scholar] [CrossRef]
- Wang, S.; Cui, Z.; Lin, J.; Xie, J.; Su, K. The Coupling Relationship between Urbanization and Ecological Resilience in the Pearl River Delta. J. Geogr. Sci. 2022, 32, 44–64. [Google Scholar] [CrossRef]
- Doré, N.I.; Teixeira, A.A.C. The Role of Human Capital, Structural Change, and Institutional Quality on Brazil’s Economic Growth over the Last Two Hundred Years (1822–2019). Struct. Chang. Econ. Dyn. 2023, 66, 1–12. [Google Scholar] [CrossRef]
- Jagódka, M.; Snarska, M. Regional disparities as a result of differences in human capital and innovativeness on the example of poland. Technol. Econ. Dev. Econ. 2023, 29, 696–716. [Google Scholar] [CrossRef]
- Wang, M.; Xu, M.; Ma, S.J. The Effect of the Spatial Heterogeneity of Human Capital Structure on Regional Green Total Factor Productivity (Vol 59, Pg 427, 2021). Struct. Chang. Econ. Dyn. 2022, 61, 463–466. [Google Scholar] [CrossRef]
- Zhang, Y.; Kumar, S.; Huang, X.; Yuan, Y. Human Capital Quality and the Regional Economic Growth: Evidence from China. J. Asian Econ. 2023, 86, 101593. [Google Scholar] [CrossRef]
- Sultana, T.; Dey, S.R.; Tareque, M. Exploring the Linkage between Human Capital and Economic Growth: A Look at 141 Developing and Developed Countries. Econ. Syst. 2022, 46, 101017. [Google Scholar] [CrossRef]
- Čadil, J.; Petkovová, L.; Blatná, D. Human Capital, Economic Structure and Growth. Procedia Econ. Financ. 2014, 12, 85–92. [Google Scholar] [CrossRef]
- Li, S.D.; Chupradit, S.; Maneengam, A.; Suksatan, W.; The, C.P.; Ngoc, Q.N. The Moderating Role of Human Capital and Renewable Energy in Promoting Economic Development in G10 Economies: Evidence from CUP-FM and CUP-BC Methods. Renew. Energy 2022, 189, 180–187. [Google Scholar] [CrossRef]
- Rahim, S.; Murshed, M.; Umarbeyli, S.; Kirikkaleli, D.; Ahmad, M.; Tufail, M.; Wahab, S. Do Natural Resources Abundance and Human Capital Development Promote Economic Growth? A Study on the Resource Curse Hypothesis in Next Eleven Countries. Resour. Environ. Sustain. 2021, 4, 100018. [Google Scholar] [CrossRef]
- Hota, S.P. Education Infrastructure, Expenditure, Enrollment & Economic Development in Odisha, India. Int. J. Educ. Dev. 2023, 103, 102903. [Google Scholar] [CrossRef]
- Zhang, Y.J.; Cheng, L. The Role of Transport Infrastructure in Economic Growth: Empirical Evidence in the UK. Transp. Policy 2023, 133, 223–233. [Google Scholar] [CrossRef]
- Tan, R.P.; Pan, L.L.; Xu, M.M.; He, X.J. Transportation Infrastructure, Economic Agglomeration and Non-Linearities of Green Total Factor Productivity Growth in China: Evidence from Partially Linear Functional Coefficient Model. Transp. Policy 2022, 129, 1–13. [Google Scholar] [CrossRef]
- Wang, B.; Wang, L.; Gong, B.; Yan, Z.; Hu, P. Does Broadband Internet Infrastructure Mitigate Firm-Level Economic Policy Uncertainty? Evidence from the Broadband China Pilot Policy. Econ. Lett. 2023, 232, 111325. [Google Scholar] [CrossRef]
- Wang, C.; Kim, Y.S.; Kim, C.Y. Causality between Logistics Infrastructure and Economic Development in China. Transp. Policy 2021, 100, 49–58. [Google Scholar] [CrossRef]
- Cui, X.; Du, Q.; Zou, P.X.W.; Lu, C.; Li, Y. A Method for Incorporating Heterogeneity in Measuring the Economic Carrying Capacity of Urban Infrastructures. J. Clean. Prod. 2022, 332, 130058. [Google Scholar] [CrossRef]
- Lin, Y.; Peng, C.; Chen, P.; Zhang, M. Conflict or Synergy? Analysis of Economic-Social- Infrastructure-Ecological Resilience and Their Coupling Coordination in the Yangtze River Economic Belt, China. Ecol. Indic. 2022, 142, 109194. [Google Scholar] [CrossRef]
- Lu, X.W.; Jones, S.; Li, L.; Han, X.Y. Balancing Road Infrastructure and Socioeconomic Development in China—Proposed Application of the Coupling Coordinated Degree. Res. Transp. Bus. Manag. 2020, 37, 100480. [Google Scholar] [CrossRef]
- Lu, C.; Hong, W.X.; Wang, Y.T.; Zhao, D.F. Study on the Coupling Coordination of Urban Infrastructure and Population in the Perspective of Urban Integration. IEEE Access 2021, 9, 124070–124086. [Google Scholar] [CrossRef]
- Sun, Y.; Cui, Y. Analyzing the Coupling Coordination among Economic, Social, and Environmental Benefits of Urban Infrastructure: Case Study of Four Chinese Autonomous Municipalities. Math. Probl. Eng. 2018, 2018, 8280328. [Google Scholar] [CrossRef]
- Tsaurai, K.; Ndou, A. Infrastructure, Human Capital Development and Economic Growth in Transitional Countries. Comp. Econ. Res. 2019, 22, 33–52. [Google Scholar] [CrossRef]
- Dai, X.; Cheng, L. Aggregate Productivity Losses from Factor Misallocation across Chinese Manufacturing Firms. Econ. Syst. 2019, 43, 30–41. [Google Scholar] [CrossRef]
- Hao, Y.; Gai, Z.; Wu, H. How Do Resource Misallocation and Government Corruption Affect Green Total Factor Energy Efficiency? Evidence from China. Energy Policy 2020, 143, 111562. [Google Scholar] [CrossRef]
- Koopman, E.; Wacker, K.M. Drivers of Growth Accelerations: What Role for Capital Accumulation? World Dev. 2023, 169, 106297. [Google Scholar] [CrossRef]
- Zhang, S.F.; Liu, Y.X.; Huang, D.E.H. Contribution of Factor Structure Change to China’s Economic Growth: Evidence from the Time-Varying Elastic Production Function Model. Econ. Res.-Ekon. Istraz. 2020, 33, 2919–2942. [Google Scholar] [CrossRef]
- Yang, Z.S. Human Capital Space: A Spatial Perspective of the Dynamics of People and Economic Relationships. Humanit. Soc. Sci. Commun. 2023, 10, 145. [Google Scholar] [CrossRef]
- López-Bazo, E.; Moreno, R. Does Human Capital Stimulate Investment in Physical Capital?: Evidence from a Cost System Framework. Econ. Model. 2008, 25, 1295–1305. [Google Scholar] [CrossRef]
- Gong, M.; Zeng, Y.; Zhang, F. New Infrastructure, Optimization of Resource Allocation and Upgrading of Industrial Structure. Financ. Res. Lett. 2023, 54, 103754. [Google Scholar] [CrossRef]
- Amendola, A.; Barra, C.; Zotti, R. Does Graduate Human Capital Production Increase Local Economic Development? An Instrumental Variable Approach. J. Reg. Sci. 2020, 60, 959–994. [Google Scholar] [CrossRef]
- Zhai, K.Y.; Moskal, M. The Impact of Place of Origin on International and Domestic Graduates’ Mobility in China. Int. Migr. Rev. 2022, 56, 123–154. [Google Scholar] [CrossRef]
- Janzen, K.; Panitz, R.; Glückler, J. Education Premium and the Compound Impact of Universities on Their Regional Economy. Res. Policy 2022, 51, 104402. [Google Scholar] [CrossRef]
- Kopecky, J. Population Age Structure and Secular Stagnation: Evidence from Long Run Data. J. Econ. Ageing 2023, 24, 100442. [Google Scholar] [CrossRef]
- Yu, X.; Li, Q.; Huang, Z.; Guo, R. Characterising Population Spatial Structure Change in Chinese Cities. Cities 2022, 123, 103555. [Google Scholar] [CrossRef]
- Shao, S.; Zhang, X.; Yang, L. Natural Resource Dependence and Urban Shrinkage: The Role of Human Capital Accumulation. Resour. Policy 2023, 81, 103325. [Google Scholar] [CrossRef]
- Zhao, J.; Xiao, Y.; Sun, S.; Sang, W.; Axmacher, J.C. Does China’s Increasing Coupling of “urban Population” and “Urban Area” Growth Indicators Reflect a Growing Social and Economic Sustainability? J. Environ. Manag. 2022, 301, 113932. [Google Scholar] [CrossRef] [PubMed]
- Ren, Y.; Shen, L.; Wang, J.; Wu, Y. How to Address Properly the Scale of Urban Infrastructures?—An Empirical Study of 35 Large Chinese Cities. Habitat Int. 2021, 118, 102464. [Google Scholar] [CrossRef]
- Wang, J.; Ren, Y.; Shen, L.; Liu, Z.; Wu, Y.; Shi, F. A Novel Evaluation Method for Urban Infrastructures Carrying Capacity. Cities 2020, 105, 102846. [Google Scholar] [CrossRef]
- Shen, L.; Chen, X.; Du, X.; Yang, Z. An Improved Method for Investigating Urban Municipal Infrastructures Carrying Capacity. Sustain. Prod. Consum. 2022, 29, 299–310. [Google Scholar] [CrossRef]
- Liu, Y.; Han, L.; Pei, Z.; Jiang, Y. Evolution of the Coupling Coordination between the Marine Economy and Urban Resilience of Major Coastal Cities in China. Mar. Policy 2023, 148, 105456. [Google Scholar] [CrossRef]
- Du, X. Can Environmental Regulation Promote High-Quality Economic Development?: Evidence from China. Econ. Anal. Policy 2023, 80, 1762–1771. [Google Scholar] [CrossRef]
- Guo, B.; Wang, Y.; Zhang, H.; Liang, C.; Feng, Y.; Hu, F. Impact of the Digital Economy on High-Quality Urban Economic Development: Evidence from Chinese Cities. Econ. Model. 2023, 120, 106194. [Google Scholar] [CrossRef]
- Guo, J.; Sun, Z. How Does Manufacturing Agglomeration Affect High-Quality Economic Development in China? Econ. Anal. Policy 2023, 78, 673–691. [Google Scholar] [CrossRef]
- Zhang, F.; Tan, H.; Zhao, P.; Gao, L.; Ma, D.; Xiao, Y. What Was the Spatiotemporal Evolution Characteristics of High-Quality Development in China? A Case Study of the Yangtze River Economic Belt Based on the ICGOS-SBM Model. Ecol. Indic. 2022, 145, 109593. [Google Scholar] [CrossRef]
- Wang, C.Y.; Xu, M.; Olsson, G.; Liu, Y. Characterizing of Water-Energy-Emission Nexus of Coal-Fired Power Industry Using Entropy Weighting Method. Resour. Conserv. Recycl. 2020, 161, 104991. [Google Scholar] [CrossRef]
- Cai, J.; Li, X.; Liu, L.; Chen, Y.; Wang, X.; Lu, S. Coupling and Coordinated Development of New Urbanization and Agro-Ecological Environment in China. Sci. Total Environ. 2021, 776, 145837. [Google Scholar] [CrossRef]
- Jiang, Q.; Zhou, Z.; Wang, Z.; Fu, Q.; Wang, T.; Zhao, Y. Risk Assessment and Optimization of Water Resources Shortage Based on Water and Land Resources Coupling. Nongye Gongcheng Xuebao Trans. Chin. Soc. Agric. Eng. 2017, 33, 136–143. [Google Scholar] [CrossRef]
- Hu, Z.L.; Kumar, J.; Qin, Q.; Kannan, S. Assessing the Coupling Coordination Degree between All-for-One Tourism and Ecological Civilization; Case of Guizhou, China. Environ. Sustain. Indic. 2023, 19, 100272. [Google Scholar] [CrossRef]
- Yuan, D.; Du, M.; Yan, C.; Wang, J.; Wang, C.; Zhu, Y.; Wang, H.; Kou, Y. Coupling Coordination Degree Analysis and Spatiotemporal Heterogeneity between Water Ecosystem Service Value and Water System in Yellow River Basin Cities. Ecol. Inform. 2024, 79, 102440. [Google Scholar] [CrossRef]
- Dong, G.; Ge, Y.; Liu, J.; Kong, X.; Zhai, R. Evaluation of Coupling Relationship between Urbanization and Air Quality Based on Improved Coupling Coordination Degree Model in Shandong Province, China. Ecol. Indic. 2023, 154, 110578. [Google Scholar] [CrossRef]
- Pradhan, R.P.; Arvin, M.B.; Bahmani, S.; Hall, J.H.; Norman, N.R. Finance and Growth: Evidence from the ARF Countries. Q. Rev. Econ. Financ. 2017, 66, 136–148. [Google Scholar] [CrossRef]
- Afonso, A.; Blanco-Arana, M.C. Financial and Economic Development in the Context of the Global 2008-09 Financial Crisis. Int. Econ. 2022, 169, 30–42. [Google Scholar] [CrossRef]
- Li, H.; Liu, B. The Effect of Industrial Agglomeration on China’s Carbon Intensity: Evidence from a Dynamic Panel Model and a Mediation Effect Model. Energy Rep. 2022, 8, 96–103. [Google Scholar] [CrossRef]
- Wang, J. Innovation and Government Intervention: A Comparison of Singapore and Hong Kong. Res. Policy 2018, 47, 399–412. [Google Scholar] [CrossRef]
- Liu, T.; Yan, W.; Zhang, Y. Functional or Selective Policy?—Research on the Relationship between Government Intervention and Enterprise Innovation in China. Int. Rev. Econ. Financ. 2023, 86, 82–96. [Google Scholar] [CrossRef]
- Crowder, W.J.; de Jong, P.J. Does Investment Lead to Greater Output? A Panel Error-Correction Model Analysis. Appl. Econ. 2011, 43, 773–785. [Google Scholar] [CrossRef]
- Hansen, B.E. Threshold Effects in Non-Dynamic Panels: Estimation, Testing, and Inference. J. Econom. 1999, 93, 345–368. [Google Scholar] [CrossRef]
- Ding, Y.; Lu, H. Activity Participation as a Mediating Variable to Analyze the Effect of Land Use on Travel Behavior: A Structural Equation Modeling Approach. J. Transp. Geogr. 2016, 52, 23–28. [Google Scholar] [CrossRef]
- Zheng, Q.; Jiang, G.; Yang, Y.; Zhou, D.; Qu, Y. Does Spatial Equilibrium of Factor Allocation Inevitably Bring about High Benefits for Regional Development? An Empirical Study of the Beijing-Tianjin-Hebei Region, China. Habitat Int. 2020, 95, 102066. [Google Scholar] [CrossRef]
- Becker, G.S.; Tomes, N. Human Capital and the Rise and Fall of Families. J. Labor Econ. 1986, 4, 1–47. [Google Scholar] [CrossRef] [PubMed]
- Zhang, C.; Yang, S. The Synergy Effect of Energy Security and Carbon-Haze Collaborative Management: From the Perspective of Biased Technological Progress. Environ. Res. 2024, 252, 118741. [Google Scholar] [CrossRef] [PubMed]
- Sun, J.; Hou, S.; Deng, Y.; Li, H. New Media Environment, Green Technological Innovation and Corporate Productivity: Evidence from Listed Companies in China. Energy Econ. 2024, 131, 107395. [Google Scholar] [CrossRef]
- Zuo, Q.; Zang, C.; Ma, J. Calculation Method and Lts Application of Coordination Degree between the Interconnected River System Network and Socio-Economic Development. South–North Water Transf. Water Sci. Technol. 2014, 12, 116–120. [Google Scholar] [CrossRef]
- Pan, X.; Uddin, M.K.; Saima, U.; Jiao, Z.; Han, C. How Do Industrialization and Trade Openness Influence Energy Intensity? Evidence from a Path Model in Case of Bangladesh. Energy Policy 2019, 133, 110916. [Google Scholar] [CrossRef]
- Streiner, D.L. Finding Our Way: An Introduction to Path Analysis. Can. J. Psychiatry-Rev. Can. Psychiatr. 2005, 50, 115–122. [Google Scholar] [CrossRef]
- Wang, R.J.; Laila, U.; Nazir, R.; Hao, X.B. Unleashing the Influence of Industrialization and Trade Openness on Renewable Energy Intensity Using Path Model Analysis: A Roadmap towards Sustainable Development. Renew. Energy 2023, 202, 280–288. [Google Scholar] [CrossRef]
- Hayes, A.F. An Index and Test of Linear Moderated Mediation. Multivar. Behav. Res. 2015, 50, 1–22. [Google Scholar] [CrossRef]
- Kong, Q.; Li, R.; Jiang, X.; Sun, P.; Peng, D. Has Transportation Infrastructure Development Improved the Quality of Economic Growth in China?S Cities? A Quasi-Natural Experiment Based on the Introduction of High-Speed Rail. Res. Int. Bus. Financ. 2022, 62, 101726. [Google Scholar] [CrossRef]
- Meka’a, C.; Fotso, S.; Kamdem, B. Investments in Basic Public Infrastructure and Their Effects on Economic Growth in a Developing Country: The Case of Cameroon. Heliyon 2024, 10, e26504. [Google Scholar] [CrossRef]


| Dimensions | Indicators | Clarification | Effect |
|---|---|---|---|
| Age | Old-age dependency ratio | Ratio of unemployed to employed persons in units at the end of the year | − |
| Employment | Manpower Advancement Index | (Employees in primary sector + 2× employees in secondary sector + 3× employees in tertiary sector)/total employees | + |
| Space | Population density | Ratio of resident population to area | + |
| Educational | Urbanization rate | Ratio of urban population to total population | + |
| Proportion of higher education qualifications | Ratio of the number of people with university education or above to the total population | + | |
| Security | Basic pension insurance coverage | Ratio of the number of urban workers insured to the number of employed people | + |
| Dimensions | Indicators |
|---|---|
| Water supply | Length of water pipeline |
| Total water supply | |
| Gas supply | Length of gas supply pipeline |
| Total gas supply | |
| Sewage treatment | Sewage treatment rate |
| Centralized sewage treatment rate | |
| Garbage disposal | Domestic waste disposal rate |
| Non-hazardous treatment rate of domestic waste | |
| Greener | Green coverage |
| Green ratio | |
| Transportation | Percentage of road length |
| Percentage of road area | |
| Medical services | Hospitals per capita |
| Doctors per capita | |
| Education | Schools per capita |
| Teachers per capita | |
| Telecommunication | Telecommunications per capita |
| Share of cell phone subscribers |
| Dimension | Indicators | Clarification | Effect |
|---|---|---|---|
| Economy | Economic growth rate | Ratio of GDP value added to current year’s GDP | + |
| GDP per capita | GDP/population | + | |
| Innovation | Patent output | Number of patents granted | + |
| Science and education input | Ratio of financial expenditure on science, technology, and education | + | |
| Coordination | Industrial structure | Ratio of tertiary industry value added to that of secondary industry | + |
| Rural–urban income ratio | Ratio of urban and rural residents’ disposable income per capita | − | |
| Greenness | Carbon intensity | Carbon dioxide emissions/real GDP | − |
| Emissions from industrial waste | Ratio of industrial wastewater, sulfur dioxide, smoke (powder), and dust emissions to industrial output value | − | |
| Openness | Foreign capital use | Ratio of total imports and exports to GDP | + |
| Actual rate of foreign capital used | Ratio of actual foreign capital used to GDP | + | |
| Sharing | Wage level | Average wage of employed workers | + |
| Population consumption | Ratio of social consumption retail sales to GDP | + |
| Variable | Observations | Mean | Standard Deviation | Minimum | Maximum |
|---|---|---|---|---|---|
| HQED | 1656 | 0.1044 | 0.074 | 0.028 | 0.620 |
| Human capital-infrastructure coupling coordination degree (HC-INFRA CCD) | 1656 | 0.354 | 0.087 | 0.225 | 0.758 |
| Financial development (FD) | 1656 | 1.572 | 0.416 | 0.208 | 4.471 |
| Industrial agglomeration (IA) | 1656 | 37.898 | 49.551 | 0.315 | 324.451 |
| Government intervention (GI) | 1656 | 0.471 | 0.224 | 0.070 | 1.541 |
| Market environment (ME) | 1656 | 0.799 | 0.273 | 0.026 | 2.296 |
| Variable | (1) | (2) |
|---|---|---|
| Ln HC | 0.322 *** | |
| [0.063] | ||
| Ln INFRA | 0.312 *** | |
| [0.064] | ||
| Ln HC-INFRA CCD | 1.266 *** | |
| [0.163] | ||
| Ln FD | −0.246 | −0.246 |
| [0.127] | [0.128] | |
| Ln IA | 0.069 ** | 0.069 ** |
| [0.022] | [0.022] | |
| Ln GI | −0.269 *** | −0.269 *** |
| [0.046] | [0.046] | |
| Ln ME | 0.103 *** | 0.103 *** |
| [0.025] | [0.025] | |
| Constant | −2.352 *** | −2.343 *** |
| [0.432] | [0.428] | |
| N | 1656 | 1656 |
| R-squared | 0.451 | 0.451 |
| Variable | (1) Economy | (2) Coordination | (3) Greenness | (4) Innovation | (5) Openness | (6) Sharing | (7) Scale of Openness |
|---|---|---|---|---|---|---|---|
| Ln HC-INFRA CCD | 2.135 *** | 1.895 *** | 0.220 ** | 2.540 *** | −0.954 *** | 1.631 *** | 0.432 * |
| [0.249] | [0.243] | [0.096] | [0.337] | [0.357] | [0.212] | [0.246] | |
| Ln FD | −0.501 ** | −0.276 | −0.091 * | −0.431 ** | 0.098 | −0.279 | −0.264 *** |
| [0.217] | [0.271] | [0.055] | [0.207] | [0.251] | [0.201] | [0.085] | |
| Ln IA | 0.123 *** | 0.010 *** | 0.023 *** | 0.125 ** | −0.022 | 0.129 *** | 0.104 *** |
| [0.036] | [0.031] | [0.007] | [0.049] | [0.054] | [0.031] | [0.032] | |
| Ln GI | −0.421 *** | −0.430 *** | −0.045 *** | −0.503 *** | 0.310 *** | −0.370 ** | −0.081 |
| [0.071] | [0.072] | [0.014] | [0.086] | [0.098] | [0.059] | [0.078] | |
| Ln ME | 0.136 *** | 0.118 *** | 0.014 * | 0.150 *** | 0.171 *** | 0.111 *** | 0.167 *** |
| [0.038] | [0.040] | [0.008] | [0.041] | [0.060] | [0.033] | [0.044] | |
| Constant | 0.269 | 0.431 | −0.863 *** | 0.697 | 0.308 | −0.367 | −6.273 *** |
| [0.683] | [0.642] | [0.120] | [0.944] | [1.045] | [0.646] | [0.618] | |
| N | 1656 | 1656 | 1656 | 1656 | 1656 | 1656 | 1656 |
| R-squared | 0.500 | 0.462 | 0.119 | 0.423 | 0.060 | 0.517 | 0.096 |
| Variable | (1) Greenness | (2) Openness | (3) Scale of Openness |
|---|---|---|---|
| Ln HC-INFRA CCD | −0.492 *** | 0.104 *** | 0.209 *** |
| [0.009] | [0.007] | [0.007] | |
| Ln FD | 0.054 *** | −0.0404 *** | −0.126 *** |
| [0.007] | [0.007] | [0.007] | |
| Ln IA | 0.011 *** | 0.012 *** | 0.0516 *** |
| [0.0001] | [0.0001] | [0.0005] | |
| Ln GI | 0.159 *** | −0.0200 *** | −0.0373 *** |
| [0.007] | [0.007] | [0.007] | |
| Ln ME | 0.0858 *** | 0.0020 | 0.0779 *** |
| [0.007] | [0.007] | [0.007] | |
| Constant | 0.476 *** | −0.794 *** | 0.175 *** |
| [0.014] | [0.014] | [0.018] | |
| N R-squared | 10000 | 10000 | 10000 |
| 0.495 | 0.500 | 0.495 |
| Variant | Threshold | F-Statistics | Prob | Crit10 | Crit5 | Crit1 |
|---|---|---|---|---|---|---|
| City scale (CS) | Single | 37.34 | 0.097 | 37.093 | 43.940 | 53.595 |
| Double | 18.62 | 0.390 | 31.821 | 39.949 | 49.849 | |
| Higher education institutions (HEI) | Single | 77.17 | 0.001 | 27.555 | 34.284 | 43.734 |
| Double | 21.40 | 0.153 | 24.506 | 30.843 | 41.580 |
| Threshold Variables | Threshold Value | Confidence Interval |
|---|---|---|
| CS | 54.070 | [53.145, 54.200] |
| HEI | 26.000 | [25.000, 31.000] |
| Variable | (1) | (2) | |
|---|---|---|---|
| Ln HC-INFRA CCD | (CS ≤ 54.07) | 1.310 *** | |
| [0.085] | |||
| (CS > 54.07) | 1.221 *** | ||
| [0.085] | |||
| (HEI ≤ 26) | 1.049 *** | ||
| [0.088] | |||
| (HEI > 26) | 2.925 *** | ||
| [0.217] | |||
| Ln FD | −0.250 *** | −0.248 *** | |
| [0.029] | [0.029] | ||
| Ln IA | 0.070 *** | 0.067 *** | |
| [0.012] | [0.012] | ||
| Ln GI | −0.262 *** | −0.256 *** | |
| [0.022] | [0.022] | ||
| Ln ME | 0.0964 *** | 0.122 *** | |
| [0.013] | [0.013] | ||
| Constant | −2.383 *** | −2.407 *** | |
| [0.233] | [0.230] | ||
| N | 1656 | 1656 | |
| R-squared | 0.395 | 0.410 | |
| Variable | First-Stage | Second-Stage |
|---|---|---|
| Instrumental variable | 4.734 *** | |
| [0.487] | ||
| Ln HC-INFRA CCD | 19.004 *** | |
| [0.916] | ||
| Ln FD | −0.486 *** | 0.160 * |
| [0.178] | [0.093] | |
| Ln IA | −0.001 | 0.008 |
| [0.005] | [0.258] | |
| Ln GI | −0.007 | 0.010 |
| [0.010] | [0.581] | |
| Ln ME | 0.011 ** | 0.002 |
| [0.006] | [0.360] | |
| Constant | −131.189 | 2.436 |
| [6.257] | [0.469] | |
| Cragg–Donald Wald F statistic | 430.660 | |
| (16.38) | ||
| Kleibergen–Paap rk LM statistic | 48.702 | |
| {0.000} | ||
| Variable | (1) | (2) | (3) | (4) | (5) |
|---|---|---|---|---|---|
| Ln HC-INFRA CCD | 0.317 *** | 0.634 *** | 0.503 *** | 0.632 *** | 0.999 *** |
| [0.041] | [0.081] | [0.072] | [0.096] | [0.151] | |
| Ln FD | −0.246 | −0.246 * | −0.106 | −0.124 * | −0.445 *** |
| [0.128] | [0.128] | [0.055] | [0.072] | [0.074] | |
| Ln IA | 0.069 ** | 0.069 *** | 0.041 *** | 0.053 *** | 0.046 ** |
| [0.022] | [0.022] | [0.010] | [0.012] | [0.021] | |
| Ln GI | −0.269 *** | −0.269 *** | −0.112 *** | −0.129 *** | −0.224 *** |
| [0.046] | [0.046] | [0.018] | [0.022] | [0.039] | |
| Ln ME | 0.103 *** | 0.103 *** | 0.036 *** | 0.052 *** | 0.168 *** |
| [0.025] | [0.025] | [0.010] | [0.014] | [0.030] | |
| Constant | −2.347 *** | −2.347 *** | −1.200 *** | −3.149 *** | −2.110 *** |
| [0.428] | [0.428] | [0.194] | [0.246] | [0.417] | |
| N | 1656 | 1656 | 1656 | 1656 | 1656 |
| R-squared | 0.4506 | 0.4691 | 0.4778 | 0.493 | 0.456 |
| Fitness Index | SRMR | RMSEA | TLI | GFI | CFI |
|---|---|---|---|---|---|
| Model parameter | 0.001 | 0.014 | 0.999 | 0.999 | 0.999 |
| Reference standard | <0.05 | <0.05 | >0.9 | >0.9 | >0.9 |
| Effect Type | Estimate | Standard Error | Lower | Upper |
|---|---|---|---|---|
| Direct effect | 0.330 **** | 0.023 | 0.286 | 0.373 |
| Total indirect effect | 0.261 **** | 0.019 | 0.224 | 0.299 |
| Total effect | 0.591 **** | 0.016 | 0.557 | 0.621 |
| Number | Specific Path | Estimate | Standard Error | Lower | Upper | |||
|---|---|---|---|---|---|---|---|---|
| 1 | HC-INFRA CCD | Capital-labor allocation | HQED | 0.173 **** | 0.012 | 0.143 | 0.207 | |
| 2 | Land efficiency (LE) | −0.065 **** | 0.007 | −0.080 | −0.051 | |||
| 3 | Capital efficiency (CE) | 0.090 **** | 0.012 | 0.067 | 0.116 | |||
| 4 | Labor efficiency (LRE) | 0.024 **** | 0.005 | 0.015 | 0.035 | |||
| 5 | Capital-economic allocation | LE | 0.046 **** | 0.006 | 0.035 | 0.059 | ||
| 6 | CE | 0.012 **** | 0.003 | 0.006 | 0.018 | |||
| 7 | LRE | 0.061 **** | 0.008 | 0.047 | 0.077 | |||
| 8 | Capital-labor allocation | CE | −0.023 **** | 0.004 | −0.032 | −0.016 | ||
| 9 | LRE | −0.065 **** | 0.009 | −0.083 | −0.049 | |||
| 10 | LE | 0.024 **** | 0.006 | 0.013 | 0.037 | |||
| 11 | Labor-economic allocation | LE | −0.004 **** | 0.001 | −0.006 | −0.003 | ||
| 12 | −0.013 **** | 0.002 | −0.018 | −0.009 | ||||
Disclaimer/Publisher’s Note: The statements, opinions and data contained in all publications are solely those of the individual author(s) and contributor(s) and not of MDPI and/or the editor(s). MDPI and/or the editor(s) disclaim responsibility for any injury to people or property resulting from any ideas, methods, instructions or products referred to in the content. |
© 2024 by the authors. Licensee MDPI, Basel, Switzerland. This article is an open access article distributed under the terms and conditions of the Creative Commons Attribution (CC BY) license (https://creativecommons.org/licenses/by/4.0/).
Share and Cite
Chen, J.; Pan, L. Impact of the Coupling Coordination Degree of Human Capital and Infrastructure on High-Quality Economic Development: Empirical Evidence from Chinese Cities. Sustainability 2024, 16, 8905. https://doi.org/10.3390/su16208905
Chen J, Pan L. Impact of the Coupling Coordination Degree of Human Capital and Infrastructure on High-Quality Economic Development: Empirical Evidence from Chinese Cities. Sustainability. 2024; 16(20):8905. https://doi.org/10.3390/su16208905
Chicago/Turabian StyleChen, Jinqi, and Lingying Pan. 2024. "Impact of the Coupling Coordination Degree of Human Capital and Infrastructure on High-Quality Economic Development: Empirical Evidence from Chinese Cities" Sustainability 16, no. 20: 8905. https://doi.org/10.3390/su16208905
APA StyleChen, J., & Pan, L. (2024). Impact of the Coupling Coordination Degree of Human Capital and Infrastructure on High-Quality Economic Development: Empirical Evidence from Chinese Cities. Sustainability, 16(20), 8905. https://doi.org/10.3390/su16208905