
Firm-Level Digitalization for Sustainability Performance: Evidence from Ningbo City of China


Abstract
1. Introduction
2. Theoretical Foundation and Hypotheses Formulation
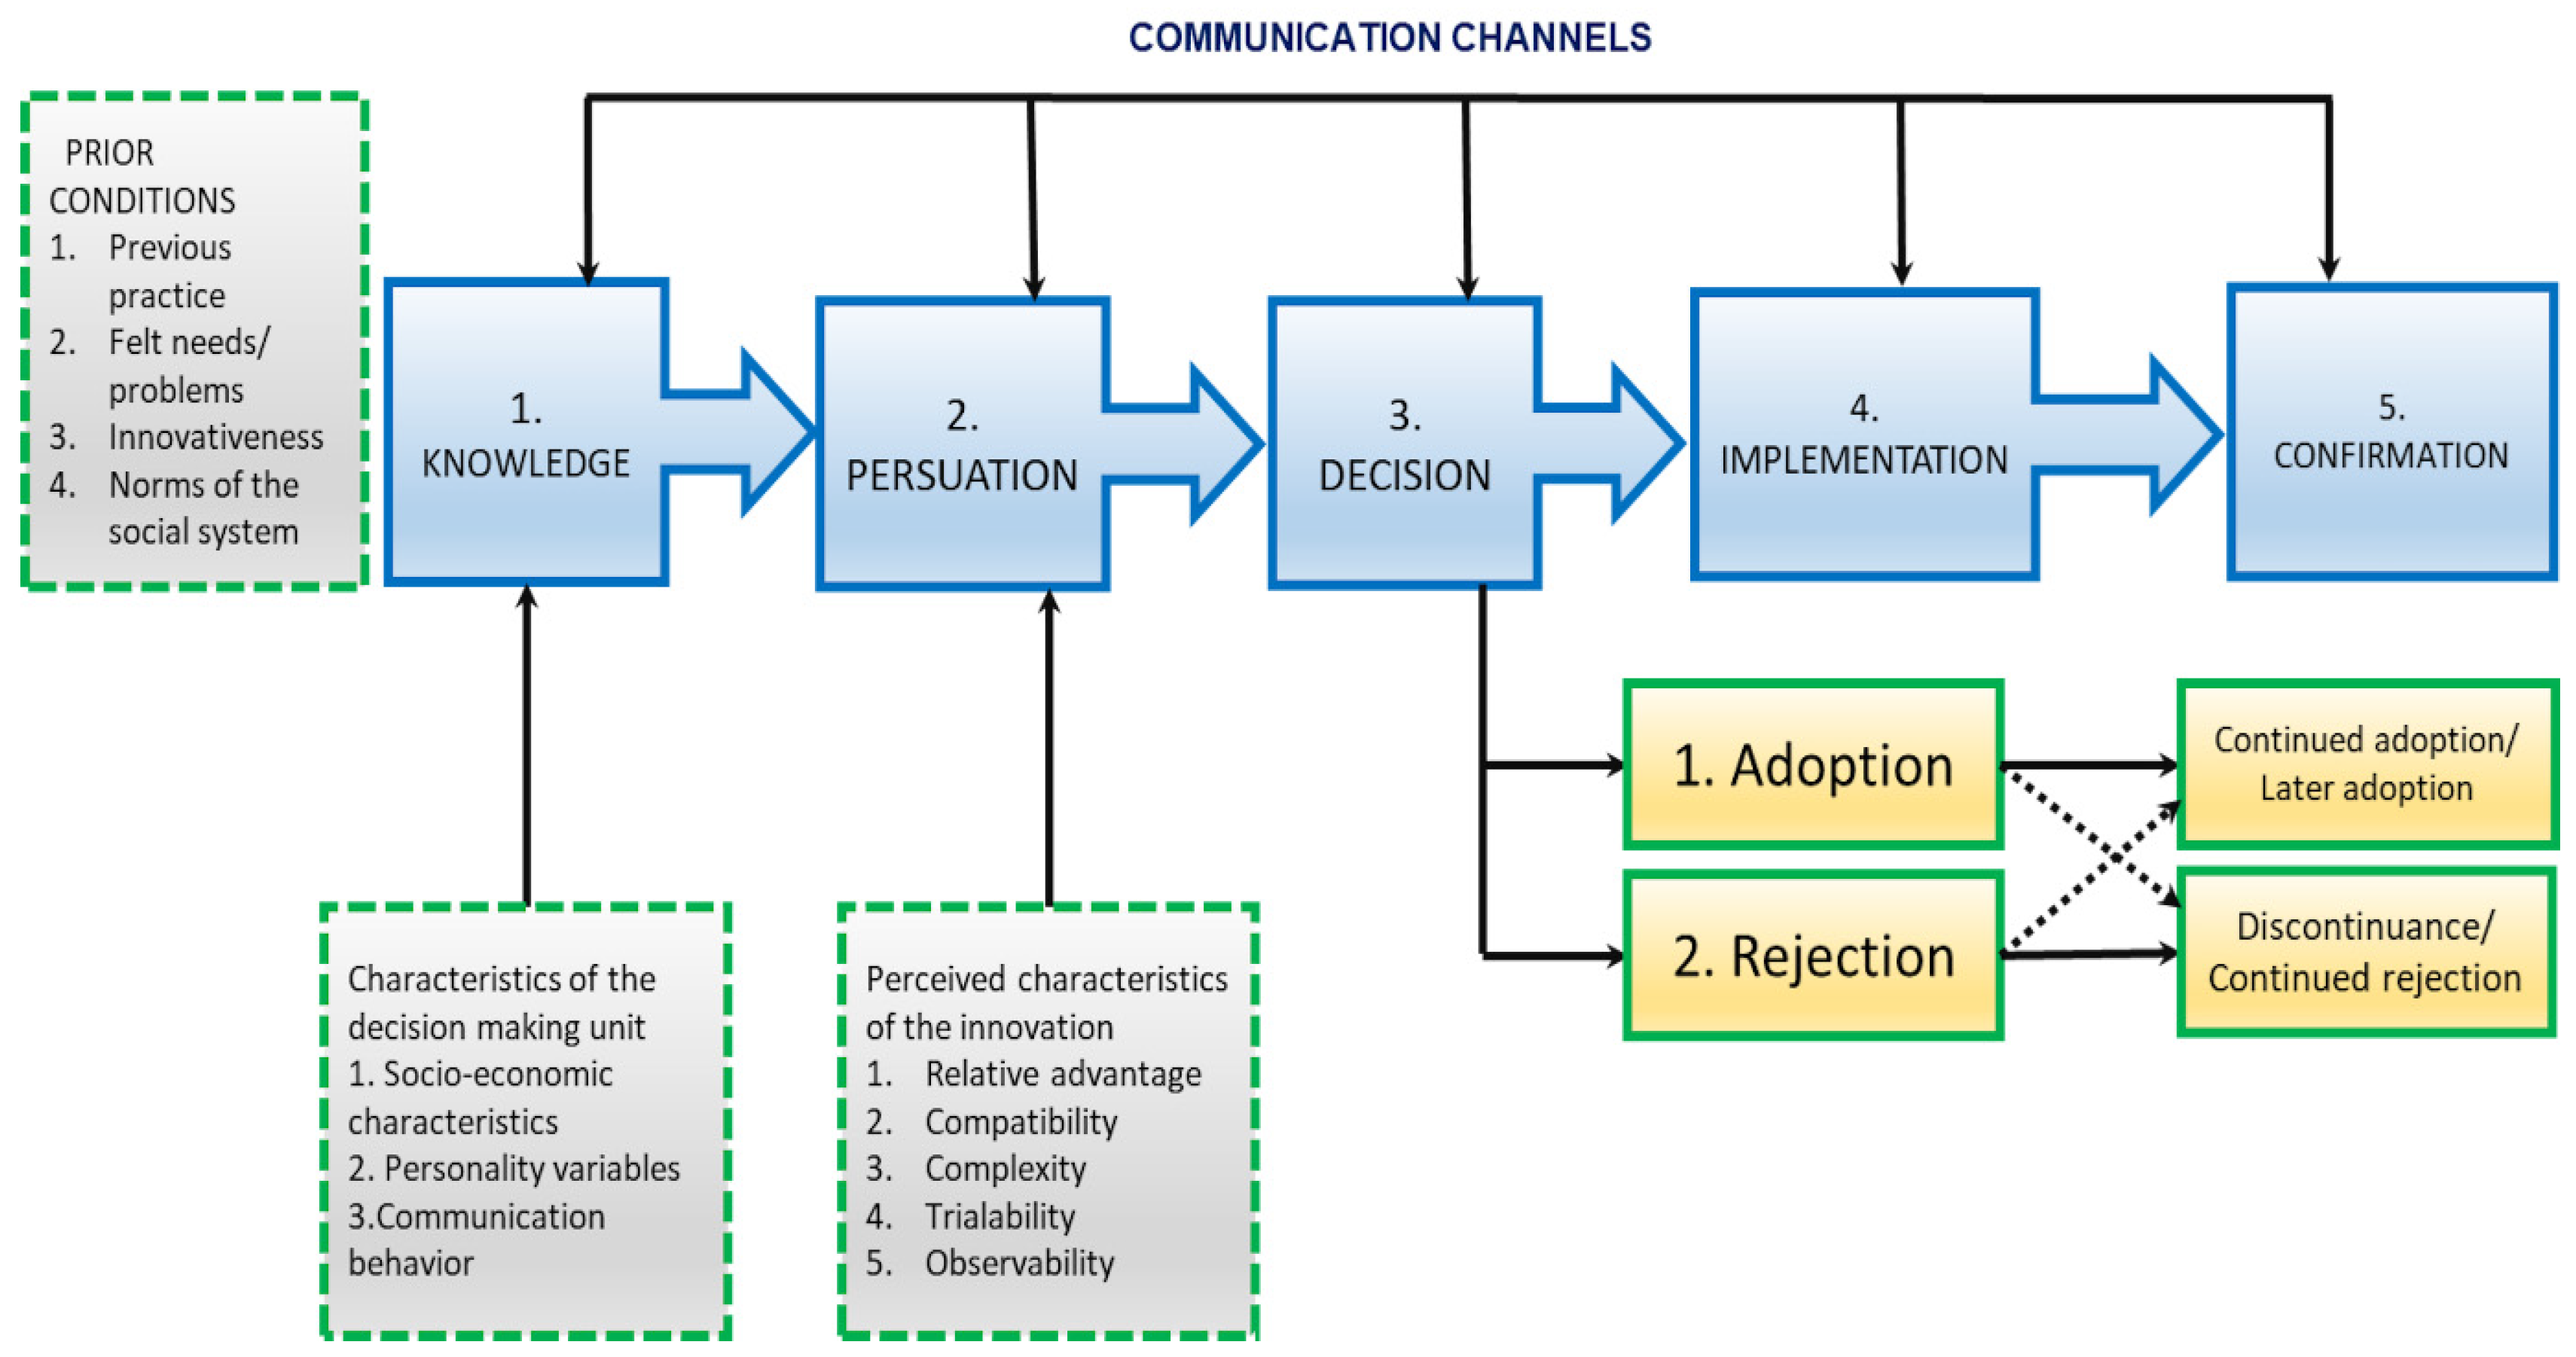
2.1. DIM-Based Factors and IoT Adoption
- The relative advantage of the IoT refers to the level at which the IoT is considered superior to traditional manual options. The progression of the use of the IoT depends on the level of relative advantage it offers. To illustrate, by utilizing real-time data from connected devices, firms are able to make data-driven decisions that increase their decision-making process, optimize operational efficiency, reduce waste, and enhance the quality of their products. This results in a notable benefit in areas such as operational effectiveness and customer contentment [98]. Regarding distinction through innovation, IoT technology has the potential to generate novel opportunities for the creation of products. Firms can develop inventive, data-centric goods and services that meet changing client needs and address environmental issues [99]. Emphasizing sustainability and efficiency can serve as a crucial factor that sets us apart from competitors in the marketplace. The IoT facilitates enhanced operational visibility by providing a comprehensive perspective of operations, allowing companies to discover areas of congestion, anticipate equipment malfunctions, and optimize the allocation of resources. The increased visibility leads to a competitive edge by enhancing responsiveness, accelerating turnaround times, and lowering production expenses [100]. Given these arguments, the following relationship can be hypothesized:
- The compatibility of the IoT refers to its alignment with present norms, prior knowledge, and the preferences and requirements of users. In the scenario showing that the IoT is not aligned with societal expectations and principles, its pace of uptake will likely be slow. To illustrate, businesses that are contemplating adoption may face a substantial obstacle in the shape of a lack of compatibility across the various IoT devices and platforms [101]. Let us imagine a situation in which different manufacturers of machines utilize communication protocols or data formats that are incompatible with one another. This results in difficulties when attempting to include them into a unified IoT system, which necessitates extra investments in adapters, gateways, or even whole system refurbishments [102]. It is possible for businesses, particularly smaller ones, to be dissuaded from entering the realm of IoT technology due to the intricacy and considerable upfront expense involved [103]. In addition, the ongoing development of IoT standards might give rise to specific worries over the futureproofing of any system that is selected. This can cause firms to be cautious about committing to a technology that may become outdated in a few years [104]. Along these lines, the following association can be formulated:
- The complexity of IoT alludes to the level of individuals’ comprehension of its application, as certain technologies are designed to be easily operated by users. However, some technological products are challenging for the users to comprehend. In this respect, the diversity of devices and protocols in the IoT might lead to issues with integration due to their wide range. Integrating sensors, machinery, and software from many manufacturers may be a complicated and costly process, requiring specialist knowledge and sometimes impeding smooth data interchange [105]. The substantial volume of data created by IoT devices gives rise to significant issues about data security and privacy. Corporations must have robust cybersecurity protocols to safeguard sensitive data from vulnerabilities or illegal entry, necessitating investments in security solutions and specialized knowledge [106]. In addition, when it comes to interfacing with existing systems, the effective integration of IoT with the current ICT infrastructure might provide a hurdle. Firms may be required to enhance outdated systems or allocate resources towards new platforms in order to effectively handle and analyze the large amount of data generated by IoT devices. This will contribute to the total expenses and intricacy of the deployment process [107]. Based on these theoretical points, the following connection can be established:
- The trialability of the IoT describes the level at which customers can engage with the IoT by experimenting with it via different endeavors. Under such circumstances, consumers are inclined to embrace emerging innovations like the IoT faster if they have previously worked with trial usage before choosing to embrace it. To explain further, contrary to extensive ICT initiatives that need significant initial expenses and lengthy implementation schedules, IoT solutions may often be deployed in a modular manner [81]. Companies may initiate small-scale trial initiatives in certain areas, such as monitoring the energy use of a particular manufacturing line or a building. Firms develop faith in the potential of the technology by directly witnessing its advantages, such as less waste or enhanced efficiency, in a controlled setting [75]. By reducing the perceived risk and expenditure involved in a complete implementation, this makes the adoption of the IoT more appealing to enterprises that are hesitant to explore unfamiliar technology domains [27]. The ability to quickly test and experiment with IoT applications encourages firms to adopt a “test-and-learn” strategy. This method helps companies find the most effective uses of the IoT and customize solutions to meet their individual requirements. As a result, the adoption of IoT technology is accelerated on a larger scale [108]. Against these arguments, the following association can be hypothesized:
- The observability in the context of the IoT pertains to the assessment and outlook on the IoT based on the feedback and experiences shared by the general people who have used the IoT. Collaborative conversation may also catalyze the uptake of novel technologies like the IoT. One major obstacle in using IoT technology is the apprehension of handling an intricate network of devices and the immense volume of data they produce. The observability component of the IoT is of utmost importance in this context, since it enables firms to gain real-time insights about the condition and functioning of their interconnected equipment [8]. By using centralized monitoring dashboards, anomaly detection, and data visualization tools, observability enables companies to proactively discover and resolve problems, optimize maintenance procedures, and ensure the efficient functioning of their IoT devices [15]. Increased visibility in the technology instils confidence and decreases the perceived difficulty of maintaining an IoT network, eventually promoting wider acceptance and unleashing the whole capabilities of the IoT for greater performance [109]. In the light of these arguments, the following hypothesized link can be formulated:
2.2. IoT Adoption and Firm-Level Sustainability Performance
2.2.1. Environmental Sustainability Performance
2.2.2. Economic and Innovation Performance
2.2.3. Energy Conservation
3. Methodology
3.1. Study Location and Research Design
3.2. Study Sample’s Demographic Attributes
3.3. Explanations of Study Variables
3.4. Statistical and Econometric Techniques
4. Results and Discussion
4.1. Results of Structural Equation Modeling
4.2. Results of Propensity Score Matching
5. Conclusions and Policy Recommendation
Author Contributions
Funding
Institutional Review Board Statement
Informed Consent Statement
Data Availability Statement
Conflicts of Interest
Appendix A

| 1. Demographic Information of Respondents and Firms’ Attributes Respondents Are Requested to Indicate the Relevant Option for Each of the Following Statements: | |||||
| 1.1. Age of firm owner (years) | 24–40 (young); 41–55 (middle-aged); Above 55 (old) | ||||
| 1.2. Gender of firm owner | 1. Male; 2. Female | ||||
| 1.3. Qualification of firm owner (schooling years) | Below primary (<6 years); 2. Primary education (6 years), 3. Junior secondary education (9 years), 4. Senior high school education (12 years), 5. Bachelor’s degree (16 years), 6. Master or PhD (18 years or above) | ||||
| 1.4. Firm size (measured by number of employees and annual revenue of the firm) | |||||
| 1.4.1. Number of employees of the firm | 1. less than 300 (small-sized); 2. 300–2000 (medium-sized) | ||||
| 1.4.2. Firm annual revenue | 1. 0.5–5 million RMB (small-sized); 2. 5–200 million RMB (medium-sized) | ||||
| 1.5. Firm category by annual earning (RMB) | 100,000–500,000 (low-earning firms); 2. 500,001–1,000,000 (medium-earning firms); 3. Above 1,000,000 (high-earning firms) | ||||
| 1.6. Firm type | Textile and garments; Information technology; Electronics; Foods and beverages; E-commerce and traders | ||||
| 2. Measurement items of exogenous constructs based on Diffusion of Innovation Modeling (DIM) framework factors Respondents are requested to indicate their degree of agreement or disagreement with the provided explanations of measurement items. | |||||
| 1 = Strongly Disagree | 2 = Disagree | 3 = Neutral | 4 = Agree | 5 = Strongly Agree | |
| Relative advantage (RLTV) | |||||
| RLTV1: I believe that I have the financial capability to invest in IoT. | |||||
| RLTV2: I believe adopting IoT will enhance the competitiveness of my business. | |||||
| RLTV3: I believe adopting IoT will make business transactions much easier than manual methods. | |||||
| RLTV4: I believe adopting IoT can partially substitute the labor force of my business. | |||||
| RLTV5: I believe the process of marketizing IoT is beneficial. | |||||
| RLTV6: I believe adopting IoT will enhance the efficiency of doing business than ever before. | |||||
| Compatibility (CMPT) | |||||
| CMPT1: I believe adopting IoT incurs excessive costs. | |||||
| CMPT2: I believe the current structure of my business is difficult to modify through the implementation of IoT. | |||||
| CMPT3: I believe that the number of employees who are capable of operating the new IoT configuration in my business activities is limited. | |||||
| CMPT4: It will become difficult to upgrade IoT infrastructure if the future devices are incompatible with existing ones. | |||||
| Complexity (CPLX) | |||||
| CPLX1: I believe that IoT products are difficult to manage initially. | |||||
| CPLX2: I believe that IoT products’ applications would necessitate frequent updates. | |||||
| CPLX3: I believe adopting IoT might risk my business to security breaches. | |||||
| CPLX4: I believe adopting IoT will involve data overload as the IoT devices generate a lot of data. | |||||
| Trialability (TRLB) | |||||
| TRLB1: I believe it might be appealing for IoT producers to provide a reimbursement policy on purchasing IoT technology. | |||||
| TRLB2: I believe that prior expertise with technology would facilitate the acceptance of IoT technology products. | |||||
| TRB3: I believe launching pilot programs of IoT applications in businesses could facilitate the acceptance of IoT technology products. | |||||
| Observability (OBSR) | |||||
| OBSR1: IoT is considered a valuable technology by my peers. | |||||
| OBSR2: The IoT product users recommend adopting this technology due to its ground-breaking characteristics. | |||||
| OBSR3: I believe that IoT technology wins broad social acceptance. | |||||
| Endogenous construct: Adoption of IoT (IoTA) | |||||
| IoTA1: I plan to adopt or have previously adopted IoT technology. | |||||
| IoTA2: I believe that the use of IoT technology is quite valuable. | |||||
| IoTA3: I am willing and able to autonomously decide on adopting IoT technology for my business. | |||||
| 3. Questions regarding the sustainability performance of small and medium-sized firms (SMFs) Respondents are requested to respond to each of the following questions. | Response | ||||
| 3.1. Environmental sustainability performance | |||||
| 3.1.1. How much does your firm spend annually on natural resources (water, coal, oil, natural gas, raw materials) (in RMB)? | |||||
| 3.1.2. How much does your firm invest annually in renewable energy technologies (in RMB)? | |||||
| 3.1.3. How much does your firm spend annually on environmental monitoring systems (in RMB)? | |||||
| 3.2. Economic sustainability performance | |||||
| 3.2.1. What is your firm’s annual input cost (in RMB)? | |||||
| 3.2.2. How much has your firm received in credits or financing (in RMB)? | |||||
| 3.2.3. How much annual revenue does your firm earn (in RMB)? | |||||
| 3.2.4. What is your firm’s annual profit (in RMB)? | |||||
| 3.3. Innovation performance | |||||
| 3.3.1. How much did your firm spend on sustainable technology innovations last year (in RMB)? | |||||
| 3.4. Energy conservation | |||||
| 3.4.1. How much does your firm invest annually in energy-efficient technologies (in RMB)? | |||||
| 3.4.2. How much does your firm spend in terms of utility bills (in RMB)? | |||||
| 4. IoT adopter versus non-adopter SMFs Respondents are requested to respond to the following questions in Yes/No. | Yes (adopter) | No (non-adopter) | |||
| 4.1. For SMFs belonging to the “Textile and garments” industry | |||||
| 4.1.1. Does your firm use IoT sensors for predictive maintenance of equipment? | |||||
| 4.1.2. Is your firm using automated quality control systems with IoT integration to track defects during production? | |||||
| 4.1.3. Has your firm implemented IoT-enabled machinery for real-time monitoring of production processes? | |||||
| 4.1.4. Does your firm use Radio Frequency Identification (RFID)-based tracking or other IoT technologies to monitor inventory in real-time? | |||||
| 4.1.5. Does your firm use IoT data analytics to optimize production schedules or inventory management? | |||||
| 4.2. For SMFs belonging to the “Information technology” industry | |||||
| 4.2.1. Does your firm develop IoT solutions or products for clients? | |||||
| 4.2.2. Is your firm’s IoT data integrated with cloud-based or other computing systems? | |||||
| 4.2.3. Does your firm invest in research and development for IoT technologies? | |||||
| 4.2.4. Does your firm use IoT for remote monitoring and maintenance of client IT infrastructure? | |||||
| 4.2.5. Does your firm use IoT data analytics to offer predictive analysis for clients? | |||||
| 4.3. For SMFs belonging to the “Electronics” industry | |||||
| 4.3.1. Does your firm manufacture IoT-enabled consumer electronics (e.g., smart appliances, wearables)? | |||||
| 4.3.2. Does your firm use IoT-enabled sensors for real-time monitoring and control of manufacturing processes? | |||||
| 4.3.3. Has your firm implemented IoT for predictive maintenance of production equipment? | |||||
| 4.3.4. Is IoT integrated into your firm’s logistics and distribution operations for real-time tracking of shipments? | |||||
| 4.3.5. Does your firm collect and analyze data from IoT-enabled products for insights into customer usage or performance? | |||||
| 4.4. For SMFs belonging to the “Foods and beverages” industry | |||||
| 4.4.1. Does your firm use IoT-enabled sensors for real-time monitoring of production processes (e.g., temperature, humidity)? | |||||
| 4.4.2. Has your firm implemented IoT solutions to ensure product quality (e.g., monitoring for spoilage or contamination)? | |||||
| 4.4.3. Does your firm use IoT for real-time tracking of raw materials and finished products in the supply chain? | |||||
| 4.4.4. Does your firm use IoT-enabled systems to track food and beverage shipments and ensure they are stored at optimal conditions (e.g., cold chain management)? | |||||
| 4.4.5. Does your firm use IoT solutions to track expiry dates and automate inventory rotation to reduce food waste? | |||||
| 4.5. For SMFs belonging to “E-commerce and traders” industry | |||||
| 4.5.1. Does your firm use IoT to monitor real-time inventory levels in warehouses? | |||||
| 4.5.2. Does your firm use IoT-enabled systems for sorting, packing, and shipping orders? | |||||
| 4.5.3. Does your firm use IoT-based solutions to track shipments in real-time, from suppliers to your warehouse and from your warehouse to customers? | |||||
| 4.5.4. Does your firm use IoT systems to monitor environmental conditions (e.g., temperature, humidity) in warehouses or storage facilities? | |||||
| 4.5.5. Are IoT systems integrated with your business’s Enterprise Resource Planning (ERP) or Customer Relationship Management (CRM) systems to improve decision-making and customer service? | |||||
Robustness Checks
| Hypothesized Path | βs | Conclusion | VIF (Threshold < 10) | ||
|---|---|---|---|---|---|
| H1: RLTV | → | IoTA | 0.825 *** | Equivalent | 3.267 |
| H2: CMPT | → | IoTA | −0.469 ** | Equivalent | 1.583 |
| H3: CPLX | → | IoTA | −0.372 ** | Equivalent | 6.378 |
| H4: TRLB | → | IoTA | 0.598 ** | Equivalent | 4.117 |
| H5: OBSR | → | IoTA | 0.680 *** | Equivalent | 2.956 |
| GoF | Estimate | Thresholds | Recommendation Reference |
|---|---|---|---|
| Comparative fit | |||
| NFIN | 0.968 | Exceeding 0.95 | [136] |
| TLIN | 0.962 | Exceeding 0.95 | [141] |
| CFIN | 0.987 | Exceeding 0.96 | [142] |
| General GoF | |||
| Unadjusted GoFIN | 0.958 | Exceeding 0.95 | [143] |
| Adjusted GoFIN | 0.915 | Exceeding 0.90 | [124] |
| Bad fit | |||
| RMSE | 0.059 | Less than 0.07 | [133] |
| Matching Standard | Outcome Variable(s) | Treated | Controls | ATET |
|---|---|---|---|---|
| Nearest neighbor matching (NNM) | Environmental sustainability (ENS) performance | (H6: IoTA → ENS performance) | ||
| Expenditures on natural resource consumption | 201 | 182 | −2.491 *** | |
| Expenditures on renewable energy technology products | 201 | 182 | 5.570 *** | |
| Expenditures on environmental monitoring systems | 201 | 182 | 1.229 ** | |
| Economic sustainability (ECS) performance | (H7: IoTA → ECS performance) | |||
| Firms’ input costs | 201 | 182 | −3.117 *** | |
| Firms’ access to credits | 201 | 182 | 4.706 *** | |
| Firms’ revenues | 201 | 182 | 9.753 *** | |
| Firms’ profits | 201 | 182 | 7.425 ** | |
| Innovation (INO) performance | (H8: IoTA → INO performance) | |||
| Expenditures on innovative products | 201 | 182 | 2.794 ** | |
| Energy conservation (ECO) | (H9: IoTA → ECO) | |||
| Expenditures on energy-efficient technology products | 201 | 182 | 7.815 *** | |
| Utility bills | 201 | 182 | −1.839 *** | |
References
- ENRR. State of the Transition 2023: Global Energy and Natural Resource Executive Perspectives; ENRR: Valparaiso, Indiana, 2023. [Google Scholar]
- WEF. World Economic Forum: On the Global Risks Report 2024; WEF: Geneva, Switzerland, 2024. [Google Scholar]
- Mukalayi, N.M.; Inglesi-lotz, R. Digital financial inclusion and energy and environment: Global positioning of Sub-Saharan African countries. Renew. Sustain. Energy Rev. 2023, 173, 113069. [Google Scholar] [CrossRef]
- Işık, C.; Ongan, S.; Ozdemir, D.; Jabeen, G.; Sharif, A.; Alvarado, R.; Amin, A.; Rehman, A. Renewable energy, climate policy uncertainty, industrial production, domestic exports/re-exports, and CO2 emissions in the USA: A SVAR approach. Gondwana Res. 2024, 127, 156–164. [Google Scholar] [CrossRef]
- Ahmad, M.; Satrovic, E. Modeling natural resources for ecological sustainability. Gondwana Res. 2024, 126, 243–266. [Google Scholar] [CrossRef]
- Jabeen, G.; Wang, D.; Işık, C.; Alvarado, R.; Ongan, S. Role of energy utilization intensity, technical development, economic openness, and foreign tourism in environmental sustainability. Gondwana Res. 2024, 127, 100–115. [Google Scholar] [CrossRef]
- Engvall, T.S.; Flak, L.S.; Sæbø, Ø. The role of digital technologies in global climate negotiations. Gov. Inf. Q. 2023, 40, 101867. [Google Scholar] [CrossRef]
- Saurin, T.A.; Patriarca, R.; Hegde, S.; Rayo, M. The influence of digital technologies on resilient performance: Contributions, drawbacks, and a research agenda. Appl. Ergon. 2024, 118, 104290. [Google Scholar] [CrossRef]
- An, S.; Cheung, C.F.; Willoughby, K.W. A gamification approach for enhancing older adults’ technology adoption and knowledge transfer: A case study in mobile payments technology. Technol. Forecast. Soc. Chang. 2024, 205, 123456. [Google Scholar] [CrossRef]
- Zou, Z.; Ahmad, M. Economic digitalization and energy transition for green industrial development pathways. Ecol. Inform. 2023, 78, 102323. [Google Scholar] [CrossRef]
- Deng, C.; Li, H.; Wang, Y.; Zhu, R. The double-edged sword in the digitalization of human resource management: Person-environment fit perspective. J. Bus. Res. 2024, 180, 114738. [Google Scholar] [CrossRef]
- Li, T.; Zhu, J.; Luo, J.; Yi, C.; Zhu, B. Breaking Triopoly to Achieve Sustainable Smart Digital Infrastructure Based on Open-Source Diffusion Using Government–Platform–User Evolutionary Game. Sustainability 2023, 15, 14412. [Google Scholar] [CrossRef]
- Zhang, X.; Ji, C.E.; Zhang, H.; Wei, Y.; Jin, J. On the Role of the Digital Industry in Reshaping Urban Economic Structure: The case of Hangzhou, China. J. Econ. Anal. 2023, 2, 123–139. [Google Scholar] [CrossRef]
- Alam, S.; Shuaib, M.; Ahmad, S.; Jayakody, D.N.K.; Muthanna, A.; Bharany, S.; Elgendy, I.A. Blockchain-Based Solutions Supporting Reliable Healthcare for Fog Computing and Internet of Medical Things (IoMT) Integration. Sustainability 2022, 14, 15312. [Google Scholar] [CrossRef]
- Usai, A.; Fiano, F.; Messeni Petruzzelli, A.; Paoloni, P.; Farina Briamonte, M.; Orlando, B. Unveiling the impact of the adoption of digital technologies on firms’ innovation performance. J. Bus. Res. 2021, 133, 327–336. [Google Scholar] [CrossRef]
- Alshahrani, S.T. Industry 4.0 in “Major Emerging Markets”: A Systematic Literature Review of Benefits, Use, Challenges, and Mitigation Strategies in Supply Chain Management. Sustainability 2023, 15, 14811. [Google Scholar] [CrossRef]
- Friess, M.; Haumann, T.; Alavi, S.; Ionut Oproiescu, A.; Schmitz, C.; Wieseke, J. The contingent effects of innovative digital sales technologies on B2B firms’ financial performance. Int. J. Res. Mark. 2024, in press. [CrossRef]
- Zhang, J.; Zhang, M.; Ballesteros-Pérez, P.; Philbin, S.P. A new perspective to evaluate the antecedent path of adoption of digital technologies in major projects of construction industry: A case study in China. Dev. Built Environ. 2023, 14, 100160. [Google Scholar] [CrossRef]
- Bhardwaj, A.; Kaushik, K.; Bharany, S.; Rehman, A.U.; Hu, Y.C.; Eldin, E.T.; Ghamry, N.A. IIoT: Traffic Data Flow Analysis and Modeling Experiment for Smart IoT Devices. Sustainability 2022, 14, 14645. [Google Scholar] [CrossRef]
- Wang, X.; Ma, C.; Yao, Z. The double-edged sword effect of digital capability on green innovation: Evidence from Chinese listed industrial firms. Econ. Anal. Policy 2024, 82, 321–339. [Google Scholar] [CrossRef]
- Wei, S.; Liu, W.; Choi, T.M.; Dong, J.X.; Long, S. The influence of key components and digital technologies on manufacturer’s choice of innovation strategy. Eur. J. Oper. Res. 2024, 315, 1210–1220. [Google Scholar] [CrossRef]
- Zhou, Y.; Liu, J. Advances in emerging digital technologies for energy efficiency and energy integration in smart cities. Energy Build. 2024, 315, 114289. [Google Scholar] [CrossRef]
- Liang, P.; Sun, X. Does digital transformation promote the green innovation of China’s listed companies? Environ. Dev. Sustain. 2024, 26, 22199–22235. [Google Scholar] [CrossRef]
- Timbula, M.A.; Marvadi, C. Digital transformation: Acceptance and use of technology among microfinance institutions in developing country: An application of UTAUT2 mode. Int. J. Inf. Technol. 2023, 15, 4459–4468. [Google Scholar] [CrossRef]
- Cirillo, V.; Fanti, L.; Mina, A.; Ricci, A. The adoption of digital technologies: Investment, skills, work organisation. Struct. Chang. Econ. Dyn. 2023, 66, 89–105. [Google Scholar] [CrossRef]
- Li, S.; Gao, L.; Han, C.; Gupta, B.; Alhalabi, W.; Almakdi, S. Exploring the effect of digital transformation on Firms’ innovation performance. J. Innov. Knowl. 2023, 8, 100317. [Google Scholar] [CrossRef]
- Tiwari, A.K.; Marak, Z.R.; Paul, J.; Deshpande, A.P. Determinants of electronic invoicing technology adoption: Toward managing business information system transformation. J. Innov. Knowl. 2023, 8, 100366. [Google Scholar] [CrossRef]
- Dabbous, A.; Aoun Barakat, K.; Tarhini, A. Digitalization, crowdfunding, eco-innovation and financial development for sustainability transitions and sustainable competitiveness: Insights from complexity theory. J. Innov. Knowl. 2024, 9, 100460. [Google Scholar] [CrossRef]
- Shao, Y.; Xu, K.; Shan, Y.G. Leveraging corporate digitalization for green technology innovation: The mediating role of resource endowments. Technovation 2024, 133, 102999. [Google Scholar] [CrossRef]
- Zhang, X.; Li, J.; Xiang, D.; Worthington, A.C. Digitalization, financial inclusion, and small and medium-sized enterprise financing: Evidence from China. Econ. Model. 2023, 126, 106410. [Google Scholar] [CrossRef]
- Liu, X.; Chong, Y.; Di, D.; Li, G. Digital financial development, synergistic reduction of pollution, and carbon emissions: Evidence from biased technical change. Environ. Sci. Pollut. Res. 2023, 30, 109671–109690. [Google Scholar] [CrossRef]
- Lin, B.; Xu, C. Digital inclusive finance and corporate environmental performance: Insights from Chinese micro, small- and medium-sized manufacturing enterprises. Borsa Istanb. Rev. 2024, 24, 460–473. [Google Scholar] [CrossRef]
- Liu, M.; Xu, X.; Chu, H.; Huang, S.; Li, W. Research on the pathway of digital technology to drive China’s energy sector to achieve its carbon neutrality goal. Environ. Sci. Pollut. Res. Int. 2023, 30, 122663–122676. [Google Scholar] [CrossRef] [PubMed]
- Liao, M.H.; Wang, C.T. Using enterprise architecture to integrate lean manufacturing, digitalization, and sustainability: A lean enterprise case study in the chemical industry. Sustainability 2021, 13, 4851. [Google Scholar] [CrossRef]
- Ebadinezhad, S.; Mobolade, T.E. A Novel Cloud-Based IoT Framework for Secure Health Monitoring. Sustainability 2024, 16, 1349. [Google Scholar] [CrossRef]
- Peiyao, Q.; Benrui, C. Research on the impact of digital technology applications on firms’ dual innovation in the digital economy context. Sci. Rep. 2024, 14, 6415. [Google Scholar] [CrossRef]
- Kronlid, C.; Brantnell, A.; Elf, M.; Borg, J.; Palm, K. Sociotechnical analysis of factors influencing IoT adoption in healthcare: A systematic review. Technol. Soc. 2024, 78, 102675. [Google Scholar] [CrossRef]
- Rey, A.; Panetti, E.; Maglio, R.; Ferretti, M. Determinants in adopting the Internet of Things in the transport and logistics industry. J. Bus. Res. 2021, 131, 584–590. [Google Scholar] [CrossRef]
- Jaspers, E.D.T.; Pearson, E. Consumers’ acceptance of domestic Internet-of-Things: The role of trust and privacy concerns. J. Bus. Res. 2022, 142, 255–265. [Google Scholar] [CrossRef]
- Ali, S.M.; Ashraf, M.A.; Taqi, H.M.M.; Ahmed, S.; Rob, S.M.A.; Kabir, G.; Paul, S.K. Drivers for Internet of Things (IoT) adoption in supply chains: Implications for sustainability in the post-pandemic era. Comput. Ind. Eng. 2023, 183, 109515. [Google Scholar] [CrossRef]
- Hsu, C.L.; Lin, J.C.C. An empirical examination of consumer adoption of Internet of Things services: Network externalities and concern for information privacy perspectives. Comput. Human Behav. 2016, 62, 516–527. [Google Scholar] [CrossRef]
- Shaqrah, A.; Almars, A. Examining the internet of educational things adoption using an extended unified theory of acceptance and use of technology. Internet Things 2022, 19, 100558. [Google Scholar] [CrossRef]
- Langer, G.; Schulze, H.; Kühl, S. From intentions to adoption: Investigating the attitudinal and emotional factors that drive IoT sensor use among dairy farmers. Smart Agric. Technol. 2024, 7, 100404. [Google Scholar] [CrossRef]
- Esfahbodi, A.; Pang, G.; Peng, L. Determinants of consumers’ adoption intention for blockchain technology in E-commerce. J. Digit. Econ. 2022, 1, 89–101. [Google Scholar] [CrossRef]
- Qin, W. How to unleash frugal innovation through internet of things and artificial intelligence: Moderating role of entrepreneurial knowledge and future challenges. Technol. Forecast. Soc. Chang. 2024, 202, 123286. [Google Scholar] [CrossRef]
- Ge, C.; Lv, W.; Wang, J. The Impact of Digital Technology Innovation Network Embedding on Firms’ Innovation Performance: The Role of Knowledge Acquisition and Digital Transformation. Sustainability 2023, 15, 6938. [Google Scholar] [CrossRef]
- Attaran, S.; Attaran, M.; Celik, B.G. Digital Twins and Industrial Internet of Things: Uncovering operational intelligence in industry 4.0. Decis. Anal. J. 2024, 10, 100398. [Google Scholar] [CrossRef]
- Tang, C.P.; Huang, T.C.K.; Wang, S.T. The impact of Internet of things implementation on firm performance. Telemat. Inform. 2018, 35, 2038–2053. [Google Scholar] [CrossRef]
- Nalajala, P.; Gudikandhula, K.; Shailaja, K.; Tigadi, A.; Rao, S.M.; Vijayan, D.S. Adopting internet of things for manufacturing firms business model development. J. High Technol. Manag. Res. 2023, 34, 100456. [Google Scholar] [CrossRef]
- Masoomi, B.; Sahebi, I.G.; Gholian-Jouybari, F.; Mejia-Argueta, C.; Hajiaghaei-Keshteli, M. The role of internet of things adoption on the sustainability performance of the renewable energy supply chain: A conceptual framework. Renew. Sustain. Energy Rev. 2024, 202, 114610. [Google Scholar] [CrossRef]
- Mishra, R.; Kr Singh, R.; Daim, T.U.; Fosso Wamba, S.; Song, M. Integrated usage of artificial intelligence, blockchain and the internet of things in logistics for decarbonization through paradox lens. Transp. Res. Part E Logist. Transp. Rev. 2024, 189, 103684. [Google Scholar] [CrossRef]
- Musarat, M.A.; Alaloul, W.S.; Khan, A.M.; Ayub, S.; Jousseaume, N. A survey-based approach of framework development for improving the application of internet of things in the construction industry of Malaysia. Results Eng. 2024, 21, 101823. [Google Scholar] [CrossRef]
- Ding, S.; Ward, H.; Tukker, A. How Internet of Things can influence the sustainability performance of logistics industries—A Chinese case study. Clean. Logist. Supply Chain 2023, 6, 100094. [Google Scholar] [CrossRef]
- Abbas, M.T.; Grinnemo, K.J.; Ferré, G.; Laurent, P.; Alfredsson, S.; Rajiullah, M.; Eklund, J. Towards zero-energy: Navigating the future with 6G in Cellular Internet of Things. J. Netw. Comput. Appl. 2024, 230, 103945. [Google Scholar] [CrossRef]
- Guan, H. Construction of urban low-carbon development and sustainable evaluation system based on the internet of things. Heliyon 2024, 10, e30533. [Google Scholar] [CrossRef] [PubMed]
- Hu, Y. Research on Industry 4.0 smart grid monitoring and energy management based on data mining and Internet of Things technology. Therm. Sci. Eng. Prog. 2024, 54, 102830. [Google Scholar] [CrossRef]
- Sun, G.; Yin, D.; Kong, T.; Yin, L. The impact of the integration of the digital economy and the real economy on the risk of stock price collapse. Pacific Basin Financ. J. 2024, 85, 102373. [Google Scholar] [CrossRef]
- Zhao, X.; Weng, Z. Digital dividend or divide: The digital economy and urban entrepreneurial activity. Socioecon. Plann. Sci. 2024, 93, 101857. [Google Scholar] [CrossRef]
- Lv, J.; Li, S.; Zhu, M.; Huang, W. Can the digital economy development limit the size of the informal economy? A nonlinear analysis based on China’s provincial panel data. Econ. Anal. Policy 2024, 83, 896–921. [Google Scholar] [CrossRef]
- Riaz, A.R.; Gilani, S.M.M.; Naseer, S.; Alshmrany, S.; Shafiq, M.; Choi, J.G. Applying Adaptive Security Techniques for Risk Analysis of Internet of Things (IoT)-Based Smart Agriculture. Sustainability 2022, 14, 10964. [Google Scholar] [CrossRef]
- Rogers, E.M. Diffusion of Innovations; Free Press: New York, NY, USA, 2003; ISBN 0029266505. [Google Scholar]
- Liu, Y.; Dong, J.; Mei, L.; Shen, R. Digital innovation and performance of manufacturing firms: An affordance perspective. Technovation 2023, 119, 102458. [Google Scholar] [CrossRef]
- Primanthi, M.R.; Kalirajan, K. Sources of Productivity Growth in the Indonesian Manufacturing Industries. J. Econ. Anal. 2023, 2, 31–46. [Google Scholar] [CrossRef]
- Nucci, F.; Puccioni, C.; Ricchi, O. Digital technologies and productivity: A firm-level investigation. Econ. Model. 2023, 128, 106524. [Google Scholar] [CrossRef]
- Ferreira, J.J.M.; Fernandes, C.I.; Veiga, P.M. The effects of knowledge spillovers, digital capabilities, and innovation on firm performance: A moderated mediation model. Technol. Forecast. Soc. Chang. 2024, 200, 123086. [Google Scholar] [CrossRef]
- He, P.; Lovo, S.; Veronesi, M. Social networks and renewable energy technology adoption: Empirical evidence from biogas adoption in China. Energy Econ. 2022, 106, 105789. [Google Scholar] [CrossRef]
- Saihi, A.; Ben-Daya, M.; Hariga, M.; As’ad, R. A Structural equation modeling analysis of generative AI chatbots adoption among students and educators in higher education. Comput. Educ. Artif. Intell. 2024, 7, 100274. [Google Scholar] [CrossRef]
- Alzahrani, N.A.; Sheikh Abdullah, S.N.H.; Adnan, N.; Zainol Ariffin, K.A.; Mohammed Mukred, M.S.; Mohamed, I.; Wahab, S. Geographic information systems adoption model: A partial least square-structural equation modeling analysis approach. Heliyon 2024, 10, e35039. [Google Scholar] [CrossRef]
- Takyi-Annan, G.E.; Zhang, H. Assessing the impact of overcoming BIM implementation barriers on BIM usage frequency and circular economy in the project lifecycle using Partial least Squares structural Equation modelling (PLS-SEM) analysis. Energy Build. 2023, 295, 113329. [Google Scholar] [CrossRef]
- Ahmad, M.; Jabeen, G. Biogas technology adoption and household welfare perspectives for sustainable development. Energy Policy 2023, 113728. [Google Scholar] [CrossRef]
- Salam, M.A.; Sarker, M.N.I. Impact of hybrid variety adoption on the performance of rice farms in Bangladesh: A propensity score matching approach. World Dev. Sustain. 2023, 2, 100042. [Google Scholar] [CrossRef]
- Mideksa, B.; Muluken, G.; Eric, N. The impact of soil and water conservation practices on food security in eastern Ethiopia. A propensity score matching approach. Agric. Water Manag. 2023, 289, 108510. [Google Scholar] [CrossRef]
- Zhou, H.; Wang, R.; Zhang, X.; Chang, M. The impact of digital technology adoption on corporate supply chain concentration: Evidence from patent analysis. Financ. Res. Lett. 2024, 64, 105413. [Google Scholar] [CrossRef]
- Hasani, A.; Haseli, G. Chapter 7—Digital transformation technologies for sustainable supply chain. In Cognitive Data Science in Sustainable Computing; Deveci, M., Ed.; Academic Press: Cambridge, MA, USA, 2024; pp. 149–168. ISBN 978-0-443-23597-9. [Google Scholar]
- Wu, H.; Li, G.; Zheng, H. How Does Digital Intelligence Technology Enhance Supply Chain Resilience? Sustainable Framework and Agenda. Ann. Oper. Res. 2024. [Google Scholar] [CrossRef]
- Huang, Q.; Fang, J.; Xue, X.; Gao, H. Does digital innovation cause better ESG performance? an empirical test of a-listed firms in China. Res. Int. Bus. Financ. 2023, 66, 102049. [Google Scholar] [CrossRef]
- Maretto, L.; Faccio, M.; Battini, D. The adoption of digital technologies in the manufacturing world and their evaluation: A systematic review of real-life case studies and future research agenda. J. Manuf. Syst. 2023, 68, 576–600. [Google Scholar] [CrossRef]
- Rahmani, A.; Aboojafari, R.; Bonyadi Naeini, A.; Mashayekh, J. Adoption of digital innovation for resource efficiency and sustainability in the metal industry. Resour. Policy 2024, 90, 104719. [Google Scholar] [CrossRef]
- Sharma, P.; Shukla, D.M.; Raj, A. Blockchain adoption and firm performance: The contingent roles of intangible capital and environmental dynamism. Int. J. Prod. Econ. 2023, 256, 108727. [Google Scholar] [CrossRef]
- Urraca-Ruiz, A.; Torracca, J.; Machado, T.; Britto, J. Expectations and digital technologies adoption in BRAZILIAN manufacturing firms. J. High Technol. Manag. Res. 2024, 35, 100498. [Google Scholar] [CrossRef]
- Charfeddine, L.; Hussain, B.; Kahia, M. Analysis of the Impact of Information and Communication Technology, Digitalization, Renewable Energy and Financial Development on Environmental Sustainability. Renew. Sustain. Energy Rev. 2024, 201, 114609. [Google Scholar] [CrossRef]
- Ferdaus, M.M.; Dam, T.; Anavatti, S.; Das, S. Digital technologies for a net-zero energy future: A comprehensive review. Renew. Sustain. Energy Rev. 2024, 202, 114681. [Google Scholar] [CrossRef]
- Wang, X.; Gan, Y.; Zhou, S.; Wang, X. Digital technology adoption, absorptive capacity, CEO green experience and the quality of green innovation: Evidence from China. Financ. Res. Lett. 2024, 63, 105271. [Google Scholar] [CrossRef]
- Davis, F.D. Perceived usefulness, perceived ease of use, and user acceptance of information technology. MIS Q. Manag. Inf. Syst. 1989, 13, 319–339. [Google Scholar] [CrossRef]
- Ali, A.; Akhmaaj, M.; Omar, M. The effects of planned behavior model constructs and technology acceptance model constructs on online purchasing behavior: An empirical study on internet users in the Libya city of Tripoli. Technol. Soc. 2024, 79, 102687. [Google Scholar] [CrossRef]
- Choi, J. Enablers and inhibitors of smart city service adoption: A dual-factor approach based on the technology acceptance model. Telemat. Informatics 2022, 75, 101911. [Google Scholar] [CrossRef]
- Alnemer, H.A. Determinants of digital banking adoption in the Kingdom of Saudi Arabia: A technology acceptance model approach. Digit. Bus. 2022, 2, 100037. [Google Scholar] [CrossRef]
- Venkatesh, V.; Morris, M.G.; Davis, G.B.; Davis, F.D. Unified Theory of Acceptance and Use of Technology. Am. Psychol. Assoc. 2003. [Google Scholar] [CrossRef]
- Rejali, S.; Aghabayk, K.; Mohammadi, A.; Shiwakoti, N. Evaluating public a priori acceptance of autonomous modular transit using an extended unified theory of acceptance and use of technology model. J. Public Transp. 2024, 26, 100081. [Google Scholar] [CrossRef]
- Michels, M.; Bonke, V.; Wever, H.; Musshoff, O. Understanding farmers’ intention to buy alternative fuel tractors in German agriculture applying the Unified Theory of Acceptance and Use of Technology. Technol. Forecast. Soc. Chang. 2024, 203, 123360. [Google Scholar] [CrossRef]
- Aysan, A.F.; Yüksel, S.; Eti, S.; Dinçer, H.; Akin, M.S.; Kalkavan, H.; Mikhaylov, A. A unified theory of acceptance and use of technology and fuzzy artificial intelligence model for electric vehicle demand analysis. Decis. Anal. J. 2024, 11, 100455. [Google Scholar] [CrossRef]
- Ajzen, I. The Theory of Planned Behavior. Organ. Behav. Hum. Decis. Process. 1991, 50, 179–211. [Google Scholar] [CrossRef]
- Yang, X.; Zhou, X.; Deng, X. Modeling farmers’ adoption of low-carbon agricultural technology in Jianghan Plain, China: An examination of the theory of planned behavior. Technol. Forecast. Soc. Chang. 2022, 180, 121726. [Google Scholar] [CrossRef]
- Chowdhury, A.; Kabir, K.H.; McQuire, M.; Bureau, D.P. The dynamics of digital technology adoption in rainbow trout aquaculture: Exploring multi-stakeholder perceptions in Ontario using Q methodology and the theory of planned behaviour. Aquaculture 2025, 594, 741460. [Google Scholar] [CrossRef]
- Vu, T.D.; Nguyen, H.V.; Nguyen, T.M.N. Extend theory of planned behaviour model to explain rooftop solar energy adoption in emerging market. Moderating mechanism of personal innovativeness. J. Open Innov. Technol. Mark. Complex. 2023, 9, 100078. [Google Scholar] [CrossRef]
- Jabeen, G.; Ahmad, M.; Zhang, Q. Factors influencing consumers’ willingness to buy green energy technologies in a green perceived value framework. Energy Sources Part B Econ. Plan. Policy 2021, 16, 669–685. [Google Scholar] [CrossRef]
- Yasmin, N.; Grundmann, P. Home-cooked energy transitions: Women empowerment and biogas-based cooking technology in Pakistan. Energy Policy 2020, 137, 111074. [Google Scholar] [CrossRef]
- Memon, K.R.; Ooi, S.K. Identifying digital leadership’s role in fostering competitive advantage through responsible innovation: A SEM-Neural Network approach. Technol. Soc. 2023, 75, 102399. [Google Scholar] [CrossRef]
- Lan, L.; Zhou, Z. Complementary or substitutive effects? The duality of digitalization and ESG on firm’s innovation. Technol. Soc. 2024, 77, 102567. [Google Scholar] [CrossRef]
- Shang, L.; Heckelei, T.; Gerullis, M.K.; Börner, J.; Rasch, S. Adoption and diffusion of digital farming technologies—integrating farm-level evidence and system interaction. Agric. Syst. 2021, 190, 103074. [Google Scholar] [CrossRef]
- James, S.; Fan, X.; Shou, Y. Digital technology use decisions by micro- and small-sized complementors in ecosystems: The influence of subjective norms. Technol. Forecast. Soc. Chang. 2024, 206, 123579. [Google Scholar] [CrossRef]
- Makinde, A.; Islam, M.M.; Wood, K.M.; Conlin, E.; Williams, M.; Scott, S.D. Investigating perceptions, adoption, and use of digital technologies in the Canadian beef industry. Comput. Electron. Agric. 2022, 198, 107095. [Google Scholar] [CrossRef]
- Weck, M.; Afanassieva, M. Toward the adoption of digital assistive technology: Factors affecting older people’s initial trust formation. Telecomm. Policy 2023, 47, 102483. [Google Scholar] [CrossRef]
- Siyal, A.W.; Chen, H.; Shahzad, F.; Bano, S. Investigating the role of institutional pressures, technology compatibility, and green transformation in driving manufacturing industries toward green development. J. Clean. Prod. 2023, 428, 139416. [Google Scholar] [CrossRef]
- Okorie, O.; Russell, J.; Cherrington, R.; Fisher, O.; Charnley, F. Digital transformation and the circular economy: Creating a competitive advantage from the transition towards Net Zero Manufacturing. Resour. Conserv. Recycl. 2023, 189, 106756. [Google Scholar] [CrossRef]
- Duong, C.D.; Nguyen, T.H. How ChatGPT adoption stimulates digital entrepreneurship: A stimulus-organism-response perspective. Int. J. Manag. Educ. 2024, 22, 101019. [Google Scholar] [CrossRef]
- Capestro, M.; Rizzo, C.; Kliestik, T.; Peluso, A.M.; Pino, G. Enabling digital technologies adoption in industrial districts: The key role of trust and knowledge sharing. Technol. Forecast. Soc. Chang. 2024, 198, 123003. [Google Scholar] [CrossRef]
- Chen, F.; Zhang, L.; Wu, H.; Dong, Z. Evaluation of the coupling coordination degree between digital inclusive finance and green technology innovation in China. Environ. Sci. Pollut. Res. Int. 2024, 31, 1212–1225. [Google Scholar] [CrossRef] [PubMed]
- Blichfeldt, H.; Faullant, R. Performance effects of digital technology adoption and product & service innovation—A process-industry perspective. Technovation 2021, 105, 102275. [Google Scholar] [CrossRef]
- Wang, B.; Gong, S.; Yang, Y. Unveiling the relation between digital technology and low-carbon innovation: Carbon emission trading policy as an antecedent. Technol. Forecast. Soc. Chang. 2024, 205, 123522. [Google Scholar] [CrossRef]
- Deng, N.; Gong, Y.; Wang, J. Promoting blockchain technology in low-carbon management to achieve firm performance from a socio-economic perspective: Empirical evidence from China. J. Clean. Prod. 2024, 448, 141686. [Google Scholar] [CrossRef]
- Vaillant, Y.; Lafuente, E. Digital versus non-digital servitization for environmental and non-financial performance benefits. J. Clean. Prod. 2024, 450, 142078. [Google Scholar] [CrossRef]
- Tianren, L.; Sufeng, H. Does digital-industrial technology integration reduce corporate carbon emissions? Environ. Res. 2024, 257, 119313. [Google Scholar] [CrossRef]
- Lim, J.S.; Zhang, J. Adoption of AI-driven personalization in digital news platforms: An integrative model of technology acceptance and perceived contingency. Technol. Soc. 2022, 69, 101965. [Google Scholar] [CrossRef]
- Zimmermann, R.; Soares, A.; Roca, J.B. The moderator effect of balance of power on the relationships between the adoption of digital technologies in supply chain management processes and innovation performance in SMEs. Ind. Mark. Manag. 2024, 118, 44–55. [Google Scholar] [CrossRef]
- Hao, X.; Fu, W.; Albitar, K. Innovation with ecological sustainability: Does corporate environmental responsibility matter in green innovation? J. Econ. Anal. 2023, 2, 21–42. [Google Scholar] [CrossRef]
- Hui, L.; Xie, H.; Chen, X. Digital technology, the industrial internet, and cost stickiness. China J. Account. Res. 2024, 17, 100339. [Google Scholar] [CrossRef]
- Ozili, P.K. Determinants of FinTech and BigTech lending: The role of financial inclusion and financial development. J. Econ. Anal. 2023, 2, 66–79. [Google Scholar] [CrossRef]
- Cai, H.; Wang, Z.; Ji, Y.; Xu, L. Digitalization and innovation: How does the digital economy drive technology transfer in China? Econ. Model. 2024, 136, 106758. [Google Scholar] [CrossRef]
- Olomu, M.O.; Binuyo, G.O.; Oyebisi, T.O. The adoption and impact of Internet-based technological innovations on the performance of the industrial cluster firms. J. Econ. Technol. 2023, 1, 164–178. [Google Scholar] [CrossRef]
- Halder, P.; Pietarinen, J.; Havu-Nuutinen, S.; Pöllänen, S.; Pelkonen, P. The Theory of Planned Behavior model and students’ intentions to use bioenergy: A cross-cultural perspective. Renew. Energy 2016, 89, 627–635. [Google Scholar] [CrossRef]
- Comrey, A.L.; Lee, H.B. A First Course in Factor Analysis, 2nd ed.; Lawrence Erlbaum Associates, Inc.: Hlilsdale, NJ, USA, 1992; p. 07642. ISBN 0805810625. [Google Scholar]
- Ahmad, M.; Khan, I.; Shahzad Khan, M.Q.; Jabeen, G.; Jabeen, H.S.; Işık, C. Households’ perception-based factors influencing biogas adoption: Innovation diffusion framework. Energy 2023, 263, 126155. [Google Scholar] [CrossRef]
- Ringle, C.M.; Sarstedt, M.; Mitchell, R.; Gudergan, S.P. Partial least squares structural equation modeling in HRM research. Int. J. Hum. Resour. Manag. 2018, 5192, 1–27. [Google Scholar] [CrossRef]
- Diebold, F.X.; Chen, C. Testing structural stability with endogenous breakpoint A size comparison of analytic and bootstrap procedures. J. Econom. 1996, 70, 221–241. [Google Scholar] [CrossRef]
- Rosenbaum, P.R.; Rubin, D.B. Constructing a control group using multivariate matched sampling methods that incorporate the propensity score. Am. Stat. 1985, 39, 33–38. [Google Scholar] [CrossRef]
- Horowitz, J.L.; Nesheim, L. Using penalized likelihood to select parameters in a random coefficients multinomial logit model. J. Econom. 2021, 222, 44–55. [Google Scholar] [CrossRef]
- Rosenbaum, P.R.; Rubin, D.B. The central role of the propensity score in observational studies for causal effects. In Matched Sampling for Causal Effects; Oxford Academic: Oxford, UK, 2006; pp. 170–184. [Google Scholar] [CrossRef]
- Caliendo, M.; Kopeinig, S. Some practical guidance for the implementation of propensity score matching. J. Econ. Surv. 2008, 22, 31–72. [Google Scholar] [CrossRef]
- Desgagné, A. The use of the bootstrap statistical method for the pharmacoeconomic cost analysis of skewed data. Pharmacoeconomics 1998, 13, 487–497. [Google Scholar] [CrossRef] [PubMed]
- Davison, A.; Hinkley, D. Bootstrap Methods and their Application. In Statistical and Probabilistic Mathematics; Cambridge University Press: Cambridge, UK, 1997; pp. 1–10. [Google Scholar]
- Hall, B.Y.P.; Horowitz, J.L. Bootstrap Critical Values for Tests Based on Generalized-Method-of-Moments Estimators. Econom. J. Econom. Soc. 2016, 64, 891–916. Available online: http://www.jstor.org/stable/2171849 (accessed on 4 June 2016). [CrossRef]
- Ketchen, D.J. A Primer on Partial Least Squares Structural Equation Modeling; Elsevier: Amsterdam, The Netherlands, 2013; Volume 46, ISBN 9781452217444. [Google Scholar]
- Hair, J.F., Jr.; Hult, G.T.M.; Ringle, C.M.; Sarstedt, M. A Primer on Partial Least Squares Structural Equation Modeling (PLS-SEM); Sage Publications: Thousand Oaks, CA, USA, 2021; ISBN 1544396333. [Google Scholar]
- Sarstedt, M.; Hair, J.F.; Ringle, C.M.; Thiele, K.O.; Gudergan, S.P. Estimation issues with PLS and CBSEM: Where the bias lies! J. Bus. Res. 2016, 69, 3998–4010. [Google Scholar] [CrossRef]
- Henseler, J.; Ringle, C.M.; Sarstedt, M. A new criterion for assessing discriminant validity in variance-based structural equation modeling. J. Acad. Mark. Sci. 2015, 43, 115–135. [Google Scholar] [CrossRef]
- Cohen, J.E. Statistical Power Analysis for the Behavioral Sciences; Routledge: New York, NY, USA, 2013; p. 490. [Google Scholar]
- Stone, M. Cross-Validatory Choice and Assessment of Statistical Predictions. J. R. Stat. Soc. Ser. B 1974, 36, 111–133. [Google Scholar] [CrossRef]
- Geisser, S. A predictive approach to the random effect model. Biometrika 1974, 61, 101–107. [Google Scholar] [CrossRef]
- Jean, R.J.B.; Deng, Z.; Kim, D.; Yuan, X. Assessing endogeneity issues in international marketing research. Int. Mark. Rev. 2016, 33, 483–512. [Google Scholar] [CrossRef]
- Kiraz, A.; Canpolat, O.; Özkurt, C.; Taşkın, H. Analysis of the factors affecting the Industry 4.0 tendency with the structural equation model and an application. Comput. Ind. Eng. 2020, 150, 106911. [Google Scholar] [CrossRef]
- Ma, Q.; Chan, A.H.S.; Chen, K. Personal and other factors affecting acceptance of smartphone technology by older Chinese adults. Appl. Ergon. 2016, 54, 62–71. [Google Scholar] [CrossRef] [PubMed]
- Hair, J.F.; Sarstedt, M.; Hopkins, L.; Kuppelwieser, V.G. Partial least squares structural equation modeling (PLS-SEM): An emerging tool in business research. Eur. Bus. Rev. 2014, 26, 106–121. [Google Scholar] [CrossRef]


| Survey Elements | Facts |
|---|---|
| Survey administration timeframe | May 2024 to June 2024 |
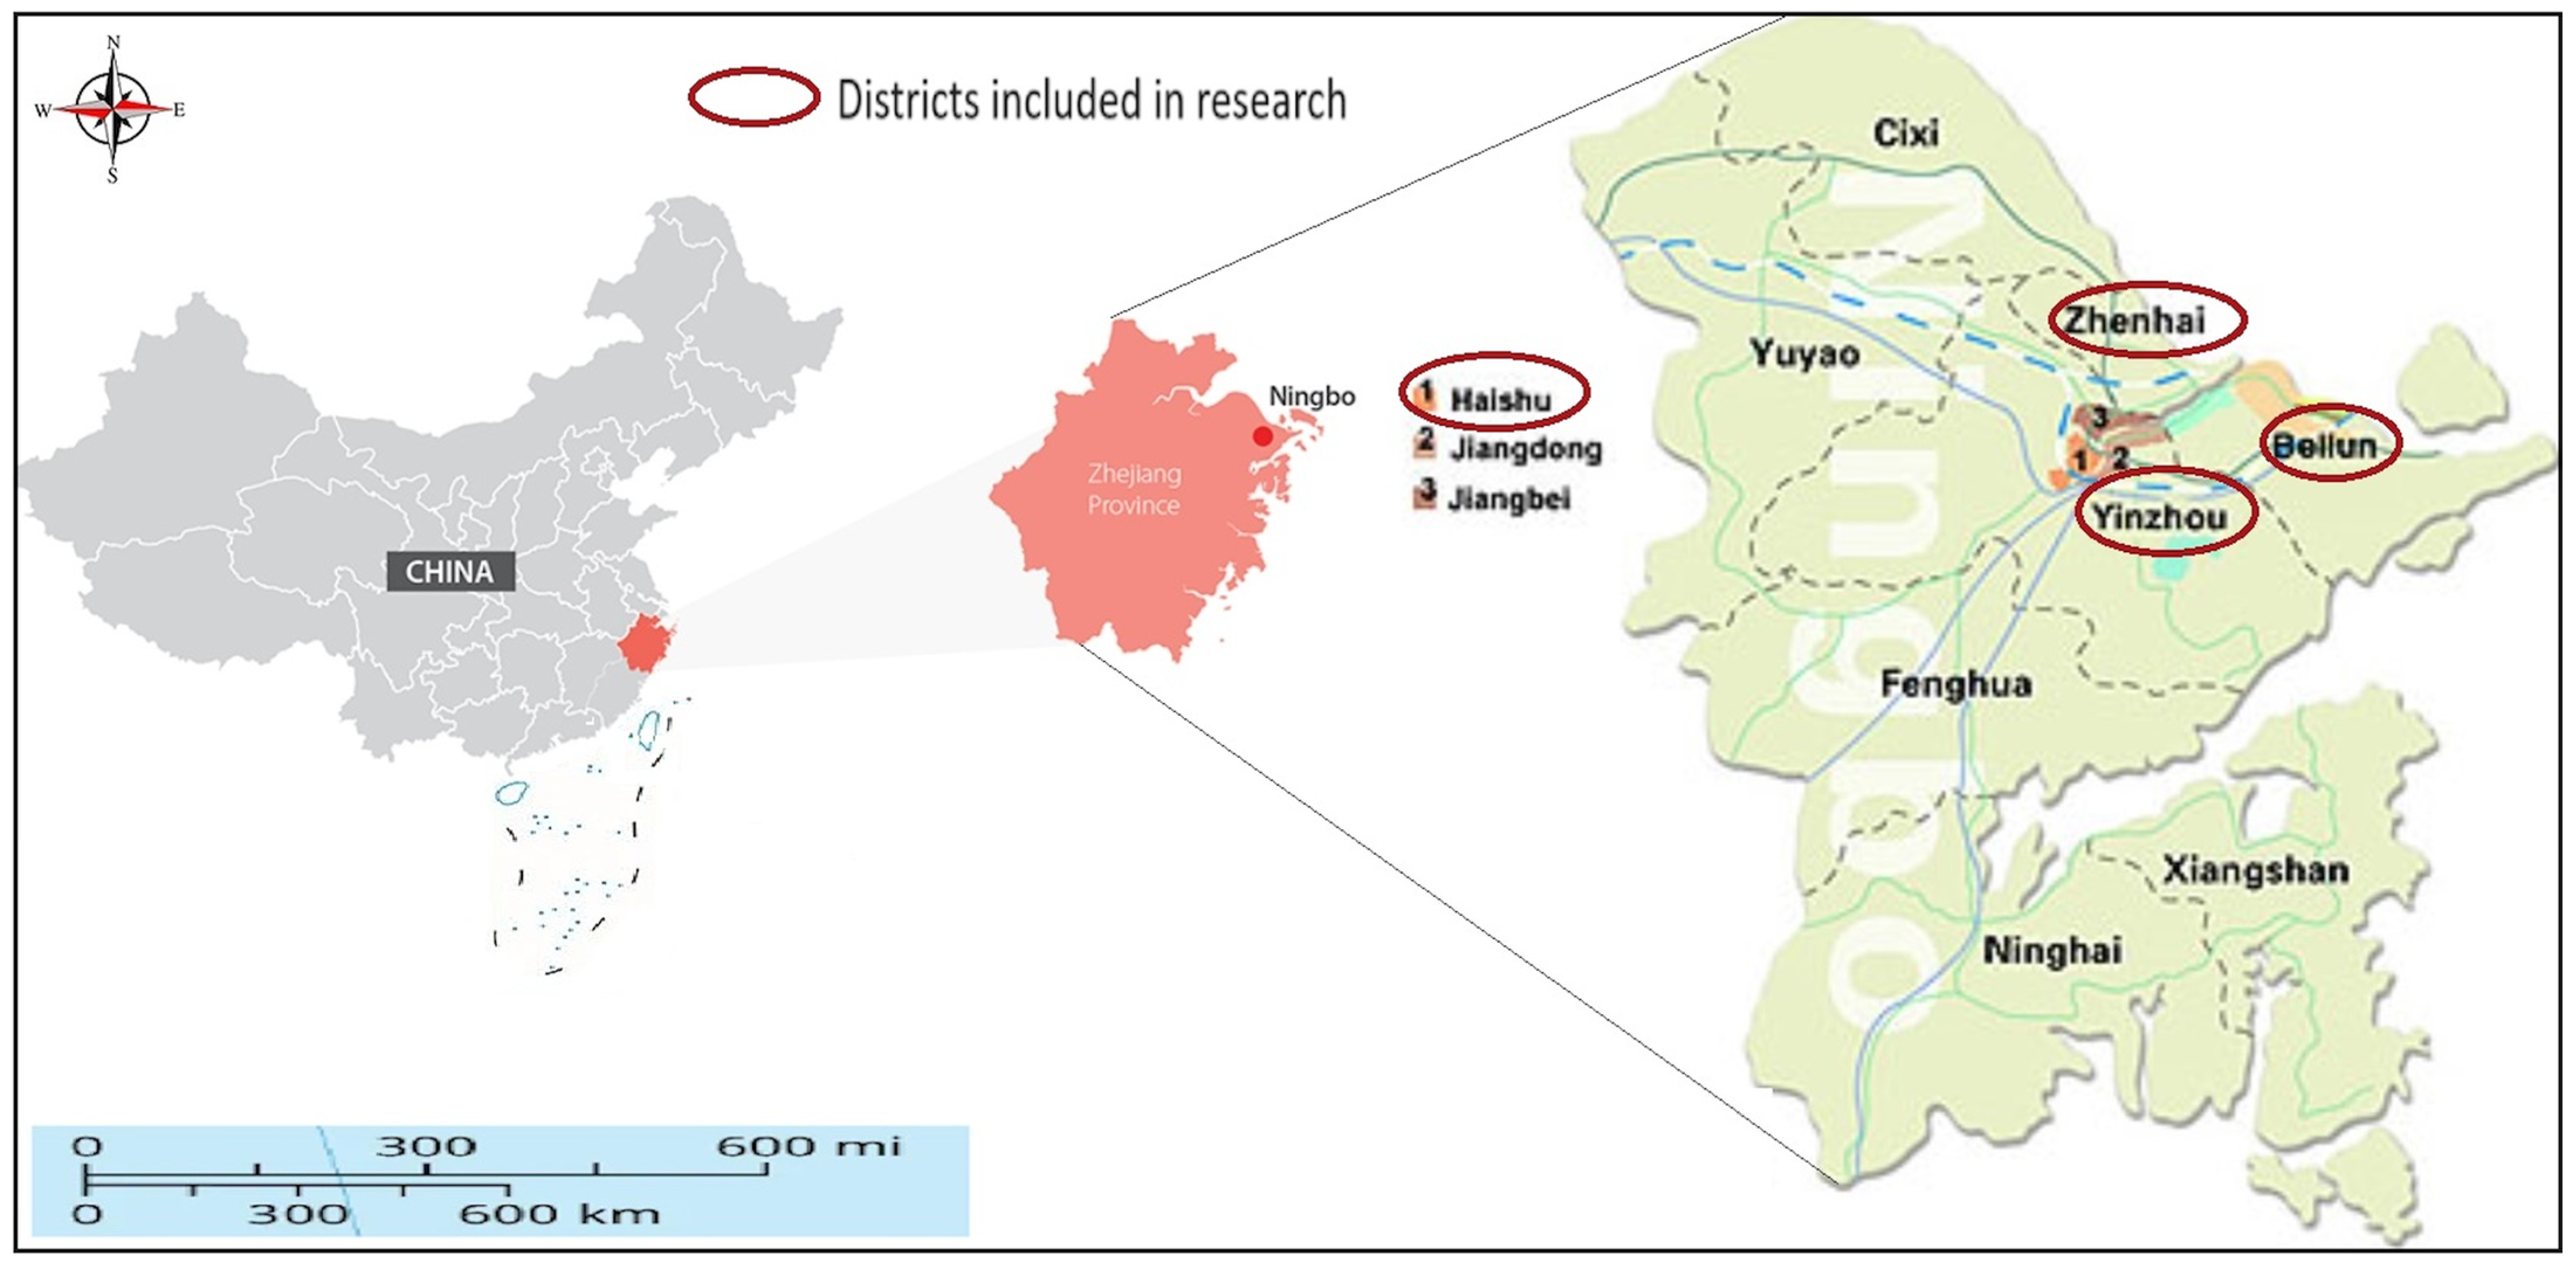
| Research site | * Zhenhai, Beilun, Haishu, and Yinzhou |
| Size of the sample | 587 |
| The number of valid responses | 491 |
| The number of adopters | 259 |
| The number of non-adopters | 232 |
| Rate of responses | 83.65% |
| Demographic Attribute | Classifications | Respondents/Firms | Proportion (%) |
|---|---|---|---|
| Age of firm owner (years) | Young (24–40) | 157 | 31.98 |
| Middle-aged (41–55) | 211 | 42.97 | |
| Old (>55) | 123 | 25.05 | |
| Gender of firm owner | Male | 394 | 80.24 |
| Female | 97 | 19.76 | |
| Qualification of firm owner (schooling years) | Below primary (<6 years) | 13 | 2.65 |
| Primary education (6 years) | 21 | 4.28 | |
| Junior secondary education (9 years) | 48 | 9.78 | |
| Senior high school education (12 years) | 174 | 35.44 | |
| Bachelor’s degree (16 years) | 119 | 24.23 | |
| Master or PhD (18 or above) | 116 | 23.62 | |
| Firm size * (number of employees/annual revenue) | Small-sized (<300/0.5 to 5 million RMB) | 279 | 56.82 |
| Medium-sized (300–2000/5 to 200 million RMB) | 212 | 43.18 | |
| Firm revenue (RMB per annum) | |||
| Low-earning firms | 100,000 to 500,000 | 92 | 18.74 |
| Medium-earning firms | 500,001 to 1,000,000 | 145 | 29.53 |
| High-earning firms | Above 1,000,000 | 254 | 51.73 |
| Firm type | Textile and garments | 118 | 24.03 |
| Information technology | 131 | 26.68 | |
| Electronics | 88 | 17.92 | |
| Foods and beverages | 69 | 14.05 | |
| E-commerce and traders | 85 | 17.31 | |
| Variable(s) | Variables’ Classification |
|---|---|
| Dependent variable | The Internet of Things (IoT) adoption (binary in nature); IoT adopter = 1, IoT non-adopter = 0 |
| Outcomes | Environmental sustainability performance (expenditures on natural resource consumption, expenditures on renewable energy technology products, expenditures on environmental monitoring systems), Economic sustainability performance (firms’ input costs, firms’ revenues, firms’ profits), Innovation performance (expenditures on innovative products), Energy conservation (expenditures on energy-efficient technology products, utility bills) |
| Independent variables | Demographic attributes (Age of firm owner, gender of firm owner, qualification of firm owner, firm size, and firm type), DIM framework factors (relative advantage, compatibility, complexity, trialability, observability) |
| Factors | IoTA | |||||
|---|---|---|---|---|---|---|
| RLTV | [0.876] | |||||
| CMPT | 0.517 | [0.838] | ||||
| CPLX | 0.139 | 0.136 | [0.810] | |||
| TRLB | 0.612 | 0.464 | 0.408 | [0.872] | ||
| OBSR | 0.263 | −0.385 | 0.237 | 0.336 | [0.854] | |
| IoTA | 0.398 | 0.419 | 0.581 | 0.192 | −0.623 | [0.835] |
| CNV | RIC | |||
|---|---|---|---|---|
| CLTs and Respective Itemized Components | External Loads | AVE | CMR | CR-Alpha |
| Relative advantage (RLTV) | ||||
| RLTV1: I believe that I have the financial capability to invest in IoT. | 0.819 | 0.795 | 0.857 | 0.711 |
| RLTV2: I believe adopting IoT will enhance the competitiveness of my business. | 0.836 | |||
| RLTV3: I believe adopting IoT will make business transactions much easier than manual methods. | 0.801 | |||
| RLTV4: I believe adopting IoT can partially substitute the labour force of my business. | 0.825 | |||
| RLTV5: I believe the process of marketizing IoT is beneficial. | 0.733 | |||
| RLTV6: I believe adopting IoT will enhance the efficiency of doing business than ever before. | 0.751 | |||
| Compatibility (CMPT) | ||||
| CMPT1: I believe adopting IoT incurs excessive costs. | 0.832 | 0.778 | 0.892 | 0.742 |
| CMPT2: I believe the current structure of my business is difficult to modify through the implementation of IoT. | 0.806 | |||
| CMPT3: I believe that the number of employees who are capable of operating the new IoT configuration in my business activities is limited. | 0.781 | |||
| CMPT4: It will become difficult to upgrade IoT infrastructure if the future devices are incompatible with existing ones. | 0.814 | |||
| Complexity (CPLX) | ||||
| CPLX1: I believe that IoT products are difficult to manage initially. | 0.815 | 0.740 | 0.884 | 0.729 |
| CPLX2: I believe that IoT products’ applications would necessitate frequent updates. | 0.768 | |||
| CPLX3: I believe adopting IoT might risk my business to security breaches. | 0.729 | |||
| CPLX4: I believe adopting IoT will involve data overload as the IoT devices generate a lot of data. | 0.761 | |||
| Trialability (TRLB) | ||||
| TRLB1: I believe it might be appealing for IoT producers to provide a reimbursement policy on purchasing IoT technology. | 0.824 | 0.732 | 0.857 | 0.713 |
| TRLB2: I believe that prior expertise with technology would facilitate the acceptance of IoT technology products. | 0.767 | |||
| TRB3: I believe launching pilot programs of IoT applications in businesses could facilitate the acceptance of IoT technology products. | 0.731 | |||
| Observability (OBSR) | ||||
| OBSR1: IoT is considered a valuable technology by my peers. | 0.816 | 0.783 | 0.875 | 0.741 |
| OBSR2: The IoT product users recommend adopting this technology due to its groundbreaking characteristics. | 0.839 | |||
| OBSR3: I believe that IoT technology wins broad social acceptance. | 0.728 | |||
| Adoption of IoT (IoTA) | ||||
| IoTA1: I plan to adopt or have previously adopted IoT technology. | 0.836 | 0.719 | 0.851 | 0.701 |
| IoTA2: I believe that the use of IoT technology is quite valuable. | 0.798 | |||
| IoTA3: I am willing and able to autonomously decide on adopting IoT technology for my business. | 0.843 | |||
| Adequacy of Sample by KMO Testing | 0.950 | |
|---|---|---|
| Bartlett sphericity | χ2 approximate | 4261.037 |
| DoF | 139 | |
| Significant @ | 0.000 | |
| Hypothesized Path | βs | Conclusion | f2 | R2 | Q2 | ||
|---|---|---|---|---|---|---|---|
| H1: RLTV | → | IoTA | 0.837 *** | Acceptance | 0.510 | 0.674 | 0.393 |
| H2: CMPT | → | IoTA | −0.478 *** | Acceptance | 0.291 | ||
| H3: CPLX | → | IoTA | −0.381 ** | Acceptance | 0.232 | ||
| H4: TRLB | → | IoTA | 0.613 *** | Acceptance | 0.374 | ||
| H5: OBSR | → | IoTA | 0.692 *** | Acceptance | 0.422 | ||
| Matching Standard | Outcome Variable(s) | Treated | Controls | ATET |
|---|---|---|---|---|
| Optimal pair matching (OPM) | Environmental sustainability (ENS) performance | (H6: IoTA → ENS performance) | ||
| Expenditures on natural resource consumption | 193 | 174 | −2.517 ** | |
| Expenditures on renewable energy technology products | 193 | 174 | 5.628 *** | |
| Expenditures on environmental monitoring systems | 193 | 174 | 1.269 *** | |
| Economic sustainability (ECS) performance | (H7: IoTA → ECS performance) | |||
| Firms’ input costs | 193 | 174 | −3.182 *** | |
| Firms’ access to credits | 193 | 174 | 4.873 *** | |
| Firms’ revenues | 193 | 174 | 9.836 ** | |
| Firms’ profits | 193 | 174 | 7.519 ** | |
| Innovation (INO) performance | (H8: IoTA → INO performance) | |||
| Expenditures on innovative products | 193 | 174 | 2.878 *** | |
| Energy conservation (ECO) | (H9: IoTA → ECO) | |||
| Expenditures on energy-efficient technology products | 193 | 174 | 7.931 *** | |
| Utility bills | 193 | 174 | −1.994 *** | |
Disclaimer/Publisher’s Note: The statements, opinions and data contained in all publications are solely those of the individual author(s) and contributor(s) and not of MDPI and/or the editor(s). MDPI and/or the editor(s) disclaim responsibility for any injury to people or property resulting from any ideas, methods, instructions or products referred to in the content. |
© 2024 by the authors. Licensee MDPI, Basel, Switzerland. This article is an open access article distributed under the terms and conditions of the Creative Commons Attribution (CC BY) license (https://creativecommons.org/licenses/by/4.0/).
Share and Cite
Shao, X.; Ahmad, M.; Javed, F. Firm-Level Digitalization for Sustainability Performance: Evidence from Ningbo City of China. Sustainability 2024, 16, 8881. https://doi.org/10.3390/su16208881
Shao X, Ahmad M, Javed F. Firm-Level Digitalization for Sustainability Performance: Evidence from Ningbo City of China. Sustainability. 2024; 16(20):8881. https://doi.org/10.3390/su16208881
Chicago/Turabian StyleShao, Xuemei, Munir Ahmad, and Fahad Javed. 2024. "Firm-Level Digitalization for Sustainability Performance: Evidence from Ningbo City of China" Sustainability 16, no. 20: 8881. https://doi.org/10.3390/su16208881
APA StyleShao, X., Ahmad, M., & Javed, F. (2024). Firm-Level Digitalization for Sustainability Performance: Evidence from Ningbo City of China. Sustainability, 16(20), 8881. https://doi.org/10.3390/su16208881