Article

Research on Land Use Versatility Evaluation, Spatiotemporal Coupling, and Influencing Factors Based on Multimethod Integration

1
College of Geographic Science, Qinghai Normal University, Xining 810008, China
2
Key Laboratory of Tibetan Plateau Land Surface Processes and Ecological Conservation (Ministry of Education), Qinghai Normal University, Xining 810008, China
3
Qinghai Province Key Laboratory of Physical Geography and Environmental Process, Qinghai Normal University, Xining 810008, China
4
Faculty of Geographical Science, Beijing Normal University, Beijing 100875, China
*
Author to whom correspondence should be addressed.
Sustainability 2024, 16(2), 843; https://doi.org/10.3390/su16020843
Submission received: 7 December 2023 / Revised: 4 January 2024 / Accepted: 16 January 2024 / Published: 18 January 2024
(This article belongs to the Section Sustainability in Geographic Science)

Abstract

:
Land use multifunctionality research is important for the efficient use of land resources and the resolution of land use conflicts. With the use of methods such as the technique for order of preference by similarity to ideal solution (TOPSIS) model, coupling coordination model, and geographical detector, the land use multifunctionality level, spatiotemporal coupling, and influencing factors in the Sichuan Province of China from 2000 to 2020 were systematically analyzed in this paper. It was revealed that, from 2000 to 2020, the comprehensive land use functionality in Sichuan Province was continuously improved with increasing economic, social, and ecological functionality levels. The comprehensive land use functionality in each city (prefecture) exhibited a positive development trend. The coupling coordination degree of the land use multifunctionality in Sichuan Province has been continuously improved, undergoing an evolutionary process from the brink of disarray to barely coordinated, then to primary coordination, and finally to medium coordination. The spatial differentiation of land use multifunctionality coupling coordination among cities (prefectures) was notable, showing center–periphery spatial distribution characteristics. The average slope and employed population density exhibited the highest explanatory power for the spatial differences in land use multifunctionality coupling coordination. The interaction between any two factors exerted a greater impact than any single factor on the spatial differentiation of land use multifunctionality coupling coordination. Based on the regional development characteristics, region-specific strategies should be adopted to enhance the land use multifunctionality level in Sichuan Province.

1. Introduction

Land serves as a vital foundation for human production and living, offering various products and services during its usage, thereby demonstrating the multifunctionality of land use. The study of land use multifunctionality is beneficial for measuring and evaluating the impact on human well-being, as well as aiding in the harmonious development of the national economy, society, and the ecological environment. As societal and economic progress continues, with the acceleration of industrialization, urbanization, and the modernization of agriculture, along with the increasing intensity of human activities [1,2], the scarcity of land resources in underdeveloped areas has become increasingly prominent. This scarcity leads to competition, where social development encroaches upon economic development spaces, economic growth divides ecological environmental spaces, and social development areas lack ecological spaces [3]. Consequently, investigating land use multifunctionality is important for enhancing the comprehensive benefits of land resources, optimizing the national territorial spatial pattern, facilitating ecological civilization construction, and contributing to the building of a beautiful China [2,4,5].
The study of land use multifunctionality traces its origins to the concept of multifunctionality in agriculture [6,7,8]. This term refers to the state and manifestation of the land use functions of a given region, including environmental, economic, and social aspects. This represents the diverse products and services provided by different land use practices and is a crucial concept and methodological framework for assessing the impact of land use changes on sustainability [2,6,9]. In recent years, land use multifunctionality has become a focal point of interest among scholars both domestically and internationally [2,3,4,10,11,12]. International researchers, relying on the Sustainability Impact Assessment–Tools for Environmental, Social and Economic Effects of Multifunctional Land Use in European Regions (SENSOR) project under the Sixth Framework Programme of the European Union [13,14], have empirically studied land use multifunctionality [14]. They have noted that changes in land use functionality can impact regional sustainable development [15]. Qualitative and quantitative studies have been carried out in typical regions, including the Mediterranean area [16,17], central Europe [18], northern Spain [19], North America [20], the northeastern part of South Asia in the Ganges River Basin [21], and the Arctic region [22]. Domestically, scholars have conducted research at various scales, ranging from national and provincial to municipal levels, as well as finer scales, such as land parcels and grid cells. Previous studies are generally based on typical geographic units such as ecologically fragile zones [2,3], the Xiangjiang River Basin [6], and the middle reaches of the Heihe River [7]. Land use multifunctionality can be categorized into economic–social–environmental–cultural [23], economic–social–production–ecological [24], and production–living–ecological [25] dimensions. Various mathematical models have been employed in these studies, including an exploratory spatial data analysis [3], geographically weighted regression [26], the gray relational projection method [23], and a comprehensive diagram method of full permutation polygons [27]. Overall, the existing research has achieved certain progress in the quantitative analysis of land use multifunctionality, thereby preliminarily establishing a research framework system. However, there are deficiencies in the scope of study regions and in the construction of theoretical frameworks.
Sichuan, characterized by its typical basin topography, exhibits significant regional differences in land use. Within this context, in this study, Sichuan Province was selected as the research subject, and an evaluative index system was constructed from three functional perspectives: economic, social, and ecological. Via the adoption of methodologies such as the entropy-weighted technique for order of preference by similarity to ideal solution (TOPSIS) model, coupling coordination degree, and a geographical detector and the utilization of analytical software such as ArcGIS (10.3) and SPSS (19.0), this research focuses on examining the spatiotemporal differentiation characteristics of land use multifunctionality and its coupling coordination in the region from 2000 to 2020. Furthermore, the aim was to identify the influencing factors of the spatial differentiation of land use multifunctionality and its coupling coordination. The objective was to provide insights for underdeveloped areas to enhance the efficacy of land resource utilization and optimize the national territorial spatial pattern.

2. Materials and Methods

2.1. Literature Review

The land use system is a composite ecosystem with specific attributes, and the functionality of land use intuitively reflects this system [15,16,28]. The multifunctionality of land use refers to the state and manifestations of the functions of land use in a specific region, including its economic, social, and ecological aspects, that is, the products and services provided to human production and life under different land use methods [15,29,30,31]. Generally speaking, the economic function is the foundation for the healthy development of land use, the social function is the goal, i.e., meeting the needs of human survival and development, while the ecological function serves as the safeguard. All three impact the functionality of land use. Based on different objectives, the subsystems of land use multifunctionality interact and establish a coupled and coordinated relationship in their respective developmental processes. This is characterized by economic functions supporting the enhancement of social functions and the maintenance of ecological functions: social functions, relying on economic development and ecological improvement, promote both, serving as a directive for internal functional optimization and coordination; the ecological function is a key component of sustainable development. The quality of ecological functions directly influences the development of economic and social functions, and the development of socioeconomics also poses severe challenges to environmental protection. In light of this, this study, drawing upon systems theory and the concept of sustainable development, constructs an evaluation index system for economic, social, and ecological functions with three dimensions: economy, society, and ecology (Figure 1). This system is used to comprehensively assess the level of land use multifunctionality. Additionally, by employing a coupling coordination model and integrating a geographic detector, this study calculates the internal coordination state of land use functions and comprehensively identifies influencing factors. This approach aims to further promote regional sustainable development, enhancing land use efficiency, and resolving conflicts in land utilization.

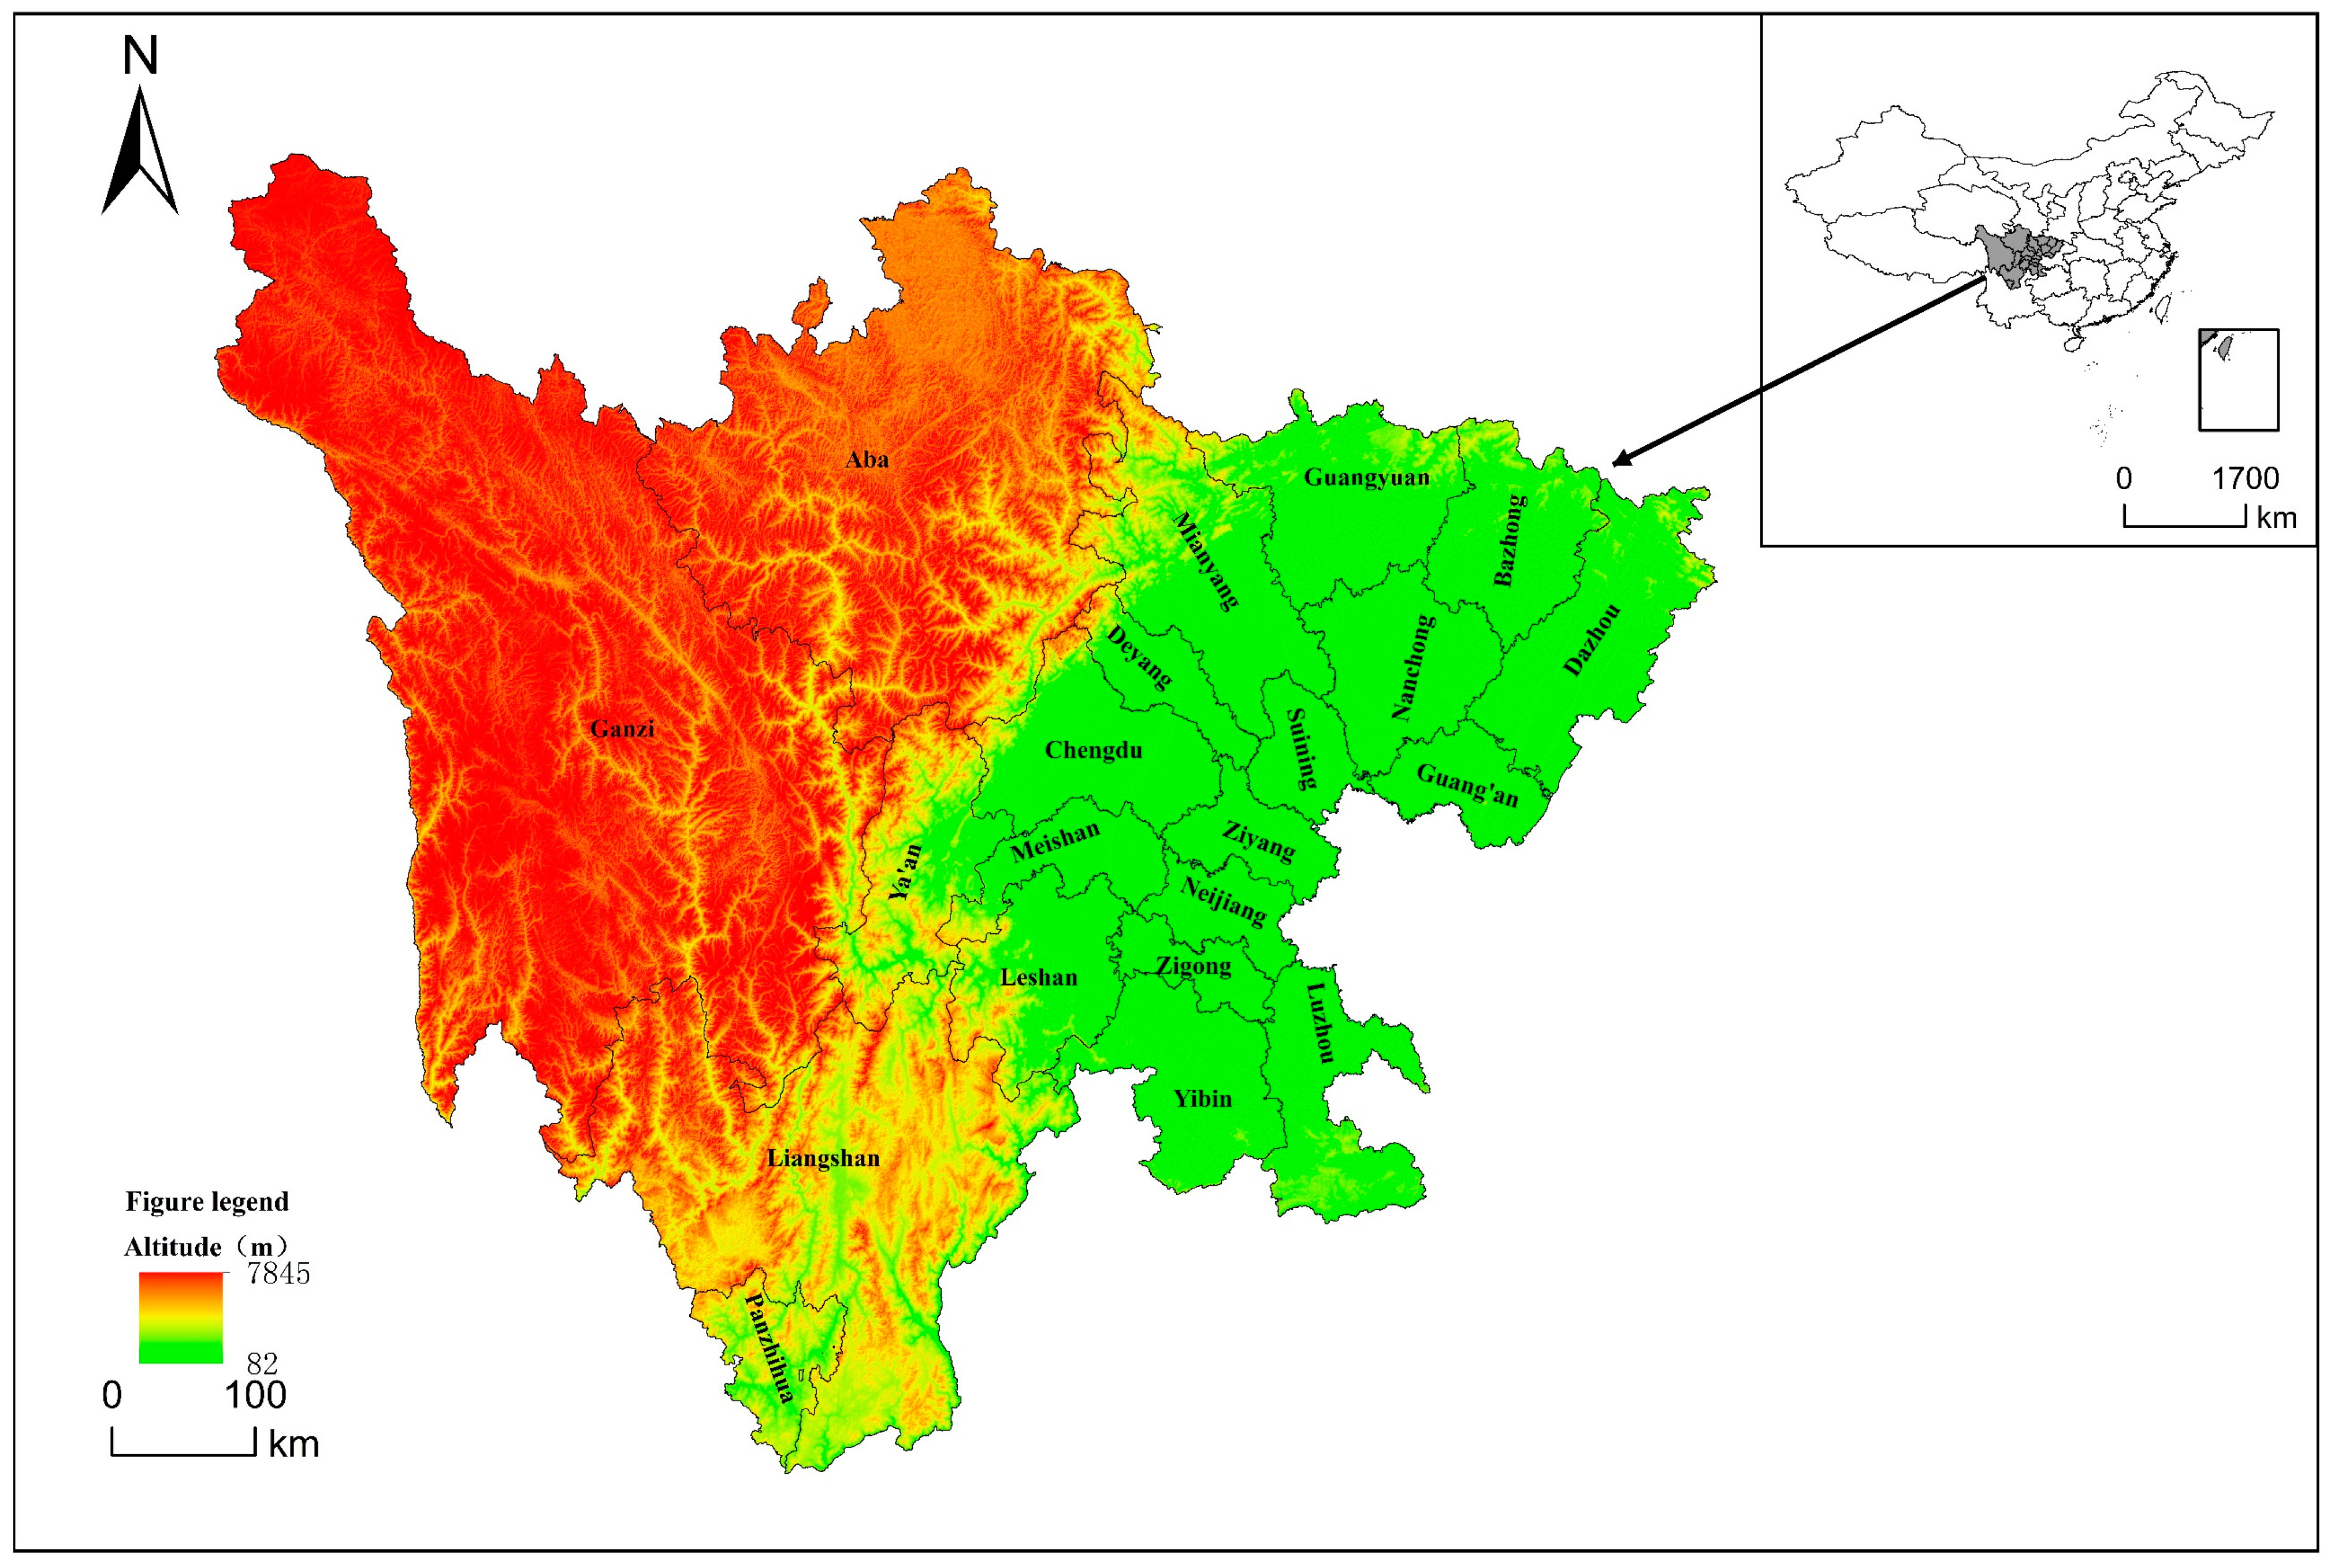
2.2. Overview of the Research Area

Sichuan Province, situated in the inland southwest of China, exemplifies a typical underdeveloped region in the western part of the country, characterized by notable poverty in the Liangshan area to the west and the Qinba mountainous belt to the east. Located in the upper reaches of the Yangtze River, the province is characterized by significant topographical diversity and a complex geomorphology, featuring a west-to-east descending terrain. The western region comprises plateaus and mountains, the central area consists of plains, and the eastern region is characterized by basins and hills. The province is rich in river systems, predominantly the Yangtze River, and is largely covered with purple soils. The forest coverage rate in Sichuan reaches 38.83%, with an average annual temperature of approximately 17 °C, an annual precipitation of 1193 mm, and an average annual sunlight period of 1443.89 h. Spanning an area of 48.61 km2, the province encompasses 18 prefecture-level cities and 3 autonomous prefectures. It exhibits an average population density of 188 people/km2, which is 1.27 times higher than the national average value of 148 people/km2, and an average economic density of 999.87 million renminbi/km2, equivalent to 89.56% of the national average value of 1058.32 million renminbi/km2. Sichuan faces acute and complex challenges in terms of human–land relations. Therefore, selecting it as the subject for a study of land use multifunctionality in underdeveloped southwestern regions is both typical and representative (Figure 2).

2.3. Data Sources

The primary sources of raw data include the China Statistical Yearbooks (https://www.stats.gov.cn, accessed on 15 November 2022) and Statistical Yearbooks of Sichuan Province and its various cities (prefectures) (http://tjj.sc.gov.cn, accessed on 15 November 2022), the National Economic and Social Development Bulletins of Sichuan Province and its cities (prefectures) (https://www.sc.gov.cn, accessed on 15 November 2022), and the Water Resources Bulletins of Sichuan Province and its cities (prefectures) (http://slt.sc.gov.cn, accessed on 10 December 2022), all for the 2000–2020 period. Additional data were sourced from official websites and other relevant databases. The data needed to calculate the influencing factors such as the average elevation and slope were obtained from the Geospatial Data Cloud of the Chinese Academy of Sciences (https://www.gscloud.cn, accessed on 8 February 2023). Slope data were generated using ArcGIS (10.2) and the digital elevation model (DEM).

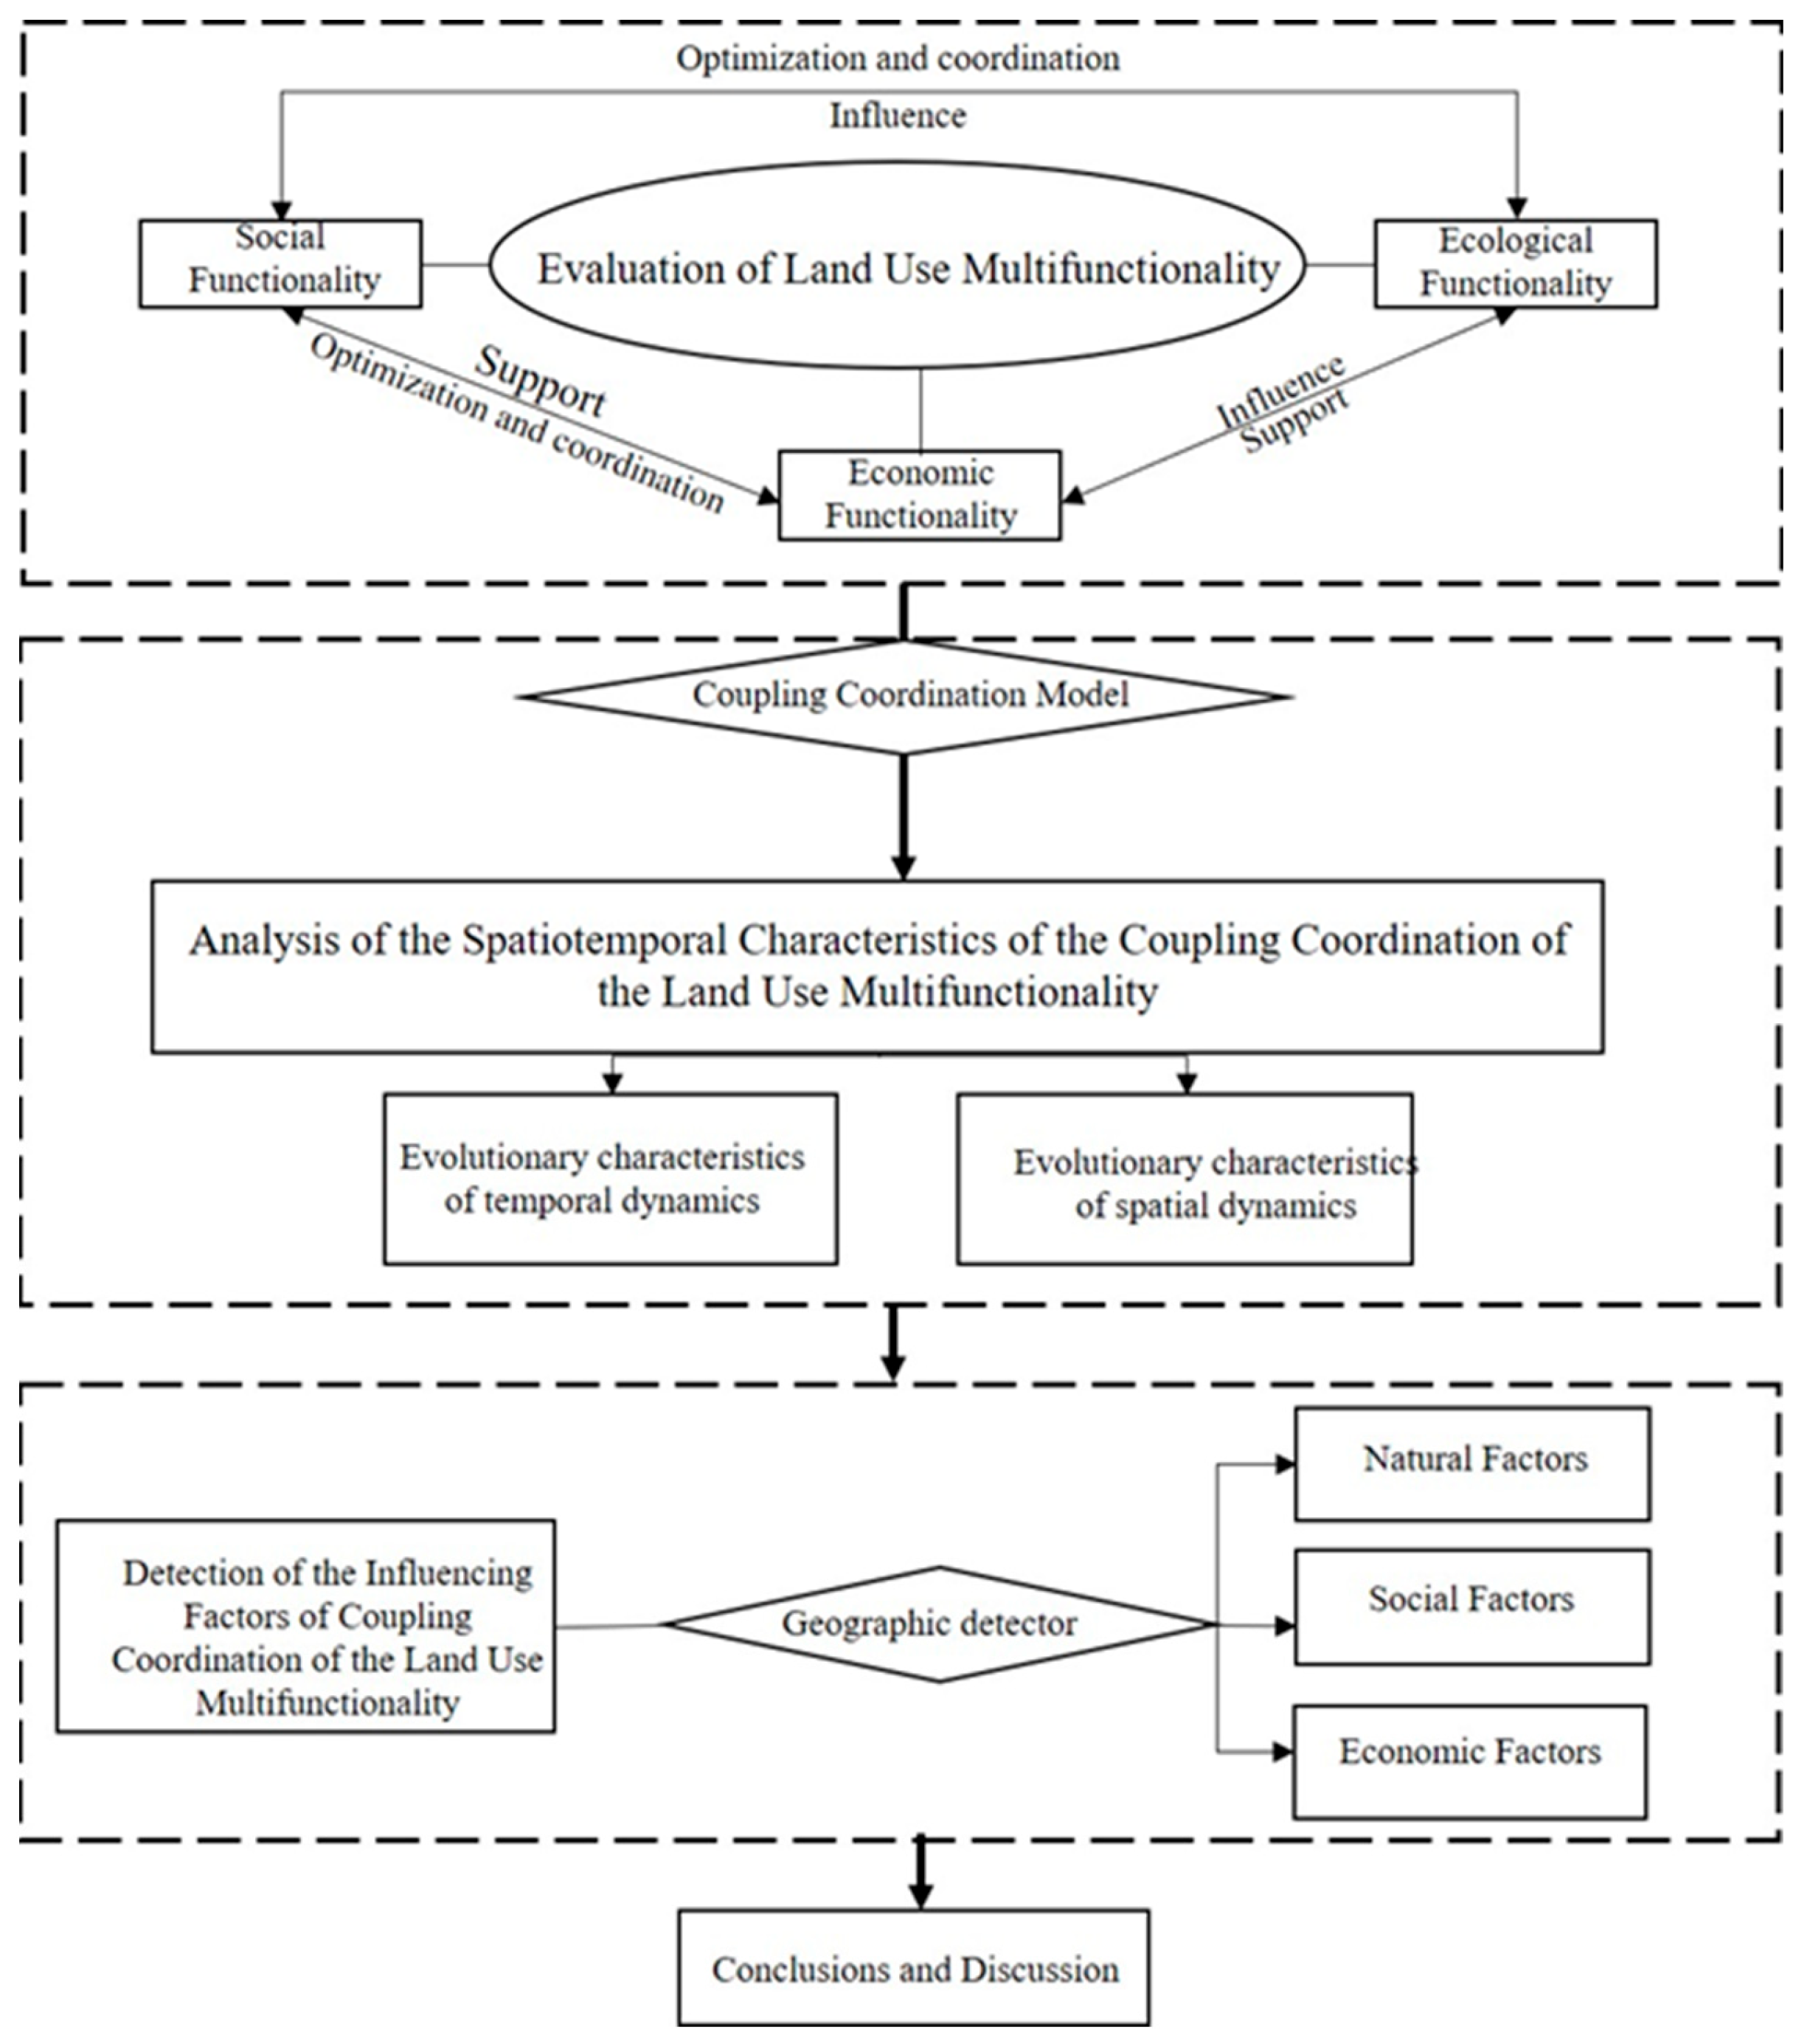
2.4. Research Methodology

2.4.1. Construction of the Index System

Land use multifunctionality evaluation is a complex systemic endeavor, but a unified standard for assessing land use multifunctionality has not yet been established in the academic community. Drawing on existing research [2,5,9,32,33] and considering the unique characteristics of Sichuan Province, in this paper, an evaluation index system for land use multifunctionality was constructed. This system was developed in accordance with the principles of completeness, scientific rigor, systemic coherence, and data availability. It comprises three primary indicators, namely, economic, social, and ecological functions, thereby providing a comprehensive framework for assessing land use multifunctionality (Table 1). The economic function refers to the capacity to provide material resources and infrastructure for human production and living. It primarily includes agricultural production and economic development functions. Per capita grain possession, fruit yield per unit area, and the proportion of the total output value of agriculture, forestry, animal husbandry, and fishery in GDP were selected to represent the agricultural production function. The proportion of secondary and tertiary industries and per capita GDP were used to characterize the economic development function. The social function addresses the human pursuit of a better life and the needs of human production and living, encompassing spatial carrying capacity, social security, employment support, and transportation guarantee functions. Population density was chosen to reflect the spatial carrying capacity; the number of medical beds per 10,000 people, and the average wages of employees, and the urban–rural income balance index represents the social security function. Road network density illustrates the transportation guarantee function, while employment density demonstrates the employment support function. The ecological function refers to the ability to maintain the natural conditions and utilities essential for human survival, mainly including environmental purification and resource supply functions. Sewage treatment rate and fertilizer application per unit area were selected to represent the environmental purification function; the land reclamation rate and average meat production of pigs, cattle, and sheep per unit of land illustrate the resource supply function.

2.4.2. Evaluation Method for Land Use Multifunctionality

Determination of Indicator Weights

The range method was used to standardize the 18 original data indicators [34], and the entropy method [35] was employed to calculate the weights of the indicators.
(1)
Data standardization processing and coordinate translation, where B represents the translation distance, which was 0.01 in this study.
Positive indicator:
χ i j = X i j m i n X j m a x X j m i n { X j } + B
Negative indicator:
χ i j = m a x X j X i j m a x X j m i n { X j } + B
(2)
Calculate the proportion of the value of indicator j in city i, as follows:
Q i j = X i j i = 1 m   X i j
(3)
Calculation of indicator information entropy and its diversity coefficient:
e j = D i = 1 m   Q i j × L N Q i j
F j = 1 e j
In the formula, D = 1/LNn, where n represents the number of samples.
(4)
Calculation of indicator weights:
G i = F j / j = 1 n   F j
In the formula, Xij represents the value of the jth evaluation indicator for city (or state) i; min{Xj} and max{Xj} denote the minimum and maximum values of the jth indicator across all cities (or states). D = 1/LNn, where m is the number of cities (or states) being evaluated, and n is the number of indicators.

Measurement of Land Use Multifunctionality Level

This study employs the MATLAB R2016 software and utilizes the TOPSIS model to evaluate the merits and demerits of land use multifunctionality. The TOPSIS model is a comprehensive evaluation method for multiobjective decision-making [36]. Its core concept involves establishing an ideal model and determining the proximity of the evaluation targets to the optimal and worst solutions. This approach can be used to assess the relative merits of the evaluation targets, allowing for both a horizontal evaluation and longitudinal comparison. This method is also suitable for evaluating small samples and can be applied in a comprehensive evaluation of large systems with multiple objectives [37]. The specific implementation steps are as follows:
(1)
Constructing the decision matrix:
R = X 11 X 12 X 1 n X 21 X 22 X 2 n X m 1 X m 2 X m n
(2)
Determining the positive and negative ideal solutions:
R + = R 1 + , R 2 + , R m + = m a x r 11 , r 12 , , r n 1 , m a x r 21 , r 22 , , r n 2 , , m a x r 1 m , r 2 m , , r n m R = R 1 , R 2 , R m = m a x r 11 , r 12 , , r n 1 , m a x r 21 , r 22 , , r n 2 , , m a x r 1 m , r 2 m , , r n m
where R + and R denote the positive and negative ideal solutions, respectively, and rij is the standardized value of the R matrix.
(3)
Calculating the Euclidean distance: this refers to the distance of the ith (i = 1, 2, 3, …, n) evaluation object from the best and worst solutions:
D i + = j = 1 m   W j R j + R i j 2 D i = j = 1 m   W j R j R i j 2
where D i + and D i denote the distances of the evaluation object from the best and worst solutions, respectively, and   W j is the entropy weight.
(4)
Calculating the relative closeness of each evaluation object to the optimal and suboptimal solutions:
G i = D i D i + + D i
where G i occurs within 0 ≤ G i ≤ 1. A G i value closer to 1 indicates superior land use multifunctionality, while a value closer to 0 indicates inferior multifunctionality.

2.4.3. Analysis of Land Use Multifunctionality Coupling Coordination

The synergy among the various functions of land use can be measured using a coupling coordination model [5,23], which can be expressed as follows:
C = [ α f ( x ) + β g ( y ) + λ h ( z ) ] × f ( x ) × g ( y ) × h ( z ) f ( x ) + g ( y ) + h ( z ) 3 3 3
where C is the coupling degree, and f ( x ) , g ( y ) , and h ( z ) denote the indices of the economic, social, and ecological functions, respectively. The symbols α, β, and λ denote the respective weights. To provide a qualitative classification standard for the coupling coordination development coefficient, in this study, in alignment with existing research [23,38], the coupling coordination coefficient was categorized into three major classes and 10 subcategories (Table 2).

2.4.4. Geographical Detector

The geographical detector, proposed by Wang Jinfeng and Xu Chengdong [39], is a statistical method for detecting and utilizing spatial heterogeneity and revealing potential driving factors. This method is widely used to analyze the spatial pattern evolution and spatial differentiation of geographical elements [38,39]. In light of the above, factor detection and interaction detection in the geographical detector toolkit were primarily utilized in this study. Factor detection was mainly used to analyze the explanatory degree of the various influencing factors of land use multifunctionality.
q = 1 h = 1 L   N h σ h   2 N σ 2 = 1 S S W S S T S S W = h = 1 L   N h σ h 2 , S S T = N σ 2
where q is the degree of explanation for the dependent variable, with a range of [0, 1], L denotes the stratification of either the independent or dependent variable, and   N h and N denote the number of units in stratum h and the total number of units in the entire region, respectively. Furthermore, σ h 2 and σ 2 denote the variances in the Y values in stratum h and the entire region, respectively, and S S W and S S T denote the sums of squares of the within-stratum variance and the total variance in the entire region, respectively.
Interaction detection aims to identify the interaction effects of the different influencing factors, which involves detecting whether the interaction between X1 and X2 can enhance or diminish the explanatory power of the dependent variable. There are a total of five types of factor interactions: single-factor nonlinear attenuation, nonlinear attenuation, dual-factor enhancement, mutual independence, and nonlinear enhancement.

2.4.5. Construction of Impact Factor Indices

To investigate the factors influencing the spatial differentiation of land use multifunctionality coupling coordination in Sichuan Province and to further enhance the land use multifunctionality level, in this study, a geographical detector was utilized. An index system of the influencing factors for the spatial differentiation of land use multifunctionality coupling coordination was constructed, encompassing natural, social, and economic dimensions (Table 3).

3. Result Analysis

3.1. Evaluation of Land Use Multifunctionality

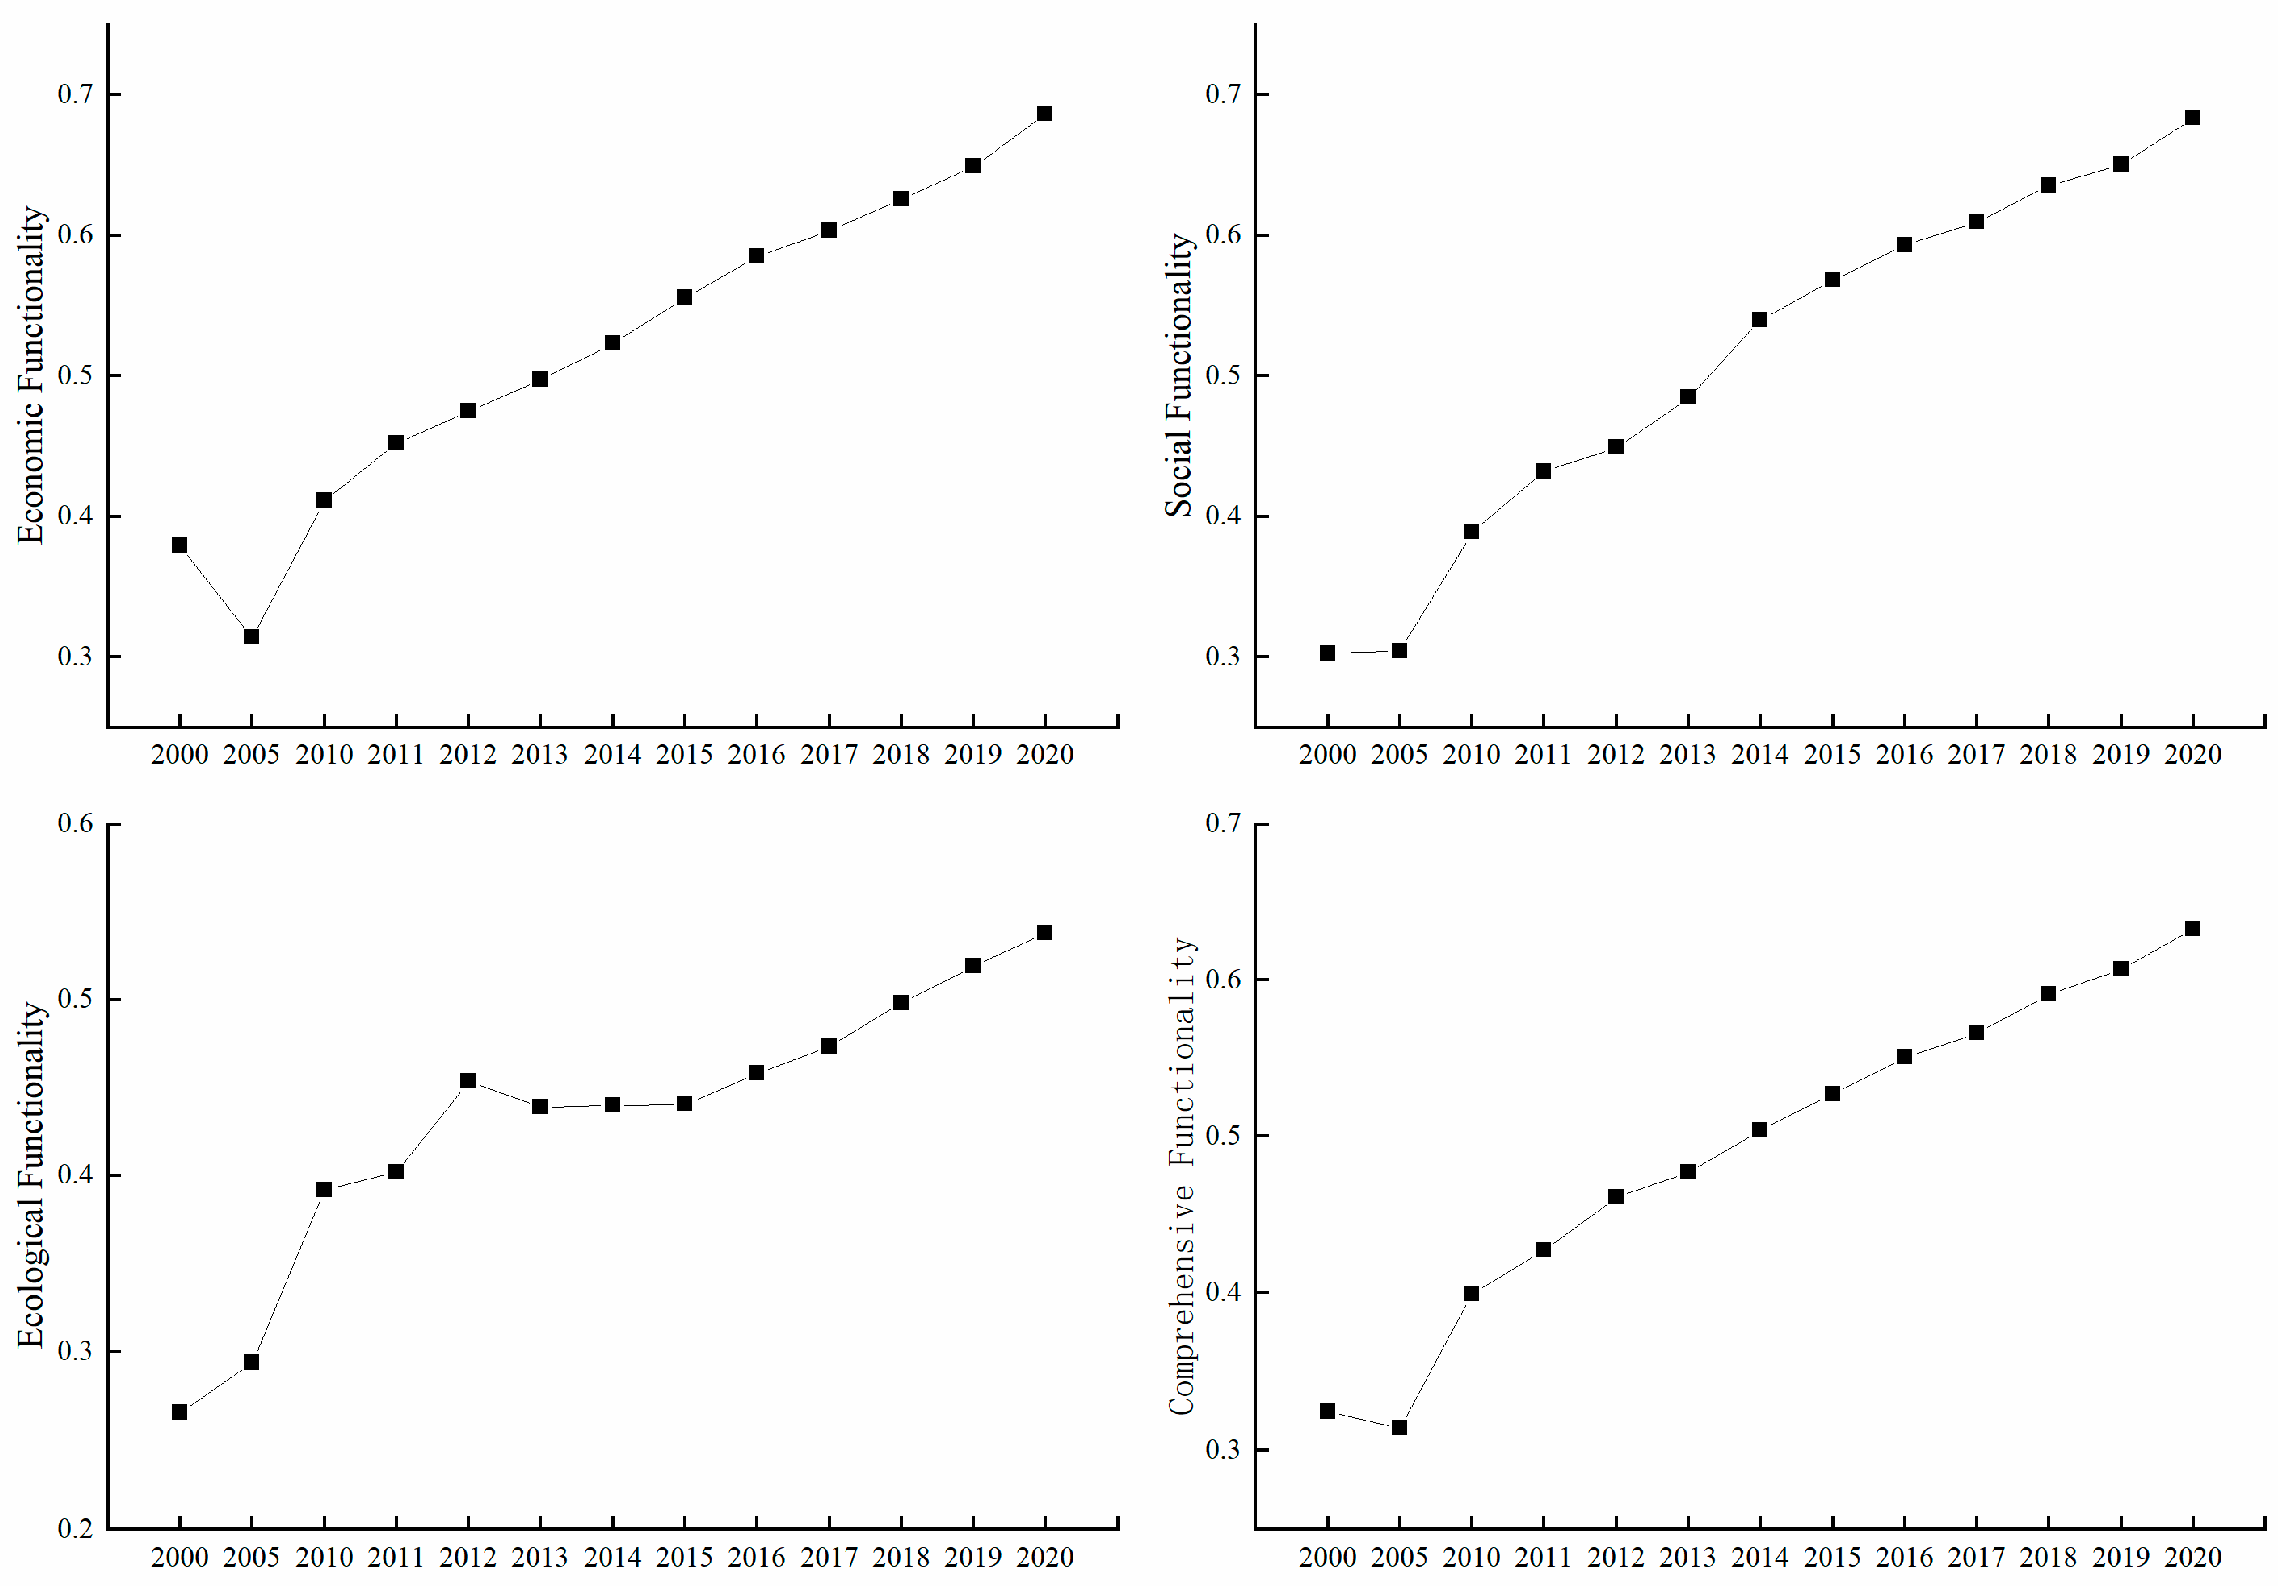
3.1.1. Evaluation of the Land Use Multifunctionality in Sichuan Province

From 2000 to 2020, the economic functionality of the land use in the entire province continuously increased. The index increased from 0.3792 in 2000 to 0.6865 in 2020, with an average annual increase of 3.01% (Figure 3). The change process can be divided into two periods: an initial decline followed by a consistent increase. Specifically, the 2000–2005 period marked the initial decline stage, where the index decreased from 0.3792 in 2000 to 0.3138 in 2005, with an average annual decrease of 3.71%. The 2005–2020 period was characterized by a continuous increase, with the index increasing from 0.3138 in 2005 to 0.6865 in 2020, at an average annual growth rate of 5.36%. During the 10th Five-Year Plan of China, the province underwent adjustments in the agricultural industrial structure, with a continuous increase in the urbanization rate and a relative decrease in the share of the total grain output and the output value of agriculture, forestry, animal husbandry, and fishery in the GDP. After 2005, the province continued to promote the transformation of its economic development mode, adjusted its economic structure, and enhanced the economic efficiency, leading to rapid increases in the added value of the secondary and tertiary industries, per capita GDP, and economic agglomeration, thereby continuously enhancing the economic functionality.
The social functionality of the land use in Sichuan Province continued to improve, with the index increasing from 0.3027 in 2000 to 0.6833 in 2020, with an average annual increase of 3.95% (Figure 3). The process of change can be divided into two stages: slow growth and rapid growth. The 2000–2010 period represented the slow growth stage, with the index increasing from 0.3027 to 0.3888. The 2010–2020 period constituted the rapid growth stage, with the index increasing from 0.3888 to 0.6833. Since the implementation of the national 10th Five-Year Plan and the formal initiation of the Western Development Strategy, along with the implementation of the poverty alleviation campaign and the subsequent introduction of the Rural Revitalization Strategy, the provincial infrastructure continued to improve, the social security system was increasingly refined, medical and health services steadily advanced, and wages consistently increased, driving a continuous increase in the social functionality.
The ecological functionality of the land use in Sichuan Province exhibited a cyclically fluctuating upward trend, with the index increasing from 0.2656 in 2000 to 0.5378 in 2020, an average annual increase of 3.42% (Figure 3). The change process can be divided into three stages: increase, decline, and increase again. The 2000–2012 period was characterized by a rapid increase, with the index rapidly increasing from 0.2656 to 0.4534. A slight decline occurred between 2012 and 2013, during which the index decreased from 0.4534 to 0.4390. The 2013–2020 period exhibited slow growth, with the index increasing from 0.4390 to 0.5378. The ecological environment is a crucial marker of social and civilizational progress, and the advancement of green and ecological development is a key aspiration when aiming to improve the quality of life for the population. Following the proposal in 2010 to establish a long-term green development mechanism, the 12th and 13th Five-Year Plans introduced corresponding measures for ecological and environmental protection, thereby facilitating positive development in the ecological functionality.
Overall, from 2000 to 2020, the comprehensive functionality of the land use in Sichuan Province demonstrated an upward trend, with the index increasing from 0.3245 in 2000 to 0.6324 in 2020, marking an average annual increase of 3.39% (Figure 3). This growth was primarily attributable to the rapid development of the economic functionality of land use, the continuous refinement of the social functionality, and the sustained improvement in the ecological functionality in the province. From a current perspective, the ranking of the various functionalities is economic > social > ecological, indicating clear differences. In particular, the ecological functionality of land use still exhibits considerable room for enhancement, which also suggests that the coordinated development among the various functionalities requires further strengthening.

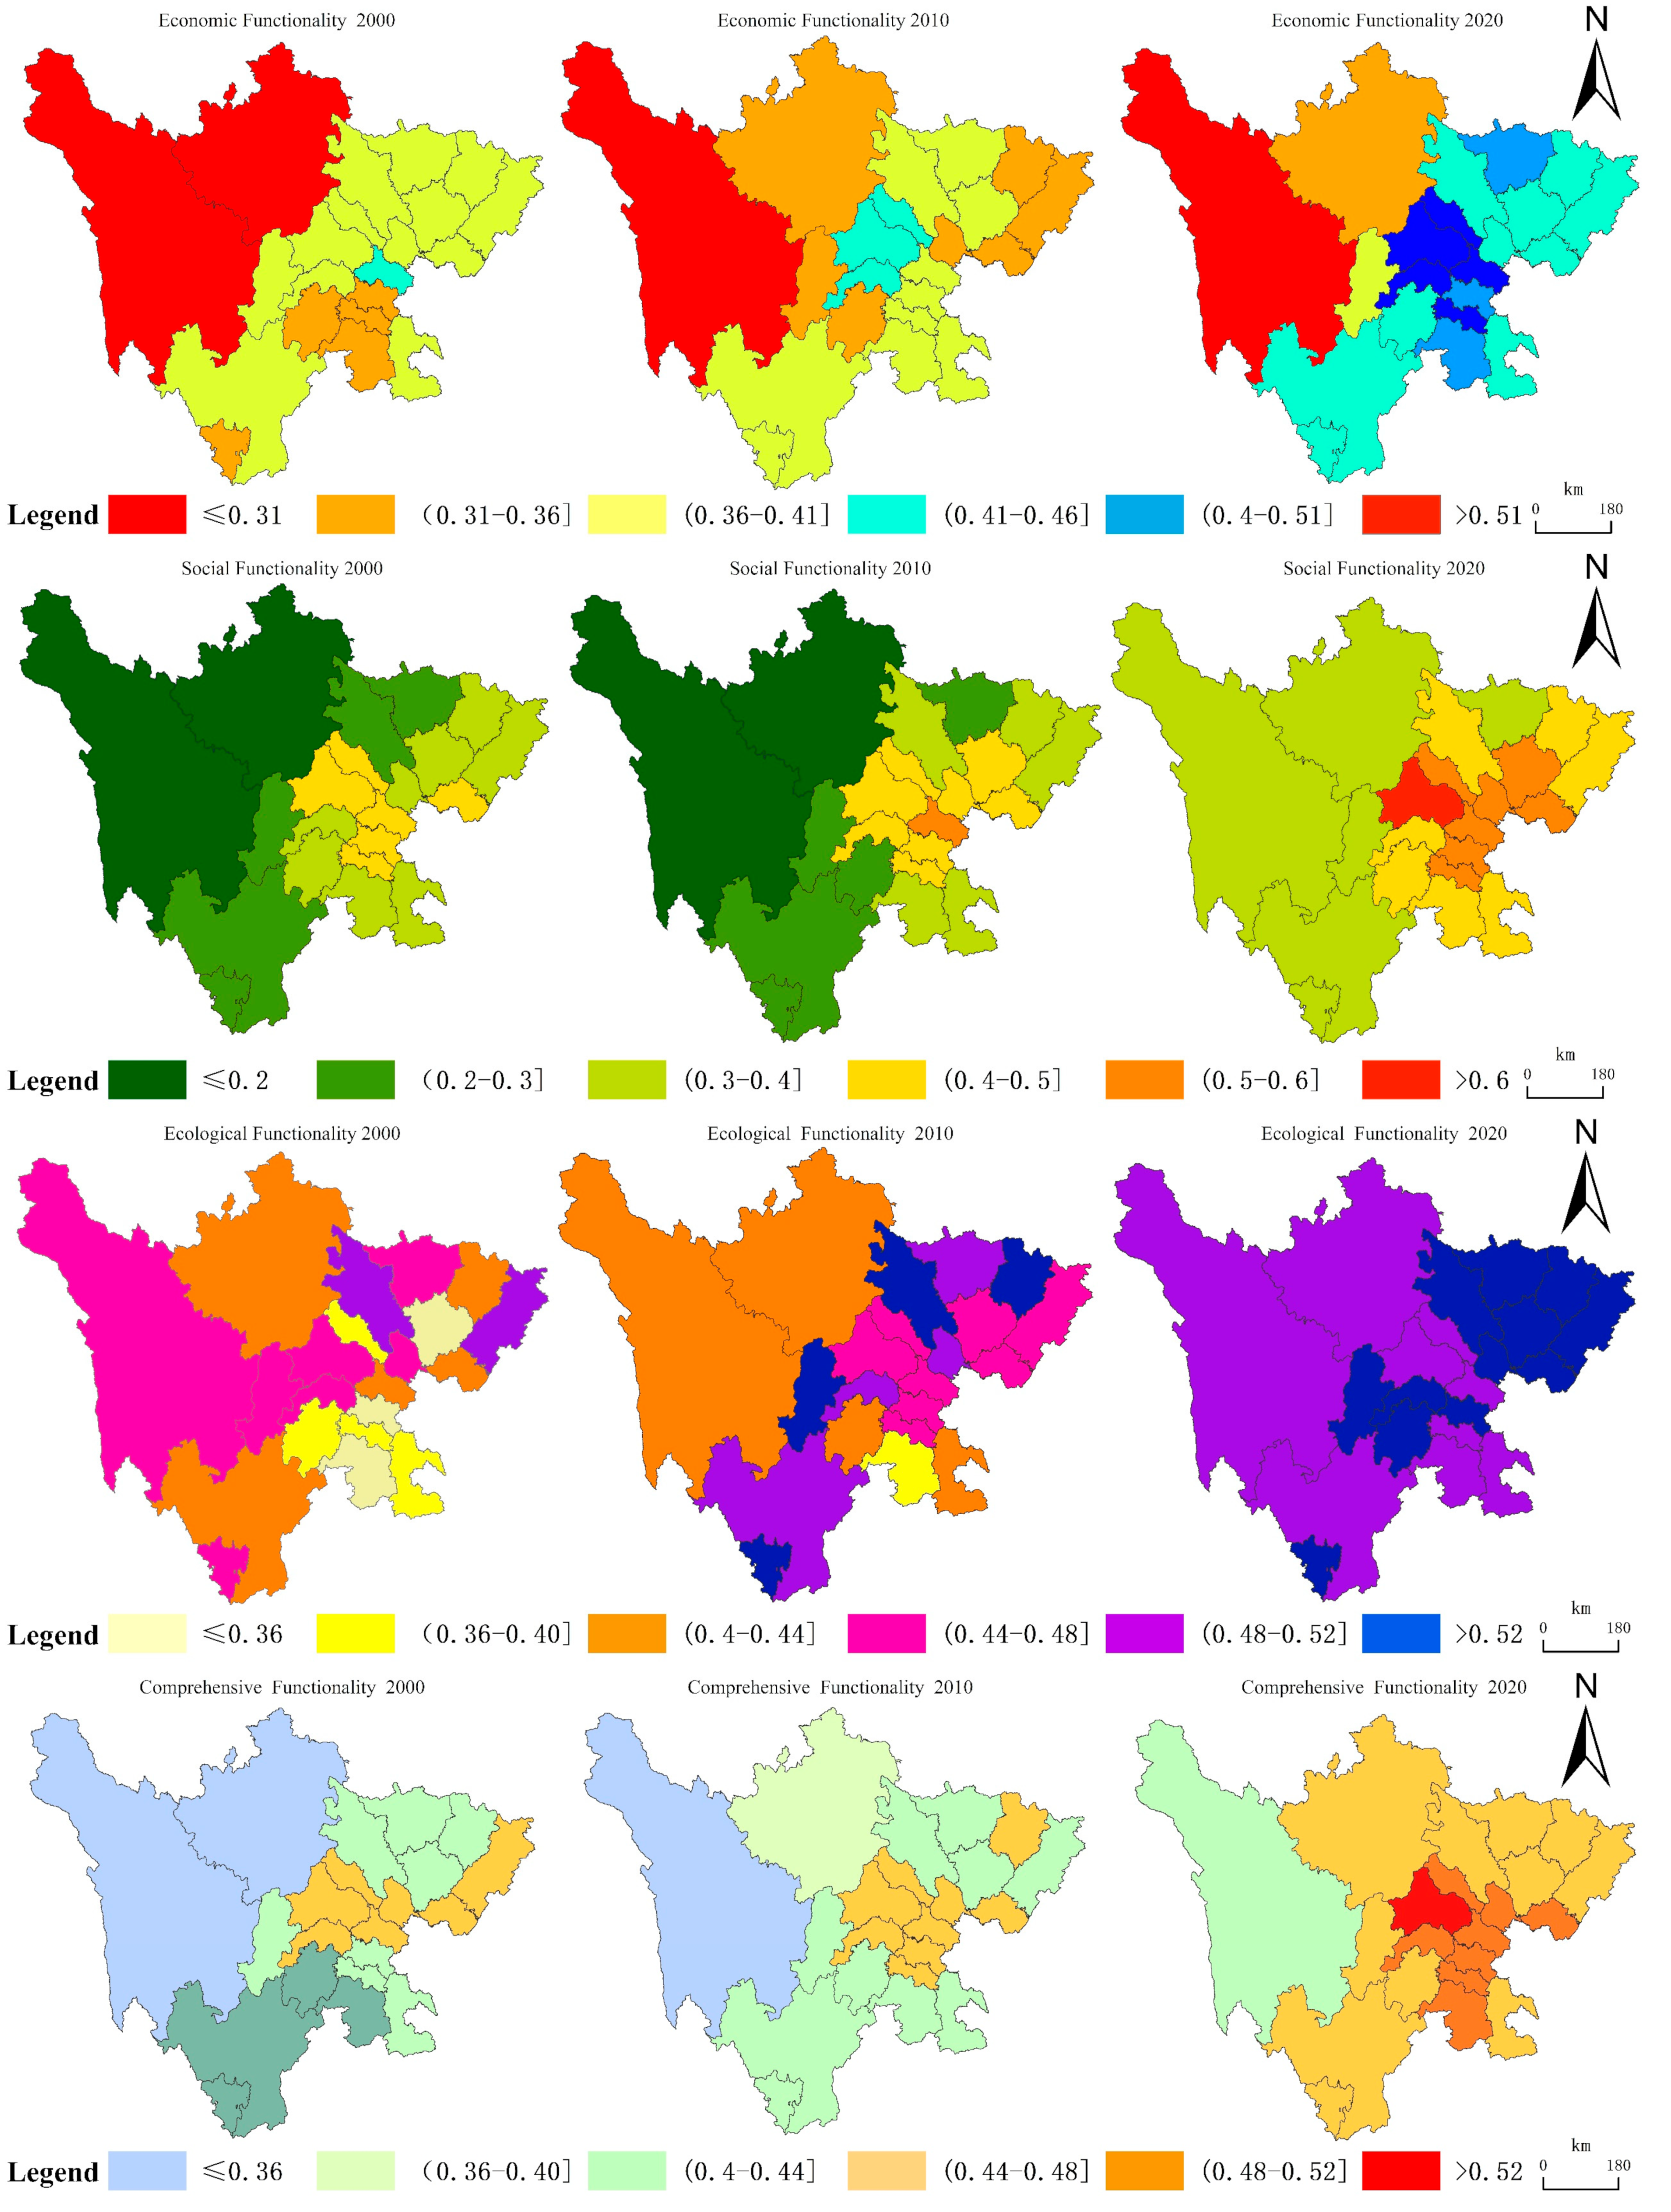
3.1.2. Evaluation of the Land Use Multifunctionality in the Various Cities (Prefectures)

During the 2000–2020 period, the land use functionality level varied across different cities (prefectures). In 2020, high-value economic functionality areas were found in Chengdu, Ziyang, and Meishan, with indices of 0.5529, 0.5428, and 0.5316, respectively. Chengdu, as the core city of the Chengdu–Chongqing economic circle and an important central city in the western region, has experienced rapid economic development. Additionally, the region’s flat terrain and fertile soil, coupled with the polarization–trickle-down effect observed in the capital city, are particularly important. Ziyang and Meishan, both parts of the Chengdu Plain economic zone, are significantly influenced by the capital city’s trickle-down effect, thereby positioning the economic functionality of land use at the forefront in the province. Low-value areas were identified in the Ganzi Tibetan Autonomous Prefecture and Aba Tibetan and Qiang Autonomous Prefecture, with indices of 0.3093 and 0.3299, respectively. Despite the abundant tourism resources, these regions exhibit a low gross regional product, remote geographical locations, a harsh natural environments, and an underdeveloped transportation infrastructure, all of which hinder economic development and result in the lagging economic functionality of land use (Figure 4).
In terms of the social functionality of land use, Chengdu city is far ahead of other cities (prefectures), with an index reaching 0.6719. As the provincial capital, Chengdu is the political, economic, and cultural center of Sichuan Province. Its high spatial carrying capacity, favorable employment and transportation conditions, and continuously improving social security system have significantly driven the rapid development of its land use social functionality. The social functionality of land use in Ganzi and Liangshan ranks at the bottom across the province. This is mainly because both areas are highly impoverished, characterized by a prevalence of mountains and scarcity of plains, which enhances the conflict between human and land resources. Additionally, the low economic level and difficulties implementing social security and other related infrastructure have resulted in a low social functionality of the land use in these regions (Figure 4).
High-value ecological functionality areas are located in Bazhong and Ya’an, with indices of 0.5630 and 0.5538, respectively. Bazhong serves as a crucial ecological barrier in the upper reaches of the Yangtze River and the Qinling Mountains, leading in the province with high forest coverage and wastewater treatment rates, among other ecological maintenance and environmental purification indicators. Ya’an, referred to as the Lung of Tianfu, benefits from its unique natural resources. Coupled with the government’s continuous efforts in strengthening ecological and environmental management, these factors have positioned Bazhong and Ya’an as the top two provinces in terms of the ecological functionality of land use. A low-value area was identified in Liangshan Prefecture, with an index of only 0.4866. This is mainly attributed to the rapid population growth and severe soil erosion, exacerbating ecological degradation and resulting in the relatively low ecological functionality of land use in this region (Figure 4).
Overall, the economic, social, and ecological functionalities are continuously improving across the various cities (prefectures). The absolute differences in the comprehensive land use functionality among these cities (prefectures) are declining, with the range decreasing from 0.2707 in 2000 to 0.1887 in 2020. However, the comprehensive functionality indices of the land use in these cities (prefectures) remain relatively low, indicating that there is substantial room for further improvement (Figure 4).

3.2. Analysis of the Spatiotemporal Characteristics of the Coupling Coordination of the Land Use Multifunctionality

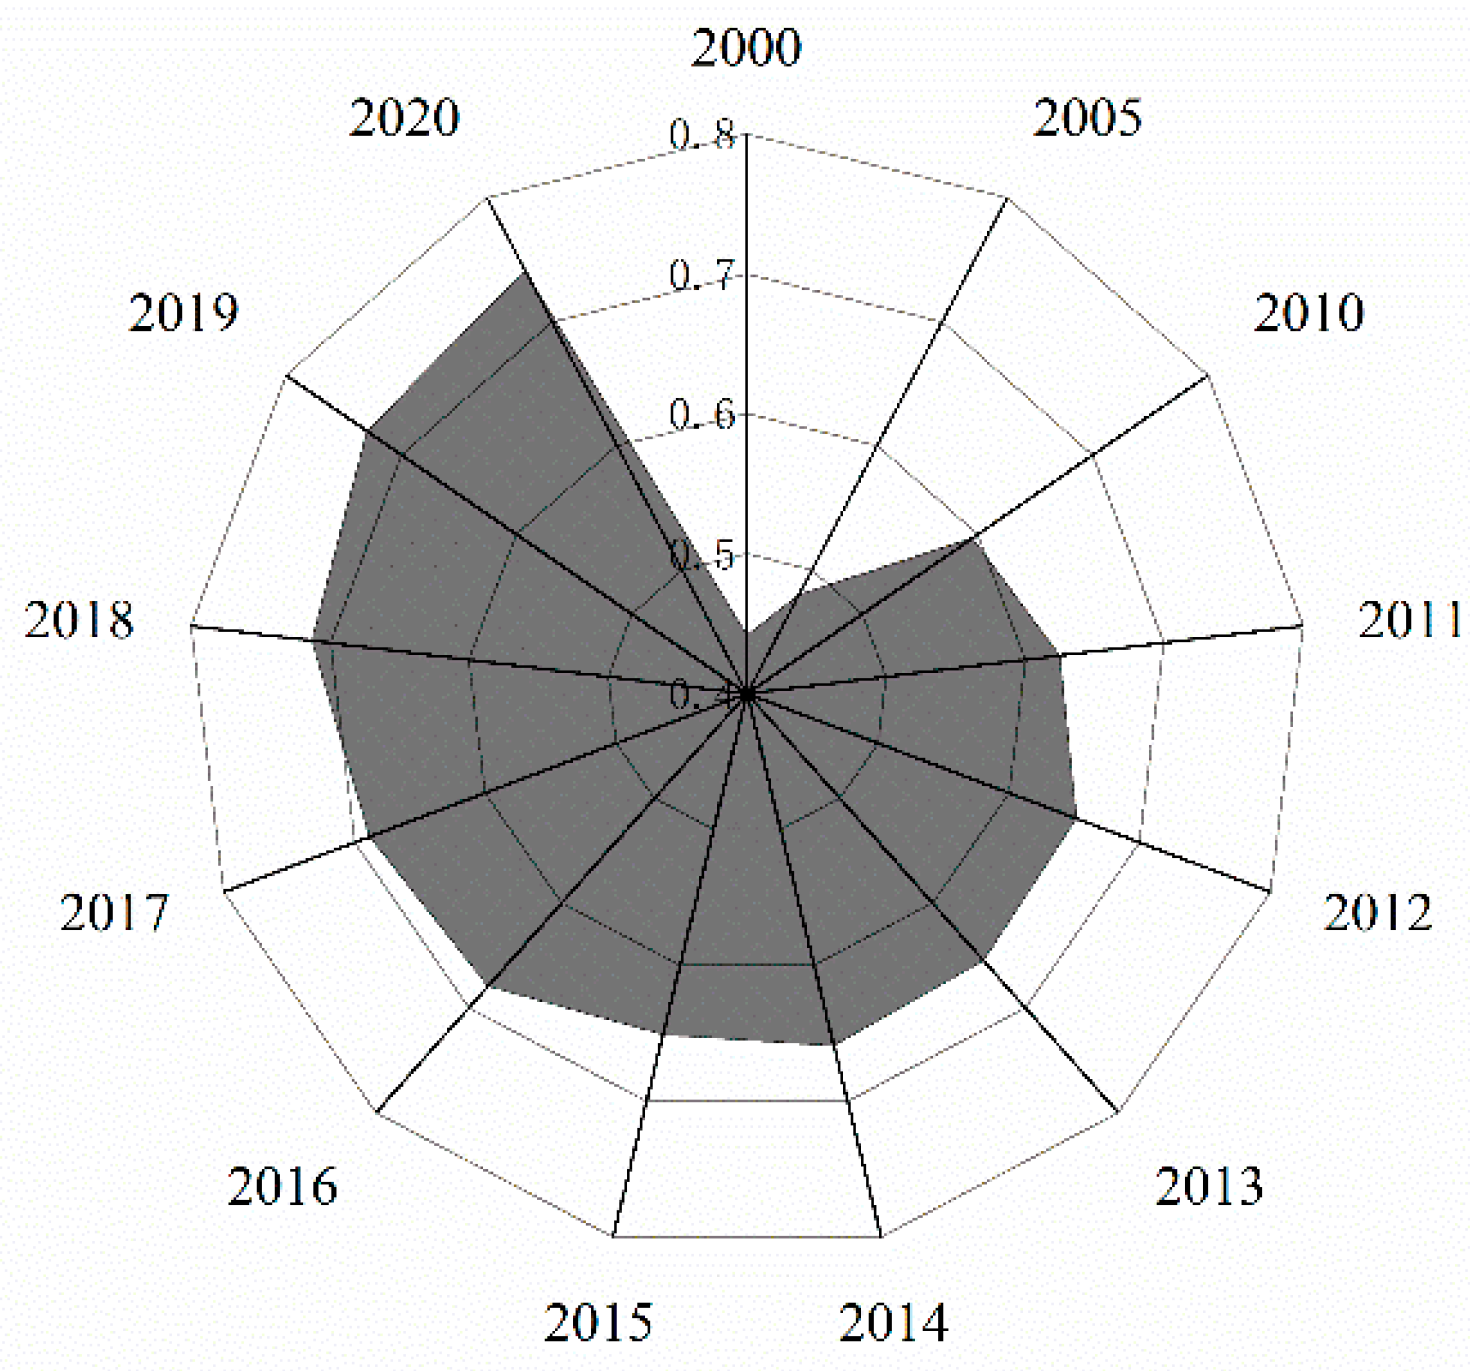
3.2.1. Temporal Evolution Analysis of the Coupling Coordination Degree of the Land Use Multifunctionality

From 2000 to 2020, the coupling coordination degree of the land use multifunctionality in Sichuan Province was continuously improved, with the coordination coefficient increasing from 0.4415 in 2000 to 0.7416 in 2020, marking an average annual increase of 2.63%. The state of coupling coordination evolved from the brink of disarray to a medium level of coordination, transitioning from a nonideal type to an ideal type of coupling coordination state. The process encompassed three stages, namely, nonrational, transitional, and ideal stages, experiencing an evolutionary process from the brink of disarray to barely coordinated, then to primary coordination, and finally to medium coordination. The year 2010 represented a pivotal point, with the land use multifunctionality at a barely coordinated state. Prior to 2010, only the index of the economic functionality of land use was above 0.4, while the indices of the social and ecological functionalities were below 0.4, indicating a lower level of development and hindering the enhancement in the overall effectiveness of land use. After 2010, the comprehensive evaluation value was improved, propelling the land use multifunctionality to a state of primary coordinated development. The coupling of the economic, social, and ecological functionalities of land use was favorable, with the overall functionality trending toward coordinated development (Figure 5).

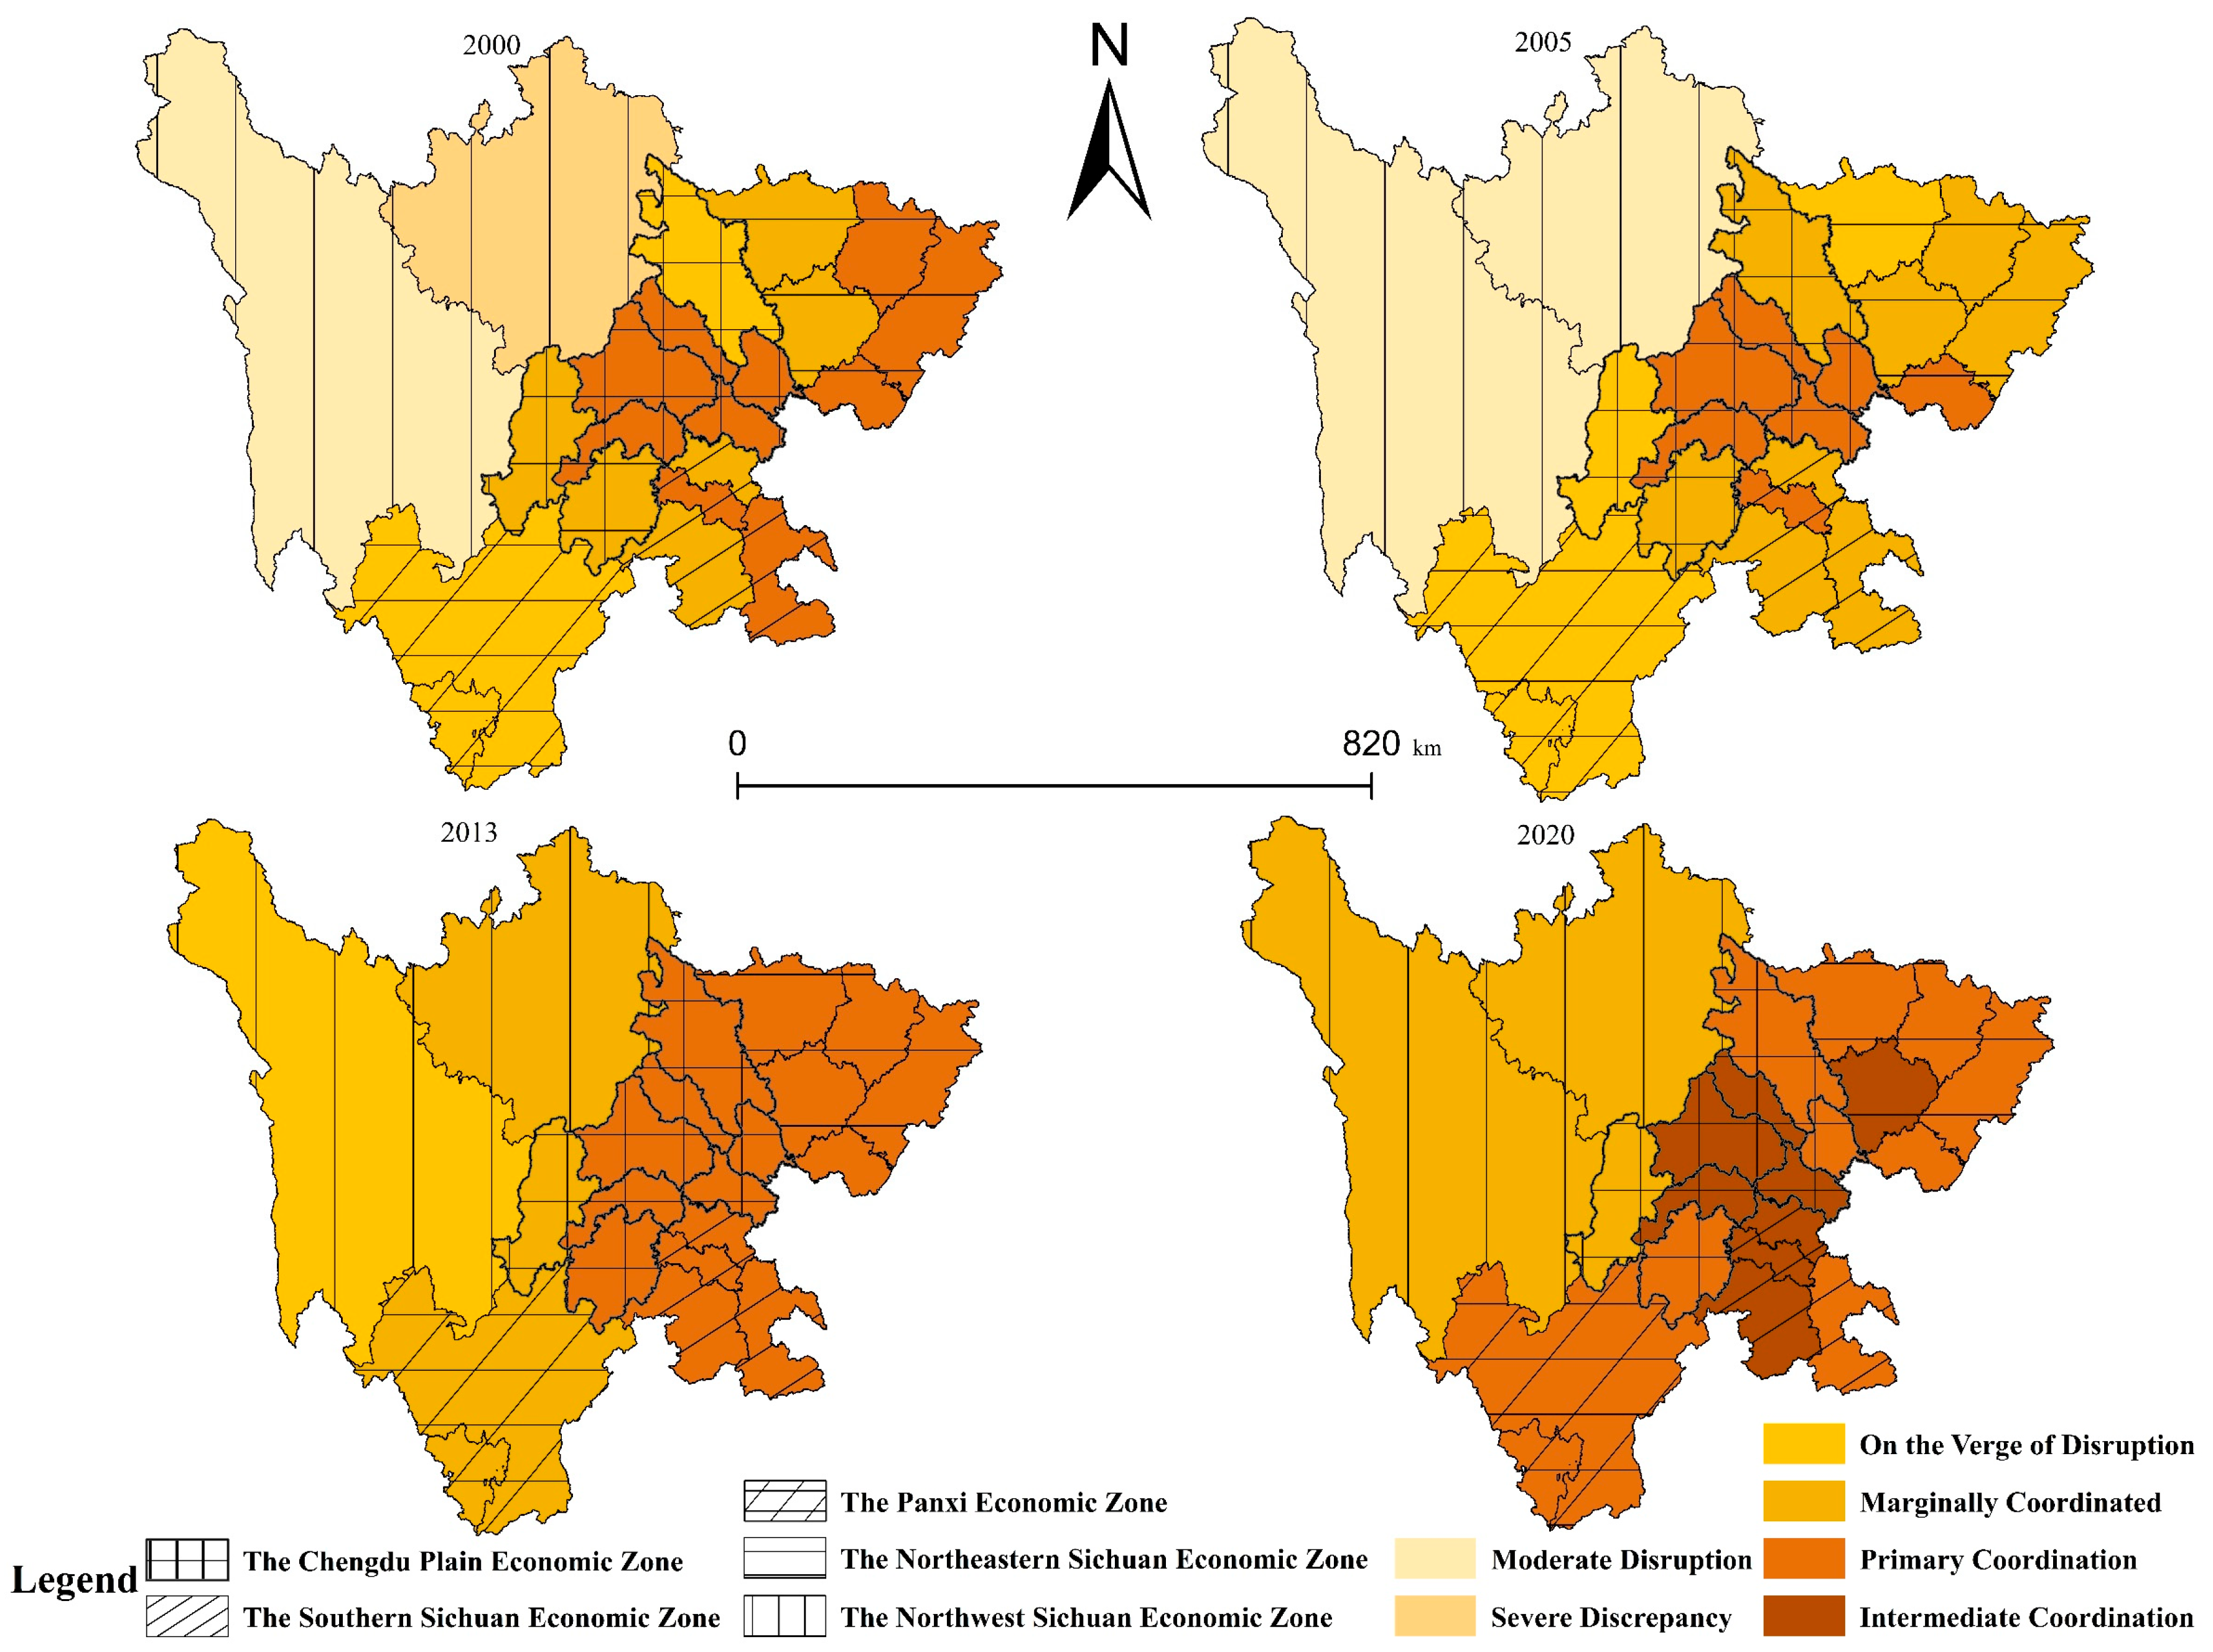
3.2.2. Spatial Evolution Analysis of the Land Use Multifunctionality Coupling Coordination Degree

Examining the changes in the coupling coordination status of the land use multifunctionality in the various cities (prefectures), it could be observed that the coupling coordination status was synchronously improved across these regions, with all indices increasing, although the extent of improvement varied, ranging from 0.05 to 0.33. Cities with an increase in the coupling coordination index between 0.05 and 0.10 include Luzhou, Deyang, Suining, Leshan, Meishan, Guang’an, Dazhou, Ya’an, Bazhong, and Ziyang, accounting for 47.62% of the province. This mainly occurs because these cities initially exhibited a relatively favorable coordinated development among the economic, social, and ecological functions, hence the smaller magnitude of the increase in their coupling coordination coefficients. Cities (prefectures) with an index increase between 0.10 and 0.20 include Chengdu, Zigong, Mianyang, Guangyuan, Neijiang, Nanchong, Yibin, and Liangshan, accounting for 38.10% of the province. In these areas, the economic functionality, represented by the economic density and per capita GDP, showed significant growth. In terms of the social security functionality, the average wage of employees increased from 7600 to 70,471 renminbi. Environmental purification indicators, such as the wastewater treatment rate and fertilizer usage, also showed positive trends, effectively enhancing the degree of coupling coordination of land use multifunctionality. Cities (prefectures) with an index increase between 0.20 and 0.33 include Panzhihua, Aba, and Ganzi, accounting for 14.29% of the province. In 2000, these areas were categorized as exhibiting a disordered state of coupling coordination. However, the implementation of poverty alleviation campaigns and rural revitalization strategies, continuous improvements in infrastructure, economic development, social security system improvements, and ecological environment protection in western Sichuan significantly enhanced the coupling coordination of the comprehensive land use functionality. The range of the coupling coordination coefficients of land use multifunctionality among the various cities (prefectures) continuously declined, decreasing from 0.4140 in 2000 to 0.1672 in 2020, with an average annual decline of 4.43%. This is primarily due to the synergistic advancement and steady improvements in the economic, social, and ecological functionalities in each city (prefecture), facilitating the evolution of land use multifunctionality coupling coordination across the province (Table 4).

3.2.3. Spatial Pattern of the Land Use Multifunctionality Coupling Coordination Degree

During the 2000–2020 period, the spatial differentiation of land use multifunctionality coupling coordination was notable across the various cities (prefectures). In 2000, the spatial pattern exhibited a structure comprising one core, two zones, and multiple points. The core was the Chengdu Plain economic zone, where Chengdu, Deyang, Meishan, Suining, and Ziyang all showed a state of primary coordination. The two zones are the Southern Sichuan economic zone and the northeastern Sichuan economic zone, with Zigong, Luzhou, Dazhou, Guang’an, and Bazhong in these zones also showing a state of primary coordination. The multiple points were distributed across 11 cities (prefectures) throughout the province, accounting for 52.38% of the total province, where the coupling coordination coefficients of the land use multifunctionality were relatively low. By 2020, all cities (prefectures) had reached coordination, forming a center–periphery spatial distribution structure that was primarily centered on the Chengdu Plain economic zone and decreased toward the periphery. In 2020, there were eight cities in a state of medium coordination, accounting for 38.10% of the province, exhibiting a 521 distribution pattern, with five cities in the Chengdu Plain economic zone, two cities in the Southern Sichuan economic zone, and one city in the northeastern Sichuan economic zone. There were 10 cities in a state of primary coordination, accounting for 47.62% of the province, mainly distributed in the Panxi economic zone and the northeastern Sichuan economic zone. Three cities (prefectures) showed a barely coordinated state, accounting for 14.29% of the province, namely, Aba, Ganzi, and Ya’an (Figure 6).

3.3. Detection of the Influencing Factors of Coupling Coordination of the Land Use Multifunctionality

3.3.1. Analysis of Single-Factor Detection Results

Single-factor detection: Each factor exhibited a significant driving effect on the spatial differentiation of land use multifunctionality coupling coordination (all p values are less than 0.05) (Table 5). The explanatory power of the various influencing factors for the spatial differentiation of the coupling coordination degree of land use multifunctionality showed descending order in the average slope, employed population density, economic agglomeration, per-unit area investment in fixed assets, road network density, per-capita local fiscal revenue, effective irrigation area, average elevation, per-capita GDP, number of medical beds per 10,000 people, and average wages of employees (Table 5). Among these, the average slope and employed population density attained the highest explanatory power, with values of 0.9513 and 0.9423, respectively, significantly impacting the spatial differentiation in the coupling coordination of land use multifunctionality.

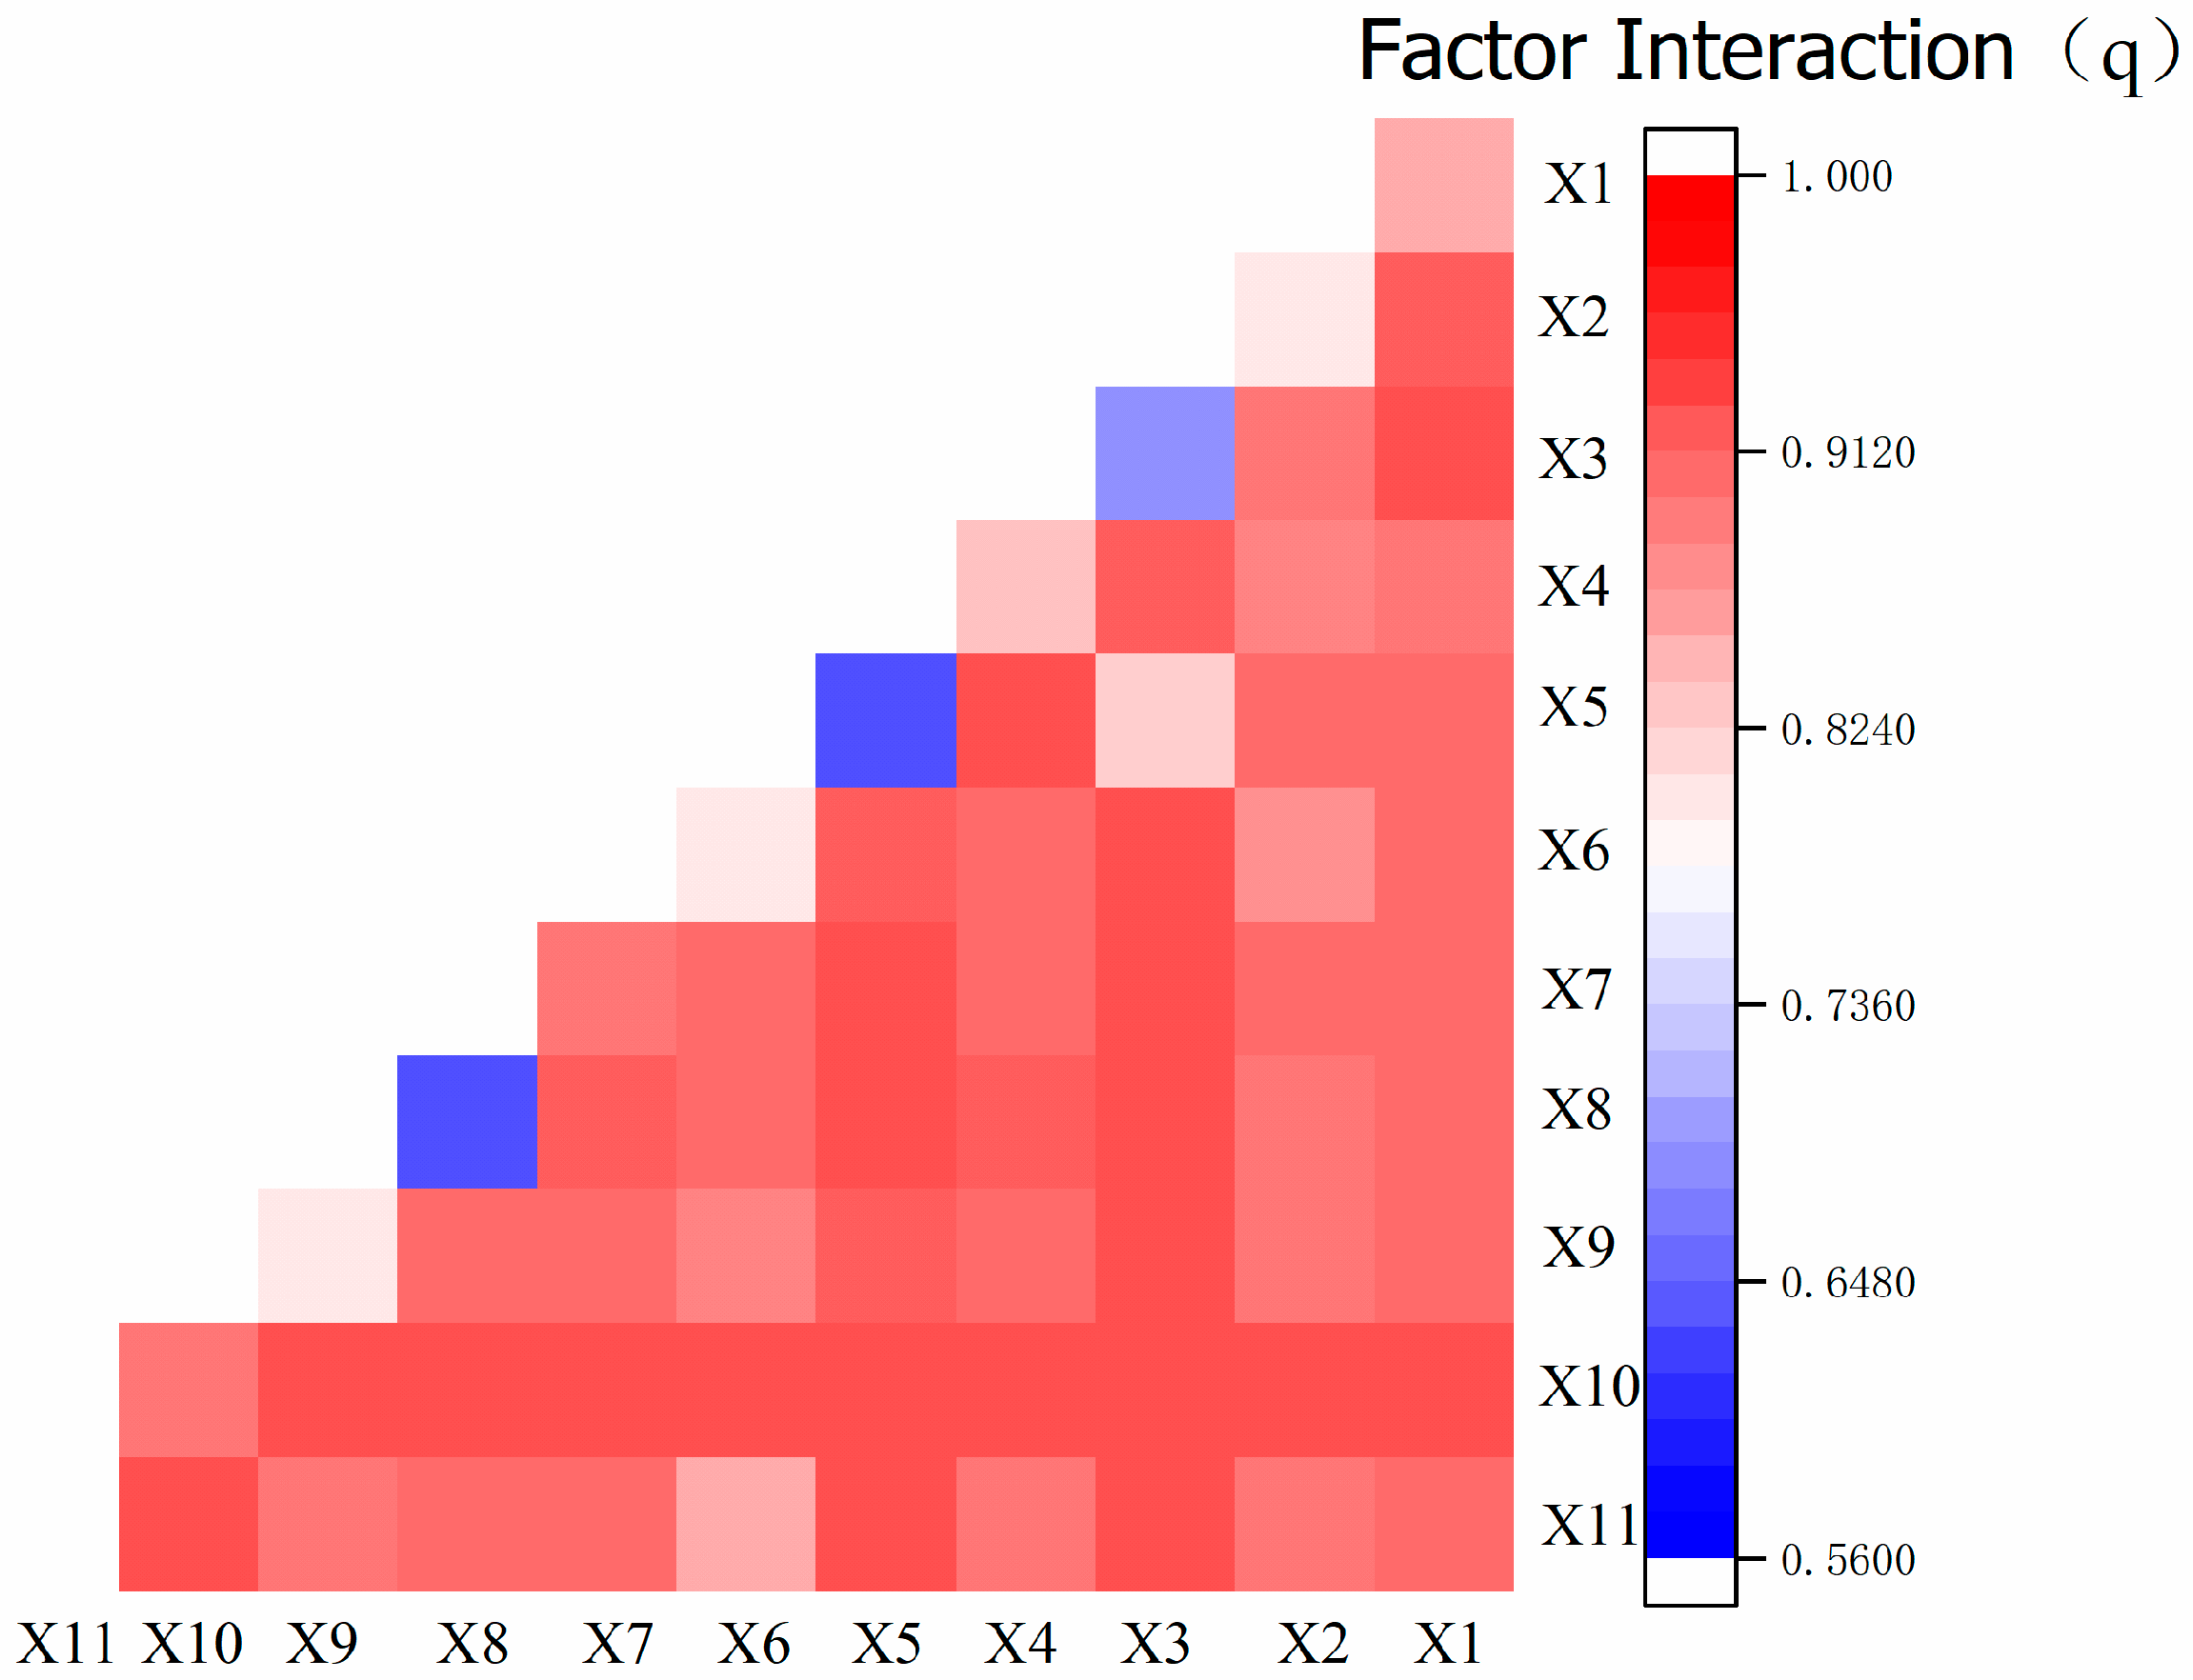
3.3.2. Analysis of Factor Interaction Detection Results

Factor interaction detection: Based on 11 single-factor detections, the analysis of the interactions between the factors revealed that the explanatory power after the interaction between the different factors mainly demonstrated either double-factor enhancement or nonlinear enhancement. Double-factor enhancement was the most common, with no observed instances of mutual independence or weakening. This indicates that the interaction between any two factors exerted a greater impact on the spatial differentiation of the coupling coordination of land use multifunctionality than a single factor (Figure 7). This suggests that the spatial differentiation in the coupling coordination of land use multifunctionality is the result of the combined effect of multiple influencing factors.

4. Discussion

4.1. The Interpretation of the Findings

In recent years, significant progress has been made in the field of land use multifunctionality research [40,41,42]. Notably, there has been a significant increase in studies focusing on the driving factors of internal functional coordination within land use multifunctionality [43,44,45]. This trend correlates with the intensity of China’s policies over the past decade, aimed at poverty alleviation, rural revitalization, and sustainable rural development. With the rapid socioeconomic development, the internal differences in land use functions are becoming increasingly evident, with the hierarchy being economic functions > social functions > ecological functions [46]. This is primarily due to the continuous implementation of economic development policies across the province, leading to a consistent elevation in economic levels, with the average economic density reaching 999.87 million CNY/km2, progressively narrowing the gap with the national average of 1058.32 million CNY/km2. The unique regional location and typical basin topography of Sichuan Province have resulted in a diverse range of geomorphological types. Generally, the conditions in the central basin differ from those in the surrounding mountainous areas, leading to a marked spatial differentiation in the coupling and coordination of land use multifunctionality, characterized by higher levels in the central region compared to the periphery [47,48]. Owing to its location in Western China and significant geomorphological features, the primary factor influencing the spatial differentiation in the coupling and coordination of land use multifunctionality is the average slope [49]. Moreover, apart from the distinct geomorphological characteristics, the western region of Sichuan, being an ethnic area with relatively recent economic development, contributes to the varied influencing factors across different municipalities and prefectures. This also indicates that the interaction between any two influencing factors has a greater impact on the coupling and coordination of land use multifunctionality than any individual factors [50,51].

4.2. Policy Recommendations

To comprehensively promote the coordinated development of land use multifunctionality and effectively enhance the efficiency of land resource utilization while reconciling human–land conflicts, Sichuan Province should rationally optimize its territorial spatial development pattern. In line with the high-quality development requirements oriented towards ecological priority and green development, the province should expedite the preparation of provincial territorial spatial planning based on the results of the “dual evaluation”. It should adhere to a bottom-line thinking approach, and, considering regional developmental characteristics, promote economic development in a manner suited to local conditions. Underdeveloped areas should particularly integrate and coordinate the relationships among economic, social, and ecological functions. They should balance and coordinate the input of various elements within the economic–social–ecological system, thereby effectively enhancing the level of land use multifunctionality. This approach will continuously improve the benefits of land resource utilization. Moreover, underdeveloped areas should also comprehensively plan and manage these aspects, establishing land use planning and management mechanisms that incorporate factors like economic development, ecological protection, and social security, to ensure the coordinated development of various functions. Concurrently, strengthening land use monitoring and assessment is crucial to adjust planning and management strategies in a timely manner.

4.3. Future Directions for Research

This paper focuses on exploring the multifunctionality of land use at the provincial and municipal (prefecture) scales in Sichuan Province, although it acknowledges certain limitations. First, future research will aim to further perfect the evaluation indicator system. Based on regional spatial characteristics, the system will be refined to emphasize research on the multifunctionality of land use at the micro-scales of counties, townships, and villages throughout the province. This research will uncover the spatiotemporal characteristics and influencing factors of land use multifunctionality at these scales, contributing to the sustainable development of land resources in the province. Secondly, there will be an innovation in the methods used to evaluate multifunctionality. The research will fully utilize and apply novel evaluation methods, such as remote sensing technology, Geographic Information Systems (GIS), and model simulations, to enhance the accuracy and efficiency of evaluating land use multifunctionality. Thirdly, the study will focus on effectively linking the evaluation of multifunctionality with sustainable development goals. It will explore how to achieve sustainable development in economic, social, and ecological terms through the optimization of land use, effectively integrating land use multifunctionality evaluations with sustainable development objectives.

5. Conclusions

In this study, based on an exploration of an evaluation index system for the land use multifunctionality in Sichuan Province, the entropy-weighted TOPSIS model and coupling coordination degree were used to investigate the development level and the spatiotemporal differentiation characteristics of the coupling coordination degree of the land use multifunctionality in Sichuan Province and its 21 cities (prefectures). With the use of a geographical detector, the factors influencing the spatial differentiation in the coordinated development of land use multifunctionality were also detected. The conclusions are as follows:
(1)
The comprehensive functionality of the land use in Sichuan Province continues to improve, with significant progress in the economic, social, and ecological functionalities. Overall, the functionalities can be ranked as follows: economic > social > ecological. Among the various cities (prefectures), the level of each functionality varies, with clear differences in the extent of improvement. The absolute differences in the comprehensive land use functionality across cities (prefectures) are decreasing, with the range declining from 0.2707 in 2000 to 0.1887 in 2020.
(2)
The coupling coordination degree of the land use multifunctionality in Sichuan Province is continuously improving, with the coordination coefficient increasing from 0.4415 in 2000 to 0.7416 in 2020. There is clear spatial differentiation in the coupling coordination degree of the land use multifunctionality among cities (prefectures). In 2000, a spatial pattern comprising one core, two zones, and multiple points was evident, while in 2020, all cities (prefectures) entered a state of coordination, forming a center–periphery distribution pattern.
(3)
The main single factors influencing the existing spatial differentiation in the coupling coordination of land use multifunctionality are the average slope and the employed population density, with the explanatory power of both factors exceeding 0.9. The interaction between any two influencing factors exerts a greater impact on land use multifunctionality coupling coordination than a single factor, indicating that the spatial differentiation in the coupling coordination development of the land use multifunctionality in Sichuan Province is influenced by multiple factors.

Author Contributions

N.Z. designed the experiments and drafted the manuscript. Data processing and visualization were performed by X.X., G.J. and Y.G. revised the manuscript. All authors have read and agreed to the published version of the manuscript.

Funding

The work was supported by Natural Science Foundation of Qinghai Province (2021-ZJ-909) and Philosophy and Social Science Foundation of Qinghai Province (22Q071).

Institutional Review Board Statement

Not applicable.

Informed Consent Statement

Not applicable.

Data Availability Statement

Publicly available datasets were analyzed in this study. This data can be found here: https://www.stats.gov.cn/ (accessed on 15 November 2022), http://tjj.sc.gov.cn/ (accessed on 15 November 2022), https://www.sc.gov.cn/ (accessed on 15 November 2022), http://slt.sc.gov.cn/ (accessed on 10 December 2022), https://www.gscloud.cn/ (accessed on 8 February 2023).

Conflicts of Interest

The authors declare no conflicts of interest.

References

  1. Wang, M.; Yu, B.; He, Y.; Zhuo, R.; Hu, S. Research on the Suitability of Land Use Multifunctionality in the Erhai Basin from the Perspective of Spatial Planning. J. Chin. Agric. Resour. Reg. Plan. 2020, 41, 220–229. [Google Scholar]
  2. Liu, C.; Xu, Y.; Lu, X. Evolution and Optimization Zoning of Land Use Multifunctionality Trade-offs/Synergies in Ecologically Fragile and Impoverished Areas: A Case Study of Zhangjiakou City. Econ. Geogr. 2021, 41, 181–190. [Google Scholar]
  3. Liu, Y.; Liao, H.; Li, J.; Cai, J.; Li, T.; Wang, Q. Analysis of Spatial Pattern Characteristics and Influencing Factors of Land Use Multi-functionality in Ecologically Fragile Areas. China Land Sci. 2020, 34, 75–83. [Google Scholar]
  4. Sun, P.; Xu, Y.; Liu, Q.; Liu, C. Dynamic Changes and Influencing Factors of Land Use Multifunctionality in Zhangjiakou City. J. Chin. Agric. Resour. Reg. Plan. 2018, 39, 65–74. [Google Scholar]
  5. Liu, Y.; Liao, H.; Cai, J.; Li, J.; Li, T.; Zhu, L.; He, T. Spatiotemporal Coupling Relationship between Land Use Multifunctionality and Multidimensional Poverty in Southwest Mountainous Areas. China Popul. Resour. Environ. 2020, 30, 154–164. [Google Scholar]
  6. Peng, H.; Zhou, G.; Cui, S.; Shang, P. Evaluation of Land Use Multifunctionality and Identification of Obstacle Factors in the Xiangjiang River Basin. Res. Soil Water Conserv. 2022, 29, 308–315. [Google Scholar]
  7. Meng, J.; Wang, Q.; Li, F.; Guo, L. Research on Multifunctional Land Use in the Middle Reaches of the Heihe River Based on Spatial Differentiation. Geogr. Res. 2019, 38, 369–382. [Google Scholar]
  8. Gu, X.; Xu, D.; Xu, M.; Zhang, Z. Measuring residents’ perceptions of multifunctional land use in peri-urban areas of three Chinese megacities: Suggestions for governance from a demand perspective. Cities 2022, 126, 103703. [Google Scholar]
  9. Zhen, L.; Cao, S.; Wei, Y.; Xie, G.; Li, F.; Yang, L. Multifunctional Land Use in Spatial Dimension: Theoretical Framework and Empirical Study. Resour. Sci. 2009, 31, 544–551. [Google Scholar]
  10. Long, H.; Tu, S. Land Use Transition and Rural Revitalization. China Land Sci. 2018, 32, 1–6. [Google Scholar]
  11. Wang, J.; Chen, H.; Shi, Q.; Liu, D.; Liang, X. Study on the Spatiotemporal Differentiation and Influencing Factors of Land Use Multifunctionality at the County Level in Shaanxi Province. J. Chin. Agric. Resour. Reg. Plan. 2019, 40, 101–108. [Google Scholar]
  12. Lv, S.; Li, L. Progress in the Study of Land Use Function Evolution in China. J. Chin. Agric. Resour. Reg. Plan. 2022, 43, 135–140. [Google Scholar]
  13. SchoBer, B.; Helming, K.; Wiggering, H. Assessing land use change impacts: A comparison of the SENSOR land use function approach with other frameworks. J. Land Use Sci. 2010, 5, 159–178. [Google Scholar]
  14. Costa, D.; Rodrigo, I.; Pintocorreia, T. Are Land Managers on the way to Multifunctionality? Application to a case study. In Proceedings of the ICAAM International Conference 2013: Acknowledging the MONTADOS and DEHESAS as High Nature Value Farming Systems, Évora, Portugal, 6–8 February 2013. [Google Scholar]
  15. Maria, L.P.; Cesare, P.M.; Laurence, M.; Jones, M. An aggregation framework to link indicators associated with multifunctional land use to the stakeholder evaluation of policy options. Ecol. Indic. 2011, 11, 71–80. [Google Scholar]
  16. Lvarez, F.; Gillian, G.; Nieves, L.; Holgado, P.; Barajas, J. Hedgerows and Enclosures in Rural Areas: Traditional vs. Modern Land Use in Mediterranean Mountain. Land 2021, 10, 57. [Google Scholar] [CrossRef]
  17. Abouaiana, A.; Battisti, A. Multifunction Land Use to Promote Energy Communities in Mediterranean Region: Cases of Egypt and Italy. Land 2022, 11, 673. [Google Scholar] [CrossRef]
  18. Tomáš, L.; Michal, W.; Igor, G.; Veronika, P. Distribution of Wood Pastures in Slovakia—Constraints and Potentials for Restoration of Multifunctional Traditional Land Use Form. Forests 2023, 14, 68. [Google Scholar] [CrossRef]
  19. Peña, L.; Onaindia, M.; Beatriz, F.; Ametzaga-Arregi, I.; Casado-Arzuaga, I. Analysing the Synergies and Trade-Offs between Ecosystem Services to Reorient Land Use Planning in Metropolitan Bilbao (Northern Spain). Sustainability 2018, 10, 4376. [Google Scholar] [CrossRef]
  20. Lovell, S.T. Multifunctional Urban Agriculture for Sustainable Land Use Planning in the United States. Sustainability 2010, 2, 2499–2522. [Google Scholar] [CrossRef]
  21. Mukul, S.A.; Saha, N. Conservation Benefits of Tropical Multifunctional Land-Uses in and Around a Forest Protected Area of Bangladesh. Land 2017, 6, 2. [Google Scholar] [CrossRef]
  22. Solbär, L.; Marcianó, P.; Pettersson, M. Land-use planning and designated national interests in Sweden: Arctic perspectives on landscape multifunctionality. J. Environ. Plan. Manag. 2019, 62, 2145–2165. [Google Scholar] [CrossRef]
  23. Zhang, Z.; Lao, Y.; He, C.; Wei, J.; Hu, B. Mechanisms of Land Use Multifunctionality and its Coupling Coordination Spatiotem-poral Differentiation: A Case Study of Guangxi. J. Agric. Resour. Environ. 2021, 38, 317–331. [Google Scholar]
  24. Zhang, X.; Zhu, D.; Xu, Z. Evaluation of Land Use Multifunctionality in Tibet. J. Agric. Eng. 2014, 30, 185–194. [Google Scholar]
  25. Lin, S.; Lu, R.; Liu, S.; Ye, Z.; Wei, Q.; Luo, J. Land Use Patterns and Multifunctionality Evolution in Guangxi’s Border Areas Based on ‘Production-Living-Ecological’ Spaces. J. Agric. Eng. 2021, 37, 265–274. [Google Scholar]
  26. Zhang, Y.; Liu, X.; Fan, Y.; Liu, Y. Analysis of Spatial Differences and Influencing Factors of Land Use Multifunctionality in Gansu Province. J. Yunnan Agric. Univ. (Nat. Sci.) 2019, 34, 544–552. [Google Scholar]
  27. Zhang, L.; Zheng, X.; Cai, Y.; Lu, Y. Evaluation of Land Multifunctionality in Hunan Province Based on the Full Permutation Polygon Indicator Method. Res. Soil Water Conserv. 2016, 23, 298–303. [Google Scholar]
  28. Wiggering, H.; Dalchow, C.; Glemnitz, M.; Helming, K.; Müller, K.; Schult, A.; Stachow, U.; Zander, P. Indicators for multifunctional land use-Linking socio-economic requirements with landscape potentials. Ecol. Indic. 2006, 6, 238–249. [Google Scholar]
  29. Qin, M.; Kang, Q.; Guo, Q.; Ding, Y.; Wu, X. Study on the Level of Multifunctional Land Use and its Changes in Shanxi Province-Based on Comprehensive Analysis Method. Reg. Res. Dev. 2023, 42, 143. [Google Scholar]
  30. Liu, C.; Xu, Y.; Lu, X.; Han, J.; Han, J. Trade-offs and driving forces of land use functions in ecologically fragile areas of northern Hebei Province: Spatiotemporal analysis. Land Use Policy 2021, 104, 105387. [Google Scholar] [CrossRef]
  31. Verburg, P.H.; Steeg, J.V.D.; Veldkamp, A.; Willemen, L. From land cover change to land function dynamics: A major challenge to improve land characterization. J. Environ. Manag. 2009, 90, 1327–1335. [Google Scholar] [CrossRef]
  32. Chen, Y.; Min, J.; Kong, X.; Hou, L.; Feng, X. Analysis of Spatial Differences in Land Use Multifunctionality in Chongqing City. Resour. Dev. Mark. 2017, 33, 1461–1467. [Google Scholar]
  33. Sun, J.; Zhang, Q.; Wang, S. Spatiotemporal Evolution and Influencing Factors of Land Use Multifunctionality at the County Level in Shandong Province. Resour. Dev. Mark. 2021, 37, 1309–1315. [Google Scholar]
  34. Ren, H.; Cui, J. Construction and Empirical Analysis of an Evaluation Index System for High-Quality Economic Development. Stat. Decis. 2022, 38, 31–34. [Google Scholar]
  35. Sun, Z.; Zhao, B.; Qin, A.; Zhu, K. Measurement and Analysis of the Influencing Factors of Sustainable Development of Rural Tour-ism in Ecologically Fragile Areas: A Case Study of Dongchuan District, Kunming City. Ecol. Econ. 2022, 38, 157–163. [Google Scholar]
  36. Li, G.; Li, S.; Ping, J. Evaluation and Analysis of Obstacle Factors for Rural Revitalization in Qinghai Province Based on an Im-proved Entropy-TOPSIS-Grey Correlation Degree Model. J. Chin. Agric. Resour. Reg. Plan. 2021, 42, 115–123. [Google Scholar]
  37. Wang, H.; Zheng, H.; Liu, Y. Health Diagnosis of Cultivated Land Resource Utilization System in Anhui Province Based on the DPSIR-TOPSIS Model. Bull. Soil Water Conserv. 2019, 39, 147–153. [Google Scholar]
  38. Niu, W.; Shen, S.; Zhang, B. Spatial Pattern and Influencing Factors of the Coupling Coordination of Five Dimensions of Rural Revitalization in China. J. Chin. Agric. Resour. Reg. Plan. 2021, 42, 218–231. [Google Scholar]
  39. Wang, J.; Xu, C. Geographical Detector: Principles and Prospects. Acta Geogr. Sin. 2017, 72, 116–134. [Google Scholar]
  40. Paracchini, M.L.; Petersen, J.E.; Hoogeveen, Y. Cultural ecosystem services provided by landscapes: Assessment of heritage areas in Europe. Landsc. Urban Plan. 2014, 133, 145–152. [Google Scholar]
  41. Wu, J. Landscape sustainability science: Ecosystem services and human well-being in changing landscapes. Landsc. Ecol. 2013, 28, 999–1023. [Google Scholar] [CrossRef]
  42. Palomo, I.; Martín-López, B.; García-Llorente, M. The role of cultural ecosystem services in landscape management and planning. Curr. Opin. Environ. Sustain. 2012, 4, 565–570. [Google Scholar]
  43. Wang, H.; Qiao, G.; Zhang, Y. Understanding the driving factors of multifunctionality in land use: A systematic review. Land Use Policy 2020, 97, 104645. [Google Scholar]
  44. Gao, J.; Zhao, W.; Yu, Y. Driving factors of land use multifunctionality in China: A spatial econometric approach. Sustainability 2015, 7, 16718–16734. [Google Scholar]
  45. Martín-López, B.; Iniesta-Arandia, I.; García-Llorente, M.; Palomo, I.; Casado-Arzuaga, I. Socio-cultural valuation of ecosystem services: Uncovering the links between values, drivers of change, and human well-being. Ecol. Econ. 2012, 74, 159–172. [Google Scholar]
  46. Zhang, L.; Lei, F.; Liu, S. Research on the Differences and Influencing Factors of Land Use Functions in Sichuan Province. Econ. Geogr. 2019, 39, 90–97. [Google Scholar]
  47. Zhou, Y. Study on the Spatiotemporal Characteristics and Driving Forces of Land Use Multifunctionality in the Sichuan Basin. J. Sichuan Agric. Univ. 2015, 33, 132–138. [Google Scholar]
  48. Guo, L.; Hailu, A.; Zeng, L. Assessing the multifunctionality of land use in Chengdu. China J. Environ. Manag. 2019, 246, 62–72. [Google Scholar]
  49. Liu, F.; Wang, L.; Deng, X. Study on the Spatial Differentiation Simulation of Land Use Multifunctionality in Sichuan Province Based on GIS and RS. Prog. Geogr. 2017, 36, 987–997. [Google Scholar]
  50. Jiang, X.; Jiang, Z.; Chen, X. Study on the Spatial Differentiation of Land Use Multifunctionality in Sichuan Province. J. Sichuan Agric. Univ. 2018, 36, 312–319. [Google Scholar]
  51. Zheng, J.; Wang, L.; Chen, H. Study on the Multifunctionality of Land Use and Its Influencing Factors in Sichuan Province. Resour. Sci. 2019, 41, 682–690. [Google Scholar]
Figure 1. Technological roadmap.
Sustainability 16 00843 g001
Figure 2. Regional location map.
Sustainability 16 00843 g002
Figure 3. Variation trend of the land use versatility index in Sichuan Province.
Sustainability 16 00843 g003
Figure 4. Spatial and temporal evolution of the land use multifunctionality evaluation results for the cities (prefectures) in Sichuan Province.
Sustainability 16 00843 g004
Figure 5. Change trend of the land use multifunctional coupling coordination degree in Sichuan.
Sustainability 16 00843 g005
Figure 6. Evolution of the spatial pattern of land use multifunctional coupling coordination in Sichuan.
Sustainability 16 00843 g006
Figure 7. Factor interaction detection results.
Sustainability 16 00843 g007
Table 1. Land use function categories and indicators.
Objective LayerCriterion LayerIndicator LayerExplanation and Calculation
Methodology for the Indicators
Land Use MultifunctionalityEconomic
Functionality
Agricultural Production FunctionalityPer capita grain possession (kg)Total grain production per capita
Yield of fruit per unit area (tons/km2)Fruit production per regional total area
Proportion of the total output value of agriculture, forestry, animal husbandry, and fishery in the gross domestic product (GDP) (%)Total output value of agriculture, forestry, animal husbandry, and fishery/GDP
Economic Development FunctionalityEconomic density (Billion renminbi/km2)GDP per regional total area
Proportion of the secondary and tertiary industries (%)Added value of the secondary and tertiary industries/GDP
Per capita GDP (renminbi)Sourced from the Sichuan Provincial Statistical Yearbook
Social FunctionalitySpatial Carrying Capacity FunctionalityPopulation density (ten thousand people/km2)Total population per regional total area
Social Security CapabilityNumber of medical beds per ten thousand people (ten thousand people/bed)Total population per number of medical beds
Average wage of on-duty employees (renminbi)Sourced from the Sichuan Provincial Statistical Yearbook
Urban–rural income balance index (%)Rural per capita net income/urban residents disposable income
Employment Support FunctionalityEmployment population density (people/km2)Total number of employed persons per regional total area
Transportation Assurance FunctionalityRoad network density (km/km2)Road mileage per regional total area
Ecological
Functionality
Ecological Maintenance FunctionalityForest coverage rate (%)Forest land area per regional total area
per capita water resources (m3)water resources per total regional population
Environmental Purification FunctionalityWastewater treatment rate (%)Sourced from the Sichuan Provincial Statistical Yearbook
Fertilizer application per unit area (ten thousand tons/thousand hectares)Total agricultural fertilizer usage per total cultivated land area
Resource Provision FunctionalityLand reclamation rate (%)Total cultivated land area per regional total area
Per capita pork, beef, and mutton production (ten thousand tons/km2)Pork, beef, and mutton production per regional total area
Table 2. Coupling coordination degree division criteria.
TypeTypes of Coupling CoordinationCoordination Hierarchy
Nonideal TypeSevere Discrepancy(0–0.1]
Profound Disruption(0.1–0.2]
Moderate Disruption(0.2–0.3]
Severe Discrepancy(0.3–0.4]
On the Verge of Disruption(0.4–0.5]
TransitionalMarginally Coordinated(0.5–0.6]
Primary Coordination(0.6–0.7]
Ideal TypeIntermediate Coordination(0.7–0.8]
Advanced Coordination(0.8–0.9]
High-Quality Coordination(0.9–1]
Table 3. Index system of the influencing factors.
Influencing FactorsDetection FactorUnitExplanation and Source of Indicators
Natural FactorsMean Elevation X1mVia the use of ArcGIS raster calculation statistics, the average elevation of each city (state) is obtained
Mean Slope X2°ArcGIS raster calculation statistics are applied to obtain the average slope of each city (state)
Effective Irrigated Area X3hm2Sourced from the Sichuan Provincial Statistical Yearbook
Social FactorsAverage On-Duty Employee Salary X4Renminbi (RMB)Sourced from the Sichuan Provincial Statistical Yearbook
Employed Population Density X510,000 people/km2Total workforce/total area
Road Network Density X6km/km2Road length/total area
Medical Bed Density per Ten Thousand People X7per 10,000 people per unitTotal population/medical bed capacity
Economic FactorsFixed Asset Investment per Unit Area X8billion Renminbi/km2Total fixed-asset investment/Total area
Per Capita GDP X9RenminbiSourced from the Sichuan Provincial Statistical Yearbook
Per Capita Local Fiscal Revenue X10RenminbiLocal fiscal revenue/total population
Economic Agglomeration Degree X11Billion Renminbi/km2Gross domestic product/total area
Table 4. Coupling coordination degree of the land use multifunctionality in cities (prefectures) in Sichuan Province from 2000 to 2020.
City (Prefectures)200020052010201220142016201820192020
Chengdu0.63140.62500.66510.68240.69640.71130.73230.74100.7382
Zigong0.60700.60590.65560.67150.68260.69610.70330.70490.7267
Panzhihua0.44420.40720.52280.55440.58830.60520.62980.63930.6540
Luzhou0.60870.58820.60920.61550.64280.65460.66860.67440.6881
Deyang0.63680.62690.66370.67530.69220.69840.70650.71380.7198
Mianyang0.49980.50010.56880.59290.62730.64720.66150.66530.6768
Guangyuan0.50690.44740.53940.56760.60450.62550.63670.64620.6584
Suining0.62730.60240.62620.64030.65120.65660.67100.68110.6944
Neijiang0.59280.57490.64650.65860.67360.69110.70410.71270.7210
Leshan0.56530.51530.56840.57840.61210.62660.64120.64840.6631
Nanchong0.59080.59910.63380.64530.65890.67280.68310.68940.7035
Meishan0.63510.62160.65020.65900.67840.69030.70220.70950.7160
Yibin0.58890.57750.60500.63380.63320.67240.68940.69610.7079
Guang’an0.63270.60580.63550.64940.65540.67300.67890.68700.6902
Dazhou0.61800.59030.62150.62930.63960.64830.66900.67460.6876
Ya’an0.52050.41500.46280.48940.51350.54280.55170.57310.5908
Bazhong0.62330.58950.56990.59050.62060.63460.64310.64970.6743
Ziyang0.65810.63170.64910.67000.68880.71650.72190.72910.7298
Ngawa Tibetan and Qiang Autonomous Prefecture0.35480.29800.42740.46940.53790.56650.57940.58720.5937
Garzê Tibetan Autonomous Prefecture0.24410.29200.42240.43930.49090.54140.56390.56800.5710
Liangshan Yi Autonomous Prefecture0.46330.48990.51970.54310.58040.60830.61910.63080.6438
Table 5. Factor detection results.
Detection FactorX1X2X3X4X5X6X7X8X9X10X11
q statistic0.78540.95130.81540.56080.94230.82320.56650.86430.63350.82310.8884
p value0.0000.0000.0000.0050.0020.0010.0020.0010.0000.0000.000
Disclaimer/Publisher’s Note: The statements, opinions and data contained in all publications are solely those of the individual author(s) and contributor(s) and not of MDPI and/or the editor(s). MDPI and/or the editor(s) disclaim responsibility for any injury to people or property resulting from any ideas, methods, instructions or products referred to in the content.

