Article

Research on the Impact of Heterogeneous Environmental Regulation on the Coordinated Development of China’s Water–Energy–Food System from a Spatial Perspective

1
School of Management, Xi’an University of Science and Technology, Xi’an 710054, China
2
School of Energy, Xi’an University of Science and Technology, Middle Part of Yanta Road, Xi’an 710054, China
3
Energy Economy and Management Research Center, Xi’an University of Science and Technology, Xi’an 710054, China
4
School of Business, University of Huddersfield, Queensgate, Huddersfield HD1 3DH, UK
*
Authors to whom correspondence should be addressed.
Sustainability 2024, 16(2), 818; https://doi.org/10.3390/su16020818
Submission received: 13 September 2023 / Revised: 21 October 2023 / Accepted: 18 December 2023 / Published: 17 January 2024

Abstract

:
Water resources, energy, and food are fundamental resources for ensuring human social development. The coordinated development of these resources contributes to improving the quality of the social environment, promoting harmony between humans and nature, and achieving economic, social, and ecological sustainability. This study utilizes panel data from 30 provinces in China from 2003 to 2020. Using a coupled coordination degree model, the coupling coordination degree of the Water–Energy–Food (WEF) system is calculated, and the spatiotemporal evolution and social network connections of WEF coupling coordination are analyzed. The spatial Durbin model is employed to investigate the spatial spillover effects of heterogeneous environmental regulation on the coordinated development of the WEF system. The mechanism model is used to explore the pathways through which heterogeneous environmental regulation influences the coordinated development of the WEF system. The results of this study demonstrate that the coupling coordination index of China’s provincial-level WEF system has shown a steady upward trend, except for a slight decline in a few years. Over the research period, there has been a significant improvement in regional coupling coordination levels. There are large differences in the level of WEF coupling coordination among different regions, with a distribution pattern of south > north and east > west. Both formal and informal environmental regulations have significant positive effects on the coupling coordination development of the WEF system, as well as significant positive spatial spillover effects. Formal environmental regulation has a stronger impact compared to informal environmental regulation. Foreign direct investment and industrial structural upgrading are important pathways for environmental regulation to promote the coordinated development of the WEF system. Both formal and informal environmental regulations can promote the coordinated development of the WEF system by facilitating foreign direct investment and industrial structural upgrading. This study not only provides important scientific evidence and decision-making references for policymakers in formulating environmental regulation policies but also offers new evidence support for the theory of regional development disparities.

1. Introduction

Water resources, energy, and food are essential strategic resources for sustaining human survival, promoting socio-economic growth, and maintaining regional sustainable development [1,2,3]. China is currently undergoing an accelerated process of new industrialization and urbanization, resulting in tremendous demand for water, energy, and food [4]. Although China possesses vast overall resource quantities, per capita resource availability is relatively low. There are distinct regional disparities in the distribution of water resources, energy production, and food supply. Water resources are concentrated in the southern regions, while agricultural production and energy reserves are concentrated in the northern regions. This unique distribution pattern leads to frequent occurrences of phenomena such as increased uncertainty in water resource demand, energy demand, and food supply in China. The inter-relationships and constraints among water, energy, and food have become increasingly prominent [5].
Water, energy, and food systems are interdependent, and their interactions are highly complex. Water resources serve as the foundation for agricultural production, while activities such as agricultural machinery operation, fertilizer production, and food processing require significant energy inputs [6]. Conversely, food production and supply chains also demand substantial water and energy resources. Therefore, changes in any of these systems may have significant impacts on the others. Water scarcity and pollution, for instance, can affect food production and supply, while frequent trading of energy-related commodities can exacerbate water resource depletion in neighboring cities, leading to spatial resource transfers [7].
The coordinated development of China’s water resources, food, and energy systems has a significant impact on achieving sustainable development [8,9]. It is not only related to environmental protection, resource utilization efficiency, and food security but also plays an important role in economic development and social stability. Unreasonable development practices may have negative impacts on the environment. Coordinated development can promote green development, reduce pollutant emissions, and protect the ecological environment [10]. Furthermore, it helps ensure the stability and security of the food supply. Scientific and reasonable management of water resources, improving agricultural irrigation efficiency, and enhancing agricultural production methods can increase food production and quality [11]. Simultaneously, optimizing energy structures and improving the operational efficiency of agricultural production and supply chains can guarantee the stability of the food supply chain. The development and utilization of water resources, food, and energy are closely related to the ecological environment [12]. Studying the coordinated development of the system can reduce water resources pollution and waste, promote the ecological, low-carbon, and sustainable development of agricultural production, and achieve eco-prioritized and green development of water resources, food, and energy.
As globalization continues to advance and resource scarcity increases, ensuring the supply of essential resources such as food, energy, and water poses a unique challenge to national sustainable development [13]. This is not only because the demand for resource imports and exports from different countries or regions continues to grow but also due to the complex interrelationships within the food–energy–water system. Water plays a crucial role in energy production, including the extraction of renewable energy and unconventional fossil fuels, which are expected to play an important role in future energy security [14]. The intricate relationship between food and water has become more complex due to the rapid growth of agricultural globalization and food trade. This has led to large-scale virtual water transfers between regions and significant roles in food and water security in some areas [15].
Environmental regulation, as a policy tool and management mechanism, guides and adjusts the rational allocation and utilization of resources through internal and external constraints and incentives. It aims to eliminate or reduce externalities, excessive resource utilization, and environmental pollution, thereby achieving environmental optimization in the socio-economic context [16] Can environmental regulation have an impact on the coordinated development of the water–energy–food system among regions in China? This is a highly debated issue. China, as one of the most populous countries in the world, faces challenges such as water scarcity, increasing energy demand, and food security [17]. In this context, achieving coordinated development of the water, energy, and food systems among regions in China becomes a significant issue.
By introducing environmental access standards, resource taxation, emission permits, and other measures, environmental regulation aims to guide enterprises and individuals in the rational utilization of water resources, energy, and land resources, reduce pollution emissions and waste, and provide security for food production and supply [18]. However, there are still many uncertainties regarding the impact of environmental regulation on the coordinated development of the water–energy–food system among regions in China [19]. On the one hand, environmental regulation may promote optimized resource allocation between regions, foster efficient utilization and sustainable development, thereby improving the output and efficiency of water resources, energy, and food [20,21]. On the other hand, environmental regulation may exacerbate resource constraints in certain regions, result in imbalanced industrial restructuring, and thereby affect the supply and demand of water resources, energy, and food [22]. Moreover, the implementation and effectiveness of environmental regulation may vary across different regions, leading to competition and coordination challenges among them [23].
Therefore, it is of great significance to deeply investigate the impact of heterogeneous environmental regulation on the coordinated development of the water–energy–food system among regions in China. By assessing the implementation effectiveness, resource utilization efficiency, and economic benefits of different types of environmental regulation policies, scientific evidence and decision support can be provided to policymakers, promoting regional collaboration and sustainable utilization. In addition, it is necessary to explore the role of environmental regulation in resource allocation, cooperation mechanisms, and policy coordination among different regions, as well as how to address conflicts and conflicting interests between regions, in order to achieve more balanced development and sustainable resource utilization.
Compared to the existing literature on water–energy–food-related research, this study makes several contributions: (1) This study analyzes the space–time evolution characteristics of the water–energy–food system coupling coordination degree among 30 provinces in China, evaluating the differences in coordination degrees between different provinces. By analyzing data over a long time span, it can reveal the changes and trends of the system in different periods and regions, providing a foundation for understanding the patterns of system changes. (2) From the perspectives of foreign direct investment and industrial structural upgrading, this study examines the specific mechanisms through which environmental regulation affects the coupled coordination development of the water–energy–food system, providing decision support for governments and enterprises in formulating comprehensive policies and implementation plans. (3) This study reveals the spatial spillover effects of heterogeneous environmental regulation on the coupling coordination degree of the water–energy–food system and compares the specific impacts of formal and informal environmental regulation on the coupled coordination development of the water–energy–food system.
The remaining sections of this paper are structured as follows: Section 2 provides the theoretical background, discussing the relevant theories that support the research and conceptualize the study. Section 3 presents the research methodology, including the variables used and the sources of data. Section 4 presents the research findings. Section 5 discusses the implications of the research findings. Section 6 summarizes the main conclusions and provides policy recommendations.

2. Theoretical Background

The WEF system is an integrated system that involves the interdependence and interaction among water resources, energy, and food [24]. In this system, water resources are the fundamental requirement for agricultural development, while energy is a crucial driving force in promoting development across all sectors. Food is also one of the essential materials necessary for human survival. These three elements are interdependent and mutually constraining [25]. In a situation where water is scarce, agricultural development will be limited, resulting in a decline in food production. At the same time, inadequate energy production capacity can also affect food production and economic development. Studying the WEF system as a whole can help to find new ways to reduce environmental pollution and improve resource utilization efficiency [26].
Environmental and resource economics research focuses on issues related to resource utilization and environmental protection. Environmental regulation is one of its important research directions. Environmental regulation can take two forms: formal and informal. Formal environmental regulation is a set of environmental policies and measures developed and enforced by the government or legal regulations with clear legal effectiveness. Informal environmental regulation is a voluntary norm generated through industry associations, social organizations, or market mechanisms.
The theory of regional developmental differences is one of the important theoretical frameworks in economic geography and regional science. This theory holds that there are inherent differences in economic and social development among different regions, which are influenced by multiple factors such as geographical conditions, resource endowments, population distribution, and technological level. These factors collectively shape the economic structure, industrial layout, and development characteristics of a region.
In China’s WEF system, due to differences in geography, climate, and resource endowments, there are significant differences in water supply, food production, and energy consumption among different regions. Water resources, food, and energy are interrelated, and their development and utilization are closely linked and interdependent [27]. When environmental regulations change the way water resources are managed, the mode of food production or energy consumption structure, it may have spillover effects on adjacent regions.
Due to differences in regional economic development, resource endowments, government management capabilities, and social participation levels, formal and informal environmental regulations also vary in different regions of China. If the research method divides China into eastern, central, and western regions, it will result in a hard division of boundary regions. This heterogeneous research makes it difficult to evaluate the impact of environmental regulations on different regions.
Spatial econometrics has become an essential research method for resource and environmental economics in recent years. By constructing different correlation matrices, spatial econometric models can study heterogeneity between regions without destroying the integrity of individual border regions. Common correlation matrices include adjacency matrices, geographical distance matrices, economic gap matrices, and economic geographic nested matrices. By using these different matrices, it is possible to assess the impact of heterogeneous environmental regulation on the development differences of the WEF system in different regions.
In a country like China with vast territory and diverse ecological environment, exploring the impact of environmental regulation on the WEF system in different regions is of great practical significance. Due to the diversity of different regions and environmental regulations, this issue involves complex factors and mechanisms. Existing research on environmental regulation mainly focuses on one aspect of the WEF system, and further discussion on the impact of heterogeneous environmental regulation on the coupled and coordinated development of the WEF system is still needed.

3. Methods, Models and Variables

3.1. Methods

3.1.1. Comprehensive Evaluation Index

Compared to the Analytic Hierarchy Process (AHP) and the Relative Index Method (RIM), the Entropy Weight Method (EWM) is considered a more objective weighting method. This method determines the weights based on the variability of indicators, where generally, indicators with higher variability are assigned greater weights. The EWM can partially eliminate subjectivity and provide a more objective reflection of the relationships between indicators [28]. The specific steps of the EWM are as follows:
(1)
Dimensionless processing. Due to the different dimensions of each index, in order to be able to compare, it is necessary to eliminate the dimension of the original data. First, the indicators are standardized:
Positive   indicators :   x i j = x i j min ( x i j ) max ( x i j ) min x i j
Negative   indicators :   x i j = max ( x i j ) x i j max ( x i j ) min x i j
In the formula, x i j is the value of the index j of the evaluation object i after standardization. x i j is the initial value of the index. max ( x i j ) and min x i j are the maximum and minimum values of the initial value of the index.
(2)
Calculate the proportion of the index j of the evaluation object i to the index Pij:
p i j = x i j i = 1 x i j
(3)
Calculation of information entropy sj:
s j = 1 ln n i = 1 n p i j ln p i j
(4)
Calculate the difference coefficient dj:
d j = 1 s j
(5)
Calculate the weight index:
ω j = d j i = 1 n d j
(6)
The comprehensive evaluation index is used to measure the development level of three subsystems in 30 regions of China. The calculation formula is as follows:
w ( u ) = j = 1 n ω j u i j
e ( y ) = j = 1 n ω j y i j
f ( z ) = j = 1 n ω j z i j
In the formula: ω j is the index weight calculated by Formula (6); u i j , y i j and z i j are the standardized values of the range of each index in the water resources, energy, and food subsystems, respectively; w ( u ) , e ( y ) and f ( z ) represent the evaluation index of the development level of the corresponding subsystem respectively. This paper analyzes the evolution characteristics of WEF coupling and coordinated development level in 30 regions of China from two dimensions of time and space. From the perspective of the time dimension, the evaluation object n = 18, that is, 18 research years from 2003 to 2020; from the perspective of spatial dimension, the evaluation object n = 30, that is, 30 provinces, autonomous regions, and cities, except Tibet.

3.1.2. Coupling Coordination Degree

Since the World Economic Forum included the “Water-Energy-Food Nexus” risk cluster in the three major risk clusters in its Global Risk Report in 2011, the WEF system has attracted significant attention from researchers worldwide. Research in this field primarily focuses on the conceptualization and understanding of the water–energy–food systems [29], optimization assessment [30,31], and simulation and prediction studies [32]. The research methods employed in this field have become increasingly diverse and include approaches such as indicator system methodology [33], the entropy weight-TOPSIS method [34], correlation analysis [35], data envelopment analysis [36], coupling coordination models [37], and system dynamics [38].
Coupling coordination is a quantitative indicator that describes the interdependence and coordinated development of two or more systems or subsystems. Compared to other analysis methods such as indicator system methodology, correlation analysis, and data envelopment analysis, the coupling coordination model is capable of integrating the water resources system, energy system, and food system into a comprehensive research framework. Furthermore, unlike system dynamics models, the coupling coordination model can analyze the variations in the water–energy–food systems of different regions over different time periods and evaluate the level of coordinated development from both temporal and spatial dimensions.
In this study, the coupling coordination model is employed to examine the level of coordination in China’s water–energy–food systems. It involves the evaluation of coupling degree (C value), coordination degree (D value), and coordination index (T value). The coupling degree model reflects the degree of interconnection, restriction, and promotion between the two systems or subsystems. When the coupling degree is high, it indicates a mutually coordinated and orderly development. Conversely, a low coupling degree suggests a lack of coordination. The coupling degree value for provincial-level WEF systems in China is denoted by C and calculated using the following formula:
C = 3 × ( w ( u ) × e ( y ) × f ( z ) 3 w ( u ) + e ( y ) + f ( z )
In the formula, C ∈ [0, 1] represents the coupling degree, where C = 0 indicates no correlation between the systems. As C increases, the interconnection between systems becomes stronger. When C reaches 1, the coupling degree is saturated, indicating that the systems are in a completely fitting state and developing towards an ordered structure.
Although coupling degree is an important indicator reflecting the degree of interdependence between systems, it has limitations when evaluating long-term studies across multiple regions. The coupling coordination model is the most commonly used method for analyzing the coupling relationships between three systems. It can effectively reflect the synergistic effects between systems. To better illustrate the coordinated development status between systems, it is necessary to further introduce the coupling coordination model:
D = C × T
T = α × w ( u ) + β × e ( y ) + γ × f ( z )
In the equation, D represents the coupling coordination degree, with a value range of (0, 1]. The higher the D value, the better the coordinated development between systems. T represents the comprehensive evaluation index of the water, energy, and food subsystems in the WEF system, with a value range of (0, 1]. The higher the T value, the more coordinated the overall development status of the three subsystems. α, β and γ represent the importance levels of the three subsystems. Based on the mechanism described in the paper, it is assumed that the importance of the water, energy, and food subsystems is equal, so α = β = γ = 1/3.
According to the explanation in the methodology section, D is an important indicator of the level of coordinated development between subsystems, and it complements the limitations of the coupling degree model. Additionally, T represents the overall level of coordinated development in the WEF system, enabling a comprehensive evaluation of the interconnections and interactions between the subsystems. The weights α, β and γ are equally divided among the three subsystems to avoid subjective bias and promote objectivity.

3.2. Variables Selection

Coupling coordination degree of the WEF System. This study focuses on the coupling coordination degree of the WEF system as the core explained variable. A scientifically reasonable evaluation index system is essential for accurately assessing the level of coupling coordination in the WEF system. Drawing upon existing research achievements and adhering to principles of scientificity, systematicity, comprehensiveness, and authenticity, we have constructed an evaluation index system for interprovincial WEF system coupling coordination and development in China, as detailed in Table 1 below. Building upon Table 1, we have applied the comprehensive evaluation index method and the coupling coordination degree model to calculate the comprehensive evaluation indices of the three subsystems, as well as the overall evaluation index and coupling coordination degree of the WEF system.
Heterogeneous environmental regulation (LnER). This article characterizes heterogeneous environmental regulation from the perspectives of formal and informal regulations. To measure formal environmental regulation (ER1), the method of Wang et al. (2016) is adopted [39]. It measures the formal environmental regulation by the ratio of environmental pollution control investment and pollutant discharge fees to GDP. The higher the proportion is, the stronger the environmental regulation. Following Chen et al. (2022) [40], informal environmental regulation (ER2) is measured by using a composite index based on income level, population density, and education level, calculated through the entropy method. Education level is measured by the proportion of the population with higher education, indicating a stronger environmental awareness. Income level is measured by the average wage of urban employees, and population density is measured by the proportion of provincial population to regional area, indicating higher environmental quality requirements in areas with higher income levels and larger population densities.
Industrial Structure Upgrading (LnAIS). Industrial structure upgrading has a profound impact on the coordinated development of water resources, food, and energy systems [41]. By optimizing water resource utilization efficiency, improving agricultural modernization, promoting energy structure transformation, driving technological innovation, and achieving green production, a virtuous interaction between industrial structure upgrading and the coordinated development of water resources, food, and energy systems can be realized. The proportion of added value of the tertiary industry to the added value of the secondary industry is used as a proxy variable for industrial structure upgrading.
Trade Exports (LnTEX). Exports have a certain impact on the coordinated development of water resources, food, and energy systems. They can bring economic benefits, optimize resource allocation, promote technological innovation, and facilitate resource integration. However, they may also lead to internal supply-demand imbalances, market risks, and resource sustainability issues [42]. We use the ratio of regional total export value to GDP as an indicator of trade exports.
Urbanization (LnURB). In the process of urbanization, on the one hand, population growth and urban expansion lead to increased demand for water resources. In addition, during the urbanization process, a large amount of farmland is converted into urban areas, resulting in a reduction in arable land. This affects food production capacity and food security. If the food supply cannot meet the needs of the urban population, it may result in food deficits, rising food prices, and thus impacting the coordinated development of water resources and energy systems. On the other hand, urbanization is often accompanied by higher industrial agglomeration effects and resource allocation efficiency, which can promote rational resource utilization. The ratio of urban population to total population is used to measure the level of urbanization.
Foreign Direct Investment (LnFDI). Foreign direct investment is often accompanied by the introduction and transfer of technology, which may bring advanced water resource, energy, and environmental management technologies. The introduction of foreign technology can improve resource utilization efficiency, reduce pollution emissions, and promote sustainable development [43]. Foreign direct investment can also accelerate the development and utilization of water resources and energy. In some cases, this may lead to excessive exploitation and consumption of resources, causing environmental problems. In this study, the natural logarithm of actual foreign direct investment is used as a measure of the foreign direct investment variable.
Population Size (LnPOP). Population has complex and important impacts on the water–resource–energy–environment system. On the one hand, regions with larger populations have more abundant human resources, providing more intellectual and physical resources. On the other hand, population growth leads to increased waste and pollutant emissions. Improper handling of waste and pollutants can cause pollution to water resources, soil, and air, endangering human health and ecological balance. The number of permanent residents in the region is used to measure this indicator.

3.3. Model Construction

3.3.1. Construction of Spatial Durbin Model

Inter-regional commodity trade has led to the cross-regional flow of water, energy, and food. There are variations in water resources, energy, and food production conditions across different regions. Therefore, conducting cross-regional optimization and allocation of resources can enhance overall efficiency and achieve rational utilization of resources. The Space Durbin model incorporates the characteristics of Spatial Error Model (SEM) and Spatial Lag Model (SAR), allowing for the analysis of regional differences and spatial patterns. This is of significant importance in studying the development of water resources, food, and energy in different regions under environmental regulations. Through spatial analysis using the model, specific regions’ advantages and potentials can be identified, providing support for regional development and resource allocation.
In this study, the Space Durbin model is used to examine the specific impact of heterogeneous environmental regulations on the coupling and coordination of the water–energy–food system in China. The research method employed is based on Chen et al. (2023) [44]. The constructed Space Durbin model is presented as follows:
L n C C D i t = ρ W i j L n C C D i t + β 1 L n E R i t + γ X i t + W i j ( β 3 L n E R i t + ε X i t ) + μ i
In the formula, LnCCD represents the logarithm of coupling coordination degree, LnER represents the logarithm of environmental regulation. The environmental regulation used in this paper includes formal environmental regulation and informal environmental regulation. In the follow-up, two different environmental regulations will be modeled and studied separately. X is the control variable, including industrial structure upgrading (LnAIS), trade export (LnTEX), urbanization (LnURB), foreign investment (LnFDI), population (LnPOP). u i represents the spatial fixed effect, and W i j is the weight matrix. i denotes different regions, and t denotes different years.
The spatial econometric model needs to design a spatial weight matrix to reflect the impact of neighboring provinces on the explained variables. This paper constructs the spatial weight matrix of geographical distance from the perspective of geographical distance. In this paper, the expression of geographical distance weight matrix is constructed as shown in Equation (14):
W 1 = 1 ( x i x j ) 2 + ( y i y j ) 2
Among them, W1 represents the geographical distance weight matrix, xi and yi represent the latitude and longitude of the provincial capital cities in each region, and the data come from the National Basic Geographic Information Center. The Euclidean distance between the two is calculated by latitude and longitude to represent its geographical distance.
In addition to considering the influence of geographical distance on variables, this paper also considers the influence of economic gap. To this end, this paper also constructs an economic geographical distance weight matrix for robustness testing. The economic geographical distance matrix constructed in this paper is shown in Equation (15):
W 2 = W 1 d i a g ( Y 1 ¯ /   Y   ¯ ,   Y 2 ¯ /   Y   ¯ ,   Y n ¯ /   Y   ¯ )
Among them, W2 is the economic geographic distance weight matrix, Y i ¯ = 1 t n t 0 + 1 t 0 t n Y i t is the per capita GDP of each region during the observation period, and Y ¯ is the per capita GDP of all regions during the observation period.
Anselin (1995) argues that the inclusion of spatial lag terms in the results obtained from spatial Durbin models incorporates the spatial dependence between the independent and dependent variables. Therefore, considering only the direct regression results would overlook the marginal effects of the independent variables on the dependent variable, leading to biased estimation [45]. To address the heterogeneity in the scope and subjects of spatial effects, LeSage (2009) decomposes the impact of independent variables on the dependent variable in spatial Durbin models into direct, indirect, and total effects [46]. The vector form of the spatial Durbin model can be represented as follows:
Y t = ( I n ρ W ) 1 ( X t β + W X t θ ) + ( I n ρ W ) 1 ε t *
Among them, the error term includes random error term, spatial effect and time effect, and the explained variable is relative to the kth explanatory variable in different spatial units at a specific time point. The partial differential matrix of ( x i k , i = 1 ,   2 ,   N ) is:
Y X 1 k , Y X 2 k Y X N k t = y 1 X 1 k y 1 X 2 k y 1 X N k y 2 X 1 k y 2 X 2 k y 2 X N k                         y N X 1 k y N X 2 k y N X N k = ( I n ρ W )     β k             w 12 θ k   w 1 N θ k w 21 θ k           β k         w 2 N θ k                                           w N 1 θ k   w N 2 β k   β k
In the above equation, the direct effect refers to the average of the diagonal elements of the partial differentiation matrix on the right-hand side, while the indirect effect is the average of the corresponding row or column of the off-diagonal elements of this matrix.
The prerequisite for using the spatial Durbin model to study the spillover effects of heterogeneous environmental regulation on the coordinated development of China’s water–energy–food system is the presence of spatial correlation between environmental regulation and the water–energy–food system. To examine this, the Moran’s I test is employed to test the existence of spatial correlation, and the results are presented in Table 2. The Moran’s statistics for formal environmental regulation, informal environmental regulation, and the level of coordination are all significantly positive, indicating that heterogeneous environmental regulation and the coordinated development of the water–energy–food system are not randomly (uniformly) distributed in space but exhibit obvious clustering characteristics and positive spatial correlation.
The LM test indicates that using spatial econometric models is more appropriate than using non-spatial econometric models. The Wald_SDM/SAR value and LR_SDM/SAR value both pass the significance test at the 1% level, rejecting the null hypothesis that the Space Durbin model can degenerate into a spatial autoregressive model. The Wald_SDM/SEM value and LR_SDM/SEM value also pass the significance test at the 1% level, rejecting the null hypothesis that the Space Durbin model can degenerate into a spatial error model. Therefore, this paper uses the Space Durbin model that simultaneously fixes time and studies individuals as the empirical model. The test results are shown in Table 3. Due to space limitations, Table 3 only reports the test results based on geographic distance matrix.

3.3.2. Construction of Influence Mechanism Model

The implementation of environmental regulations can enhance the level of ecological environmental protection and resource utilization efficiency, reduce environmental pollution, and emissions, thereby attracting foreign enterprises to invest in China. Foreign investment brings advanced environmental protection technology and management experience, which can improve the level of environmental protection through technology transfer and innovation [47]. Environmental regulations can require companies to adopt more environmentally friendly measures in the production process, reducing pollution and minimizing damage to the ecological environment. The improvement in environmental governance capabilities has led to the improvement of China’s ecological environment, increasing the stability and reliability of the investment environment for foreign-funded enterprises in China and attracting more foreign investment [48]. Strict control and supervision of companies have been imposed through environmental regulations, and companies that fail to meet environmental standards may face substantial fines and compensation costs [49]. At the same time, the government provides rewards and support policies such as tax incentives to companies that comply with environmental standards. Enterprises that meet environmental requirements will be more competitive and attract more foreign investment. Based on the above analysis, this study examines the mechanism by which environmental regulations promote foreign direct investment and the coordinated development of the water–energy–food system. The proposed mediation model is presented in Equation (18).
L n F D I i t = β 0 + β 1 L n E R i t + L n X i t + ϵ t + μ i
In the equation, LnFDI represents the logarithm of foreign direct investment, while LnER represents the logarithm of environmental regulations, which include both formal and informal regulations. X is the control variable, including industrial structure upgrading (LnAIS), trade exports (LnTEX), urbanization (LnURB), foreign investment (LnFDI), and population size (LnPOP). ϵ t represents time fixed effects, and μ i represents individual fixed effects.
Formal environmental regulations require companies to assume environmental responsibilities, including compliance emissions, waste treatment, and environmental risk management. This forces companies to improve their environmental management level by adopting cleaner, energy-saving, and environmentally friendly production methods, promoting industrial structure upgrading [50]. To comply with regulations, companies may need to invest in environmental governance facilities, pollution prevention technologies, and clean energy to meet environmental standards. Informal environmental regulations can shape consumer preferences and increase demand for environmentally friendly products and services in the market [51]. As consumers become more concerned about environmentally friendly products and brands, companies must accelerate the adjustment of their industrial structure to develop and produce more environmentally friendly and sustainable products. Industrial structure upgrades can promote the application of green production methods, reducing negative impacts on water resources, energy, and the environment. By strengthening research and development and promoting clean production processes and low-carbon production methods, water resources, energy consumption, waste, and pollutant emissions can be reduced, achieving sustainable development of water resources, energy, and food production. Based on the above analysis, this study examines the mechanism by which environmental regulations promote the coupled and coordinated development of the water–energy–food system through industrial structure upgrading, and the proposed mediation effect model is shown in Equation (19).
L n A I S i t   =   β 0   +   β 1 L n E R i t + L n X i t + ϵ t + μ i
In the equation, LnAIS represents the logarithm of industrial structure upgrading, while LnER represents the logarithm of environmental regulations, which include both formal and informal regulations. X is the control variable, including industrial structure upgrading (LnAIS), trade exports (LnTEX), urbanization (LnURB), foreign investment (LnFDI), and population size (LnPOP). ϵ t represents time fixed effects, and μ i represents individual fixed effects.

3.4. Data Source

The annual data for this study are collected from 30 provinces (municipalities and regions) in China from 2003 to 2020, excluding the sample data from the Tibet region due to the severe level of data missing. The primary sources of data for this study include “China Statistical Yearbook”, “China Regional Economic Yearbook”, “China Industrial Statistical Yearbook”, “China Environmental Yearbook”, and “China Energy Statistical Yearbook”. Some data are also sourced from the EPS database, the website of the National Bureau of Statistics, and the China Statistical Information Network. The data on pollution tax and fees for calculating environmental regulations are obtained from the Wind database. Since the earliest available data on investment in environmental pollution control in the statistical yearbooks is from 2003, the starting period for this study is set as 2003.

4. Results

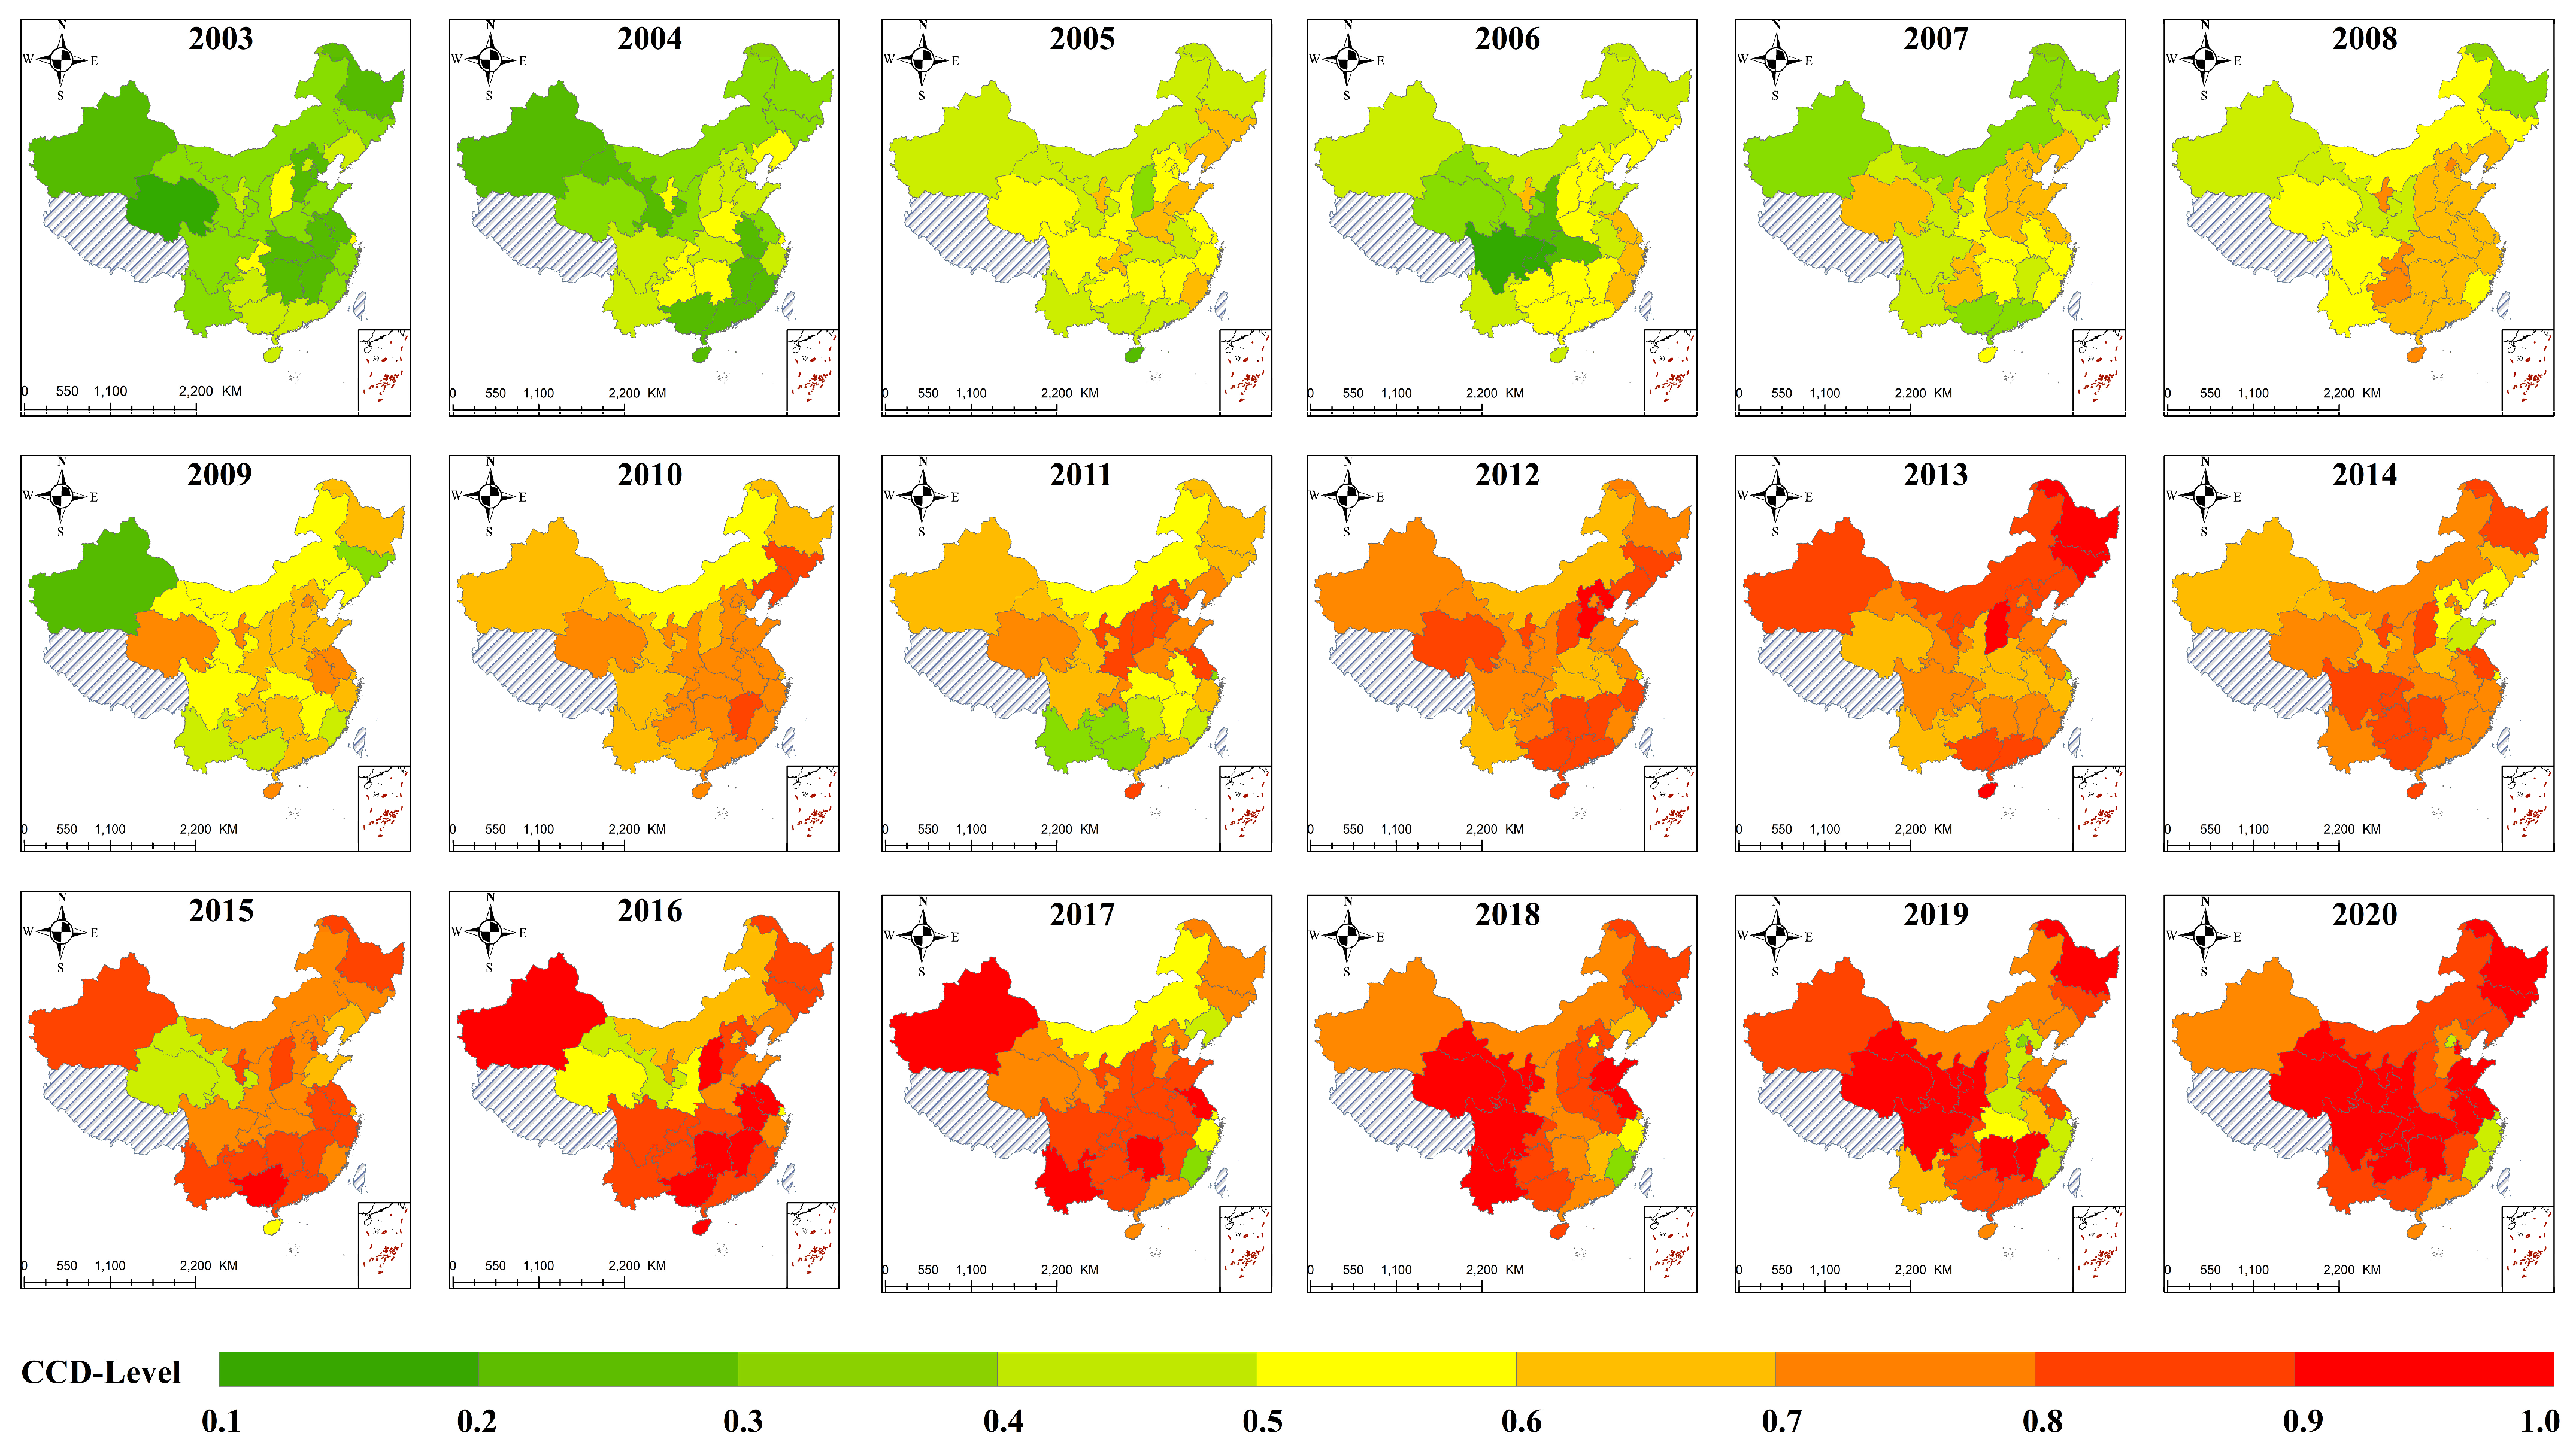
4.1. Analysis of Spatiotemporal Evolution of WEF System Coupling and Coordination Development in China

The degree of coupling model and coupled coordination model were used to measure the coupling and coordination degrees of the WEF system in China from 2003 to 2020. The results are shown in Figure 1. Overall, the coupling and coordination index of the WEF system at the provincial level in China has shown a steady upward trend, except for a slight decline in 2010–2011 and 2013–2014. This indicates that the regional connections and coordination levels of the provincial-level WEF system in China are gradually increasing. The average degree of coupling and coordination has increased from 0.210 in 2003 to 0.911 in 2020, with an annual average growth rate of 10.51%. This means that the coordination level of the provincial-level WEF system in China has changed from a state of serious imbalance to a state of high-quality coordination, showing the gradual strengthening of regional connections. There are significant differences in the level of coupling and coordination of WEF systems between regions, with overall distribution patterns of south > north and east > west. In 2003, most regions in the country were in a state of serious imbalance in terms of coordinated development, with only Hainan in a state of barely coordinated development. From 2003 to 2010, the index of coupling and coordination of the WEF system increased rapidly, with an annual average growth rate of 20.10%, and the overall coordination level significantly improved. In 2010, all regions in the country had a level of coupling and coordination at or above a barely coordinated state, with Jilin, Liaoning, and Jiangxi in a state of good coordination. In 2011, due to persistent drought and less precipitation, the comprehensive evaluation index of the water resources subsystem decreased significantly (Figure 1), which led to a slight decline in the coupling and coordination degree of the WEF system. From 2015 to 2020, the overall growth rate slowed significantly, with an average annual growth rate of 4.01%.
The spatiotemporal evolution of the WEF system coupling and coordination shows that there are significant differences in development between different regions in China. The theory of regional development differences holds that geographic, economic, social, and other factors lead to differences in the development status and level between different regions. These differences can be reflected in aspects such as economic growth, income distribution, industrial structure, human resources, and infrastructure. There are significant differences in the level of coupling and coordination of the WEF system between regions, with an overall distribution pattern of south > north and east > west. This reflects the difference in economic development levels between regions in China and is consistent with the core region relatively developed viewpoint in the theory of regional development differences.

4.2. The Impact of Heterogeneous Environmental Regulations on the Spatial Metric Estimation Results of WEF System

Table 4 reports the impact of heterogeneous environmental regulations on the coupling coordination degree of the WEF system. W1 represents the geographic distance spatial weighting matrix, while W2 represents the economic geography distance spatial weighting matrix. From the first two columns of Table 3, it can be observed that the coefficient of formal environmental regulation (LnER1) is significantly positive at the 1% level under the estimation of both spatial weighting matrices. This indicates that formal environmental regulation helps mitigate the negative impact of external shocks on the local WEF system, thereby promoting the coupling and coordinated development of the local WEF system.
From the last two columns of Table 4, it can be seen that the coefficient of informal environmental regulation (LnER2) is significantly positive at the 10% level under the estimation of both spatial weighting matrices. This suggests that informal environmental regulation also contributes to mitigating the negative impact of external shocks on the local WEF system, thereby enhancing its coupling and coordinated development.

4.3. Analysis of "Neighborhood" Effect of Heterogeneous Environmental Regulation

Table 5 reports the decomposition results of the coupling coordination effects of heterogeneous environmental regulations on the WEF system. W1 represents the geographic distance spatial weighting matrix, while W2 represents the economic geography distance spatial weighting matrix. From the first two columns of Table 5, it can be observed that formal environmental regulation (LnER1) not only significantly promotes the coupling coordination degree of the local WEF system but also has a significant positive spillover effect on neighboring areas. The coefficients are significantly positive at the 5% level under the estimation of both spatial weighting matrices, indicating significant positive spatial spillover effects of formal environmental regulation. This suggests that formal environmental regulation helps promote the coupling and coordinated development of the local and neighboring WEF systems.
From the last two columns of Table 5, it can be seen that informal environmental regulation (LnER2) not only significantly promotes the coupling coordination degree of the local WEF system but also has a significant positive spillover effect on neighboring areas. The coefficients are significantly positive at the 5% level under the estimation of both spatial weighting matrices, indicating significant positive spatial spillover effects of informal environmental regulation. This suggests that informal environmental regulation helps promote the coupling and coordinated development of the local and neighboring WEF systems.

4.4. The Results of the Mechanism Analysis

Table 6 reports the mechanism by which heterogeneous environmental regulations promote the coupling and coordinated development of the WEF system. The dependent variables in the first two columns of Table 6 are the logarithm of foreign direct investment. Analysis of the first two columns of Table 6 shows that both formal and informal environmental regulations can effectively promote the level of foreign direct investment, with coefficients passing the hypothesis test at the 1% significance level. Among them, the coefficient of formal environmental regulation on foreign direct investment is higher than that of informal environmental regulation, indicating that formal environmental regulation has a stronger driving force.
The dependent variables in the last two columns of Table 6 are the logarithm of industrial structure upgrading. Analysis of the last two columns of Table 6 shows that both formal and informal environmental regulations can effectively promote industrial structure upgrading, with coefficients passing the hypothesis test at the 1% significance level. Among them, the coefficient of formal environmental regulation on industrial structure upgrading is higher than that of informal environmental regulation, indicating that formal environmental regulation has a stronger driving force.

5. Discussion

By studying the spatiotemporal evolution trend of the coupling and coordination degree of the WEF system in 30 provinces of China from 2003 to 2020, as well as the impact of heterogeneous environmental regulations on the coupling and coordination degree of the WEF system, we found a significant growth trend in the coupling and coordination degree of the WEF system during the research period. Formal and informal environmental regulations have significant positive spatial spillover effects on the coordinated development of the WEF system. Compared with informal environmental regulation, formal environmental regulation has a stronger promotional effect on the coordinated development of the WEF system. Moreover, foreign direct investment and industrial structure are the key paths for heterogeneous environmental regulations to promote the coupling and coordination development of the WEF system.
This paper analyzes the impact of different types of environmental regulations on the coupling and coordination development of the WEF system, clarifying the key paths for environmental regulations to promote the coupling and coordination development of the WEF system. By studying the different impacts of formal and informal environmental regulations, policy suggestions and practical experience can be provided to promote cooperation and communication between regions, and potential solutions can be provided to improve the efficiency of environmental regulation policy guidance and promote the sustainable use of water, energy, and food resources. This research is of great significance for government decision making, policy formulation, and the development of strategies that ensure the long-term balance and resilience of China’s water–energy–food systems.
Since the proposal of location theory by Karl Wepman, the analysis of regional development differences has gradually expanded from geographical location to resource endowments, industrial structure, and policy orientation. The distribution pattern of the coupled coordination level of the WEF system in different regions can be explained from multiple levels such as economic development, geographical environment, and environmental regulatory policies. There are significant geographical differences in China’s conditions, with the western and southwestern regions either being in arid areas or mountainous areas with scarce water resources, which poses a restrictive impact on the development of the water–energy–food system [5]. Different regions have significant differences in energy and food resource endowments; for example, the western part of a region may be rich in water resources, coal, or oil and gas, while its eastern part is relatively poor. The imbalance in resource endowments leads to differences in energy supply and food production capacity, which in turn affects the coordination level of the system.
There are significant differences in the economic development stage and industrial structure in various regions of China. The eastern coastal areas are economically developed, highly industrialized, and have greater energy needs, but with scarce water resources [52]. Conversely, the western region is mainly agricultural-based with stronger food production capacity but relatively insufficient energy supply. This difference in development stage and industrial structure results in the water–energy–food system being poorly coordinated [53,54]. There are significant differences between southern and northern regions in water resource, energy, and food policies, with different investment and support efforts from the government, which directly impacts coupled coordination level of the system [37]. Differences also exist in China’s emphasis on water resources and environmental protection, with some areas facing serious issues such as water pollution and overexploitation of water resources, which limit the coordinated development of the water–energy–food system.
Formal environmental regulations provide guidance and constraints for the coordinated development of the WEF system. Relevant departments carry out systematic planning and regulation according to regulatory requirements to ensure balance and coordination among subsystems. At the same time, formal environmental regulations can also promote the coordinated development of the WEF system through economic incentives and market mechanisms. Informal environmental regulations are usually based on social customs and moral norms, which can guide the public in self-restraint regarding the use of water resources, energy, and food. The formation of informal environmental regulations requires a certain degree of consensus and increased awareness.
Compared to informal environmental regulations, formal environmental regulations have higher coefficients and significance, indicating that they exert a stronger force on the degree of coupling and coordination within the local WEF system. Formal environmental regulations are formulated and enforced by the government and have mandatory enforcement power. The government can constrain and supervise various sectors and enterprises to manage and utilize resources according to regulations through laws, regulations, and policies. This mandatory enforcement compels all stakeholders to actively participate and comply with the standards, thereby enhancing the overall coordination of the WEF system.
Formal environmental regulations can promote the establishment of cross-border cooperation mechanisms among neighboring regions. By establishing common environmental protection standards and resource management policies, neighboring regions can cooperate and negotiate to address shared challenges related to water resources, energy, and food. This cooperation mechanism can facilitate resource sharing and optimal allocation, promoting the coordinated development of the WEF system in neighboring regions. Some regions may be rich in water resources but relatively scarce in energy and food, while others may have the opposite situation. Through formal environmental regulations, neighboring regions can establish resource exchange and mutual assistance mechanisms, achieve optimal resource utilization through rational resource allocation and cooperative relationships, and promote coupled coordination development [55].
In an informal regulatory environment, neighboring regions can enhance cooperation through information sharing and experience transfer. Best practices in resource management, environmental protection, and agricultural production can be shared among regions to deepen understanding of issues, explore solutions, and learn from each other’s experiences within the framework of the WEF system. In an informal regulatory environment, market mechanisms can play a promoting role. Through free trade and supply–demand adjustment in the market, neighboring regions can allocate and exchange resources based on their resource endowments and demands. The role of market mechanisms can optimize resource allocation to some extent and promote the coordinated and harmonious development of the WEF system.
Formal environmental regulations have a stronger positive impact on the local WEF coupling and coordination than informal regulations, and their influence coefficients are more significant. Under the estimation of the geographical distance matrix, formal environmental regulations also have a greater impact on neighboring regions compared to informal regulations. However, when considering the economic factor, under the estimation of the economic geographical distance matrix, the impact of informal environmental regulations on neighboring regions is greater than that of formal environmental regulations, and the estimated coefficient is more significant. We believe that the reason behind this phenomenon may be the result of population interregional mobility, with economic factors being important drivers of population mobility. Based on this development, we believe that the economic development level between regions is an essential consideration in studying the impact of informal environmental regulations.
Formal environmental regulations exist in the form of laws and regulations, with clear constraints and enforceability. This provides legal protection for foreign investors, regulates their direct investment activities, ensures their legitimate rights and interests in economic activities, and reduces potential risks and uncertainties. In contrast, informal environmental regulations are often based on customs, conventions, or unwritten agreements, with weaker constraints and reliability. Formal environmental regulations often define investment conditions, procedures, and limitations through laws, policies, and institutions, enabling foreign investors to understand the legal framework and rules of the investment environment in advance and anticipate potential risks and limitations. This transparency and predictability help foreign investors formulate investment strategies and make informed decisions. Informal environmental regulations often lack clarity and predictability, and may involve subjectivity and variability, bringing uncertainties to foreign investment.
Formal environmental regulations, through government guidance and policy regulation, can effectively promote the upgrading of industrial structure. The government can use means such as laws, policies, and planning to clarify the direction, focus, and policy support for industrial development, guiding resources towards industries with high added value, technological intensity, and environmental friendliness. In comparison, informal environmental regulations often fail to provide clear government guidance and effective policy support, making it difficult to facilitate the orderly upgrading of industrial structure.
Formal environmental regulations, through mechanisms for industrial access and exit, can effectively regulate market competition and drive the optimization of industrial structure. The government can set relevant entry conditions and standards to restrict the growth of inefficient, highly polluting, or excessive production capacity, thereby promoting the transition of industrial structure towards a more competitive and sustainable direction [39]. At the same time, the government can also encourage non-compliant enterprises to exit the market through policy regulation and financial support, in order to meet the requirements of industrial upgrading. Informal environmental regulations often fail to provide effective mechanisms for access and exit, leading to inadequate constraints and guidance in industrial structure adjustment.
It is necessary to balance the development of formal and informal environmental regulations. The impact of formal environmental regulations should outweigh that of informal environmental regulations, but this does not mean that the government needs to focus all attention on formal environmental regulations. Formal environmental regulations have mandatory enforcement, and violations will face legal sanctions. This form of regulation can compel enterprises and individuals to comply with environmental laws and regulations, ensuring the effective implementation of environmental standards. However, formal environmental regulations require enterprises to invest substantial resources in compliance transformation, equipment updates, and monitoring. This may increase operational costs for businesses, particularly for small and medium-sized enterprises, potentially posing a burden [56].
Informal environmental regulations encourage the participation of stakeholders in environmental protection and promote environmental awareness and responsibility among enterprises and the public. This participation can enhance information sharing, cooperation, and negotiation, improving the effectiveness of environmental management [57]. However, informal environmental regulations also lack legal enforceability, making it difficult to effectively supervise and punish non-compliant enterprises and individuals, potentially leading to environmental violations [58].

6. Conclusions and Policy Recommendations

6.1. Conclusions

Water resources, food, and energy are interdependent and mutually restrictive key resources. Water resources are the foundation of agricultural irrigation and energy production, food is the cornerstone of human survival and social stability, and energy is the driving force behind economic development and social progress. The coordinated development of these three areas is crucial to ensuring people’s livelihood needs and achieving sustainable economic development. We used data from 30 provinces in China from 2003 to 2020 and analyzed the impact of heterogeneous environmental regulation on the coupling coordination of the WEF system using a coupled coordination degree model. The study found that:
(1)
Overall, the coupling coordination index of the provincial-level WEF system in China showed a stable upward trend except for a slight decline in 2010–2011 and 2013–2014. During the research period, the regional coupling coordination level showed significant improvement. In 2003, most of the regions in the country were in a state of severe imbalance in the WEF system coupling coordination index. After decades of development, in 2020, the coupling coordination index of the WEF system in most regions of the country is in a state of high-quality coordination. The level of coupling coordination of the WEF system in various regions varies greatly, showing a distribution pattern of south > north and east > west overall.
(2)
Formal environmental regulations and informal environmental regulations both have significant positive effects on the coupling coordination development of the WEF system and also have significant positive spatial spillover effects. Heterogeneous environmental regulations can not only promote the coupling coordination development of the local WEF system but also promote the coupling coordination development of the neighboring WEF system. Compared with informal environmental regulations, formal environmental regulations have a stronger impact.
(3)
Foreign direct investment and industrial structure upgrading are important paths for environmental regulation to promote the coupling coordination development of the WEF system. Both formal and informal environmental regulations can promote the coupling coordination development of the WEF system by promoting foreign direct investment and industrial structure upgrading. Among them, formal environmental regulation has a greater impact than informal environmental regulation.

6.2. Policy Recommendations

Based on the above research conclusions and considering the reality of China’s development, this paper proposes the following policy recommendations:
First, optimize regional planning and strengthen cross-regional cooperation. Scientific and reasonable regional planning should be carried out according to the water resources, energy, and land conditions in different regions. Consider factors such as the ecological carrying capacity, climate conditions, and agricultural suitability of each region to ensure the coordinated development of water resources, energy, and food production. Cooperation between different regions should be strengthened to jointly promote the coordinated development of the WEF system of water resources, energy, and food. Establish cross-regional cooperation mechanisms and joint prevention and control mechanisms to jointly formulate and implement cross-regional planning, policies, and measures.
Second, enhance public participation awareness, attach importance to environmental protection propaganda and education, and improve the public’s awareness and sense of responsibility for environmental management and protection. Environmental issues are usually complex system projects involving multiple factors and stakeholders. Strengthening public participation awareness can incorporate more voices into the decision-making process, making environmental policies more comprehensive, scientific, and democratic. Public participation can provide more information, perspectives, and suggestions, promote diversified decision making on environmental issues, and also provide more scientific basis for governments and relevant departments to formulate more effective environmental policies and measures.
Third, guide regions to make reasonable environmental regulation measures. The central government should strengthen the top-level design of environmental regulation, establish clear policy frameworks and laws and regulations, and provide overall guidance and support to local governments. The central government should also strengthen the coordination and cooperation between adjacent regions in environmental protection policies and ecological law enforcement. Through strengthening information communication and establishing cooperation mechanisms, the strategy of ecological environment joint prevention and control should be implemented to jointly address cross-regional environmental issues. Adjacent regions should implement integrated environmental governance, jointly formulate emission constraints and environmental management standards. By cooperating and sharing technology, resources, and experience, the goal of coordinated management and unified standards can be achieved, and the positive spatial spillover effect of environmental regulation can be leveraged.

Author Contributions

Conceptualization, S.Z. and Z.L.; methodology, S.Z. and Z.L.; software, Y.L. and X.F.; validation, S.Z. and Z.L.; formal analysis, S.Z., Y.L. and X.F.; data curation, Y.L. and X.F. and Z.L.; writing—original draft preparation, S.Z., Z.L., Y.L. and X.F.; writing—review and editing, S.Z., Z.L., Y.L. and X.F.; visualization, S.Z., Z.L. and X.F.; supervision, S.Z. and Y.L.; project administration, S.Z.; and funding acquisition, S.Z. All authors have read and agreed to the published version of the manuscript.

Funding

This research was supported by the National Social Science Foundation of China (NSSFC) under Grant (No. 19GBL183).

Institutional Review Board Statement

Not applicable.

Informed Consent Statement

Not applicable.

Data Availability Statement

The data used in the study are available from the corresponding authors upon request.

Conflicts of Interest

The authors declare that they have no conflicts of interest.

References

  1. Abbas, A.; Waseem, M.; Ullah, W.; Zhao, C.; Zhu, J. Spatiotemporal analysis of meteorological and hydrological droughts and their propagations. Water 2021, 13, 2237. [Google Scholar] [CrossRef]
  2. Elahi, E.; Khalid, Z.; Zhang, Z. Understanding farmers’ intention and willingness to install renewable energy technology: A solution to reduce the environmental emissions of agriculture. Appl. Energy 2022, 309, 118459. [Google Scholar] [CrossRef]
  3. Rocholl, M.; Giljum, S.; Behrens, A.; Schlegelmilch, K. Factor X and the EU: How to Make Europe the Most Resource and Energy Efficient Economy in the World; Aachen Foundation Kathy Beys: Aachen, Germany, 2006. [Google Scholar]
  4. Yan, X.; Fang, L.; Mu, L. How does the water-energy-food nexus work in developing countries? An empirical study of China. Sci. Total Environ. 2020, 716, 134791. [Google Scholar] [CrossRef]
  5. Wang, Q.; Li, S.; He, G.; Li, R.; Wang, X. Evaluating sustainability of water-energy-food (WEF) nexus using an improved matter-element extension model: A case study of China. J. Clean. Prod. 2018, 202, 1097–1106. [Google Scholar] [CrossRef]
  6. Chen, D.; Lu, X.; Hu, W.; Zhang, C.; Lin, Y. How urban sprawl influences eco-environmental quality: Empirical research in China by using the Spatial Durbin model. Ecol. Indic. 2021, 131, 108113. [Google Scholar] [CrossRef]
  7. Li, Z.; Zhou, Y.; Li, K.; Xiao, H.; Cai, Y. The spatial effects of city-level water-energy nexus: A case study of Hebei Province, China. J. Clean. Prod. 2021, 310, 127497. [Google Scholar] [CrossRef]
  8. Xu, S.; He, W.; Shen, J.; Degefu, D.M.; Yuan, L.; Kong, Y. Coupling and coordination degrees of the core water–energy–food nexus in China. Int. J. Environ. Res. Public Health 2019, 16, 1648. [Google Scholar] [CrossRef]
  9. Sun, C.; Hao, S. Research on the competitive and synergistic evolution of the water-energy-food system in China. J. Clean. Prod. 2022, 365, 132743. [Google Scholar] [CrossRef]
  10. Deng, H.M.; Wang, C.; Cai, W.J.; Liu, Y.; Zhang, L.X. Managing the water-energy-food nexus in China by adjusting critical final demands and supply chains: An input-output analysis. Sci. Total Environ. 2020, 720, 137635. [Google Scholar] [CrossRef]
  11. Sukhwani, V.; Shaw, R.; Mitra, B.K.; Yan, W. Optimizing Food-Energy-Water (FEW) nexus to foster collective resilience in urban-rural systems. Prog. Disaster Sci. 2019, 1, 100005. [Google Scholar] [CrossRef]
  12. Srigiri, S.R.; Dombrowsky, I. Governance of the Water-Energy-Food Nexus for an Integrated Implementation of the 2030 Agenda: Conceptual and Methodological Framework for Analysis; Discussion Papers; Deutsches Institut für Entwicklungspolitik (DIE): Bonn, Germany, 2021. [Google Scholar] [CrossRef]
  13. Franz, M.; Schlitz, N.; Schumacher, K.P. Globalization and the water-energy-food nexus–Using the global production networks approach to analyze society-environment relations. Environ. Sci. Policy 2018, 90, 201–212. [Google Scholar] [CrossRef]
  14. Sušnik, J. Data-driven quantification of the global water-energy-food system. Resour. Conserv. Recycl. 2018, 133, 179–190. [Google Scholar] [CrossRef]
  15. Hailemariam, W.G.; Silalertruksa, T.; Gheewala, S.H.; Jakrawatana, N. Water–energy–food nexus of sugarcane production in Ethiopia. Environ. Eng. Sci. 2019, 36, 798–807. [Google Scholar] [CrossRef]
  16. Shao, S.; Hu, Z.; Cao, J.; Yang, L.; Guan, D. Environmental regulation and enterprise innovation: A review. Bus. Strategy Environ. 2020, 29, 1465–1478. [Google Scholar] [CrossRef]
  17. Lu, S.; Zhang, X.; Peng, H.; Skitmore, M.; Bai, X.; Zheng, Z. The energy-food-water nexus: Water footprint of Henan-Hubei-Hunan in China. Renew. Sustain. Energy Rev. 2021, 135, 110417. [Google Scholar] [CrossRef]
  18. Motte, H.; Vanneste, S.; Beeckman, T. Molecular and environmental regulation of root development. Annu. Rev. Plant Biol. 2019, 70, 465–488. [Google Scholar] [CrossRef] [PubMed]
  19. Peng, H.; Shen, N.; Ying, H.; Wang, Q. Can environmental regulation directly promote green innovation behavior?—Based on situation of industrial agglomeration. J. Clean. Prod. 2021, 314, 128044. [Google Scholar] [CrossRef]
  20. Aragòn-Correa, J.A.; Marcus, A.A.; Vogel, D. The effects of mandatory and voluntary regulatory pressures on firms’ environmental strategies: A review and recommendations for future research. Acad. Manag. Ann. 2020, 14, 339–365. [Google Scholar] [CrossRef]
  21. Du, L.; Tian, M.; Cheng, J.; Chen, W.; Zhao, Z. Environmental regulation and green energy efficiency: An analysis of spatial Durbin model from 30 provinces in China. Environ. Sci. Pollut. Res. 2022, 29, 67046–67062. [Google Scholar] [CrossRef]
  22. Danish; Ulucak, R.; Khan, S.U.D.; Baloch, M.A.; Li, N. Mitigation pathways toward sustainable development: Is there any trade-off between environmental regulation and carbon emissions reduction? Sustain. Dev. 2020, 28, 813–822. [Google Scholar] [CrossRef]
  23. Song, M.; Zhao, X.; Shang, Y. The impact of low-carbon city construction on ecological efficiency: Empirical evidence from quasi-natural experiments. Resour. Conserv. Recycl. 2020, 157, 104777. [Google Scholar] [CrossRef]
  24. Schmidt, J.J.; Matthews, N. From state to system: Financialization and the water-energy-food-climate nexus. Geoforum 2018, 91, 151–159. [Google Scholar] [CrossRef]
  25. Pahl-Wostl, C. Governance of the water-energy-food security nexus: A multi-level coordination challenge. Environ. Sci. Policy 2019, 92, 356–367. [Google Scholar] [CrossRef]
  26. D’Amore, G.; Di Vaio, A.; Balsalobre-Lorente, D.; Boccia, F. Artificial intelligence in the water–energy–food model: A holistic approach towards sustainable development goals. Sustainability 2022, 14, 867. [Google Scholar] [CrossRef]
  27. Raya-Tapia, A.Y.; Cansino-Loeza, B.; Sánchez-Zarco, X.G.; Ramírez-Márquez, C.; Martín, M.; Ponce-Ortega, J.M. A spatial and temporal assessment of resource security in the water, energy, food and waste nexus in Spain. Sustain. Prod. Consum. 2023, 39, 109–122. [Google Scholar] [CrossRef]
  28. Xu, H.; Wang, Y.W.; Zhang, Z.Y.; Gao, Y.; Zhang, D. Coupling mechanism of water-energy-food and spatiotemporal evolution of coordinated development in the Yellow River Basin. Resour. Sci. 2021, 43, 2526–2537. [Google Scholar] [CrossRef]
  29. Zhang, C.; Chen, X.; Li, Y.; Ding, W.; Fu, G. Water-energy-food nexus: Concepts, questions and methodologies. J. Clean. Prod. 2018, 195, 625–639. [Google Scholar] [CrossRef]
  30. Zhang, T.; Tan, Q.; Yu, X.; Zhang, S. Synergy assessment and optimization for water-energy-food nexus: Modeling and application. Renew. Sustain. Energy Rev. 2020, 134, 110059. [Google Scholar] [CrossRef]
  31. Chang, Y.; Li, G.; Yao, Y.; Zhang, L.; Yu, C. Quantifying the water-energy-food nexus: Current status and trends. Energies 2016, 9, 65. [Google Scholar] [CrossRef]
  32. El-Gafy, I. Water–food–energy nexus index: Analysis of water–energy–food nexus of crop’s production system applying the indicators approach. Appl. Water Sci. 2017, 7, 2857–2868. [Google Scholar] [CrossRef]
  33. Al-Ansari, T.; Korre, A.; Nie, Z.; Shah, N. Development of a life cycle assessment tool for the assessment of food production systems within the energy, water and food nexus. Sustain. Prod. Consum. 2015, 2, 52–66. [Google Scholar] [CrossRef]
  34. Zhu, Y.; Zhang, C.; Fang, J.; Miao, Y. Paths and strategies for a resilient megacity based on the water-energy-food nexus. Sustain. Cities Soc. 2022, 82, 103892. [Google Scholar] [CrossRef]
  35. Deng, C.; Wang, H.; Gong, S.; Zhang, J.; Yang, B.; Zhao, Z. Effects of urbanization on food-energy-water systems in mega-urban regions: A case study of the Bohai MUR, China. Environ. Res. Lett. 2020, 15, 044014. [Google Scholar] [CrossRef]
  36. Sun, C.; Yan, X.; Zhao, L. Coupling efficiency measurement and spatial correlation characteristic of water–energy–food nexus in China. Resour. Conserv. Recycl. 2021, 164, 105151. [Google Scholar] [CrossRef]
  37. Qi, Y.; Farnoosh, A.; Lin, L.; Liu, H. Coupling coordination analysis of China’s provincial water-energy-food nexus. Environ. Sci. Pollut. Res. 2022, 29, 23303–23313. [Google Scholar] [CrossRef] [PubMed]
  38. Sušnik, J.; Masia, S.; Indriksone, D.; Brēmere, I.; Vamvakeridou-Lydroudia, L. System dynamics modelling to explore the impacts of policies on the water-energy-food-land-climate nexus in Latvia. Sci. Total Environ. 2021, 775, 145827. [Google Scholar] [CrossRef] [PubMed]
  39. Wang, Y.; Shen, N. Environmental regulation and environmental productivity: The case of China. Renew. Sustain. Energy Rev. 2016, 62, 758–766. [Google Scholar] [CrossRef]
  40. Chen, L.; Li, W.; Yuan, K.; Zhang, X. Can informal environmental regulation promote industrial structure upgrading? Evidence from China. Appl. Econ. 2022, 54, 2161–2180. [Google Scholar] [CrossRef]
  41. Su, J.; Su, K.; Wang, S. Does the digital economy promote industrial structural upgrading?—A test of mediating effects based on heterogeneous technological innovation. Sustainability 2021, 13, 10105. [Google Scholar] [CrossRef]
  42. Verna, D.E.; Minton, M.S.; Ruiz, G.M. Trade exports predict regional ballast water discharge by ships in San Francisco Bay. Front. Mar. Sci. 2021, 8, 638955. [Google Scholar] [CrossRef]
  43. Demena, B.A.; Afesorgbor, S.K. The effect of FDI on environmental emissions: Evidence from a meta-analysis. Energy Policy 2020, 138, 111192. [Google Scholar] [CrossRef]
  44. Chen, D.; Hu, W.; Li, Y.; Zhang, C.; Lu, X.; Cheng, H. Exploring the temporary and spatial effects of city size on regional economic integration: Evidence from the Yangtze River Economic Belt in China. Land Use Policy 2023, 132, 106770. [Google Scholar] [CrossRef]
  45. Anselin, L.; Florax, R.J.G.M. New directions in spatial econometrics: Introduction. In New Directions in Spatial Econometrics; Springer: Berlin/Heidelberg, Germany, 1995; pp. 3–18. [Google Scholar]
  46. LeSage, J.; Pace, R.K. Introduction to Spatial Econometrics; Chapman and Hall/CRC: Boca Raton, FL, USA, 2009. [Google Scholar]
  47. Fahad, S.; Bai, D.; Liu, L.; Baloch, Z.A. Heterogeneous impacts of environmental regulation on foreign direct investment: Do environmental regulation affect FDI decisions? Environ. Sci. Pollut. Res. 2022, 29, 5092–5104. [Google Scholar] [CrossRef] [PubMed]
  48. Zhang, J.; Fu, X. FDI and environmental regulations in China. J. Asia Pac. Econ. 2008, 13, 332–353. [Google Scholar] [CrossRef]
  49. Yang, J.; Guo, H.; Liu, B.; Shi, R.; Zhang, B.; Ye, W. Environmental regulation and the pollution haven hypothesis: Do environmental regulation measures matter? J. Clean. Prod. 2018, 202, 993–1000. [Google Scholar] [CrossRef]
  50. Xiong, B.; Wang, R. Effect of environmental regulation on industrial solid waste pollution in China: From the perspective of formal environmental regulation and informal environmental regulation. Int. J. Environ. Res. Public Health 2020, 17, 7798. [Google Scholar] [CrossRef] [PubMed]
  51. Du, S.; Liu, J.; Fu, Z. The impact of village rules and formal environmental regulations on farmers’ cleaner production behavior: New evidence from China. Int. J. Environ. Res. Public Health 2021, 18, 7311. [Google Scholar] [CrossRef] [PubMed]
  52. Zheng, D.; An, Z.; Yan, C.; Wu, R. Spatial-temporal characteristics and influencing factors of food production efficiency based on WEF nexus in China. J. Clean. Prod. 2022, 330, 129921. [Google Scholar] [CrossRef]
  53. Hua, E.; Wang, X.; Engel, B.A.; Qian, H.; Sun, S.; Wang, Y. Water competition mechanism of food and energy industries in WEF Nexus: A case study in China. Agric. Water Manag. 2021, 254, 106941. [Google Scholar] [CrossRef]
  54. Xie, Y.; Hou, Z.; Liu, H.; Cao, C.; Qi, J. The sustainability assessment of CO2 capture, utilization and storage (CCUS) and the conversion of cropland to forestland program (CCFP) in the Water–Energy–Food (WEF) framework towards China’s carbon neutrality by 2060. Environ. Earth Sci. 2021, 80, 1–17. [Google Scholar] [CrossRef]
  55. Wu, H.; Hao, Y.; Ren, S. How do environmental regulation and environmental decentralization affect green total factor energy efficiency: Evidence from China. Energy Econ. 2020, 91, 104880. [Google Scholar] [CrossRef]
  56. Song, Y.; Yang, T.; Zhang, M. Research on the impact of environmental regulation on enterprise technology innovation—An empirical analysis based on Chinese provincial panel data. Environ. Sci. Pollut. Res. 2019, 26, 21835–21848. [Google Scholar] [CrossRef] [PubMed]
  57. Zhang, M.; Huang, M. Study on the impact of informal environmental regulation on substantive green innovation in China: Evidence from PITI disclosure. Environ. Sci. Pollut. Res. 2023, 30, 10444–10456. [Google Scholar] [CrossRef] [PubMed]
  58. Ma, Y.; Cao, H.; Ma, Y.; Wu, S. Does technological innovation reduce water pollution intensity in the context of informal environmental regulation? Asia-Pac. J. Chem. Eng. 2020, 15, e2493. [Google Scholar] [CrossRef]
Figure 1. Spatio-temporal evolution diagram of WEF system coupling coordination.
Sustainability 16 00818 g001
Table 1. Evaluation Index System for interprovincial WEF System coupling coordination and development.
Target LevelIndicatorsAttribute
Water Resources SubsystemPer capita water consumption
Total available water resources per capita+
Proportion of ecological water usage+
Proportion of domestic water usage
Total precipitation+
Water productivity+
Irrigated area+
Wastewater discharge volume
Water consumption per RMB 10,000 GDP
Water consumption per RMB 10,000 industrial value added
Energy SubsystemEnergy production+
Energy consumption
Energy self-sufficiency rate+
Per capita energy consumption
Energy industry investment+
Coal consumption ratio
Total renewable energy production+
Energy structure+
Energy consumption per RMB 10,000 GDP
Energy consumption per RMB 10,000 industrial value added
Food SubsystemPer capita grain production+
Grain yield per unit area+
Per capita grain consumption
Total power of agricultural machinery+
Crop sown area+
Fertilizer use per unit of arable land
Natural population growth rate
Rural residents’ disposable income+
Table 2. Global Moran’s I test results.
LnER1LnER2LnCCD
W1W2W1W2W1W2
20030.085 ***0.203 ***0.072 ***0.456 ***0.093 ***0.322 ***
20040.085 ***0.246 ***0.084 ***0.453 ***0.093 ***0.328 ***
20050.081 ***0.292 ***0.088 ***0.442 ***0.087 ***0.315 ***
20060.085 ***0.298 ***0.075 ***0.451 ***0.087 ***0.311 ***
20070.080 ***0.353 ***0.095 ***0.430 ***0.084 ***0.308 ***
20080.077 ***0.353 ***0.108 ***0.422 ***0.087 ***0.312 ***
20090.083 ***0.272 ***0.083 ***0.435 ***0.087 ***0.316 ***
20100.084 ***0.238 ***0.034**0.428 ***0.087 ***0.311 ***
20110.084 ***0.292 ***0.085 ***0.418 ***0.086 ***0.307 ***
20120.087 ***0.176 ***0.068 ***0.419 ***0.084 ***0.298 ***
20130.087 ***0.139 ***0.055 ***0.416 ***0.080 ***0.288 ***
20140.086 ***0.117 ***0.079 ***0.412 ***0.081 ***0.290 ***
20150.082 ***0.139 ***0.057 ***0.411 ***0.086 ***0.315 ***
20160.082 ***0.116 ***0.036**0.409 ***0.090 ***0.336 ***
20170.083 ***0.152 ***0.061 ***0.407 ***0.094 ***0.346 ***
20180.079 ***0.169 ***0.072 ***0.396 ***0.097 ***0.355 ***
20190.081 ***0.174 ***0.077 ***0.400 ***0.099 ***0.364 ***
20200.072 ***0.174 ***0.078 ***0.371 ***0.100 ***0.372 ***
Note: *** p < 0.01.
Table 3. Test of applicability of Space Durbin model.
Test TypeLnER1LnER2
LM testLM_error204.724 ***768.337 ***
Robust_LM_error85.693 ***347.215 ***
LM_lag352.600 ***725.004 ***
Robust_LM lag233.569 ***303.883 ***
LR testLR_SDM/SAR102.65 ***110.65 ***
LR_SDM/SEM121.06 ***127.68 ***
Wald testWald_SDM/SAR44.61 ***68.84 ***
Wald_SDM/SEM128.32 ***136.75 ***
Fixed effects testLR_both/ind106.92 ***105.94 ***
LR_both/time866.75 ***854.32 ***
Note: *** p < 0.01.
Table 4. The impact of heterogeneous environmental regulations on the coupling coordination degree of the WEF system.
VariablesW1W2W1W2
LnER10.087 ***0.125 ***
(8.190)(7.640)
LnER20.015 **0.014 *
(2.020)(1.780)
LnAIS0.356 ***0.0340.402 ***0.310 ***
(11.580)(1.160)(12.630)(10.550)
LnTEX−0.100 ***0.116 ***−0.092 ***−0.068 ***
(−7.760)(10.090)(−6.820)(−4.950)
LnURB0.0060.571 ***0.0380.056
(0.160)(10.350)(1.020)(1.480)
LnFDI0.030 ***0.089 ***0.040 ***0.034 ***
(4.280)(8.810)(5.350)(4.510)
LnPOP0.422 ***0.743 ***0.386 ***0.345 ***
(5.000)(34.440)(4.330)(3.670)
Spatial−rho0.054 ***0.339 **0.101 ***0.632 ***
sigma2_e0.006 ***0.029 ***0.007 ***0.008 ***
R−sq0.57870.91950.32900.7418
Individual fixedYesYesYesYes
Time fixedYesYesYesYes
N540540540540
Note: * p < 0.1, ** p < 0.05, *** p < 0.01.
Table 5. Effects of “neighborhood” effect of heterogeneous environmental regulation.
VariablesW1W2W1W2
LR_Direct0.088 ***0.122 ***0.016 **0.019 **
(7.980)(7.150)(2.06)(2.41)
LR_Indirect0.221 **0.156 **0.122 **0.203 ***
(2.380)(1.990)(2.06)(4.47)
LR_Total0.308 ***0.278 ***0.114 **0.222 ***
(3.220)(3.630)(2.23)(4.69)
Control variablesYesYesYesYes
R-sq0.57870.91950.32900.7418
Individual fixedYesYesYesYes
Time fixedYesYesYesYes
Log-likelihood552.8741172.9610577.2304524.2584
N540540540540
Note: ** p < 0.05, *** p < 0.01.
Table 6. Results of mechanism of action.
VariablesLnFDILnAIS
LnER10.630 ***0.419 ***
(4.06)(9.32)
LnER20.337 ***0.066 ***
(5.54)(3.19)
LnAIS−0.140−0.024
(−0.98)(−0.18)
LnTEX0.225 ***0.334 ***0.045 **0.042 **
(3.62)(6.42)(2.34)(2.32)
LnURB3.292 ***3.127 ***0.324 ***0.295 ***
(15.04)(14.35)(4.07)(3.46)
LnFDI−0.013−0.003
(−0.98)(−0.18)
LnPOP1.312 ***1.223 ***−0.093 ***−0.142 ***
(22.07)(20.15)(−3.68)(−5.37)
R−sq0.7320.7390.5240.455
Individual fixedYesYesYesYes
Time fixedYesYesYesYes
N540540540540
Note: ** p < 0.05, *** p < 0.01.
Disclaimer/Publisher’s Note: The statements, opinions and data contained in all publications are solely those of the individual author(s) and contributor(s) and not of MDPI and/or the editor(s). MDPI and/or the editor(s) disclaim responsibility for any injury to people or property resulting from any ideas, methods, instructions or products referred to in the content.

