Article

Empirical Estimation of Landslide Runout Distance Using Geometrical Approximations in the Colombian North–East Andean Region

by
Daniel Camilo Roman Quintero
1,
Jose David Ortiz Contreras
1,
Mauricio Alberto Tapias Camacho
1 and
Edgar Ricardo Oviedo-Ocaña
2,*
1
Departamento de Ingeniería Civil y Agrícola, Facultad de Ingeniería, Universidad Nacional de Colombia, Carrera 30 No. 45-03 Bogotá D.C. Colombia Edificio 453, Oficina 201, Bogotá 111321, Colombia
2
Escuela de Ingeniería Civil, Facultad de Ingenierías Físico-Mecánicas, Universidad Industrial de Santander, Carrera 27 Calle 9, Bucaramanga 680002, Colombia
*
Author to whom correspondence should be addressed.
Sustainability 2024, 16(2), 793; https://doi.org/10.3390/su16020793
Submission received: 6 December 2023 / Revised: 10 January 2024 / Accepted: 12 January 2024 / Published: 17 January 2024

Abstract

:
Landslides represent geological hazards wherein a part of a slope loses its static equilibrium and initiates movement. Once this movement begins, it becomes crucial to evaluate the land-slide runout distance (LRD). Currently, there exist numerous tools for estimating LRD, among which geometrical approximations stand as one of the most popular. These empirical models are particularly useful for wide-scale studies, aiding in the scale-down of the problem by identifying the critical areas. This study examines the application of geometrical approximations in the Colombian north–east Andean region. Within this area, a sampling of 49 was conducted using photogrammetric techniques, enabling the morphometrical characterization of each study unit. The results showcase the relationship between geometrical characteristics and LRD in the studied area, considering both land use and geomorphological settings. By exploiting these relationships, the study compares the estimation of LRD using various empirical models, many of which are already employed by practitioners within the studied region. For instance, the relationships in literature display a relative error in the estimation ranging around −50% and 100%. Furthermore, this research proposes new relationships for estimating LRD, enhancing the error estimations in a range between 0% and 50%, highlighting both the advantages and limitations of such empirical estimations. Consequently, it contributes new data to enrich the field of LRD studies.

1. Introduction

Landslides are catastrophic events in which a portion of the terrain loses its static equilibrium and enters a state of motion. Those events are part of the natural formation of the earth’s surface [1], impacting the sustainable development of human societies, especially in mountainous regions. In cases such as the Colombian northeast Andes, the damages reported in infrastructure, environment, and economy have risen to approximately USD 1.3 million since the beginning of the 21st century, affecting approximately 20,000 m of civil works, 1300 homes and buildings, and almost 1000 hectares of productive land, with more than 60% of the records reported as moderate to severe damage [2]. In fact, some studies in this context point out that the cumulative effects of landslides affecting roads and vital lines constitute the first cause of loss of infrastructure and human lives among all geohazards [3].
The factors causing landslide triggering are relatively well known. The link between triggering conditions, such as intense rainfall and earthquakes, combined with high antecedent water content in the soil, the present state of the material, and human interventions may render a slope unstable [4,5]. In any case, once a movement starts, its development can take place in different ways. This is important for vulnerability and risk assessment because many landslides reach farther distances from their source. In those cases, commonly classified as slides, flows, or avalanches [6], the affected elements may not be only those close to the failure zone, but also those in the middle of the runout distance, measured from the crown of the main scarp to the furthest block, characterizing the distance affected by the landslide.
The runout and deposition of landslides is a complex process affected by several conditions, including the rheological properties of the material, the entrainment/deposition of material dragged/expelled from the flow base, and topographical barriers [7,8]. There are physically based models proposing analytical tools to model in detail the runout and deposition phases of landslides. Such models rely on detailed mechanical properties to assess in a detailed way the landslide runout distance [9,10,11,12]. Nonetheless, the application of this kind of modeling at catchment or regional scales could be impractical. For instance, the rheological and mechanical parameters of such models are very case-specific, making them difficult to upscale, and the computational burden is commonly unaffordable in conventional computers. In those cases, simpler tools, such as the empirical models, are available to model the landslide runout distance [13]. In that sense, the geometrical approximations offer an alternative and a practical solution to estimate the landslide runout distance with few input data.
The geometric approximations are a family of empirical models that utilize casual relationships among certain variables that are easy to collect. Many models relate the slope inclination and the landslide volume with the runout distance [14]. For instance, Scheidegger (1973) [15] found early relationships between the ratio of the total vertical drop, the runout distance, and the triggered landslide volume, gathering data from different studies. Tianchi (1983) [16] confirmed such a relationship in the cases of major rock falls in the Alps. Nicoletti and Sorriso-Valvo, (1991) [17] proposed different relationships characterizing the flow path of 40 rock avalanches. Moreover, Corominas (1996) [18] studied a dataset of 204 landslides and confirmed the general form of the abovementioned relationships and proposed, rather than one single relationship gathering all cases, many specific relationships depending on the landslide type and the constraints imposed by the flow path. Furthermore, in some cases, such models are an income for more complex empirical models, some relying on the triggered volume [19] and others on the topography of the studied area [20].
The present paper aims to validate and propose empirical tools for the estimation of landslide runout distance exclusively based on geometrical approximations, specifically for landslides occurring in the north–east Andean region. To do that, the study contributes a novel dataset of 49 landslides involving typical cases surveyed in the northeastern Andean region of Colombia. It comprises a wide landslide-prone area of about 3000 km2, affecting 37 municipalities within certain geological, geomorphological, land use, and cover settings. The morphometric variables were carefully surveyed using unmanned air vehicle (UAV) technologies and measured using photogrammetric techniques, determining the dimensions of each landslide, and thus establishing the runout distance for each study unit. Photogrammetric studies are a fast and reliable tool for mapping the earth’s surface at basin (and even slope) scale studies applied to landslide recognition and measurement [21,22]. Moreover, some of the models that are presented in the literature [13,14,23] and are currently being used by practitioners [24] are validated in the light of the measurements taken from the photogrammetric studies. Finally, new empirical relationships are also proposed to be considered in the estimation of the landslide runout distance. Thus, a new database containing the abovementioned information is here presented to enrich the empirical studies of landslide runout distances.

2. Materials and Methods

2.1. Study Area

The studied area corresponds to a region located in the northeastern Andean region of Colombia (South America). In particular, a wide landslide-prone area in the western cordillera. The precise location of the studied area is shown in Figure 1.
The Colombian Geological Survey collects the inventory of landslides occurring in Colombian territory [2]. Specifically, the landslide inventory corresponds to a detailed description of any singular landslide event. In a landslide inventory, the following data is recorded: space and time occurrence of the event, land use and cover, causes of the landslide triggering, activity and type of movement, geological and geomorphological description of the area, morphometrical aspects of the landslide, damages, and on-site risk assessment. According to the landslide inventory, more than 1500 landslides are registered in the region of interest.
The impacted area is composed of 34 municipalities affected by landslides in roads, houses, crops, farms, mines, forest reserves, recreational areas, industrial zones, and others in very different geological and geomorphological setups. On the one hand, the geomorphological environments correspond predominantly to structural and denudational ones, containing geomorphological units such as Spurs, Sierras, Hills, Escarpments, and Slopes in different dispositions. On the other hand, the geological origin and composition of the materials involved in the landslides show a great variety. There we found materials of igneous origin from the Mesozoic–Jurassic, and metamorphic of low intensity such as the Bucaramanga Gneiss, terrigenous sedimentary origins such as the Sandstones of the Aguardiente formation, Siltstones of the Mercedes formation, and from chemical sedimentary origins such as the Chert rocks of the La Luna formation and younger sedimentary rocks such as those of the Guadalupe formation and the Chipaque formation [25].
From a socioeconomic point of view, the reported damages belong mainly to three main kinds of soil use: infrastructure, environment, and economy with associated costs reported approximately USD 1.3 million since the beginning of the 21st century and affecting approximately 20,000 m of civil works, 1300 homes and buildings, and almost 1000 hectares of productive land, with more than 60% of the records reported as moderate to severe damage [2]. Figure 2 summarizes the proportions of damages reported in the entire region of interest according to different land uses.
A data subset of landslides belonging to different subregions in the study area was deeply analyzed as a part of the records and review areas for the analysis in the present study. Specifically, the area corresponds to the municipalities of Bucaramanga, Girón, Floridablanca, El Playón, Guaca, San Andrés and Carcasí in the department of Santander between 6°30′00″ N–7°30′00″ N and 73°24′00″ W–72°24′0″ W. Figure 3 shows the subregion located in the study area and the location and amount of the analyzed events. The sampling of the study units in the dataset was achieved in different steps. Firstly, from the public inventory records managed by the Colombian Geological Survey [2], some major zones grouping around 2000 landslide inventory records were identified. Then cluster sampling was applied to the records, to randomly select some units suitable to be further studied. The cluster sampling is a well-known technique commonly used in geographically related sampling problems. It applies random selection to heterogeneous study units within homogeneous clusters [26]. In this case, this technique was useful for selecting clusters with a consistent number of heterogeneous study units; around 400 events were randomly sampled and further analyzed. Afterward, a multicriteria decision evaluation was applied to the previously sampled data to select the most suitable study locations according to experts’ criteria [27]. Thus, and on the basis of the photogrammetric studies, a total of 49 landslides were identified and used in the present study.

2.2. Landslide Magnitude and Runout Distance

The magnitude of landslides corresponds to the amount of material involved in the process and can be characterized by measuring different characteristic magnitudes of the movement. Amongst the most common are the length ( L r , L d ), width ( W r , W d ), and the depth ( D r , D d ) of the soil mass at rupture and displaced stages (i.e., before and after the displacement). Figure 4 shows schematically the parts of a landslide that are identifiable. The subscripts r and d indicate the magnitudes at rupture and displaced stages respectively.
The morphometric characterization may lead to the estimation of the magnitude of landslides, commonly referred to as a function of the triggered volume. The estimation of the volume of displaced material was done using Equation (1).
V = ( 1 6 π D r W r L r ) f exp
In Equation (1) D r , W r , L r are the depth, width, and length of the mass at the rupture stage respectively, and f exp is an expansion factor which depend on the material type but assumed here as 1.5.
The runout distance (L) is known as the maximum distance directly affected by the material dragged by a landslide. It is defined as the horizontal projection of the line that joins the highest part of the landslide with its outermost part, as sketched in Figure 4. It is in fact, geometrically related to the total or maximum drop height (H). Indeed, the angle of the line joining the highest and the outermost part of the landslide is known as the reach angle, α = tan 1 ( H / L ) [18]. The reach angle is an inverse measurement of the efficiency of the landslide movement; the ratio L/H accounts for the degradation of the potential energy into other kinds of non-conservative energy states [7]. In this study, we will refer to both the linear measurement of L and the ratio H/L, so it indicates the lesser the ratio, the higher the efficiency of the movement.
According to different authors, landslides with relatively large volumes have a smaller reach angle than small-volume landslides [7,15]. Specifically, it has been verified the dependence of the runout distance of rock avalanches on the initial height, the regularity of the surface, and the volume of rocks involved in the movement [14].

2.3. Photogrammetric Landslide Surveys

Photogrammetric studies were carried out with two types of UAVs. From one side, a DJI-Phantom 4 Pro quadcopter was used exclusively for relatively small areas where landing or take-off needed to be done on a restricted surface. On the other side, an eBee X fixed-wing drone covers greater areas in comparison to the quadcopter, but landing conditions with gentle and wide plane areas were available.
A total of 15 missions were planned and executed, taking images from the study area, georeferencing, and recording the flight height from the take-off location to compute the relative distances from the images.
The sampled images were processed and ortho-corrected using the standard processing and postprocessing procedures through the software Pix4Dmapper, which can be consulted in detail within the software documentation [28]. Figure 5 shows the results of two ortho-corrected images, processed with a set of imagery taken from two flights: one of a quadcopter in May 2017 (Figure 5a) and another one of a fixed-wing drone in September 2020 (Figure 5b). In both cases, the study units contained in the affected area are identified, as well as the area affected by the landslides. Maps containing the other study units can be found in the supplementary materials to this paper.
The products of each image analysis are ortho-corrected images, point clouds containing geospatial information, and Digital Elevation Models (DEM). The products shown in Figure 5 have resolutions ranging from 5 to 30 cm per pixel, depending on the flight height. Such tolerance of the resulting DEM for these cases is good enough to take measures for landslide inventory applications in the present study, considering that the smallest events reach a runout distance of a couple of tens of meters and unleash a volume of no less than 300 m3.
The landslide characteristic magnitudes D r , W r , L r as well as H and L were measured matching the ortho-corrected images with the DEM.

2.4. Geometrical Approximations for the Empirical Estimation of Landslide Runout Distances

The correlation between the runout distance (L) and the geometric characteristics of the study units, specifically V and α 2 , was assessed using various methods. Graphical representations, such as 90% and 95% confidence ellipses, were constructed alongside a linear regression. An F-test within an analysis of variance (ANOVA) was conducted to validate the null hypothesis, which posits that the slope of the regression line equals zero. A zero slope implies the absence of any correlation among the data.
Some of the geometrical approximations used here follow the form of Equation (2). Such a functional format is used by many authors in some renowned studies [15,16,17,18,29].
log ( H L ) = a + b log ( V )
In Equation (2), a and b are empirical coefficients calibrated for different datasets. However, other models were applied showing good agreement between morphometrical data and the runout distance, as the one proposed by Hunter and Fell (2003), with the form of Equation (3), where α 2 is the downslope angle, and a and b are the calibration parameters. The parameters of any model are reported in Table 1.
H L = a + b tan α 2

3. Results

3.1. Land Use, Land Cover and Geological Settings of the Sampled Landslides

Figure 6 shows the average percentage of incidence of each coverage and land use in the sample analyzed with the average estimate of the H/L ratio in each category of land use/cover. It could be seen that the sampled landslides affect areas in which land cover goes from crops to forests, passing through anthropomorphic environments as constructions as well. However, it is notable that most of the events occur in regions with bushes and low vegetation. Considering the ratio H/L as an inverse measurement of landslide efficiency, the movements developed in bushes and low vegetation show a relatively low efficiency, while the efficiency of movements recorded in grasslands, crops, and water bodies is consistently higher. This is consistent with the development of the physical processes leading to high/low volumes of landslides developing high/low runout distances; the influence of such type of vegetation may influence landslide runout efficiency.
Figure 7 shows each geological unit in which the studied landslides evolve and associates it with the average runout distance and the mean slope angle for each lithology. The sample of studied landslides, in general terms, mobilize materials involving soils and rocks product of five superficial geological units. Table 2 resumes the main characteristics (acronyms and descriptions) associated with each geological unit taken from the geological map studied on a scale of 1:100,000 [25]. It could be seen that the runout distance of the landslides associated with the Bocas formation, in which the present landslides mostly involve the products of gray to brownish-gray sandstones, show a consistently greater runout distance than that of the other materials in the sample, with a slope inclination relatively equal to or less than other cases with a consistently shorter runout distance.
As seen in Figure 7, the slope inclination does not seem to play an important role in the development of post-failure mechanics of the landslide in the sampled cases. In any case, the conjunction of slope inclination and geological setup of the area may be important to assess landslide susceptibility rather than its runout distance. Anyways, the preliminary results presented here serve to establish the limitations of the final derived conclusions.

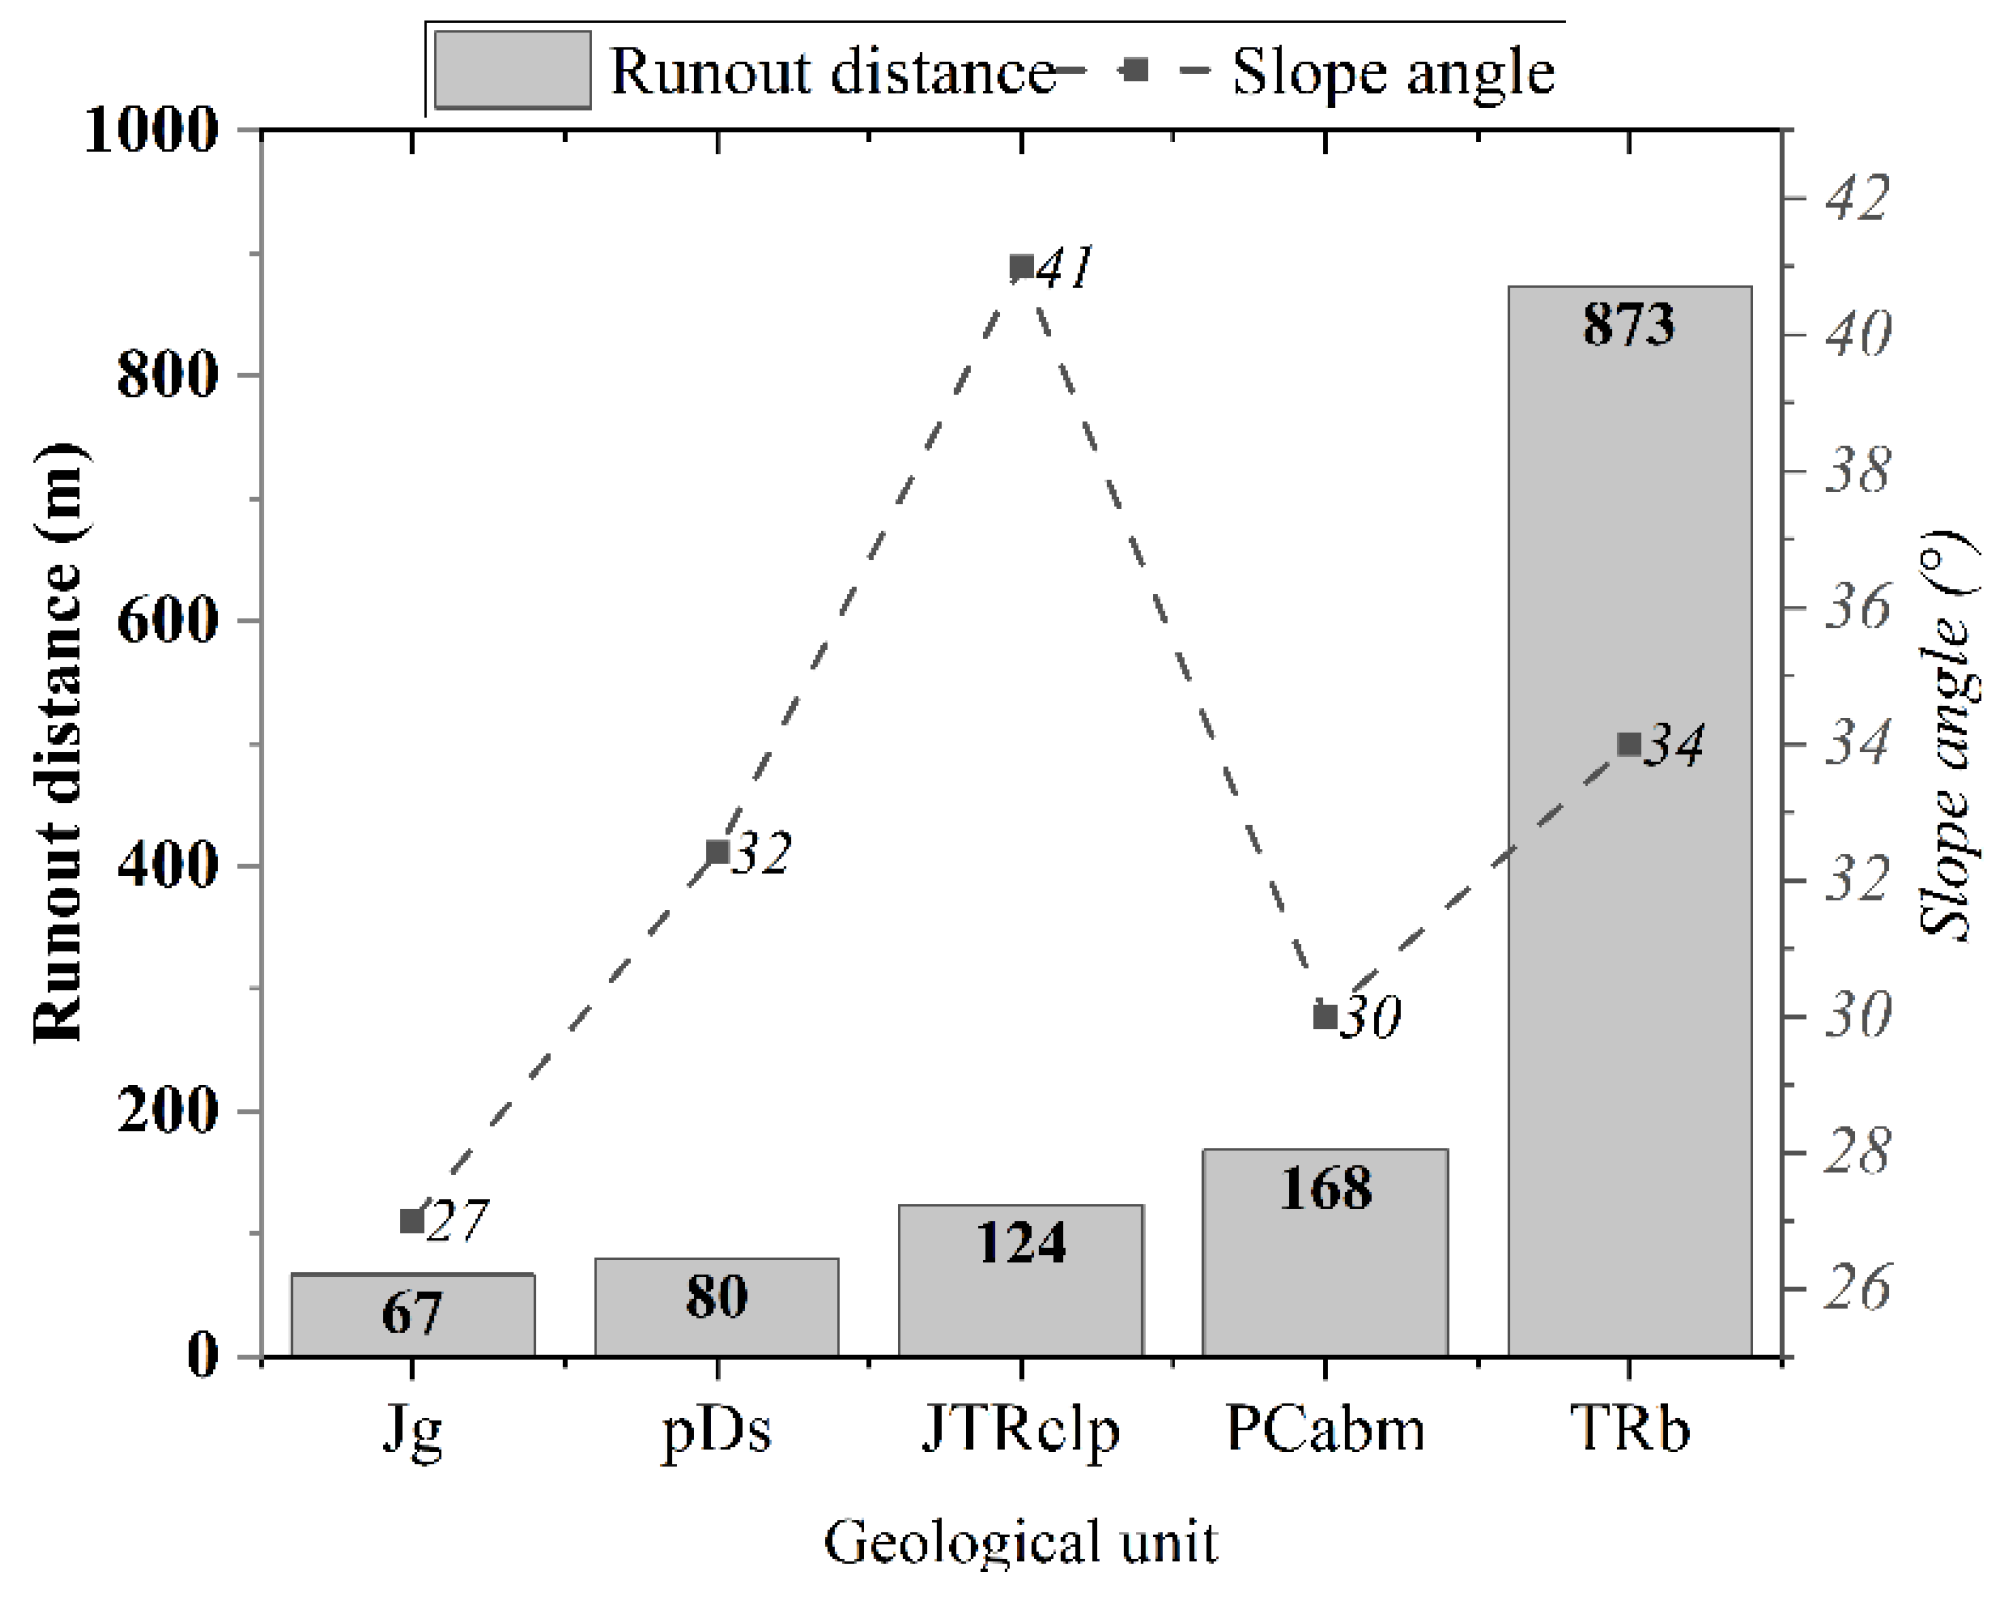
3.2. Runout Distance and Slope Inclination Angle

Figure 8 shows the relationship between the ratio H/L and the tangent of the slope inclination angle ( α 2 ). A clear trend indicates a direct relationship between the variables in the dataset under study. An ANOVA test was conducted to test the null hypothesis, which posited that the slope was equal to zero (no relationship among the data). With a 90% confidence level, there is statistical evidence to reject this hypothesis.
The relationship between L, H and α 2 from currently studied dataset can be seen in Table 3. In the same table, other models reported in the literature are shown. The determination coefficient ( R 2 ) in any case, corresponds to its own dataset of reference.
Figure 9 shows the relative error (RE) on the estimation of L from each relationship reported in Table 3. RE was estimated as expressed in Equation (4), where L obs is the observed runout distance and L est is the estimated runout distance. Thus, a negative RE means an underestimation of L while a positive one means an overestimation of L.
RE = L obs L est L obs
As could be seen in Figure 9, the RE for all models ranges mostly from (underestimations) about 30% to (overestimations) about 60%. The linear relationship H/L vs. tan ( α 2 ) found in the current study, through the minimization of the squared error, tends to underestimate the runout distance. An overestimation of L is preferred since the underestimation could lead to catastrophic results in engineering practice. In that way, the model that performs in a better way in the studied dataset is the one developed by [29] for confined flows. Anyways, it is interesting to note that even if the model proposed by [30] underestimates the runout distance in many cases, the RE ranges in a quite narrow strip.

3.3. Runout Distance and Landslide Volume

The landslide volume was estimated based on the characteristic distances: Failure depth ( D r ), width ( W r ), and length ( L r ). The morphometry of the cases under study in the sample confirms that extreme cases occur for events with larger dimensions. Figure 10 shows that while most landslide events have low relative dimensions, a minority (the extreme cases) show relatively high dimensions.
Figure 11a shows the relationship between L and the planimetric area affected by the boundaries of the landslides, A. Conversely, Figure 11b shows the relationship between L and the total triggered volume of the landslides, V. It is evident that both measures exhibit a comparable scatter concerning the resulting runout distance. Consequently, the correlation in both instances (area and volume) is graphically assessed using confidence ellipses constructed at 90% and 95% confidence levels for the logarithmic values of A, V, and L. Comparing the shapes of these ellipses, a discernible trend emerges in both cases. However, the correlation appears stronger in the case of the relationship between L and V, as indicated by the elongation of the ellipse along its main axis. In fact, the linear fitting shows a trend in both cases, with a Pearson’s R coefficient of 0.3 in the case of the correlation between log 10 A and log 10 L and 0.7 in the case of the correlation between log 10 V and log 10 L .
The slopes of the fitted linear trends were evaluated using an ANOVA test, assuming the null hypothesis that the slope equals zero. In both cases, the analysis concluded that, with a 90% confidence level, there is significant statistical evidence to reject the null hypothesis. The p-values were 0.04 for the A-L relationship and 0.0001 for the V-L relationship, confirming a stronger correlation between V and L compared to that between A and L.
Figure 12 shows the performance of different models aiming at estimate L through the relationships expressed in Equation (2) and Table 1. Here once again, most of the models (except the one proposed by Corominas (1996)) tend to underestimate the runout distance. In that sense, an empirical relationship derived from the studied data is proposed here in the form of Equation (5).
L = a + b V
where a = 172.16 and b = 0.0005 . The data show a strong correlation with an R 2 = 0.9 . Anyways, as seen in Figure 12, the performance in terms of the RE is similar to the model proposed by [18].

3.4. Other Multilinear Empirical Models for the Estimation of the Runout Distance

Figure 13 shows the RE on the estimations done using two empirical models. The first model corresponds to the one proposed by Finlay et al. (1999), with data gathered in landslides that occurred in fill slopes. This relationship depends on landslide volume, its width, and its fall height. The second model is empirically derived from the data under study with a bilinear equation in the form of (6). The model parameters are shown in Table 4.
L = a · H tan ( α 2 ) + b V + c
In this case, both models are mostly overestimating the runout distance. Anyways while there is up to 20% of underestimated runout distance using the first model, the relationship here proposed maintains most of the estimations ranging from errors between 0% and 50%. It is always desirable to never underestimate the LRD. Such kinds of misestimations could lead to catastrophic events as such kinds of landslides could be very destructive.
The latter is a promising result if one considers the practical applications of such relationships. The geometrical approximations are empirical relationships for the estimation of landslide runout distances catching casual relationships among the data. In that way, many uncertainties still remain in the estimations; the RE for every estimation proves it. Anyways, they are a simple tool with powerful potential. When correctly used, they may lead to the identification of high mobility landslides with clear possibilities of application in the catchment to regional scale analyses, where detailed information is usually lacking, giving important insights for downscaling, and doing deeper studies using more detailed models.

4. Discussion

A set of 49 landslides were surveyed to analyze its runout distance. The cases under study developed as slides or flows involving materials from different geological and geomorphological setups constraining the presented dataset to some specific characteristics. However, the surveyed landslides cover a wide range of lithologies, finding materials from metamorphic to sedimentary units showing a particular behavior in the cases located on the Bocas formation involving materials originated from fine-grained sandstones and mudstones, for which the runout distance is considerably greater than the other cases related to the dimensions of the landslides triggered on that geological set. Anyhow, the studied cases belong to different land uses and covers. The most efficient movements are those characterized by a low ratio between the total vertical runout height with the runout distance (H/L). In the studied sample, the most efficient movements are related to land/use covers associated with agricultural farming (crops and pastures) and water body places. Instead, naturally vegetated places such as forests, even covered with low vegetation and bushes, exhibit a lower efficiency. Rather than the land use/cover, the studied cases take place in steep slope mountains, i.e., slopes with inclination angles above 30° regardless of the geomorphological settings and land cover conditions.
It has been shown that, in the studied dataset, there is a relationship between the slope inclination angle and the landslide runout distance (LRD). Within the dataset, a wide range of slope inclinations ranging between 12° and 55° are analyzed. The present study shows a relationship within the data displaying an R2 = 0.32. It can be seen that this relationship mostly underestimates the LRD; the relative error (RE) on the estimations varies roughly around −40% and −10%. Validating some empirical models already proposed in the scientific literature (and even available for the use of practitioners [24], confirms that slope inclination is a key feature in the LRD assessment. In particular, the models proposed in [29,30] offer an interesting estimation of the landslide runout distance, given its maximum vertical drop (H) and the slope inclination ( α 2 ). The model proposed in [29] built for confined flows showed a higher correlation (R2 = 0.85) in its original dataset. However, it is interesting to note that in this case, this is the model that shows less underestimations in the LRD, showing a RE ranging mostly around −20% and 40%. Nonetheless, from the same point of view, the model proposed in [30] shows a slightly restrained variation, with RE ranging mostly between −10% and 25%. Moreover, the relationship between landslide volume and runout distance has also been confirmed within the studied dataset, with landslide volumes ranging within several orders of magnitude (from 102 m3 to 107 m3). Different models show different performances in terms of RE. Most of the models strongly underestimate the LRD, and its application should be restricted or avoided according to the evidence. It should be noted that it is preferable to overestimate the runout distance as it may help to identify critical scenarios to attend to possible disastrous situations. In that way, the model proposed in [18] by Corominas (1996) shows a good performance, given the landslide volume and the maximum drop height (H), showing RE mostly ranging between 0% and 100%. Anyways in the present study, a linear relationship is presented, with similar estimations as the previously mentioned model but without the need of introducing H. This is important because this feature could further simplify the assessment of the LRD as the value of H might be a priori unknown in many cases. Finally, some other relationships can be established using multilinear regressions. In the present study, an empirical relationship between the slope inclination, landslide volume, and runout distance is presented. In light of the RE, the empirical relationship proposed here shows that most of the overestimations within the dataset concentrate around 0% and 50%. It is important to note that, given the uncertainty in estimating the LRD with models based on geometrical approximations, it is highly recommended to avoid underestimations because such misestimations may lead to catastrophic events. Such results are relevant to landslide risk assessment as the LRD is an integral part of the identification of high-risk zones; empirical evidence is the fundamental factual observation of any hazard or risk assessment methodology [31].

5. Conclusions

The current study presented some insights into the application of empirical models based on geometrical approximations to estimate the landslide runout distance in a context in the north–east Andean region. A database of 49 events with detailed morphometric information is here presented. An analysis of the runout distance has been done in light of the relationships presented between the landslide-triggered volume, the slope inclination, and the runout distance in the studied events in the database, deriving the following conclusions:
  • The study provided detailed morphometric data and established a clear relationship between slope inclination angle, landslide volume, and landslide runout distance for the data analyzed from the northeast Andean region of Colombia. Comparisons with existing empirical models confirmed these results and emphasized the significance of slope inclination in estimating landslide runout. Additionally, the correlation between landslide volume and runout distance was confirmed, showcasing their importance in predicting landslide behavior;
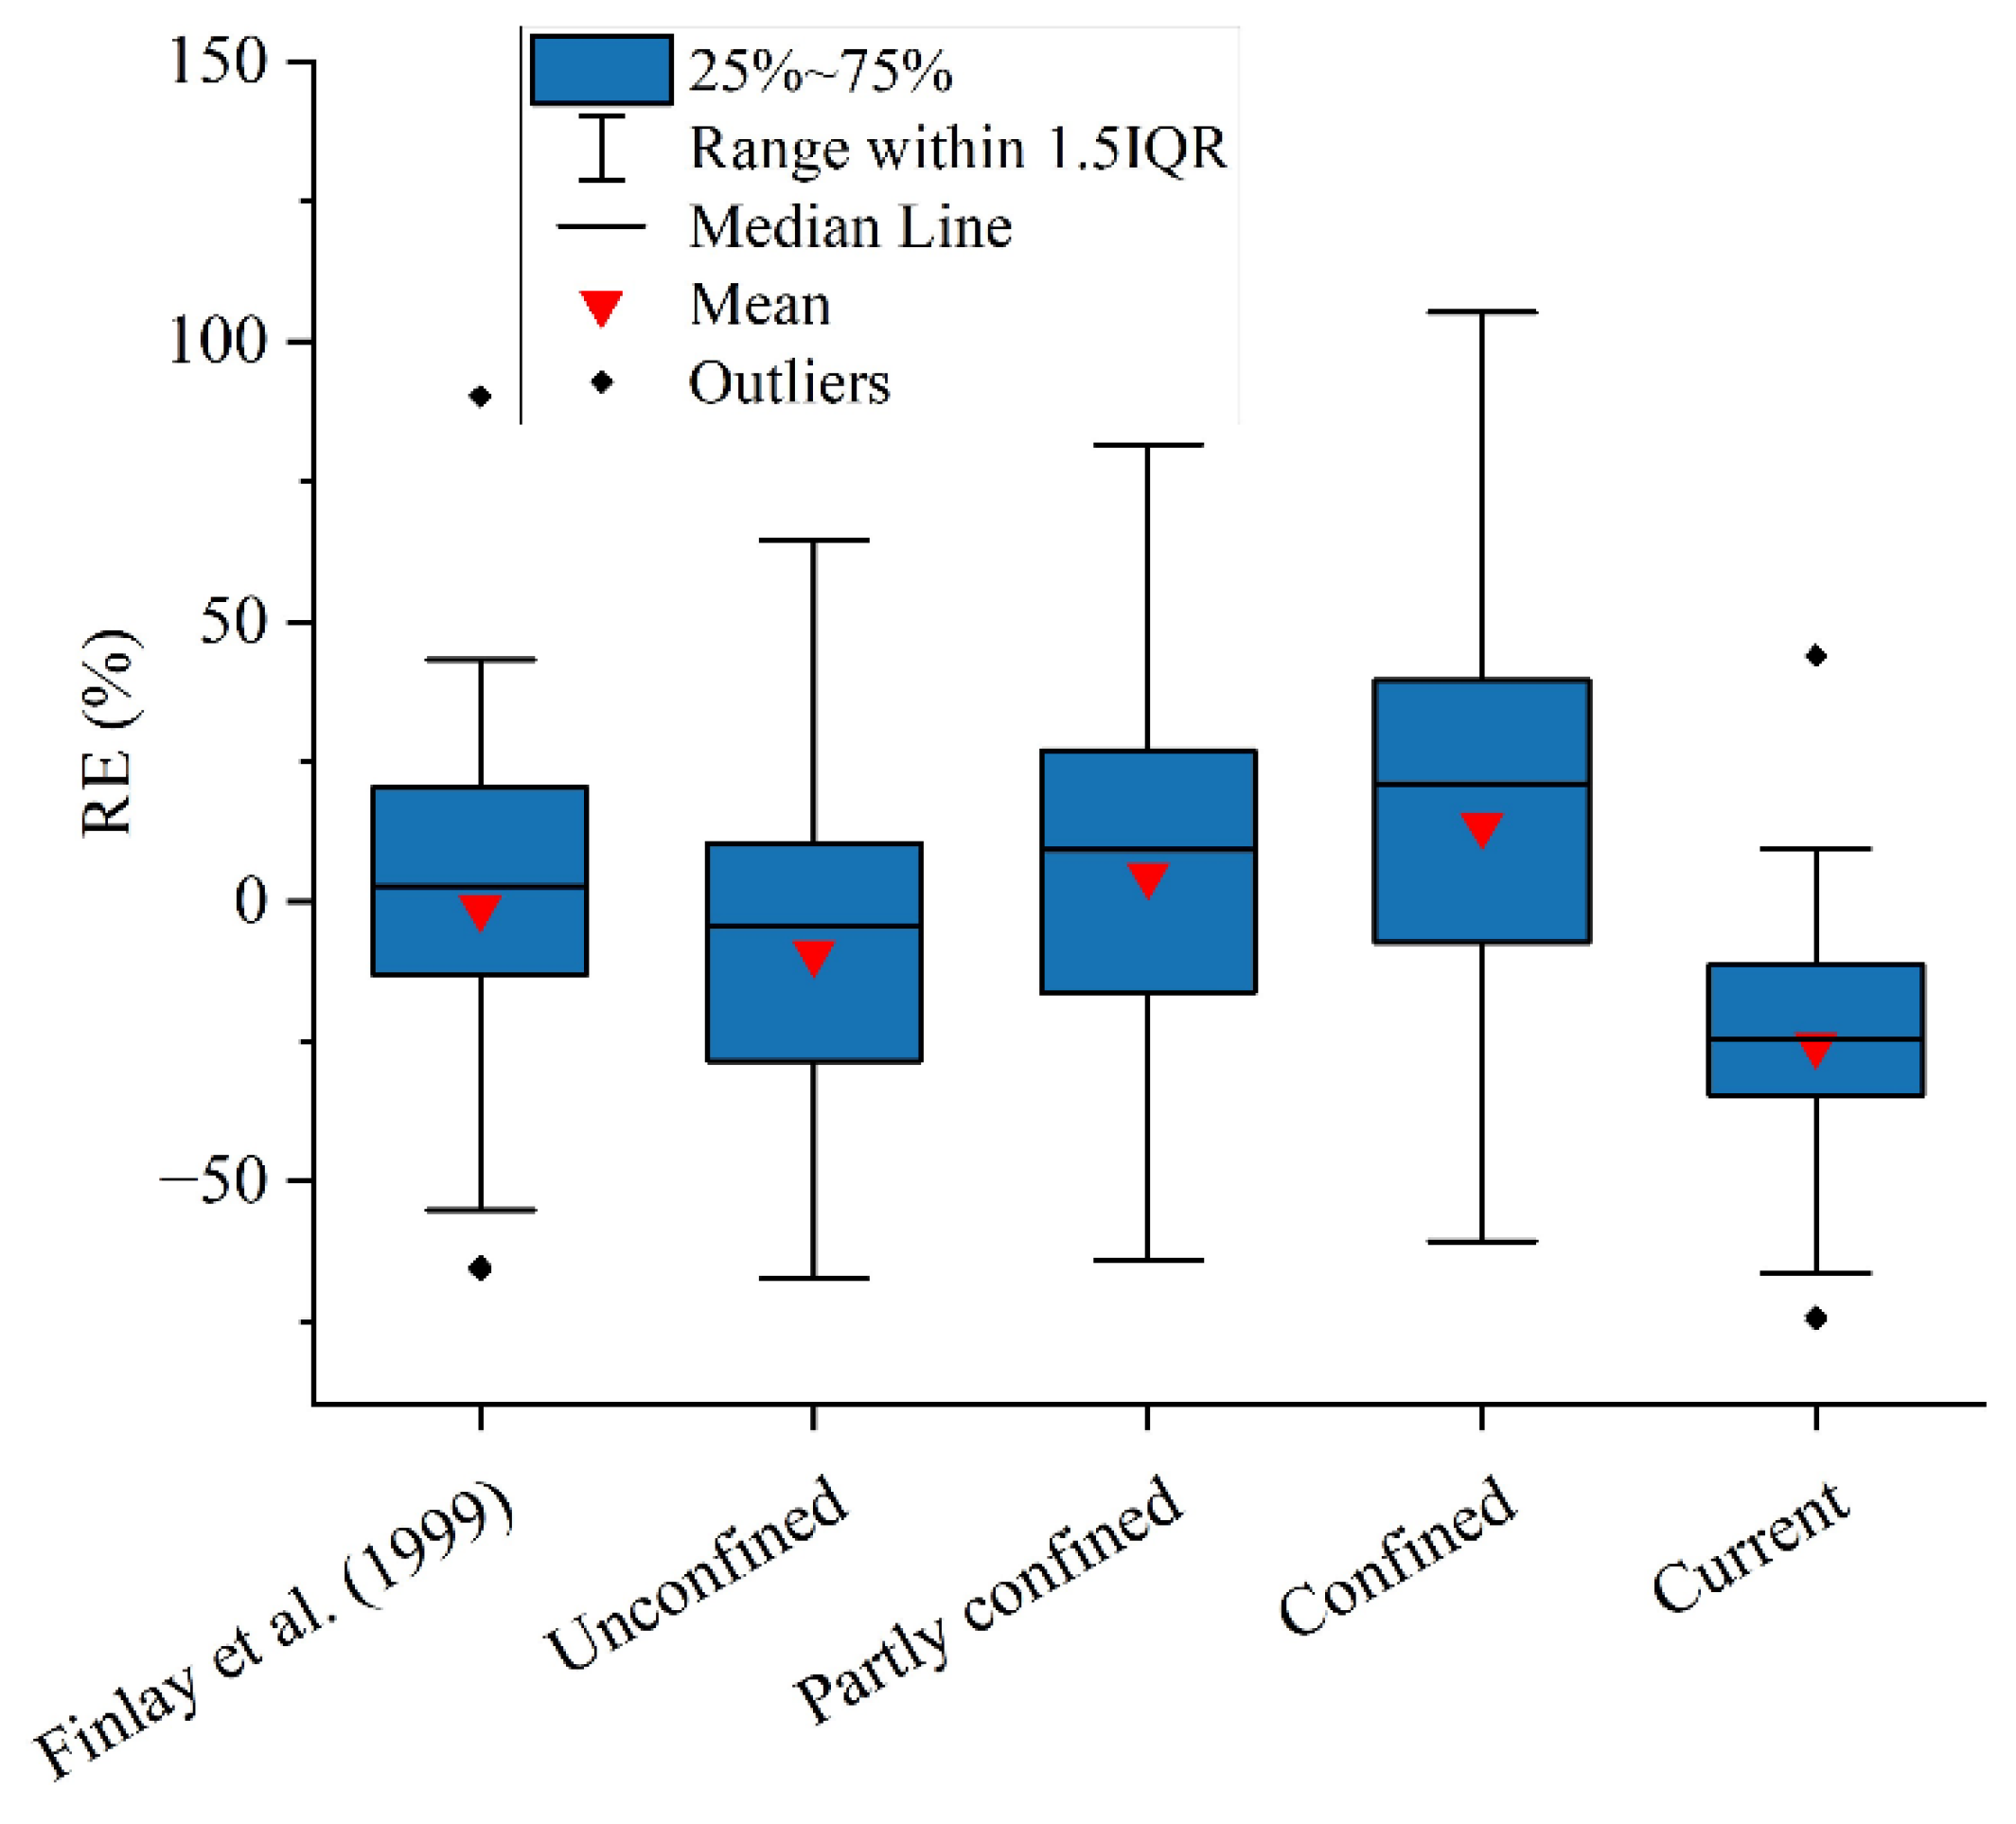
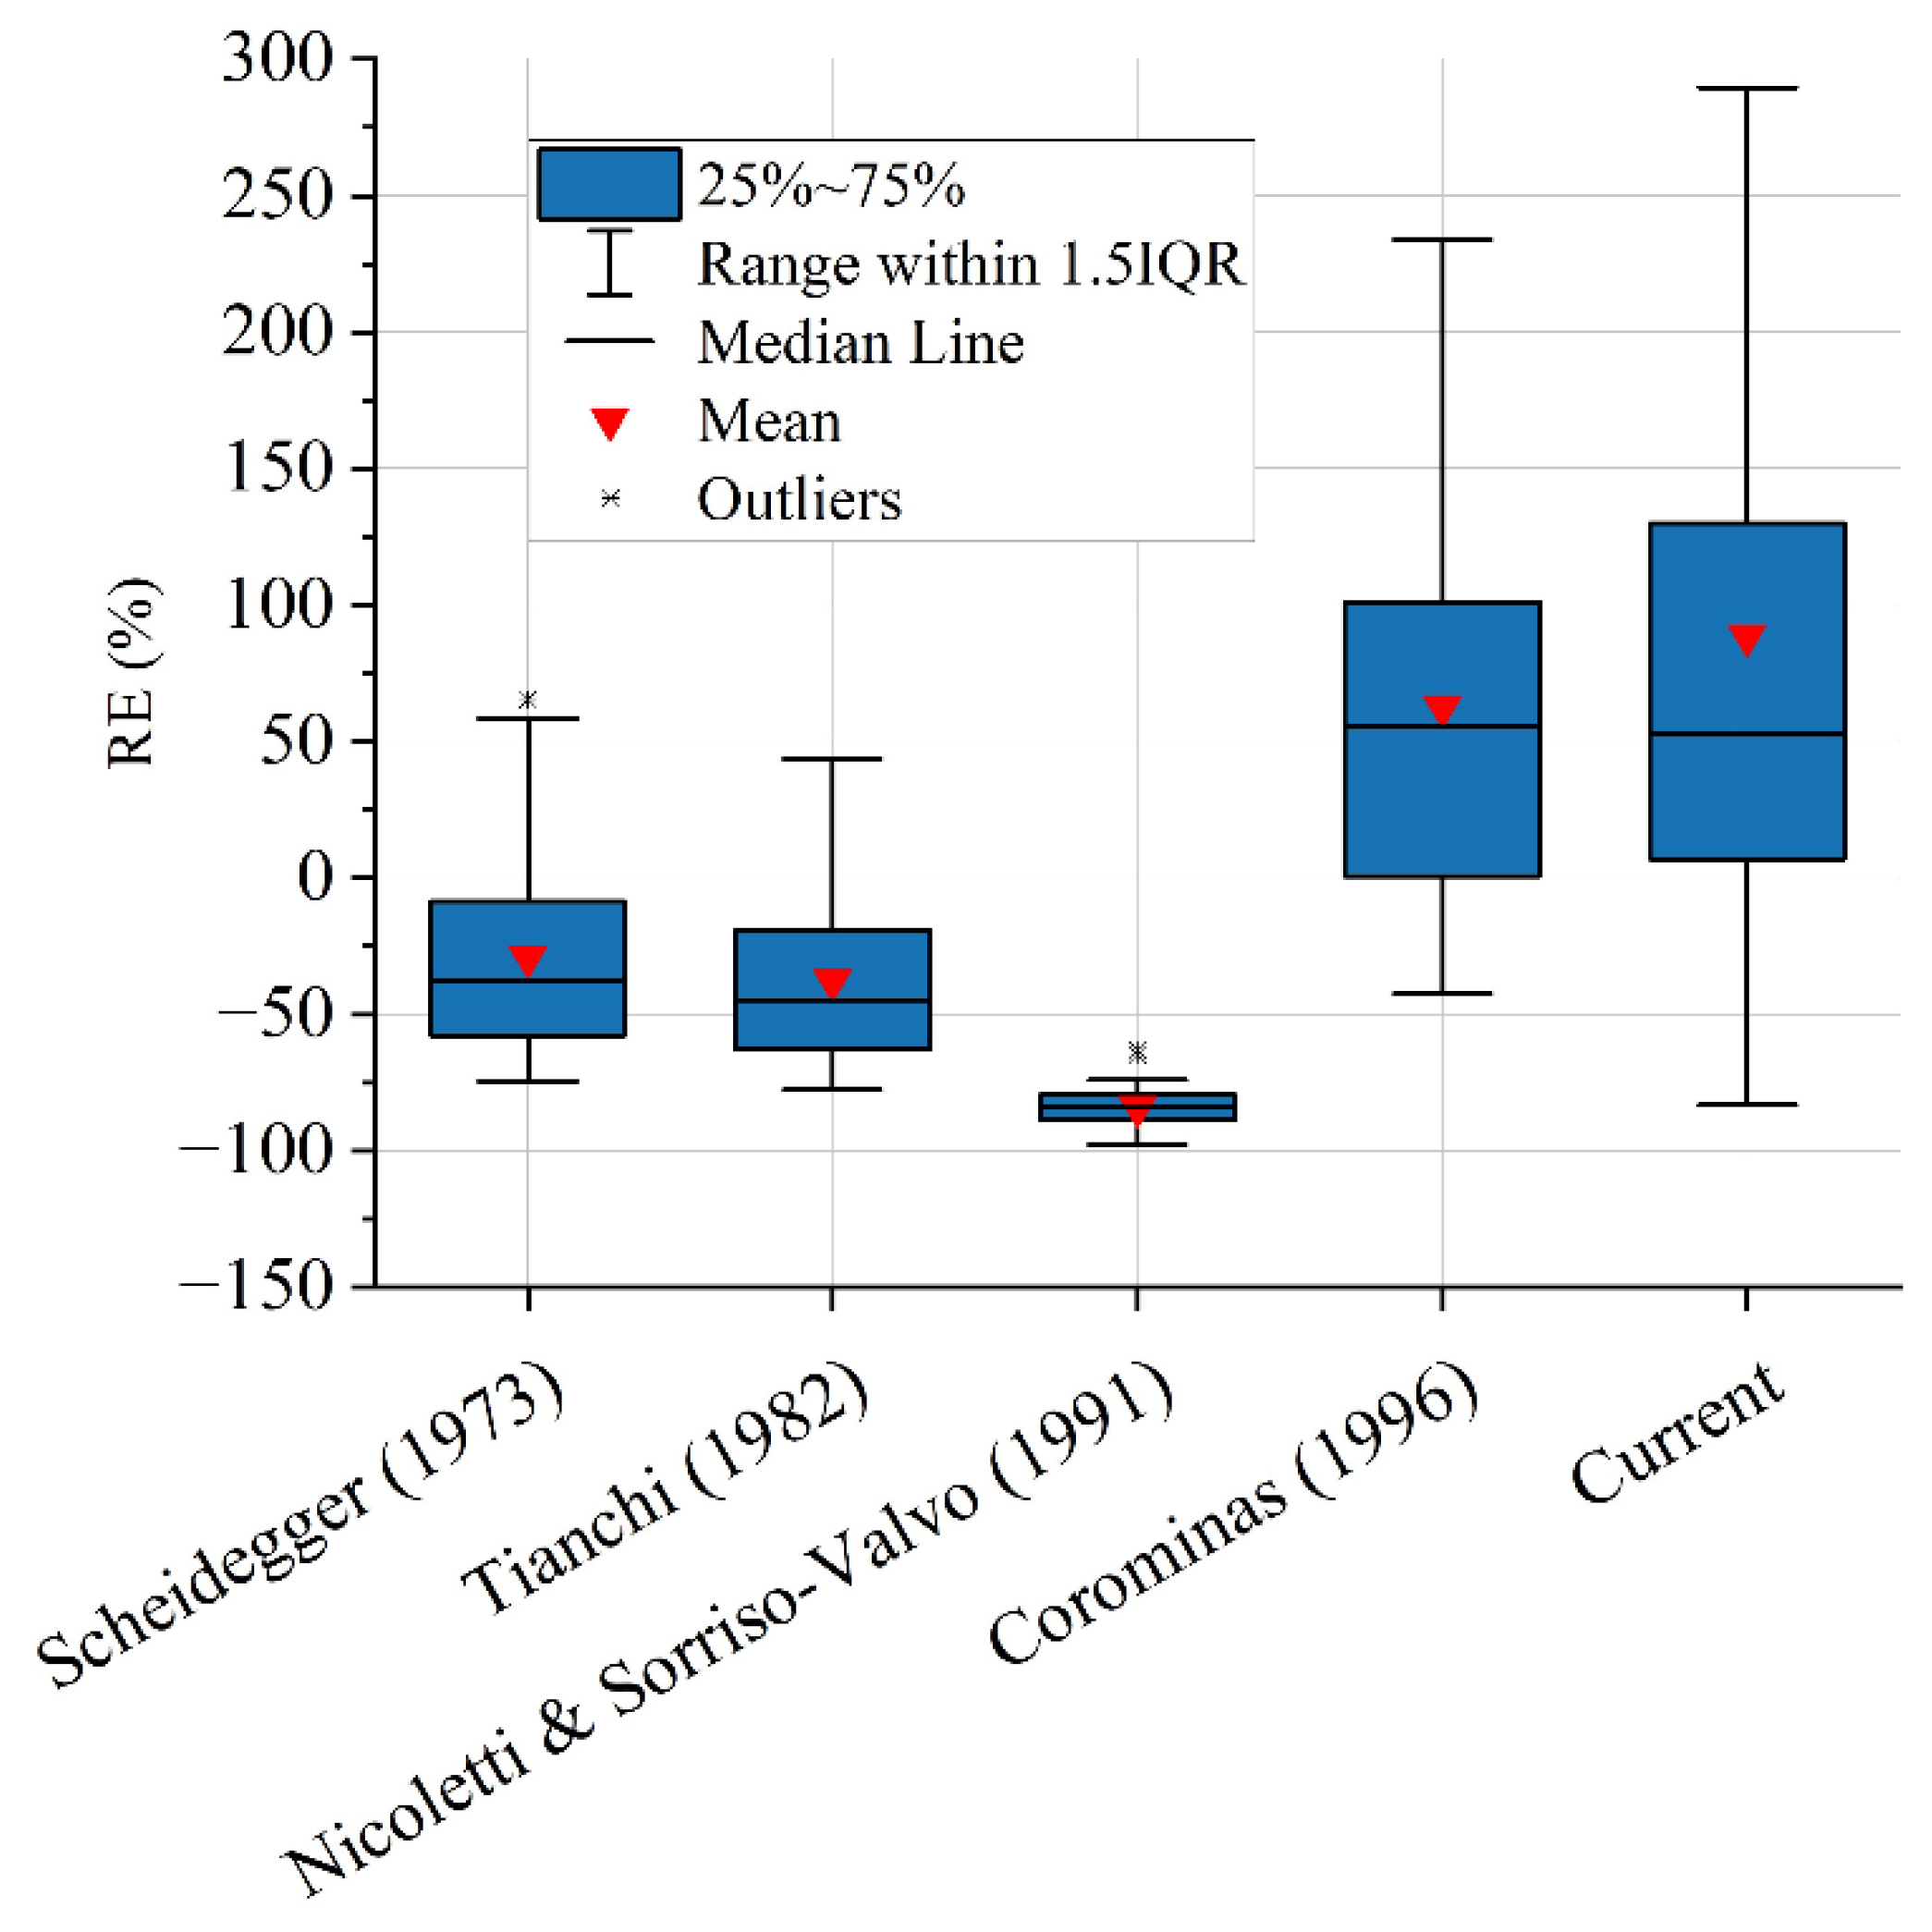
  • Different empirical models exhibited varying performances in estimating runout distance, notably in terms of relative error (RE). Models like the one proposed by Corominas (1996) showed a relatively good performance, emphasizing the importance of overestimating runout distance to identify critical scenarios and prevent disastrous situations. Moreover, the study introduced a linear relationship between landslide volume and runout distance, offering similar estimations as existing models without the necessity of including maximum drop height (H), which, in many cases, is unknown;
  • The study introduced a multilinear regression to establish an empirical relationship between slope inclination, landslide volume, and runout distance. Evaluating the relative error (RE), this empirical relationship revealed that most of the overestimations concentrated around 0% and 50%, emphasizing the potential for predicting runout distance through this combined relationship of variables.
It has been shown that, in the studied context, the empirical models are a simple and powerful tool at hand to scientists and practitioners even for simple estimations of very complex processes as the mechanics of such kinds of flows. Even if such empirical relationships have proven to be useful in different contexts, they might be used with caution as the estimations do not intend to be accurate. Instead, they can be a powerful tool to be used as a preliminary identification of potentially destructive landslides in order to identify areas worthy of downscale to more detailed studies. However, it has been shown that linear (or logarithmic) relationships between LRD and other important features (slope inclination and triggered volume in this case) explain quite well the casual relationships among the data. In that sense, further investigations applying algorithms based on linear relationships, such as random forests, neural networks, or other machine learning techniques, are promising in the improvement of the empirical assessment of the landslide runout distance.

Supplementary Materials

The following supporting information can be downloaded at: https://www.mdpi.com/article/10.3390/su16020793/s1, Table S1: Morphometrical measurements of the landslide runout distance of a set of 49 landslides sampled through a photogrammetric study in the Colombian north–east Andes.

Author Contributions

Conceptualization, D.C.R.Q. and E.R.O.-O.; methodology, D.C.R.Q. and M.A.T.C.; investigation, D.C.R.Q. and J.D.O.C.; data curation, J.D.O.C.; writing—original draft preparation, D.C.R.Q.; writing—review and editing, E.R.O.-O. and M.A.T.C.; visualization D.C.R.Q.; supervision, E.R.O.-O. and M.A.T.C. All authors have read and agreed to the published version of the manuscript.

Funding

This study is part of the research project entitled “Método para la estimación de distancias de viaje de movimientos en masa con base en aproximaciones geométricas”, which was funded by “PATRIMONIO AUTÓNOMO FONDO NACIONAL DE FINANCIAMIENTO PARA LA CIENCIA, LA TECNOLOGÍA Y LA INNOVACIÓN FRANCISCO JOSÉ DE CALDAS” granted to Universidad Nacional de Colombia by Ministerio de Ciencia, Tecnología e Innovación—MinCiencias (Grant no. 80740-509-2020, Call 852-2019).

Institutional Review Board Statement

The study does not require the approvement of an ethical or institutional review board.

Informed Consent Statement

Not applicable.

Data Availability Statement

Data are contained within the article and Supplementary Materials.

Acknowledgments

The authors would like to acknowledge the Universidad Nacional de Colombia, Universidad Industrial de Santander and Servicio Geológico Colombiano (SGC) for being part of the research project (MinCiencias—Grant no. 80740-509-2020). Our acknowledge to the SGC by providing the data used to settle the basis of the present study. It gave valuable interdisciplinary insight into the runout distance of the landslides in the Colombian North–East Andean region. The authors encourage all interested researchers to access the free and open dataset containing the Colombian landslide inventory through https://simma.sgc.gov.co (accessed on 5 December 2023).

Conflicts of Interest

The authors declare no conflict of interest.

References

  1. Rossato, S.; Martin, S.; Ivy-Ochs, S.; Gabrieli, F. Historic and Prehistoric Landslides in the Northern Italian Alps: Implications for New Hazard Maps in Montanous Areas. Alp. Mediterr. Quat. 2020, 33, 1–2. [Google Scholar]
  2. SGC-SIMMA. Sistema de Información de Movimientos En Masa. Available online: https://simma.sgc.gov.co/#/ (accessed on 12 May 2022).
  3. Banco Mundial. Análisis de La Gestión Del Riesgo de Desastres En Colombia: Un Aporte Para La Construcción de Políticas Públicas; Campos, G.A., Holm-Nielsen, N., Díaz, G.C., Rubiano, V.M.D., Costa, P.C.R., Ramírez, C.F., Dickson, E., Eds.; Banco Mundial: Bogota, Colombia, 2012. [Google Scholar]
  4. Duncan, J.M.; Wright, S.G. Examples and Causes of Slope Failure. In Soil Strength and Slope Stability; John Wiley & Sons: Hoboken, NJ, USA, 2005; pp. 5–17. [Google Scholar]
  5. Wadhawan, S.K.; Singh, B.; Ramesh, M.V. Causative Factors of Landslides 2019: Case Study in Malappuram and Wayanad Districts of Kerala, India. Landslides 2020, 17, 2689–2697. [Google Scholar] [CrossRef]
  6. Hungr, O.; Leroueil, S.; Picarelli, L. The Varnes Classification of Landslide Types, an Update. Landslides 2014, 11, 167–194. [Google Scholar] [CrossRef]
  7. Iverson, R.M. The Physics of Debris Flows. Rev. Geophys. 1997, 35, 245–296. [Google Scholar] [CrossRef]
  8. Delannay, R.; Valance, A.; Mangeney, A.; Roche, O.; Richard, P. Granular and Particle-Laden Flows: From Laboratory Experiments to Field Observations. J. Phys. D Appl. Phys. 2017, 50, 053001. [Google Scholar] [CrossRef]
  9. McDougall, S. A New Continuum Dynamic Model for the Analysis of Extremely Rapid Landslide Motion across Complex 3D Terrain. Ph.D. Thesis, University of British Columbia, Vancouver, BC, Canada, 2006; p. 268. [Google Scholar]
  10. Hungr, O.; McDougall, S. Two Numerical Models for Landslide Dynamic Analysis. Comput. Geosci. 2009, 35, 978–992. [Google Scholar] [CrossRef]
  11. Iverson, R.; George, D. Modelling Landslide Liquefaction, Mobility Bifurcation and the Dynamics of the 2014 Oso Disaster. Géotechnique 2015, 66, 175–187. [Google Scholar] [CrossRef]
  12. Alonso, E.E. Triggering and Motion of Landslides. Géotechnique 2021, 71, 3–59. [Google Scholar] [CrossRef]
  13. Peruzzetto, M.; Mangeney, A.; Grandjean, G.; Levy, C.; Thiery, Y.; Rohmer, J.; Lucas, A. Operational Estimation of Landslide Runout: Comparison of Empirical and Numerical Methods. Geosciences 2020, 10, 424. [Google Scholar] [CrossRef]
  14. Hungr, O.; Corominas, J.; Eberhardt, E. Estimating Landslide Motion Mechanism, Travel Distance and Velocity. In Landslide Risk Management; Hungr, O., Fell, R., Couture, R., Eberhardt, E., Eds.; Taylor and Francis Group: London, UK, 2005; pp. 99–128. [Google Scholar]
  15. Scheidegger, A.E. On the Prediction of the Reach and Velocity of Catastrophic Landslides. Rock Mech. 1973, 5, 231–236. [Google Scholar] [CrossRef]
  16. Tianchi, L. A Mathematical Model for Predicting the Extent of a major Rockfall. Z. Geomorphol. 1983, 27, 473–482. [Google Scholar] [CrossRef]
  17. Nicoletti, P.G.; Sorriso-Valvo, M. Geomorphic Controls of the Shape and Mobility of Rock Avalanches. Geol. Soc. Am. Bull. 1991, 103, 1365–1373. [Google Scholar] [CrossRef]
  18. Corominas, J. The Angle of Reach as a Mobility Index for Small and Large Landslides. Can. Geotech. J. 1996, 33, 260–271. [Google Scholar] [CrossRef]
  19. Fannin, R.J.; Wise, M.P. An Empirical-Statistical Model for Debris Flow Travel Distance. Can. Geotech. J. 2001, 38, 982–994. [Google Scholar] [CrossRef]
  20. Goetz, J.; Kohrs, R.; Parra Hormazábal, E.; Bustos Morales, M.; Araneda Riquelme, M.B.; Henríquez, C.; Brenning, A. Optimizing and Validating the Gravitational Process Path Model for Regional Debris-Flow Runout Modelling. Nat. Hazards Earth Syst. Sci. 2021, 21, 2543–2562. [Google Scholar] [CrossRef]
  21. Walstra, J.; Chandler, J.H.; Dixon, N.; Dijkstra, T.A. Aerial Photography and Digital Photogrammetry for Landslide Monitoring. Geol. Soc. Lond. Spec. Publ. 2007, 283, 53–63. [Google Scholar] [CrossRef]
  22. Peternel, T.; Kumelj, Š.; Oštir, K.; Komac, M. Monitoring the Potoška Planina Landslide (NW Slovenia) Using UAV Photogrammetry and Tachymetric Measurements. Landslides 2016, 14, 395–406. [Google Scholar] [CrossRef]
  23. Chae, B.G.; Park, H.J.; Catani, F.; Simoni, A.; Berti, M. Landslide Prediction, Monitoring and Early Warning: A Concise Review of State-of-the-Art. Geosci. J. 2017, 21, 1033–1070. [Google Scholar] [CrossRef]
  24. Ávila, G.E.; Cubillos, C.E.; Granados, A.E.; Bello, E.; Rodríguez, É.A.; Rodríguez, C.E.; Ruiz, G.L. Guía Metodológica para Estudios de Amenaza, Vulnerabilidad y Riesgo por Movimientos en Masa; Buitrón Paz, V.E., Molina Ochoa, M.J., Eds.; Servicio Geológico Colombiano: Bogotá, Colombia, 2015.
  25. González Iregui, H.; Rincón, J.P.; Duque Pineda, J.; Tolosa Fernández, L. Plancha 122-Chucarima; Servicio Geológico Colombiano: Medellín, Colombia, 2015.
  26. Taherdoost, H. Sampling Methods in Research Methodology; How to Choose a Sampling Technique for Research. SSRN Electron. J. 2016, 5, 18–27. [Google Scholar] [CrossRef]
  27. Pacheco, J.F.; Contreras, E. Manual Metodológico de Evaluación Multicriterio Para Programas y Proyectos 2008. Available online: https://repositorio.cepal.org/items/abad1f0a-b1c8-4ba8-bc37-0e0b9da69dd1 (accessed on 21 November 2023).
  28. PIX4Dmapper–Support. Available online: https://support.pix4d.com/hc/en-us/categories/360001503192-PIX4Dmapper (accessed on 9 January 2024).
  29. Hunter, G.; Fell, R. Travel Distance Angle for “Rapid” Landslides in Constructed and Natural Soil Slopes. Can. Geotech. J. 2003, 40, 1123–1141. [Google Scholar] [CrossRef]
  30. Finlay, P.J.; Mostyn, G.R.; Fell, R. Landslide Risk Assessment: Prediction of Travel Distance. Can. Geotech. J. 1999, 36, 556–562. [Google Scholar] [CrossRef]
  31. Hungr, O. A Review of Landslide Hazard and Risk Assessment Methodology. In Landslides and Engineered Slopes. Experience, Theory and Practice; CRC Press: Boca Raton, FL, USA, 2018; pp. 3–27. [Google Scholar] [CrossRef]
Figure 1. Study area located in the northeast Andean region of Colombia (South America).
Sustainability 16 00793 g001
Figure 2. Land uses and the proportion of damages in each category, environmental, infrastructure, and economic, were reported in the study area in the northeast Andean region of Colombia. According to public data repositories [2].
Sustainability 16 00793 g002
Figure 3. Subregion in the study area located in the north–east Andean region near by Bucaramanga city, in Santander department (Colombia). Red circles indicate the location of the study units and the number of cases inside the area.
Sustainability 16 00793 g003
Figure 4. Scheme with typical distances characterizing the morphometry of landslides in pre-failure and post-failure conditions. Adapted from [24].
Sustainability 16 00793 g004
Figure 5. Ortho-corrected images of two landslide affected areas taken by (a) quadcopter (7°04′50″ N, 73°11′08″ W) and (b) fixed-wing UAV (7°04′25″ N, 73°09′32″ W). The images display the location of the crown of the study units Z11_12, Z11_41_1, Z11_41_2, Z11_41_3, Z11_41_4, Z11_41_5, Z11_41_6 with orange dots, delimiting the landslide affected area with red lines.
Sustainability 16 00793 g005
Figure 6. Relationship between the land cover (left) and land use (right) with the mean ratio H/L in the 49 sampled landslides.
Sustainability 16 00793 g006
Figure 7. Mean runout distance (left vertical axis) and mean pre-failure slope angle (right vertical axis) according to the geological formations: Giron (Jg), Silgará (pDs), La Corcova (JTRclp), Bucaramanga (PCabm), and Bocas (TRb) as described in Table 2.
Sustainability 16 00793 g007
Figure 8. Trend analysis between the values of height fall and runout distance ratio (H/L) and slope inclination angle ( tan ( α 2 ) ).
Sustainability 16 00793 g008
Figure 9. Distribution of the relative error (RE) in the estimation of the runout distance according to different models that use the slope inclination as input variable. From left to right: Finlay et al. (1999) [30], Hunter and Fell (2003) [29] for unconfined, partly confined, and confined flows, and the current study.
Sustainability 16 00793 g009
Figure 10. Distribution of typical distances measured in the sample: rupture depth D r (top), rupture length L r (middle), W r rupture width (bottom).
Sustainability 16 00793 g010
Figure 11. Trend analysis between the logarithmic values of planimetric area, A (a), landslide volume, V (b) and runout distance L.
Sustainability 16 00793 g011
Figure 12. Distribution of the Relative Error (RE) on the estimation of the landslide runout distances within the dataset using different models that use the landslide volume as an input variable [15,16,17,18].
Sustainability 16 00793 g012
Figure 13. Distribution of the Relative Error (RE) on the estimation of the landslide runout distances within the dataset using different multilinear models [30].
Sustainability 16 00793 g013
Table 1. Determination coefficient and model parameters proposed by different authors using the empirical relationship shown in Equations (2) and (3).
Study a b R 2
[15]0.624−0.1570.67
[16]0.664−0.1530.61
[17]0.5270.0850.14
[18]−0.047−0.0850.63
[29]0.0870.7700.71
Table 2. Description of the geological formations hosting the sampled landslides in the study area according to the geological map of the region [25].
AcronymGeological FormationDescription
JgGirónSlightly weathered sandstones of the Girón formation
pDsSilgaráPhyllite, schists and quartzites
JTRclpLa CorcovaLa Corcova quartz monzonite with porphyritic facies
PCabmBucaramangaGneiss with abundant small masses of orthogneiss
TRbBocasGray to brownish gray sandstone and mudstone
Table 3. Model coefficients and determination coefficients for the equations of the form H / L = a + b tan ( α 2 ) and log 10 L = a + b log 10 ( H ) + c log 10 ( tan α 2 ) . Values with * correspond to the equation of the form log 10 L = a + b log 10 ( H ) + c log 10 ( tan α 2 ) .
Model a b , c * R 2
From [30]: Cut slope0.1091.010, −0.506 *0.85
From [29]: Unconfined0.0870.770.71
From [29]: Partly confined0.0860.690.52
From [29]: Confined0.1470.540.85
Current study0.4490.520.31
Table 4. Model coefficients and determination coefficient for the equations of the form log 10 L = a + b log 10 ( H ) + c log 10 ( tan α 2 ) [30] and the one shown in Equation (6).
Model a b c R 2
[30]0.450.550.310.59
Current study−5.59 × 10−22.64 × 10−4607.500.91
Disclaimer/Publisher’s Note: The statements, opinions and data contained in all publications are solely those of the individual author(s) and contributor(s) and not of MDPI and/or the editor(s). MDPI and/or the editor(s) disclaim responsibility for any injury to people or property resulting from any ideas, methods, instructions or products referred to in the content.

