Article

Contribution of Climatic Factors and Human Activities to Vegetation Changes in Arid Grassland

1
Yinshanbeilu Grassland Eco-Hydrology National Observation and Research Station, China Institute of Water Resources and Hydropower Research, Beijing 100038, China
2
State Key Laboratory Base of Eco-Hydraulic Engineering in Arid Area, Xi’an University of Technology, Xi’an 710048, China
*
Author to whom correspondence should be addressed.
Sustainability 2024, 16(2), 794; https://doi.org/10.3390/su16020794
Submission received: 11 December 2023 / Revised: 5 January 2024 / Accepted: 8 January 2024 / Published: 17 January 2024
(This article belongs to the Section Resources and Sustainable Utilization)

Abstract

:
Clarifying the changing trend in vegetation and its affecting variables is extremely valuable for natural resource management. Vegetation changes in the Yinshanbeilu grassland region, which is situated in the centre of Inner Mongolia in northern China and is part of the arid steppe region, are extremely sensitive to climatic factors. In this study, we investigated the changes in vegetation in the Yinshanbeilu grassland zone from the year 2000 to 2020 using the Normalized Difference Vegetation Index (NDVI) data. The contribution of climatic conditions and human activities to the annual and growing season vegetation changes was quantified. The findings revealed that vegetation cover in the Yinshanbeilu grassland zone increased at a rate of 0.00267/a between 2000 and 2020. Throughout the year and during the growing season, precipitation had a greater influence on the growth of vegetation than other climatological factors. In most places, there was a significant positive correlation between the NDVI and precipitation, which negatively correlated with other climatic factors. The average rates at which precipitation, temperature, cumulative sunshine hours, and potential evapotranspiration contributed to changes in NDVI were 0.00173/a, −0.00027/a, 0.00006/a, and 0.00074/a, respectively, for the entire year, and 0.00180/a, −0.00001/a, 0.00021/a, and 0.00059/a for the growing season. The impact of climate change on vegetation activities was more pronounced, accounting for 84.76% of annual NDVI change and 97.36% of growing season NDVI change. Humans contributed 15.24% of total annual NDVI change and 2.64% of growing season NDVI change. This research’s findings serve as scientific support for preserving the environment in the Yinshanbeilu grassland region, as well as an essential reference for government decision making.

1. Introduction

In the terrestrial biosphere, vegetation facilitates the exchange of energy, water vapor, and momentum by acting as a vital link between the ground surface and the atmosphere [1,2]. An excellent indicator of vegetation coverage, the Normalized Difference Vegetation Index (NDVI) provides excellent data for tracking and analysing changes in vegetation. It can reflect the presence, density, and dynamics of vegetation, and has been extensively utilized in vegetation covering study [3,4,5]. Climate change and human elements are the primary causes of vegetation change. Quantifying the contribution of both these factors can elucidate the driving mechanism behind vegetation change and give a useful guide to sustainable development [4,6].
Beginning in the year 2000, scholars began to recognize the significant effect of both climate change and human activities on vegetation cover alteration. Thus, at the watershed, regional, and global levels, a great deal of research has been conducted on the relationships between vegetation change, climatic factors, and human activity [4,5,7,8]. Researchers employ a variety of techniques to examine how human activity and climatic conditions affect changes in vegetation, but two primary approaches are commonly used: qualitative-semi-quantitative evaluation and quantitative evaluation. Currently, the most widely used quantitative evaluation method is the evaluation method based on residual trend, which is able to assess the rate of how climatic variables and human activities contribute to changes in vegetation across time and space [9,10,11,12,13]. In order to better understand the drivers of NDVI, researchers mostly analyse land use changes, population density, night-time-light, and other anthropogenic variables [14,15]. In terms of climatic elements, they typically investigate how temperature and precipitation affect vegetation changes [16].
The Mongolian Plateau’s front edge is home to the Yinshanbeilu grassland area. It is a channel for wind and sand to invade the Beijing–Tianjin–Tangshan region and is also located in the middle of the northern farming–pastoral transition zone. This region is semi-arid and arid, and the vegetation is extremely sensitive to changes in climatic factors. Low vegetation cover in winter and spring, coupled with strong wind action, leads to the sanding of large areas of grassland in the region [17]. The Yinshanbeilu grassland region has not received much study attention. Studies have clearly shown an overall warming and drying trend in northwest China from 1979 to 2018 [18]. Increased temperatures caused by anthropogenic climate change in arid and semi-arid regions can have persistent or disruptive effects on vegetation productivity [19]. The destruction of grasslands, erosion of the soil, land desertification, and infertile soil are key ecological issues for Yinshanbeilu [20]. In response to these problems, China has taken measures to control degradation and perform ecological restoration in Inner Mongolia during 2000–2020, and herders in these pastoral areas have benefited from a series of subsidies such as grassland ecological protection incentives since 2011, which have facilitated vegetation growth in these grassland areas to some extent [21,22,23,24,25].
The goals of this study are to (1) analyse the dynamic changes and future development trends in vegetation coverage in the Yinshanbeilu grassland region during 2000–2020, (2) study the temporal and spatial variation characteristics of climatic factors in the Yinshanbeilu grassland regions, and to find out the spatial correlation and significance of NDVI and various climatic elements, and (3) quantify the whole-year and growing-season contributions of meteorological conditions and human activity to NDVI. The results will serve as a guide to sustainable development and vegetation change in the Yinshanbeilu grassland area.

2. Materials and Methods
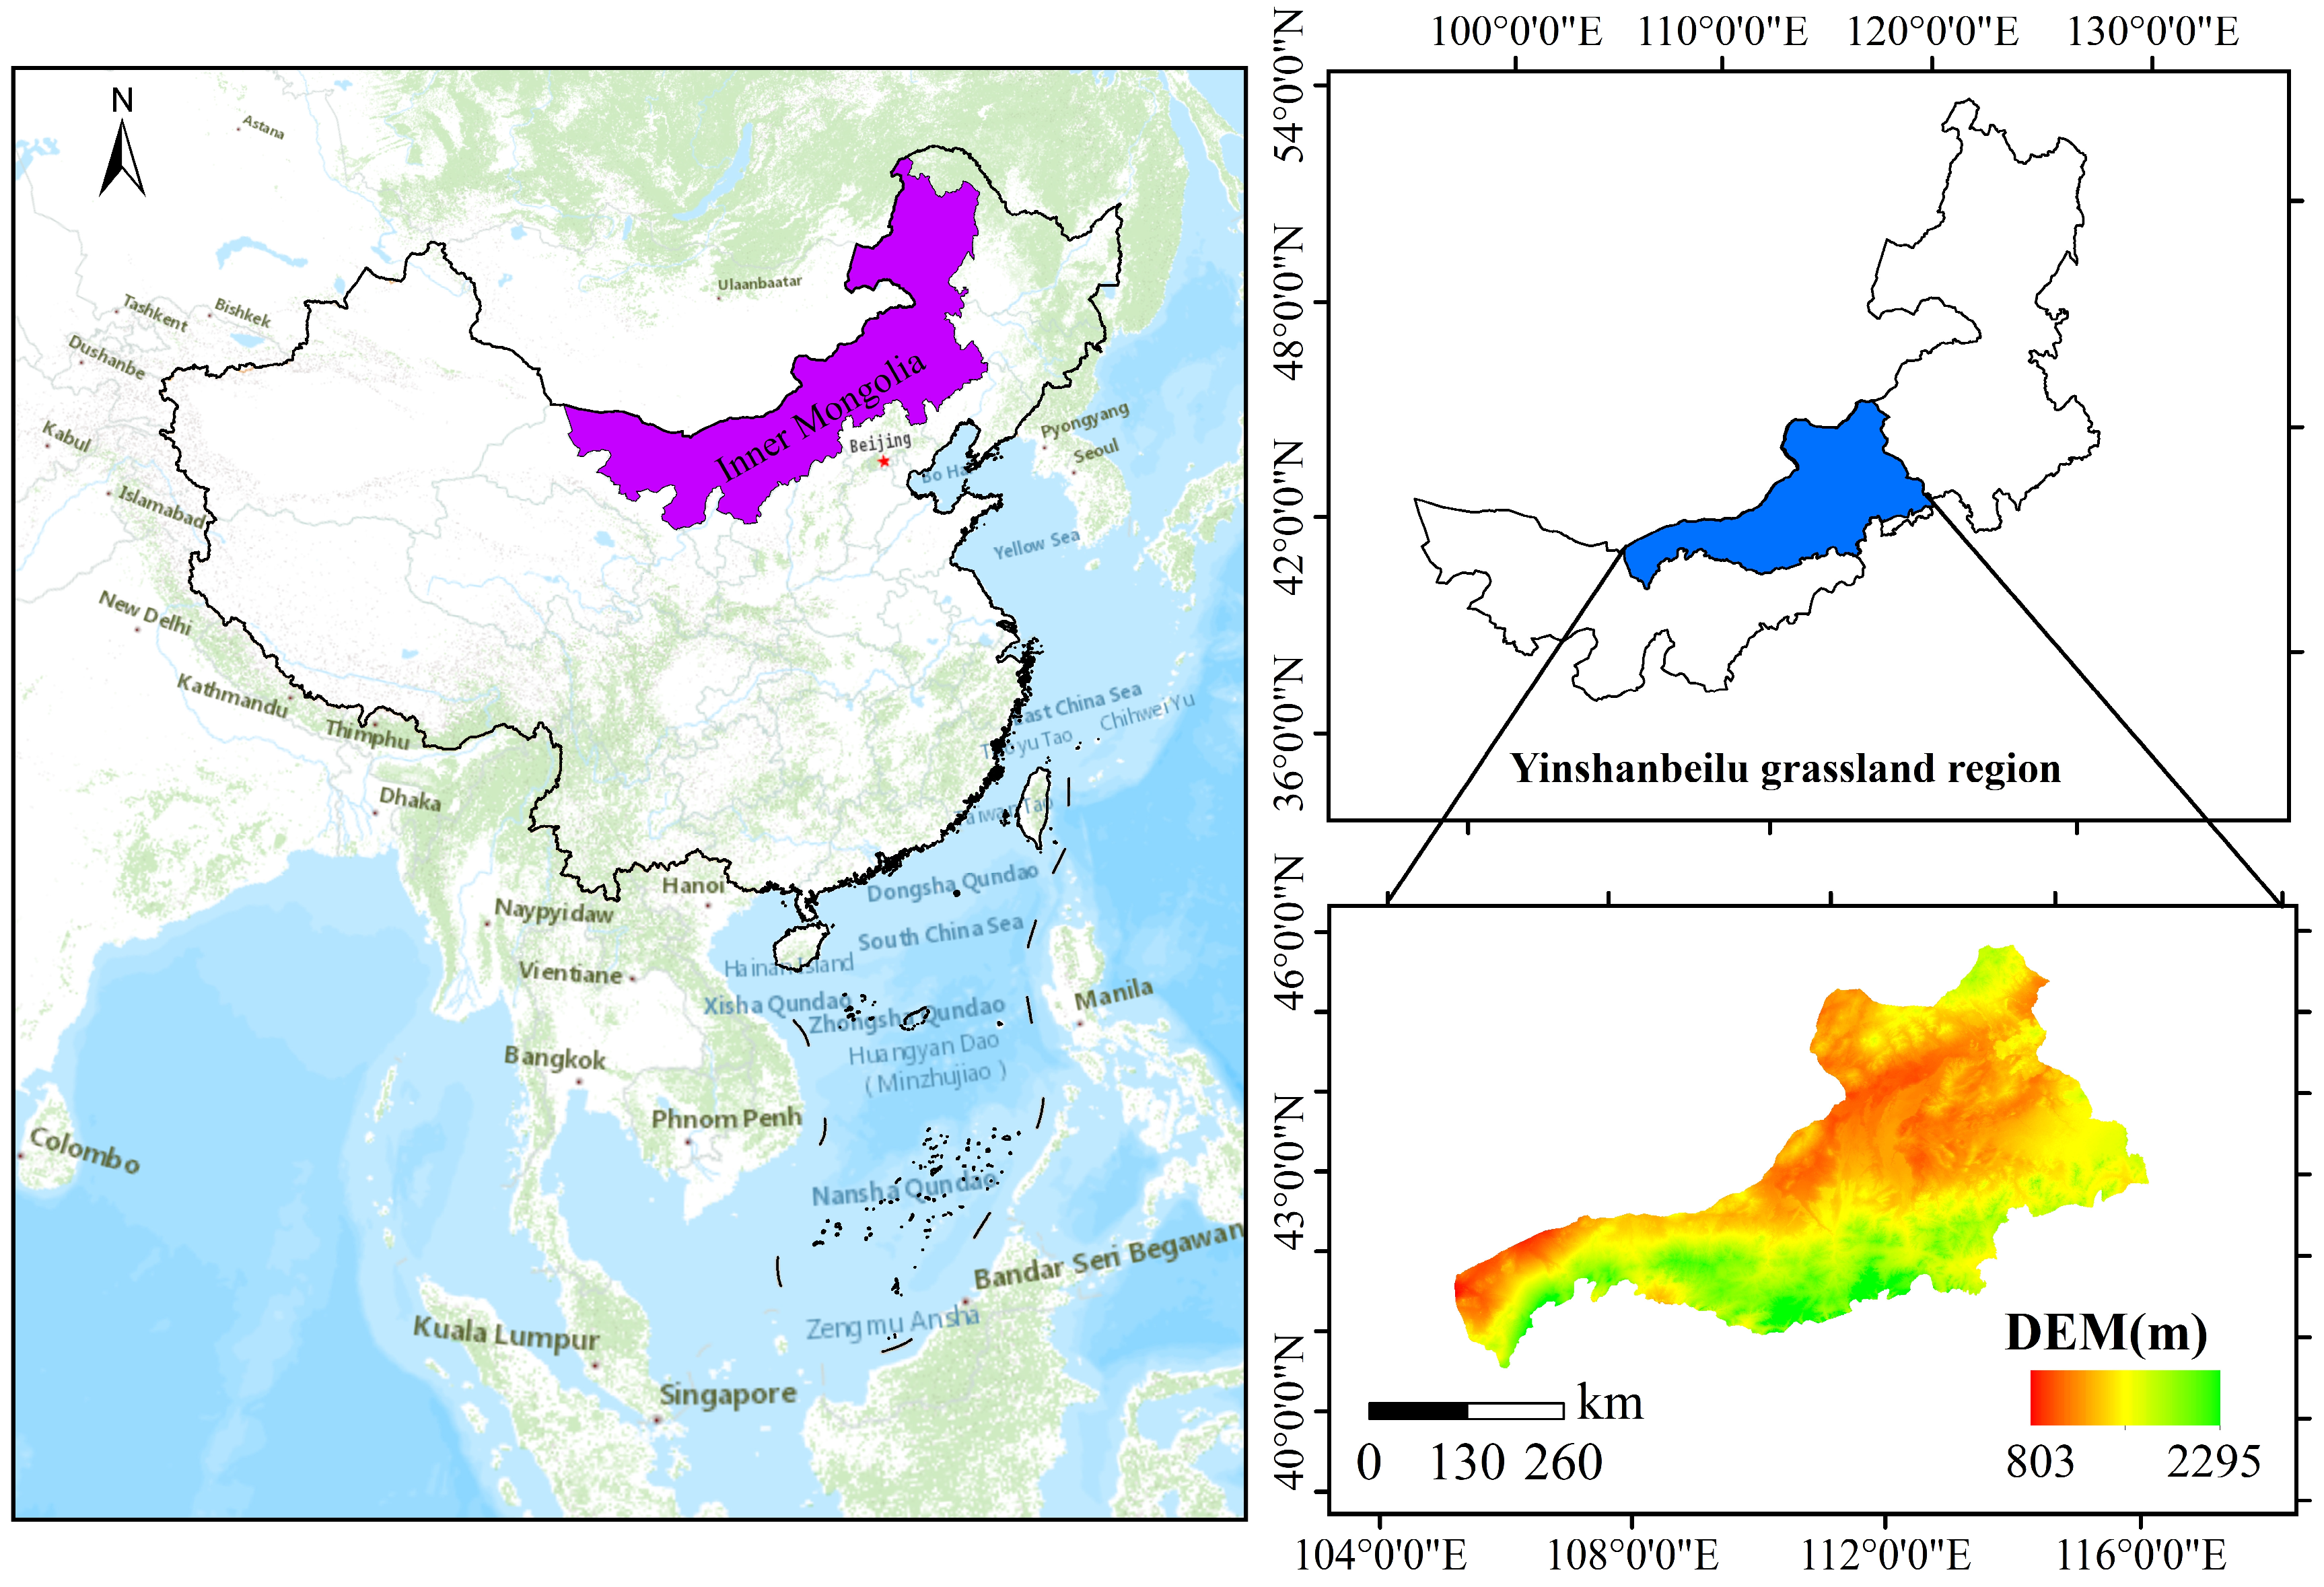
2.1. Study Area

The Yinshanbeilu grassland region (39°29′–45°27′ N, 106°22′–117°1′ E), which covers an area of approximately 202,100 km2, is situated in the centre of Inner Mongolia in northern China (Figure 1). Located at the junction of the Inner Mongolian Plateau and the Yinshan Mountains, in the centre of China’s grazing and agricultural belt, it is one of the poorest and most environmentally vulnerable areas in the whole belt. Sandstorms occur frequently in spring, and wind erosion and desertification are serious. It is considered to be the main source of wind and sand in the Beijing–Tianjin–Hebei region and belongs to the arid steppe zone. This not only affects the social economy in the area, but also poses a major risk to national productivity and survival [26,27]. The south has high terrain, whereas the north has low terrain. The climate of this region is a continental monsoon that is semi-arid and mid-temperately dry. The average annual precipitation is in the range of 100–400 mm, increasing from the west to the east, and concentrated mainly during May–September. The types of vegetation in the study area include coniferous forest, broad-leaved forest, shrubland, desert, grassland, meadow, and cultivated vegetation.

2.2. Data Source and Preprocessing

The Moderate Resolution Imaging Spectroradiometer (MODIS) time series data were used to generate the NDVI data for this investigation. ArcGIS10.2 was used to resample to a spatial resolution of 1000 m × 1000 m. Seasonal and annual NDVI data were obtained by removing cloud, atmospheric, and solar altitude angle interferences using the Maximum Value Composition (MVC) method [28]. We used the inverse distance weighting method to interpolate the monthly data to obtain the monthly cumulative sunshine hours and hours data. This study uses cumulative sunshine hours data to characterize solar radiation [29]. Detailed information of the datasets applied in this study are summarised in Table 1.

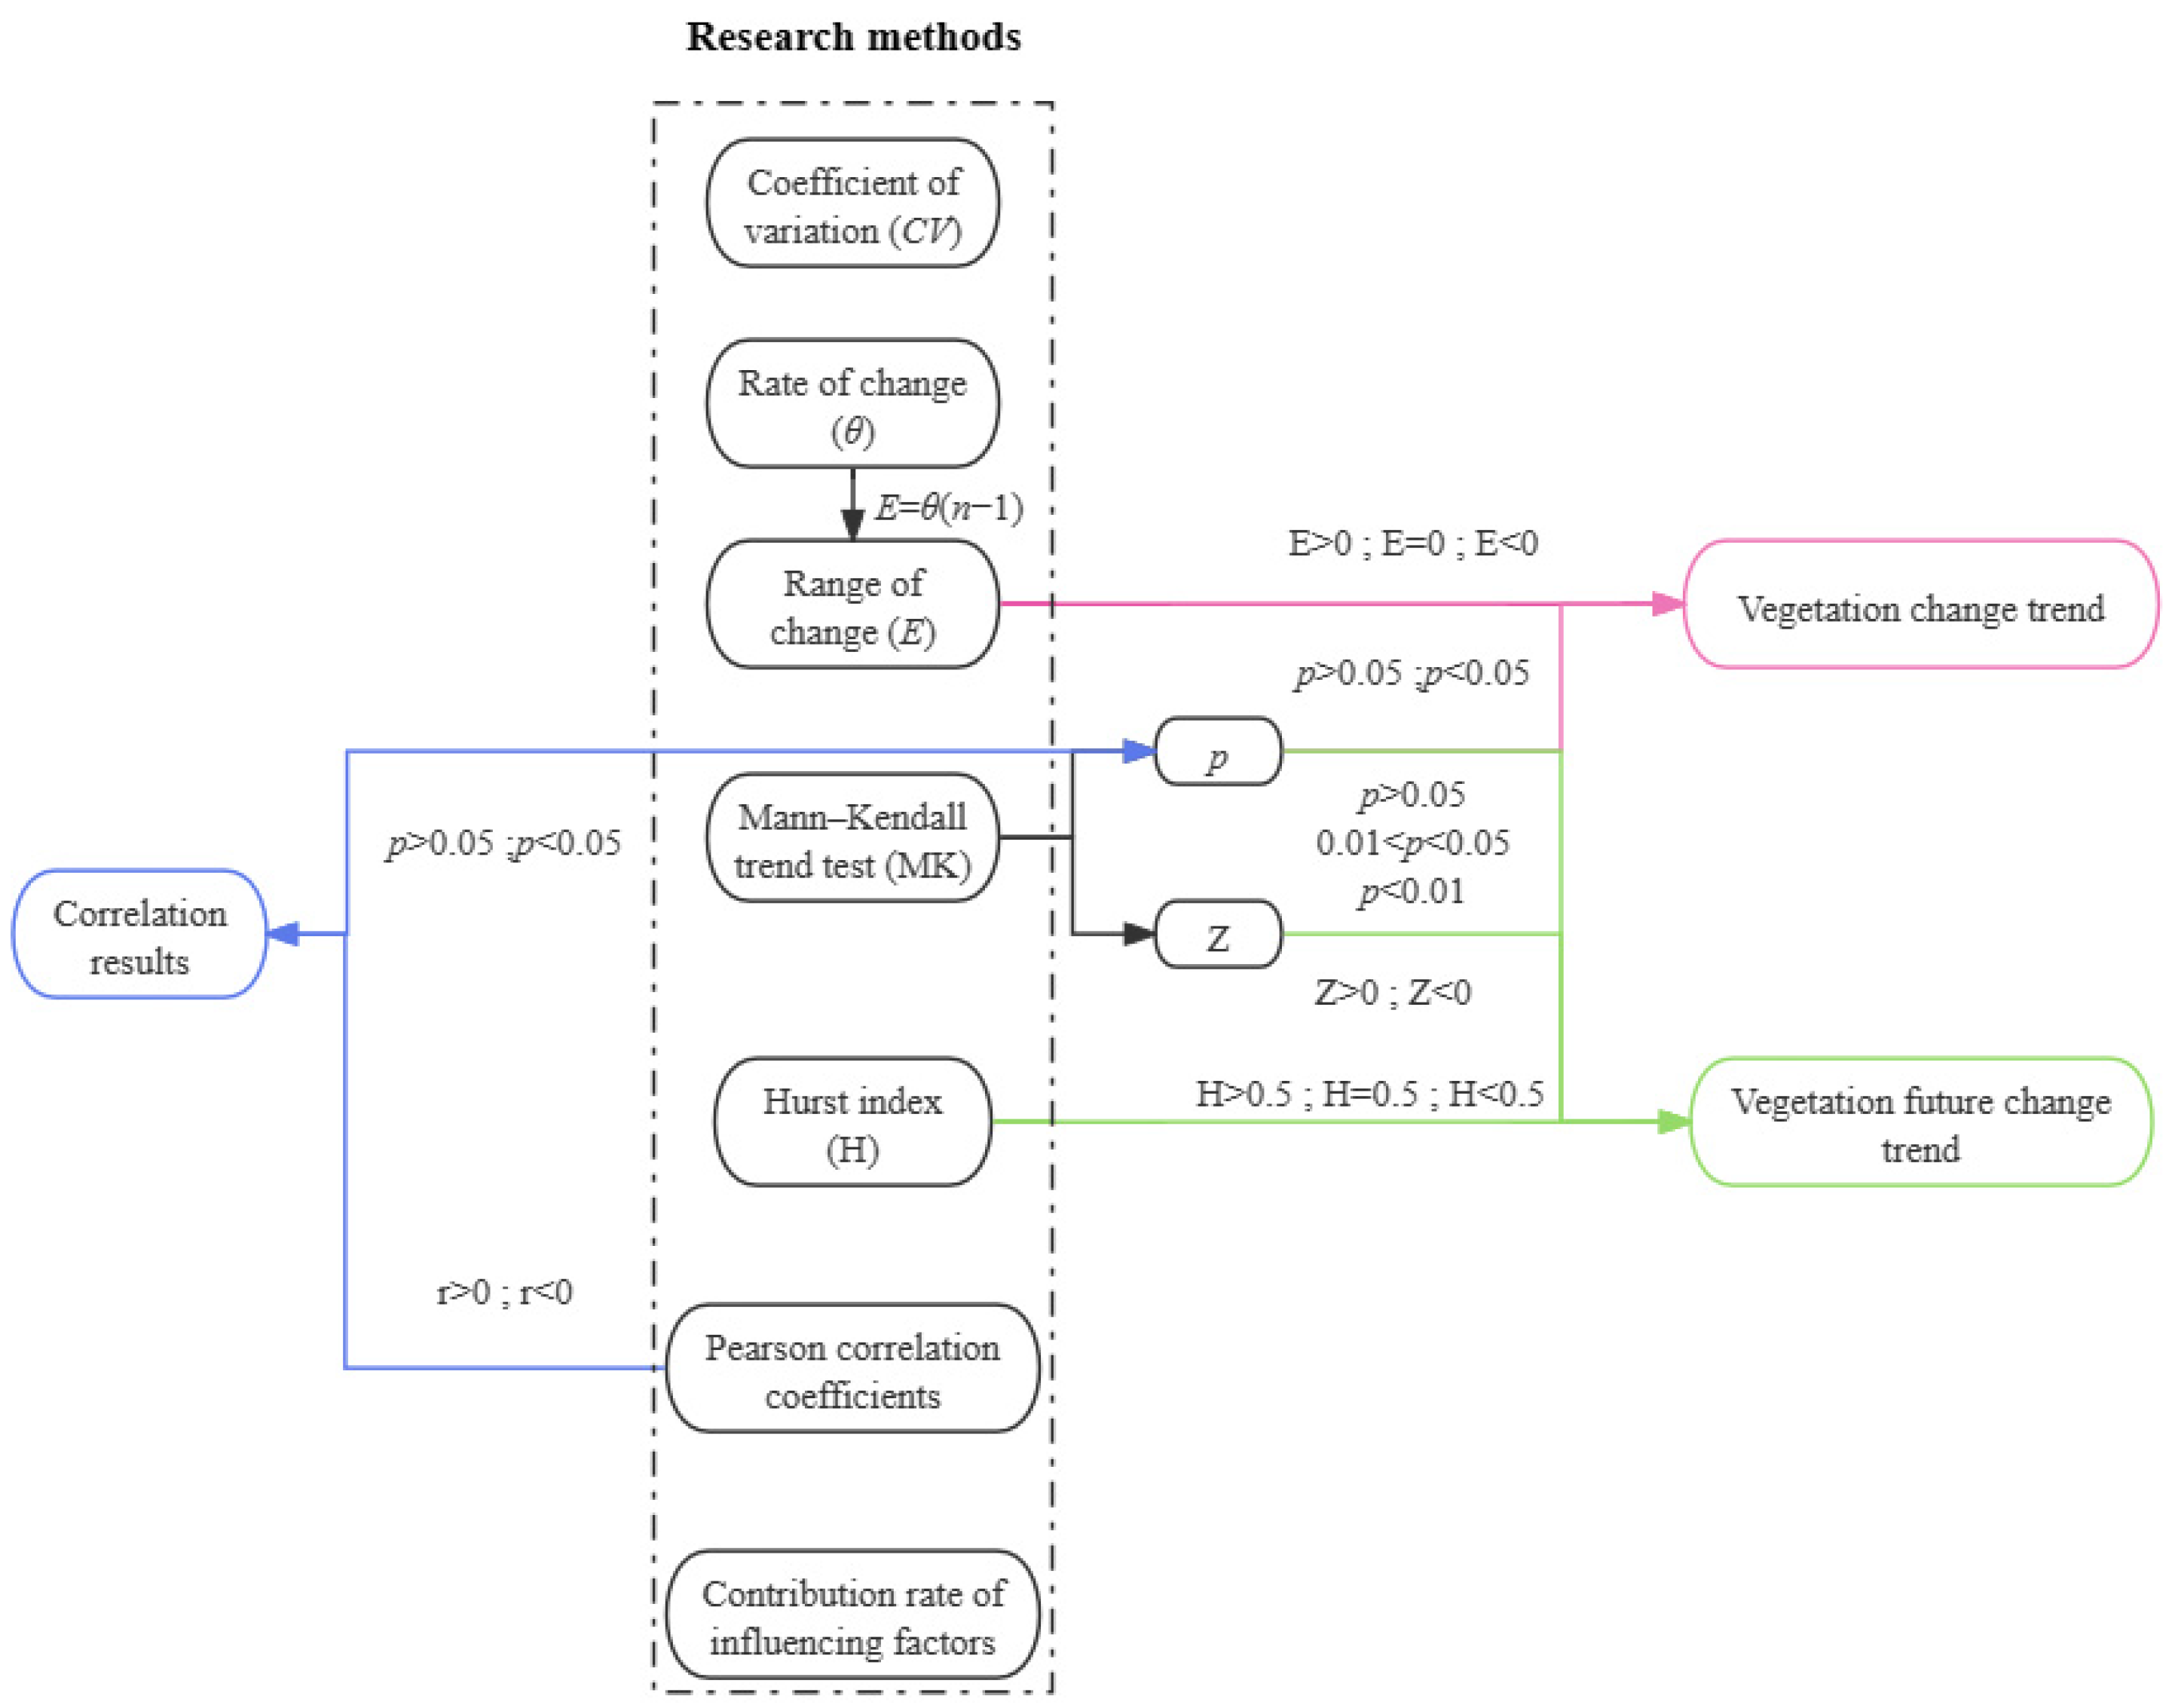
2.3. Research Methods

2.3.1. Trend Analysis, Correlation Analysis, and Forecasting of Future Trends

As Figure 2 demonstrates, this article’s analyses mainly used the following methods. Linear regression was used to calculate the trend in NDVI over time and to calculate the rate of change (θ).
θ = n × i = 1 n i × N D V I i i = 1 n i × i = 1 n N D V I i n × i = 1 n i 2 i = 1 n i 2
where θ is the change rate of NDVI from 2000 to 2020; n is the total number of years studied, 21 years in this study; i is the year, ranging from 1 to 21; N D V I i is the value of NDVI in the i-th year [30,31].
The rate of change and the length of the study period can be used to derive a range of changes (E) in NDVI.
E = θ n 1
In this formula, E is the change range of NDVI from 2000 to 2020; θ is the change rate of NDVI; n is the total number of years in the study period, which is 21. E > 0 indicates increasing vegetation cover, and the larger the value of E, the faster the increase in vegetation cover; E = 0 implies no significant change in vegetation cover; and E < 0 denotes decreasing vegetation cover [32].
The study used the Mann–Kendall (MK) tend test to determine the significance of changes in NDVI values in the Yinshanbeilu grassland region during 2000–2020 [33,34]. Based on the p of the MK trend test, with 0.05 as the cut-off, the rate of change in NDVI in the study period, E, and with 0 as the cut-off, the results of the reclassification were multiplied with the raster calculator of ArcGIS 10.2, which was mainly used for analysing the change in the trend in the Yinshanbeilu grassland region from 2000 to 2020.
The coefficient of variation (CV) is mainly used to illustrate the degree of fluctuation in NDVI changes. In this study, CV < 0.1 is the weakest variation, 0.1 < CV < 0.25 is weak variation, 0.25 < CV < 0.4 is relatively weak variation, 0.4 < CV < 0.7 is medium variation, 0.7 < CV < 1 is relatively strong variation, and CV > 1 is strong variation [32,35].
C V = σ x ¯
In the formula, σ is the standard deviation of NDVI from 2000 to 2020, and x ¯ is the mean value of NDVI from 2000 to 2020.
Correlation analysis between NDVI and climate factors is a powerful tool to detect the response of ecosystem functions to global climate change [36,37]. Pearson correlation coefficients were used to explore the relationships of NDVI with precipitation, air temperature, solar radiation, and potential evapotranspiration [38]. Based on the p of the MK trend test, the results of the Pearson correlation test were divided by 0 at a significance level of 0.05, and the results of the reclassification were multiplied using the raster calculator of ArcGIS 10.2, which was used to analyse the significance of the correlation between the NDVI and each climatic factor.
The Hurst index (H) is frequently utilized in climatology, hydrology, and other domains to examine the continuity and correlation of changes in long-time-series data, reflecting future trends [39,40,41]. H > 0.5 indicates that the future trend is consistent with the study phase, implying that the trend in the study period will continue in the future; H = 0.5 reveals an indeterminate future trend in change; and H < 0.5 demonstrates that the next trend in change is opposite to the study phase [42,43,44]. The reclassification results were multiplied using the raster calculator of ArcGIS 10.2 based on the Z of the MK trend test, divided by 0; and the p divided by 0.01 and 0.05; combined with the Hurst index, divided by 0.5; and were used to predict the trend in the future vegetation changes.

2.3.2. Relationship between Vegetation and Influencing Factors

To describe the dynamic changes in vegetation more accurately, we calculated the contribution rate of each influencing factor based on the partial derivative of the NDVI change rate. In this study, based on the original three climatic factors of precipitation, temperature, and solar radiation, the contribution rate of potential evapotranspiration, a climatic factor, was considered. The updated formula is as follows:
d N D V I d t = N D V I p r e × d p r e d t + N D V I t e m × d t e m d t + N D V I s o r × d s o r d t + N D V I e t × d e t d t + U F = C pre + C tem + C sor + C et + U F
In the formula, d N D V I d t , d p r e d t , d t e m d t , d s o r d t and det d t , represent the change rates of NDVI, precipitation, temperature, solar radiation, and potential evapotranspiration over time, respectively; N D V I p r e , N D V I t e m , N D V I s o r , and N D V I e t are the slopes of the linear regression lines between NDVI and precipitation, temperature, solar radiation, and potential evapotranspiration, respectively; and UF is the residual of the NDVI change rate and the contribution rate of climate factors, which represents the contribution rate of unknown factors dominated by human factors, for example, land use change, implementation of ecological projects, urbanisation, etc. [29,45].

2.3.3. The Environment for Calculations

In this paper, all calculations were performed on pixel scales. ArcGIS 10.2 was used for the splicing and cropping of NDVI, as well as basic arithmetic, Matlab 2021a for bias correlation analysis, significance, calculation of Hurst index, and MK tend tests were performed in the R 4.2.3 environment using the ‘sp’, ‘raster’, ‘rgdal’, and ‘trend’ packages, respectively.

3. Results

3.1. Temporal and Spatial Changes in Vegetation in the Yinshanbeilu Grassland Region

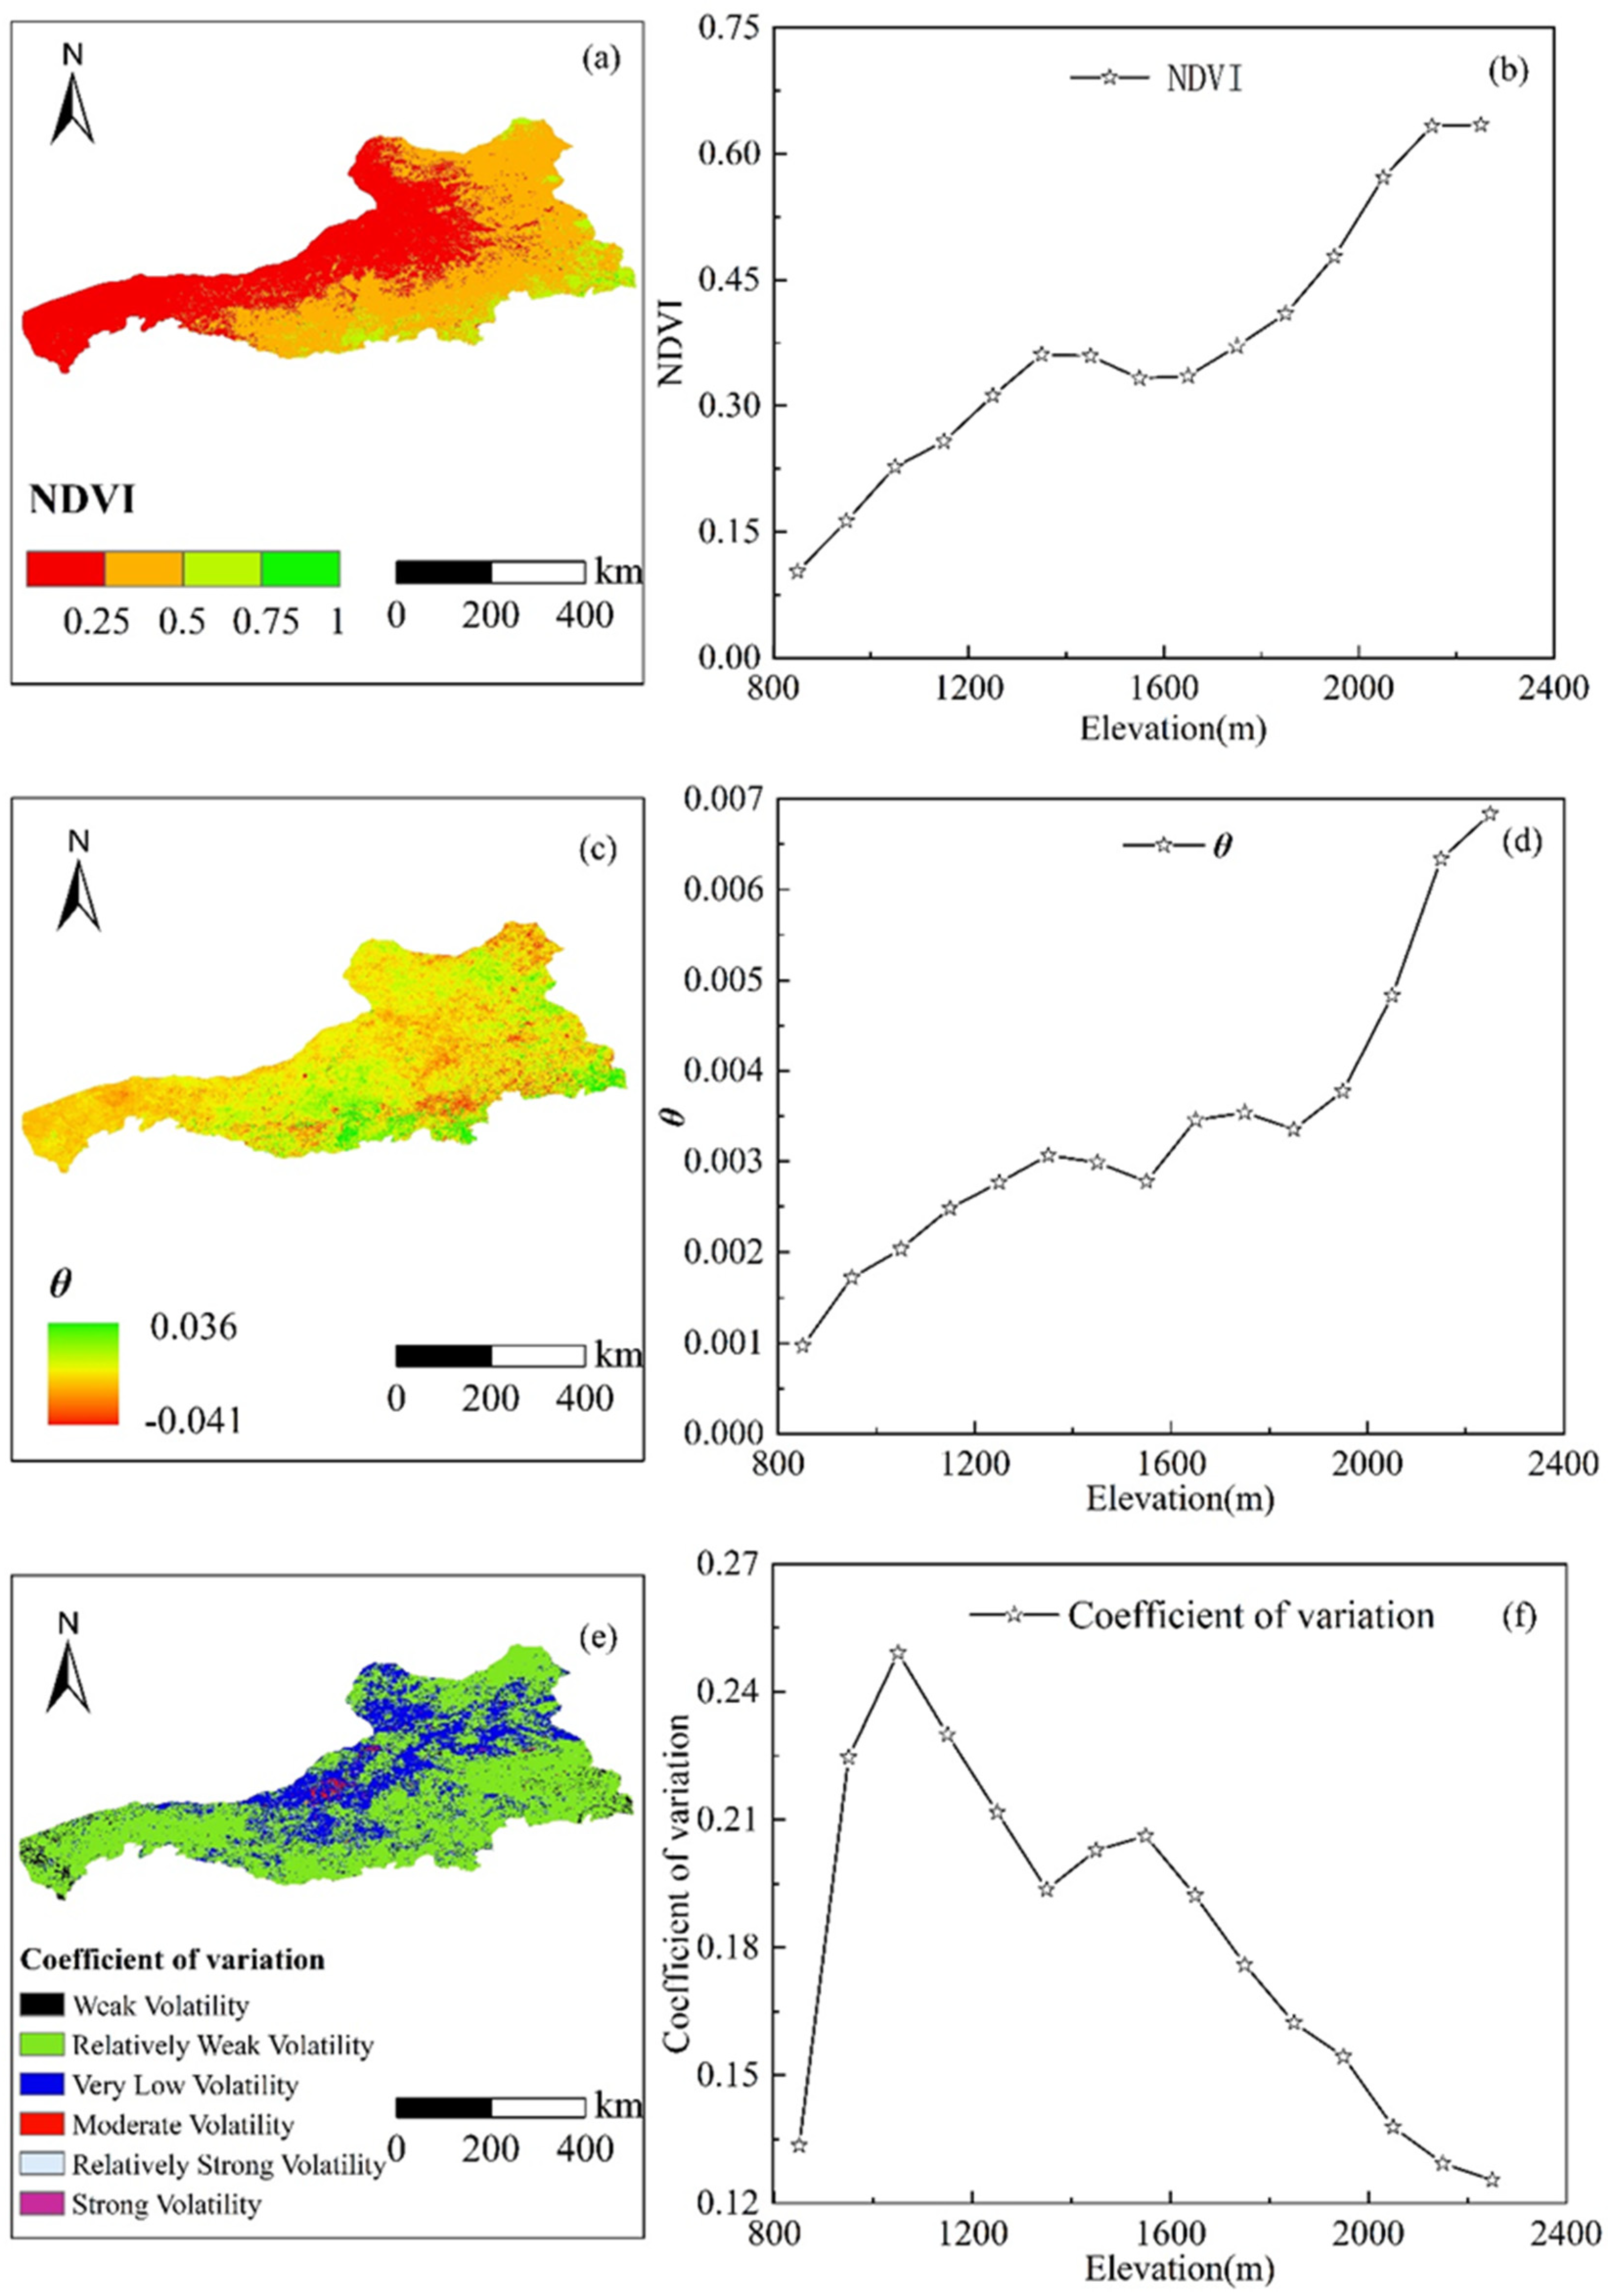
3.1.1. Spatial Variation Trend in NDVI

The multi-year average NDVI (Figure 3a) during 2000–2020 gradually increased from northwest to southeast, with a change range of 0.01–0.89. The high values of NDVI (0.75–10) were mainly distributed in the southeast region. Low NDVI values (0–0.25) were mainly distributed in the northwest region. The vegetation types in the study area can be divided into coniferous forest, broad-leaved forest, shrubland, grassland, meadow, desert, cultivated vegetation, and others (Figure 4a). The largest average NDVI was for coniferous forest (0.495), followed by broad-leaved forest (0.471) (Table 2). Mean NDVI values also varied at different altitudes (Figure 3b). In the altitude range of 1400–1600 m, the NDVI value decreased with increased altitude; for other altitudes, the NDVI value increased with increased altitude.
The change range of NDVI values (Figure 3c) during 2000–2020 was from −0.041 to 0.036/a, with the lowest value in parts of the southern and eastern parts of the study area. Each vegetation type had a unique average change rate. The average change rate was greatest for coniferous forests (0.005/a), followed by cultivated vegetation (0.004/a). At different altitudes, the average change rate of NDVI values differed (Figure 3d). In the altitude ranges of 800–1400, 1600–1800, and 2000–2300 m, the average change rate of NDVI values increased with increasing altitude. The largest proportion was that with a slight improving trend, accounting for 61.92% of the total area.
To better explore the dynamic changes in vegetation, CV was used to study the fluctuation in vegetation (Figure 3e). The CV values in the northern and central areas of the study area were higher and so volatility was greater. In this study, CV was divided into six categories, the largest proportion was weak variation (0.1–0.25), accounting for 70.44% of the total area. Different vegetation types had different CV values. The maximum CV value was for other (0.455), followed by grassland (0.228). Changes in altitude also affected the volatility of vegetation (Figure 3f). At 1000–1400 and 1600–2400 m, as altitude increased, CV showed a decreasing trend, that is, volatility decreased.
During the study period, the largest percentage of vegetation change was the insignificant improvement trend, which accounted for 73.62% of the total area, while insignificant degradation (10.17%) and significant improvement (14.90%) had similar areas, with significant degradation accounting for only 0.47% of the total area (Figure 4b).

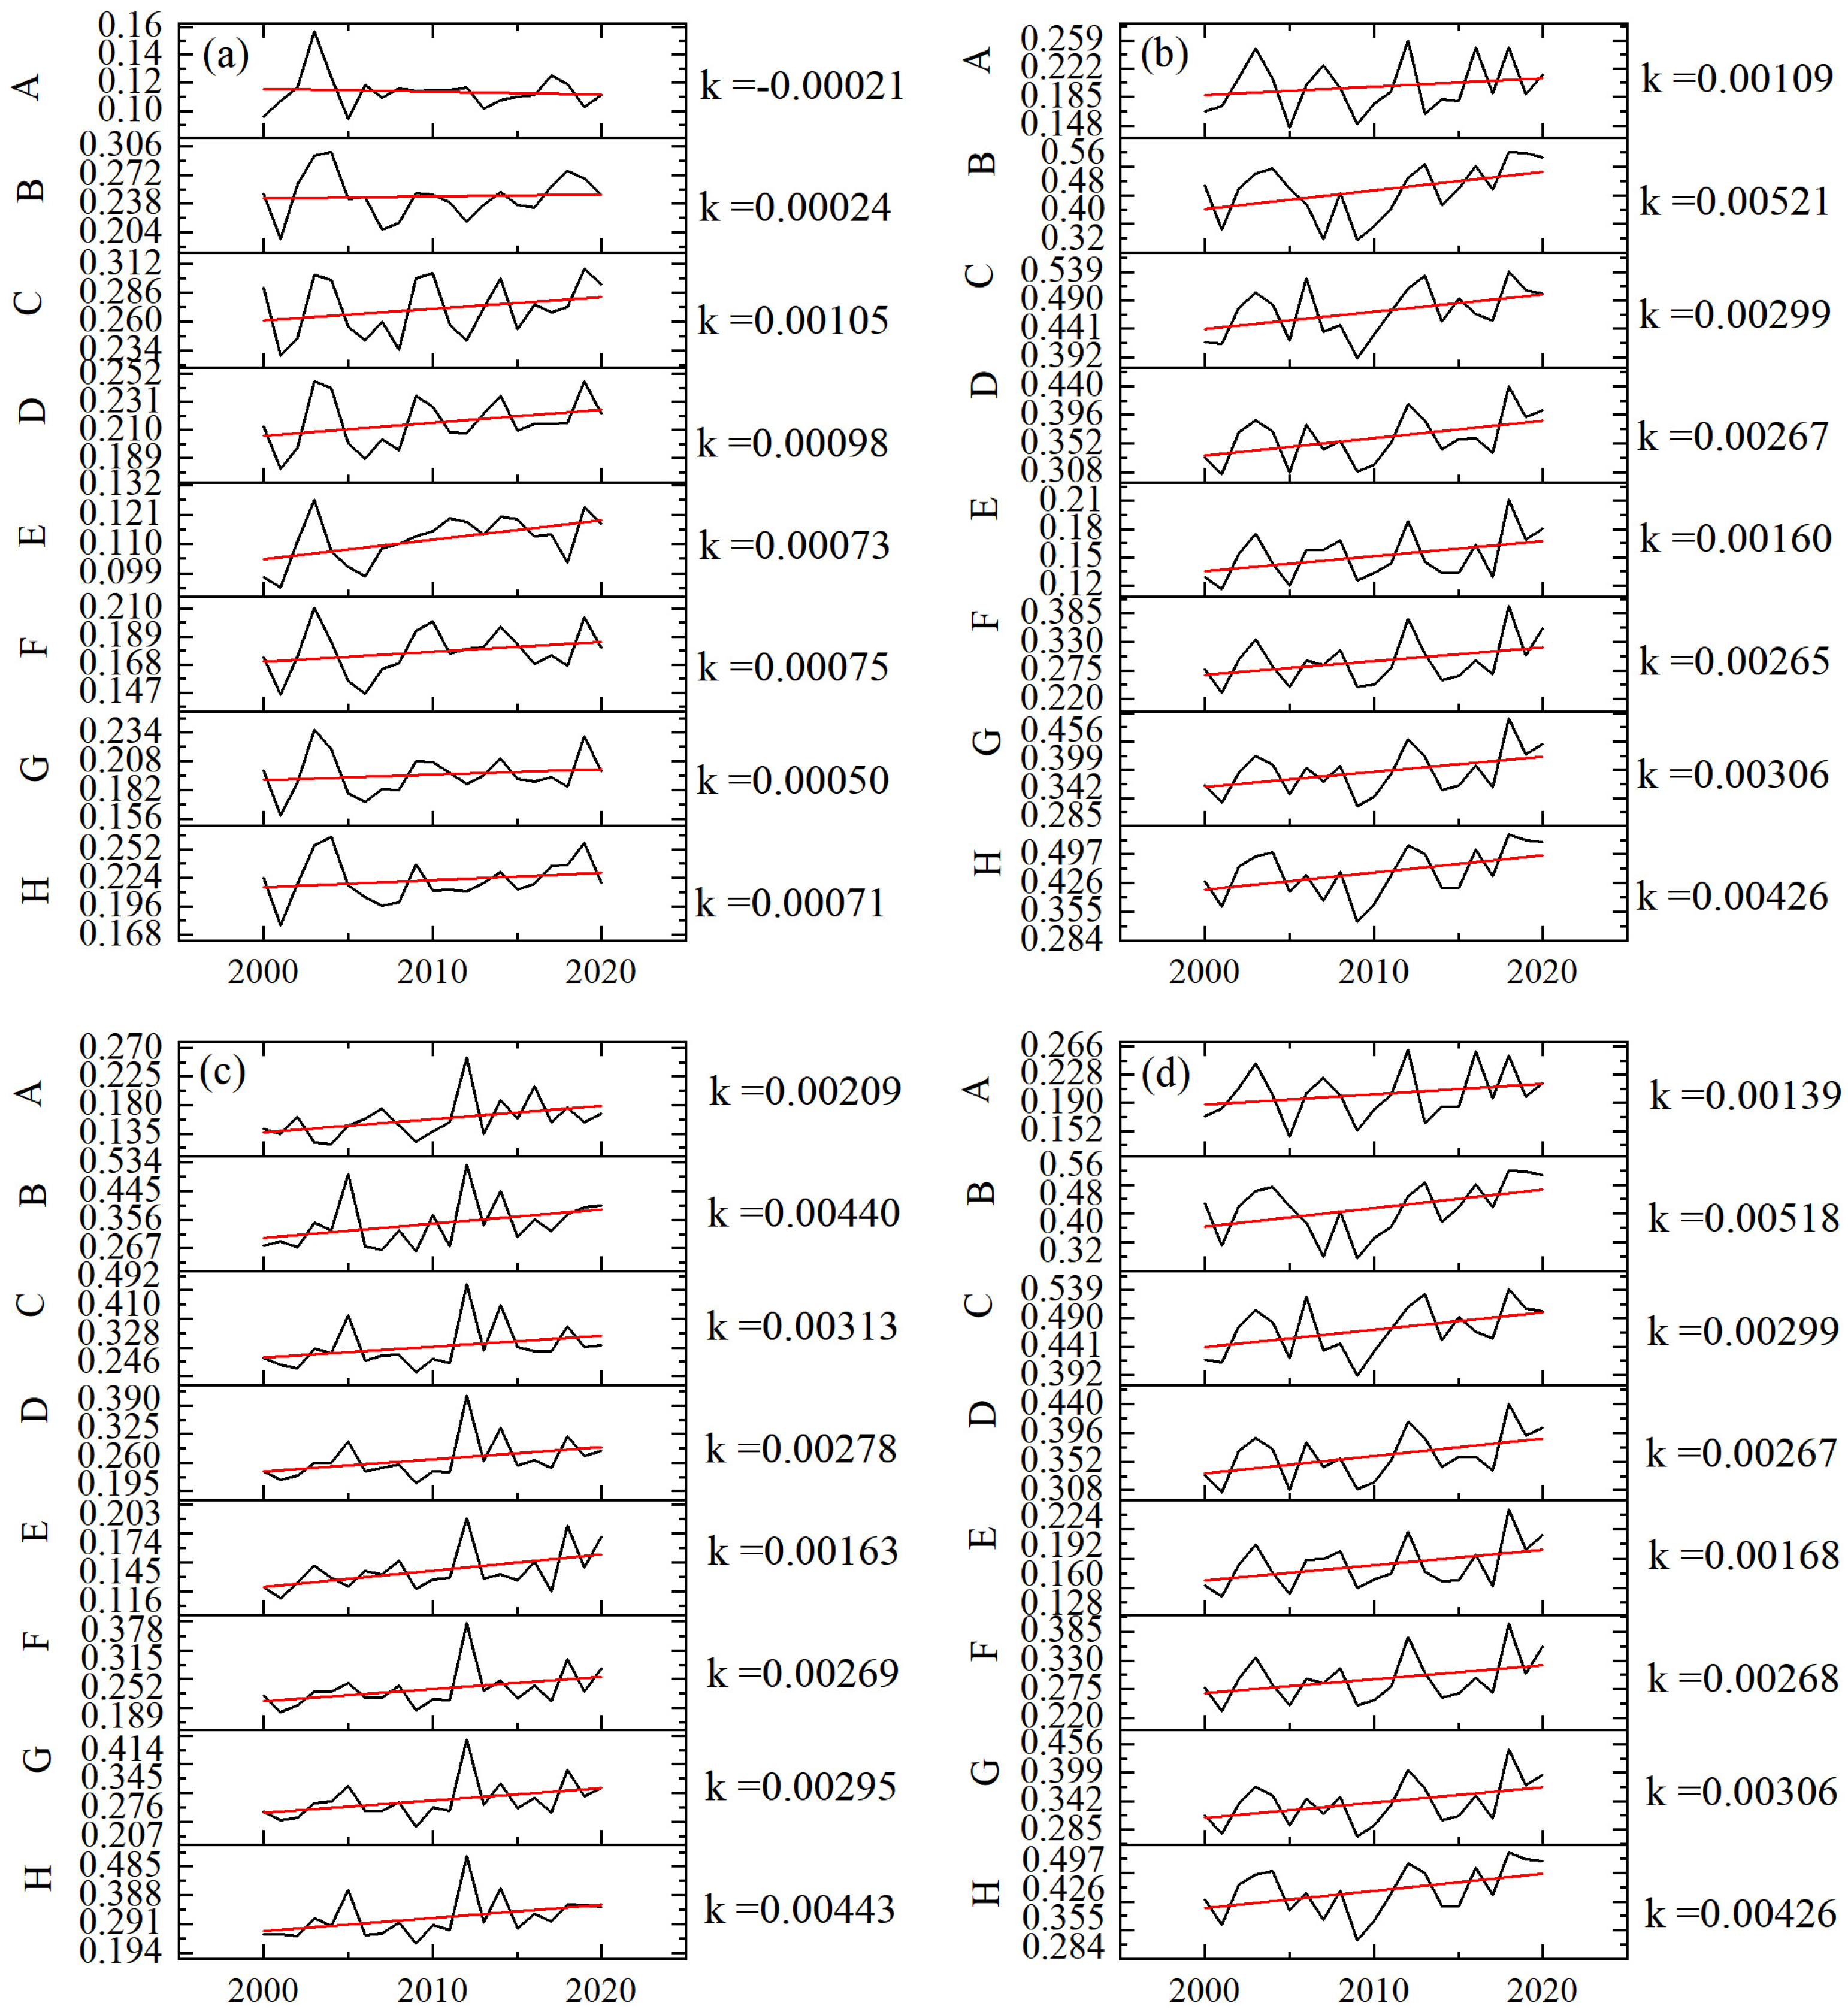
3.1.2. Seasonal Changes in NDVI

Vegetation growth and development occur in three seasons: spring, summer, and autumn. Thus, NDVI changes in spring, summer, and autumn were analysed. The average change rate of annual average NDVI during 2000–2020 was 0.00267/a, was greatest in 2018 with 0.388/a, and least in 2011 with 0.234/a. The average change rate of NDVI during the growing season was also 0.00267/a. Different vegetations had different trends in change over time (Figure 5, Table 3). The change rate of each vegetation type in spring was smaller than in other seasons. The growth rate of the broad-leaved forest was the fastest in spring, with 0.00105/a. The increasing trend in coniferous forest was at its greatest in summer, with 0.00521/a, followed by cultivated vegetation with 0.00426/a. For autumn, the growth rate of cultivated vegetation was fastest, with 0.00443/a, followed by coniferous forest with 0.00440/a. The fastest growth rate in the whole growing season was also the coniferous forest with 0.00518/a, followed by cultivated vegetation with 0.00426/a. The order for the rate of vegetation growth during the growing season was coniferous forest > cultivated vegetation > meadow > broad-leaved forest > grassland > shrubland > desert > others.

3.2. Relationship between Vegetation Change and Climate Factors

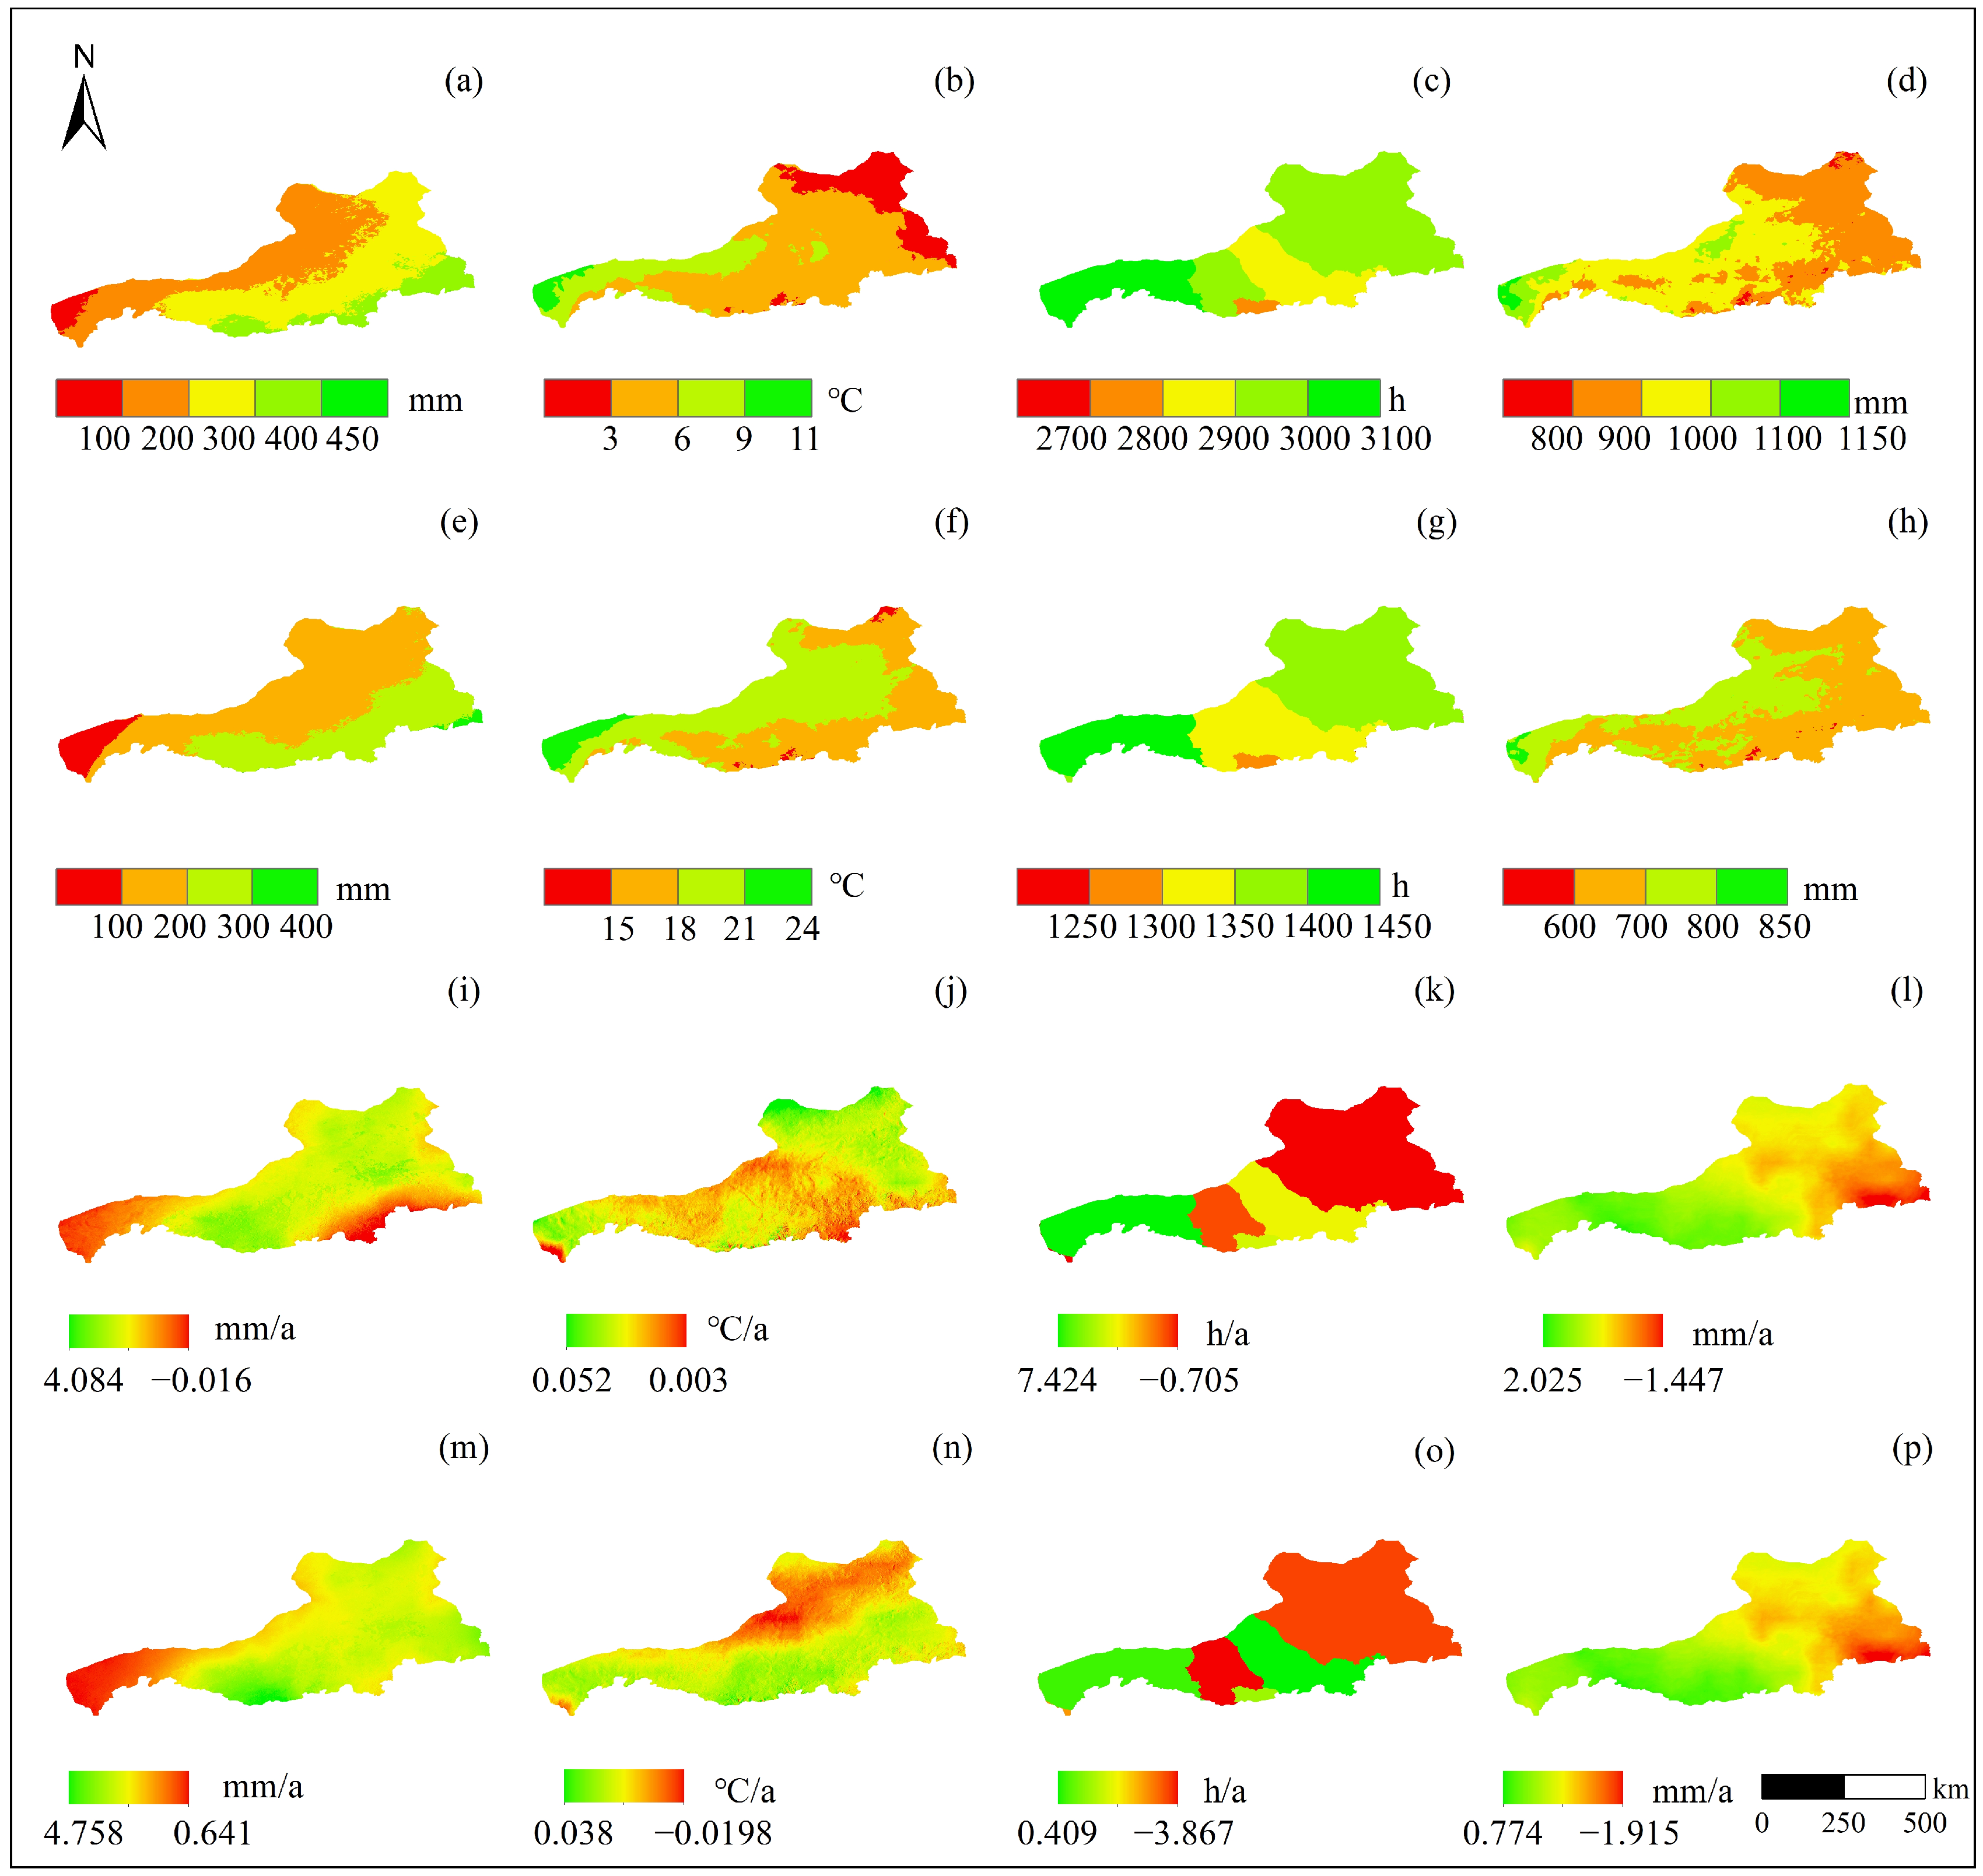
3.2.1. Temporal and Spatial Changes in Climate Factors

The changing characteristics of each climate factor differed over time (Figure 6a–d). Precipitation increased by 6.10 mm/a in the growing season, with was the largest increase, and showed a downward trend in spring with −0.52 mm/a (Figure 6a). During 2000–2020, temperature showed an upward trend, and rose fastest in spring, with 0.71 °C/a (Figure 6b). Cumulative sunshine hours decreased most obviously during the growing season, with −2.15 h/a (Figure 6c) and had the greatest increase in spring (1.99 h/a). Potential evapotranspiration declined the most in the summer (−1.84 mm/a) and rose the most in spring with 4.01 mm/a (Figure 6d).
There were obvious regional characteristics for annual precipitation, temperature, annual cumulative sunshine hours, and potential evapotranspiration during 2000–2020 (Figure 7a–h). Annual precipitation differed greatly between southeast and northwest regions. Specifically, the southeast region had abundant precipitation, mostly >300 mm, while the northwest had <100 mm (the region with the lowest precipitation in the study area) (Figure 7a). Temperature in the southwest was highest, 9–11 °C, and was lower in the southeast, mostly <3 °C, with the lowest being −0.05 °C (Figure 7b). Annual cumulative sunshine hours showed an overall increasing trend and were long in the northeast and southwest with range of 3000–3100 h (Figure 7c). Potential evapotranspiration was <900 mm in northeast China (Figure 7d). The spatial distribution and variation trend in climate factors in the growing season during 2000–2020 also had obvious regional characteristics (Figure 7e–h). Growing season precipitation gradually decreased from southeast to northwest, following the annual change trend, and was lowest in the southwest, with <100 mm (Figure 7e). The distribution of potential evapotranspiration was consistent with temperature, with greater potential evapotranspiration in areas of increasing temperature, reaching a maximum in the southwest (Figure 7f,h). Cumulative sunshine duration during the growing season was lower in the central region and highest in the west, with 1400–1450 h, followed by the northeast with 1350–1400 h (Figure 7g).
The annual average rate of change in the four climatic factors had an increasing trend (Figure 7i–l). From the southeast and southwest to the central region, the rate of change in precipitation gradually increased (Figure 7i). Temperature change rates were small in the central area, with 0.003 °C/a, and large in the northeast and some parts of the southwest (Figure 7g). The change rate of annual cumulative sunshine hours gradually increased from northeast to southwest, reaching a maximum of 7.424 h/a (Figure 7k). With a maximum of 2.025 mm/a, the rate of change in potential evapotranspiration was high in the southwest (Figure 7l). In terms of the changing trend in climate factors in the growing season (Figure 7m–p), precipitation showed a trend in initially increasing, then decreasing, and then increasing from southwest to east, with the highest change rate of 4.758 mm/a (Figure 7m). Temperature change rates were lower in northern regions, with a minimum of 0.0198 °C/a, and the overall rate of temperature change did not vary much (Figure 7n). Cumulative sunshine hours in the growing season in the northeast and central regions showed a decreasing trend, with a minimum of −3.867 h/a (Figure 7o). From the east to the west, the rate of change in potential evapotranspiration gradually increased during the growing season (Figure 7p).
The total precipitation in the growing season is equivalent to the total precipitation in the whole year. The average annual precipitation was 218.19 mm, and regional average of total precipitation in the growing season was 182.74 mm. Thus, about 85% of the year’s average total regional precipitation falls during the growing season. Both average annual precipitation and average precipitation in the growing season had the same distribution trend, with a gradual increase from southwest to east. Average temperatures during the growing season were generally higher than the annual average and rose to the southwest. Growing season temperature change rate differed from annual change rate. The annual temperature change rate increased from the centre to the east and west, while temperature change rate during the growing season increased from the north to the south—it was higher in the south and lower in the north. Cumulative annual sunshine hours and cumulative growing season sunshine hours in the central region were both less than values for the western and eastern parts of the Yinshanbeilu grassland region. The overall trend in the change rate of the two was the same but was greater for the annual increase and less for the growth season. The distribution and change rate of potential evapotranspiration and temperature had the same trend.

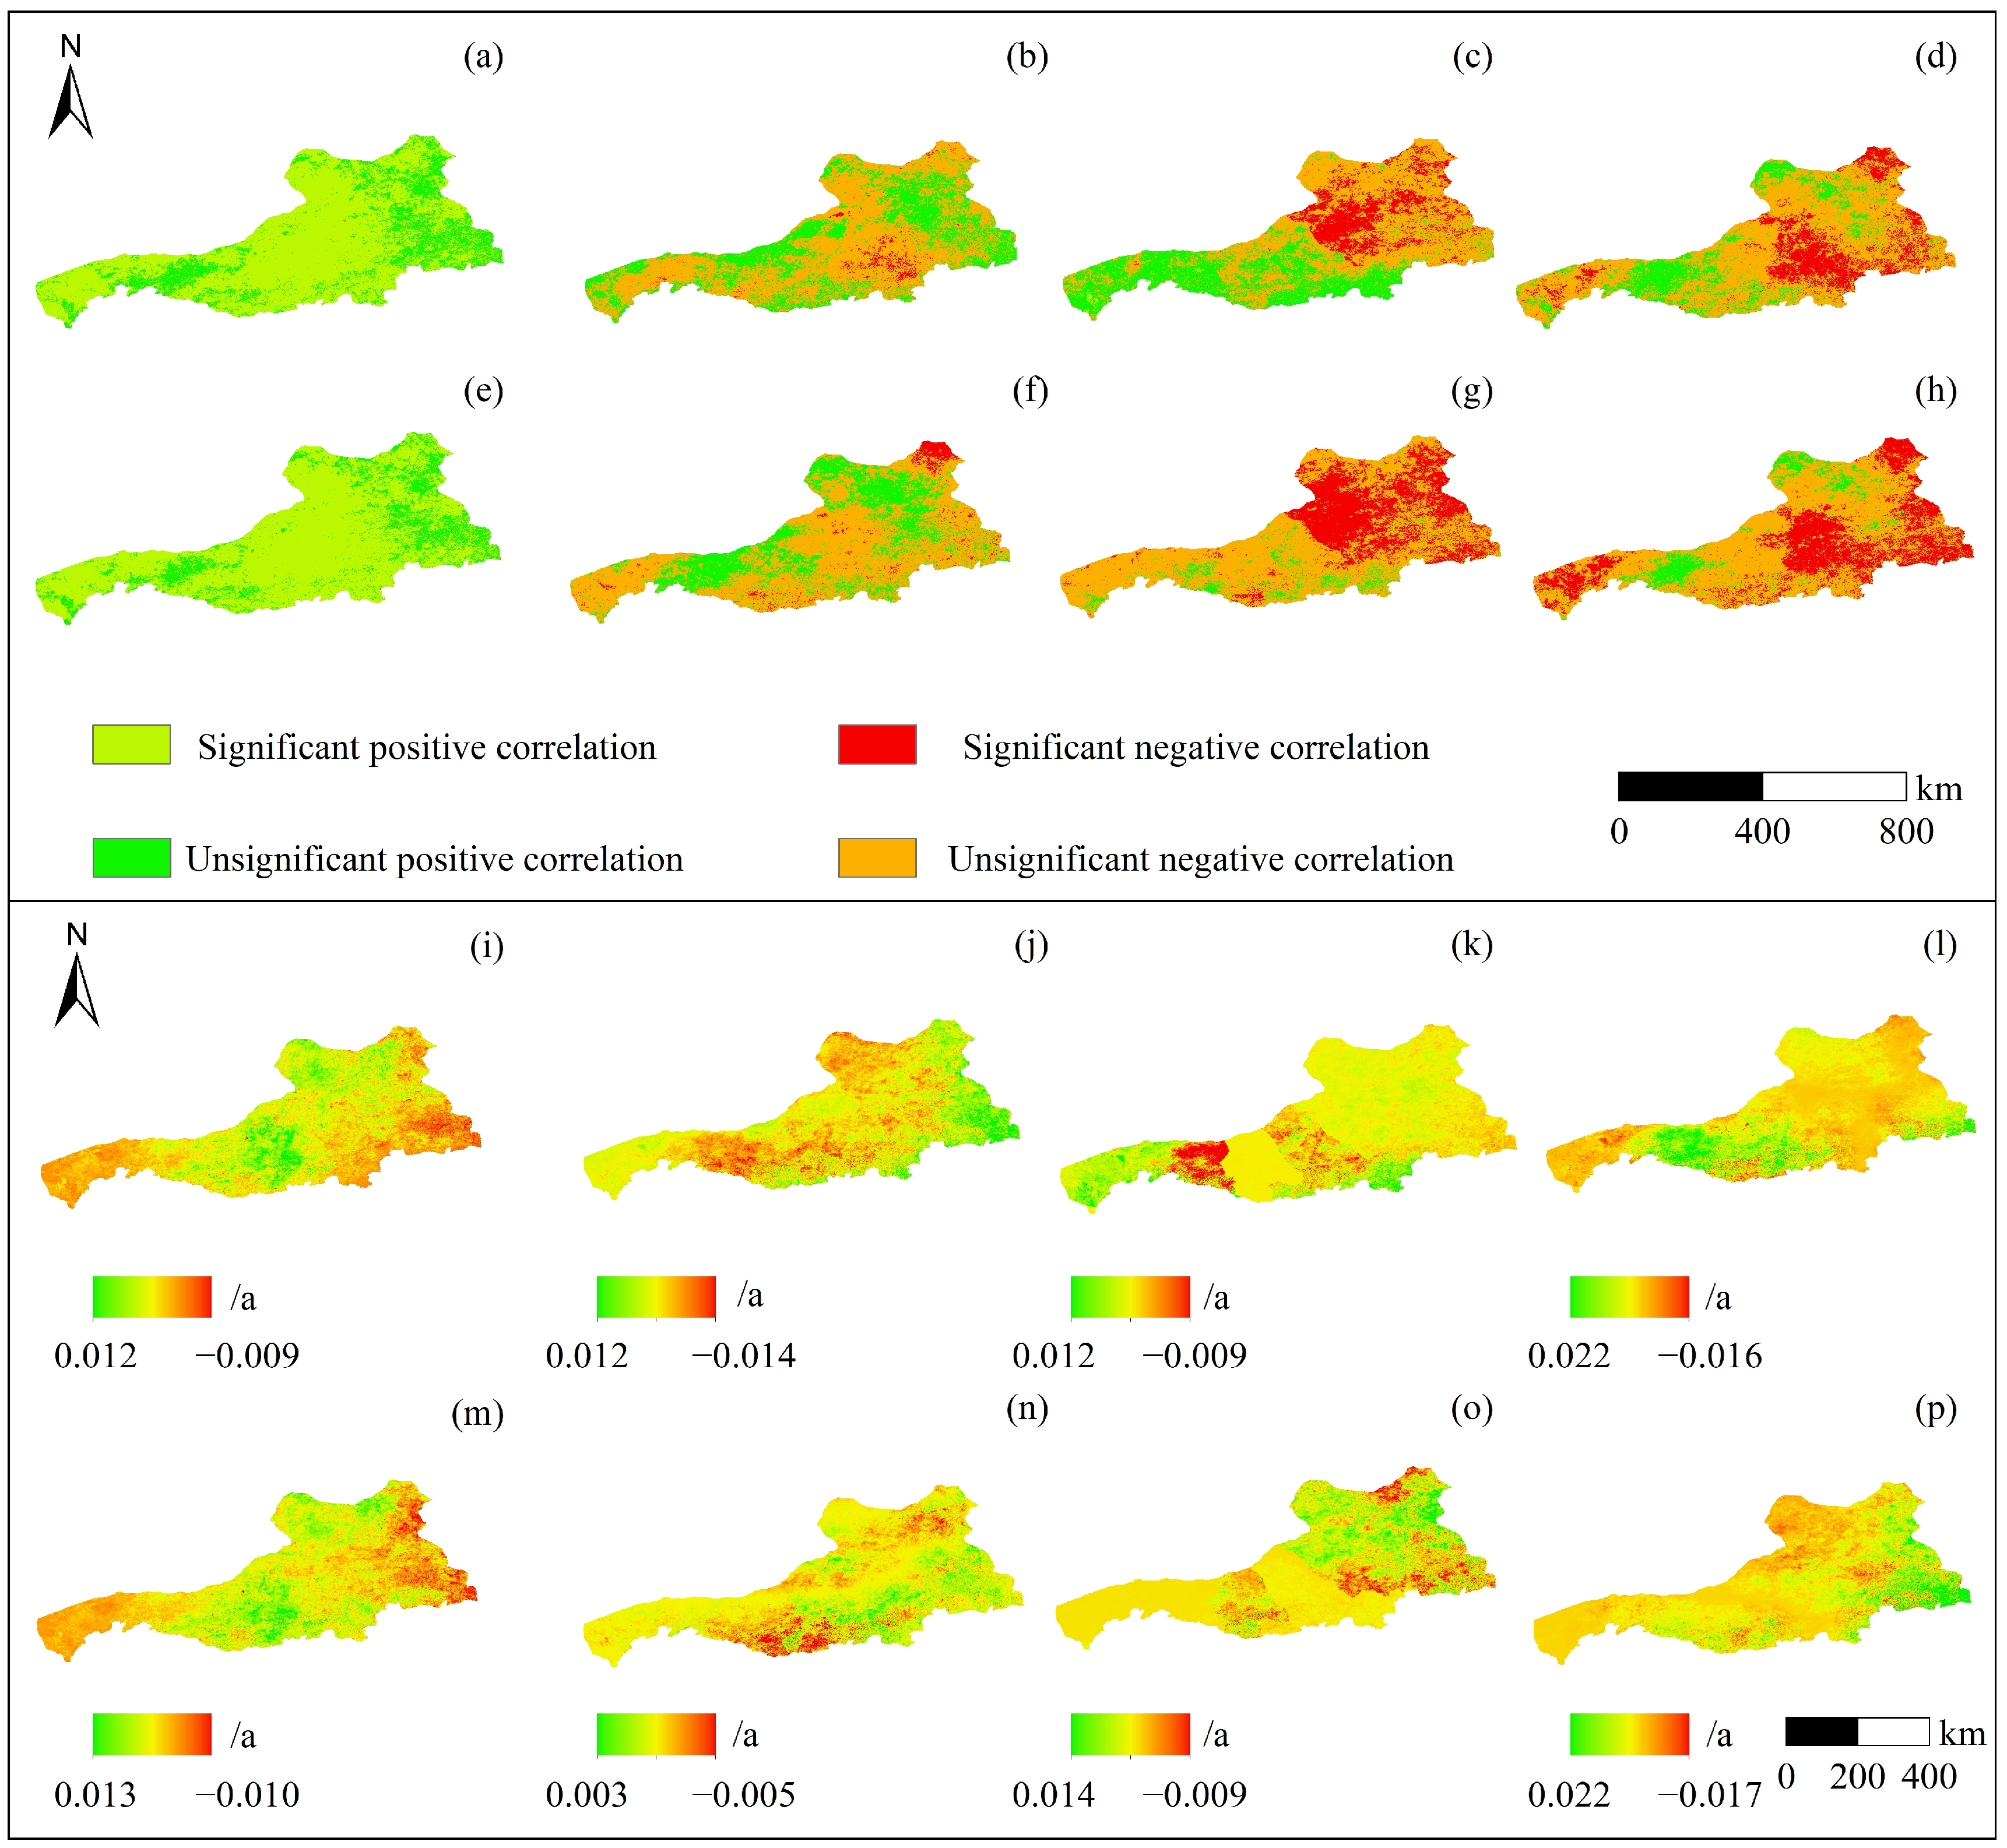
3.2.2. Correlations between NDVI and Various Climate Factors

For the whole year, the correlation coefficients of NDVI with precipitation, temperature, annual cumulative sunshine hours, and potential evapotranspiration during 2000–2020 were 0.532, −0.080, −0.148, and −0.217, respectively. There was a positive correlation between annual NDVI and precipitation in 99.58% of the area, and a significant positive correlation between annual NDVI and precipitation in 75.84%, mainly concentrated in the central region and parts of the southwest, indicating that precipitation affected vegetation throughout the year (Figure 8a).
Temperature, annual accumulated sunshine, and annual potential evapotranspiration were unfavourable to annual vegetation growth in the Yinshanbeilu grassland region. In 66.90% of the area, the annual NDVI and temperature were negatively correlated—in particular, 2.49% of the study area had a significant negative correlation between these two. The areas with a positive correlation between NDVI and temperature throughout the year accounted for 33.10% of the study area, and areas with a significant positive correlation only accounted for 0.25% (Figure 8b). For annual cumulative sunshine hours, negative correlation areas accounted for 69.92% of the study area, and significant negative correlations accounted for 15.67%, mainly concentrated in the central region (Figure 8c). In the entire region, there was a negative correlation in potential evapotranspiration representing 83.21%, and significant negative correlations accounted for 17.85% of the entire region, which were mainly concentrated in the southern and eastern regions (Figure 8d).
During the growing season, NDVI was positively correlated with precipitation and negatively with temperature, sunshine hours, and potential evapotranspiration during 2000–2020. Precipitation was beneficial to and played a leading role in vegetation growth in the Yinshanbeilu grassland region during the growing season. The NDVI and precipitation during the growing season were positively correlated in 99.65% of the area, and significant positive correlations accounted for 79.86% and were mainly concentrated in the central and southwest parts (Figure 8e).
Temperature, cumulative sunshine hours, and potential evapotranspiration in the growing season were unfavourable to the vegetative growth in the Yinshanbeilu grassland region during the growing season. The NDVI in the growing season was negatively correlated with temperature in 71.29% of the area, and significant negative correlations only accounted for 3.74% (Figure 8f). Throughout the growing season, the area with negative correlations between NDVI and cumulative sunshine hours was as high as 94.38%. It is noteworthy that significant negative correlations accounted for 30.13% of the area, mainly concentrated in the northern and western regions (Figure 8g). Growing season NDVI and growing season potential evapotranspiration were also negatively correlated in 91.41% of the area, of which 29.49% had significant negative correlations, which were mainly concentrated in a few areas in the centre, southwest, and south of the study area (Figure 8h).

3.3. Impact of Climate Change and Human Factors on Vegetation Changes

3.3.1. Contribution of Climate Change to Vegetation Changes

The average contribution rates of different climate factors are different to NDVI changes (Table 3). From the perspective of the whole year, precipitation, temperature, annual cumulative sunshine hours, and potential evapotranspiration had the largest positive average contribution to annual NDVI change in the entire region: precipitation had 0.001729/a, followed by potential evapotranspiration with 0.000743/a, and only temperature had a negative average contribution to NDVI of the whole region (Figure 8i–l). For the growing season, the positive average contribution of precipitation to changes in NDVI across the region was still the largest at 0.001801/a, followed by potential evapotranspiration at 0.000595/a, and temperature still had a negative contribution (Figure 8m–p).
The mean contribution of precipitation to NDVI change was the greatest for both the annual and growing seasons, temperature contributed negatively for both seasons, and cumulative sunshine hours contributed relatively little to the mean contribution to NDVI. Potential evapotranspiration was the second largest contributor for both annual and growing seasons.

3.3.2. Contribution of Human Factors to Vegetation Change

The impact of human activities on vegetation dynamics cannot be ignored (Table 4). During 2000–2020, for the whole year, the interannual change rate of NDVI was 0.00267/a, which can be explained by the mutual change in the contribution rate of climatic factors of 0.00226/a and the contribution rate of human factors of 0.00041/a. Thus, climate factors dominated, contributing 84.76% to the annual NDVI compared with the contribution rate of human factors of 15.24% (Figure 9a). In the whole year, human factors inhibited vegetation growth in 40.43% of the area, promoted vegetation growth in 57.92%, and had no effect in 1.65% (Figure 9c). During the growing season, climate factors accounted for 0.00260/a and contributed to 97.36% of the NDVI, while correspondingly human factors contributed 0.00007/a and 2.64% (Figure 9b). In the growing season, human factors inhibited vegetation growth in 47.01% of the area, promoted vegetation growth in 52.94%, and only 0.05% was not affected by human factors (Figure 9d).

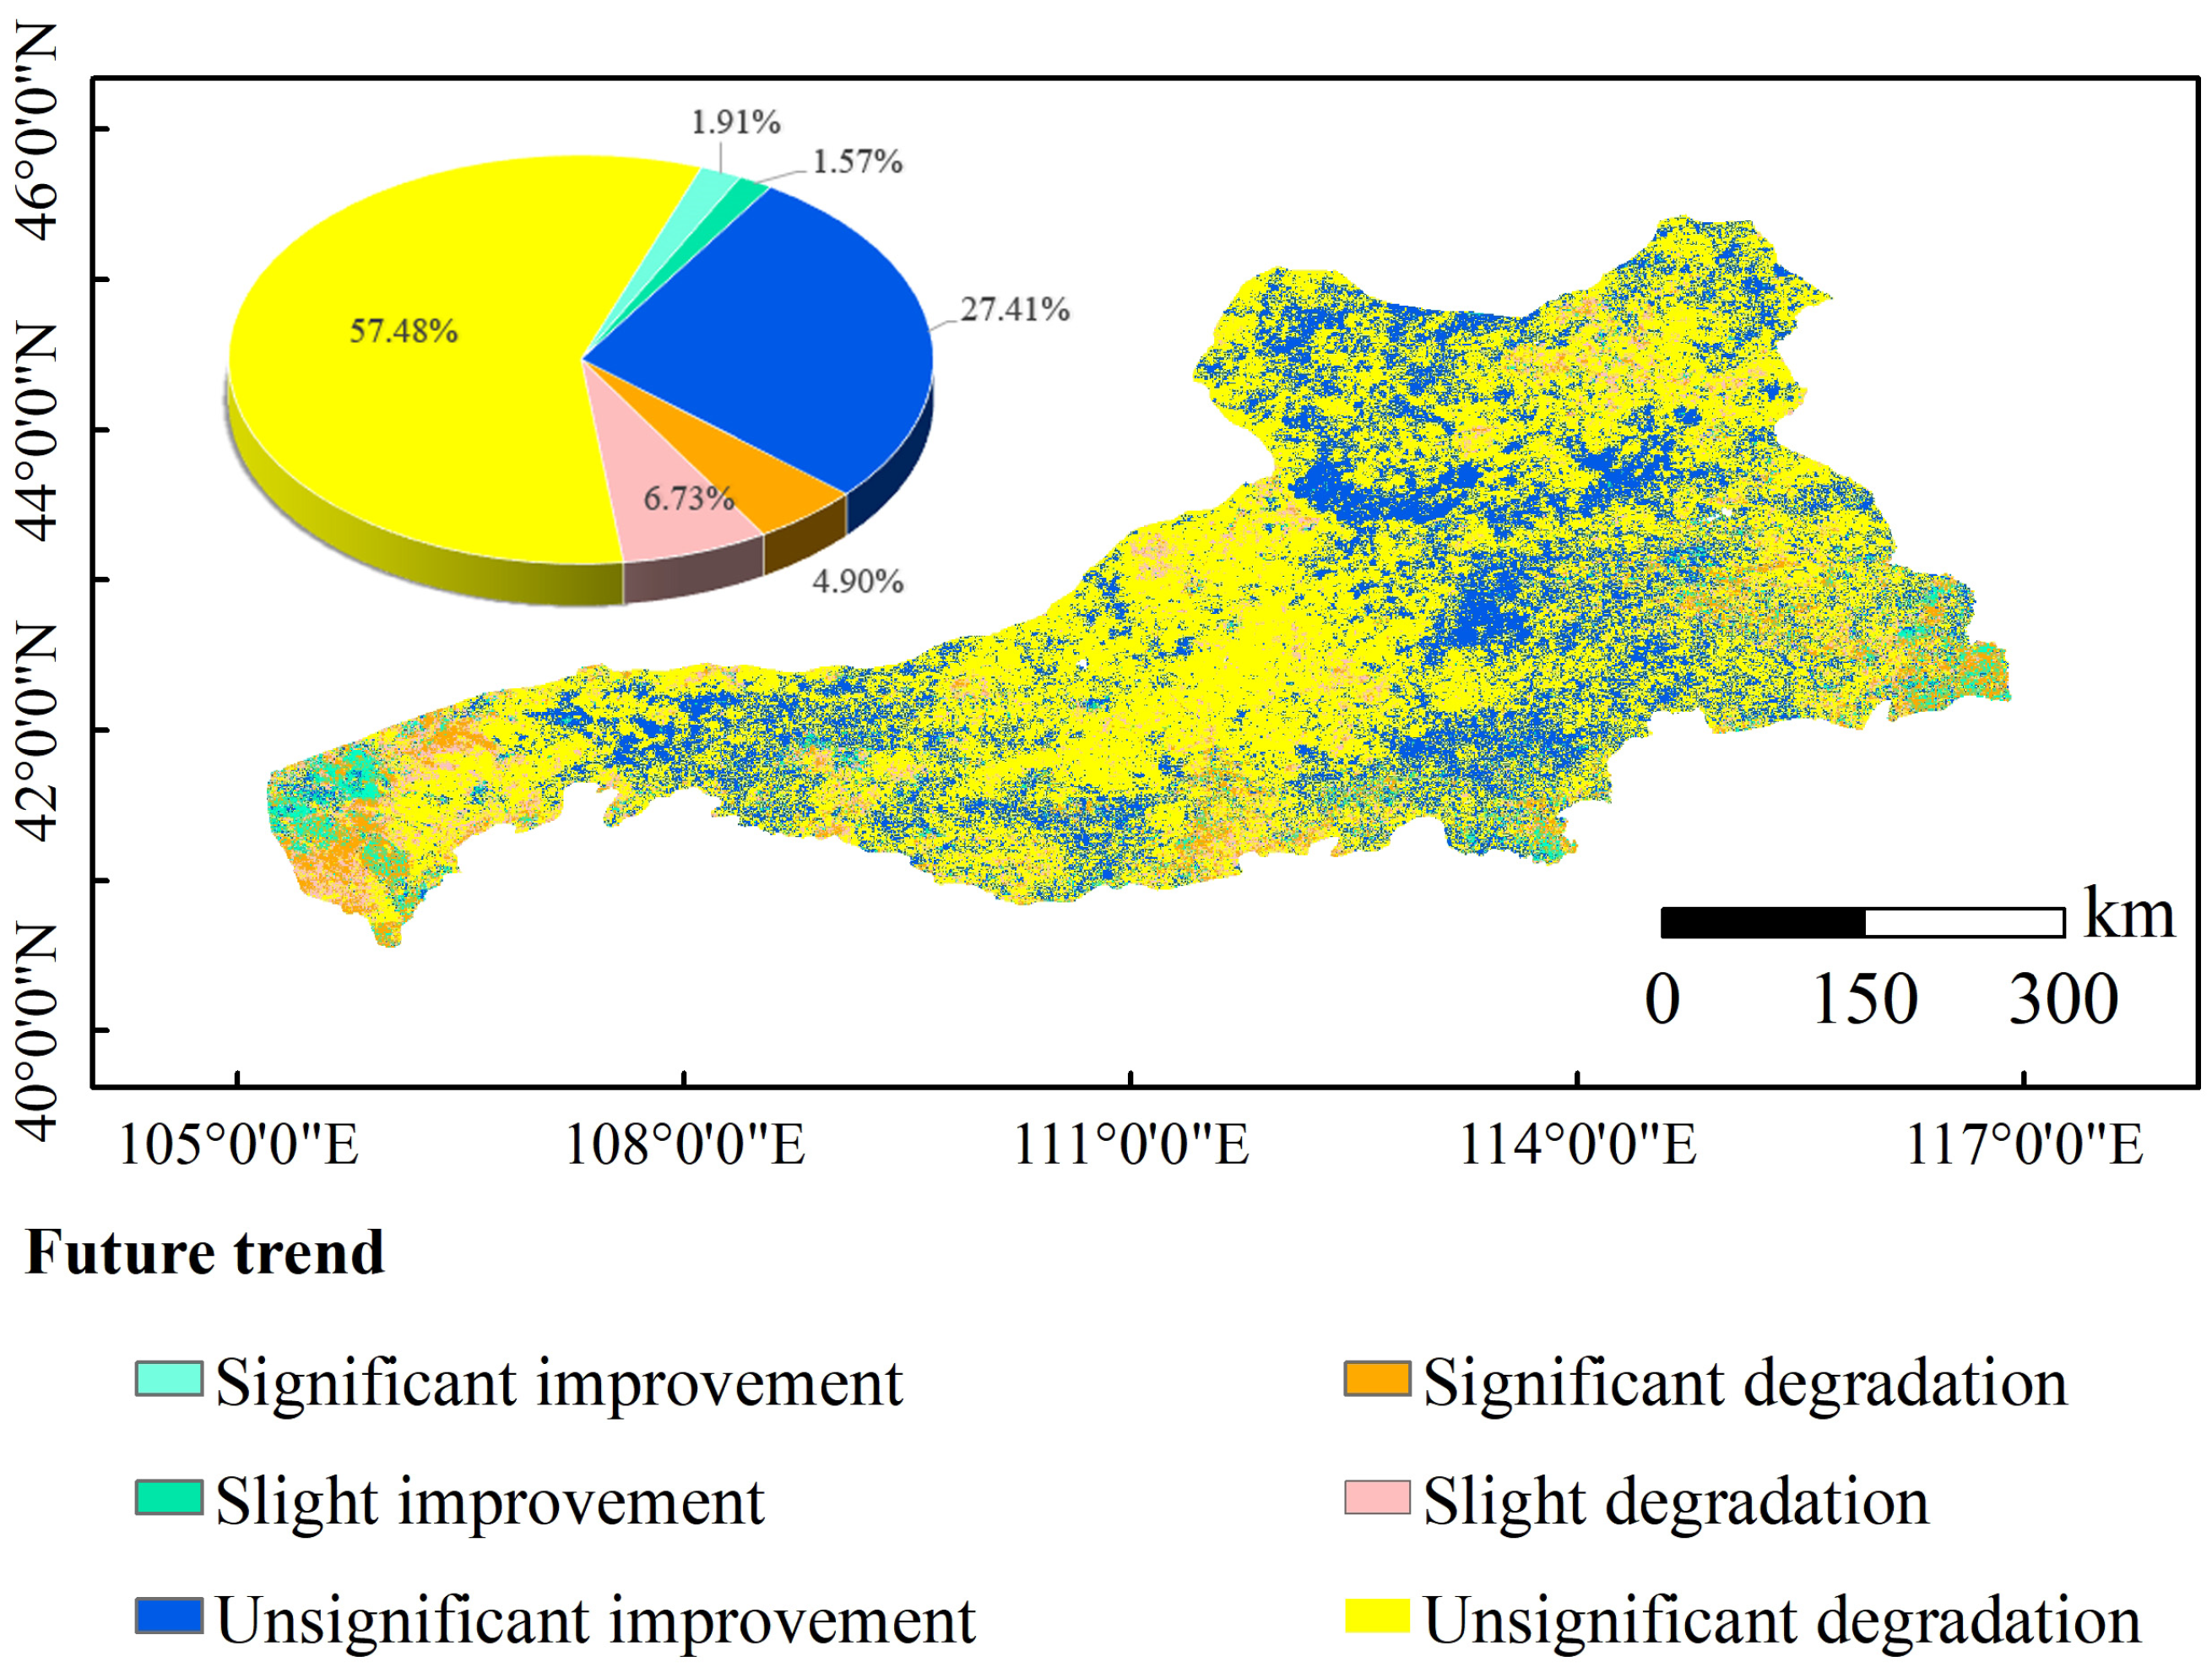
3.4. Trends in Future Changes in Vegetation

In the Yinshanbeilu grassland region, 88.43% of the area had H < 0.5, indicating that the trend in vegetation change in these areas will be opposite to the that during 2000–2020. In the future, the largest proportion of areas with no significant improved and non-significantly degraded vegetation cover, accounting for a total of 84.89% of the total area. The central region is where the insignificantly degraded areas are located, while the insignificant improvements are located in the eastern region. Grassland is the primary vegetation type in both (Figure 10). Of the study area, 1.91% will show a significant improvement trend in the future, and 4.90% will show significant degradation.

4. Discussion

4.1. NDVI Change Rate of Vegetation for the Yinshanbeilu Grassland Region

Global climate change has a strong impact on vegetation changes. Changes in water balance, ecological balance, and terrestrial carbon cycle are affected by vegetation [46,47,48,49]. Vegetation changes are affected by climate factors and human activities. During 2000–2020, the vegetation of the Yinshanbeilu grassland region tended to be green, and the average annual change rate of NDVI was 0.00267/a. The growth rate of China’s NDVI during 2001–2020 was 0.0021/a, but the change rate for the Yinshanbeilu grassland region was greater than this value [50]. Due to the combined effects of climate change and ecological restoration, vegetation greening in arid areas of northern China increased significantly after 2000 [51,52]. Studies have shown that the overall vegetation coverage in the Loess Plateau region showed an upward trend with a growth rate of 0.005/a during 2000–2020. During the study period, the vegetation growth rate in the Yinshanbeilu grassland region was 0.00233/a lower than that in the Loess Plateau. The growth rate of grassland in Inner Mongolia during 2000–2020 was 0.002/a [53]. The Yinshanbeilu grassland region is located in the middle of Inner Mongolia, and its vegetation growth rate is 0.00067/a greater than that of grassland in Inner Mongolia. Inner Mongolia’s NDVI growth rate during 2000–2012 was 0.0016/a. The growth rate of NDVI in the Yinshanbeilu grassland region during the study period was greater than that in Inner Mongolia [54].

4.2. Impact of Climate Factors on Vegetation Changes

4.2.1. Precipitation Affects Vegetation Changes

Studies have shown that climate change is the decisive factor affecting vegetation growth, and climate factors are more important than human factors in improving vegetation, with the main climate factors being precipitation, temperature, sunshine duration, and potential evapotranspiration [55,56,57,58]. Although the main drivers of vegetation change differed in various regions, China’s NDVI was generally on an upward trend and the degree of vegetation greening increased [59,60]. Temperature and precipitation were the main factors affecting changes in China’s NDVI. There was a significant positive correlation between NDVI and precipitation in the northwest region [61]. Some studies have shown high NDVI values around high precipitation areas in arid and semi-arid areas [62]. This is consistent with the fact that in our study, the multi-year average NDVI gradually increased from northwest to southeast, and precipitation also gradually increased from northwest to southeast. The possible reason is limited precipitation in arid and semi-arid regions, which may be the main factor limiting vegetation growth [63]. It is also possible that the southwestern region is connected to the Loess Plateau region, and some studies have shown that topography significantly influences the spatial distribution of precipitation [64].
However, on the Tibetan Plateau, which is located in arid and semi-arid areas, temperature has a stronger beneficial effect on vegetation than precipitation [65]. The possible reason is that the greater average altitude of the Qinghai–Tibet Plateau compared to the Yinshanbeilu grassland region. Studies have shown that altitude indirectly affects the spatial distribution of soil types and vegetation by controlling the distribution of precipitation and temperature, and the Qinghai–Tibet Plateau shows a trend in warming and humidification overall, while the Yinshanbeilu grassland region showed an overall trend in warming and drying. Study has shown that the NDVI value under the warm-drying scenario is lower than that under the warm-wet scenario, and when the temperature increase remains constant, precipitation is the main factor affecting vegetation growth [66,67].
Moreover, in our study, annual NDVI and annual precipitation were positively correlated in 99.58% of the area, and significantly positively correlated in 75.84%. There was a positive correlation between growing season NDVI and growing season precipitation in 99.65% of the area, with a significant positive correlation in 79.86%. These all indicate that precipitation was the main factor affecting vegetation growth, consistent with previous research results [5,68,69]. Precipitation replenishes soil moisture and so aids plant growth. In this study, the influence of precipitation on vegetation dominated both throughout the year and during the growing season.

4.2.2. Effects of Other Climatic Factors on Vegetation

Temperature is closely related to vegetation growth. Too high or too low a temperature will inhibit vegetation growth [70]. In this study, annual NDVI and temperature in the Yinshanbeilu grassland region were negatively correlated in 66.90% of the area, and growing season NDVI was negatively correlated with temperature in 71.29%, consistent with previous research [71].
Daylight duration is considered an indicator of solar radiation and affects vegetation photosynthesis [57,72]. The annual sunshine duration in the Yinshanbeilu grassland region increased from the central area to east and west. During 2000–2020, the annual cumulative sunshine duration in the east and a small number of areas in the central part showed a decreasing trend. During the 21 years, the lowest change rate in the whole year was −0.705 h/a, and the lowest change rate in the growing season was −0.387 h/a. In some places where the cumulative sunshine duration throughout the year and the growing season were reduced, the contribution rate to NDVI was also negative, that is, vegetation growth was inhibited. A possible reason is that reduced sunshine hours may be insufficient to properly support photosynthesis of vegetation, thus limiting vegetation growth compared to long sunshine hours. However, in areas with reduced sunlight, some parts had promoted vegetation growth. The likely reason is that the duration of cloudy days tended to increase in this region due to the increase in daily rainfall, which, under the influence of global warming, encouraged plant growth to some extent [73,74].
Potential evapotranspiration is the most important driver of basin-scale drought characteristics and affects vegetation growth [75]. In this study, both annual potential evapotranspiration and growing season potential evapotranspiration were unfavourable to vegetation growth in the Yinshanbeilu grassland region. There was 11.91% more area where potential evapotranspiration in the growing season and NDVI were significantly negatively correlated than in the whole year. In terms of the impact of climate on vegetation, potential evapotranspiration was second only to precipitation, consistent with previous research [76].
There are many climatic factors in nature, with varying degrees of impact on vegetation changes. This study only considered the response of vegetation to four climate factors: precipitation, temperature, cumulative sunshine duration, and potential evapotranspiration. Therefore, future research needs to discuss the effects of more climate factors on vegetation.

4.3. Influence of Human Factors on Vegetation Change

Population densities are higher in areas with highly degraded vegetation than in other areas, and the gap widens with each passing year (Table 5). Studies have shown that climate change and human activities promote vegetation growth in non-urban areas, but human activities mainly damage vegetation growth in urban areas [77]. In the past few decades, most studies have focused on the impact of climate change on vegetation coverage, and there are few reports on the impact of human factors on vegetation coverage. In this study, the average contribution rate of human activities to NDVI in the whole year was 0.00041/a, and in the growing season was 0.00007/a—both were positive contributions. The inhibitory effect of human factors on vegetation during the growing season was closer to the eastern region than throughout the year. The possible reasons are that there are many grasslands in the eastern region, vegetation grows rapidly during the growing season, and people conducting grazing on the grassland will increase the inhibitory effect on vegetation.
Potential unknown factors of UF in this study may be land use change, implementation of ecological projects, urbanisation process, etc. [78]. The implementation of ecological projects can provide favourable conditions for grassland recovery and promote the growth of vegetation, but ecological projects have a lagging effect on the recovery of vegetation. Overgrazing, reclamation, urbanisation, and development have changed the type of land use and can also counteract the positive effects of ecological projects [79].
Increased rainfall in Inner Mongolia after 2010 boosted vegetation growth to some extent, but competition for access to grazing land has led to an increase in herders’ livestock by 41.23 million heads, which in turn has exacerbated soil degradation [80,81]. Data show that in northern China, the contribution of climate change to vegetation during 1981–2000 and 2000–2020 was 96.07% and 73.72%, respectively, and the contribution of human activities to vegetation increased from 3.93% to 26.28% [82]. Although the state has implemented measures to promote vegetation in the Yinshanbeilu grassland region, both west and north of China are still in the early stages of recovery. They have weak self-regulation abilities and poor stability, making it challenging to establish a sustainable ecosystem in such a short time [47]. Research has indicated that the effects of human activity on vegetation are far less than those of regional climate change [44,83]. Therefore, climatic elements still play a leading part in the vegetation change in the Yinshanbeilu grassland region.
Vegetation restoration can improve the region’s ability to sequester carbon, increase the stability of soil aggregates, reduce carbon emissions in the soil, and can adsorb and decompose organic matter in the water [15,84,85]. In the future, implementation of ecological projects in the Yinshanbeilu grassland region should be further promoted, policy mechanisms should be optimized, and continuous monitoring of the dynamics and driving forces of vegetation activities at the pixel-scale should be strengthened.

4.4. Limitation

In this study, we quantified the effects of climatic and anthropogenic factors on vegetation change, but considered only precipitation, temperature, cumulative sunshine hours, and potential evapotranspiration in the climate factors, and only population density in the anthropogenic factors. Climatic factors such as humidity and wind speed, and anthropogenic factors such as land use, urbanisation, and agricultural production can also affect vegetation change, so it is necessary to further consider multiple climatic factors and other human factors. Meanwhile, we only conducted a macroscopic study based on NDVI data with a spatial resolution of 1000 m × 1000 m. As different resolutions of NDVI may also have different results, and as this paper we did not use data with multiple resolutions, results should be compared and analysed in the future to obtain more accurate results. Different methods to quantify climatic factors and anthropogenic factors should be tried in the next studies to compare the advantages and disadvantages of different methods.

5. Conclusions

The condition of the vegetation in the Yinshanbeilu grassland region improved during 2000–2020. The NDVI’s interannual change was relatively stable, with an average annual change rate of 0.00267/a. It is projected that 58.90% of the area will not exhibit any significant degradation trends in the future. Whether in the whole year or the growing season, the positive correlation between NDVI and precipitation was the largest and significant positive correlations accounted for 75.84% and 79.86% of the study area, respectively. Climatic elements were the key factors influencing vegetation activities throughout the year and during the growing season, and human intervention accounted for only a small proportion. Further quantification of the impact of different anthropogenic factors on vegetation changes in the future are necessary as climate warming and ecological engineering are further implemented. For ecologically fragile areas, the dominant factors affecting vegetation change should be identified.

Author Contributions

Conceptualization, G.X.; Methodology, M.T. and F.G.; Validation, M.Z.; Formal analysis, M.T.; Investigation, T.Z., J.G. and J.Y.; Data curation, M.Z., F.G. and J.Y.; Writing—original draft, M.T.; Writing—review & editing, M.T., G.X. and B.W.; Supervision, G.X., T.Z., J.G. and B.W.; Project administration, G.X. All authors have read and agreed to the published version of the manuscript.

Funding

This research was funded by the National key research and development program grant number 2022YFF1300803, Commercialization of scientific and technological achievements of Inner Mongolia Autonomous Region grant number 2021CG0012, Natural Science Foundation of Inner Mongolia Autonomous Region grant number 2021MS04022 and the Yinshanbeilu Grassland Eco-hydrology National Observation and Research Station, China Institute of Water Resources and Hydropower Research grant number YSS202113.

Institutional Review Board Statement

Not applicable.

Informed Consent Statement

Not applicable.

Data Availability Statement

Data are contained within the article.

Conflicts of Interest

The authors declare that they have no known competing financial interests or personal relationships that could have appeared to influence the work reported in this paper.

References

  1. Jong, R.; de Bruin, S.; de Wit, A.; Schaepman, M.E.; Dent, D.L. Analysis of monotonic greening and browning trends from global NDVI time-series. Remote Sens. Environ. 2011, 115, 692–702. [Google Scholar] [CrossRef]
  2. Wang, X.; Piao, S.; Ciais, P.; Li, J.; Friedlingstein, P.; Koven, C.; Chen, A. Spring temperature change and its implication in the change of vegetation growth in North America from 1982 to 2006. Proc. Natl. Acad. Sci. USA 2011, 4, 1240–1245. [Google Scholar] [CrossRef] [PubMed]
  3. Zhang, J.; Zhang, L.; Xu, C.; Liu, W.; Qi, Y.; Wo, X. Vegetation variation of mid-subtropical forest based on MODIS NDVI data—A case study of Jinggangshan City, Jiangxi Province. Acta Ecol. Sin. 2014, 34, 7–12. [Google Scholar] [CrossRef]
  4. Wang, J.; Wang, K.; Zhang, M.; Zhang, C. Impacts of climate change and human activities on vegetation cover in hilly southern China. Ecol. Eng. 2015, 81, 451–461. [Google Scholar] [CrossRef]
  5. Zheng, K.; Wei, J.; Pei, J.; Cheng, H.; Zhang, X.; Huang, F.; Li, F.; Ye, J. Impacts of climate change and human activities on grassland vegetation variation in the Chinese Loess Plateau. Sci. Total Environ. 2019, 660, 236–244. [Google Scholar] [CrossRef]
  6. Ren, Y.; Zhang, F.; Zhao, C.; Cheng, Z. Attribution of climate change and human activities to vegetation NDVI in Jilin Province, China during 1998–2020. Ecol. Indic. 2023, 153, 110415. [Google Scholar] [CrossRef]
  7. Cai, H.; Yang, X.; Wang, K.; Xiao, L. Is Forest Restoration in the Southwest China Karst Promoted Mainly by Climate Change or Human-Induced Factors? Remote Sens. 2014, 6, 9895–9910. [Google Scholar] [CrossRef]
  8. Li, X.; Xu, X.; Tian, W.; Tian, J.; He, C. Contribution of climate change and vegetation restoration to interannual variability of evapotranspiration in the agro-pastoral ecotone in northern China. Ecol. Indic. 2021, 154, 110485. [Google Scholar] [CrossRef]
  9. Yan, Y.; Liu, X.; Wen, Y.; Ou, J. Quantitative analysis of the contributions of climatic and human factors to grassland productivity in northern China. Ecol. Indic. 2019, 103, 542–553. [Google Scholar] [CrossRef]
  10. Bai, X.; Fu, J.; Li, Y.; Li, Z. Attributing vegetation change in an arid and cold watershed with complex ecosystems in northwest China. Ecol. Indic. 2022, 138, 108835. [Google Scholar] [CrossRef]
  11. Ren, Z.; Tian, Z.; Wei, H.; Liu, Y.; Yu, Y. Spatiotemporal evolution and driving mechanisms of vegetation in the Yellow River Basin, China during 2000–2020. Ecol. Indic. 2022, 138, 108832. [Google Scholar] [CrossRef]
  12. Wang, J.; Ding, Y.; Wang, S.; Watson, A.E.; He, H.; Ye, H.; Ouyang, X.; Li, Y. Pixel-scale historical-baseline-based ecological quality: Measuring impacts from climate change and human activities from 2000 to 2018 in China. J. Environ. Manag. 2022, 313, 114944. [Google Scholar] [CrossRef]
  13. Banerjee, A.; Kang, S.; Meadows, M.E.; Xia, Z.; Sengupta, D.; Kumar, V. Quantifying climate variability and regional anthropogenic influence on vegetation dynamics in northwest India. Environ. Res. 2023, 234, 116541. [Google Scholar] [CrossRef]
  14. Sin, L.; Zhao, D.; Zhang, G.; Wu, X.; Yang, Y.; Wang, Z. Using SPOT VEGETATION for analyzing dynamic changes and influencing factors on vegetation restoration in the Three-River Headwaters Region in the last 20 years (2000–2019), China. Ecol. Eng. 2022, 183, 106742. [Google Scholar] [CrossRef]
  15. Xu, M.; Xu, G.; Li, Z.; Dang, Y.; Li, Q.; Min, Z.; Gu, F.; Wang, B.; Liu, S.; Zhang, Y. Effects of comprehensive landscape patterns on water quality and identification of key metrics thresholds causing its abrupt changes. Environ. Pollut. 2023, 333, 122097. [Google Scholar] [CrossRef]
  16. Huo, T.; Wang, J.; Zhang, Y.; Wei, B.; Chen, K.; Zhuang, M.; Liu, N.; Zhang, Y.; Liang, J. Temperate grassland vegetation restoration influenced by grazing exclusion and climate change. Sci. Total Environ. 2024, 912, 168842. [Google Scholar] [CrossRef]
  17. Hu, W.; Wu, X.; Zhang, K. Spatiotemporal change of beneficiary area from wind erosion prevention service in the Ulan Buh Desert in 2008 and 2018. Geogr. Sustain. 2022, 3, 119–128. [Google Scholar] [CrossRef]
  18. Chi, H.; Wu, Y.; Zheng, H.; Zhang, B.; Sun, Z.; Yan, J.; Ren, Y.; Guo, L. Spatial patterns of climate change and associated climate hazards in Northwest China. Sci. Rep. 2023, 13, 10418. [Google Scholar] [CrossRef]
  19. Williams, E.L.; Funk, C.; Shukla, S. Anthropogenic Climate Change Negatively Impacts Vegetation and Forage Conditions in the Greater Four Corners Region. Earth Future 2023, 11, e2022EF002943. [Google Scholar] [CrossRef]
  20. Yu, Y.; Zhan, L.; Wang, D.; Hu, D. Thoughts on comprehensive management of forest and grass ecology at the northern foot of Yinshan Mountain in Ulanqab City of Inner Mongolia. Inner Mongolia Forestry Investig. Des. 2022, 45, 6–8. [Google Scholar] [CrossRef]
  21. Zhang, H.; Fan, J.; Cao, W.; Zhong, H.; Harris, W.; Gong, G.; Zhang, Y. Changes in multiple ecosystem services between 2000 and 2013 and their driving factors in the Grazing Withdrawal Program, China. Ecol. Eng. 2018, 116, 67–79. [Google Scholar] [CrossRef]
  22. Yin, Y.; Hou, Y.; Langford, C.; Bai, H.; Hou, X. Herder stocking rate and household income under the Grassland Ecological Protection Award Policy in northern China. Land Use Pol. 2019, 82, 120–129. [Google Scholar] [CrossRef]
  23. Yan, H.; Xue, Z.; Niu, Z. Ecological restoration policy should pay more attention to the high productivity grasslands. Ecol. Indic. 2021, 129, 107938. [Google Scholar] [CrossRef]
  24. Wang, S.; Wang, W.; Wu, Y.; Li, W.; Zhao, S.; Chen, Z. Effects of a changing climate and anthropogenic impacts on net primary production in Yinshanbeilu, Inner Mongolia, China. Environ. Impact Asses. Rev. 2023, 102, 107185. [Google Scholar] [CrossRef]
  25. Zhao, Y.; Yang, S.; Liu, L.; Jia, X.; Han, L.; Yuan, X.; Zhao, M.; Zhang, P. Variations and driving mechanisms of desertification in the southeast section of the China-Mongolia-Russia Economic Zone. Sci. Total Environ. 2023, 887, 164004. [Google Scholar] [CrossRef]
  26. Du, Z.; Ding, S.; Xiao, R.; Fang, C.; Jia, R.; Chu, W. Disinfection by-product precursors introduced by sandstorm events: Composition, formation characteristics and potential risks. Water Res. 2023, 244, 120429. [Google Scholar] [CrossRef]
  27. Wang, N.; Zhang, Q.; Sun, S.; Yang, W.; Zhang, Y.; Zhai, Y.; Liu, H.; Wang, H.; He, M.; Fan, P.; et al. Sandstorms in the Yellow River Basin, China in the 21st century: Spatiotemporal pattern and variation trend. Ecol. Indic. 2023, 154, 110601. [Google Scholar] [CrossRef]
  28. Wang, B.; Xu, G.; Li, P.; Li, Z.; Zhang, Y.; Cheng, Y.; Jia, L.; Zhang, J. Vegetation dynamics and their relationships with climatic factors in the Qinling Mountains of China. Ecol. Indic. 2020, 108, 105719. [Google Scholar] [CrossRef]
  29. Zhu, L.; Sun, S.; Li, Y.; Liu, X.; Hu, K. Effects of climate change and anthropogenic activity on the vegetation greening in the Liaohe River Basin of northeastern China. Ecol. Indic. 2023, 148, 110105. [Google Scholar] [CrossRef]
  30. Peng, W.; Kuang, T.; Tao, S. Quantifying influences of natural factors on vegetation NDVI changes based on geographical detector in Sichuan, western China. J. Clean. Prod. 2019, 233, 353–367. [Google Scholar] [CrossRef]
  31. Huo, H.; Sun, C. Spatiotemporal variation and influencing factors of vegetation dynamics based on Geodetector: A case study of the northwestern Yunnan Plateau, China. Ecol. Indic. 2021, 130, 108005. [Google Scholar] [CrossRef]
  32. Song, Y.; Ma, M.; Veroustraete, F. Comparison and conversion of AVHRR GIMMS and SPOT VEGETATION NDVI data in China. Int. J. Remote Sens. 2010, 31, 2377–2392. [Google Scholar] [CrossRef]
  33. Mann, H.B. Nonparametric tests against trend. Econometrica 1945, 13, 245–259. Available online: https://www.jstor.org/stable/1907187 (accessed on 5 October 2023). [CrossRef]
  34. Kendall, M.G. Rank Correlation Measures; Charles Griffin: London, UK, 1975. [Google Scholar]
  35. Zhang, Y.; Gong, J.; Yang, J.; Peng, J. Evaluation of Future Trends Based on the Characteristics of Net Primary Production (NPP) Changes over 21 Years in the Yangtze River Basin in China. Sustainability 2023, 15, 10606. [Google Scholar] [CrossRef]
  36. Potter, C.S.; Brooks, V. Global analysis of empirical relations between annual climate and seasonality of NDVI. Int. J. Remote Sens. 1998, 19, 2921–2948. [Google Scholar] [CrossRef]
  37. Piao, S.; Mohammat, A.; Fang, J.; Cai, Q.; Feng, J. NDVI-based increase in growth of temperate grasslands and its responses to climate changes in China. Glob. Environ. Chang.-Hum. Policy Dimens. 2006, 16, 340–348. [Google Scholar] [CrossRef]
  38. Ma, Y.; Huang, N.; Ma, C. Heterogeneity, marginality, stagementation and driving forces in the Otindag Sandy Land and its ecotones based on GIMMS NDVI3g v1.0. Ecol. Inform. 2023, 77, 102187. [Google Scholar] [CrossRef]
  39. Hurst, H.E. Long–term storage capacity of reservoirs. Trans. Am. Soc. Civ. Eng. 1951, 116, 770–808. [Google Scholar] [CrossRef]
  40. Rao, A.R.; Bhattacharya, D. Comparison of Hurst exponent estimates in hydrometeorological time series. J. Hydrol. Eng. 1999, 4, 4225–4231. [Google Scholar] [CrossRef]
  41. Zhang, B.; Wu, P.; Zhao, X.; Gao, X.; Shi, Y. Assessing the spatial and temporal variation of the rainwater harvesting poten-tial (1971–2010) on the Chinese Loess Plateau using the VIC model. Hydrol. Process. 2014, 28, 534–544. [Google Scholar] [CrossRef]
  42. Rehman, S. Study of Saudi Arabian climatic conditions using Hurst exponent and climatic predictability index. Chaos Solitons Fractals 2009, 39, 499–509. [Google Scholar] [CrossRef]
  43. Xu, G.; Zhang, J.; Li, P.; Li, Z.; Lu, K.; Wang, X.; Wang, F.; Cheng, Y.; Wang, B. Vegetation restoration projects and their influence on runoff and sediment in China. Ecol. Indic. 2018, 95, 233–241. [Google Scholar] [CrossRef]
  44. Marin-Lopez, A.; Martínez-Cadena, J.A.; Martinez-Martinez, F.; Alvarez-Ramirez, J. Surrogate multivariate Hurst exponent analysis of gait dynamics. Chaos Solitons Fractals 2023, 172, 113605. [Google Scholar] [CrossRef]
  45. Zhang, Y.; Zhang, C.; Wang, Z.; Chen, Y.; Gang, C.; An, R.; Li, J. Vegetation dynamics and its driving forces from climate change and human activities in the Three-River Source Region, China from 1982 to 2012. Sci. Total Environ. 2016, 563–564, 210–220. [Google Scholar] [CrossRef]
  46. Cao, M.; Woodward, F.I. Dynamic responses of terrestrial ecosystem carbon cycling to global climate change. Nature 1998, 393, 249–252. [Google Scholar] [CrossRef]
  47. Zhu, L.; Southworth, J. Disentangling the Relationships between Net Primary Production and Precipitation in Southern Africa Savannas Using Satellite Observations from 1982 to 2010. Remote Sens. 2013, 5, 3803–3825. [Google Scholar] [CrossRef]
  48. Chen, A.; He, B.; Wang, H.; Huang, L.; Zhu, Y.; Lv, A. Notable shifting in the responses of vegetation activity to climate change in China. Phys. Chem. Earth 2015, 87–88, 60–66. [Google Scholar] [CrossRef]
  49. Huang, F.; Xu, S. Spatio-Temporal Variations of Rain-Use Efficiency in the West of Songliao Plain, China. Sustainability 2016, 8, 308. [Google Scholar] [CrossRef]
  50. Wei, Y.; Sun, S.; Liang, D.; Jia, Z. Spatial-temporal variations of NDVI and its response to climate in China from 2001 to 2020. Int. J. Digit. Earth 2022, 15, 1463–1484. [Google Scholar] [CrossRef]
  51. Meng, S.; Xie, X.; Zhu, B.; Wang, Y. The relative contribution of vegetation greening to the hydrological cycle in the Three-North region of China: A modelling analysis. J. Hydrol. 2020, 591, 125689. [Google Scholar] [CrossRef]
  52. Wu, D.; Xie, X.; Tong, J.; Meng, S.; Wang, Y. Sensitivity of Vegetation Growth to Precipitation in a Typical Afforestation Area in the Loess Plateau: Plant-Water Coupled Modelling. Ecol. Model. 2020, 430, 109128. [Google Scholar] [CrossRef]
  53. Zhang, H.; Yang, X.; Yang, D.; Chen, A.; Zhang, M. Spatio-temporal changes in grassland fractional vegetation cover in Inner Mongolia from 2000 to 2020 and a future forecast. Acta Prataculturae Sin. 2023, 32, 1–13. [Google Scholar] [CrossRef]
  54. Tian, H.; Cao, C.; Chen, W.; Bao, S.; Yang, B.; Myneni, R.B. Response of vegetation activity dynamic to climatic change and ecological restoration programs in Inner Mongolia from 2000 to 2012. Ecol. Eng. 2015, 82, 276–289. [Google Scholar] [CrossRef]
  55. Yang, L.; Wylie, B.K.; Tieszen, L.L.; Reed, B.C. An Analysis of Relationships among Climate Forcing and Time-Integrated NDVI of Grasslands over the U.S. Northern and Central Great Plains. Remote Sens. Environ. 1998, 65, 25–37. [Google Scholar] [CrossRef]
  56. Bai, Y.; Guo, C.; Degen, A.A.; Ahmad, A.A.; Wang, W.; Zhang, T.; Li, W.; Ma, L.; Huang, M.; Zeng, H.; et al. Climate warming benefits alpine vegetation growth in Three-River Headwater Region, China. Sci. Total Environ. 2020, 742, 140574. [Google Scholar] [CrossRef] [PubMed]
  57. Zhang, X.; Jin, X. Vegetation dynamics and responses to climate change and anthropogenic activities in the Three-River Headwaters Region, China. Ecol. Indic. 2021, 131, 108223. [Google Scholar] [CrossRef]
  58. Luan, J.; Miao, P.; Tian, X.; Li, X.; Ma, N.; Abrar Faiz, M.; Xu, Z.; Zhang, Y. Estimating hydrological consequences of vegetation greening. J. Hydrol. 2022, 611, 128018. [Google Scholar] [CrossRef]
  59. Liu, Y.; Liu, H.; Chen, Y.; Gang, C.; Shen, Y. Quantifying the contributions of climate change and human activities to vegetation dynamic in China based on multiple indices. Sci. Total Environ. 2022, 838, 156553. [Google Scholar] [CrossRef]
  60. Zhan, Y.; Ma, C.; Yan, Y.; Zhu, J.; Ji, Y.; Ma, C.; Luo, Y. Spatial differentiation characteristics of vegetation greening rates and climate attribution in China’s arid and semi-arid regions. Glob. Ecol. Conserv. 2023, 46, e2563. [Google Scholar] [CrossRef]
  61. Zhao, Y.; Hu, C.; Dong, X.; Li, J. NDVI Characteristics and Influencing Factors of Typical Ecosystems in the Semi-Arid Region of Northern China: A Case Study of the Hulunbuir Grassland. Land 2023, 12, 713. [Google Scholar] [CrossRef]
  62. Bai, X.Y.; Fan, Z.M.; Yue, T.X. Dynamic pattern-effect relationships between precipitation and vegetation in the semi-arid and semi-humid area of China. CATENA 2023, 232, 107425. [Google Scholar] [CrossRef]
  63. Hu, M.Q.; Mao, F.; Sun, H.; Hou, Y.Y. Study of normalized difference vegetation index variation and its correlation with climate factors in the three-river-source region. Int. J. Appl. Earth Obs. Geoinf. 2011, 13, 24–33. [Google Scholar] [CrossRef]
  64. Gu, W.; Zhu, X.; Meng, X.; Qiu, X. Research on the Influence of Small-Scale Terrain on Precipitation. Water 2021, 13, 805. [Google Scholar] [CrossRef]
  65. Li, Z.; Qu, H.; Li, L.; Zheng, J.; Wei, D.; Wang, F. Effects of climate change on vegetation dynamics of the Qinghai-Tibet Plateau, a causality analysis using empirical dynamic modeling. Heliyon 2023, 9, e16001. [Google Scholar] [CrossRef] [PubMed]
  66. Liu, Y.Y.; Evans, J.P.; McCabe, M.F.; de Jeu, R.A.; van Dijk, A.I.; Dolman, A.J.; Saizen, I. Changing climate and overgrazing are decimating Mongolian steppes. PLoS ONE 2013, 8, e57599. [Google Scholar] [CrossRef] [PubMed]
  67. Lou, P.; Wu, T.; Yang, S.; Wu, X.; Chen, J.; Zhu, X.; Chen, J.; Lin, X.; Li, R.; Shang, C.; et al. Deep learning reveals rapid vegetation greening in changing climate from 1988 to 2018 on the Qinghai-Tibet Plateau. Ecol. Indic. 2023, 148, 110020. [Google Scholar] [CrossRef]
  68. Chen, J.; Wang, Y.; Sun, J.; Liang, E.; Shen, M.; Yang, B.; Jia, X.; Zhang, J. Precipitation dominates synergies and trade-offs among ecosystem services across the Qinghai-Tibet Plateau. Glob. Ecol. Conserv. 2021, 32, e01886. [Google Scholar] [CrossRef]
  69. Zhang, Y.; Jiang, X.; Lei, Y.; Gao, S. The contributions of natural and anthropogenic factors to NDVI variations on the Loess Plateau in China during 2000–2020. Ecol. Indic. 2022, 143, 109342. [Google Scholar] [CrossRef]
  70. Chuai, X.W.; Huang, X.J.; Wang, W.J.; Bao, G. NDVI, temperature and precipitation changes and their relationships with different vegetation types during 1998-2007 in Inner Mongolia, China. Int. J. Climatol. 2013, 33, 1696–1706. [Google Scholar] [CrossRef]
  71. Sardiña, L.C.; Irisarri, G.; Texeira, M. Climate factors rather than human activities controlled NDVI trends across wet meadow areas in the Andes Centrales of Argentina. J. Arid. Environ. 2023, 214, 104983. [Google Scholar] [CrossRef]
  72. Li, R.; Zhao, L.; Ding, Y.; Wang, S.; Ji, G.; Xiao, Y.; Liu, G.; Sun, L. Monthly ratios of PAR to global solar radiation measured at northern Tibetan Plateau, China. Sol. Energy 2010, 84, 964–973. [Google Scholar] [CrossRef]
  73. Yang, T.; Hao, X.; Shao, Q.; Xu, C.; Zhao, C.; Chen, X.; Wang, W. Multi-model ensemble projections in temperature and precipitation extremes of the Tibetan Plateau in the 21st century. Glob. Planet. Change 2012, 80–81, 1–13. [Google Scholar] [CrossRef]
  74. Zuo, Y.; Li, Y.; He, K.; Wen, Y. Temporal and spatial variation characteristics of vegetation coverage and quantitative analysis of its potential driving forces in the Qilian Mountains, China, 2000–2020. Ecol. Indic. 2022, 143, 109429. [Google Scholar] [CrossRef]
  75. Guo, W.; Huang, S.; Huang, Q.; She, D.; Shi, H.; Leng, G.; Li, J.; Cheng, L.; Gao, Y.; Peng, J. Precipitation and vegetation transpiration variations dominate the dynamics of agricultural drought characteristics in China. Sci. Total Environ. 2023, 898, 165480. [Google Scholar] [CrossRef]
  76. Jia, Z.; Lei, R.; Liu, Y.; Liu, P.; Wang, Z.; Chang, Y.; Wei, W. Spatial–Temporal Variations and the Driving Factors of Vegetation Coverage in the Loess Hilly and Gully Region of China. Forests 2023, 14, 1238. [Google Scholar] [CrossRef]
  77. Yang, S.; Liu, J.; Wang, C.; Zhang, T.; Dong, X.; Liu, Y. Vegetation dynamics influenced by climate change and human activities in the Hanjiang River Basin, central China. Ecol. Indic. 2022, 145, 109586. [Google Scholar] [CrossRef]
  78. Sun, Y.L.; Shan, M.; Pei, X.R.; Zhang, X.K.; Yang, Y.L. Assessment of the impacts of climate change and human activities on vegetation cover change in the Haihe River basin, China. Phys. Chem. 2020, 115, 102834. [Google Scholar] [CrossRef]
  79. Ning, X.; Zhu, N.; Liu, Y.; Wang, H. Quantifying impacts of climate and human activities on the grassland in the Three-River Headwater Region after two phases of Ecological Project. Geogr. Sustain. 2022, 3, 164–176. [Google Scholar] [CrossRef]
  80. Saizen, I.; Maekawa, A.; Yamamura, N. Spatial analysis of time-series changes in livestock distribution by detection of local spatial associations in Mongolia. Appl. Geogr. 2010, 30, 639–649. [Google Scholar] [CrossRef]
  81. Zhao, L.; Jia, K.; Liu, X.; Li, J.; Xia, M. Assessment of land degradation in Inner Mongolia between 2000 and 2020 based on remote sensing data. Geogr. Sustain. 2023, 4, 100–111. [Google Scholar] [CrossRef]
  82. Xu, L.; Gao, G.; Wang, X.; Chen, Y.; Zhou, C.; Wang, K.; Fu, B. Quantifying the contribution of climate change and human activities to vegetation greening in the drylands of northern China. Acta Ecol. Sin. 2023, 43, 1–10. [Google Scholar] [CrossRef]
  83. Gao, W.; Zheng, C.; Liu, X.; Lu, Y.; Chen, Y.; Wei, Y.; Ma, Y. NDVI-based vegetation dynamics and their responses to climate change and human activities from 1982 to 2020: A case study in the Mu Us Sandy Land, China. Ecol. Indic. 2022, 137, 108745. [Google Scholar] [CrossRef]
  84. Cheng, Y.; Xu, G.; Wang, X.; Li, P.; Dang, X.; Jiang, W.; Ma, T.; Wang, B.; Gu, F.; Li, Z. Contribution of soil aggregate particle size to organic carbon and the effect of land use on its distribution in a typical small watershed on Loess Plateau, China. Ecol. Indic. 2023, 155, 110988. [Google Scholar] [CrossRef]
  85. Wang, B.; Xu, G.; Ma, T.; Chen, L.; Cheng, Y.; Li, P.; Li, Z.; Zhang, Y. Effects of vegetation restoration on soil aggregates, organic carbon, and nitrogen in the Loess Plateau of China. CATENA 2023, 231, 107340. [Google Scholar] [CrossRef]
Figure 1. Research area.
Sustainability 16 00794 g001
Figure 2. Sketch of the research methods.
Sustainability 16 00794 g002
Figure 3. Vegetation coverage map of Yinshanbeilu grassland region from 2000 to 2020, including multi-year average NDVI (a), average NDVI value at different altitudes (b), change rate of NDVI (c), average NDVI change rate at different altitudes (d), coefficient of variation of NDVI (e), and the coefficient of variation (f) of NDVI at different altitudes.
Sustainability 16 00794 g003
Figure 4. Vegetation distribution map (a) and vegetation change trend map (b) for Yinshanbeilu grassland region.
Sustainability 16 00794 g004
Figure 5. NDVI variation trend map of different vegetation types for Yinshanbeilu grassland region: spring (a), summer (b), autumn (c), and growing season (d). In the picture, A is other vegetation types, B is coniferous forest, C is broad-leaved forest, D is shrub, E is desert, F is grassland, G is meadow, and H is cultivated vegetation. k Slope of change over time for different vegetation types.
Sustainability 16 00794 g005
Figure 6. Trend chart of climate factors over time: precipitation (a), temperature (b), accumulated sunshine (c), and potential evapotranspiration (d); k is the slope of the climate factor over time.
Sustainability 16 00794 g006
Figure 7. Spatial distribution (ah) and change rate (ip) of climate factors throughout the year and growing season in Yinshanbeilu grassland region. The distribution of climatic factors: precipitation (a,e,i,m), temperature (b,f,j,n), cumulative sunshine hours (c,g,k,o), and potential evapotranspiration (d,h,l,p); the first and third rows represent the whole year, and the second and fourth rows represent the growing season.
Sustainability 16 00794 g007
Figure 8. Significance (ah) and change rate (ip) of climatic factors and NDVI for Yinshanbeilu grassland regions in the whole year and growing season. Climatic factors: precipitation (a,e,i,m), temperature (b,f,j,n), cumulative sunshine hours (c,g,k,o), and potential evapotranspiration (d,h,l,p). The first and third rows represent the year, and the second and fourth rows represent the growing season.
Sustainability 16 00794 g008
Figure 9. The contribution rate of human factors to NDVI and the impact on vegetation in Yinshanbeilu grassland region: the contribution rate of human factors to NDVI throughout the year (a), the contribution rate of human factors to NDVI during the growing season (b), the impact of human factors on vegetation throughout the year (c), and the impact of human factors on vegetation during the growing season (d).
Sustainability 16 00794 g009
Figure 10. Future vegetation changes.
Sustainability 16 00794 g010
Table 1. Datasets.
Table 1. Datasets.
DatasetSourceNotes
NDVINASA Space Earth data (https://ladsweb.modaps.eosdis.nasa.gov/)
(accessed on 8 May 2023)
A spatial resolution of 500 m × 500 m with a 16-day interval was used for the period 2000–2020.
PrecipitationNational Earth System Science Data Center, National Science & Technology Infrastructure of China (http://www.geodata.cn/)
(accessed on 11 May 2023)
A spatial resolution of 1000 m ×1000 m and a temporal resolution of 1 month.
TemperatureNational Earth System Science Data Center, National Science & Technology Infrastructure of China (http://www.geodata.cn/)
(accessed on 6 May 2023)
A spatial resolution of 1000 m ×1000 m and a temporal resolution of 1 month.
Potential evapotranspirationNational Earth System Science Data Center, National Science & Technology Infrastructure of China (http://www.geodata.cn/)
(accessed on 7 May 2023)
A spatial resolution of 1000 m ×1000 m and a temporal resolution of 1 month.
Cumulative sunshine hoursNational Meteorological Information Center-China Meteorological Website (http://data.cma.cn/)
(accessed on 13 May 2023)
Using the inverse distance weighting method to interpolate the monthly data to obtain the monthly cumulative sunshine hours and hours data.
Vegetation typesResource and Environment Science and Data Center (https://www.resdc.cn/)
(accessed on 6 May 2023)
A spatial resolution of 1000 m × 1000 m.
Population distributionLandScan global population dynamic crowding analysis database (https://landscan.ornl.gov/)
(accessed on 23 August 2023)
A spatial resolution of 1000 m × 1000 m and a time interval of 1 year.
Table 2. Average NDVI, θ, and CV of different vegetation.
Coniferous ForestBroadleaf ForestMeadowBushesGrasslandCultivated VegetationDesertOthers
Average NDVI0.4950.4710.3390.3610.2940.4530.1530.206
Average θ (a−1)0.0050.0030.0030.0030.0030.0040.0020.001
Average CV0.1870.1450.2160.1740.2280.2000.2070.455
Table 3. Variation trend in average NDVI of each vegetation type.
Vegetation TypeSpring
(March–May)
(a−1)
Summer
(June–August)
(a−1)
Autumn
(September–November)
(a−1)
Growing Season
(May–September)
(a−1)
Coniferous forest0.000240.005210.00440.00518
Broadleaf forest0.001050.002990.003130.00299
Meadow0.000500.003060.002950.00306
Bushes0.000980.002670.002780.00267
Grassland0.000750.002650.002690.00268
Cultivated vegetation0.000710.004260.004430.00426
Desert0.000730.001600.001630.00168
Others−0.000210.001090.002090.00139
Table 4. Average contribution rate of climate factors and human factors to NDVI.
Average NDVIClimate FactorsHuman Factors
PrecipitationTemperatureAccumulated SunshinePotential Evapotranspiration
Annual (a−1)0.002670.00173−0.000270.000060.000740.00041
Growing season (a−1)0.002670.00180−0.000010.000210.0005950.00007
Table 5. Population density corresponding to vegetation change trends in typical years in the Yinshanbeilu grassland region during 2000–2020.
Vegetation Trends2000
(Person/km2)
2010
(Person/km2)
2020
(Person/km2)
Significant Improvement10.249.428.84
Significantly Degraded25.2343.1662.23
Insignificantly Degraded10.729.839.17
Insignificant Improvement6.004.994.40
Stability6.395.954.66
Disclaimer/Publisher’s Note: The statements, opinions and data contained in all publications are solely those of the individual author(s) and contributor(s) and not of MDPI and/or the editor(s). MDPI and/or the editor(s) disclaim responsibility for any injury to people or property resulting from any ideas, methods, instructions or products referred to in the content.

