

A Survey of Commercial and Industrial Demand Response Flexibility with Energy Storage Systems and Renewable Energy


Abstract
1. Introduction
- An assessment of potential DR flexibility exclusively for C&I consumers;
- A survey analysis incorporating ESS, ORG, and DR—three promising systems in one study;
- An analysis of wastewater treatment plants as an example within the water industry, which has not yet been extensively covered in previous DR survey studies.
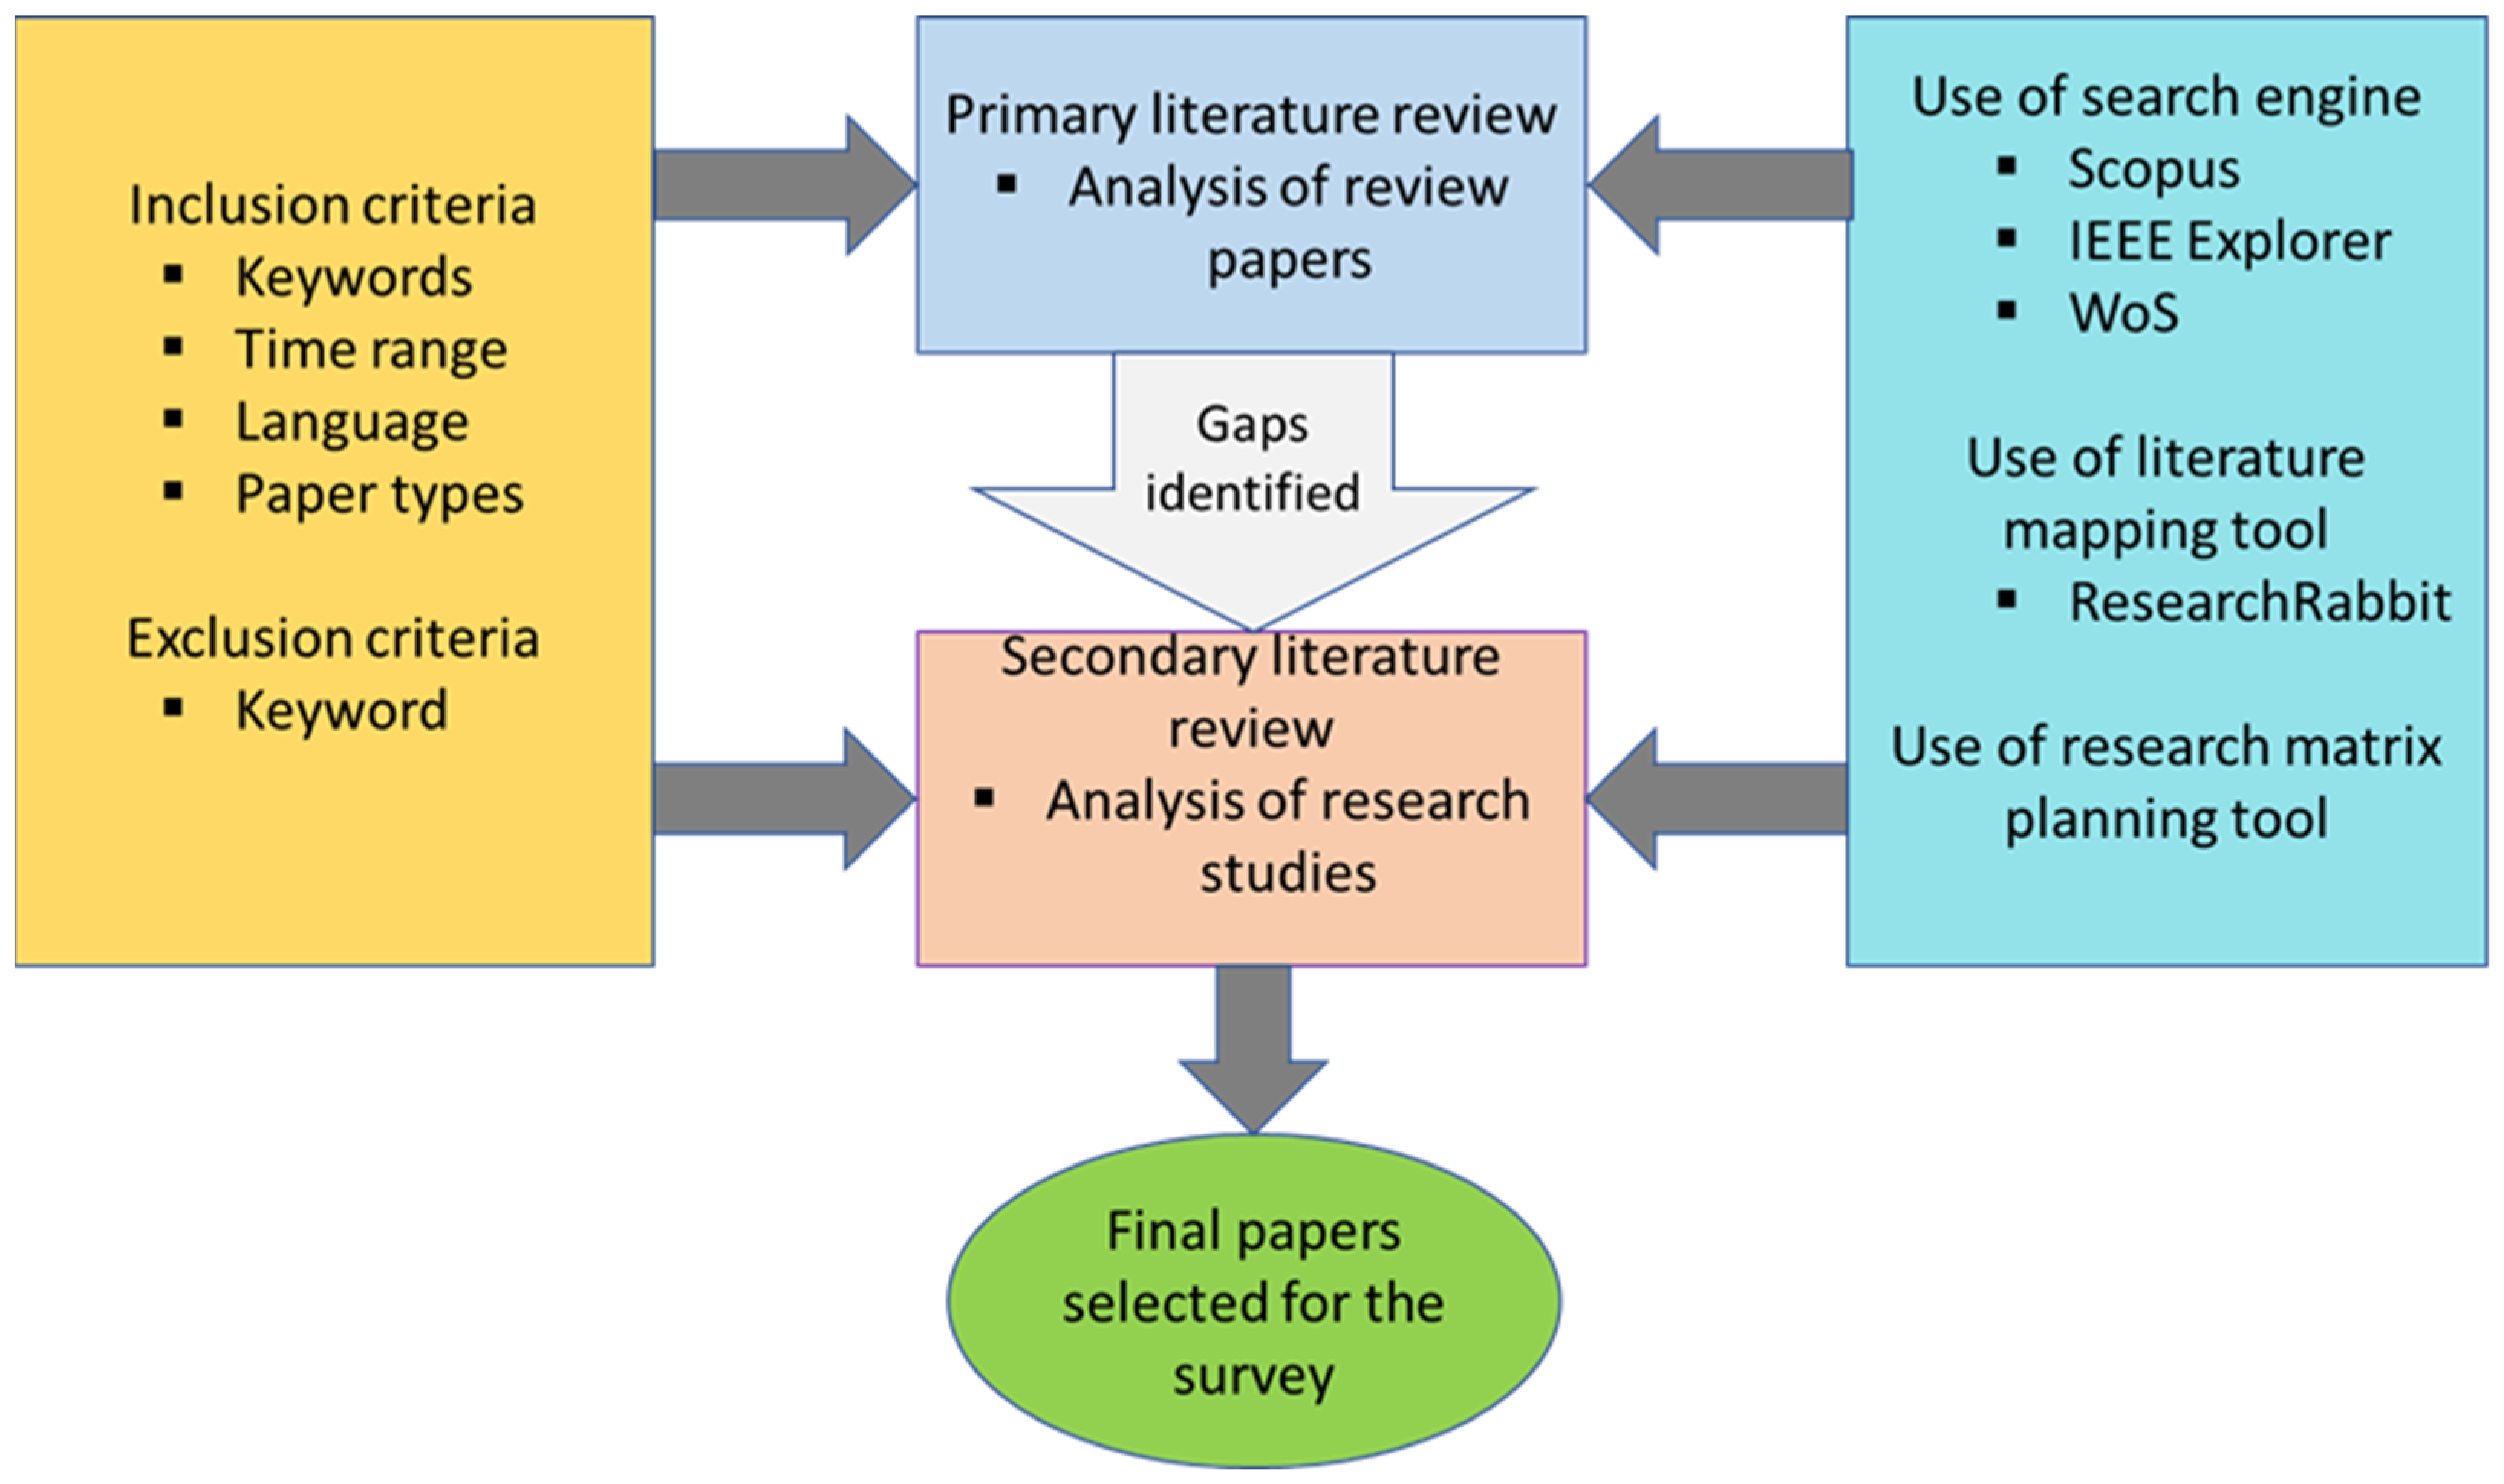
2. Methodology
3. Demand Response and ESS Technology
3.1. Overview of Demand Response
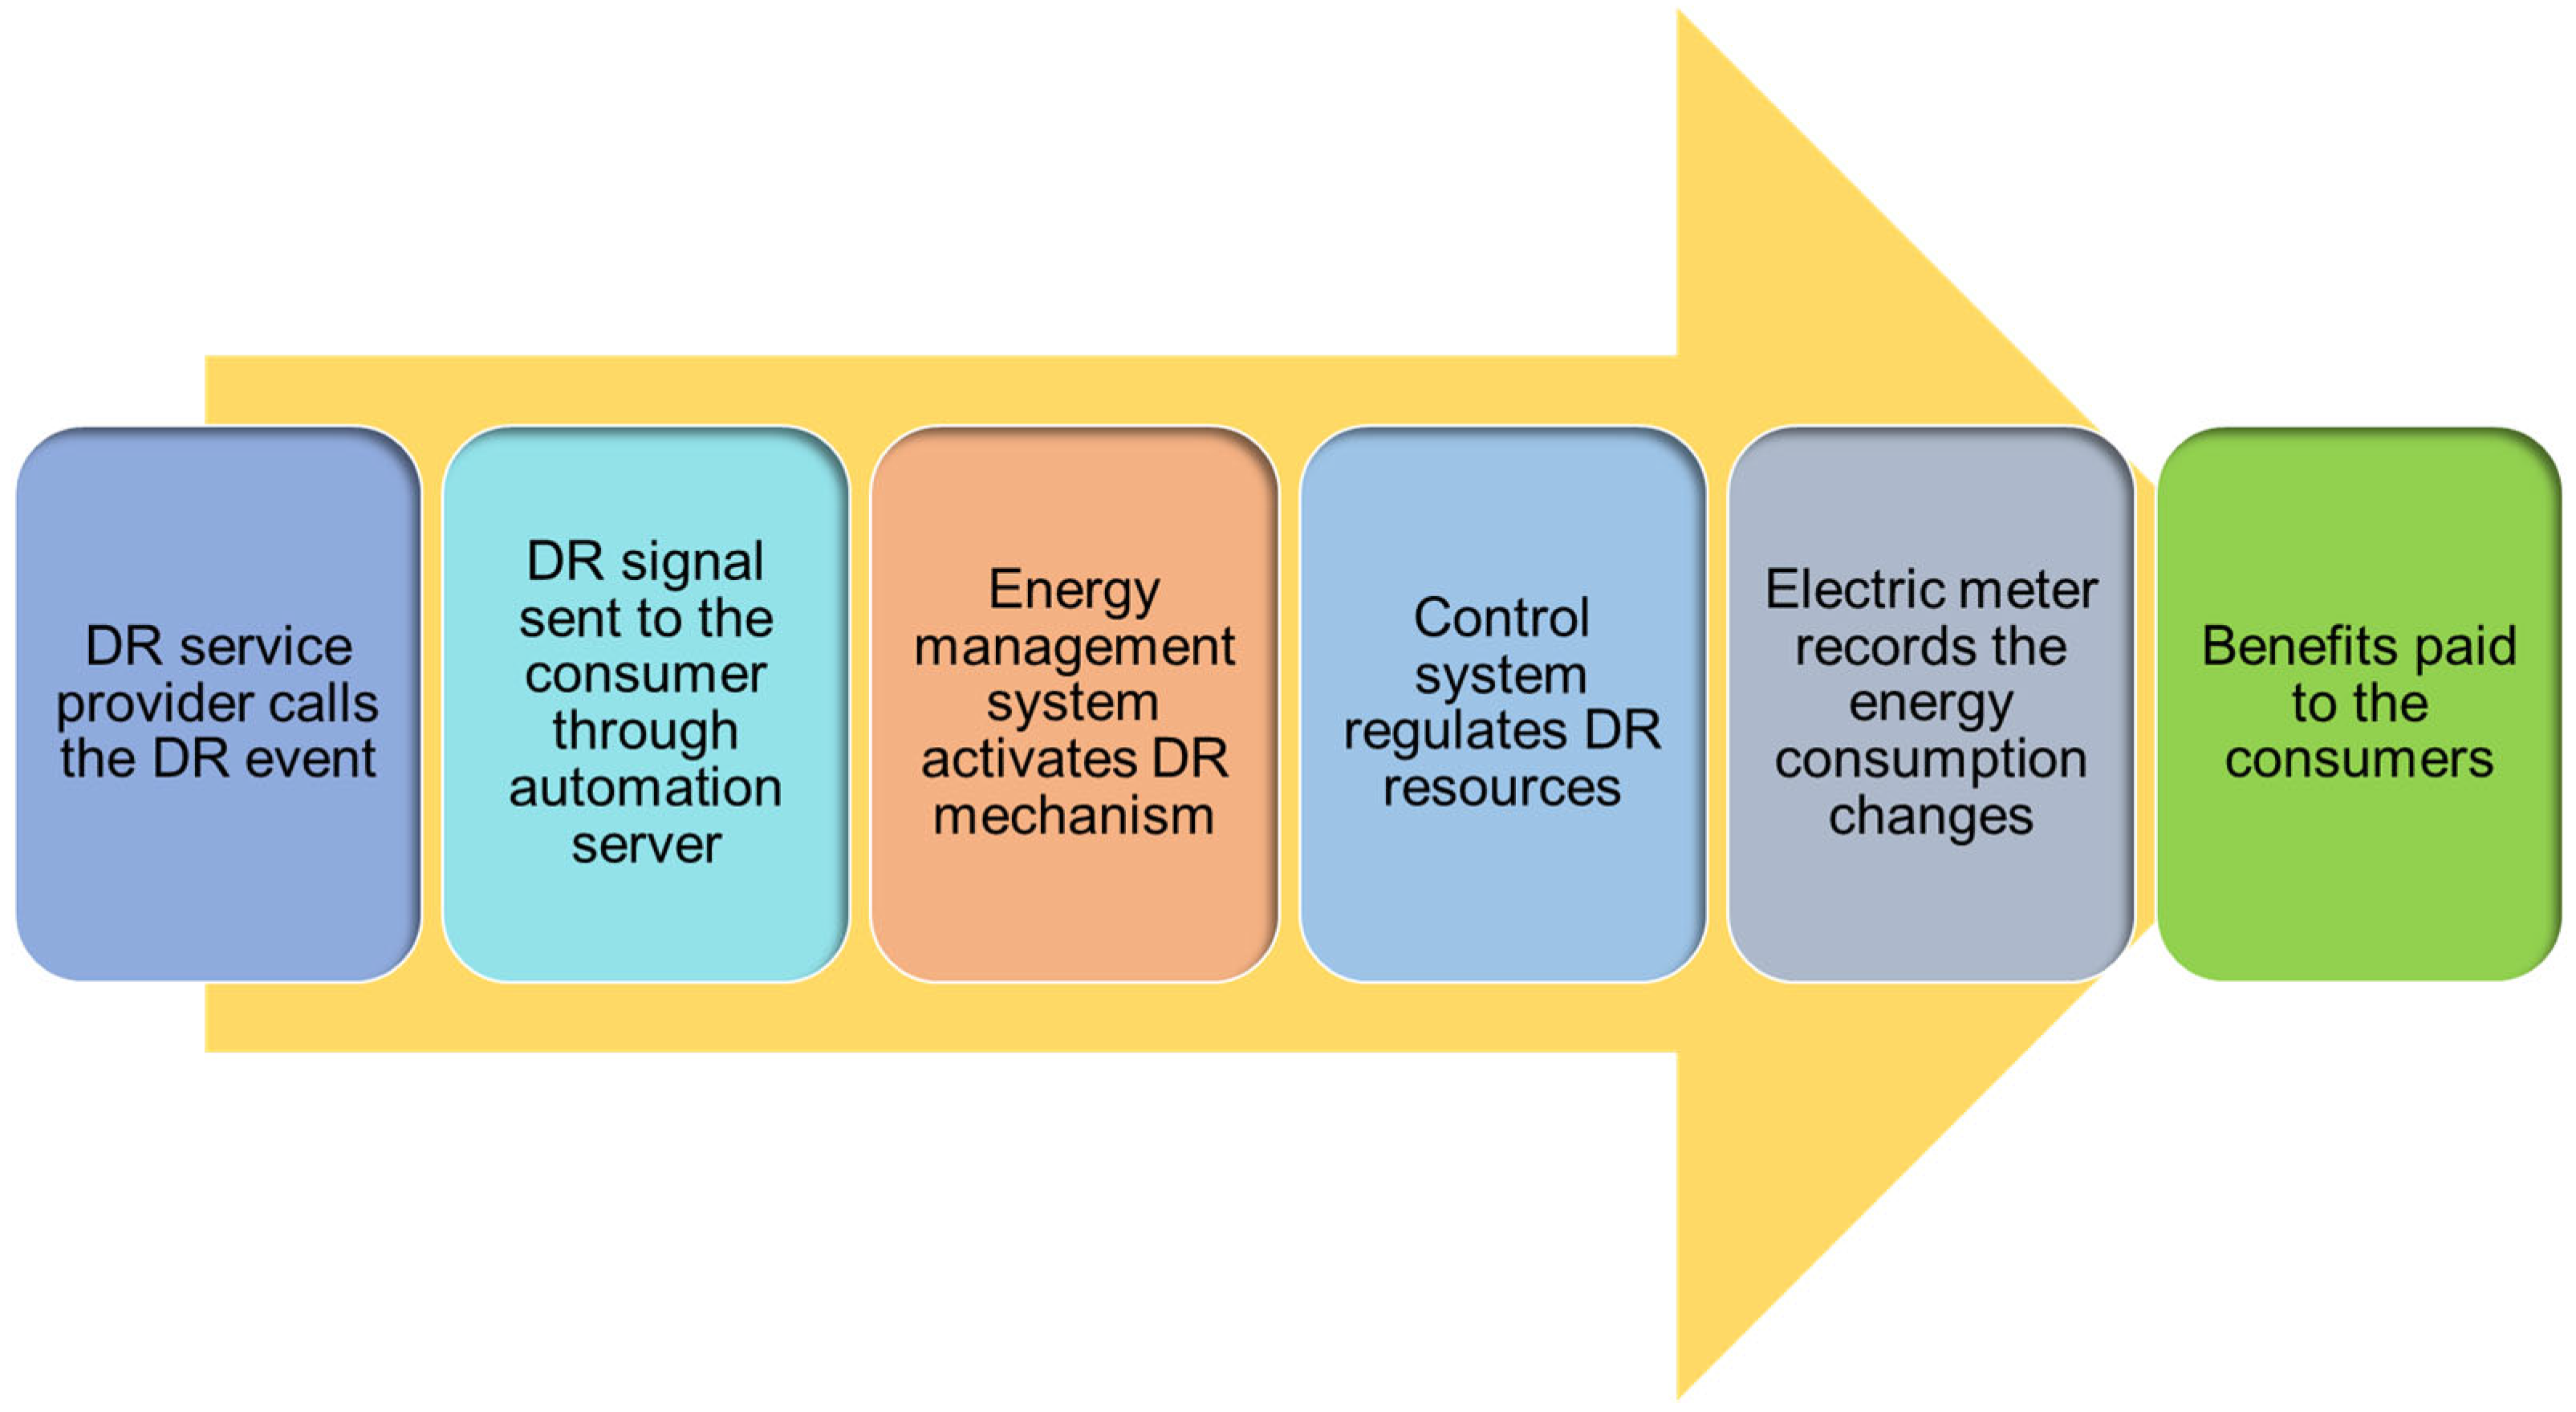
3.1.1. Demand Response Operation
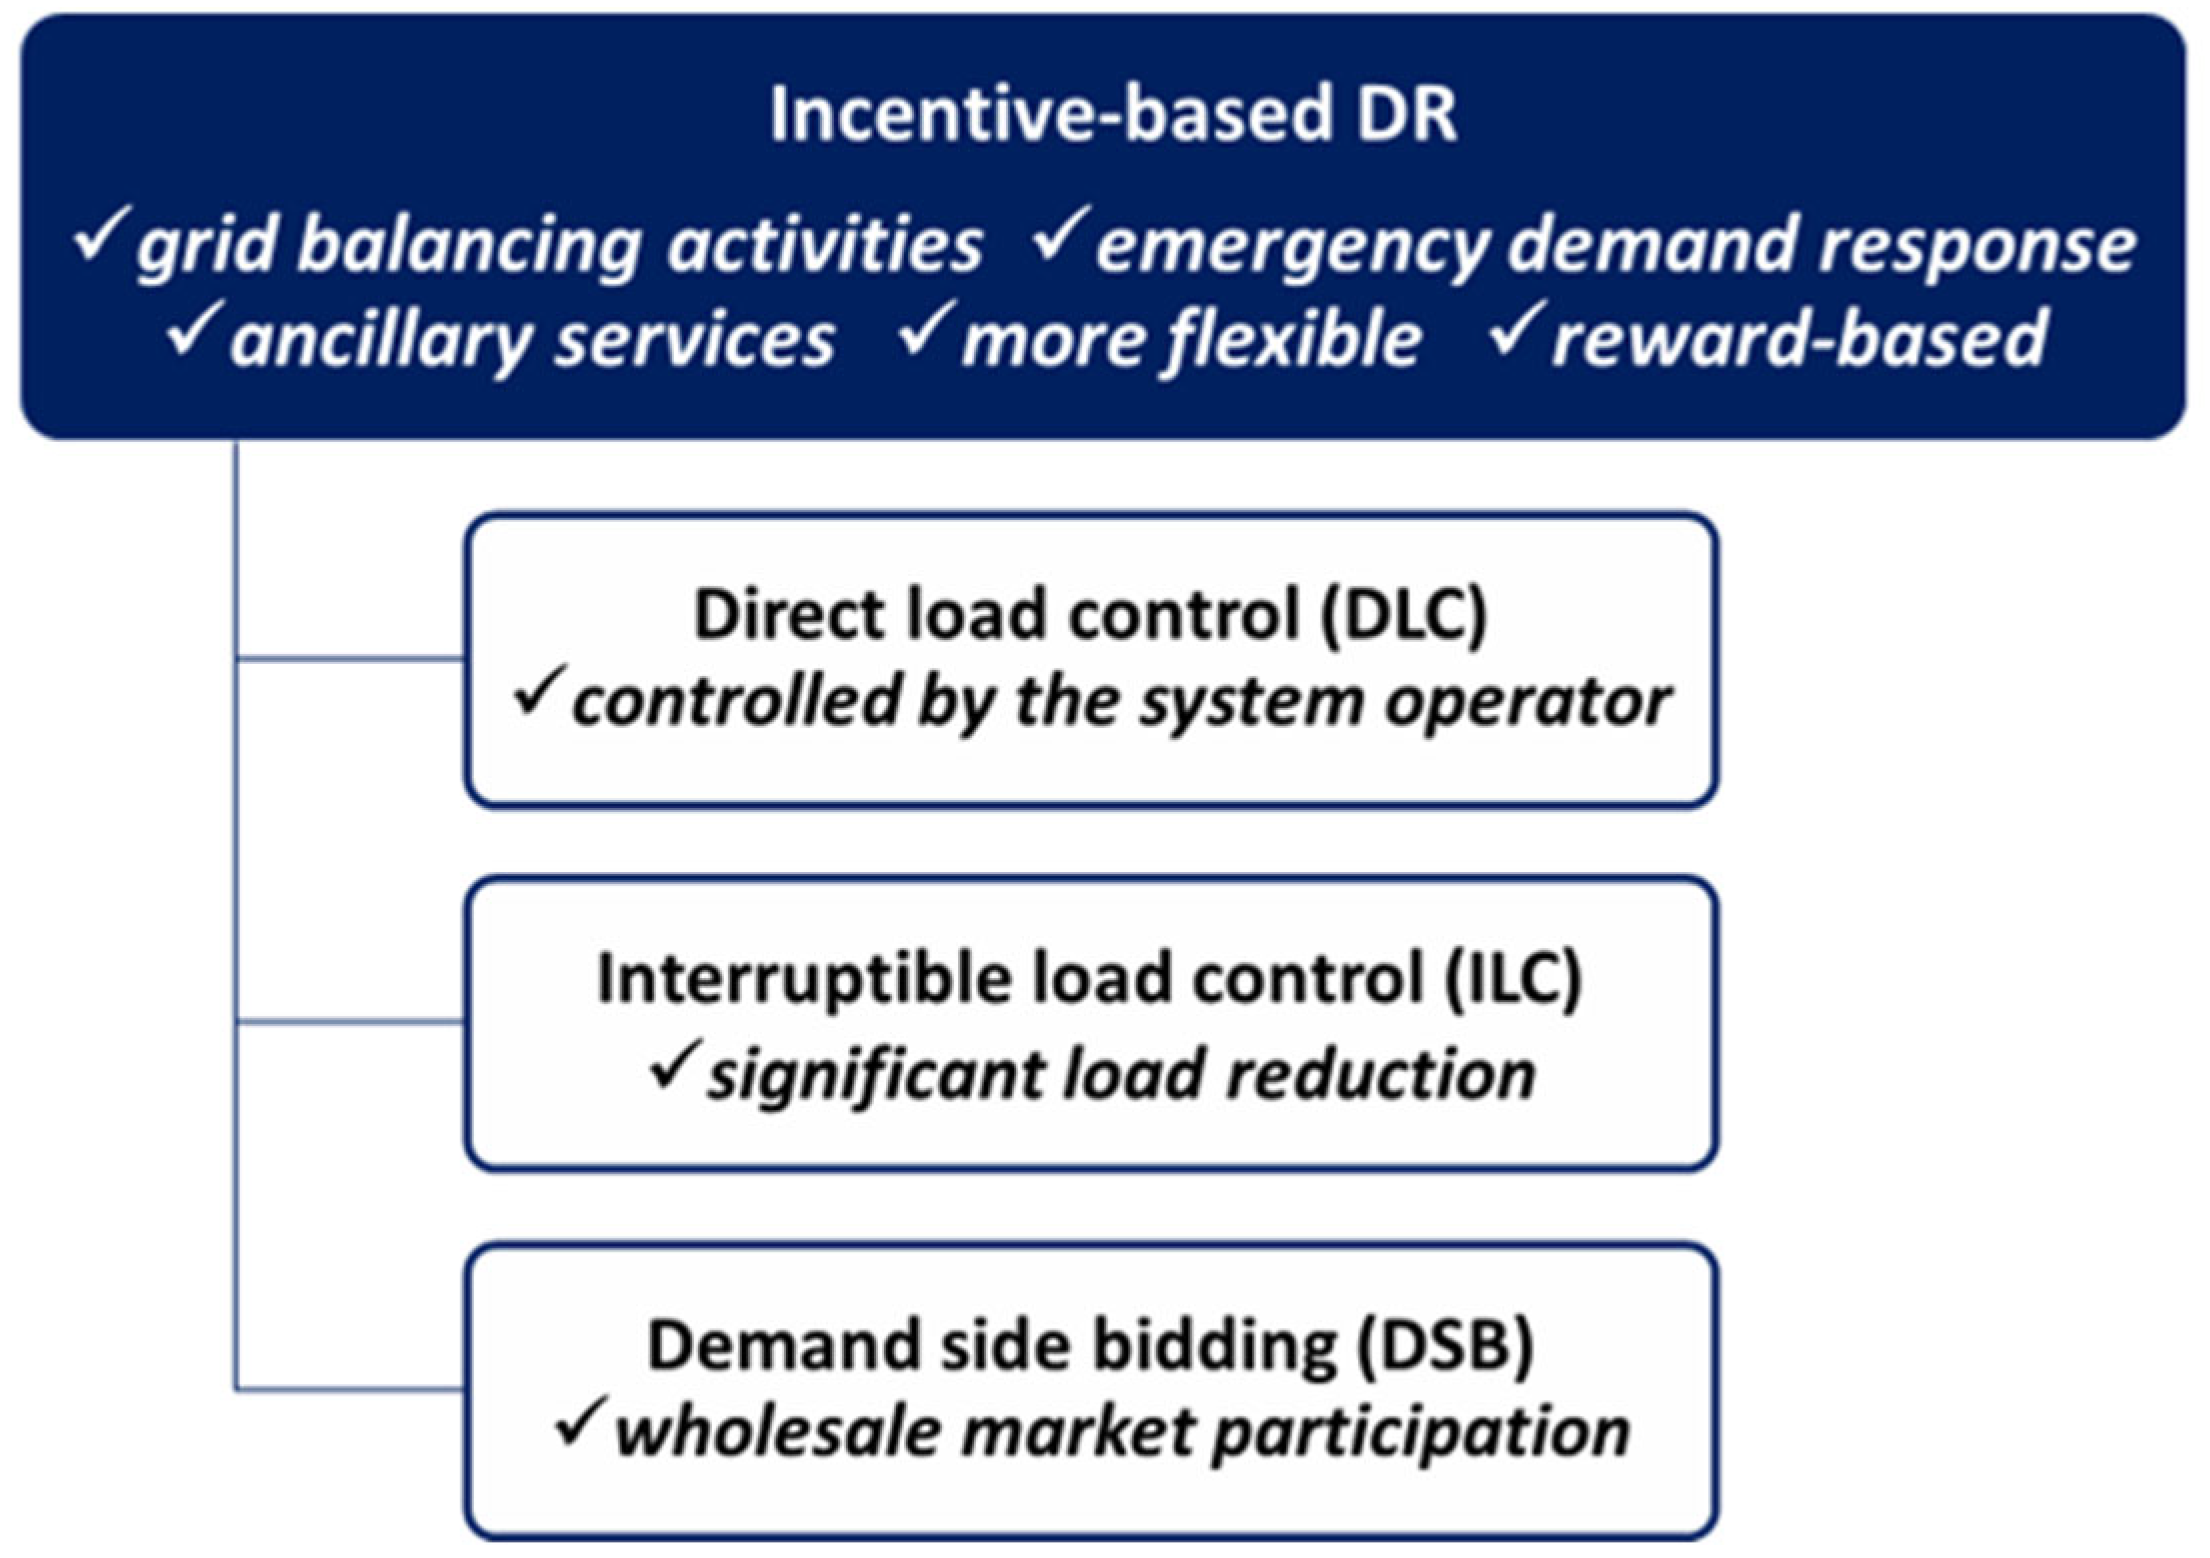
3.1.2. Demand Response Programs
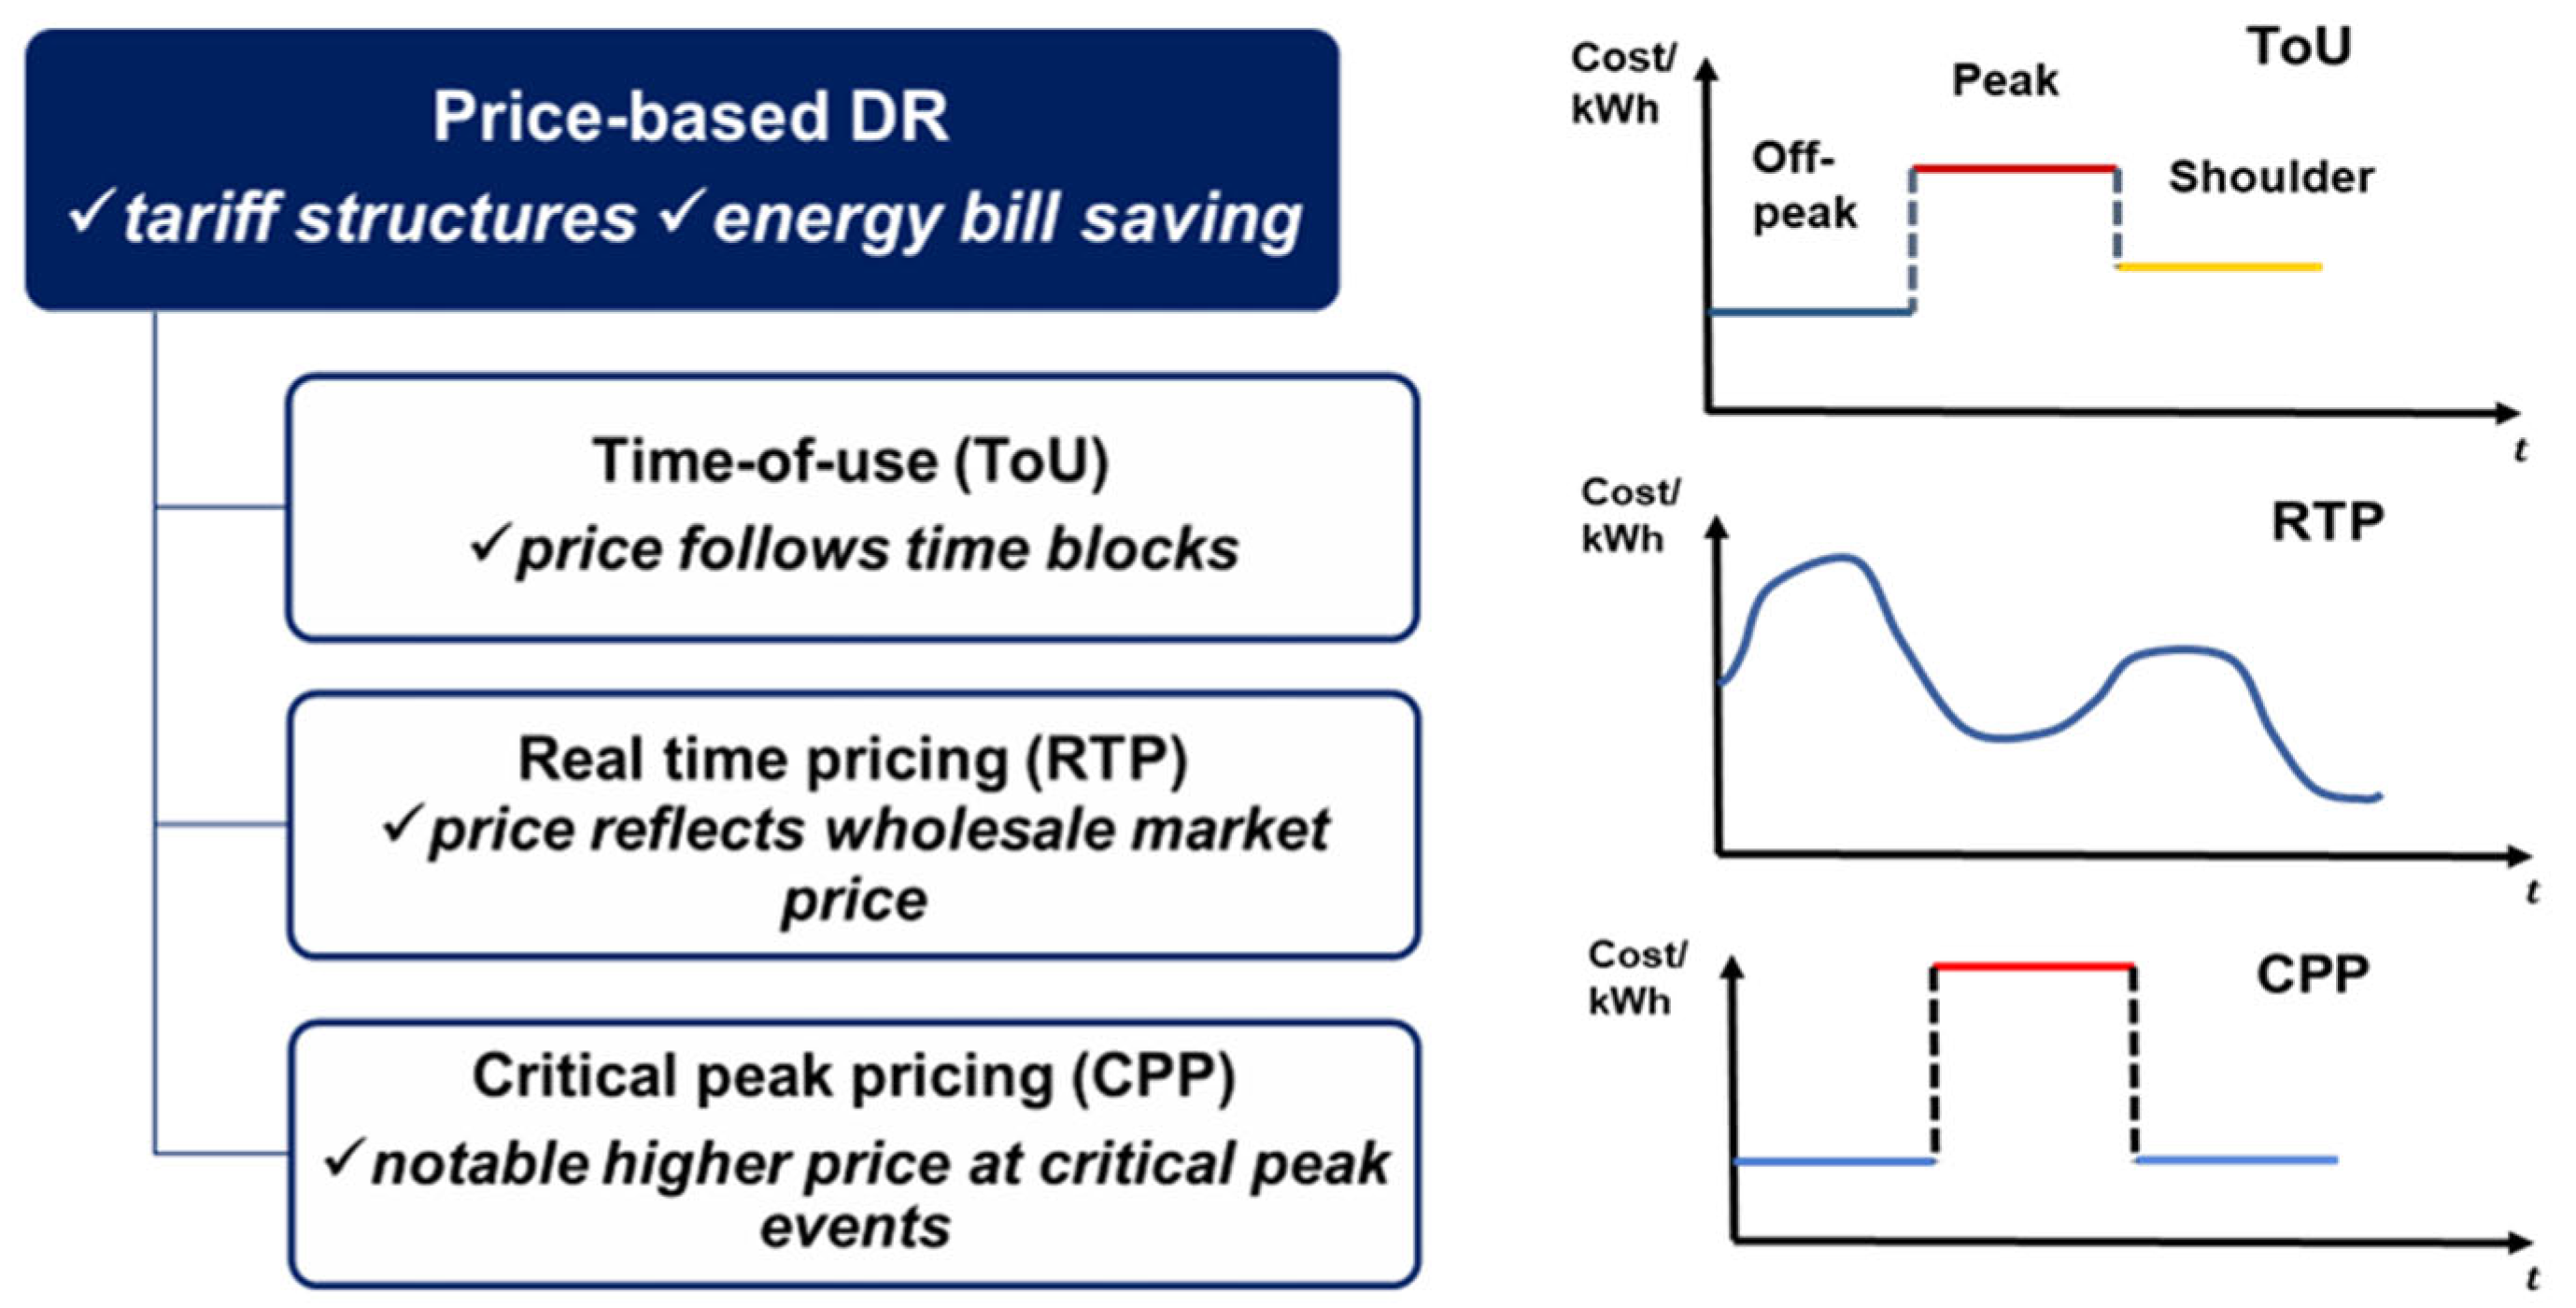
3.1.3. Demand Response Strategies
3.2. Overview of ESSs
3.2.1. Electrochemical ESS
3.2.2. Electrical ESS
3.2.3. Mechanical ESS
3.2.4. Compressed Air ESS
3.2.5. Thermal ESS
3.2.6. Chemical ESS
3.3. Battery Energy Storage System (BESS)
3.3.1. Lead-Acid Battery
3.3.2. Li-Ion Battery
3.3.3. Nickel-Based Battery
3.3.4. Sodium-Based Batteries
3.3.5. Flow Batteries
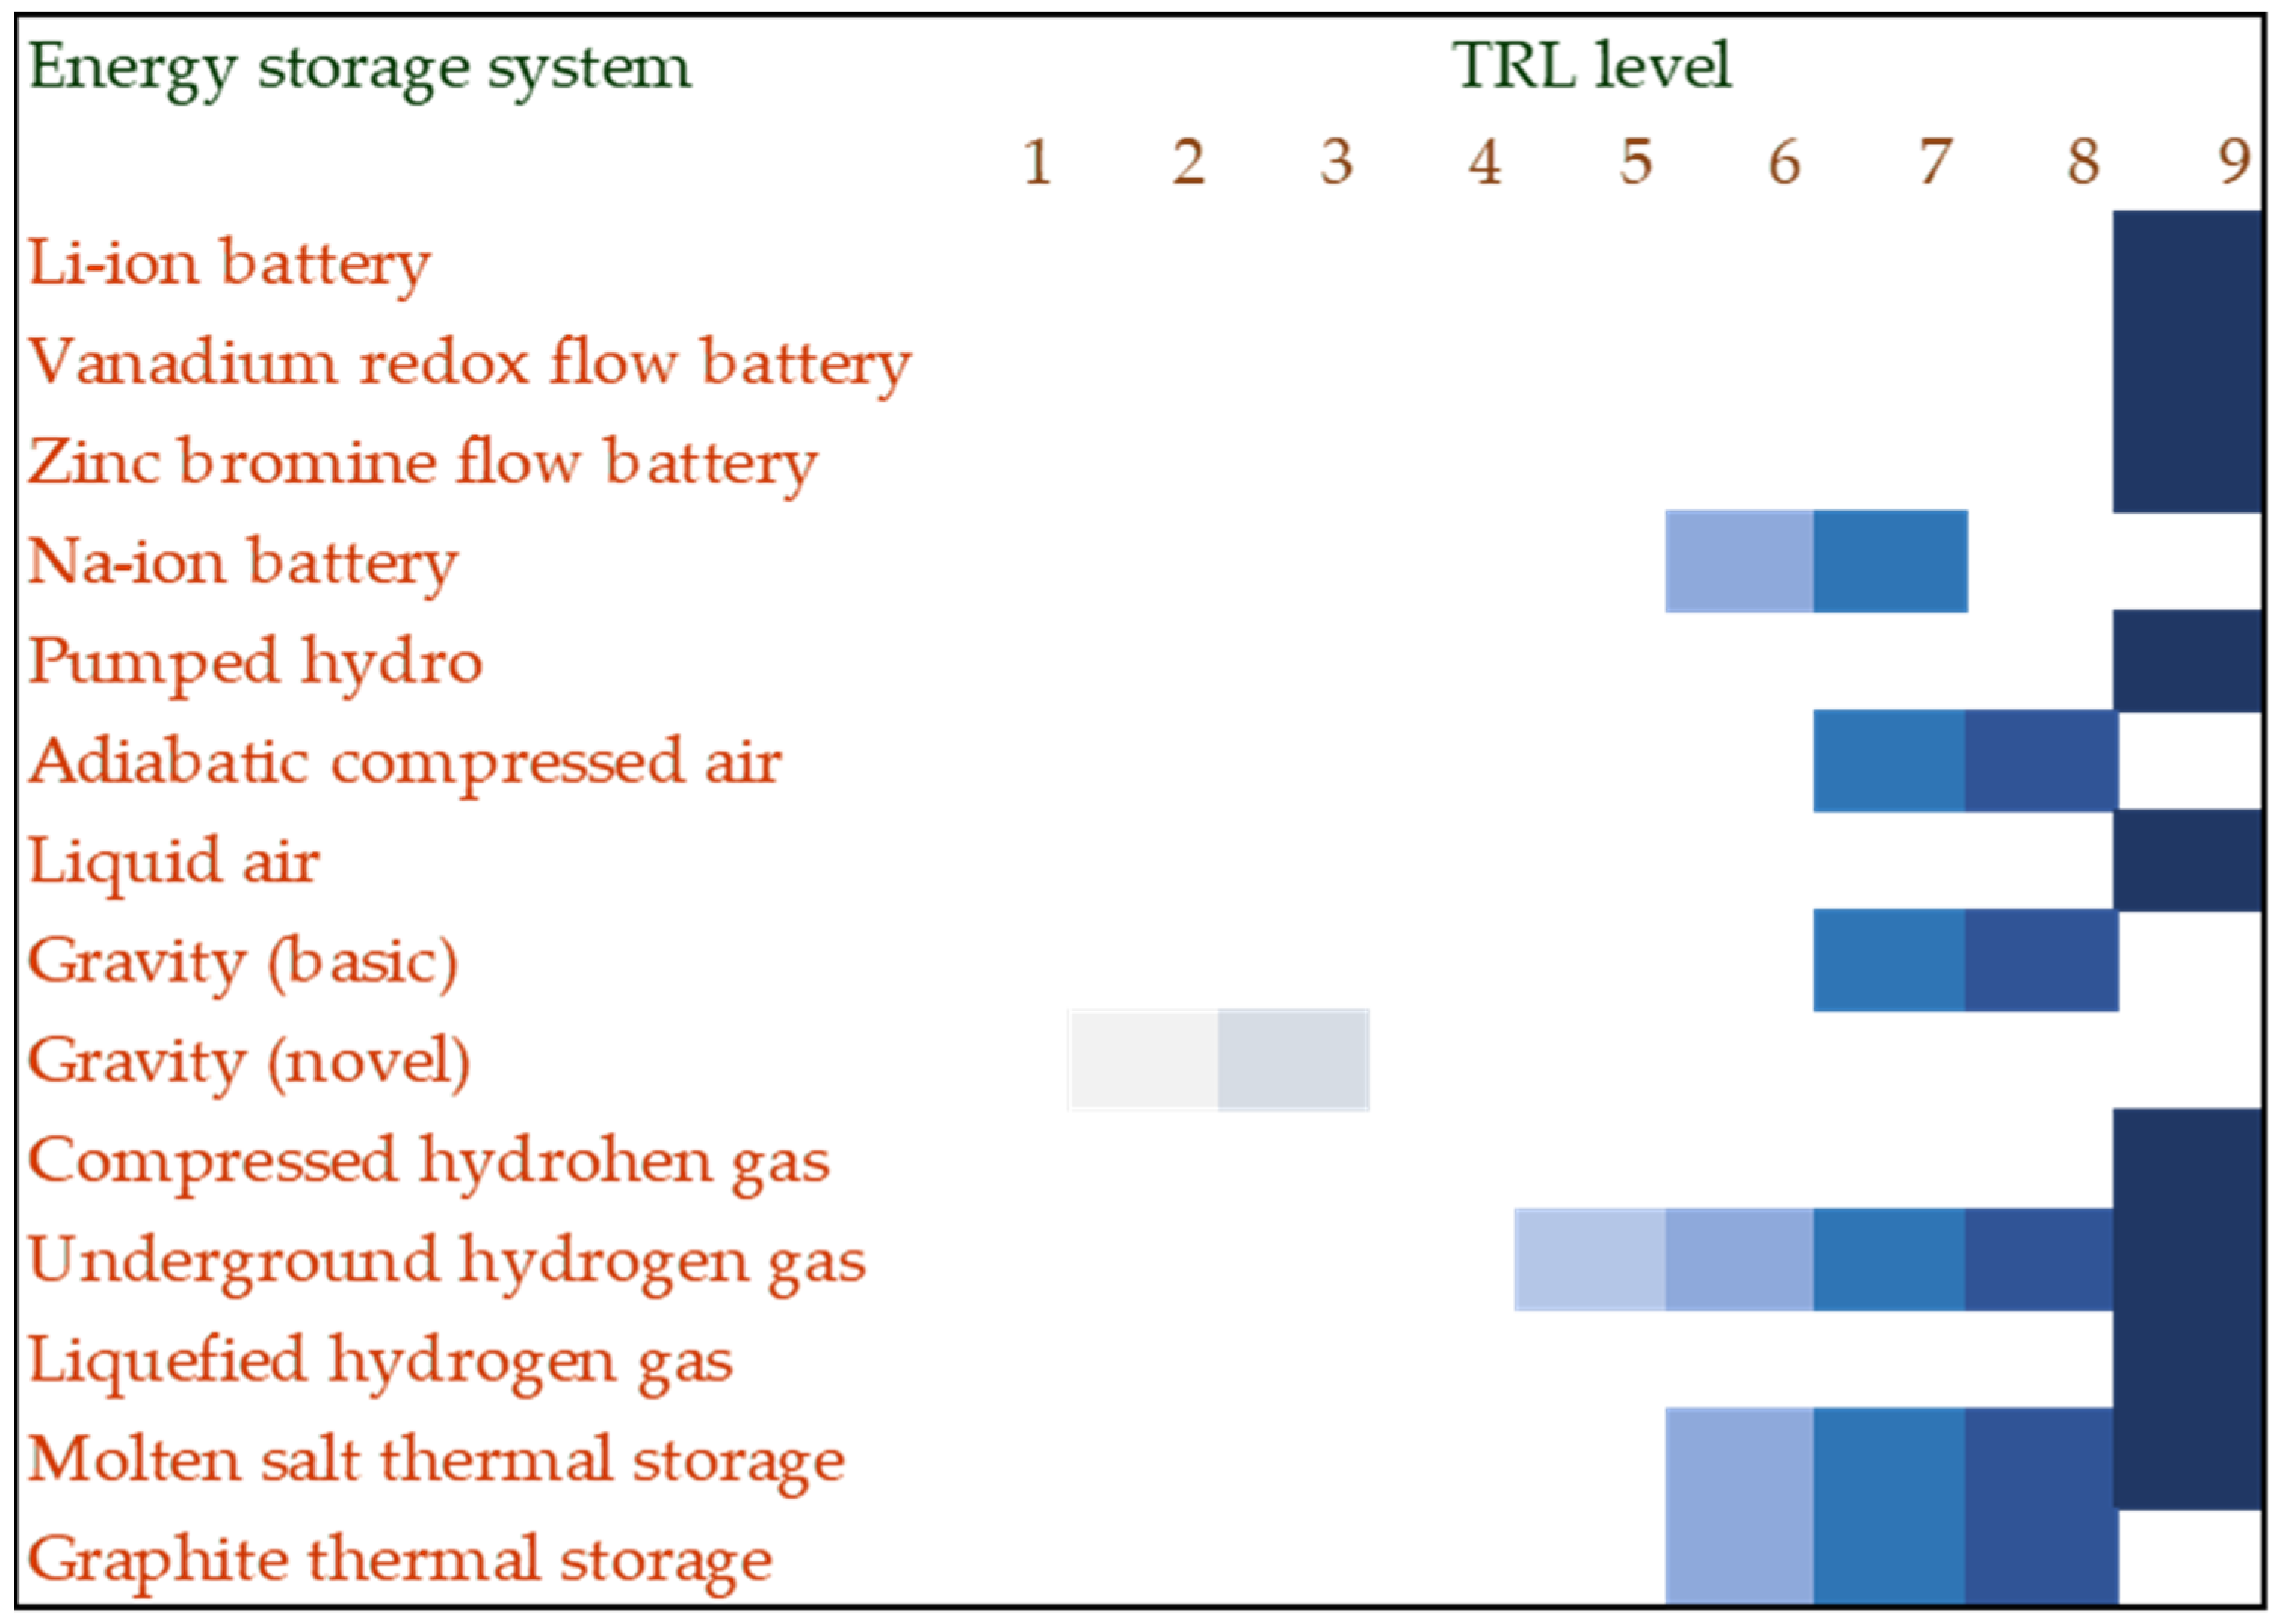
3.4. Technology Readiness Level
4. Application of ESS and ORG with DR
4.1. Background
4.2. Analysis with Commercial Consumers
4.2.1. Demand Flexibility with HVAC
4.2.2. Demand Flexibility with ESS and ORG
4.3. Analysis with Industrial Consumers
4.3.1. DR with ESS
4.3.2. DR with ESS and ORG
4.3.3. Role of Load Scheduling
4.3.4. DR with VPP
4.3.5. DR with EV
4.4. Outlook
4.5. Case Studies
4.5.1. Australian Case Study
4.5.2. Mexican Metal Structure Manufacturer
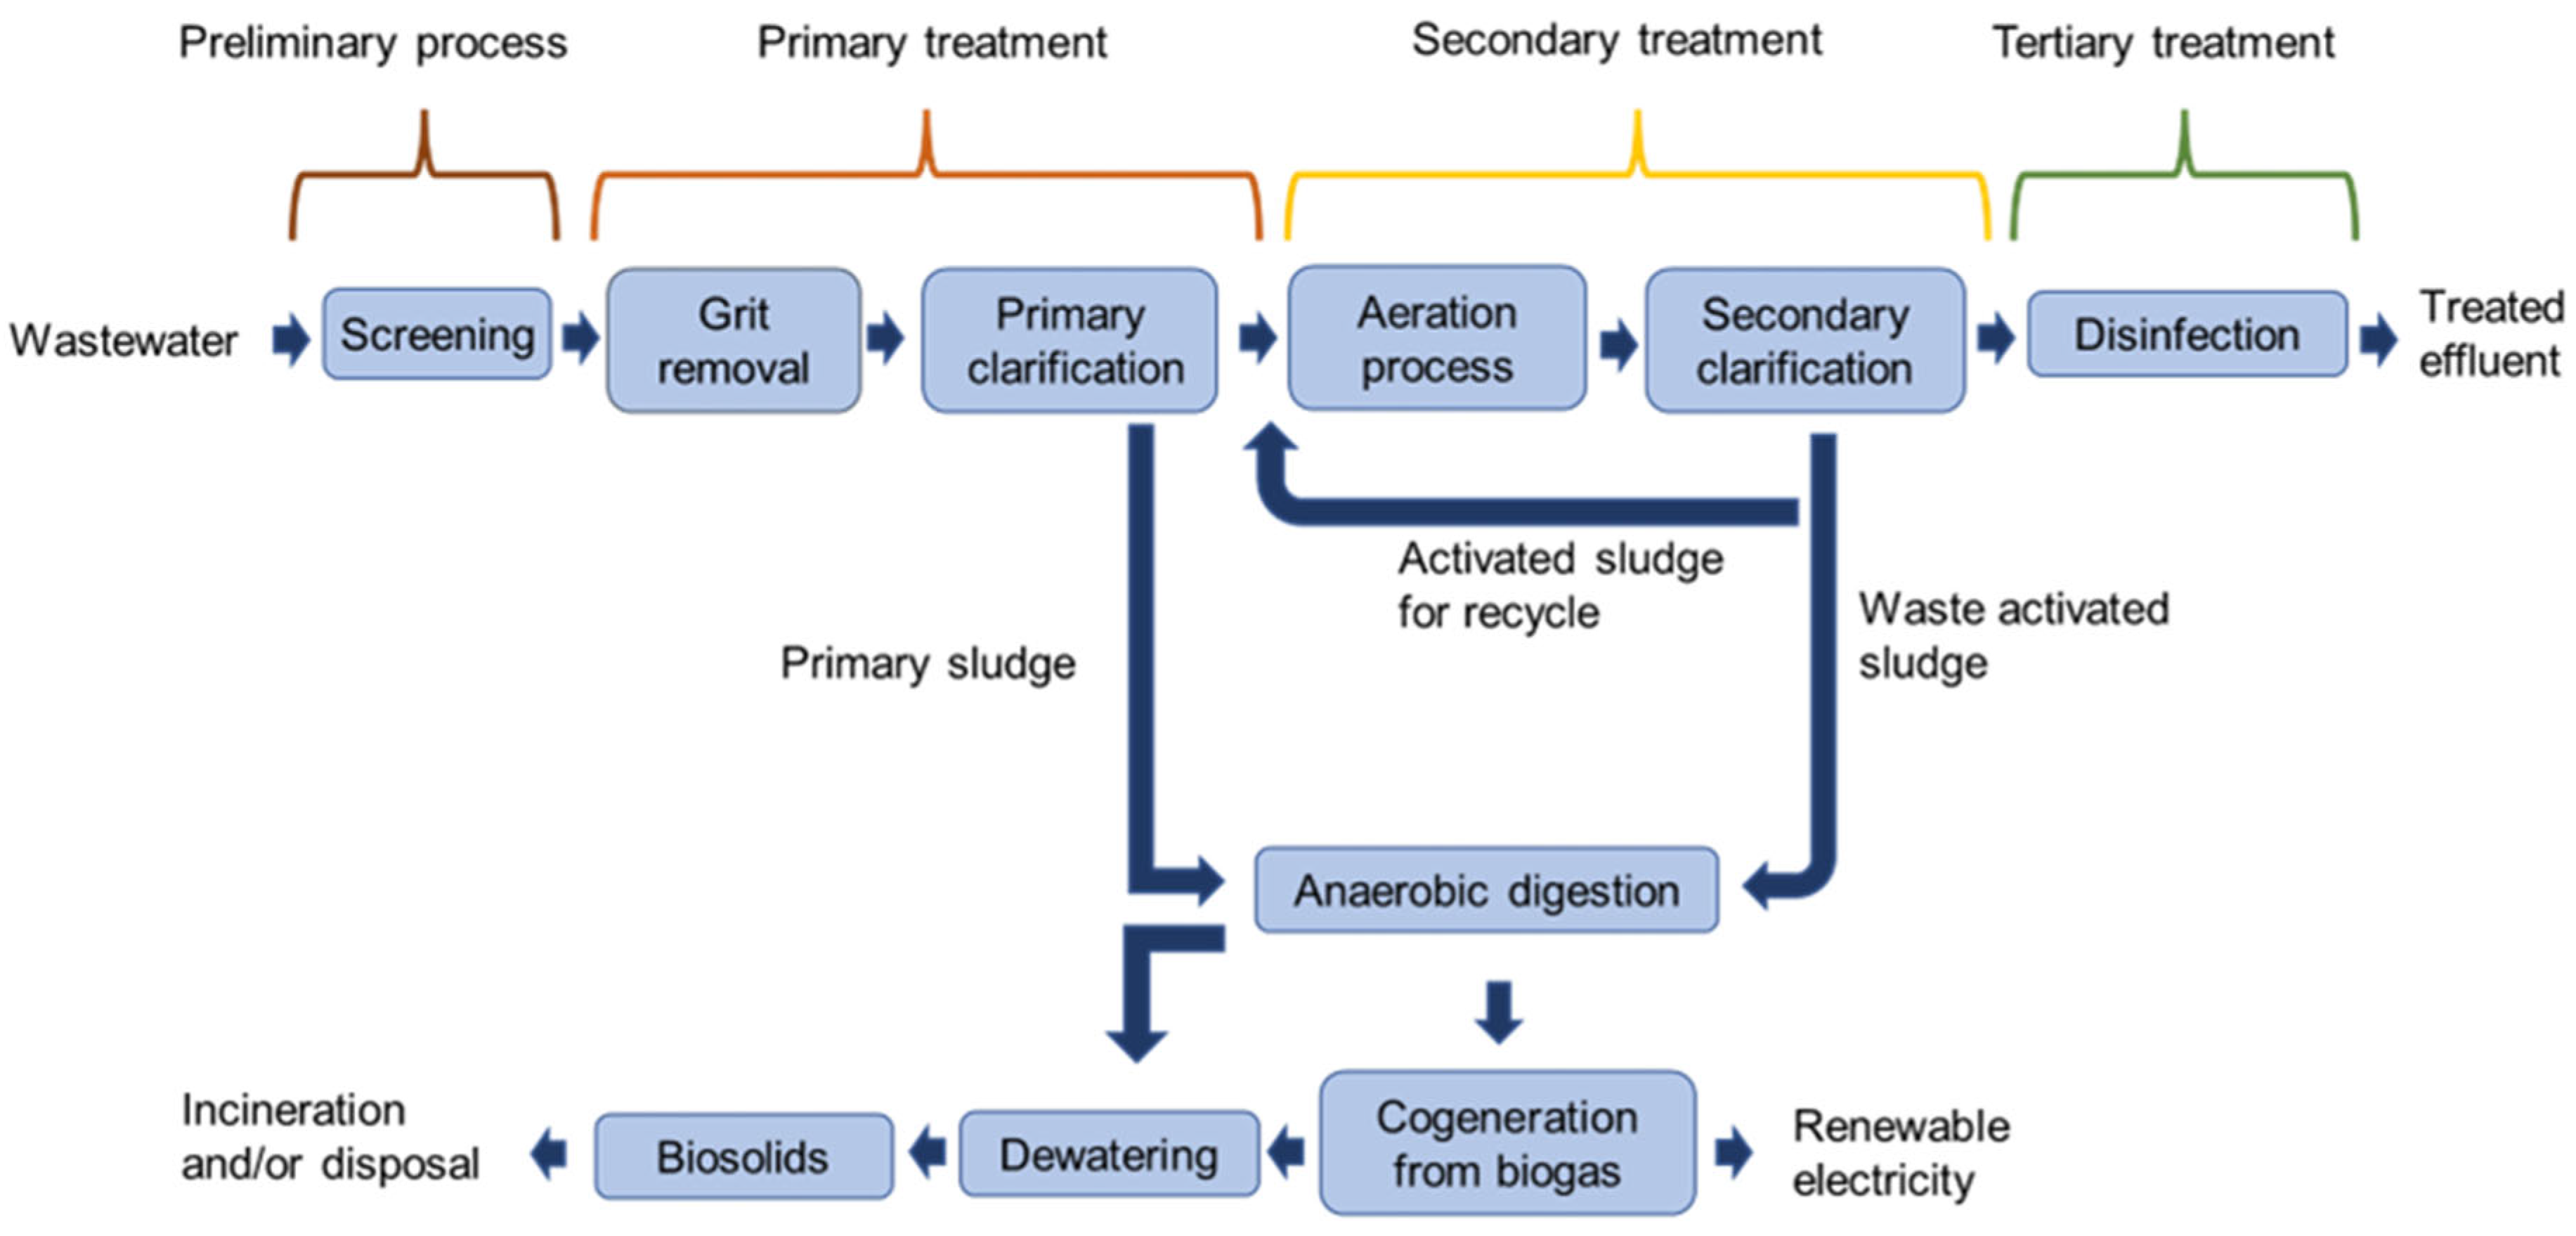
5. DR in Wastewater Treatment Plant (WWTP)

5.1. Flexible Resources
5.1.1. Aeration Process
5.1.2. Pumping
5.1.3. Built-in Redundancy
5.1.4. Onsite Generation
5.2. DR Potential in WWTP with Increased Flexibility
5.3. Outlook
6. Summary
6.1. Flexibility Assessment
6.1.1. Role of ESS and ORG
6.1.2. Techno–Economic Benefits
6.1.3. Environmental Benefits
6.1.4. Challenges and Limitations
6.2. Further Work and Recommendations
- C&I consumers with inflexible loads and processes can increase their flexibility by implementing a DR-ESS-ORG framework. They can maximise benefits by using a hybrid energy system, including more than one energy storage and/or renewable generation technology, through optimal DR modelling and extensive cost–benefit analysis.
- With the aid of ESS, C&I consumers can pre-plan their load reduction/shifting strategy, generate their load reduction curve (LRC), protect their privacy, and communicate this LRC with the system operator facilitating direct load control program participation.
- Considering thermal storage as an inexpensive technology, the C&I facility can include thermal storage in the DR framework while prioritising thermal comfort for the users. Thermal comfort can be evaluated through practical field surveys involving the users.
- Considering the effect of the DR program on battery life, a good appraisal of demand profile, electricity charges, tariff structures, and/or DR incentives should be inspected for suitable battery sizing and cost-effective investment.
- WWTPs as a source of valuable energy from waste should be supported with necessary research, education, and technical know-how to cultivate their opportunity of producing green energy for their own and wider interest.
7. Conclusions
Author Contributions
Funding
Data Availability Statement
Conflicts of Interest
Abbreviations
| DG | Distributed generation |
| DER | Distributed energy resources |
| RES | Renewable energy sources |
| RE | Renewable energy |
| DR | Demand response |
| DSM | Demand side management |
| C&I | Commercial and industrial |
| ESS | Energy storage system |
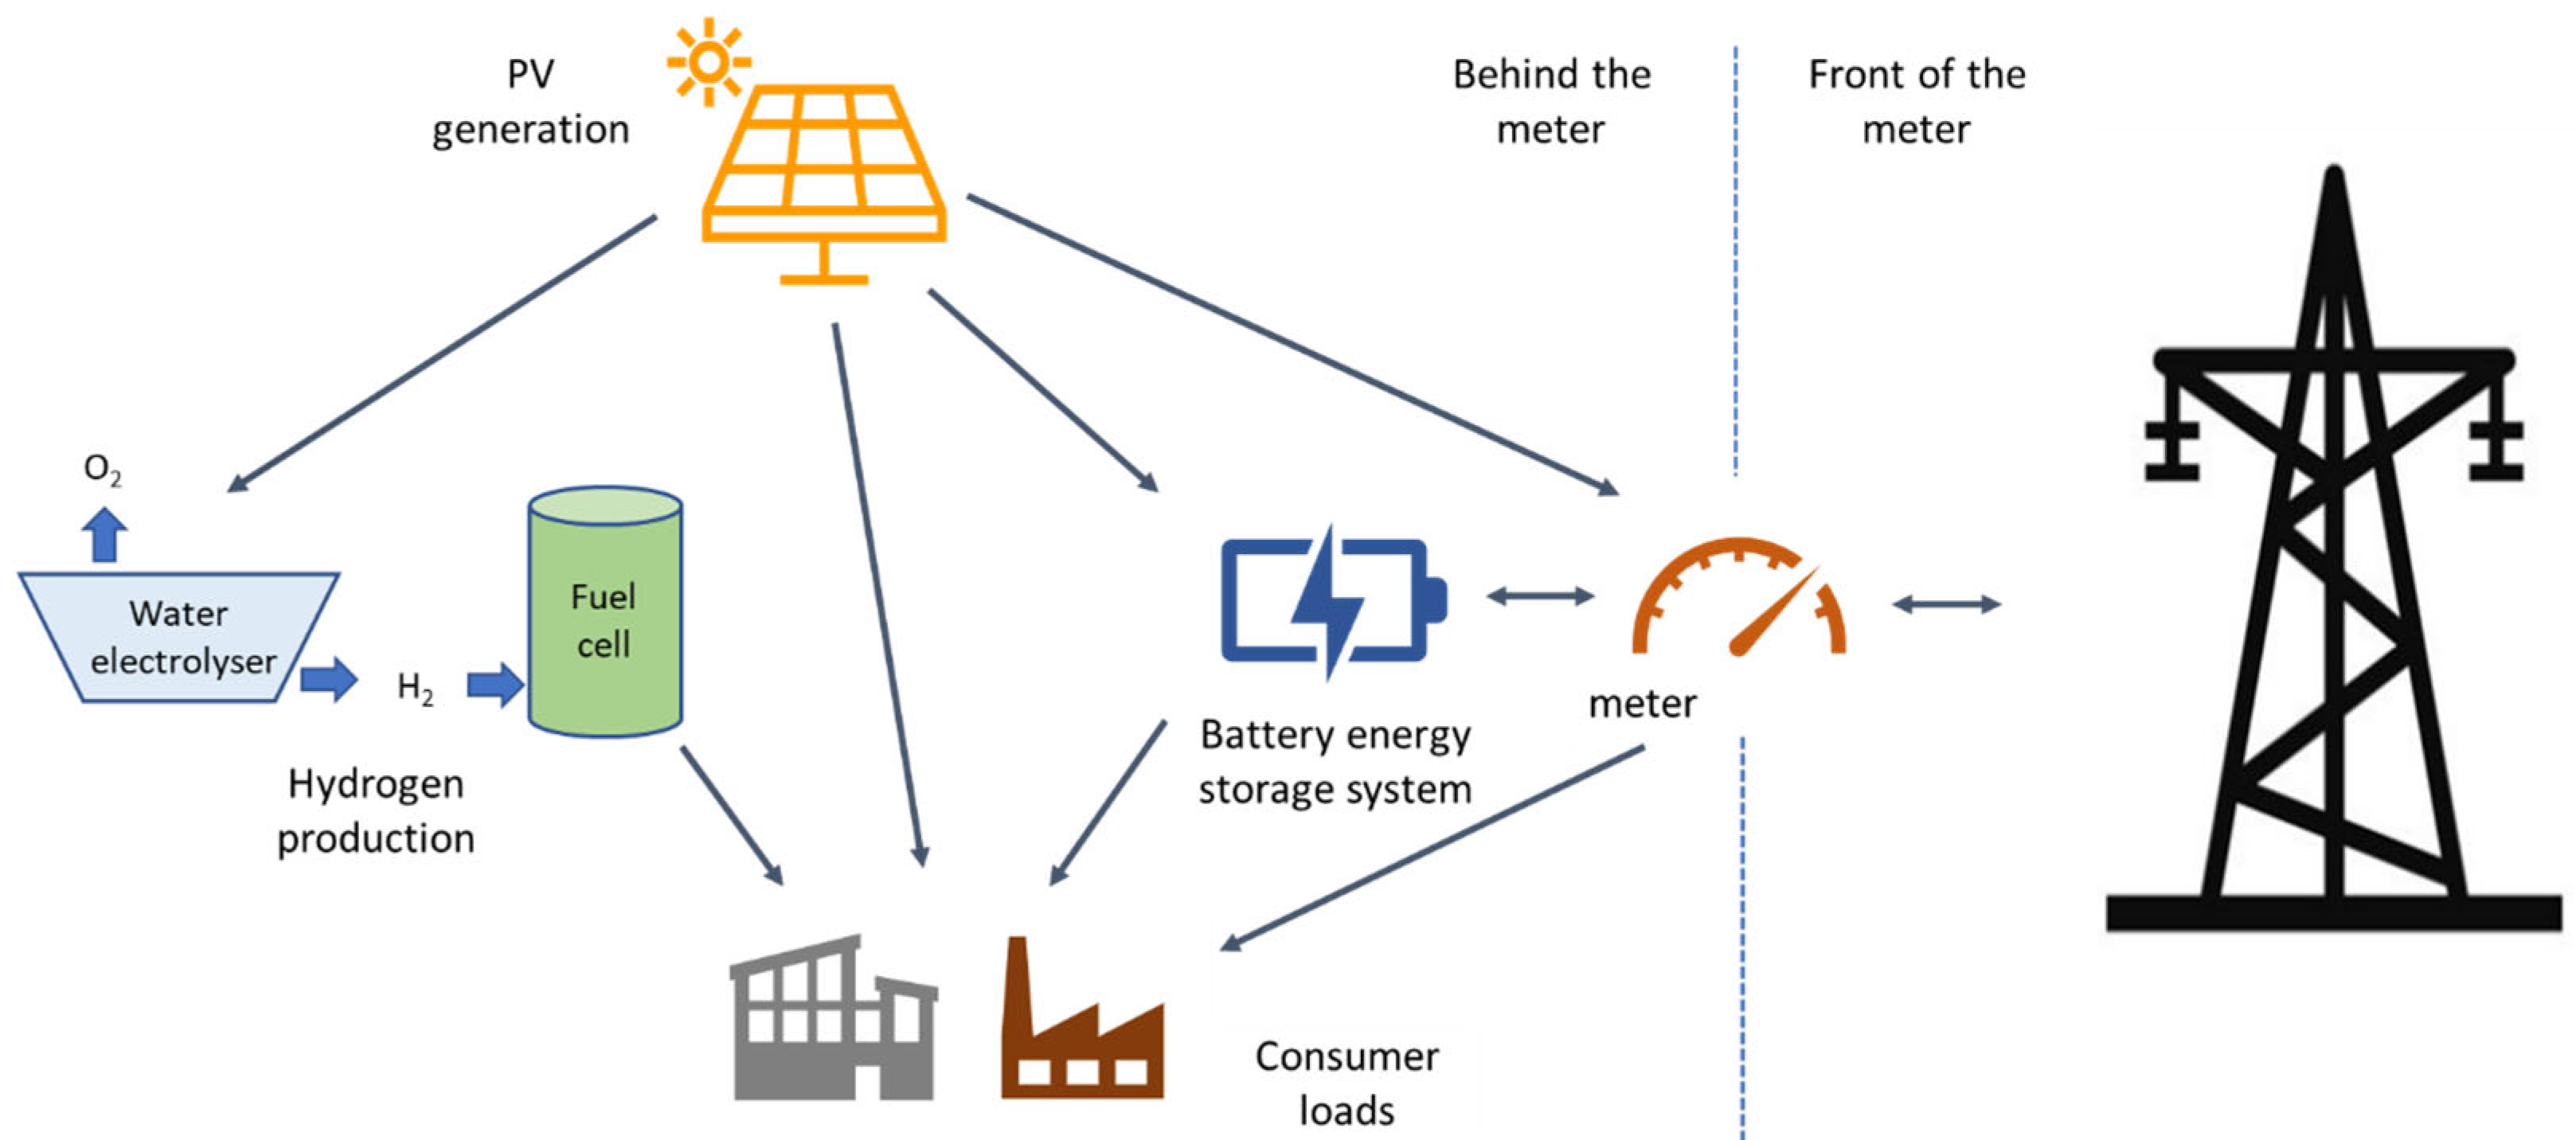
| FTM | Front of the meter |
| BTM | Behind-the-meter |
| ORG | Onsite renewable generation |
| EV | Electric vehicle |
| WWTP | Wastewater treatment plant |
| HVAC | Heating, ventilation and cooling |
| PV | Photovoltaic |
| DTR | Dynamic thermal rating |
| OTS | Optimal transmission switching |
| EGS | Energy generation system |
| AMI | Advanced metering infrastructure |
| DRSP | Demand response service provider |
| DSO | Distribution system operator |
| ISO | Independent system operator |
| ToU | Time of use |
| RTP | Real time pricing |
| CPP | Critical peak pricing |
| DLC | Direct load control |
| SC | Supercapacitor |
| SMES | Superconducting magnetic energy storage |
| MESS | Mechanical energy storage system |
| PHES | Pumped hydro energy storage |
| CAES | Compressed air energy storage |
| FES | Flywheel energy storage |
| TES | Thermal energy storage |
| BESS | Battery energy storage system |
| PCM | Phase change material |
| VES | Virtual energy storage |
| CES | Chemical energy storage |
| LPG | Liquified petroleum gas |
| SNG | Synthetic natural gas |
| HESS | Hydrogen energy storage system |
| HFC | Hydrogen fuel cell |
| SOC | State of the charge |
| SOH | State of the health |
| DOD | Depth of discharge |
| P2H | Power-to-heat |
| CHP | Combined heat and power |
| MPC | Model predictive control |
| STN | State task network |
| ST | Schedulable task |
| NST | Non schedulable task |
| CEMS | Commercial energy management system |
| VPP | Virtual power plant |
| IVPP | Industrial virtual power plant |
| V2G | Vehicle-to-grid |
| DO | Dissolved oxygen |
| PEM | Proton exchange membrane |
| RO | Reverse osmosis |
| MFC | Microbial fuel cell |
| TN | Total nitrogen |
| COES | Compressed oxygen energy storage |
| DC | Demand charge |
| SO | System operator |
| LCD | Load control device |
| LRC | Load reduction curve |
| ROI | Return of investment |
Appendix A

| Consumer | References | Year | DR Program/Market | ESS | ORG | Process/Loads/Main Strategy | Facilities | Highlighted Aspects |
|---|---|---|---|---|---|---|---|---|
| C * | [105] | 2017 | x | √ | √ | Use of optimum RE harvesting and ESS capacity | Non-deferable load facility | The nonlinear relationship between the discharging rate and the remaining charge of ESS was highlighted. |
| C | [136] | 2023 | Incentive-based | √ | x | The battery itself | Large commercial building | Participation in event-based DR provided a shorter discounted payback period for the Li-ion battery. |
| C | [102] | 2023 | x | √ | x | HVAC with chilled water storage | Commercial building | Flexibility potential provided through the control of temperature threshold and energy use reduced. |
| C | [187] | 2014 | Price-based: ToU | √ | x | Chiller system | Commercial building | Energy management algorithms, including chiller and ESS could reduce operational cost |
| C | [134] | 2021 | Price-based: flat rate, ToU, RTP | √ | √ | x | Office building | Battery behaviour can vary according to different DR price signals |
| C&I ** | [53] | 2019 | x | √ | √ | Water system including wells, pumps, seawater reverse osmosis system | Seawater desalination plant | Demand shifting of loads to utilise onsite RES generation using probabilistic weather data. |
| C | [79] | 2021 | Peak shaving and intra-day request | √ | √ | AHU fan, heat pump | Commercial building | Quality of flexibility introduced to address the variability of flexibility of resources |
| C | [108] | 2023 | Price-based: RTP | √ | x | Refrigerators, freezers, AC, water heater, washing machine, disinfection cabinet | Commercial building | Flexible loads, optimal regulation strategy could reduce power consumption costs and peak demand |
| C | [133] | 2019 | Price-based: ToU | √ | x | ESS control strategy following price signal | x | Users can maximise benefits by increasing energy consumption from ESS during peak periods. |
| C | [113] | 2018 | Price-based: RTP | √ | x | Gas turbine CHP unit | Office building | Use of TES with CHP provided more economic benefits than EES |
| C | [107] | 2017 | Price-based: ToU | √ | x | Flexible building loads | Commercial building | Coordination of real and virtual storages to save energy cost and demand charge |
| C | [139] | 2015 | Price-based: ToU | √ | x | HVAC control | Commercial building | Load was reduced by the cooperation of pre-cooling the chiller and discharging of ESS |
| C | [141] | 2021 | Price-based: RTP | √ | √ | Controlling AC and non-AC loads | Food court and commercial kitchen | Increase in non-AC appliances can provide better cost saving than AC loads |
| C | [146] | 2022 | Price-based: ToU | √ | x | Ice storage air conditioning system operation | Shopping mall | With the collaborative optimization of the operation and planning of ice storage and cooling air conditioning systems electricity cost was reduced |
| C | [188] | 2015 | Incentive-based | √ | x | chiller | Office building | Model predictive control of TES considering multi-tiered demand charge |
| C | [138] | 2018 | Ancillary services | √ | √ | Battery control with DC threshold | C&I site | DR with demand charge reduction using an ESS |
| C | [145] | 2019 | √ | x | HVAC scheduling | Office building | MPC optimisation results reduced demand charge with improved battery life | |
| C&I | [137] | 2019 | Price-based | √ | x | Transferrable, deferrable, power adjustable loads | Industrial enterprise | By rationally regulating demand side resources could save electricity bill notably while satisfying user’s energy consumption |
| C, I & R *** | [47] | 2019 | Incentive-based | √ | √ | Next-generation industrial and household level system | C&I site, residences | Provided grid support with accumulated loads and renewable generation in real time |
| C&I | [147] | 2016 | x | √ | x | Compressed air energy system with air storage | Car repair shop | Load management potential notably increases with the CAES storage size |
| I | [127] | 2021 | Price-based: ToU | √ | √ | Transferable and reducible loads | Industrial Park | Optimal configuration of energy storage capacity was established considering ESS despatching strategy and DR |
| I | [86] | 2021 | Incentive-based | √ | x | Shifting of workloads | Data centre | Simultaneous schedule of workloads, generator and battery could maximise benefit |
| I | [131] | 2018 | Price-based: ToU | √ | √ | HVAC with chilled water storage, EV | Tire manufacturing facility | Using the flexibility available at all parts of the facility electricity cost was reduced |
| I | [12] | 2015 | Price-based: CPP | √ | √ | Luxury vehicle cockpit assembly | Automobile industry | Taking advantage of onsite generation, demand scheduling and DR profit was maximised |
| I | [104] | 2017 | Ancillary services | √ | √ | Raw mills | Cement industry | Integration of solar energy with ESS provided cost-efficient plant scheduling and promising load following capability |
| I | [11] | 2018 | Real time and day-ahead and | √ | √ | server operations with delay-tolerant workload | Data centre | Co-optimization of server provisioning and power procurement fitted with DR reduced energy cost and increased RE use |
| I | [189] | 2017 | Day-ahead market | √ | √ | Flexible and inflexible loads | Large industrial manufacturer | Using ORG and ESS enabled DR operation for both flexible and inflexible loads |
| I | [122] | 2016 | Real time and day-ahead and | √ | √ | x | Data centre and manufacturing | Provided a decision-making methodology to procure energy with cut generation and aggregation strategy |
| I | [112] | 2017 | Price-based | √ | √ | Temperature control of HVAC system | Factory building | TES charged by PV energy is beneficial, however consideration need on the installation cost |
| I | [85] | 2020 | Price based (TimeLevel-of-Use); load reduction | √ | √ | Optimal production scheduling and EMS decisions | Metal structure manufacturing industry | Optimised production schedule coordinated with RES, ESS, and grid power back up could reduce energy cost |
| I | [103] | 2014 | Day-ahead market | √ | √ | STN based production scheduling integrated with DERs | Oxygen generation facilities | DER integration with DR reduced energy cost |
| I | [121] | 2016 | Ancillary services | √ | x | Cement crushing process | Cement industry | Granularity restrictions of industrial loads was reduced with ESS considering hourly operation |
| I | [114] | 2018 | Ancillary services | √ | x | Cement crushing process | Cement industry | Granularity restrictions of industrial loads was reduced with ESS considering day ahead optimal scheduling |
| I | [149] | 2018 | Incentive-based | x | √ | Refinery process | Oil refinery industry | An EMS framework including cogeneration facility, PV and DR could reduce electricity cost |
| I | [143] | 2015 | Price and incentive-based | √ | √ | Various industrial units including interdependent loads | Steel mill industry | Optimal load control scheduling through optimal energy and material usage |
| I | [190] | 2017 | Price-based: RTP | √ | x | Optimal scheduling of still powder manufacturing process | Steel industry | Hourly ahead DR with ESS provided better cost reduction than day ahead DR |
| I | [118] | 2019 | Incentive-based | √ | √ | Discrete manufacturing process | Metal processing industry | load reduction curves generated to infer potential load reduction |
| I | [144] | 2018 | Day ahead pricing and RTP | √ | √ | Industrial machine, lighting, HVAC loads | Manufacturing facility | A varied cast saving was observed according to seasonal changes having RESs in the system |
| I | [120] | 2016 | Day ahead hourly pricing | √ | x | Stamping process | Automobile manufacturing industry | DR energy management scheme with ESS reduced energy cost without degrading production processes |
| I | [125] | 2020 | Day ahead market | √ | x | Reducible industrial loads | Eco-industrial park | Increased capacity of DR and ESS gives better RES integration and reduced grid power purchase |
| I | [135] | 2021 | Incentive-based | √ | √ | flow equalization basin; CHP unit | Wastewater treatment plant | Adding energy stabilising load as battery can secure DR participation |
| I | [142] | 2020 | Price-based | √ | x | x | Large industries | By integrating DR commercial benefit of energy storage was increased |
| I | [148] | 2017 | Contract and incentive-based scheme | √ | √ | Chlor-alkali process | Chlor-alkali plant | By onsite generation using wind, solar and hydrogen integrated with DR increased revenue |
| I | [140] | 2018 | Price-based: RTP | √ | x | Plastic packaging process | Food industry | Shifting of industrial load utilising battery was proposed through particular modelling |
| I | [191] | 2023 | Price-based; Incentive-based | √ | x | x | Industry | Application of Reinforcement Learning algorithm focusing on economic assessment of DR |
References
- Nadeem, T.B.; Siddiqui, M.; Khalid, M.; Asif, M. Distributed energy systems: A review of classification, technologies, applications, and policies: Current Policy, targets and their achievements in different countries (continued). Energy Strategy Rev. 2023, 48, 101096. [Google Scholar] [CrossRef]
- Bakare, M.S.; Abdulkarim, A.; Zeeshan, M.; Shuaibu, A.N. A comprehensive overview on demand side energy management towards smart grids: Challenges, solutions, and future direction. Energy Inform. 2023, 6, 4. [Google Scholar] [CrossRef]
- Caineng, Z.; Feng, M.; Songqi, P.; Qun, Z.; Guoyou, F.; ZHANG, G.; Yichao, Y.; Hao, Y.; LIANG, Y.; Minjie, L. Global energy transition revolution and the connotation and pathway of the green and intelligent energy system. Pet. Explor. Dev. 2023, 50, 722–740. [Google Scholar]
- Australian Energy Update 2022. Canberra, Australia. 2022. Available online: https://www.energy.gov.au/sites/default/files/Australian%20Energy%20Statistics%202022%20Energy%20Update%20Report.pdf (accessed on 24 September 2023).
- Shen, B.; Kahrl, F.; Satchwell, A.J. Facilitating power grid decarbonization with distributed energy resources: Lessons from the united states. Annu. Rev. Environ. Resour. 2021, 46, 349–375. [Google Scholar] [CrossRef]
- Pommeret, A.; Schubert, K. Optimal energy transition with variable and intermittent renewable electricity generation. J. Econ. Dyn. Control 2022, 134, 104273. [Google Scholar] [CrossRef]
- Impram, S.; Nese, S.V.; Oral, B. Challenges of renewable energy penetration on power system flexibility: A survey. Energy Strategy Rev. 2020, 31, 100539. [Google Scholar] [CrossRef]
- Santecchia, A.; Kantor, I.; Castro-Amoedo, R.; Marechal, F. Industrial Flexibility as Demand Side Response for Electrical Grid Stability. Front. Energy Res. 2022, 10, 831462. [Google Scholar] [CrossRef]
- Ma, O.; Cheung, K. Demand Response and Energy Storage Integration Study; Office of Energy Efficiency and Renewable Energy: Washington, DC, USA, 2016.
- Nguyen, T.A.; Byrne, R.H. Optimal time-of-use management with power factor correction using behind-the-meter energy storage systems. In Proceedings of the 2018 IEEE Power & Energy Society General Meeting (PESGM), Portland, OR, USA, 5–10 August 2018; pp. 1–5. [Google Scholar]
- Kwon, S.; Ntaimo, L.; Gautam, N. Demand response in data centers: Integration of server provisioning and power procurement. IEEE Trans. Smart Grid 2018, 10, 4928–4938. [Google Scholar] [CrossRef]
- Choobineh, M.; Mohagheghi, S. Optimal energy management in an industrial plant using on-site generation and demand scheduling. IEEE Trans. Ind. Appl. 2015, 52, 1945–1952. [Google Scholar] [CrossRef]
- Denholm, P. The Role of Storage and Demand Response. US. 2015. Available online: https://www.nrel.gov/docs/fy15osti/63041.pdf (accessed on 31 August 2023).
- Aghaei, J.; Alizadeh, M.-I. Demand response in smart electricity grids equipped with renewable energy sources: A review. Renew. Sustain. Energy Rev. 2013, 18, 64–72. [Google Scholar] [CrossRef]
- Metwaly, M.K.; Teh, J. Probabilistic peak demand matching by battery energy storage alongside dynamic thermal ratings and demand response for enhanced network reliability. IEEE Access 2020, 8, 181547–181559. [Google Scholar] [CrossRef]
- Almehizia, A.A.; Al-Masri, H.M.; Ehsani, M. Integration of renewable energy sources by load shifting and utilizing value storage. IEEE Trans. Smart Grid 2018, 10, 4974–4984. [Google Scholar] [CrossRef]
- dos Santos, S.A.B.; Soares, J.M.; Barroso, G.C.; de Athayde Prata, B. Demand response application in industrial scenarios: A systematic mapping of practical implementation. Expert Syst. Appl. 2022, 215, 119393. [Google Scholar] [CrossRef]
- Emami, N.; Sobhani, R.; Rosso, D. Diurnal variations of the energy intensity and associated greenhouse gas emissions for activated sludge processes. Water Sci. Technol. 2018, 77, 1838–1850. [Google Scholar] [CrossRef] [PubMed]
- Giberti, M.; Dereli, R.K.; Flynn, D.; Casey, E. Predicting wastewater treatment plant performance during aeration demand shifting with a dual-layer reaction settling model. Water Sci. Technol. 2020, 81, 1365–1374. [Google Scholar] [CrossRef] [PubMed]
- Brok, N.B.; Munk-Nielsen, T.; Madsen, H.; Stentoft, P.A. Flexible control of wastewater aeration for cost-efficient, sustainable treatment. IFAC-PapersOnLine 2019, 52, 494–499. [Google Scholar] [CrossRef]
- Williams, B.; Bishop, D.; Gallardo, P.; Chase, J.G. Demand Side Management in Industrial, Commercial, and Residential Sectors: A Review of Constraints and Considerations. Energies 2023, 16, 5155. [Google Scholar] [CrossRef]
- Timplalexis, C.; Angelis, G.-F.; Zikos, S.; Krinidis, S.; Ioannidis, D.; Tzovaras, D. A comprehensive review on industrial demand response strategies and applications. In Industrial Demand Response: Methods, Best Practices, Case Studies, and Applications; The Institution of Engineering and Technology: Hong Kong, China, 2022; p. 1. [Google Scholar]
- Siddiquee, S.M.S.; Howard, B.; Bruton, K.; Brem, A.; O’Sullivan, D.T.J. Progress in Demand Response and It’s Industrial Applications (in English). Front. Energy Res. 2021, 9, 673176. [Google Scholar] [CrossRef]
- Shafie-khah, M.; Siano, P.; Aghaei, J.; Masoum, M.A.; Li, F.; Catalão, J.P. Comprehensive review of the recent advances in industrial and commercial DR. IEEE Trans. Ind. Inform. 2019, 15, 3757–3771. [Google Scholar] [CrossRef]
- Arias, L.A.; Rivas, E.; Santamaria, F.; Hernandez, V. A review and analysis of trends related to demand response. Energies 2018, 11, 1617. [Google Scholar] [CrossRef]
- Shoreh, M.H.; Siano, P.; Shafie-khah, M.; Loia, V.; Catalão, J.P. A survey of industrial applications of Demand Response. Electr. Power Syst. Res. 2016, 141, 31–49. [Google Scholar] [CrossRef]
- Lashmar, N.; Wade, B.; Molyneaux, L.; Ashworth, P. Motivations, barriers, and enablers for demand response programs: A commercial and industrial consumer perspective. Energy Res. Soc. Sci. 2022, 90, 102667. [Google Scholar] [CrossRef]
- Leippi, A.; Fleschutz, M.; Murphy, M.D. A review of ev battery utilization in demand response considering battery degradation in non-residential vehicle-to-grid scenarios. Energies 2022, 15, 3227. [Google Scholar] [CrossRef]
- Krzton, A. Welcome to the Machine: Ir/Responsible Use of Machine Learning in Research Recommendation Tools. ACRL 2023. 2023. Available online: http://aurora.auburn.edu/handle/11200/50507 (accessed on 18 November 2023).
- Heffron, R.; Körner, M.-F.; Wagner, J.; Weibelzahl, M.; Fridgen, G. Industrial demand-side flexibility: A key element of a just energy transition and industrial development. Appl. Energy 2020, 269, 115026. [Google Scholar] [CrossRef]
- Silva, B.N.; Khan, M.; Han, K. Futuristic sustainable energy management in smart environments: A review of peak load shaving and demand response strategies, challenges, and opportunities. Sustainability 2020, 12, 5561. [Google Scholar] [CrossRef]
- Babatunde, O.M.; Munda, J.L.; Hamam, Y. Power system flexibility: A review. Energy Rep. 2020, 6, 101–106. [Google Scholar] [CrossRef]
- Nolan, S.; O’Malley, M. Challenges and barriers to demand response deployment and evaluation. Appl. Energy 2015, 152, 1–10. [Google Scholar] [CrossRef]
- Samad, T.; Koch, E.; Stluka, P. Automated demand response for smart buildings and microgrids: The state of the practice and research challenges. Proc. IEEE 2016, 104, 726–744. [Google Scholar] [CrossRef]
- Finck, C.; Li, R.; Kramer, R.; Zeiler, W. Quantifying demand flexibility of power-to-heat and thermal energy storage in the control of building heating systems. Appl. Energy 2018, 209, 409–425. [Google Scholar] [CrossRef]
- Jordehi, A.R. Optimisation of demand response in electric power systems, a review. Renew. Sustain. Energy Rev. 2019, 103, 308–319. [Google Scholar] [CrossRef]
- Paterakis, N.G.; Erdinç, O.; Catalão, J.P. An overview of Demand Response: Key-elements and international experience. Renew. Sustain. Energy Rev. 2017, 69, 871–891. [Google Scholar] [CrossRef]
- Zohrabian, A.; Plata, S.L.; Kim, D.M.; Childress, A.E.; Sanders, K.T. Leveraging the water-energy nexus to derive benefits for the electric grid through demand-side management in the water supply and wastewater sectors. Wiley Interdiscip. Rev. Water 2021, 8, e1510. [Google Scholar] [CrossRef]
- Vardakas, J.S.; Zorba, N.; Verikoukis, C.V. A survey on demand response programs in smart grids: Pricing methods and optimization algorithms. IEEE Commun. Surv. Tutor. 2014, 17, 152–178. [Google Scholar] [CrossRef]
- D’Ettorre, F.; Banaei, M.; Ebrahimy, R.; Pourmousavi, S.A.; Blomgren, E.; Kowalski, J.; Bohdanowicz, Z.; Łopaciuk-Gonczaryk, B.; Biele, C.; Madsen, H. Exploiting demand-side flexibility: State-of-the-art, open issues and social perspective. Renew. Sustain. Energy Rev. 2022, 165, 112605. [Google Scholar] [CrossRef]
- Kholerdi, S.S.; Ghasemi-Marzbali, A. Interactive Time-of-use demand response for industrial electricity customers: A case study. Util. Policy 2021, 70, 101192. [Google Scholar] [CrossRef]
- Yang, H.; Zhang, X.; Ma, Y.; Zhang, D. Critical peak rebate strategy and application to demand response. Prot. Control. Mod. Power Syst. 2021, 6, 28. [Google Scholar] [CrossRef]
- Dewangan, C.L.; Singh, S.; Chakrabarti, S.; Singh, K. Peak-to-average ratio incentive scheme to tackle the peak-rebound challenge in TOU pricing. Electr. Power Syst. Res. 2022, 210, 108048. [Google Scholar] [CrossRef]
- Ponnaganti, P.; Pillai, J.R.; Bak-Jensen, B. Opportunities and challenges of demand response in active distribution networks. Wiley Interdiscip. Rev. Energy Environ. 2018, 7, e271. [Google Scholar] [CrossRef]
- Wang, Y.; Li, L. Critical peak electricity pricing for sustainable manufacturing: Modeling and case studies. Appl. Energy 2016, 175, 40–53. [Google Scholar] [CrossRef]
- Shahryari, E.; Shayeghi, H.; Mohammadi-Ivatloo, B.; Moradzadeh, M. An improved incentive-based demand response program in day-ahead and intra-day electricity markets. Energy 2018, 155, 205–214. [Google Scholar] [CrossRef]
- Eissa, M. Developing incentive demand response with commercial energy management system (CEMS) based on diffusion model, smart meters and new communication protocol. Appl. Energy 2019, 236, 273–292. [Google Scholar] [CrossRef]
- Amin, B.R.; Shah, R.; Hasan, K.N.; Tayab, U.B.; Islam, S. An Overview of Demand Response Opportunities for Commercial and Industrial Customers in the Australian NEM. In Proceedings of the 2022 IEEE PES 14th Asia-Pacific Power and Energy Engineering Conference (APPEEC), Melbourne, Australia, 20–23 November 2022; pp. 1–6. [Google Scholar]
- Siano, P. Demand response and smart grids—A survey. Renew. Sustain. Energy Rev. 2014, 30, 461–478. [Google Scholar] [CrossRef]
- Naware, D.; Badigenchala, R.; Mitra, A.; Das, D. Impact of demand response on battery energy storage degradation using gbest-guided artificial bee colony algorithm with forecasted solar insolation. J. Energy Storage 2022, 52, 104915. [Google Scholar] [CrossRef]
- Zinaman, O.R.; Bowen, T.; Aznar, A.Y. An Overview of Behind-the-Meter Solar-Plus-Storage Regulatory Design: Approaches and Case Studies to Inform International Applications; National Renewable Energy Laboratory: Golden, CO, USA, 2020.
- Islam, M.M.; Sun, Z.; Qin, R.; Hu, W.; Xiong, H.; Xu, K. Flexible energy load identification in intelligent manufacturing for demand response using a neural network integrated particle swarm optimization. Proc. Inst. Mech. Eng. Part C J. Mech. Eng. Sci. 2022, 236, 1943–1959. [Google Scholar] [CrossRef]
- Meschede, H. Increased utilisation of renewable energies through demand response in the water supply sector—A case study. Energy 2019, 175, 810–817. [Google Scholar] [CrossRef]
- Xu, X.; Sun, W.; Abeysekera, M.; Qadrdan, M. Quantifying the flexibility from industrial steam systems for supporting the power grid. IEEE Trans. Power Syst. 2020, 36, 313–322. [Google Scholar] [CrossRef]
- Rao, Y.; Cui, X.; Zou, X.; Ying, L.; Tong, P.; Li, J. Research on Distributed Energy Storage Planning-Scheduling Strategy of Regional Power Grid Considering Demand Response. Sustainability 2023, 15, 14540. [Google Scholar] [CrossRef]
- Guney, M.S.; Tepe, Y. Classification and assessment of energy storage systems. Renew. Sustain. Energy Rev. 2017, 75, 1187–1197. [Google Scholar] [CrossRef]
- Zhang, Z.; Ding, T.; Zhou, Q.; Sun, Y.; Qu, M.; Zeng, Z.; Ju, Y.; Li, L.; Wang, K.; Chi, F. A review of technologies and applications on versatile energy storage systems. Renew. Sustain. Energy Rev. 2021, 148, 111263. [Google Scholar] [CrossRef]
- Elio, J.; Phelan, P.; Villalobos, R.; Milcarek, R.J. A review of energy storage technologies for demand-side management in industrial facilities. J. Clean. Prod. 2021, 307, 127322. [Google Scholar] [CrossRef]
- Rezaeimozafar, M.; Monaghan, R.F.; Barrett, E.; Duffy, M. A review of behind-the-meter energy storage systems in smart grids. Renew. Sustain. Energy Rev. 2022, 164, 112573. [Google Scholar] [CrossRef]
- Mitali, J.; Dhinakaran, S.; Mohamad, A. Energy storage systems: A review. Energy Storage Sav. 2022, 1, 166–216. [Google Scholar] [CrossRef]
- Castro-Gutiérrez, J.; Celzard, A.; Fierro, V. Energy storage in supercapacitors: Focus on tannin-derived carbon electrodes. Front. Mater. 2020, 7, 217. [Google Scholar] [CrossRef]
- Cavanagh, K.; Ward, J.; Behrens, S.; Bhatt, A.; Ratnam, E.; Oliver, E.; Hayward, J. Electrical Energy Storage: Technology Overview and Applications; CSIRO: Canberra, Australia, 2015.
- Zheng, W.; Ma, K.; Wang, X. Hybrid energy storage with supercapacitor for cost-efficient data center power shaving and capping. IEEE Trans. Parallel Distrib. Syst. 2016, 28, 1105–1118. [Google Scholar] [CrossRef]
- Shu, X.; Kumar, R.; Saha, R.K.; Dev, N.; Stević, Ž.; Sharma, S.; Rafighi, M. Sustainability Assessment of Energy Storage Technologies Based on Commercialization Viability: MCDM Model. Sustainability 2023, 15, 4707. [Google Scholar] [CrossRef]
- Blakers, A.; Stocks, M.; Lu, B.; Cheng, C. A review of pumped hydro energy storage. Prog. Energy 2021, 3, 022003. [Google Scholar] [CrossRef]
- Numan, M.; Baig, M.F.; Yousif, M. Reliability evaluation of energy storage systems combined with other grid flexibility options: A review. J. Energy Storage 2023, 63, 107022. [Google Scholar]
- Olabi, A.G.; Wilberforce, T.; Abdelkareem, M.A.; Ramadan, M. Critical review of flywheel energy storage system. Energies 2021, 14, 2159. [Google Scholar] [CrossRef]
- Fambri, G.; Badami, M.; Tsagkrasoulis, D.; Katsiki, V.; Giannakis, G.; Papanikolaou, A. Demand Flexibility Enabled by Virtual Energy Storage to Improve Renewable Energy Penetration. Energies 2020, 13, 5128. [Google Scholar] [CrossRef]
- Koohi-Fayegh, S.; Rosen, M.A. A review of energy storage types, applications and recent developments. J. Energy Storage 2020, 27, 101047. [Google Scholar] [CrossRef]
- Pal, S.; Kumar, R. Electric vehicle scheduling strategy in residential demand response programs with neighbor connection. IEEE Trans. Ind. Inform. 2017, 14, 980–988. [Google Scholar] [CrossRef]
- Zhang, W.; Maleki, A.; Rosen, M.A.; Liu, J. Optimization with a simulated annealing algorithm of a hybrid system for renewable energy including battery and hydrogen storage. Energy 2018, 163, 191–207. [Google Scholar] [CrossRef]
- Zhang, Y.; Hua, Q.; Sun, L.; Liu, Q. Life cycle optimization of renewable energy systems configuration with hybrid battery/hydrogen storage: A comparative study. J. Energy Storage 2020, 30, 101470. [Google Scholar] [CrossRef]
- Douglas, T. Dynamic modelling and simulation of a solar-PV hybrid battery and hydrogen energy storage system. J. Energy Storage 2016, 7, 104–114. [Google Scholar] [CrossRef]
- Hassan, I.; Ramadan, H.S.; Saleh, M.A.; Hissel, D. Hydrogen storage technologies for stationary and mobile applications: Review, analysis and perspectives. Renew. Sustain. Energy Rev. 2021, 149, 111311. [Google Scholar] [CrossRef]
- Atawi, I.E.; Al-Shetwi, A.Q.; Magableh, A.M.; Albalawi, O.H. Recent advances in hybrid energy storage system integrated renewable power generation: Configuration, control, applications, and future directions. Batteries 2022, 9, 29. [Google Scholar] [CrossRef]
- Hannan, M.; Wali, S.; Ker, P.; Abd Rahman, M.; Mansor, M.; Ramachandaramurthy, V.; Muttaqi, K.; Mahlia, T.; Dong, Z. Battery energy-storage system: A review of technologies, optimization objectives, constraints, approaches, and outstanding issues. J. Energy Storage 2021, 42, 103023. [Google Scholar] [CrossRef]
- Kiehbadroudinezhad, M.; Merabet, A.; Hosseinzadeh-Bandbafha, H. Review of latest advances and prospects of energy storage systems: Considering economic, reliability, sizing, and environmental impacts approach. Clean Technol. 2022, 4, 477–501. [Google Scholar] [CrossRef]
- Yin, J.; Lin, H.; Shi, J.; Lin, Z.; Bao, J.; Wang, Y.; Lin, X.; Qin, Y.; Qiu, X.; Zhang, W. Lead-carbon batteries toward future energy storage: From mechanism and materials to applications. Electrochem. Energy Rev. 2022, 5, 2. [Google Scholar] [CrossRef]
- O’Connell, S.; Reynders, G.; Keane, M.M. Impact of source variability on flexibility for demand response. Energy 2021, 237, 121612. [Google Scholar] [CrossRef]
- Zhao, C.; Andersen, P.B.; Træholt, C.; Hashemi, S. Grid-connected battery energy storage system: A review on application and integration. Renew. Sustain. Energy Rev. 2023, 182, 113400. [Google Scholar] [CrossRef]
- Carpinelli, G.; Mottola, F.; Proto, D. Planning of Battery Energy Storage Systems Accounting for Uncertainties and Degradation. In Proceedings of the 2019 IEEE 5th International forum on Research and Technology for Society and Industry (RTSI), Florence, Italy, 9–12 September 2019; pp. 213–218. [Google Scholar]
- Lucaferri, V.; Valentini, M.; De Lia, F.; Laudani, A.; Presti, R.L.; Schioppo, R.; Fulginei, F.R. Modeling and optimization method for Battery Energy Storage Systems operating at variable C-rate: A comparative study of Lithium technologies. J. Energy Storage 2023, 73, 109232. [Google Scholar] [CrossRef]
- Yang, Y.; Bremner, S.; Menictas, C.; Kay, M. Modelling and optimal energy management for battery energy storage systems in renewable energy systems: A review. Renew. Sustain. Energy Rev. 2022, 167, 112671. [Google Scholar] [CrossRef]
- Maheshwari, A.; Paterakis, N.G.; Santarelli, M.; Gibescu, M. Optimizing the operation of energy storage using a non-linear lithium-ion battery degradation model. Appl. Energy 2020, 261, 114360. [Google Scholar] [CrossRef]
- Duarte, J.L.R.; Fan, N.; Jin, T. Multi-process production scheduling with variable renewable integration and demand response. Eur. J. Oper. Res. 2020, 281, 186–200. [Google Scholar] [CrossRef]
- Lu, X.; Zhang, P.; Li, K.; Wang, F.; Li, Z.; Zhen, Z.; Wang, T. Data center aggregators’ optimal bidding and benefit allocation strategy considering the spatiotemporal transfer characteristics. IEEE Trans. Ind. Appl. 2021, 57, 4486–4499. [Google Scholar] [CrossRef]
- CSIRO. Renewable Energy Storage Roadmap. 2023. Available online: https://www.csiro.au/en/work-with-us/services/consultancy-strategic-advice-services/csiro-futures/energy-and-resources/renewable-energy-storage-roadmap (accessed on 25 December 2023).
- Baxter, R. Energy Storage Financing: Project and Portfolio Valuation; Sandia National Lab. (SNL-NM): Albuquerque, NM, USA, 2021.
- ARENA. Technology Readiness Levels for Renewable Energy Sectors; Australian Renewable Energy Agency: Canberra, Australia, 2014. Available online: https://arena.gov.au/assets/2014/02/Technology-Readiness-Levels.pdf (accessed on 26 December 2023).
- Golmohamadi, H. Demand-side management in industrial sector: A review of heavy industries. Renew. Sustain. Energy Rev. 2022, 156, 111963. [Google Scholar] [CrossRef]
- Parrish, B.; Heptonstall, P.; Gross, R.; Sovacool, B.K. A systematic review of motivations, enablers and barriers for consumer engagement with residential demand response. Energy Policy 2020, 138, 111221. [Google Scholar] [CrossRef]
- Zhao, H.; Yan, X.; Ren, H. Quantifying flexibility of residential electric vehicle charging loads using non-intrusive load extracting algorithm in demand response. Sustain. Cities Soc. 2019, 50, 101664. [Google Scholar] [CrossRef]
- Hu, J.; Cao, J. Demand Response Optimal Dispatch and Control of TCL and PEV Agents with Renewable Energies. Fractal Fract. 2021, 5, 140. [Google Scholar] [CrossRef]
- Carmichael, R.; Gross, R.; Hanna, R.; Rhodes, A.; Green, T. The Demand Response Technology Cluster: Accelerating UK residential consumer engagement with time-of-use tariffs, electric vehicles and smart meters via digital comparison tools. Renew. Sustain. Energy Rev. 2021, 139, 110701. [Google Scholar] [CrossRef]
- Rassaei, F.; Soh, W.-S.; Chua, K.-C. Demand response for residential electric vehicles with random usage patterns in smart grids. IEEE Trans. Sustain. Energy 2015, 6, 1367–1376. [Google Scholar] [CrossRef]
- Kiliccote, S.; Olsen, D.; Sohn, M.D.; Piette, M.A. Characterization of demand response in the commercial, industrial, and residential sectors in the United States. In Advances in Energy Systems: The Large-Scale Renewable Energy Integration Challenge; Wiley: Hoboken, NJ, USA, 2019; pp. 425–443. [Google Scholar]
- Tiwari, A.; Pindoriya, N.M. Automated demand response for residential prosumer with electric vehicle and battery energy storage system. In Proceedings of the 2021 9th IEEE International Conference on Power Systems (ICPS), Kharagpur, India, 16–18 December 2021; pp. 1–6. [Google Scholar]
- Sridhar, A.; Honkapuro, S.; Ruiz, F.; Stoklasa, J.; Annala, S.; Wolff, A.; Rautiainen, A. Toward residential flexibility—Consumer willingness to enroll household loads in demand response. Appl. Energy 2023, 342, 121204. [Google Scholar] [CrossRef]
- Rajabi, A.; Li, L.; Zhang, J.; Zhu, J. Aggregation of small loads for demand response programs—Implementation and challenges: A review. In Proceedings of the 2017 IEEE International Conference on Environment and Electrical Engineering and 2017 IEEE Industrial and Commercial Power Systems Europe (EEEIC/I&CPS Europe), Milan, Italy, 6–9 June 2017; pp. 1–6. [Google Scholar]
- Cui, H.; Zhou, K. Industrial power load scheduling considering demand response. J. Clean. Prod. 2018, 204, 447–460. [Google Scholar] [CrossRef]
- Chen, Y.; Xu, P.; Gu, J.; Schmidt, F.; Li, W. Measures to improve energy demand flexibility in buildings for demand response (DR): A review. Energy Build. 2018, 177, 125–139. [Google Scholar] [CrossRef]
- de Chalendar, J.A.; McMahon, C.; Valenzuela, L.F.; Glynn, P.W.; Benson, S.M. Unlocking demand response in commercial buildings: Empirical response of commercial buildings to daily cooling set point adjustments. Energy Build. 2023, 278, 112599. [Google Scholar] [CrossRef]
- Ding, Y.M.; Hong, S.H.; Li, X.H. A demand response energy management scheme for industrial facilities in smart grid. IEEE Trans. Ind. Inform. 2014, 10, 2257–2269. [Google Scholar] [CrossRef]
- Chau, T.K.; Yu, S.S.; Fernando, T.; Iu, H.H.-C. Demand-side regulation provision from industrial loads integrated with solar PV panels and energy storage system for ancillary services. IEEE Trans. Ind. Inform. 2017, 14, 5038–5049. [Google Scholar] [CrossRef]
- Leithon, J.; Sun, S.; Lim, T.J. Demand response and renewable energy management using continuous-time optimization. IEEE Trans. Sustain. Energy 2017, 9, 991–1000. [Google Scholar] [CrossRef]
- Yin, R.; Kara, E.C.; Li, Y.; DeForest, N.; Wang, K.; Yong, T.; Stadler, M. Quantifying flexibility of commercial and residential loads for demand response using setpoint changes. Appl. Energy 2016, 177, 149–164. [Google Scholar] [CrossRef]
- Hao, H.; Wu, D.; Lian, J.; Yang, T. Optimal coordination of building loads and energy storage for power grid and end user services. IEEE Trans. Smart Grid 2017, 9, 4335–4345. [Google Scholar] [CrossRef]
- Zhou, C.; Wang, P.; Bao, T.; Yao, S.; Tang, Y.; Yang, P. Flexible load optimal regulation strategy of commercial buildings under the environment of electricity market. Energy Rep. 2023, 9, 1705–1716. [Google Scholar] [CrossRef]
- Hao, H.; Lin, Y.; Kowli, A.S.; Barooah, P.; Meyn, S. Ancillary service to the grid through control of fans in commercial building HVAC systems. IEEE Trans. Smart Grid 2014, 5, 2066–2074. [Google Scholar] [CrossRef]
- Beil, I.; Hiskens, I.; Backhaus, S. Frequency regulation from commercial building HVAC demand response. Proc. IEEE 2016, 104, 745–757. [Google Scholar] [CrossRef]
- Aghniaey, S.; Lawrence, T.M. The impact of increased cooling setpoint temperature during demand response events on occupant thermal comfort in commercial buildings: A review. Energy Build. 2018, 173, 19–27. [Google Scholar] [CrossRef]
- Arteconi, A.; Ciarrocchi, E.; Pan, Q.; Carducci, F.; Comodi, G.; Polonara, F.; Wang, R. Thermal energy storage coupled with PV panels for demand side management of industrial building cooling loads. Appl. Energy 2017, 185, 1984–1993. [Google Scholar] [CrossRef]
- De Rosa, M.; Carragher, M.; Finn, D.P. Flexibility assessment of a combined heat-power system (CHP) with energy storage under real-time energy price market framework. Therm. Sci. Eng. Prog. 2018, 8, 426–438. [Google Scholar] [CrossRef]
- Zhang, X.; Hug, G.; Kolter, J.Z.; Harjunkoski, I. Demand response of ancillary service from industrial loads coordinated with energy storage. IEEE Trans. Power Syst. 2017, 33, 951–961. [Google Scholar] [CrossRef]
- Bao, Y.; Xu, J.; Feng, W.; Sun, Y.; Liao, S.; Yin, R.; Jiang, Y.; Jin, M.; Marnay, C. Provision of secondary frequency regulation by coordinated dispatch of industrial loads and thermal power plants. Appl. Energy 2019, 241, 302–312. [Google Scholar] [CrossRef]
- Zhang, Q.; Grossmann, I.E. Enterprise-wide optimization for industrial demand side management: Fundamentals, advances, and perspectives. Chem. Eng. Res. Des. 2016, 116, 114–131. [Google Scholar] [CrossRef]
- Leinauer, C.; Schott, P.; Fridgen, G.; Keller, R.; Ollig, P.; Weibelzahl, M. Obstacles to demand response: Why industrial companies do not adapt their power consumption to volatile power generation. Energy Policy 2022, 165, 112876. [Google Scholar] [CrossRef]
- Weitzel, T.; Glock, C.H. Scheduling a storage-augmented discrete production facility under incentive-based demand response. Int. J. Prod. Res. 2019, 57, 250–270. [Google Scholar] [CrossRef]
- Lashmar, N.; Wade, B.; Molyneaux, L.; Ashworth, P. Activating electricity system demand response for commercial and industrial organisations. Australas. J. Environ. Manag. 2023, 1–21. [Google Scholar] [CrossRef]
- Luo, Z.; Hong, S.-H.; Kim, J.-B. A price-based demand response scheme for discrete manufacturing in smart grids. Energies 2016, 9, 650. [Google Scholar] [CrossRef]
- Zhang, X.; Hug, G.; Kolter, J.Z.; Harjunkoski, I. Model predictive control of industrial loads and energy storage for demand response. In Proceedings of the 2016 IEEE Power and Energy Society General Meeting (PESGM), Boston, MA, USA, 17–21 July 2016; pp. 1–5. [Google Scholar]
- Kwon, S.; Ntaimo, L.; Gautam, N. Optimal day-ahead power procurement with renewable energy and demand response. IEEE Trans. Power Syst. 2016, 32, 3924–3933. [Google Scholar] [CrossRef]
- Lin, J.; Peng, K.; Huang, X.; Men, J.; Hu, Y.; Qiu, F.; Lu, Y. Benefit Evaluation for Industrial Users Utilizing User-Side Energy Storages Participating Auxiliary Services. In Proceedings of the 2021 IEEE 4th International Electrical and Energy Conference (CIEEC), Wuhan, China, 28–30 May 2021; pp. 1–6. [Google Scholar]
- Ning, L.; Liu, Y.; Chen, Y.; Zhao, Y.; Li, G.; Wang, Y. Research on the Optimal Scheduling Method of Virtual Power Plant with Industrial Loads Participating the Peak Regulation Ancillary Service. In Proceedings of the 2023 5th Asia Energy and Electrical Engineering Symposium (AEEES), Chengdu, China, 23–26 March 2023; pp. 1080–1087. [Google Scholar]
- Liu, R.; Liu, Y.; Jing, Z. Impact of industrial virtual power plant on renewable energy integration. Glob. Energy Interconnect. 2020, 3, 545–552. [Google Scholar] [CrossRef]
- Saxena, V.; Kumar, N.; Nangia, U. Protagonist of renewable energy in distributed generation: A review. Rev. Tecnol. Marcha 2021, 34, 3–15. [Google Scholar] [CrossRef]
- Nan, B.; Dong, S.; Tang, K. Optimal Configuration of Energy Storage Capacity considering Generalized Energy Storage Resource Dispatching. In Proceedings of the the 2021 IEEE Sustainable Power and Energy Conference (iSPEC), Nanjing, China, 25–27 November 2021; pp. 1153–1159. [Google Scholar]
- Wei, J.; Zhang, Y.; Wang, J.; Wu, L.; Zhao, P.; Jiang, Z. Decentralized demand management based on alternating direction method of multipliers algorithm for industrial park with CHP units and thermal storage. J. Mod. Power Syst. Clean Energy 2022, 10, 120–130. [Google Scholar] [CrossRef]
- Zhu, X.; Zhang, X.; Gong, P.; Li, Y. A review of distributed energy system optimization for building decarbonization. J. Build. Eng. 2023, 73, 106735. [Google Scholar] [CrossRef]
- Pourghaderi, N.; Fotuhi-Firuzabad, M.; Moeini-Aghtaie, M.; Kabirifar, M. Commercial demand response programs in bidding of a technical virtual power plant. IEEE Trans. Ind. Inform. 2018, 14, 5100–5111. [Google Scholar] [CrossRef]
- Wang, J.; Shi, Y.; Zhou, Y. Intelligent demand response for industrial energy management considering thermostatically controlled loads and EVs. IEEE Trans. Ind. Inform. 2018, 15, 3432–3442. [Google Scholar] [CrossRef]
- Baherifard, M.A.; Kazemzadeh, R.; Yazdankhah, A.S.; Marzband, M. Intelligent charging planning for electric vehicle commercial parking lots and its impact on distribution network’s imbalance indices. Sustain. Energy Grids Netw. 2022, 30, 100620. [Google Scholar] [CrossRef]
- Zhao, L.; Zhou, Y.; Quilumba, F.L.; Lee, W.-J. Potential of the commercial sector to participate in the demand side management program. IEEE Trans. Ind. Appl. 2019, 55, 7261–7269. [Google Scholar] [CrossRef]
- Kinoshita, S.; Yamaguchi, N.; Sato, F.; Ohtani, S. Impact of Demand Response Price Signal on Battery State of Charge Management at Office Buildings. In Proceedings of the 2021 International Conference on Smart Energy Systems and Technologies (SEST), Virtual, 6–8 September 2021; pp. 1–6. [Google Scholar]
- Musabandesu, E.; Loge, F. Load shifting at wastewater treatment plants: A case study for participating as an energy demand resource. J. Clean. Prod. 2021, 282, 124454. [Google Scholar] [CrossRef]
- Elio, J.; Milcarek, R.J. A comparison of optimal peak clipping and load shifting energy storage dispatch control strategies for event-based demand response. Energy Convers. Manag. X 2023, 19, 100392. [Google Scholar] [CrossRef]
- Song, Y.; Cheng, X.; Zhang, Y. Energy management optimization strategy for industrial enterprises based on demand response. In Proceedings of the 2019 Chinese Automation Congress (CAC), Hangzhou, China, 22–24 November 2019; pp. 1267–1272. [Google Scholar]
- Nakayama, K.; Sharma, R. Demand charge and response with energy storage. In Proceedings of the 2018 IEEE International Conference on Communications, Control, and Computing Technologies for Smart Grids (SmartGridComm), København, Denmark, 29 October–1 November 2018; pp. 1–6. [Google Scholar]
- Son, J.; Hara, R.; Kita, H.; Tanaka, E. Operation scheduling considering demand response in a commercial building with chiller system and energy storage system. In Proceedings of the 2015 IEEE PES Asia-Pacific Power and Energy Engineering Conference (APPEEC), Brisbane, QLD, Australia, 15–18 November 2015; pp. 1–5. [Google Scholar]
- Kozadajevs, J.; Boreiko, D.; Varfolomejeva, R.; Zalitis, I. Detailed Modelling of a Battery Energy Storage System in an Energy-Intensive Enterprise. In Proceedings of the 2018 IEEE International Conference on Environment and Electrical Engineering and 2018 IEEE Industrial and Commercial Power Systems Europe (EEEIC/I&CPS Europe), Palermo, Italy, 12–15 June 2018; pp. 1–5. [Google Scholar]
- Sharma, M.; Kakran, S. An Energy Scheduling Algorithm for Commercial Loads Integrated with Wind Energy and Energy Storage System. In Proceedings of the 2021 IEEE 8th Uttar Pradesh Section International Conference on Electrical, Electronics and Computer Engineering (UPCON), Dehradun, India, 11–13 November 2021; pp. 1–5. [Google Scholar]
- Peng, P.; Li, Y.; Li, D.; Guan, Y.; Yang, P.; Hu, Z.; Zhao, Z.; Liu, D.; Wang, M. Commercial Optimized Operation Strategy of Distributed Energy Storage. In Proceedings of the 2020 8th International Conference on Power Electronics Systems and Applications (PESA), Hong Kong, China, 7–10 December 2020; pp. 1–5. [Google Scholar]
- Gholian, A.; Mohsenian-Rad, H.; Hua, Y. Optimal industrial load control in smart grid. IEEE Trans. Smart Grid 2015, 7, 2305–2316. [Google Scholar] [CrossRef]
- Fazli Khalaf, A.; Wang, Y. Energy-cost-aware flow shop scheduling considering intermittent renewables, energy storage, and real-time electricity pricing. Int. J. Energy Res. 2018, 42, 3928–3942. [Google Scholar] [CrossRef]
- Vedullapalli, D.T.; Hadidi, R.; Schroeder, B. Combined HVAC and battery scheduling for demand response in a building. IEEE Trans. Ind. Appl. 2019, 55, 7008–7014. [Google Scholar] [CrossRef]
- Yang, G.; Liu, S.; Mu, J.; Wang, Y. Economic Analysis of the Application of Ice Storage Air Conditioning System in Chongqing. In Proceedings of the 2022 5th International Conference on Energy, Electrical and Power Engineering (CEEPE), Chongqing, China, 22–24 April 2022; pp. 874–881. [Google Scholar]
- Diekerhof, M.; Hecker, S.; Monti, A. Modeling and optimization of industrial compressed-air energy systems for demand response. In Proceedings of the 2016 IEEE International Energy Conference (ENERGYCON), Leuven, Belgium, 4–8 April 2016; pp. 1–6. [Google Scholar]
- Wang, X.; El-Farra, N.H.; Palazoglu, A. Optimal scheduling of demand responsive industrial production with hybrid renewable energy systems. Renew. Energy 2017, 100, 53–64. [Google Scholar] [CrossRef]
- Alarfaj, O.; Bhattacharya, K. Material flow based power demand modeling of an oil refinery process for optimal energy management. IEEE Trans. Power Syst. 2018, 34, 2312–2321. [Google Scholar] [CrossRef]
- Amin, B.M.R.; Shah, R.; Amjady, N.; Hasan, K.; Tayab, U.B.; Islam, S. Demand Response on the Operation of Regional Distribution Network: An Australian Case Study. In Proceedings of the 2023 IEEE Power & Energy Society General Meeting (PESGM), Orlando, FL, USA, 16–20 July 2023; pp. 1–5. [Google Scholar]
- Energy Efficiency Opportunities in Wastewater Treatment Facilities. 2019. Available online: https://www.environment.nsw.gov.au/research-and-publications/publications-search/energy-efficiency-opportunities-in-wastewater-treatment-facilities (accessed on 19 October 2023).
- Kirchem, D.; Lynch, M.Á.; Bertsch, V.; Casey, E. Modelling demand response with process models and energy systems models: Potential applications for wastewater treatment within the energy-water nexus. Appl. Energy 2020, 260, 114321. [Google Scholar] [CrossRef]
- Ali, S.M.H.; Lenzen, M.; Sack, F.; Yousefzadeh, M. Electricity generation and demand flexibility in wastewater treatment plants: Benefits for 100% renewable electricity grids. Appl. Energy 2020, 268, 114960. [Google Scholar] [CrossRef]
- Aghajanzadeh, A.; Wray, C.; McKane, A. Opportunities for Automated Demand Response in California Wastewater Treatment Facilities. 2015. Available online: https://escholarship.org/uc/item/5hw7r2gw (accessed on 10 November 2023).
- Kirchem, D.; Lynch, M.; Bertsch, V.; Casey, E. Market effects of industrial demand response and flexibility potential from wastewater treatment facilities. In Proceedings of the 2018 15th International Conference on the European Energy Market (EEM), Lodz, Poland, 27–29 June 2018; pp. 1–6. [Google Scholar]
- Chen, Y.; Zhang, H.; Yin, Y.; Zeng, F.; Cui, Z. Smart energy savings for aeration control in wastewater treatment. Energy Rep. 2022, 8, 1711–1721. [Google Scholar] [CrossRef]
- Schäfer, M. Short-term flexibility for energy grids provided by wastewater treatment plants with anaerobic sludge digestion. Water Sci. Technol. 2020, 81, 1388–1397. [Google Scholar] [CrossRef] [PubMed]
- Skouteris, G.; Parra Ramirez, M.A.; Reinecke, S.F.; Hampel, U. Energy Flexibility Chances for the Wastewater Treatment Plant of the Benchmark Simulation Model 1. Processes 2021, 9, 1854. [Google Scholar] [CrossRef]
- Karches, T. Fine-Tuning the Aeration Control for Energy-Efficient Operation in a Small Sewage Treatment Plant by Applying Biokinetic Modeling. Energies 2022, 15, 6113. [Google Scholar] [CrossRef]
- Sparn, B.; Hunsberger, R. Opportunities and Challenges for Water and Wastewater Industries to Provide Exchangeable Services. 2015. Available online: https://www.osti.gov/biblio/1227107 (accessed on 23 November 2023).
- Rioja-Cabanillas, A.; Valdesueiro, D.; Fernández-Ibáñez, P.; Byrne, J.A. Hydrogen from wastewater by photocatalytic and photoelectrochemical treatment. J. Phys. Energy 2020, 3, 012006. [Google Scholar] [CrossRef]
- Kumar, R.; Kumar, A.; Pal, A. Overview of hydrogen production from biogas reforming: Technological advancement. Int. J. Hydrogen Energy 2022, 47, 34831–34855. [Google Scholar] [CrossRef]
- Barghash, H.; Al Farsi, A.; Okedu, K.E.; Al-Wahaibi, B.M. Cost benefit analysis for green hydrogen production from treated effluent: The case study of Oman. Front. Bioeng. Biotechnol. 2022, 10, 1046556. [Google Scholar] [CrossRef]
- Kumar, S.S.; Himabindu, V. Hydrogen production by PEM water electrolysis—A review. Mater. Sci. Energy Technol. 2019, 2, 442–454. [Google Scholar]
- Nawaz, A.; ul Haq, I.; Qaisar, K.; Gunes, B.; Raja, S.I.; Mohyuddin, K.; Amin, H. Microbial fuel cells: Insight into simultaneous wastewater treatment and bioelectricity generation. Process Saf. Environ. Prot. 2022, 161, 357–373. [Google Scholar] [CrossRef]
- Jayashree, S.; Ramesh, S.; Lavanya, A.; Gandhimathi, R.; Nidheesh, P. Wastewater treatment by microbial fuel cell coupled with peroxicoagulation process. Clean Technol. Environ. Policy 2019, 21, 2033–2045. [Google Scholar] [CrossRef]
- Tsekouras, G.J.; Deligianni, P.M.; Kanellos, F.D.; Kontargyri, V.T.; Kontaxis, P.A.; Manousakis, N.M.; Elias, C.N. Microbial fuel cell for wastewater treatment as power plant in smart grids: Utopia or reality? Front. Energy Res. 2022, 10, 843768. [Google Scholar] [CrossRef]
- Reifsnyder, S.; Cecconi, F.; Rosso, D. Dynamic load shifting for the abatement of GHG emissions, power demand, energy use, and costs in metropolitan hybrid wastewater treatment systems. Water Res. 2021, 200, 117224. [Google Scholar] [CrossRef]
- Donald, R.; Love, J.G. Energy shifting in wastewater treatment using compressed oxygen from integrated hydrogen production. J. Environ. Manag. 2023, 331, 117205. [Google Scholar] [CrossRef] [PubMed]
- Douglass, P.J.; Garcia-Valle, R.; Nyeng, P.; Østergaard, J.; Togeby, M. Smart demand for frequency regulation: Experimental results. IEEE Trans. Smart Grid 2013, 4, 1713–1720. [Google Scholar] [CrossRef]
- Cottes, M.; Mainardis, M.; Goi, D.; Simeoni, P. Demand-response application in wastewater treatment plants using compressed air storage system: A modelling approach. Energies 2020, 13, 4780. [Google Scholar] [CrossRef]
- Schäfer, M.; Gretzschel, O.; Schmitt, T.G.; Knerr, H. Wastewater treatment plants as system service provider for renewable energy storage and control energy in virtual power plants–a potential analysis. Energy Procedia 2015, 73, 87–93. [Google Scholar] [CrossRef]
- Strazzabosco, A.; Kenway, S.J.; Lant, P.A. Solar PV adoption in wastewater treatment plants: A review of practice in California. J. Environ. Manag. 2019, 248, 109337. [Google Scholar] [CrossRef]
- Kretschmer, F.; Hrdy, B.; Neugebauer, G.; Stoeglehner, G. Wastewater Treatment Plants as Local Thermal Power Stations—Modifying Internal Heat Supply for Covering External Heat Demand. Processes 2021, 9, 1981. [Google Scholar] [CrossRef]
- Gu, Y.; Li, Y.; Li, X.; Luo, P.; Wang, H.; Wang, X.; Wu, J.; Li, F. Energy self-sufficient wastewater treatment plants: Feasibilities and challenges. Energy Procedia 2017, 105, 3741–3751. [Google Scholar] [CrossRef]
- Aymerich, I.; Rieger, L.; Sobhani, R.; Rosso, D.; Corominas, L. The difference between energy consumption and energy cost: Modelling energy tariff structures for water resource recovery facilities. Water Res. 2015, 81, 113–123. [Google Scholar] [CrossRef]
- Desta, A.A.; Badis, H.; George, L. Demand response scheduling in industrial asynchronous production lines constrained by available power and production rate. Appl. Energy 2018, 230, 1414–1424. [Google Scholar] [CrossRef]
- Verbeke, S.; Audenaert, A. Thermal inertia in buildings: A review of impacts across climate and building use. Renew. Sustain. Energy Rev. 2018, 82, 2300–2318. [Google Scholar] [CrossRef]
- Brok, N.B.; Munk-Nielsen, T.; Madsen, H.; Stentoft, P.A. Unlocking energy flexibility of municipal wastewater aeration using predictive control to exploit price differences in power markets. Appl. Energy 2020, 280, 115965. [Google Scholar] [CrossRef]
- Guo, Y.; Xiang, Y. Cost–benefit analysis of photovoltaic-storage investment in integrated energy systems. Energy Rep. 2022, 8, 66–71. [Google Scholar] [CrossRef]
- Assad, U.; Hassan, M.A.S.; Farooq, U.; Kabir, A.; Khan, M.Z.; Bukhari, S.S.H.; Jaffri, Z.u.A.; Olah, J.; Popp, J. Smart grid, demand response and optimization: A critical review of computational methods. Energies 2022, 15, 2003. [Google Scholar] [CrossRef]
- Halabi, L.M.; Mekhilef, S.; Olatomiwa, L.; Hazelton, J. Performance analysis of hybrid PV/diesel/battery system using HOMER: A case study Sabah, Malaysia. Energy Convers. Manag. 2017, 144, 322–339. [Google Scholar] [CrossRef]
- Üçtuğ, F.G.; Azapagic, A. Environmental impacts of small-scale hybrid energy systems: Coupling solar photovoltaics and lithium-ion batteries. Sci. Total Environ. 2018, 643, 1579–1589. [Google Scholar] [CrossRef]
- Elio, J.; Peinado-Guerrero, M.; Villalobos, R.; Milcarek, R.J. An energy storage dispatch optimization for demand-side management in industrial facilities. J. Energy Storage 2022, 53, 105063. [Google Scholar] [CrossRef]
- Tran, D.; Khambadkone, A.M. Energy management for lifetime extension of energy storage system in micro-grid applications. IEEE Trans. Smart Grid 2013, 4, 1289–1296. [Google Scholar] [CrossRef]
- A.R.E.A. (ARENA). Renewable Energy and Load Management. University of Technology, Sydney, NSW, Australia. Available online: https://arena.gov.au/assets/2018/10/REALM-Industry-Report_public_FINAL.pdf (accessed on 19 October 2023).
- Son, J.; Hara, R.; Kita, H.; Tanaka, E. Energy management considering demand response resource in commercial building with chiller system and energy storage systems. In Proceedings of the The 2nd IEEE Conference on Power Engineering and Renewable Energy (ICPERE), Bali, Indonesia, 9–11 December 2014; pp. 96–101. [Google Scholar]
- Kircher, K.J.; Zhang, K.M. Model predictive control of thermal storage for demand response. In Proceedings of the 2015 American Control Conference (ACC), Chicago, IL, USA, 1–3 July 2015; pp. 956–961. [Google Scholar]
- Angizeh, F.; Parvania, M.; Fotuhi-Firuzabad, M.; Rajabi-Ghahnavieh, A. Flexibility scheduling for large customers. IEEE Trans. Smart Grid 2017, 10, 371–379. [Google Scholar] [CrossRef]
- Huang, X.; Hong, S.H.; Li, Y. Hour-ahead price based energy management scheme for industrial facilities. IEEE Trans. Ind. Inform. 2017, 13, 2886–2898. [Google Scholar] [CrossRef]
- Oh, S.; Kong, J.; Yang, Y.; Jung, J.; Lee, C.-H. A multi-use framework of energy storage systems using reinforcement learning for both price-based and incentive-based demand response programs. Int. J. Electr. Power Energy Syst. 2023, 144, 108519. [Google Scholar] [CrossRef]


| ESS Type | Power Capacity (MW) | Power Density (W/L) | Energy Density (Wh/L) | Response Time | Discharge Time | Efficiency (%) | * Cycle | * Year |
|---|---|---|---|---|---|---|---|---|
| Li-ion | 0–100 [58] | 1500–1 × 10⁴ [57,58] | 250–750 [58] | ms [58] | min-h [58] | 90–95 [58] | 2 × 10³–1 × 10⁴ [58] | 5–15 [57,59,75] |
| 0–0.1 [59] | 200–500 [57] | ms [75] | s-h [57] | 85–90 [59,75] | 4.5 × 10³ [75] | |||
| 0.1–100 [57] | <5 ms [57] | 90–97 [57] | 1 × 10³–1 × 10⁴ [59] | |||||
| 0.1 [75] | ||||||||
| Pb-acid | 0–40 [57,58,75] | 10–100 [58] | 50–80 [58] | ms [58] | s-h [57,58] | 70–90 [58,59,76] | 500–2000 [58] | 5–15 [57,59,75] |
| 0–20 [59] | 10–400 [57] | 50–90 [57] | <5 ms [57] | 75 [75] | 5 × 10²–1 × 10³ [59] | |||
| 75–85 [57] | 2 × 10³ [75] | |||||||
| Na-S | 0–100 [58] | 120–180 [58] | 150–250 [58] | <10 s [58] | s-h [57,58] | 75–85 [58] | 2500–4500 [58] | 15–20 [57] |
| 0.15–10 [57] | 140–180 [57] | 150–300 [57] | <5 ms [57] | 75–90 [57] | ||||
| 89 [75] | ||||||||
| Ni-cd | 0–40 [57,75] | 80–600 [57] | 15–150 [57] | ms [75] | s-h [57] | 60–65 [75] | 3 × 10³ [75] | 10–20 [57,75] |
| <5 ms [57] | 60–80 [57] | |||||||
| 80 [76] | ||||||||
| PSB Flow | 0.1–15 [57] | <2 [57,58] | 20–30 [57,58] | <100 ms [58] | s-10 h [57,58] | 65–85 [58] | 2000–2500 [58] | 10–15 [57] |
| 20 ms [57] | 60–75 [57] | |||||||
| VRB Flow | 0.03–3 [58,75] | 0.5–2 [58] | 20–70 [58] | <100 ms [58] | s-10 h [57,58] | 65-85 [58] | 1 × 10⁴–1.3 × 10⁴ [58] | 15–20 [75] |
| 0.3–15 [57] | 0.03–3 [59] | 25–35 [57] | ms [75] | 75-85 [57,59,75] | >1 × 10⁴ [75] | 5–10 [59] | ||
| <2 [57] | <5 ms [57] | >1.2 × 10⁴ [59] | 5–20 [57] | |||||
| ZnBr Flow | 0.05–2 [58] | <25 [57,58] | 30–60 [58] | <100 ms [58] | s-10 h [57,58] | 70–80 [58] | 2 × 10³–1 × 10⁴ [58] | 5–20 [57] |
| 0.05–10 [57] | 30–65 [57] | <5 ms [57] | 65–80 [57] | |||||
| SC | 0–0.3 [58] | 4 × 10⁴–1.2 × 10⁵ [58] | 10–30 [57,58] | ms [58] | ms-1 h [58] | 90–95 [58,75] | 1 × 10⁵–1 × 10⁶ [58] | 10–20 [57] |
| 0.2 [75] | >1 × 10⁵ [57] | <4 ms [75] | s-min [57] | 90–98 [57] | >1 × 10⁵ [75] | 20+ [75] | ||
| 0.01–1 [57] | <5 ms [57] | |||||||
| SMES | 0.1–10 [57,58,75] | 1000–4000 [57,58] | 0.2–2.5 [58] | ms [58] | ms-8 s [58] | 93–98 [58,75] | >1 × 10⁵ [58,75] | 20–30 [57] |
| 0.2–6 [57] | 5 ms [57] | s-30 min [57] | 95–97 [57] | 20+ [75] | ||||
| FES | 0–1.5 [58] | 1000–5000 [58] | 20–80 [57,58] | s [57,58] | ms-15 min [58] | 93–95 [58,75] | 2 × 10⁴–1 × 10⁵ [58] | ~15 [75] |
| 0.25 [75] | 1000–2000 [57] | s-min [57] | 85–90 [59] | >1 × 10⁵ [75] | >20 [59] | |||
| 0–2 [59] | 90–98 [57] | 15–20 [57] | ||||||
| 0.01–20 [57] | ||||||||
| PHS | 100–5000 [57,58,75] | 0.5–1.5 [58] | 0.5–1.5 [58] | s [58] | 1–24 h+ [58] | 75–85 [58] | 2 × 10⁴–5 × 10⁴ [58] | 40–60 [75] |
| 1–1.5 [57] | 1–2 [57] | s [57] | hour-day [57] | 75–85 [75] | >1.3 × 10⁴ [75] | 30–60 [57] | ||
| 70–85 [57] | ||||||||
| CAES | 5–400 [58] | 0.2–0.6 [58] | 2–6 [58] | 9–12 min [58] | 1–24 h+ [58] | 40-70 [58] | 8 × 10³–1.2 × 10⁴ [58] | 20–40 [75] |
| 3–400 [75] | 1–2 [57] | 3–6 [57] | s-min [57] | hour-day [57] | 70 [57] | >1.3 × 10⁴ [75] | 30–40 [57] | |
| 5–300 [57] | 50–88 [75] | |||||||
| TES | 0.1–300 [57] | - | 80–500 [57] | Not for rapid [57] | hour [57] | 30–60 [57] | - | 5–20 [57] |
| HFC | 0–50 [59,75] | >500 [57] | 500–3000 [57] | <5 ms [57] | min-hour [57] | 20–50 [75] | >1 × 10³ [59,75] | 5–15 [75] |
| 0.001–50 [57] | 30–45 [59] | 5–20 [57] | ||||||
| 30–50 [57] | 3–10 [59] | |||||||
| 20–66 [76] |
| Parameters | Description |
|---|---|
| Capacity | The amount of energy possessed by a battery at its highest level. |
| State of Charge | The energy level referring the charging condition during a certain period which is required to maintain to prevent any damage. |
| Depth of discharge | The amount of charge has been used. A battery with 100% charge has a DoD of 0%. |
| Power density | The amount of power per unit volume in a system is usually measured in W/L. |
| Energy density | Measurement of energy stored in a system’s per unit volume which is usually measured in Wh/L. |
| Efficiency | The ratio of the energy charged to and discharged from the battery. |
| Cycle | Charging action of a battery and discharging it throughout a certain time with specific energy limits. It can be used to represent the battery lifetime. |
| Levels | Description |
|---|---|
| 1 | Observation of fundamental principles and reporting completed. |
| 2 | Concept of the technology and/or application established. |
| 3 | Analysis with experiments of critical function and/or validation of proof of concept. |
| 4 | Laboratory scale validation of component/subsystem. |
| 5 | Validation of system/subsystem/component application in respective environment. |
| 6 | Demonstration of system/subsystem model or prototype with respective end-to-end testing. |
| 7 | Demonstration of system prototype in operational environment. |
| 8 | System development completed; qualification of operation achieved through practical demonstration and testing. |
| 9 | Successful operation observed confirming the system application. |
| Technologies | References | |
|---|---|---|
| ESS | Battery | [11,12,79,85,86,105,107,113,118,125,127,133,134,135,136,137,138,139,140,141,142,143,144,145] |
| Thermal storage | [102,113,131,146] | |
| Compressed air energy storage | [147] | |
| Fuel cell | [148] | |
| Pumped hydro storage | [53] | |
| Onsite renewable generation | PV | [11,12,53,79,85,105,118,125,127,131,134,138,143,144,148,149] |
| Wind | [53,125,141,144,148] | |
| Onsite non-renewable generation | CHP | [113,135,149] |
| Generator | [86] | |
| Low-carbon technology | EV | [131] |
| Loads/Processes | References | Strategies | Remarks |
|---|---|---|---|
| Aeration control | [20,154,157,158] | Load shed and shift | Effluent quality concern: strict maintenance of control parameter needed |
| CHP unit | [153,154,157] | Load shed and shift | Use of waste heat for process and space heating |
| Equalisation basin | [135,154,168] | Load shift | Can be used for water storage |
| Excess storage capacity | [135,154] | Load shift | Oversize facility required |
| Return sludge pump | [157] | Load shift | Strict maintenance of control parameter needed |
| Inlet pump | [154,157] | Load shed and shift | Strict maintenance of control parameter needed |
| Battery | [135] | Load shift | No interruption of load |
| Compressed oxygenenergy storage | [169] | Load shift | Integration of water electrolysis in the activated sludge process |
Disclaimer/Publisher’s Note: The statements, opinions and data contained in all publications are solely those of the individual author(s) and contributor(s) and not of MDPI and/or the editor(s). MDPI and/or the editor(s) disclaim responsibility for any injury to people or property resulting from any ideas, methods, instructions or products referred to in the content. |
© 2024 by the authors. Licensee MDPI, Basel, Switzerland. This article is an open access article distributed under the terms and conditions of the Creative Commons Attribution (CC BY) license (https://creativecommons.org/licenses/by/4.0/).
Share and Cite
Yasmin, R.; Amin, B.M.R.; Shah, R.; Barton, A. A Survey of Commercial and Industrial Demand Response Flexibility with Energy Storage Systems and Renewable Energy. Sustainability 2024, 16, 731. https://doi.org/10.3390/su16020731
Yasmin R, Amin BMR, Shah R, Barton A. A Survey of Commercial and Industrial Demand Response Flexibility with Energy Storage Systems and Renewable Energy. Sustainability. 2024; 16(2):731. https://doi.org/10.3390/su16020731
Chicago/Turabian StyleYasmin, Roksana, B. M. Ruhul Amin, Rakibuzzaman Shah, and Andrew Barton. 2024. "A Survey of Commercial and Industrial Demand Response Flexibility with Energy Storage Systems and Renewable Energy" Sustainability 16, no. 2: 731. https://doi.org/10.3390/su16020731
APA StyleYasmin, R., Amin, B. M. R., Shah, R., & Barton, A. (2024). A Survey of Commercial and Industrial Demand Response Flexibility with Energy Storage Systems and Renewable Energy. Sustainability, 16(2), 731. https://doi.org/10.3390/su16020731