Article

The Renewable Energy Communities in Italy and the Role of Public Administrations: The Experience of the Municipality of Assisi between Challenges and Opportunities

1
Department of Engineering, University of Perugia, Via G. Duranti 93, 06132 Perugia, Italy
2
CIRIAF (Interuniversity Research Centre on Pollution and Environment “Mauro Felli”), University of Perugia, Via G. Duranti 67, 06125 Perugia, Italy
*
Authors to whom correspondence should be addressed.
Sustainability 2023, 15(15), 11869; https://doi.org/10.3390/su151511869
Submission received: 14 June 2023 / Revised: 17 July 2023 / Accepted: 30 July 2023 / Published: 2 August 2023
(This article belongs to the Special Issue Sustainable Integration of Renewable Power Generation Systems)

Abstract

:
The pressing necessity to address climate change calls for the reduction in carbon emissions in the energy sector. Renewable energy communities (RECs) provide environmental, financial, and societal advantages that facilitate the shift towards sustainable energy sources. This paper examines the development of RECs in Italy through a case study in the Municipality of Assisi, and investigates the pivotal role played by public administrations as catalysts in the formation of RECs. Despite facing unique challenges and constraints, Assisi leverages RECs and the proactive approach of the local government to overcome barriers hindering the implementation of renewable energy projects. A municipality-led REC of a total power of 2 MWp by 2030, using clusters of prosumers and consumers and including energy-intensive municipal facilities, is investigated. Through rigorous simulations and the resulting shared energy, the study conducts a comprehensive analysis encompassing technical, energy, and economic aspects. The results, including relevant energy indices, are presented and various scenarios are discussed as the energy shared varies. Finally, sensitivity analyses show that the profitability strongly depends on the cost of energy, the remuneration from the sale, and the value of the incentive earned on the shared energy: the simple payback time ranges from 8 to 14 years and NPV varies from EUR 0.8 to 4.5 M.

1. Introduction

The current state of our planet necessitates the reduction in climate-altering emissions and the mitigation of global warming’s impacts. However, this process presents us with complex challenges, not only in technological advancements, but also in economic and social aspects, further complicated by the rapid post-COVID-19 economic recovery [1,2]. Moreover, following the Russian invasion of Ukraine in February 2022, the energy market has plunged into a severe crisis. In this context, the energy transition becomes and will remain one of the defining factors for the decades to come, and renewable energy has become a key driver in the global transition towards a sustainable and low-carbon future [3,4,5]. Several strategies and policies at the international and national level have been developed during the last several years, among which is worth mentioning the 2030 Agenda for Sustainable Development with its related 17 Sustainable Development Goals [6] and its implementation policies within the European Union (EU) [7]. However, such important objectives defined at the international level in order to counteract global warming cannot be achieved without the implementation of sustainable strategies and policies at the local level [8,9,10].
In this context, renewable energy communities have emerged as a promising and innovative approach to accelerate the transition towards cleaner and more decentralized energy systems. Renewable energy communities involve local stakeholders coming together to collectively develop, own, and manage renewable energy installations. These community-driven initiatives empower individuals, businesses, and organizations (also public administrations) to actively participate in the generation and consumption of renewable energy (shared energy) within their communities. By fostering a sense of ownership and collaboration, these communities play a vital role in reshaping the energy landscape and promoting sustainable development at the local scale [11,12,13,14]. Renewable energy communities are legal entities and consist of two main types of users/members: prosumers and consumers. Prosumers actively participate in the energy production process and play an active role within the community, while consumers are passive users who solely consume the energy generated. Prosumers typically own one or more renewable energy systems, and there can be multiple prosumers within an energy community. The nature of this new energy management system is based on voluntary and open participation, which means that the type (citizens, small and medium-sized enterprises (SMEs), local authorities, etc.) and number of members in the REC can vary.
The benefits of renewable energy communities are manifold. Firstly, they enable the decentralized production of renewable energy, reducing the need for long-distance transmission and minimizing energy losses. This decentralized approach enhances energy resilience and reliability by creating a more robust and diverse energy infrastructure. Additionally, community energy projects contribute to local economic development, creating job opportunities and stimulating the growth of renewable energy businesses. They also promote social cohesion by fostering community engagement and cooperation, empowering individuals to take part in the energy transition and have a say in local energy decisions. Furthermore, renewable energy communities have the potential to democratize the energy sector by providing access to affordable, clean energy for all members. By promoting energy self-sufficiency, these communities also reduce the dependence on external energy sources, strengthening energy security and reducing vulnerability to price fluctuations [15,16,17].
The European Commission acknowledges the importance of energy communities (ECs) as a valuable instrument for advancing the energy transition. This instrument was introduced by the European Union Directive 2018/2001/EU, also known as the revised Renewable Energy Directive (RED II) [18], which is further detailed in the regulations outlined in the Internal Electricity Market Directive 2019/944/UE (IEMD) [19]. The IEMD came into effect as part of the Clean Energy for all Europeans Package [20].
The aforementioned European directive emphasizes the promotion of renewable energy usage, energy production, and sharing within ECs. It also establishes common regulations for the internal electricity market and various collective self-consumption schemes and energy communities. Before the transposition of the European directive, Italy had already introduced renewable energy communities (RECs) through the Decree-Law of 30 December 2019, No. 162 [21], in alignment with the Integrated National Energy and Climate Plan.
On 28 February 2020, the aforementioned decree was converted into Law No. 8, which outlined specific spatial, technological, and power constraints for the establishment of RECs. Article 42-bis of the law clarified the essential requirements for defining the potential boundaries of these communities: consumer withdrawal points and plant entry points must be located on low-voltage electricity grids, specifically within the same secondary transformer substation, and the participants must generate energy from renewable sources for their own consumption, using plants with a total power not exceeding 200 kW.
Recently, this regulatory framework was updated by Legislative Decree 8 November 2021, No. 199 [22], which transposed the European directive on this matter. The updated decree modified the previous parameters, easing the imposed requirements. Specifically, the connection limit shifted from the secondary to the primary transformer substation, allowing for a greater number of users to participate, and the power limit was extended from 200 kW to 1 MW.
The growth of renewable energy communities (RECs) in Italy is the result of collaborative efforts from both public and private sectors, and the crucial involvement of public administrations (PAs) in promoting and expanding RECs is undeniable. A renewable energy community, especially when facilitated and supported by public administration, can be an effective solution to overcome the limitations and difficulties in implementing renewable energy sources, especially in historic and small towns.

2. Literature Review and Aim of the Work

This section explores the evolution of renewable energy communities in Italy, examining key studies conducted on both Italian and European renewable energy communities. This section aims to provide a comprehensive analysis of the existing literature on renewable energy communities. It will examine studies, research papers, and reports that have investigated the development and implementation of renewable energy communities in Italy and Europe. By reviewing these works, we seek to identify the trends, challenges, and opportunities associated with renewable energy communities, contributing to a deeper understanding of their evolution and impact on the energy landscape. The literature review will understand various aspects of RECs, including their organizational structures, technological choices, policy frameworks, and socio-economic impacts.
In May 2023, the “Energia e clima in Italia—Rapporto trimestrale Q4/2022” authored by Gestore Servizi Energetici—GSE (Energy System Operator) [23] continued this mapping initiative, identifying a total of 67 established and operational RECs and collective self-consumption configurations, and the total installed power of renewable energy communities (RECs) amounted to 1.4 MW, with photovoltaic systems accounting for more than 70% of this capacity (31 December 2022). Among these, only 21 configurations were RECs, with a total installed capacity of 407 kW, out of which only two were located in the Umbria region. One of these two communities is the “Comunità Energetica Via dei Partigiani”. This community is located in an industrial area of Marsciano, 25 km south of Perugia. Established in January 2022, it consists of four clusters in two adjacent buildings: a medical center, a residential apartment, a dairy, and an engineering studio. The residential apartment is the only prosumer, owning shared 10 kWp photovoltaic panels on one building’s roof. The other members are consumers [24]. The community was formed due to the owner’s commitment to renewable energy and the engineering studio’s promotion. Smart meters were installed, connected to a central energy management platform, optimizing energy sharing and raising awareness. The community aimed to upgrade natural gas-dependent assets, such as the heating system, to electricity-based systems. The feasibility analysis used the RECON online service by ENEA, simulating energy distribution based on bills and hourly consumption. The investment in photovoltaic modules is expected to have a return period of 7–8 years, considering energy savings and incentives. This community is an example of a bottom-up established community.
Cirone et al. examine a real case of a planned renewable energy community in a small town in southern Italy. The heating system generators in the buildings are replaced with electric air-to-water heat pumps assisted by a PV generator and an electrical storage system. The objective is to optimize the use of the produced and shared energy within the community, assuming that electricity can also be stored in adjacent buildings. After analyzing the assessed electrical needs for each building, a parametric study was conducted, including 21 scenarios that varied the maximum installed PV power and battery capacity. The battery was found to play an increasingly important role with higher storage capacity, resulting in a 30% reduction in grid energy consumption, relative to the size of the PV systems. The economic analysis demonstrates that the payback period is acceptable, falling within the range of 6–8 years, for any maximum PV power and storage capacity. The reduction in CO2 emissions increases with the battery capacity, and all considered cases resulted in a net decrease in CO2 emissions [25].
Ceglia et al. analyzed the energy, environmental, and socio-economic performance of a photovoltaic-based energy community located in San Felice a Cancello, Italy. The community consists of three apartments in two buildings, equipped with a rooftop photovoltaic system with a maximum power of 18 kW. The heating and cooling needs for the offices are met through reversible air-to-air heat pumps and natural gas boilers. The simulation results demonstrate that the renewable energy-based community could achieve primary energy savings of 61% and an annual reduction in carbon dioxide emissions of up to 64%. Additionally, socio-economic indicators were analyzed to assess the improvement in energy poverty conditions for users. A new socio-economic indicator, 10%ISEE, was introduced to evaluate users’ socio-economic status based not only on their overall income, but also on 20% of their property and investment portfolio. The energy community has a simple payback period of 10 years, but a sensitivity analysis to evaluate the economic profitability under various economic scenarios is not discussed [26].
As written above, non-Italian renewable communities were also analyzed. The Schoonschip energy community is a sustainable neighborhood in Amsterdam, the Netherlands, created through the collaborative efforts of its residents. The community consists of 46 residential units on floating plots, with over 140 residents. The community focuses on promoting sustainable living, clean energy, and participating in the energy transition. Various workgroups within the community manage aspects such as smart grids, energy, ecology, water quality, and more. Each house is well insulated and equipped with green roofs, smart heat pumps, shared solar panels, local batteries, and solar water heaters. The community operates on a smart grid, shares electric vehicles, and utilizes rainwater collection and wastewater reuse systems. The legal framework required innovative elements to establish multiple entities, including a foundation, cooperative association, owners’ association, and Pioneer Vessel foundation. The community faced obstacles due to legal considerations for houseboats, but successfully implemented a replicable model. The residents engage in a collective investment of resources, and the project includes affordable housing options [26].
Efthymiou et al. present a practical methodology to facilitate decision making in the development of a renewable energy community (REC) in the municipality of Hersonissos, Crete, Greece. The impact of sharing energy produced from renewable sources through the direct or indirect participation of citizens represents a significant opportunity to strengthen energy democracy and alleviate energy poverty. Through a step-by-step methodology, potential sites and alternatives for photovoltaic system installations are explored to identify the most optimal option from both technical and legislative perspectives. Subsequently, the best business model for the REC is selected based on SWOT analysis and a detailed techno-economic analysis of the expected investments. According to the design calculations, the emerged optimal option of the photovoltaic systems and business model can achieve substantial environmental and economic benefits, reducing the municipality’s annual CO2 emissions and electricity expenses by at least 68.40% and EUR 59,446,154, respectively. Furthermore, key economic indicators were analyzed, with an NPV of EUR 3,213,654 and a payback time of 4.9 years [27].
In this context, this paper intends to outline a practical and replicable methodology to facilitate the development of municipality-led RECs through a case study in the municipality of Assisi, Italy. The work aims to study the first renewable energy community within the municipal territory using a technical, energy, and economic analysis. The aim of the REC is to reduce emissions due to the large flows of tourists and citizens in the historic center (where, due to landscape and architectural constraints, it is almost impossible to build new photovoltaic systems) providing residential buildings, hotels, commercial buildings, municipal buildings, etc., with energy produced in the industrial and commercial area of the city. The investigated renewable energy community promotes participatory and flexible planning, taking into account local specificities and landscape or architectural constraints. In the proposed model, the public administration facilitates this process during the planning stage by involving stakeholders and by implementing specific and municipal regulations [28,29]. In this way, a balance can be struck between the need for renewable energy and the preservation of historical and scenic aspects [30]. As a result of this work, a replicable model/action flow was proposed in order to implement medium-sized CERs with strong PA traction.

3. Case of the Study

Assisi is a small town sited in central Italy (Umbria region), covering an area of about 187 km2, with a population of approximately 28,000 inhabitants. Assisi appears as a town with a strong rural character, dominated by the historical city center, situated at the base of Subasio Mount, and several of the municipality’s hamlets. The historical city center is characterized by many important monuments that are destinations of religious tourism and pilgrimages. Assisi, the Basilica of St. Francis, and other Franciscan places have been on the list of the UNESCO World Heritage Sites since 2000, as a fundamental reference for the history of art in Europe and the world.

3.1. Energy Transition of the Municipality of Assisi

In recent years, the use of strategies and policies for reducing greenhouse gas (GHG) emissions and energy consumption are being developed worldwide. Several initiatives were drawn up at the global level, but it has become necessary to implement sustainable policies also at the local scale. The Covenant of Mayors [31] represents an important resource for local administrations, as it allows the drawing up of Sustainable Energy and Climate Action Plans (SECAPs) in order to move towards more sustainable and resilient cities. In this context, the Municipality of Assisi adopted the SECAP in October 2020; developed with the support of the CIRIAF at the University of Perugia, the SECAP outlines Assisi’s goals to reduce CO2 emissions by 40% and enhance its capacity for climate change mitigation by 2030.
The SECAP begins with an inventory of emissions for the reference year 2008. Assisi’s energy consumption in 2008 was 541,797 MWh, resulting in total CO2 emissions of 146,611 tons. The transportation sector accounted for 30% of emissions, followed by industry (25%), residential (24%), tertiary (17%), public (2%), and agricultural (2%) sectors. An update in 2016 showed a 4.2% reduction in energy consumption and a 17.4% decrease in CO2 emissions, attributed to changes in the national emission factor for electricity, increased photovoltaic energy production, and the operation of a cogeneration plant.
To achieve the 40% emissions reduction target compared to 2008 (Figure 1), the SECAP outlines 13 strategic mitigation actions across various sectors. Six key actions align with Covenant of Mayors guidelines, focusing on energy efficiency in residential and municipal buildings, the tertiary sector, industry, agriculture, and the implementation of photovoltaic systems. An additional three actions address mobility and transportation, representing approximately 56% of the reduction target. These actions involve renewing private and municipal fleets and implementing the Sustainable Urban Mobility Plan (SUMP) for Assisi. Other measures include improving public lighting, tree planting, stakeholder engagement, and awareness campaigns.
In addition to mitigation, the SECAP emphasizes the need for adaptation to climate change. Through an analysis of historical climate data, Assisi identified seven primary risks: extreme heat, heavy precipitation, floods, droughts and water scarcity, land degradation, wildfires, and chemical changes. The plan proposes nine adaptation actions, including environmental monitoring protocols, a “Zero Waste” strategy, enhancing and preserving the Monte Subasio Park, promoting public water usage, implementing green procurement practices, aiming for zero soil consumption by 2026, maintaining urban green spaces, dematerializing operations, and promoting the event “un albero per Francesco” (a tree for Francis).
According to the data [32], the citizens of Assisi are directly responsible for approximately 50% of the emissions in the municipal territory. Therefore, attention should be focused on the citizens and their potential to directly reduce their own emissions, facilitated by actions that the municipality can adopt through engagement and awareness strategies. Recognizing that public sector actions alone are insufficient, the SECAP emphasizes the importance of involving stakeholders who contribute to energy consumption. The plan also calls for the establishment of an Energy Management and Environment Office and an energy help desk to coordinate and monitor the SECAP’s implementation. The adoption of the SECAP demonstrates Assisi’s commitment to sustainable development and addressing climate change. The plan encompasses a comprehensive approach, encompassing both mitigation and adaptation actions to reduce emissions, improve energy efficiency, promote renewable energy sources, and enhance the city’s resilience to climate impacts. Through dedicated offices and coordination mechanisms, Assisi aims to effectively implement, monitor, and report on the progress of the SECAP. By taking proactive steps, Assisi is positioning itself as a leader in sustainable energy and climate action.
In 2021, Assisi joined the European Horizon 2020 European City Facility (EUCF) program, which funded the project “Towards a climate neutral Assisi: the role of citizens and tourists in the city of Francesco in the post-COVID new normal”. The obtained resources aim to accelerate the achievement of the goals outlined in the SECAP, thanks to an in-depth technical, economic, and legal analysis of specific actions. Despite being a public-driven project, it primarily targets citizens and private entities and develops through two main directions. The first is a comprehensive renovation of residential buildings, aiming to save 26,749 GWh/year, with 7791 energy refurbishment interventions planned by 2030. These interventions involve improving the building envelope, enhancing energy systems, and transitioning from fossil fuel-based heating systems to more environmentally friendly alternatives. The second direction focuses on significantly increasing renewable energy production through the installation of new photovoltaic systems on public and private buildings’ rooftops and the creation of the first renewable energy community (REC) within the territory of Assisi, as explained below.

3.2. Renewable Energy Installations: State of the Art and Development Trends

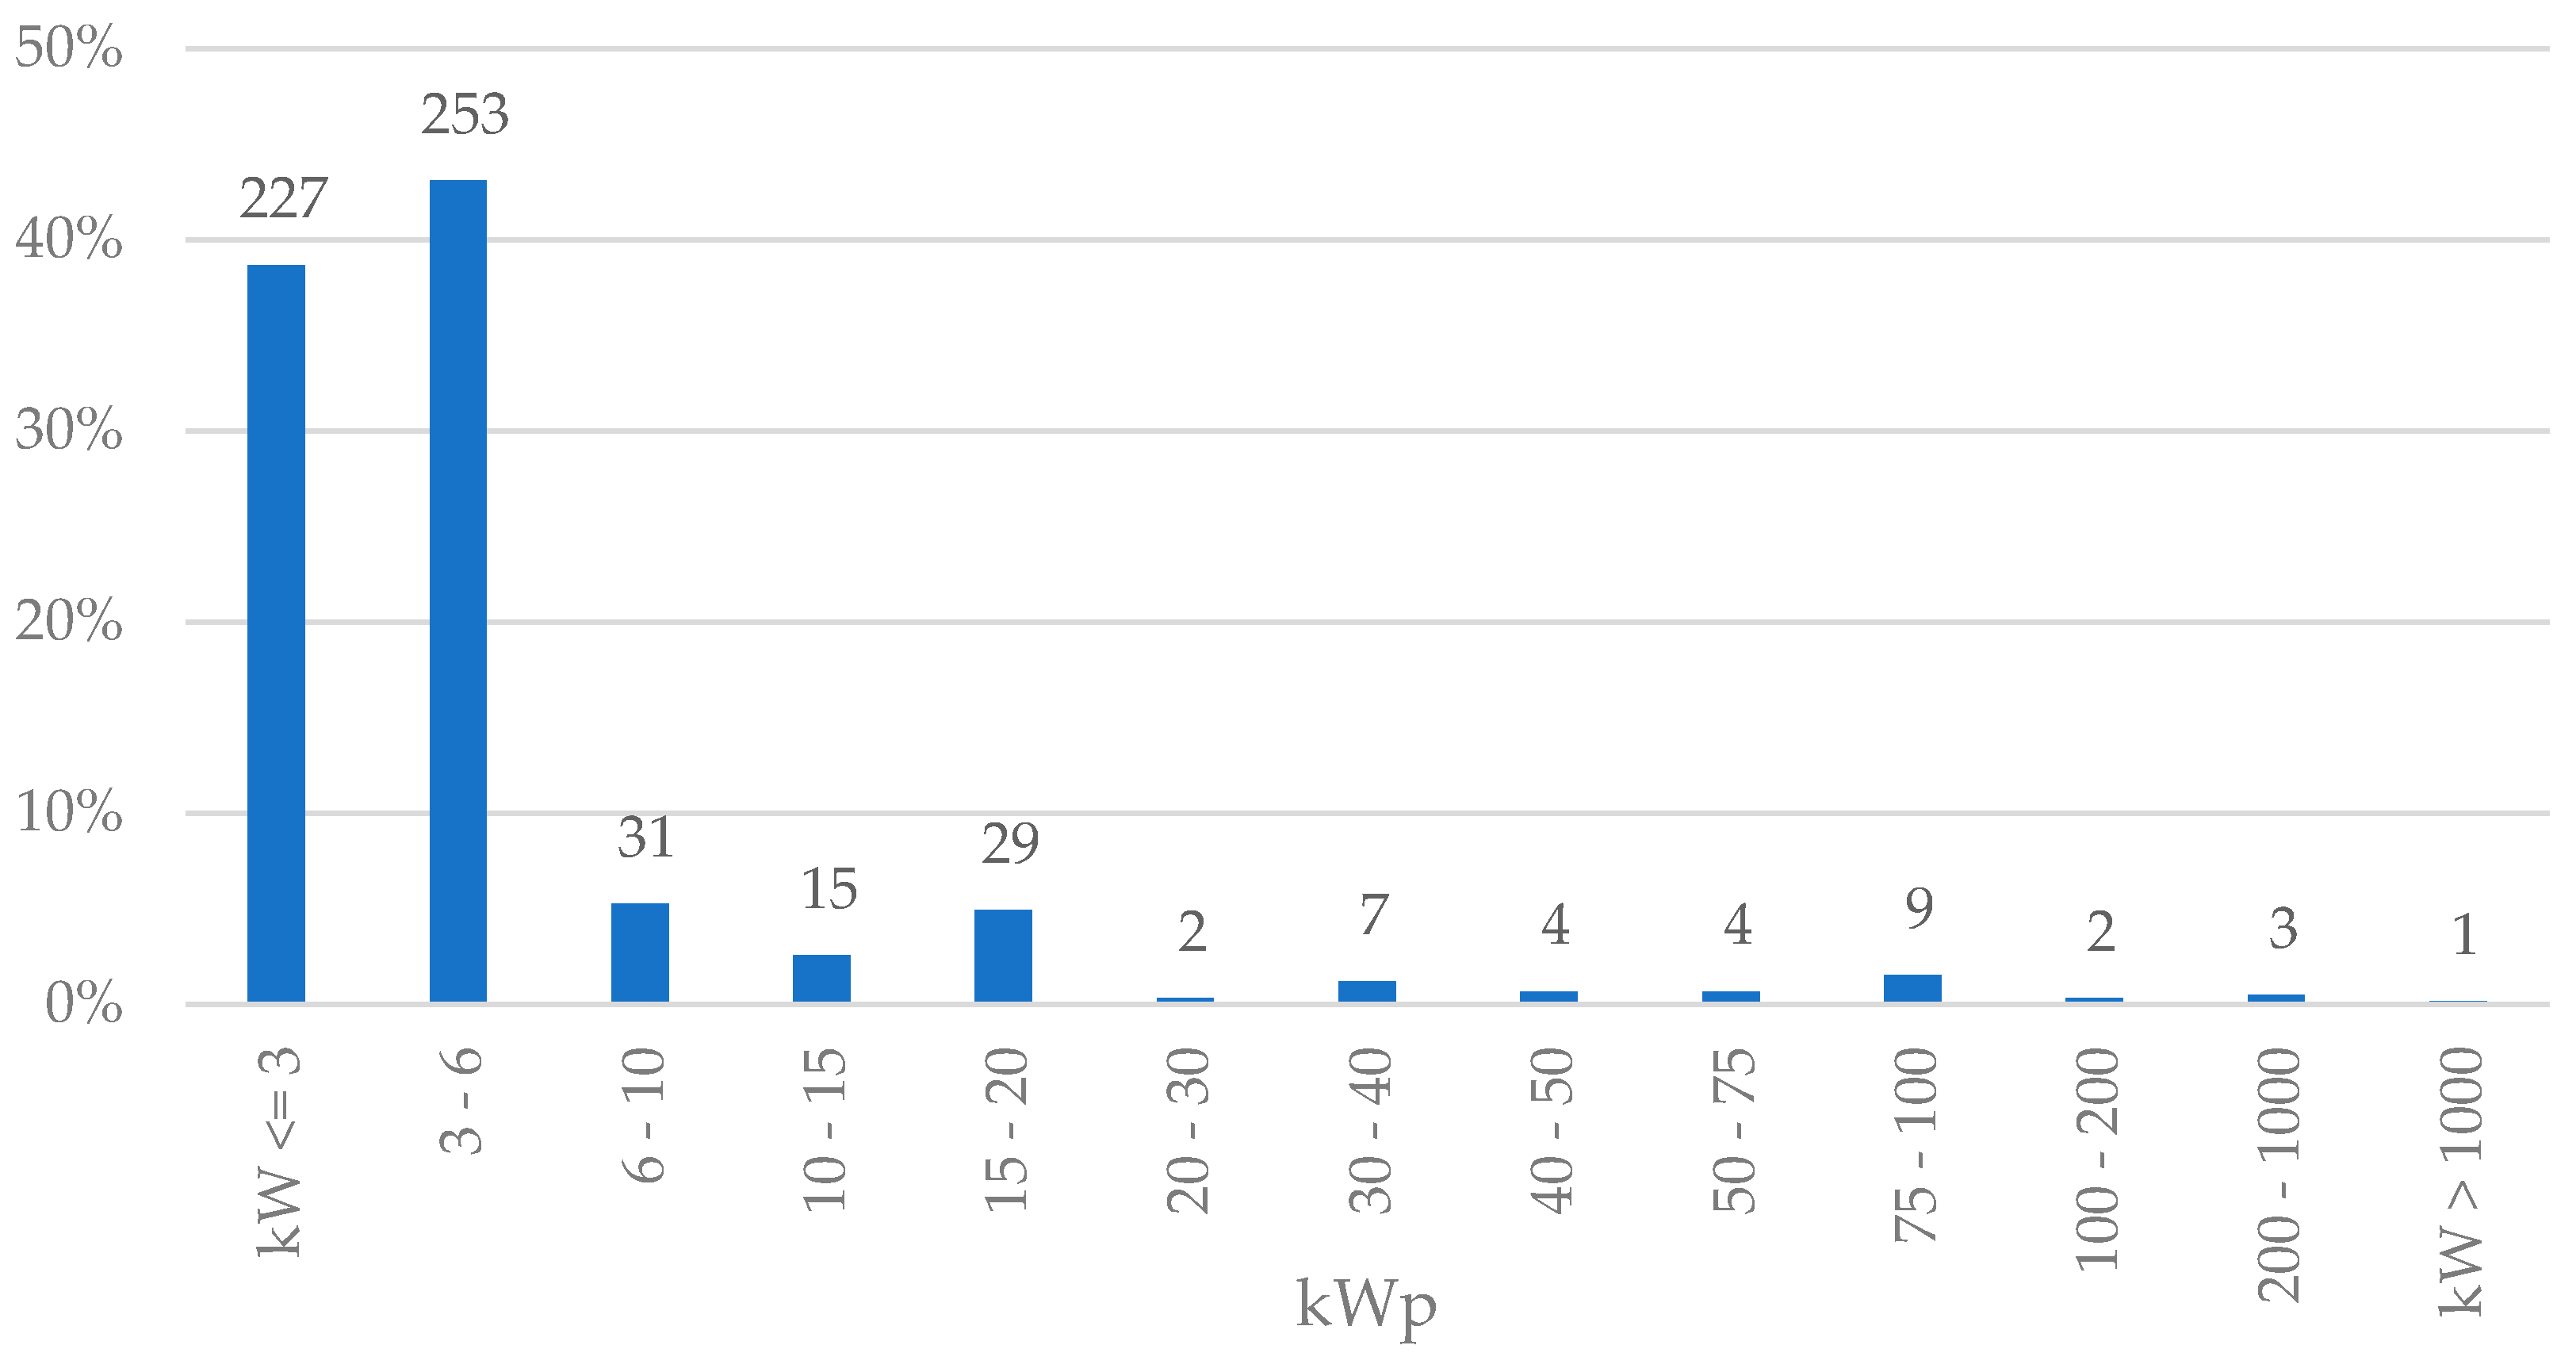
A thorough analysis of the current state of renewable energy installations in the municipality of Assisi was carried out, specifically focusing on photovoltaic systems. According to the latest available data from the “Atlaimpianti” portal of the GSE (Gestore dei Servizi Energetici) [33], as of July 2021, a total of 587 installations with a cumulative capacity of 8263 kWp were present in Assisi. As depicted in Figure 2, systems below 10 kWp accounted for 87% of the total installations, representing 25% of the installed capacity, and can be classified as “residential installations”. Installations ranging from 10 to 100 kWp constituted 12% of the total, with only 1% (six installations) exceeding 100 kWp, of which a single system surpassed 1 MWp (1478 kWp). Analyzing the installed capacities reveals that systems above 100 kWp contribute 48% of the total installed capacity, while the range between 10 and 100 kWp contributes only 27%.
The aforementioned findings shed light on the distribution of installed photovoltaic capacities in Assisi. Notably, a significant proportion of installations, primarily serving residential and small-scale purposes, consists of systems below 10 kWp. Conversely, a relatively small number of larger-scale installations, including a solitary system surpassing 1 MWp, accounts for a substantial portion of the total installed capacity.
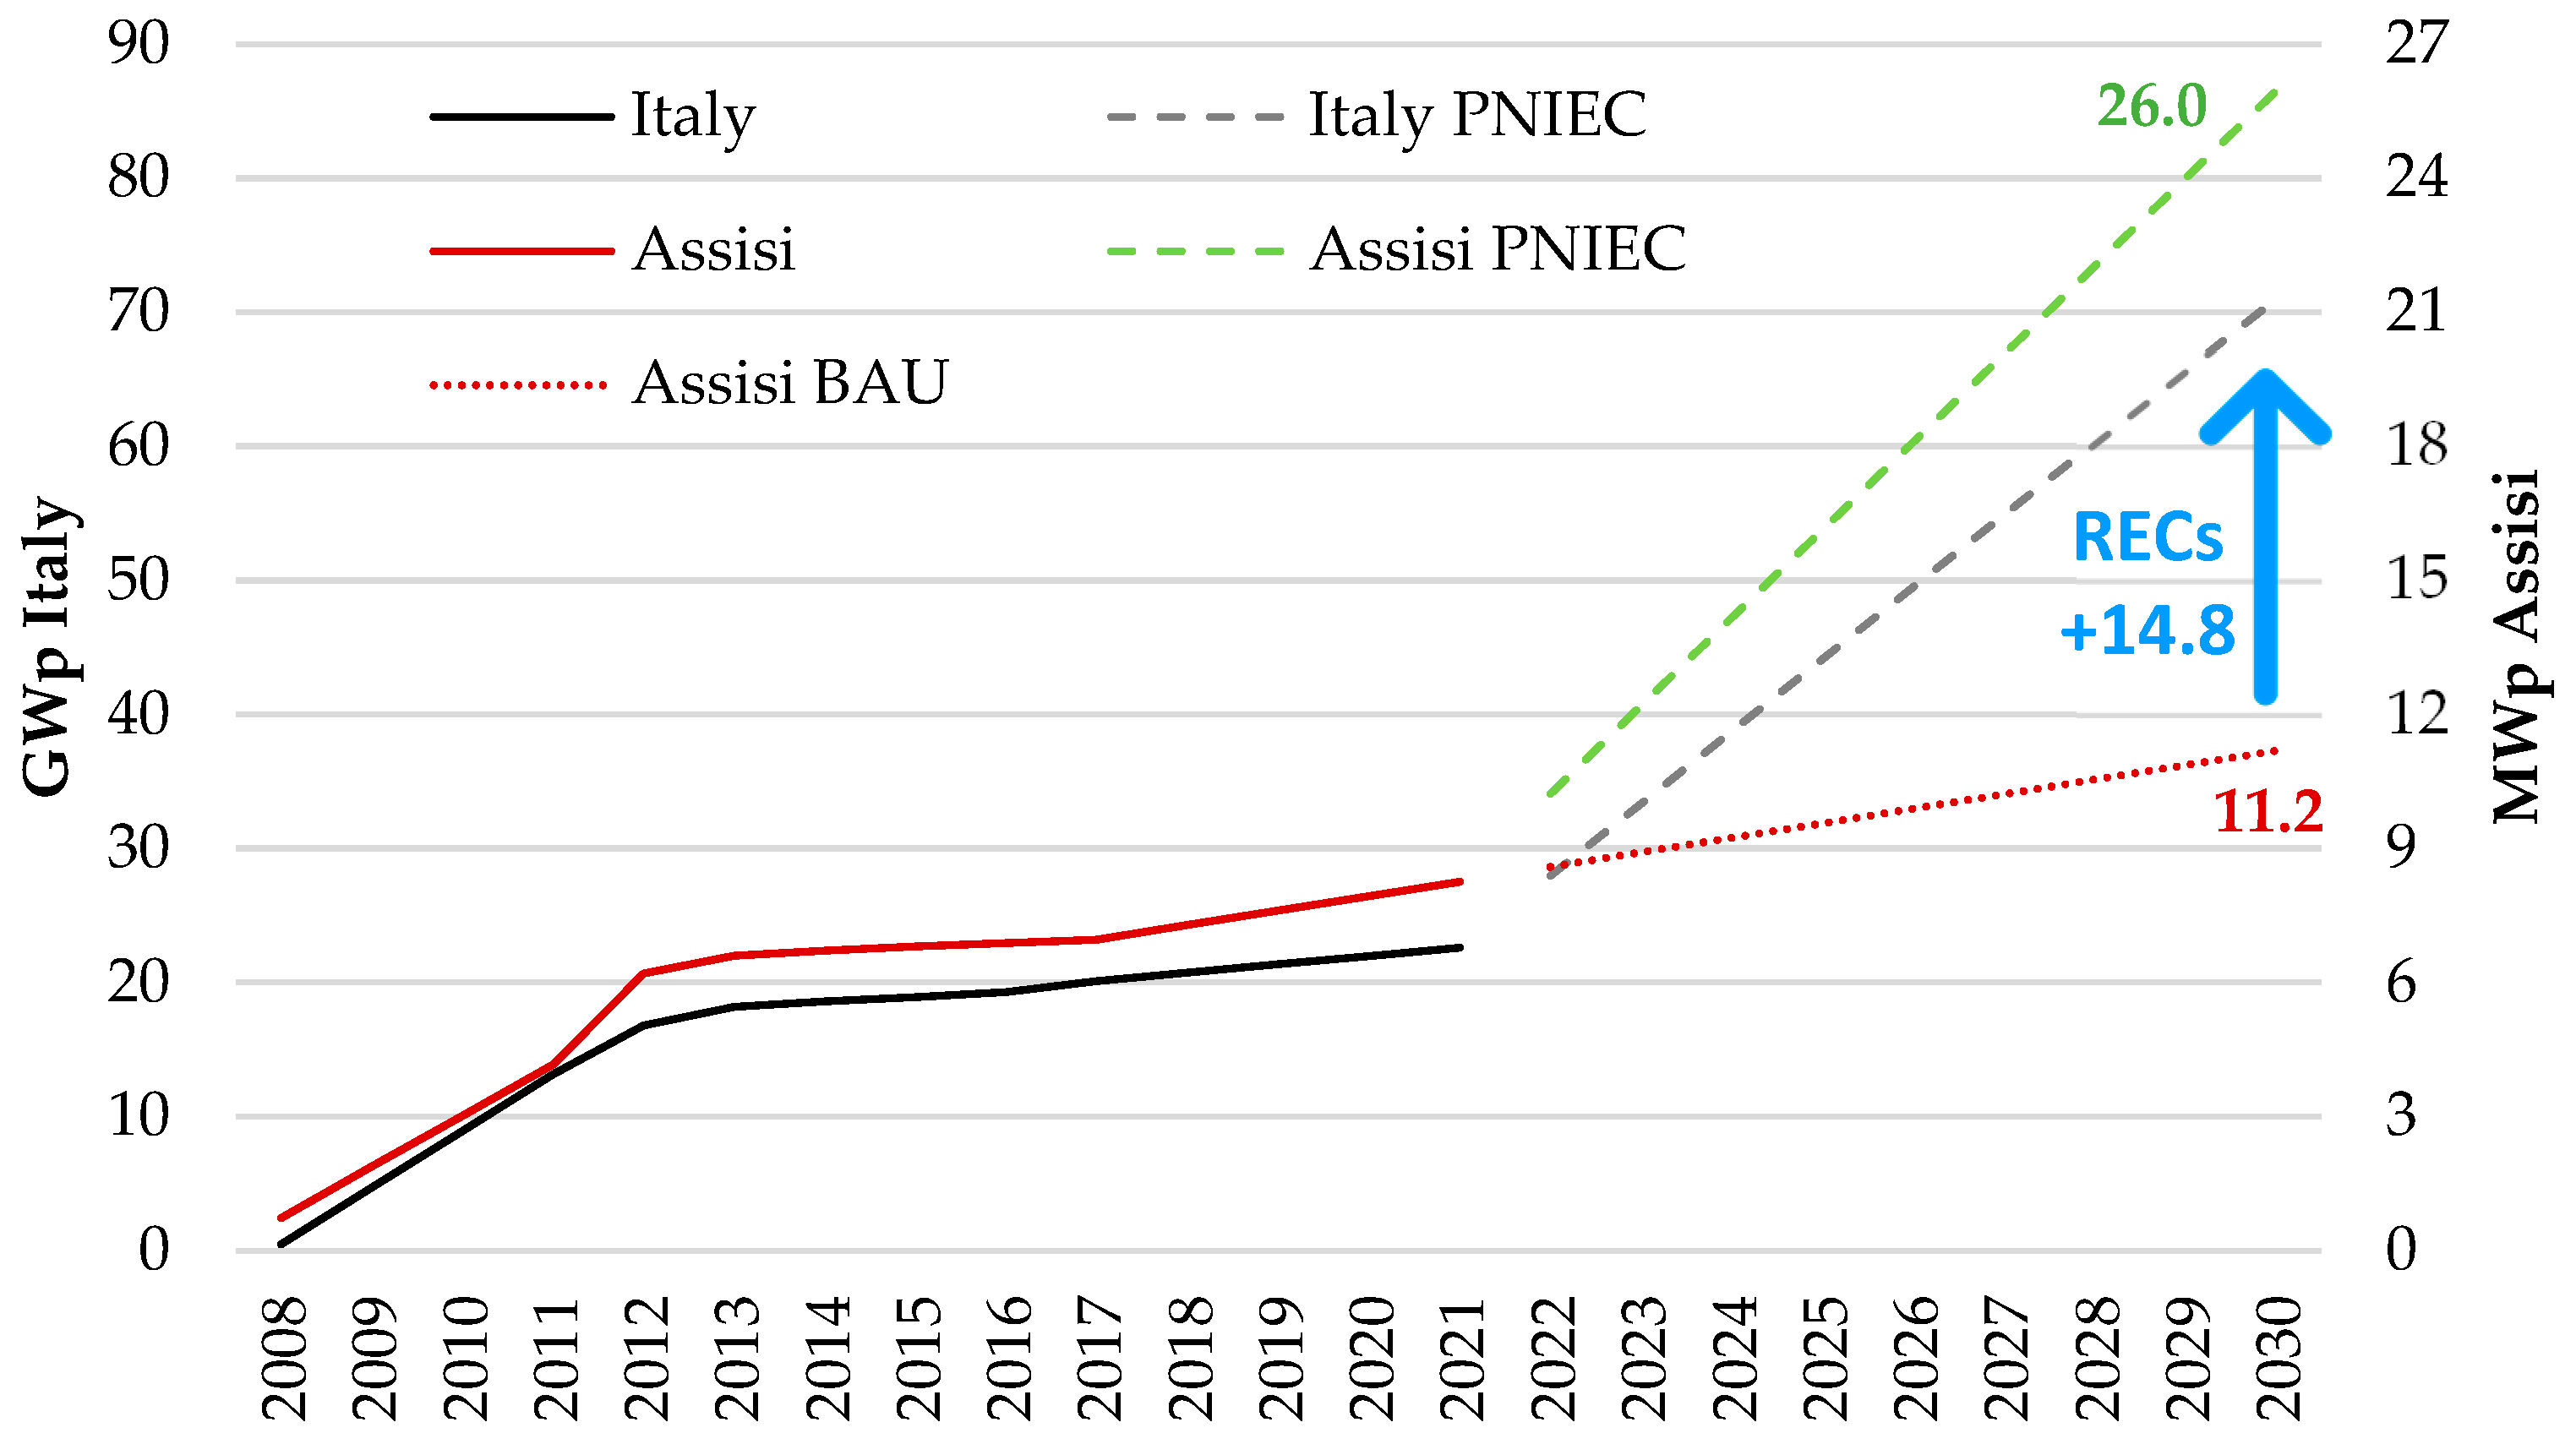
Moreover, an energy analysis has been conducted to examine the installed capacity trends over the years in the municipality of Assisi. As shown in Figure 3, a consistent pattern emerges, revealing a significant annual increase in installed capacity between 2008 and 2012. Over the past decade, there has been a steady rise in installed capacity by a few percentage points each year. Notably, Assisi has followed the same trajectory as the overall national installations.
When considering the targets set by the National Integrated Plan for Energy and Climate (PNIEC), it is evident that Italy aims to triple its installed capacity by 2030. Moving this objective to the context of Assisi implies a transition from the current 8.3 MWp to 26 MWp. To provide a comprehensive perspective, the graph also presents a Business-As-Usual scenario (BAU), projecting the expected kWp in Assisi if no incentivizing policies were implemented. The analysis demonstrates that by 2030, the projected capacity under such circumstances would amount to 11.2 MWp, falling short by 14.8 MWp compared to the set objectives. These findings underline the need to foster the establishment of new renewable energy communities within the municipality of Assisi to partially bridge the gap and strive towards achieving the defined targets.

4. Methodology

4.1. Rationale

To implement a successful renewable energy community, an operation model must be set up, taking into account the main goal of the REC, the number and profile of members, the RES energy plants, the ongoing legislative framework, and the development model. According to the literature [11], the main developing models of RECs are bottom-up/citizen-driven, top-down/PA-driven, and energy/technical operator-driven.
Due to the site-specificity of the area and the political willingness and readiness to take concrete actions to spread renewable energies, a top-down/PA-driven REC was proposed and analyzed for Assisi. The municipality is the aggregator and promoter of the REC and it consists of public and private (citizens, small and medium-sized enterprises, religious organizations, etc.) members.
The REC allows leveraging renewable energy sources to offset the emissions generated by heavy tourist flows and residents in the historic center, where installing new photovoltaic systems is challenging due to landscape and architectural constraints. The REC will supply energy produced in the city’s industrial and commercial area to residential buildings, hotels, commercial buildings, and municipal facilities. The energy refurbishment actions will not only contribute to reducing energy consumption in buildings, but also improve the quality of life and comfort for citizens. Moreover, within an economic context characterized by rising energy prices, these benefits generate significant social advantages for REC members and various stakeholders. Furthermore, RECs can address energy poverty and the associated challenges of energy access by providing tools and information for proper consumption management.
To evaluate the potential and critical issues of the chosen model, a preliminary so-called strength–weaknesses–opportunities–threats (SWOT) analysis was carried out (Figure 4).
In the context of the municipality of Assisi, and other Italian municipalities with the same characteristics, the implementation of renewable energy facilities and implementing REC may encounter various constraints and barriers that can hinder their development [34,35]. Some of the main ones are described below.
Landscape and architectural constraints: as Assisi is a city of great historical and cultural value, it is subject to strict constraints to preserve its unique architectural and landscape appearance. These constraints can limit flexibility in choosing locations for installing renewable energy facilities. For example, there may be restrictions on installing solar panels on the roofs of historical buildings or constructing visible wind turbines that could alter the city’s aesthetic appeal. This requires careful planning and targeted design to find solutions that harmoniously integrate with the surrounding environment.
Limited availability of space: Assisi is a relatively compact city with an already established urban fabric. This can result in the limited availability of suitable space for large-scale renewable energy installations. The lack of open land or suitable areas can pose a challenge in locating facilities such as solar parks or biomass plants. Therefore, it may be necessary to explore creative solutions, such as utilizing existing urban spaces or promoting small-scale community projects.
Complexity of authorization procedures: Obtaining the necessary authorizations and permits for the construction and operation of renewable energy facilities can be a complex and lengthy process. Norms and administrative procedures can vary at regional and local levels and require approval from different competent authorities. This can lead to delays and additional costs for developers, slowing down project implementation. It is important to address this challenge by streamlining procedures, promoting cooperation among competent authorities, and providing clear guidelines to facilitate the authorization process.
Community acceptance and involvement: The acceptance and active involvement of the local community are crucial for the success of renewable energy facilities. Some community members may express concerns or opposition regarding the potential impacts of the facilities on the environment, landscape, or quality of life. It is important to promote open and transparent communication, involving the community from the early stages of project planning. This can include disseminating clear information about the environmental and socio-economic benefits through public meetings and engagement initiatives.
Concerning the opportunities, the REC aims to increase the power of installed photovoltaic systems (set goal of 2 MWp by 2030), providing a strong incentive to the sector, and to develop new photovoltaic solar installations on municipal buildings. Therefore, the project has only hypothesized the contribution provided by photovoltaic energy, as this type of installation is visually less impactful and more integrable in the environmental context. This territorial characteristic is confirmed by the presence of photovoltaic installations in the industrial and residential areas of “Santa Maria degli Angeli”, which is distant from the city’s historic center.
The planned photovoltaic solar installations will contribute to reducing utility costs by increasing the share of physical energy self-consumption. Moreover, being the installations part of a renewable energy community configuration, they will contribute to combating energy poverty and achieving the objectives set by the SECAP by 2030.
In order to achieve these objectives, the creation of the first renewable energy community in the municipality of Assisi plays a crucial role, as it allows:
  • The dissemination of renewable sources in the municipal energy mix;
  • The installation of energy storage systems and the increase of self-consumption from renewable energy sources;
  • The dissemination of home automation (smart meters, digital meters, control and management platforms) and the consequent optimization of consumption profiles;
  • The transition towards sustainable mobility (charging stations and electric vehicles);
  • The active involvement of citizens in the energy transition, as consumers, energy producers, or both (prosumers).
Furthermore, the distributed generation of electricity leads to a decrease in losses resulting from long-distance transport. The energy that is shared within the REC, defined as the minimum on an hourly basis between the energy generated by renewable sources and the energy consumed by the REC members from the grid, allows for the establishment of a virtuous system of virtual self-consumption that brings both environmental and economic benefits.
Alongside these general considerations, a detailed technical, economic, and legal analysis is crucial to assess the effectiveness of the proposed model on the territory in analytical and quantitative terms through appropriate analysis tools. A specific methodology was developed to study the energy configuration of the REC, which, moving from the results provided by the technical analysis, allowed an economic evaluation of the project. In this discussion, since it is functional for the realization of an exclusively “photovoltaic” REC, only the contribution given by photovoltaic systems will be evaluated. The same procedure, by adjusting the technical and economic parameters, can also be applied to other production plants from renewable sources [36].

4.2. Choice of Clusters and Configuration

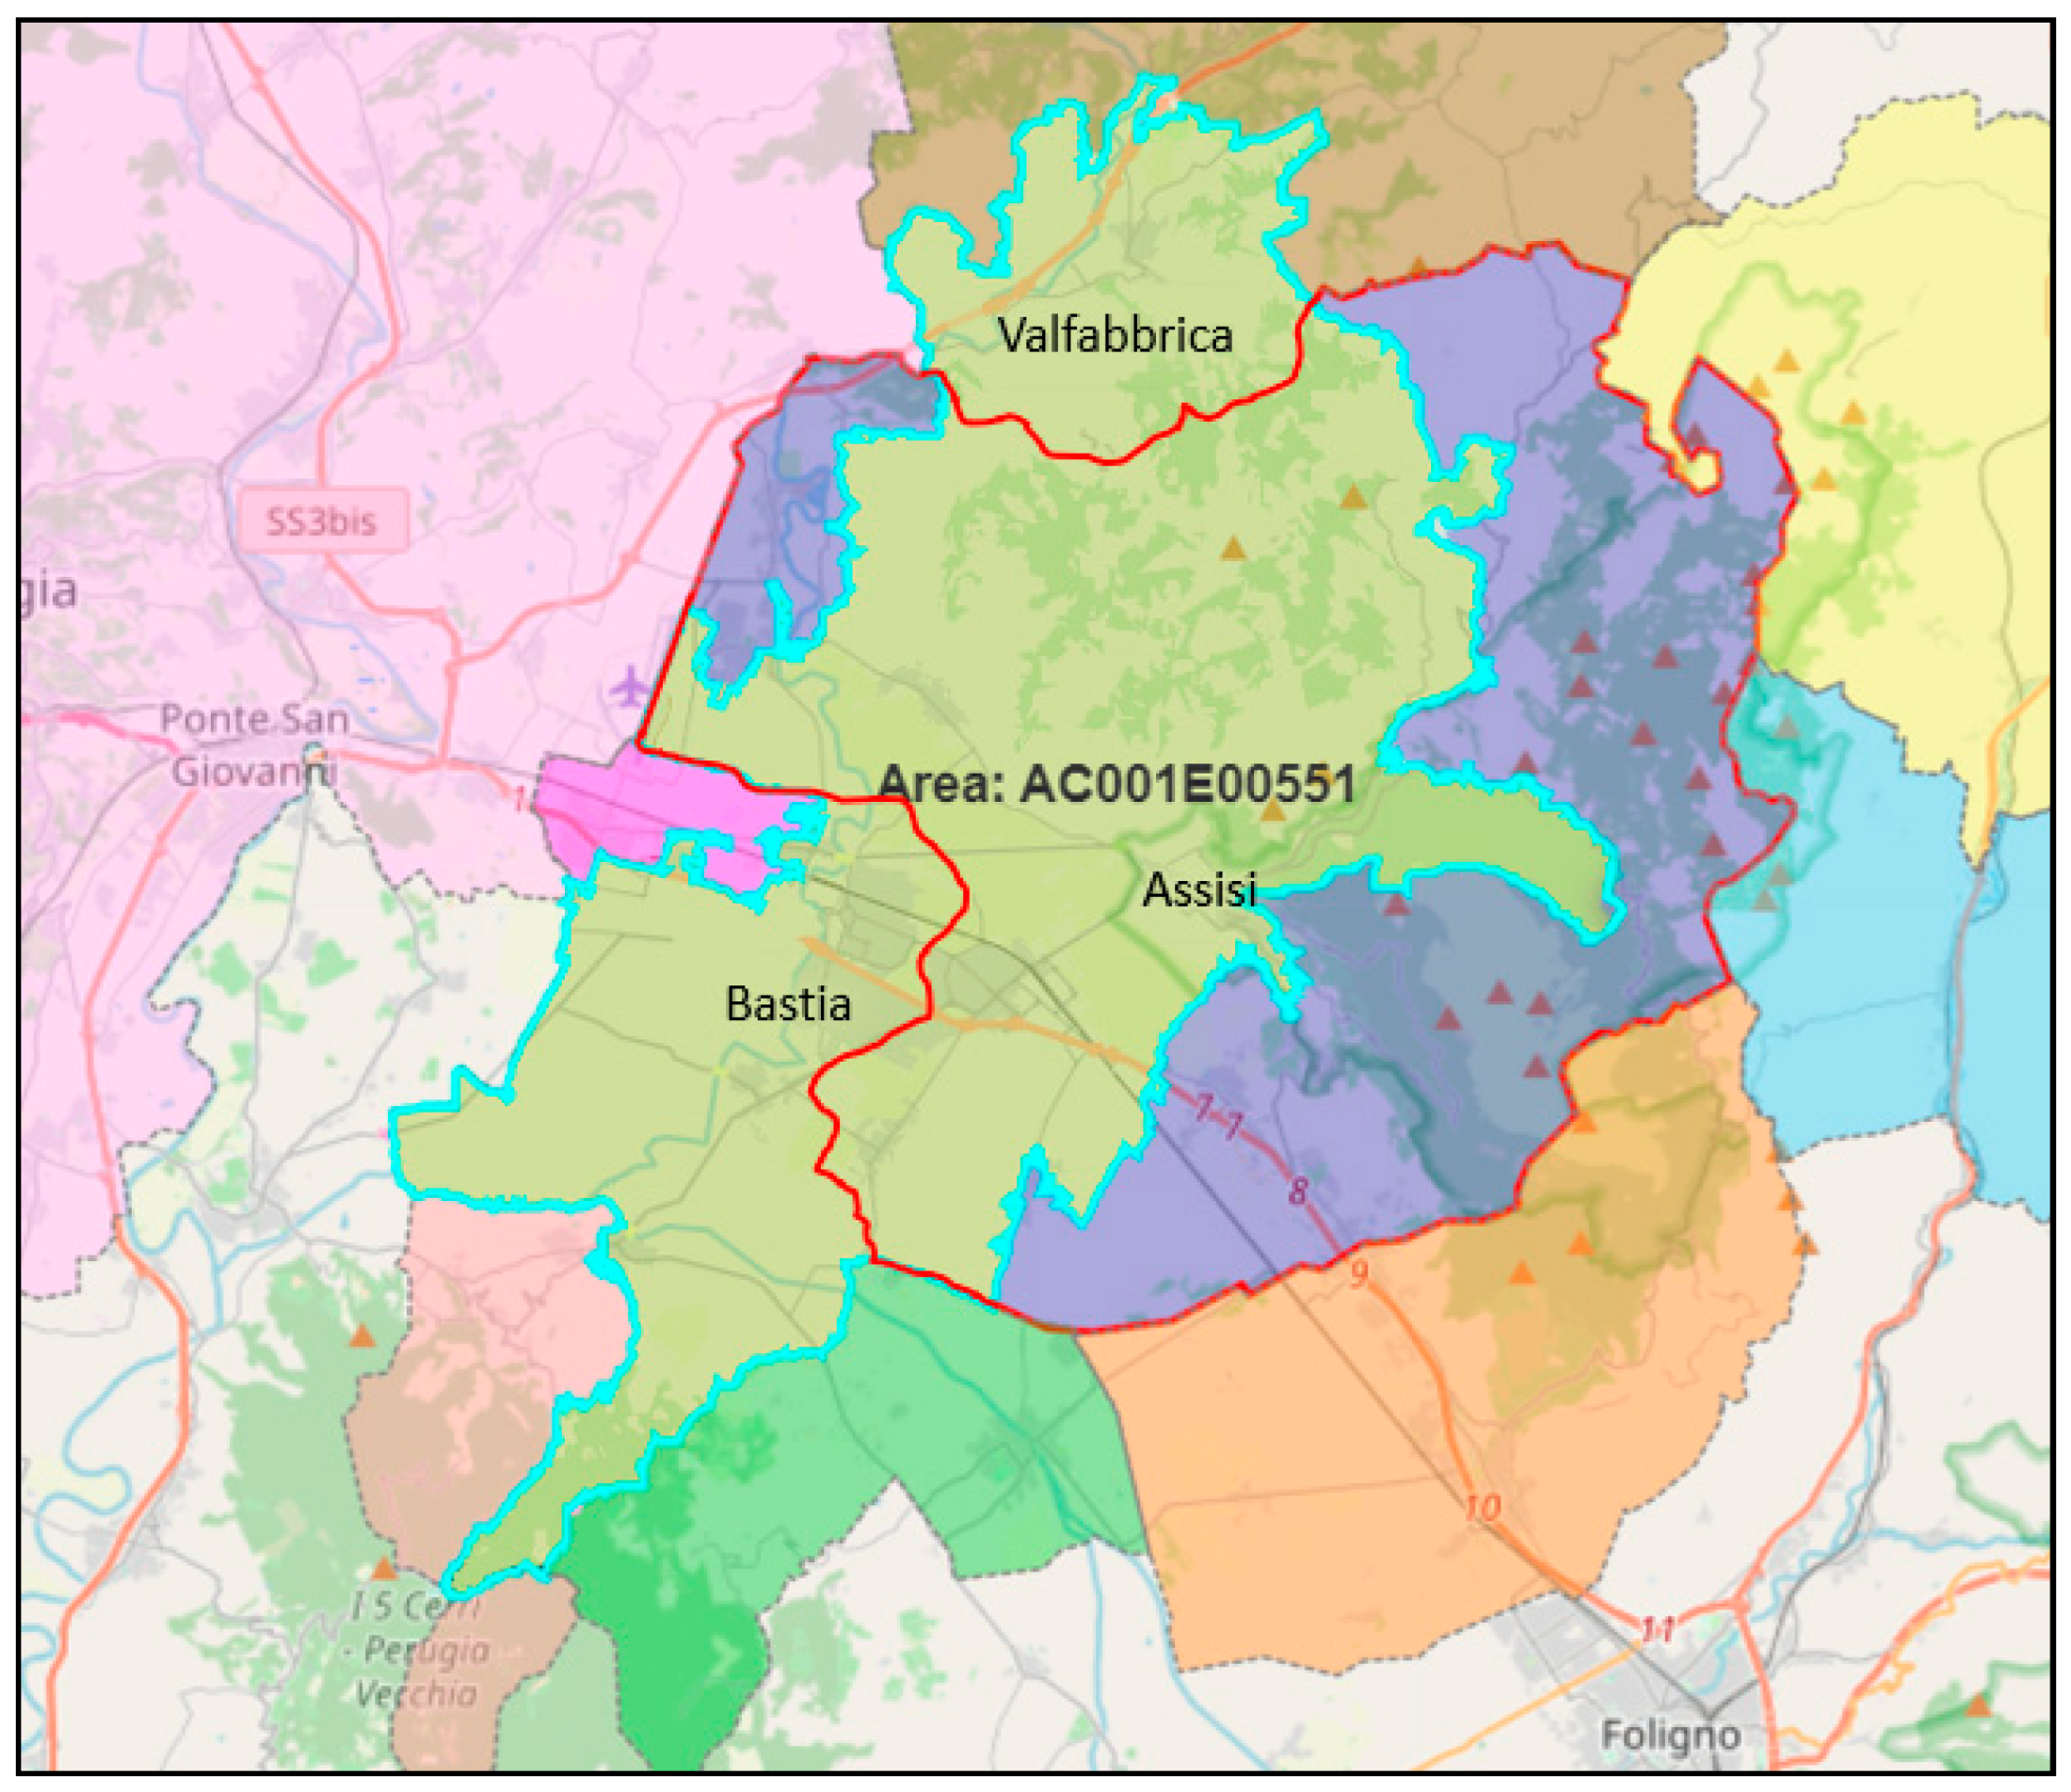
In this section, the considerations made for the initial choice of the energy community configuration and how the various types of users were clustered will be discussed. In order to achieve a total power from renewable energy sources of approximately 2 MWp by 2030 (with a production of 2.2 GWh/year), the hypothesis is to distribute 65 photovoltaic solar installations on the territory of the Municipality of Assisi. The installations that will be part of the REC must be connected to the same primary distribution substation. Following the provisions of Resolution ARERA 727/2022/R/eel, the map identifying the conventional areas related to primary substations throughout the national territory has been published. This allowed the designation of the area AC00100551 as part of the municipal territory (bounded by the red line in Figure 5) designated to host the REC (bounded by the cyan line). This area was chosen because, although it is not entirely within the municipal territory, it includes the historic center of Assisi, Santa Maria degli Angeli, and commercial–industrial areas.
As previously mentioned, the planned installation of the systems will be widely distributed outside the historical centers and will include buildings provided by the Municipality of Assisi, on which the municipality is committed to implementing photovoltaic systems. Since it is not currently possible to estimate the types of users who will join the energy community in the future, groups or “clusters” of both prosumers and consumers have been assumed. The clusters of prosumers from A to E are groups of users with the same installed photovoltaic capacity and annual consumption, assuming an office building consumption profile.
In the proposed configuration, as shown in Table 1, 50% of the installed capacity is allocated to five systems of 199 kWp each (Prosumer A). The remaining capacity is distributed among users with smaller systems, totaling 59 prosumers (Prosumers B to E). Additionally, there is only one producer consisting of a 50 kWp PV system installed on the roof of a building not connected for self-consumption (Cluster P). In the full-capacity configuration, a cluster of consumers consisting of 200 residential units has been considered (Cluster R), characterized by an annual consumption profile of 3000 kWh per household. Additionally, there are 23 public buildings owned by the Municipality of Assisi (Cluster M), which, according to data provided by the municipality for the year 2022, collectively consume 1,021,940 kWh.
The distribution of photovoltaic systems in the municipality of Assisi exhibits both similarities and differences when compared to the current configuration (Section 3.2). In both cases, 50% of the installed power is attributed to systems with a capacity exceeding 100 kWp. However, the distribution of smaller systems, specifically those below 10 kWp (residential installations), demonstrates variations between the two configurations. In the simulated configuration, residential systems below 10 kWp represent 78% in terms of quantity and 10% in terms of installed power. This deviates from the reality, where such systems accounted for 87% of the total number of installations and 25% of the total installed power. Therefore, the chosen configuration exhibits a preference for “non-residential” users with capacities ranging from 10 to 100 kWp over “residential” installations. The reason for this is that the primary role of the public administration, which actively supports the community, is to encourage and engage in the tourism and commercial sectors.
Moreover, the simulated configuration excludes systems with capacities exceeding 200 kWp. This omission aligns with the limited presence of such systems due to regulatory and restrictive challenges within the municipality of Assisi.
Overall, the chosen configuration favors the inclusion of PV plants for non-residential users within the 10 to 100 kWp range, while giving less priority to residential systems below 10 kWp. This preference aligns with the observed distribution and reflects the prevailing regulatory and restrictive environment in Assisi, which hampers the proliferation of larger-scale installations.
The larger systems will be installed in the commercial–industrial area of Santa Maria degli Angeli, on non-residential buildings. Currently, neither energy storage systems nor car charging stations are considered in the configuration, as they would mainly impact fixed costs. Therefore, the energy analysis does not consider the potential benefits of storage systems, which would increase the self-consumption of users and, if shared within the community, enhance energy sharing.

4.3. Energy Analysis

The configuration of the REC has been established and the main energy quantities have been studied, including energy produced, consumed, self-consumed (referred to as physical self-consumption), fed into the grid, and shared.
To assess the energy balance of the configuration, the following performance indices have been defined:
  • Physical self-consumption index: the ratio between physical self-consumption and photovoltaic production.
  • Virtual self-consumption index: the ratio between the energy shared among community members and the total photovoltaic production.
  • Total self-consumption index: the sum of the physical self-consumption index and the virtual self-consumption index. Since both terms in this index have the energy produced by the REC in the denominator, this index provides insights into how effectively the configuration utilizes the overall energy production.
  • Energy self-sufficiency index: the sum of physical self-consumption and shared energy divided by total energy consumption.
These parameters, calculated for the proposed configuration based on representative consumption profiles of different member types, are reported in the next section [38,39].

4.4. Economic Analysis

After defining the energy parameters for each user (or cluster), an economic analysis was conducted by developing an algorithm on a spreadsheet.
First, the revenue items were identified for each type of energy flow, assuming the following values:
  • Electricity fed into the grid “RID” (Ritiro Dedicato): paid by the GSE for selling electricity to the grid, conservatively assumed to be the minimum guaranteed price, albeit variable over the lifespan of the REC, at EUR 40.7/MWh [40].
  • Physical self-consumption: corresponding to the savings from not purchasing electricity from the grid, estimated at EUR 300.0/kWh.
  • Energy shared within the REC (energy shared: the minimum on an hourly basis between the energy generated by renewable sources and the energy consumed by the REC members from the grid):
    • Annual incentive paid by the GSE for shared energy: The incentive paid by the GSE to the REC (CACV) has a duration of 20 years and is directly proportional to the shared energy (EACV). Pending the Decree of the Italian Ministry of Environment and Energy Security (MASE) that establishes the incentive values in implementation of Legislative Decree 199/21, reference was made to the currently applicable transitional regime, which corresponds to an amount of EUR 110.0/kWh.
    • Compensation related to ARERA refunds: Refund of the transmission tariff (TRASE) defined for low-voltage users and the higher value of the variable distribution component for other low-voltage users. Referring to the values set by ARERA for low-voltage users for 2023, they are considered as EUR 8.48/MWh and EUR 0.61/MWh, respectively, for a total of EUR 9.09/MWh.
  • The total value of incentives and compensation considered for the valuation of shared energy is, therefore, EUR 119.09/MWh.
To perform an accurate economic analysis, a preliminary study was conducted on the cost items of an REC. A renewable energy community incurs expenses, divided into one-time costs (CAPEX) such as facility implementation and legal entity establishment, and periodic costs (OPEX) including regular and extraordinary (OPEX in the 10th year) maintenance and platform costs. These parameters, calculated for the proposed configuration, are reported in the next section [41,42,43,44,45,46].

5. Results

This section presents a comprehensive overview of the key energy and economic outcomes derived from the configuration analyzed. This chapter aims to provide a detailed account of the significant findings obtained during the study, shedding light on the energy performance and financial viability of the examined configuration.
Within this section, the primary energy parameters, including energy production, consumption, self-consumption, and sharing with the community, will be explored in depth. In addition, an in-depth analysis of economic aspects will be conducted, with revenue calculation based on different energy flows and factors. In addition, the time factor will be considered, recognizing the time required for the configuration to reach its full potential, particularly in cases involving high powers.
By presenting these essential outcomes, this chapter aims to provide valuable insights into the energy and economic performance of the analyzed configuration, offering a comprehensive understanding of its potential benefits and implications.

5.1. Energy Results

The energy parameters, calculated for the proposed configuration based on the assumptions made in the previous section, are shown in Table 2. As we can see from the results of the PV, production is 67% of consumption. In this configuration of the 2.392 MWh produced, about half of it is self-consumed (51%), while the remainder is fed into the grid (49%).
The configuration studied is characterized by a percentage of shared energy, compared to the energy fed into the grid, of 55.5%, for a total of 651,240 kWh. This value is critical, as it gives us an indication of the goodness of the chosen configuration. A higher value of shared energy may be desirable, but the percentage obtained still indicates that the REC is able to virtually share only 55.5% of the energy fed into the grid. This means that there is possible room for improvement by changing the chosen configuration or users’ consumption habits.
These parameters are for the community overall, but can also be calculated for the individual cluster. In this case, it is good to highlight the role of the public administration, which, with the consumption of its utilities, participates in the composition of 40% of the total shared energy. This means that the fact that the PA participates in the REC, even if only as a consumer, increases the share of shared energy and therefore of the share that will then be incentivized.
The energy data discussed so far show how the REC can be further improved in its balance by going to work on utility habits in order to maximize sharing.
An additional output that has been derived is the community’s environmental impact, shown in Table 3, calculated by referring to the following conversion factors:
  • 0.187 × 10⁻³ toe (tons of oil equivalent)/kWh [47];
  • 0.255 kg CO2/kWh [48].

5.2. Economic Results

Table 4 shows the cost and revenue items of the community according to the above. CAPEX are mainly attributable to the purchase and installation of photovoltaic systems, but also include legal entity establishment, while OPEX include regular and extraordinary (OPEX in the 10th year) maintenance and platform costs.
Another factor to consider is time, as, especially for configurations involving high power, it takes years to bring the REC to full operation. Considering this, reaching a power capacity of 2 MW by 2029 has been hypothesized. This assumption was made because the 2 MW of installed PV capacity to 2030 is what is planned in the EUCF project.
Starting from the electricity fed into the grid, self-consumed by users, and shared within the community, calculating the revenue of the REC for each year is straightforward. An annual increase of 1% in the cost of purchasing electricity and an inflation component of 3% reflecting the increase in prices for equipment purchase and installation have also been considered.
To assess the economic feasibility of the intervention, the economic indicator used is the Net Present Value (NPV). The NPV is the algebraic sum of cash flows generated by a project, adjusted by a discount factor that takes into account the opportunity cost of money, i.e., the return forgone by deciding to invest in that project rather than in a financial activity with the same risk, and inflation.
The discount rate used in the analysis is 3.21%, corresponding to the yield of government bonds (BTP) with a duration close to the time horizon of the overall intervention, multiplied by the specific risk rate (β unlevered corrected for cash) of the Green and Renewable Energy sector, based on listed companies in Western European markets (Damodaran, NYU, Gen 2022) [49]. The Simple Payback Period and the Discounted Payback Period are identified from the cumulative cash flow and NPV, respectively. The importance of this information relates to the financial resources available to the investing entity because if there is no possibility to finance the project before the cash flow becomes positive, that is, before the cutoff period, the investment may have to be rejected, even though it may be profitable in the long run.
Another economic indicator employed in the study of the intervention is the Internal Rate of Return (IRR), which is defined as the discount rate at which the NPV becomes zero and expresses the real rate of return of the project.
Table 5 presents the results obtained from the economic analysis with the specified assumptions. Figure 6 illustrates the economic performance of the project by showing the cumulative cash flow over the project’s duration.

6. Discussion

This section aims to explore how changes in the incentive on shared energy or changes on the sale or purchase price of energy will impact the economic analysis of RECs. Additionally, hypothetical configurations of RECs will be considered, utilizing clusters of prosumers and consumers to investigate how variations in the shared energy index within the community impact on economic indicators.

6.1. Revenue Sensitivity

As mentioned in the previous chapters, it is highly likely that the current transitional regime will be updated, and along with it, the incentive calculation algorithm will also be updated. It has been hypothesized that the unit value of the incentive will vary with the zonal hourly price of electricity (PZ), according to the recent draft of Italian support mechanisms. The formula considered is as follows:
Incentive [EUR/MWh] = min [120; 80 + max (0; 180 − PZ)]
From the formula, it can be inferred that the incentive will vary based on the zonal price (PZ), ranging from a minimum of 80 EUR/MWh to a maximum of 120 EUR/MWh. In this way, since the selling prices (RID) also vary with the zonal price, the REC can benefit from a higher incentive if the selling prices are low. Conversely, if the zonal price (and therefore the selling price) is high (above 180 EUR/MWh), then the incentive would be minimum (80 EUR/MWh).
Therefore, six scenarios (Case ID: 1–6) were simulated where the incentive value varies as the zonal price (equal to the selling price) changes. Subsequently, an additional six scenarios (Case ID: 7–12) were simulated with the same considerations as the first six cases, but with a lower grid electricity purchase price and therefore a lower economic value of self-consumed energy, equal to 200 EUR/MWh instead of 300 EUR/MWh.
Analyzing the results derived from the calculation of the Net Present Value (NPV) and the Simple Payback Period, it becomes evident that the most significant variable is the cost of purchasing electricity from the grid. Transitioning from 300 EUR/MWh to 200 EUR/MWh (−33%) leads to a decrease in NPV ranging from 69% (Case 1 compared to Case 7) to 39% (Case 6 compared to Case 12). It is then shown that for values of PZ between 140 EUR/MWh and 180 EUR/MWh (Cases 3, 4, and 5), the selling price (RID) increases linearly at the same rate at which the incentive decreases. However, in this case, as the PZ increases, the NPV also increases, since the additional revenue from the sale of electricity outweighs the additional loss resulting from the decrease in the incentive. This result was expected as the RID applies to all the energy fed into the grid, while the incentive only applies to the energy fed into the grid and shared with the renewable energy certificate (REC), which, in all considered cases, accounts for 55.5% of the energy fed into the grid.
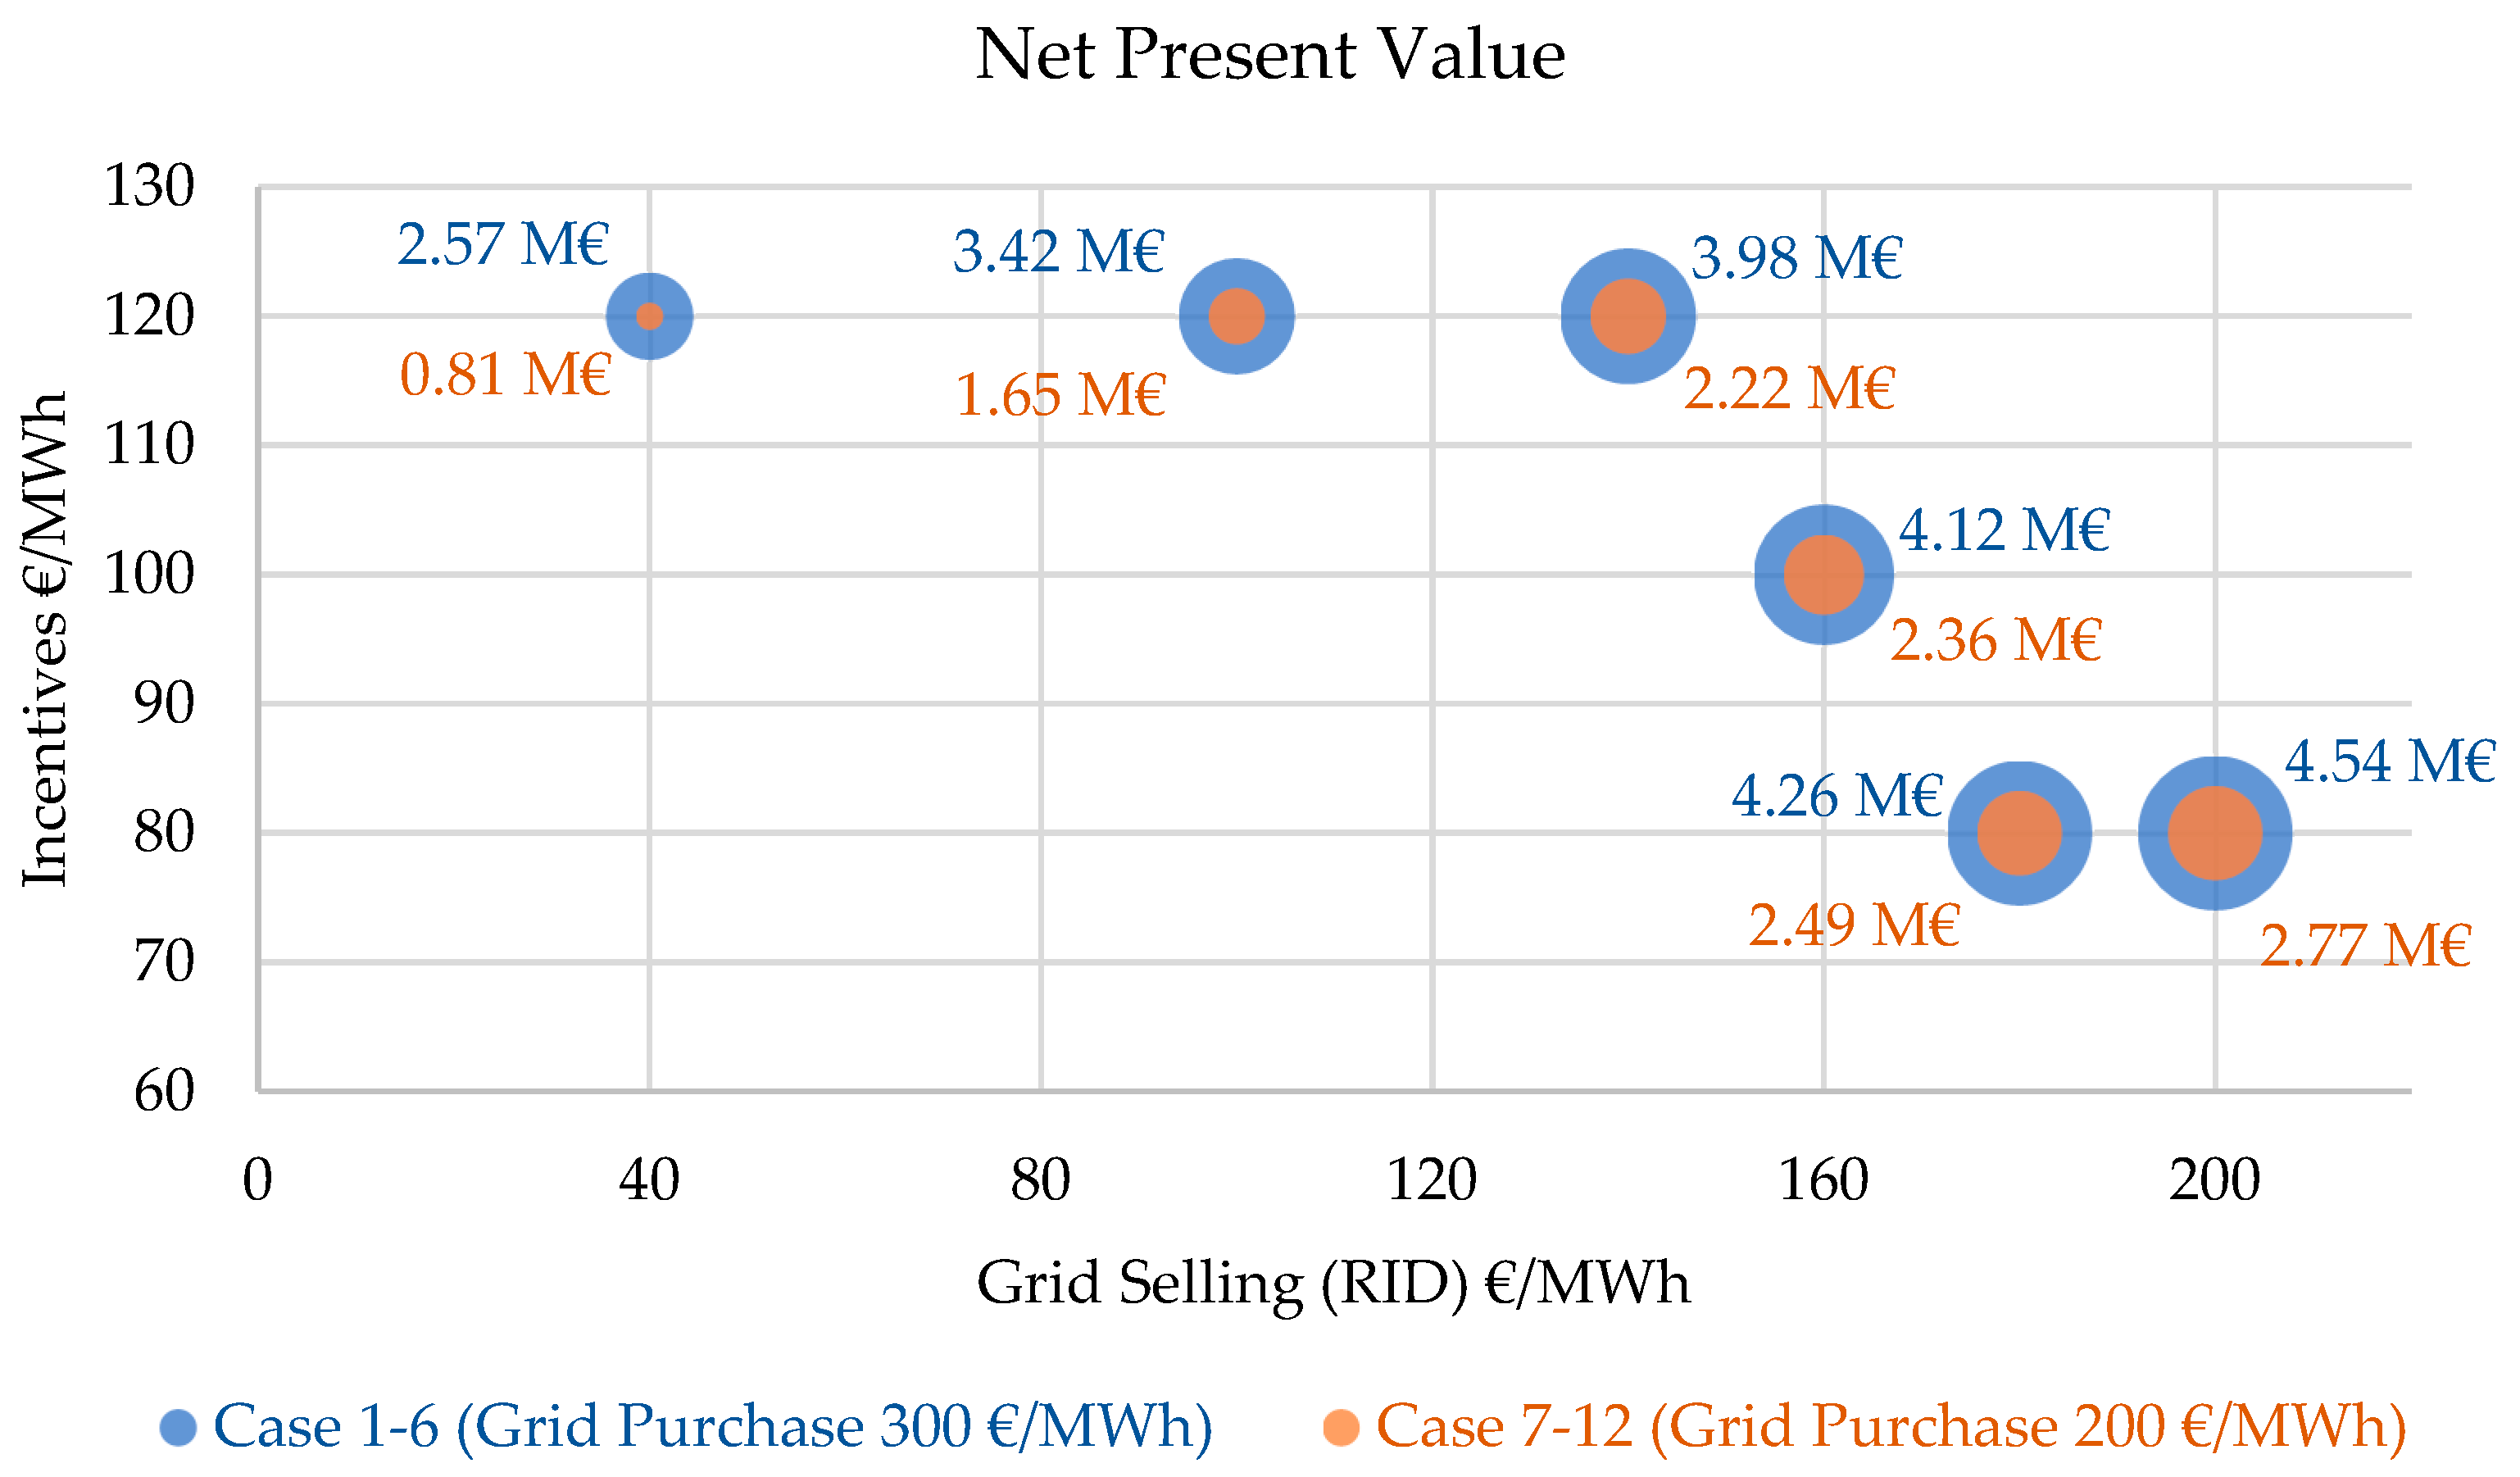
The graphical representation in Figure 7 provides a visual depiction of the data presented in Table 6. The x-axis varies the RID (assumed equal to the PZ), while the ordinates varies the incentive. See first of all how, for the PZ values below 140 EUR/MWh, the incentive is maximum and equal to 120 EUR/MWh. The incentive then decreases as the PZ increases and reaches 180 EUR/MWh, in which case, the incentive is worth 80 EUR/MWh. As the PZ then increases, a minimum incentive of 80 EUR/MWh is still guaranteed. The color of the indicators is blue if the value of self-consumption of energy from RES is 300 EUR/MWh, whereas if it falls to 200 EUR/MWh, it is orange. The radius that determines the area of the indicators varies linearly with the NPV.

6.2. Shared Energy Index

The economic analysis methodology described and applied so far, thanks to its automation, is highly versatile in evaluating different scenarios. Therefore, two configurations were studied (Intermediate Scenario, Optimal Scenario) with better energy performance compared to the described Base Scenario. Compared to the Base Scenario, the Intermediate Scenario assumes a higher percentage of shared energy (75%), while the Optimal Scenario assumes total sharing of energy fed into the grid by the base case (Table 7).
This provides information on the maximum incentive that the optimized base case can achieve. Furthermore, while keeping the members constant, both fixed costs (CAPEX) and operational costs (standard OPEX and 10th-year OPEX) remain unchanged in all scenarios. Taking into account the PUN (Unitary National Price) value’s trend prior to the significant fluctuations caused by the war in Ukraine and the values it has returned to today (May 23), Case 8 appears to be the most realistic for analyzing the economic parameters over a 20-year period. The described cases have been chosen to assess the variation in economic performance of the project in the case of a more rational energy use, with the Optimal Scenario representing the extreme value.
The increase in the percentage of physical self-consumption results in a decrease in revenue from electricity fed into the grid. This loss is compensated by the increase in savings from physical self-consumption, which has a greater impact on cash flows due to the higher value related to this energy usage. Therefore, in both alternative cases, there will be better economic performance compared to the base case, based on the economic indicators used, as reported in Table 8.
Thus, as the total self-consumption index increases, the project’s revenue significantly increases. This leads to a reduction in the payback period of the investment, and at the end of the useful life, a significantly higher net present value (NPV) is generated. Therefore, by only optimizing the consumption of the community members, it is possible to considerably increase the project’s profitability. Moreover, the most profitable economic parameters analyzed in the previous paragraph (Case 6) were applied to the Optimal Scenario. This allowed for the identification of the best possible scenario in terms of both sharing and economic profitability.
Ultimately, although the works analyzed in Section 2 did not use the same input variables, we can state that the results presented do not deviate from those analyzed in the literature. In particular, the result of the best-case scenario regarding the Simple Payback Period of 8 years is in line with those in the literature [28,29].

6.3. Potential of the Model and Replicability

First and foremost, in the proposed REC model, the role of public administration is crucial, as shown in Figure 8. The municipality is not only a member of the community, but is the aggregator and promoter of the REC. The impact on the REC’s implementation is significant, especially during the planning stage, with suitable actions such as the development of a cost–benefit analysis (preliminary feasibility analysis), estimation of the expected environmental, economic and social benefits (for members and for the area in which it operates), definition and proposal of the legal framework and rules for the management of the community, and the identification of the actors to be involved and their respective roles within the REC. At this stage, possible administrative barriers and solutions for their removal should be identified, as well as the potential audience of users to be aggregated as members of the community. Moreover, actively involving and gaining support from the community is crucial. A renewable energy community actively engages citizens and local stakeholders in the decision-making process and the implementation of renewable sources. This creates a sense of belonging and awareness among community members. Direct community involvement increases acceptance and reduces potential resistance or concerns regarding the impacts of the installations.
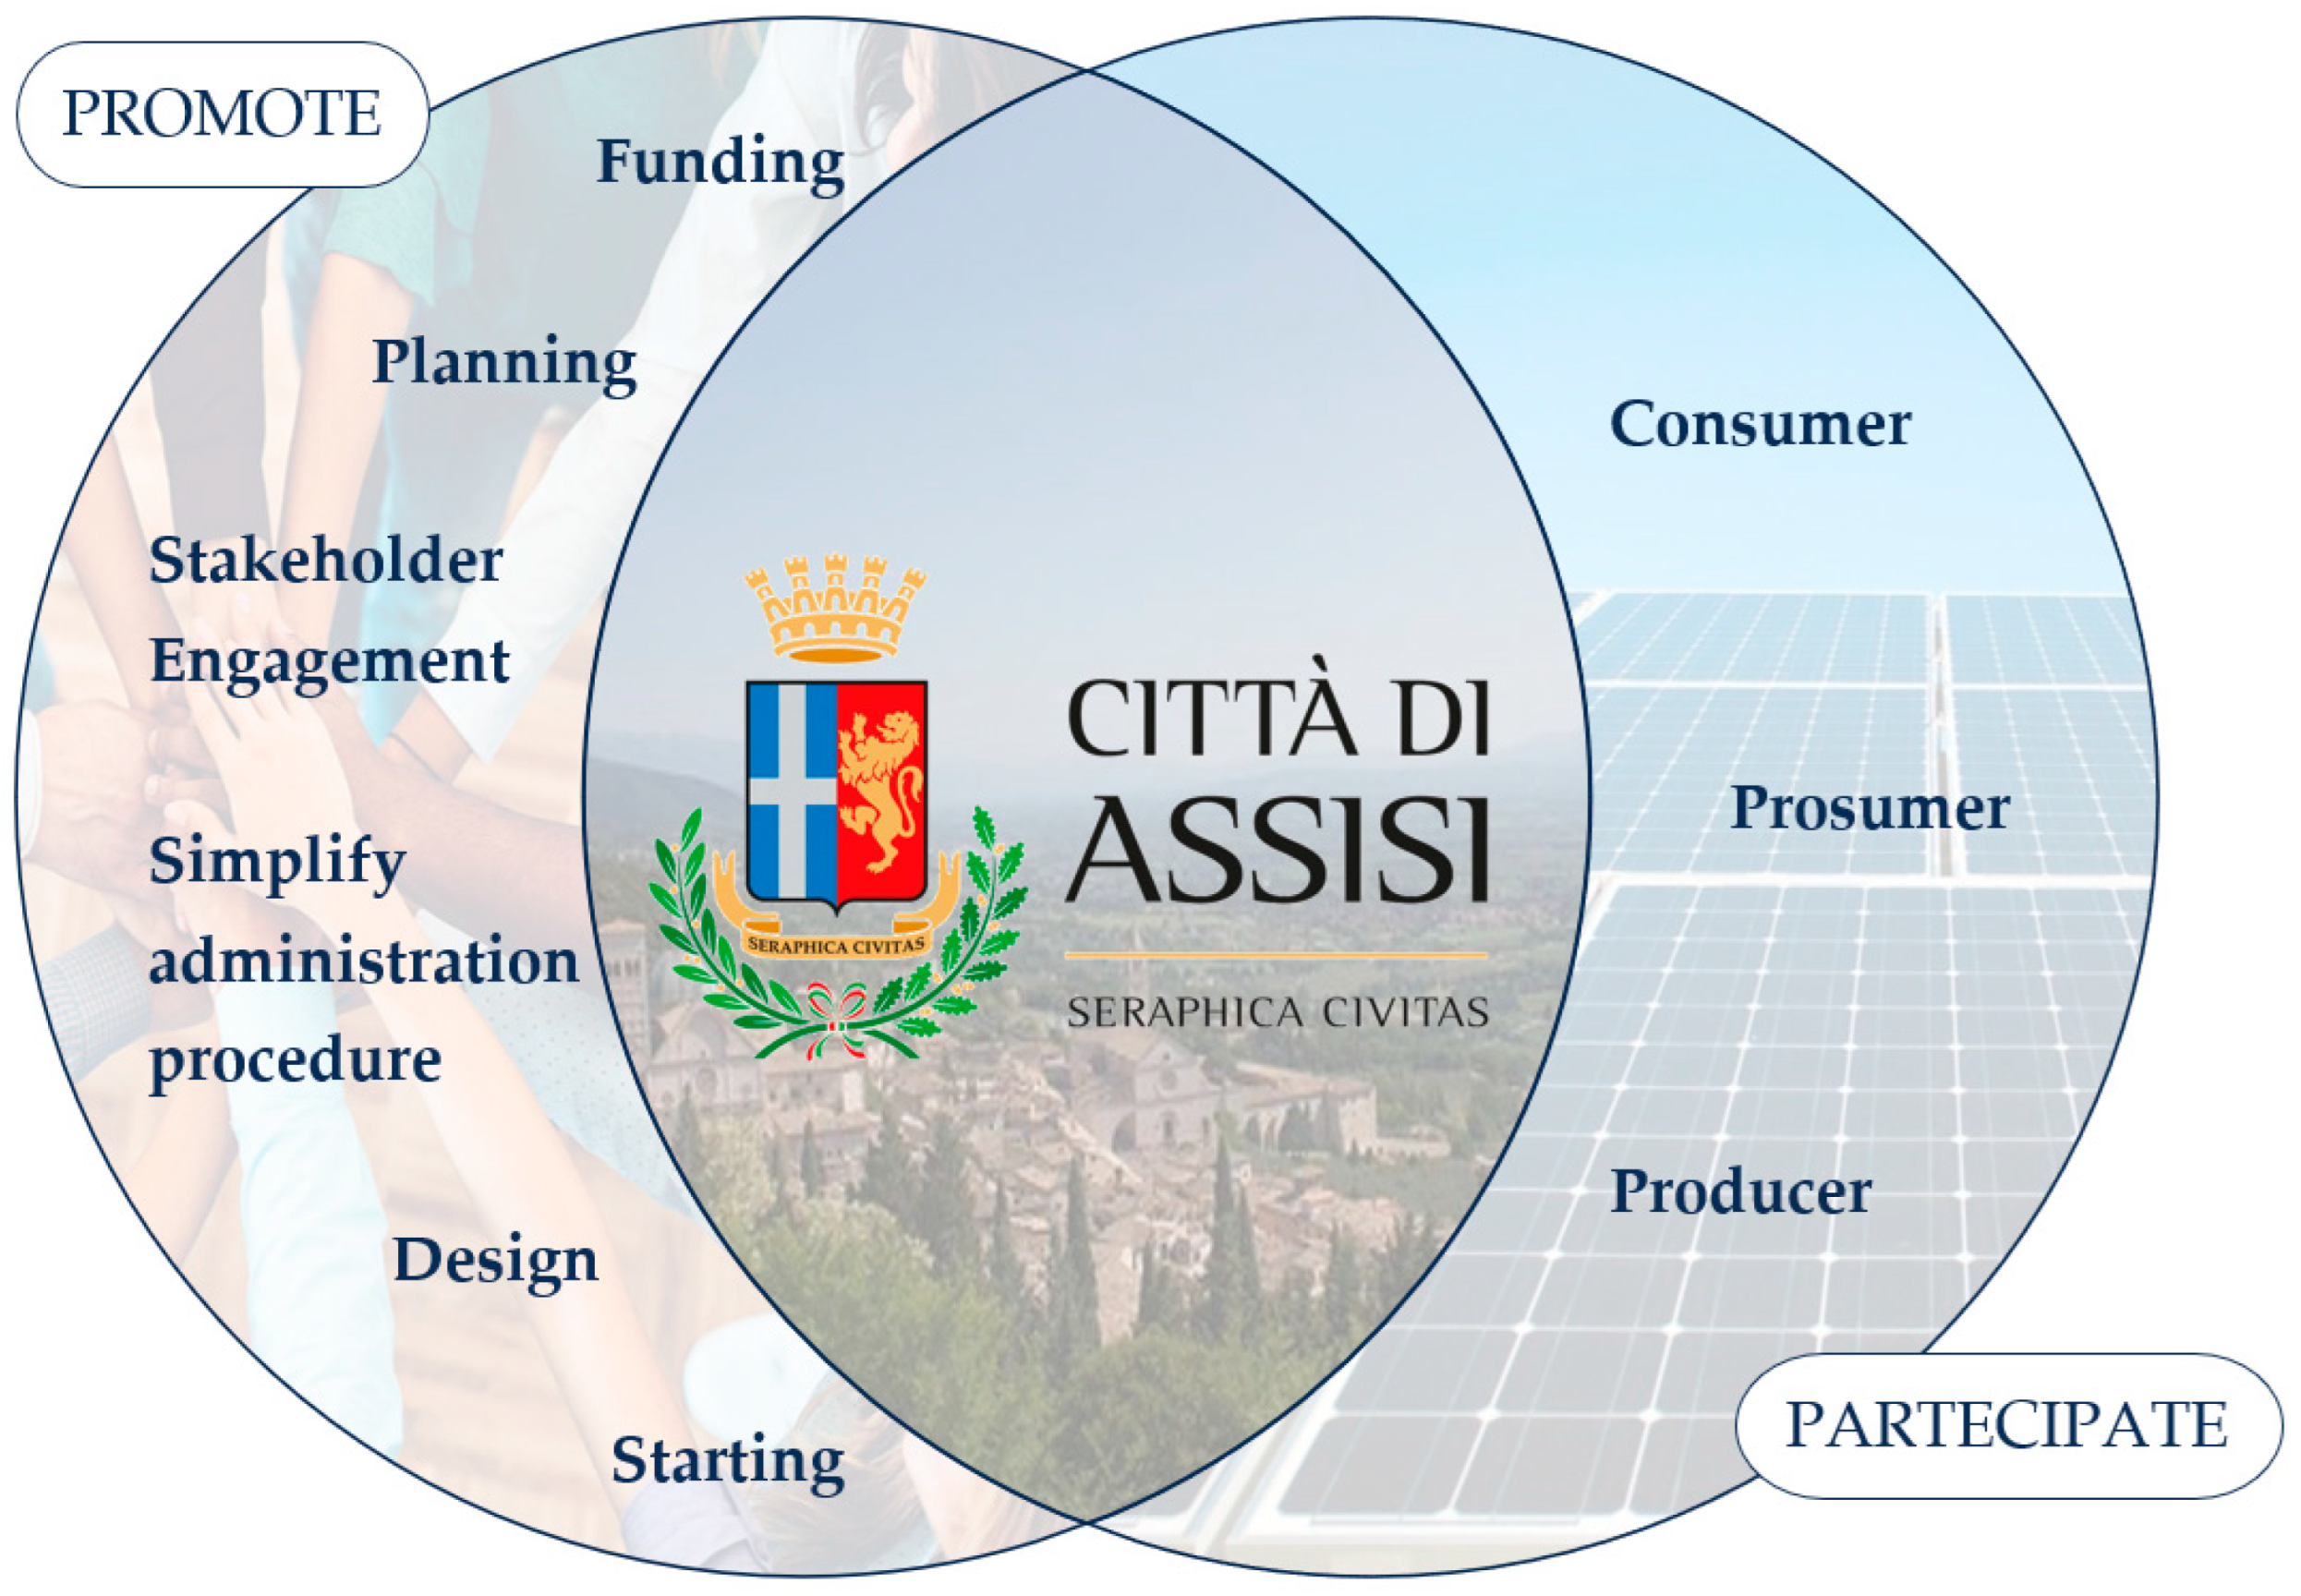
A strategy was defined to overcome the barriers (as shown in the SWOT analysis), which still prevent the creation of citizens’ energy communities, and a work plan, according to the PDCA (Plan, Do, Check, Act) approach, was set up (Figure 9). As the promoter of the REC, the municipality takes charge of relevant actions such as cost–benefit analysis, the proposal of the legal framework (suitable for both private and public members) and rules for the management of the community, and the identification and engagement of members.
The Municipality of Assisi is committed to implementing a range of tangible actions aimed at promoting renewable energy and fostering sustainable practices within the community. These actions include the establishment and operation of a citizen’s energy desk, which will serve as a valuable resource providing technical and practical support to residents, businesses, and other stakeholders, and the creation of a new section on the institutional website [50]. Additionally, the municipality plans to organize awareness conferences and thematic workshops, serving as catalysts to encourage individuals and businesses to enhance the energy efficiency of buildings and to facilitate the creation of the first energy community. In the meantime, a survey on renewable energy community was launched to raise awareness and engage new local stakeholders. Finally, the municipality is working on specific municipal regulations concerning new renewable energy plants, since municipal planning can be a non-negligible tool in promoting RECs (Figure 9).

7. Conclusions

A renewable energy community, especially when supported and driven by public administration, can overcome the limitations and barriers in implementing renewable energy installations, especially in Italy. The work presents the model of a top-down/PA-driven REC taking into account the case study of the Municipality of Assisi, Italy.
One of the fundamental aspects of the municipality’s approach is the active involvement and support of the local community. By establishing a renewable energy community, citizens and local stakeholders are actively engaged in the decision-making processes and the implementation of renewable energy sources. This participatory approach fosters a sense of ownership, belonging, and increased awareness among community members. Moreover, involving the community directly helps to build acceptance and mitigate potential resistance or concerns regarding the installation of renewable energy systems.
The cost–benefit analysis of different scenarios is the first and most relevant stage of REC planning and development. In particular, the Net Present Value (NPV) and Simple Payback Period estimated for the investigated REC (2 MWp total power by 2030) reveals that the cost of purchasing electricity from the grid is the most significant variable. Decreasing the cost from 300 EUR/MWh to 200 EUR/MWh leads to a significant reduction in NPV, ranging from 69% (Case 1 compared to Case 7) to 39% (Case 6 compared to Case 12). It has been considered that the incentive of 120 EUR/MWh starts to decrease as the selling price (RID), set equal to the electricity zonal price PZ, increases (for PZ values between 140 and 180 EUR/MWh). When the RID exceeds 180 EUR/MWh, the incentive paid is EUR 80 for each MWh of shared energy. However, in all considered scenarios, an increase in RID, even when causing a decrease in the incentive, leads to an improvement in economic indicators. Increasing the percentage of physical self-consumption also has a positive impact on revenue while reducing the dependence on the grid. This is offset by higher savings from self-consumption, leading to improved economic performance compared to the base case. As the total self-consumption index rises, the project’s revenue increases significantly, resulting in a shorter payback period and higher net present value. By optimizing community members’ consumption, the project’s profitability can be substantially enhanced. Applying the most profitable economic parameters from Case 6 to the optimal scenario identifies the best scenario in terms of sharing and economic profitability. The economic indicators are aligned with those reported in the literature and we can also state that this study has conducted a careful sensitivity analysis, demonstrating how economic indicators are strongly influenced by the considered economic variables. Moreover, the findings demonstrate the importance of maximizing self-consumption for financial success.
In conclusion, the development of a renewable energy community, particularly when driven and supported by the public administration, holds great potential for overcoming limitations and barriers in the implementation of renewable energy installations and for achieving the SECAP targets in terms of CO2 reductions. As a result of this work, a replicable model/action flow was proposed in order to implement medium-sized CERs with strong PA traction as an effective solution to overcome the limitations and difficulties in implementing renewable energy sources, especially in historic and small towns with landscape and architectural constraints.
The engagement of the community, participatory planning, utilization of local resources, stimulation of the local economy, and reduction in carbon emissions are all pivotal factors that contribute to addressing challenges and achieving a sustainable energy transition in the city. By embracing these strategies, the case study can emerge as a model for other municipalities seeking to establish resilient and environmentally conscious communities.

Author Contributions

Conceptualization, E.M. and E.S.; methodology, E.M. and E.S.; software, E.S.; validation, E.M. and E.S.; formal analysis, E.M.; investigation, E.M. and E.S.; resources, E.M. and E.S.; data curation, E.S.; writing—original draft preparation, E.S.; writing—review and editing, E.M.; visualization, E.S.; supervision, E.M.; project administration, E.M.; funding acquisition, E.M. All authors have read and agreed to the published version of the manuscript.

Funding

Part of this work was developed within the project “Towards a climate-neutral Assisi: the role of citizen and tourist in the city of Francesco in the postcovid new normal”, funded by the European Union under the European City Facility (EUCF, https://www.eucityfacility.eu/home.html, accessed on 30 May 2023) to the Municipality of Assisi (Contract number: 2021-203).

Institutional Review Board Statement

Not applicable.

Informed Consent Statement

Not applicable.

Data Availability Statement

Not applicable.

Acknowledgments

The authors would like to thank the Municipality of Assisi for their invaluable support throughout the research process and input data. The authors also would like to thank Michele Eugeni supporting the data elaboration, and Christian Cavazzoni for giving support in our economic analysis.

Conflicts of Interest

The authors declare no conflict of interest. The funders had no role in the design of the study; in the collection, analyses, or interpretation of data; in the writing of the manuscript; or in the decision to publish the results.

References

  1. Mišík, M.; Nosko, A. Post-pandemic lessons for EU energy and climate policy after the Russian invasion of Ukraine: Introduction to a special issue on EU green recovery in the post-COVID-19 period. Energy Policy 2023, 177, 113546. [Google Scholar] [CrossRef] [PubMed]
  2. Cassetti, G.; Boitier, B.; Elia, A.; Le Mouël, P.; Gargiulo, M.; Zagamé, P.; Nikas, A.; Koasidis, K.; Doukas, H.; Chiodi, A. The interplay among COVID-19 economic recovery, behavioural changes, and the European Green Deal: An energy-economic modelling perspective. Energy 2023, 263, 125798. [Google Scholar] [CrossRef] [PubMed]
  3. Ferriani, F.; Gazzani, A. The impact of the war in Ukraine on energy prices: Consequences for firms’ financial performance. Int. Econ. 2023, 174, 221. [Google Scholar] [CrossRef]
  4. Kuzemo, C.; Blondeel, M.; Dupont, C.; Brisbois, M.C. Russia’s war on Ukraine, European energy policy responses & implications for sustainable transformations. Energy Res. Soc. Sci. 2023, 93, 102842. [Google Scholar]
  5. Cui, L.; Yue, S.; Nghiem, X.; Duan, M. Exploring the risk and economic vulnerability of global energy supply chain interruption in the context of Russo-Ukrainian war. Resour. Policy 2023, 81, 103373. [Google Scholar] [CrossRef]
  6. UN General Assembly. Transforming Our World: The 2030 Agenda for Sustainable Development, 21 October 2015, A/RES/70/1, United Nations. Available online: https://sdgs.un.org/sites/default/files/publications/21252030%20Agenda%20for%20Sustainable%20Development%20web.pdf (accessed on 30 May 2023).
  7. European Commission. Fit for 55: Delivering the EU’s 2030 Climate Target on the Way to Climate Neutrality. 2021. Available online: https://eur-lex.europa.eu/legal-content/EN/TXT/HTML/?uri=CELEX:52021DC0550&from=EN (accessed on 30 May 2023).
  8. Khan, H.; Weili, L.; Bibi, R.; Khan, I. Innovations, energy consumption and carbon dioxide emissions in the global world countries: An empirical investigation. J. Environ. Sci. Econ. 2022, 4, 1225. [Google Scholar] [CrossRef]
  9. Raihan, A.; Chandra Voumik, L. Carbon Emission Dynamics in India Due to Financial Development, Renewable Energy Utilization, Technological Innovation, Economic Growth, and Urbanization. J. Environ. Sci. Econ. 2022, 4, 3650. [Google Scholar] [CrossRef]
  10. Jamil, M.N. Critical Analysis of Energy Consumption and Its Impact on Countries Economic Growth: An empirical analysis base on Countries income level. J. Environ. Sci. Econ. 2022, 2, 112. [Google Scholar] [CrossRef]
  11. Tatti, A.; Ferroni, S.; Ferrando, M.; Motta, M.; Causone, F. The Emerging Trends of Renewable Energy Communities’ Development in Italy. Sustainability 2023, 15, 6792. [Google Scholar] [CrossRef]
  12. Zatti, M.; Moncecchi, M.; Gabba, M.; Chiesa, A.; Bovera, F.; Merlo, M. Energy communities design optimization in the Italian framework. Appl. Sci. 2021, 11, 5218. [Google Scholar] [CrossRef]
  13. Lode, M.L.; Boveldt, G.; Coosemans, T.; Camargo, L.R. A transition perspective on Energy Communities: A systematic literature review and research agenda. Renew. Sustain. Energy Rev. 2022, 163, 112479. [Google Scholar] [CrossRef]
  14. Bovera, F.; Lo Schiavo, L. From energy communities to sector coupling: A taxonomy for regulatory experimentation in the age of the European Green Deal. Energy Policy 2022, 171, 113299. [Google Scholar] [CrossRef]
  15. Legambiente. Legambiente Rapporto Comunità Rinnovabili 2022; Legambiente: Rome, Italy, 2022. [Google Scholar]
  16. Krug, M.; Rosaria, M.; Nucci, D.; Caldera, M.; De Luca, E. Mainstreaming Community Energy: Is the Renewable Energy Directive a Driver for Renewable Energy Communities in Germany and Italy? Sustainability 2022, 14, 7181. [Google Scholar] [CrossRef]
  17. Haji Bashi, M.; De Tommasi, L.; Le Cam, A.; Relaño, L.S.; Lyons, P.; Mundó, J.; Pandelieva-Dimova, I.; Schapp, H.; Loth-Babut, K.; Egger, C.; et al. A review and mapping exercise of energy community regulatory challenges in European member states based ona survey of collective energy actors. Renew. Sustain. Energy Rev. 2023, 172, 113055. [Google Scholar] [CrossRef]
  18. EU Directive (EU). 2018/2001 of the European Parliament and of the Council of 11 December 2018 on the Promotion of the Use of Energy from Renewable Sources (Recast). Off. J. Eur. Union 2018, 2018, 82–209. [Google Scholar]
  19. European Parliament. Council of the European Union Directive (EU) 2019/944 on Common Rules for the Internal Market for Electricity and Amending Directive 2012/27/EU. Off. J. Eur. Union 2019, 18, 27–28. [Google Scholar]
  20. European Commission Clean Energy for All Europeans Package. Available online: https://energy.ec.europa.eu/topics/energy-strategy/clean-energy-all-europeans-package_en (accessed on 30 May 2023).
  21. Decreto Legge. 30 Dicembre 2019, n. 162. Coordinato con la Legge di Conversione 28 Febbraio 2020, n. 8, Recante: ‘Disposizioni Urgenti in Materia di Proroga di Termini Legislativi, di Organizzazione delle Pubbliche Amministrazioni, Nonché di Innovazione Tecnologica’; Gazzetta Ufficiale della Repubblica Italiana: Rome, Italy, 2019. [Google Scholar]
  22. Decreto Legislativo. 8 Novembre 2021, n. 199. Attuazione della Direttiva (UE) 2018/2001 del Parlamento Europeo e del Consiglio, dell’11 Dicembre 2018, Sulla Promozione dell’uso Dell’energia da Fonti Rinnovabili; Gazzetta Ufficiale Della Repubblica Italiana: Rome, Italy, 2021. [Google Scholar]
  23. GSE. Energia e Clima in Italia—Rapporto Trimestrale Q4/2022–2023. Available online: https://www.gse.it/dati-e-scenari/rapporti (accessed on 30 June 2023).
  24. Tarpani, E.; Piselli, C.; Fabiani, C.; Pigliautile, I.; Kingma, E.J.; Pioppi, B.; Pisello, A.L. Energy Communities Implementation in the European Union: Case Studies from Pioneer and Laggard Countries. Sustainability 2022, 14, 12538. [Google Scholar] [CrossRef]
  25. Cirone, D.; Bruno, R.; Bevilacqua, P.; Perrella, S.; Arcuri, N. Techno-Economic Analysis of an Energy Community Based on PV and Electric Storage Systems in a Small Mountain Locality of South Italy: A Case Study. Sustainability 2022, 14, 13877. [Google Scholar] [CrossRef]
  26. Ceglia, F.; Esposito, P.; Faraudello, A.; Marrasso, E.; Rossi, P.; Sasso, M. An energy, environmental, management and economic analysis of energy efficient system towards renewable energy community: The case study of multi-purpose energy community. J. Clean. Prod. 2022, 369, 133269. [Google Scholar] [CrossRef]
  27. Efthymiou, E.N.; Yfanti, S.; Kyriakarakos, G.; Zervas, P.L.; Langouranis, P.; Terzis, K.; Stavrakakis, G.M. A Practical Methodology for Building a Municipality-Led Renewable Energy Community: A Photovoltaics-Based Case Study for the Municipality of Hersonissos in Crete, Greece. Sustainability 2022, 14, 12935. [Google Scholar] [CrossRef]
  28. Hoppe, T.; Graf, A.; Warbroek, B.; Lammers, I.; Lepping, I. Local Governments Supporting Local Energy Initiatives: Lessons from the Best Practices of Saerbeck (Germany) and Lochem (The Netherlands). Sustainability 2015, 7, 1900–1931. [Google Scholar] [CrossRef] [Green Version]
  29. Bourdin, S.; Nadou, F. The role of a local authority as a stakeholder encouraging the development of biogas: A study on territorial intermediation. J. Environ. Manag. 2020, 258, 110009. [Google Scholar] [CrossRef] [PubMed]
  30. Botsaris, P.N.; Giourka, P.; Papatsounis, A.; Dimitriadou, P.; Goitia-Zabaleta, N.; Patsonakis, C. Developing a Business Case for a Renewable Energy Community in a Public Housing Settlement in Greece—The Case of a Student Housing and Its Challenges, Prospects and Barriers. Sustainability 2021, 13, 3792. [Google Scholar] [CrossRef]
  31. SECAP (Piano d’Azione per l’Energia Sostenibile e il Clima) Città di Assisi, October 2020. Available online: https://www.comune.assisi.pg.it/wp-content/uploads/2022/08/31_8_2022_SECAP.pdf (accessed on 30 May 2023).
  32. Stamponi, E.; Cardinali, M.; Fondacci, L.; Moretti, E.; Cotana, F.; Proietti, S.; Broccolo, B.M.; Fortini, P. The role of the citizen in sustainability: The Sustainable Energy and Climate Action Plan for the Municipality of Assisi. In Atti del XXI Congresso Nazionale CIRIAF 2021; Morlacchi Editore University Press: Perugia, Italy, 2021; pp. 266–277. [Google Scholar]
  33. GSE. Atlaimpianti. Available online: https://atla.gse.it/atlaimpianti/project/Atlaimpianti_Internet.html (accessed on 30 May 2023).
  34. De Santi, F.; Moncecchi, M.; Prettico, G.; Fulli, G.; Olivero, S.; Merlo, M. To Join or Not to Join? The Energy Community Dilemma:An Italian Case Study. Energies 2022, 15, 7072. [Google Scholar] [CrossRef]
  35. Di Silvestre, M.L.; Ippolito, M.G.; Sanseverino, E.R.; Sciumè, G.; Vasile, A. Energy self-consumers and renewable energy communities in Italy: New actors of the electric power systems. Renew. Sustain. Energy Rev. 2021, 151, 111565. [Google Scholar] [CrossRef]
  36. Cosic, A.; Stadler, M.; Mansoor, M.; Zellinger, M. Mixed-integer linear programming based optimization strategies for renewable energy communities. Energy 2021, 237, 121559. [Google Scholar] [CrossRef]
  37. Moretti, E.; Stamponi, E.; Stoklin, S.; Eugeni, M.; Cavazzoni, C.; Marchetti, M.L.; Fortini, P.; Proietti, S. La prima Comunità Energetica rinnovabile di Assisi: Analisi tecnico-economica e legale. In Proceedings of the XXIII Congresso Nazionale CIRIAF “Sviluppo Sostenibile, Tutela dell’Ambiente e della Salute Umana”, Perugia, Italy, 13–14 April 2023; Morlacchi Editore University Press: Perugia, Italy, 2023; pp. 349–368, ISBN 978-88-9392-442-9. (In Italian). [Google Scholar]
  38. De Lotto, R.; Micciché, C.; Venco, E.M.; Bonaiti, A.; De Napoli, R. Energy Communities: Technical, Legislative, Organizational, and Planning Features. Energies 2022, 15, 1731. [Google Scholar] [CrossRef]
  39. Barnes, J.; Hansen, P.; Kamin, T.; Golob, U.; Musolino, M.; Nicita, A. Energy communities as demand-side innovators? Assessing the potential of European cases to reduce demand and foster flexibility. Energy Res. Soc. Sci. 2022, 93, 102848. [Google Scholar] [CrossRef]
  40. ARERA. Comunicato: Aggiornamento dei Prezzi Minimi Garantiti per L’anno. 2022. Available online: https://www.arera.it/it/comunicati/22/220118.htm (accessed on 30 June 2023).
  41. MiSE—Ministry of Economic Development. Decreto Ministeriale 16 Settembre 2020—Individuazione della Tariffa Incentivante per la Remunerazione degli Impianti a Fonti Rinnovabili Inseriti Nelle Configurazioni Sperimentali di Autoconsumo Collettivo e Comunità Energetiche Rinnovabili; MiSE—Ministry of Economic Development: Rome, Italy, 2020; p. 39.
  42. Ghiani, E.; Trevisan, R.; Rosetti, G.L.; Olivero, S.; Barbero, L. Energetic and Economic Performances of the Energy Community of Magliano Alpi after One Year of Piloting. Energies 2022, 15, 7439. [Google Scholar] [CrossRef]
  43. Cielo, A.; Margiaria, P.; Lazzeroni, P.; Mariuzzo, I.; Repetto, M. Renewable Energy Communities business models under the 2020 Italian regulation. J. Clean. Prod. 2021, 316, 128217. [Google Scholar] [CrossRef]
  44. Volpato, G.; Carraro, G.; Cont, M.; Danieli, P.; Rech, S.; Lazzaretto, A. General guidelines for the optimal economic aggregation of prosumers in energy communities. Energy 2022, 258, 124800. [Google Scholar] [CrossRef]
  45. Kyriakopoulos, G.L. Energy Communities Overview: Managerial Policies, Economic Aspects, Technologies, and Models. J. Risk Financ. Manag. 2022, 15, 521. [Google Scholar] [CrossRef]
  46. Ceglia, F.; Marrasso, E.; Samanta, S.; Sasso, M. Addressing Energy Poverty in the Energy Community: Assessment of Energy, Environmental, Economic, and Social Benefits for an Italian Residential Case Study. Sustainability 2022, 14, 15077. [Google Scholar] [CrossRef]
  47. ARERA. Delibera EEN 3/08 Aggiornamento del Fattore di Conversione dei kWh in Tonnellate Equivalenti di Petrolio Connesso al Meccanismo dei titoli di Efficienza Energetica. 2008. Available online: https://www.arera.it/it/docs/08/003-08een.htm (accessed on 1 April 2023).
  48. ISPRA. RAPPORTI 363/2022 Indicatori di Efficienza e Decarbonizzazione del Sistema Energetico Nazionale e del Settore Elettrico. 2022. Available online: https://www.isprambiente.gov.it/resolveuid/9d1b5539c2b54f629f1a9e52416d5727 (accessed on 1 April 2023).
  49. Damodaran, A. β Unlevered Corrected for Cash by Sector, Based on Listed Companies. 2022. Available online: https://pages.stern.nyu.edu/~adamodar/New_Home_Page/datafile/Betas.html (accessed on 30 November 2022).
  50. Available online: https://www.comune.assisi.pg.it/assisi-2050-una-citta-carbon-neutral/ (accessed on 30 May 2023).
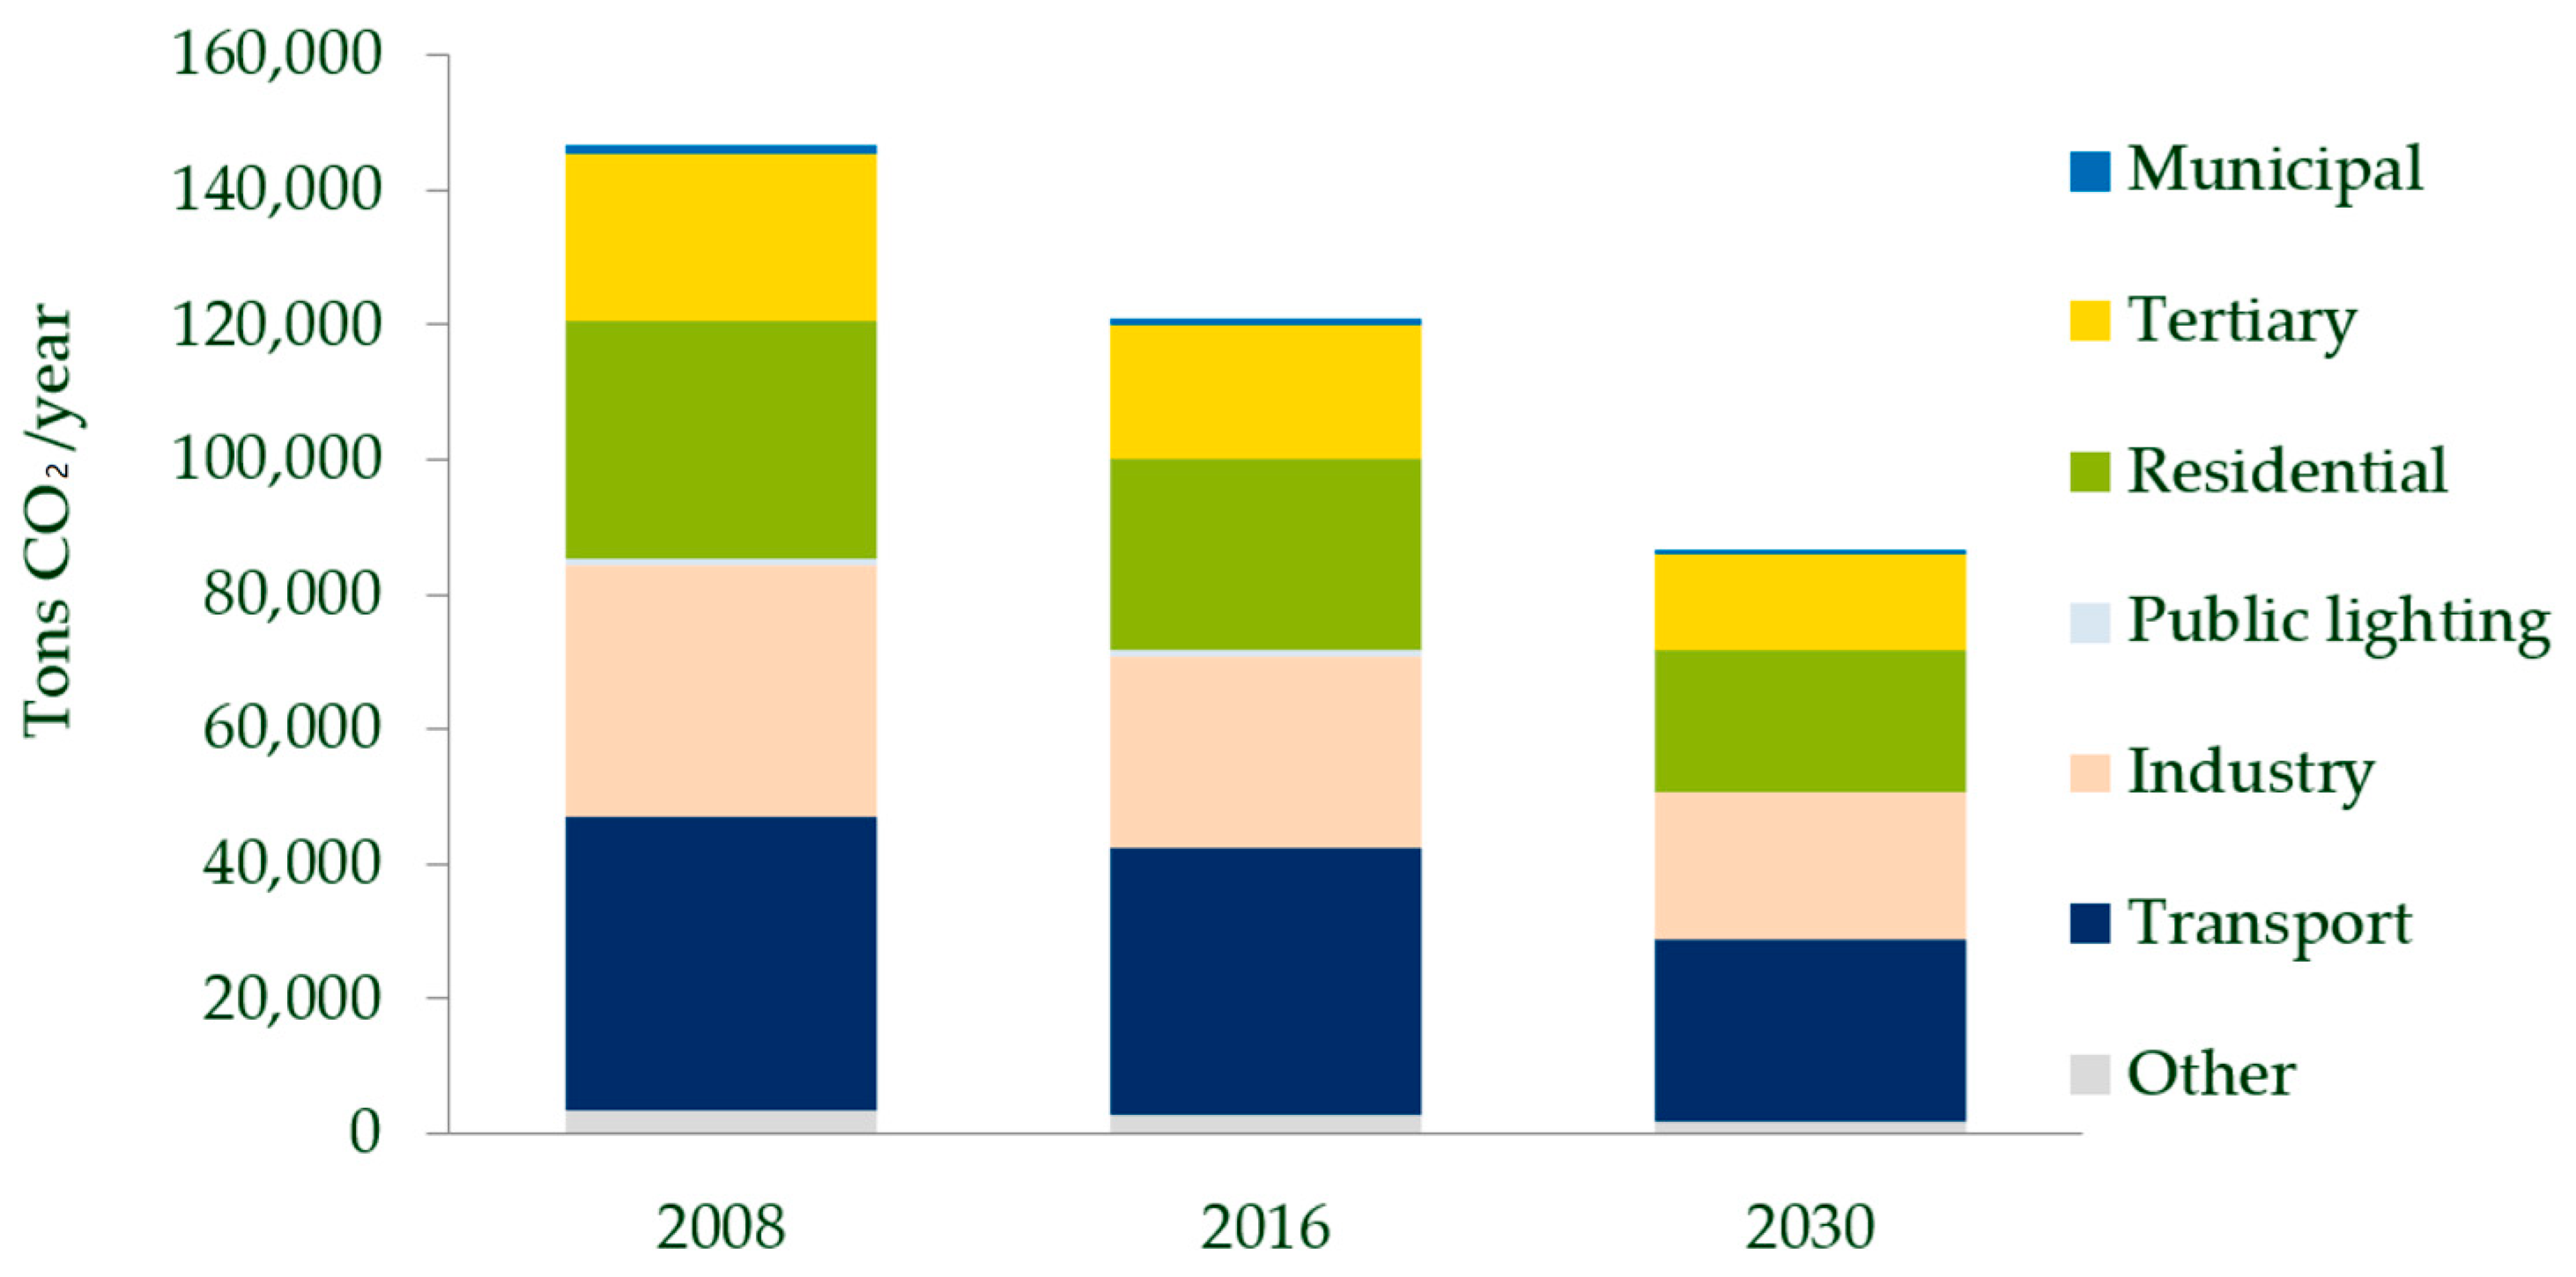
Figure 1. Outline of the SECAP (adapted from [31]).
Sustainability 15 11869 g001
Figure 2. Photovoltaic systems in Assisi by power (number and %)—”Atlaimpianti, Jul. 2021—GSE”.
Sustainability 15 11869 g002
Figure 3. Trends and scenarios to 2030 of installed photovoltaic capacity.
Sustainability 15 11869 g003
Figure 4. SWOT analysis of the proposed model of municipality-led REC.
Sustainability 15 11869 g004
Figure 5. REC area map in the Municipality of Assisi. [37].
Sustainability 15 11869 g005
Figure 6. Cumulative cash flow trends (adapted from [37]).
Sustainability 15 11869 g006
Figure 7. Alternative configurations—Net Present Values.
Sustainability 15 11869 g007
Figure 8. Roles of Municipality of Assisi in the REC.
Sustainability 15 11869 g008
Figure 9. PDCA approach for RECs.
Sustainability 15 11869 g009
Table 1. REC configuration (adapted from [37]).
ClusterType of
Users
Number of
Users
Peak Power
Photovoltaic Systems 1 (kWp)
Annual
Electricity
Consumption 2 (kWh)
PProducer150-
AProsumer51991,000,000
BProsumer599500,000
CProsumer450200,000
DProsumer1010100,000
EProsumer404120,000
MConsumer23-1,021,940
RConsumer200-600,000
Total 28820003,556,680
1 Power of a single user photovoltaic plant. 2 Consumption of the whole cluster.
Table 2. Energy parameters (adapted from [37]).
ParameterValue 1
Energy consumption (MWh)3557
Photovoltaic production (MWh)2392
Physical self-consumption (MWh)1219
Physical self-consumption index (%)51.0
Energy fed into the grid (MWh)1173
Energy fed into the grid (% of production)49.0
Energy withdrawn (MWh)2338
Shared energy (MWh)651
Shared energy (% of grid fed in)55.5
Virtual self-consumption index (%)27.2
Total self-consumption index (%)78.2
Energy self-sufficiency index (%)52.6
1 All values were assessed over a one-year time frame.
Table 3. Environmental parameters (adapted from [37]).
ParameterAnnual Value
Tons of oil equivalent saved447
Tons of CO2 avoided610
Table 4. Cost and revenues items (adapted from [37]).
ParameterValue
CAPEX (EUR)2,973,180
OPEX (EUR/yr)88,140
OPEX in the 10th year (EUR)384,930
Revenue from energy sales (RID) (EUR/yr) 45,990
Physical self-consumption (EUR/yr)380,990
Revenue from incentive of shared energy (EUR/yr)74,010
Table 5. Economic parameters [37].
ParameterAnnual Value
Net Present Value (NPV) (EUR)2,575,707
Simple Payback Period (year)10
Discounted Payback Period (year)11
Internal Rate of Return (IRR) (%)13.94
Table 6. Alternative configurations.
Case
ID
Grid Purchase (EUR/MWh)PZ (RID)
(EUR/MWh)
Incentives
(EUR/MWh)
NPV
(EUR)
Simple Payback Period (Year)
1300401202,572,96910
21001203,419,4839
31401203,983,8269
41601004,120,2779
5180804,256,7299
6200804,538,9008
720040120808,14214
81001201,654,65612
91401202,218,99811
101601002,355,45010
11180802,491,90110
12200802,774,07310
Table 7. Alternative configurations [37].
ScenarioPhysical Self-
Consumption Index
Shared Energy
(% of Grid Fed in)
Total Self-
Consumption Index
Base51%56%78%
Intermediate63%75%91%
Optimal70%100%100%
Table 8. Economic parameters.
ParameterBase
Scenario
(Case 8)
Intermediate
Scenario
Optimal
Scenario
Best-Case Scenario
Net Present Value (NPV) (EUR)1,654,6562,086,9652,420,2235,316,254
Simple Payback Period (year)1211108
Discounted Payback Period (year)1312118
Internal Rate of Return (IRR) (%)10.37%12.08%13.37%24.76%
Disclaimer/Publisher’s Note: The statements, opinions and data contained in all publications are solely those of the individual author(s) and contributor(s) and not of MDPI and/or the editor(s). MDPI and/or the editor(s) disclaim responsibility for any injury to people or property resulting from any ideas, methods, instructions or products referred to in the content.