Article

Impacts of Crop Production and Value Chains on Household Food Insecurity in Kwazulu-Natal: An Ordered Probit Analysis

School of Agricultural, Earth, and Environmental Sciences, University of KwaZulu-Natal, Pietermaritzburg 3201, South Africa
*
Author to whom correspondence should be addressed.
Sustainability 2024, 16(2), 700; https://doi.org/10.3390/su16020700
Submission received: 1 October 2023 / Revised: 9 January 2024 / Accepted: 12 January 2024 / Published: 12 January 2024

Abstract

:
Household food insecurity persists in the KwaZulu-Natal Province, South Africa, despite the significant contribution of agriculture to the country’s economy. The role that the combination of crop production systems and value chains can play in improving household food security has yet to be addressed. This paper examines the combined effects of crop production systems and value chains on household food insecurity. A Principal Component Analysis (PCA) transformed the correlated variables into three distinct domains, namely, modern agro-production practices, sustainable market integration, and traditional knowledge. An Ordered Probit Analysis was used to determine the factors that influence household food insecurity. Household food insecurity was measured using the Household Food Insecurity Access Scale (HFIAS) using 300 randomly selected smallholder farmers. The results showed that sustainable market integration, traditional knowledge focus, education, and livestock ownership significantly and negatively impact a household’s food insecurity. A household’s size, food expenditure, and cash credit, as well as floods, significantly and positively affect its food insecurity. Policymakers and stakeholders should prioritise the integration of a sustainable market and the preservation of traditional knowledge, while reducing the food costs, in order to combat household food insecurity.

1. Introduction

Agriculture plays a significant role in many nations, by driving both economic growth and employment opportunities, especially in sub-Saharan Africa, where the issue of food insecurity continues to be a significant challenge [1]. The KwaZulu-Natal Province in South Africa has a diverse agricultural sector, which contributes significantly to national food production [2]. However, household food insecurity remains a pressing issue, with a substantial part of the population experiencing inadequate access to safe and nutritious food [3].
Recent impactful events, including the COVID-19 pandemic, Russia’s war in Ukraine, and the devastating KZN floods, have significantly compromised food security in South Africa. While the nation is deemed food secure at the national level, according to Stats S.A., the scenario shifts at the household level, with nearly 20% of households grappling with food insecurity. In 2023, approximately 20% (1 in 5) of South Africans faced food insecurity [4].
Within the realms of moderate and severe food insecurity, the female and black population groups emerged as the most affected. A multitude of factors contribute to this predicament, including poverty, unemployment, income inequality, climate change, the cost of living, unstable food production, past spatial imbalances, and the capacity to produce food [5]. A study by the Integrated Food Security Phase Classification (IFSPC) body underscores the COVID-19 pandemic mitigation measures, escalating food prices, drought, and the country’s economic decline as primary causes of food insecurity in South Africa.
To address the persistent issue of food insecurity, studies like [6,7,8,9] have been conducted to examine the relationship between agricultural practices and food security. However, according to the authors’ knowledge, no studies have focused specifically on the interaction between crop production systems and value chains and their relationship with household food insecurity in South Africa. Refs. [10,11,12,13] focused on crop production systems and their impact on household food security, but they overlooked the role of value chains. Similarly, Refs. [14,15,16,17] explored the impact of value chains on household food security, but they neglected the role played by specific crop production systems. The research conducted to date demonstrates the need to understand the combined impact of crop production systems and value chains on household food security.
This study recognises that the impact of production systems cannot be viewed in isolation from the broader value chains within which they operate [18]. The value chain describes the full range of activities that are required to bring a product or service from conception through the different phases of production (involving a combination of physical transformation and the input of various producer services), delivery to final consumers, and final disposal after use [17]. According to [19], both crop production systems and value chains can allow for a comprehensive understanding of the factors that influence household food security.

2. Materials and Methods

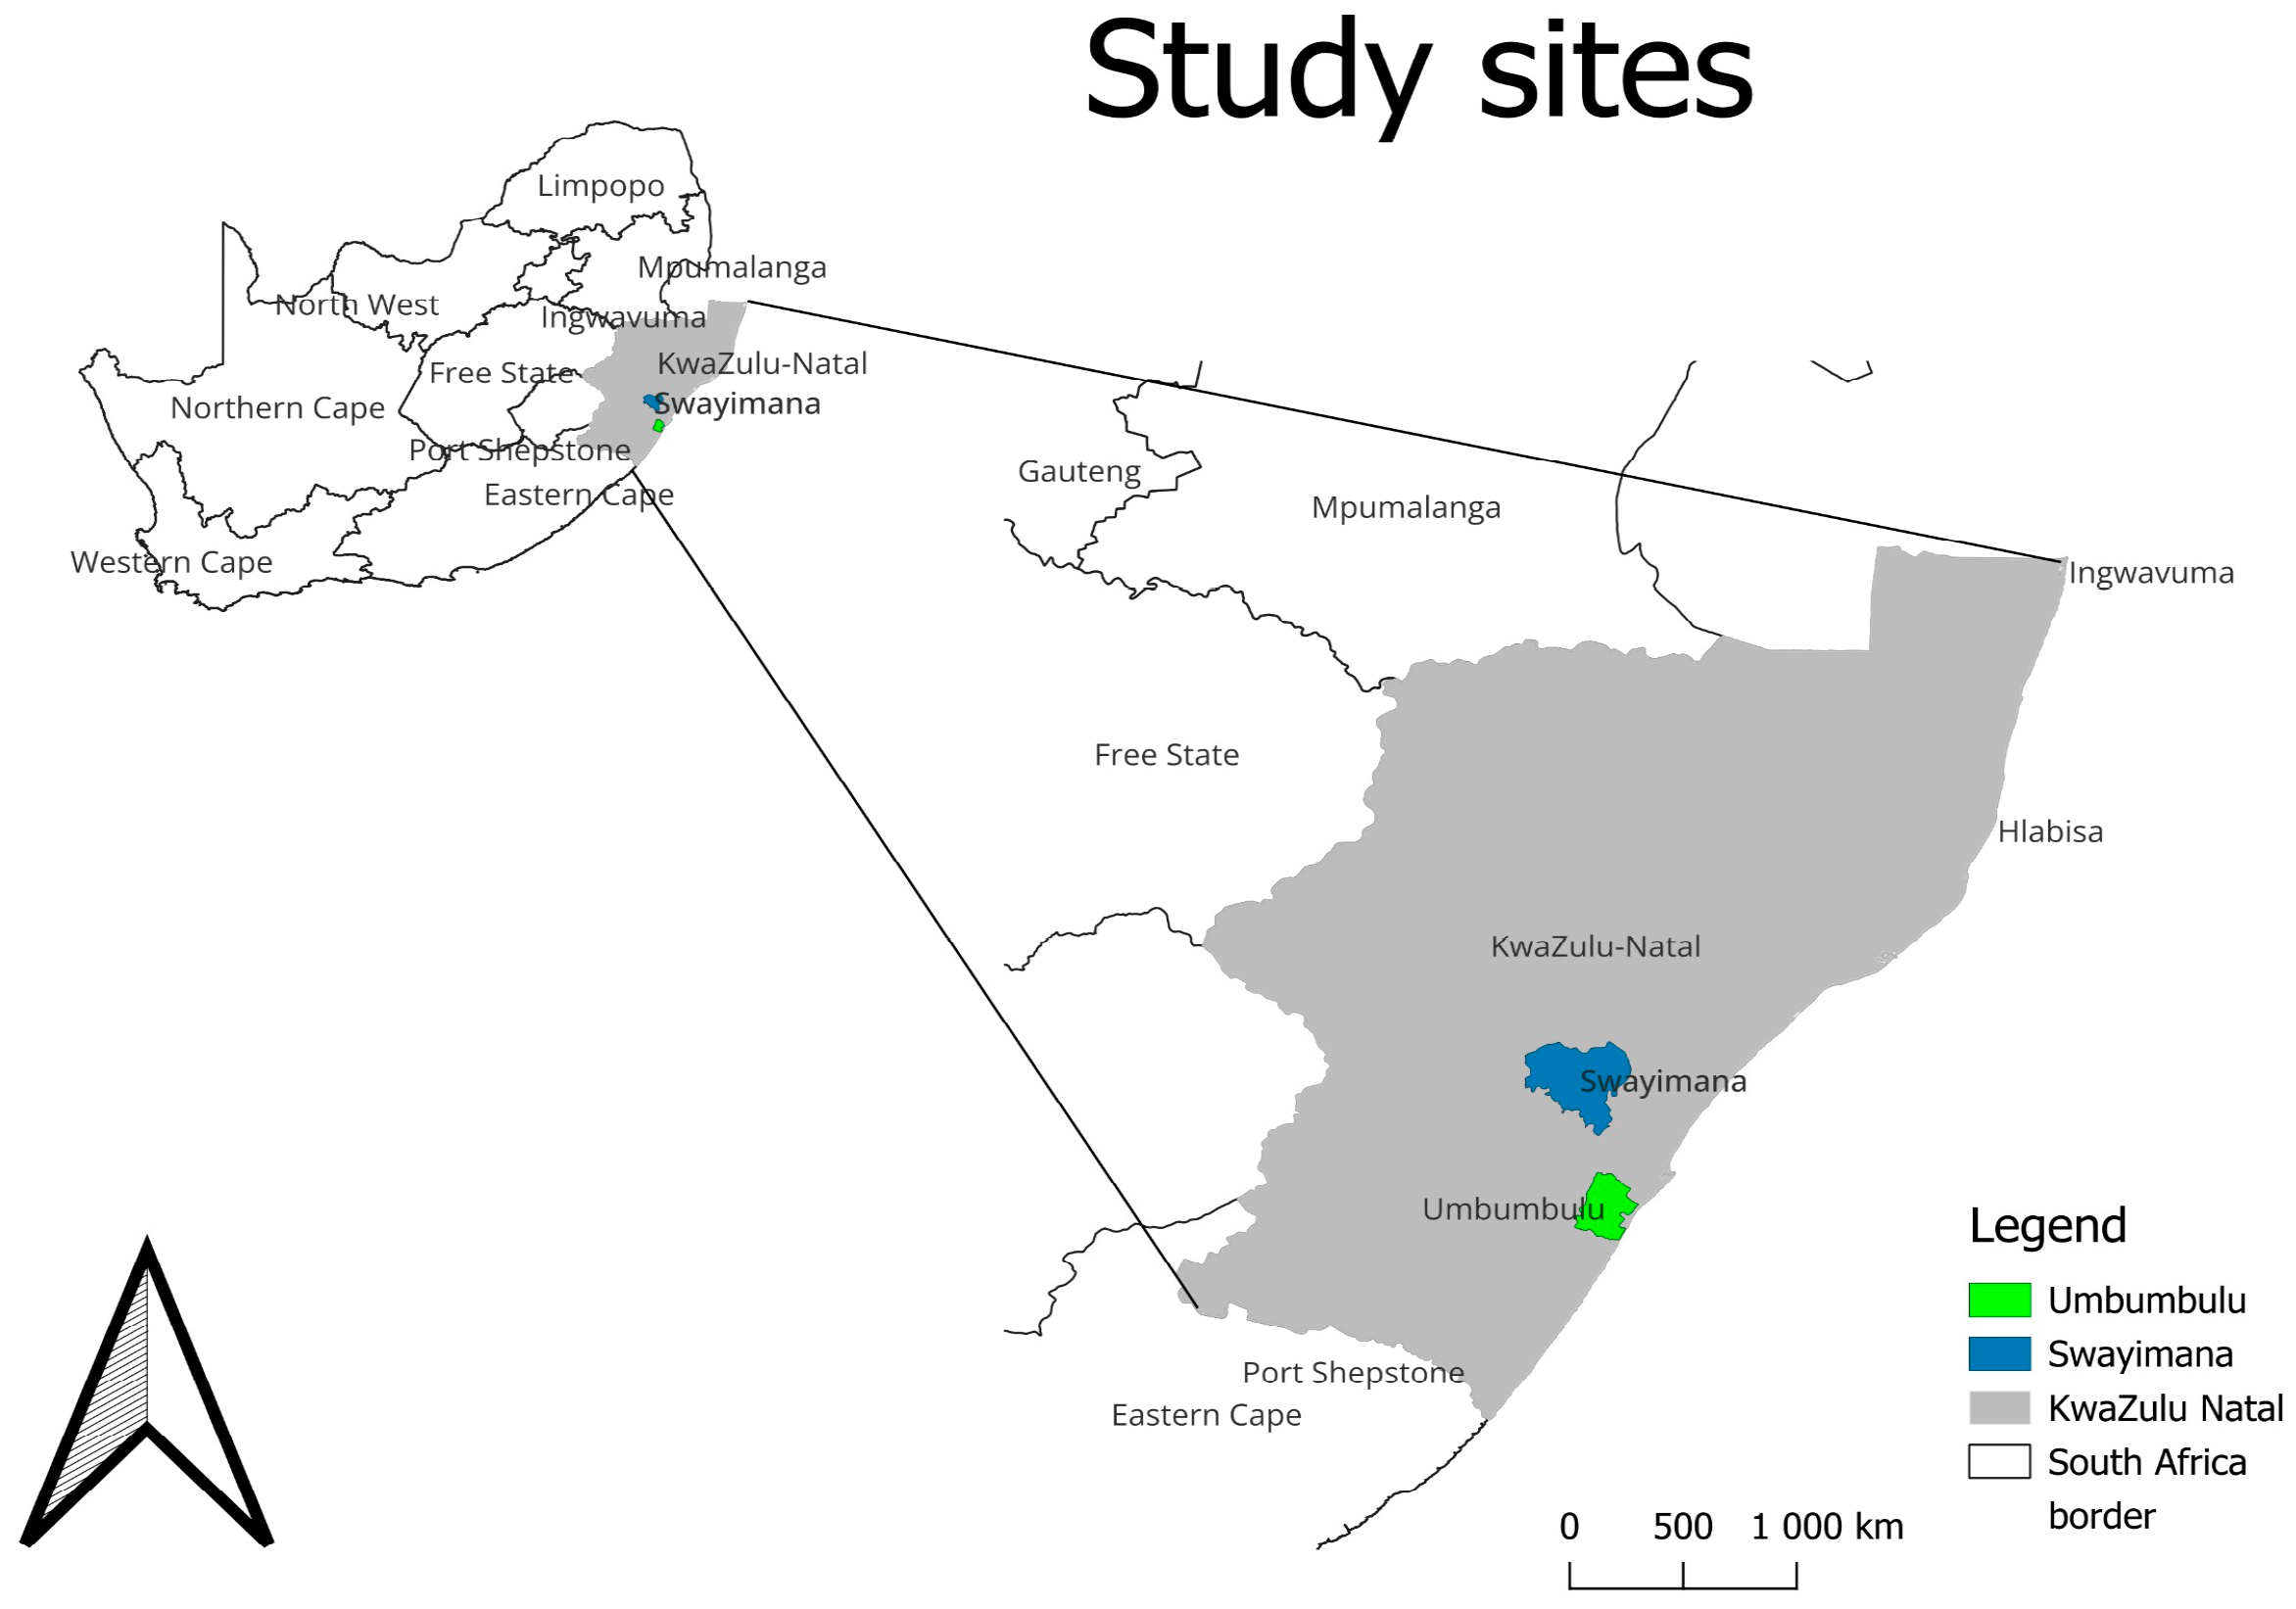
2.1. Study Site and Sampling Procedure

Two rural areas (Swayimana and Umbumbulu) in the KwaZulu-Natal Province were selected for this study as shown in Figure 1. These two rural areas were chosen because they represent the typical socio-economic, biological, and demographic characteristics of KwaZulu-Natal. Swayimana is in the uMgungundlovu District Municipality (UDM), under the Mshwati Local Municipality, and Umbumbulu is in the eThekwini Metropolitan Municipality.
The uMgungundlovu District Municipality is in KwaZulu-Natal and is comprised of seven local municipalities that are connected to different towns [20]. This study focused on Swayimana based on its bioresources, socio-economic, and demographic categories. The region receives an average of 600 to 1200 mm of rain annually, with Swayimana specifically receiving 600 to 1100 mm [21]. Swayimana is part of the humid Midlands in the mist belt. The average temperature ranges from 11.8 °C to 24.0 °C, with Swayimana having an average temperature of 17 °C. The Midlands have dry winters and warm, wet, and cold summers [21]. The soil is a productive type of clay loam.
The Umbumbulu region is part of the eThekwini Metropolitan Municipality in the coastal area of KwaZulu-Natal. The annual rainfall in Umbumbulu is 956 mm [22], which is abundant for agriculture, with most rain falling between November and March. Smallholder farming in the region starts in September or October before the start of the rainy season. The maximum and minimum temperatures in Umbumbulu are 24.0 °C and 13.4 °C, respectively [22]. According to [23], 15% of the Umbumbulu region has good potential for annual agriculture, while 9% is fertile, but less suitable. Its climate is ideal for a wide range of crops, including taro roots and sweet potatoes, and farming can be conducted all year round, with most smallholder relying on rainfall.

2.2. Data Collection and Sampling

In the survey conducted from July to September 2022, a comprehensive effort was made to gather data from a diverse group of smallholder farmers in Umbumbulu and Swayimana, South Africa. A total of 300 farmers were randomly selected to ensure a representative sample. The demographic characteristics of these farmers were considered, including age and gender. This approach aimed to capture a holistic understanding of the agricultural landscape, recognising the potential influence of demographic factors on farming practices and food security outcomes. The survey employed a questionnaire that had undergone meticulous pre-testing among 30 smallholder farmers in June 2022. Expert enumerators, proficient in Zulu, were instrumental in the pre-test and the subsequent survey, ensuring effective communication and comprehension of the questionnaire among the farmers.
The pre-testing phase played a crucial role in refining the questionnaire, not only to verify the farmers’ understanding but also to ensure that it comprehensively captured all necessary information. This iterative process improved the translation of the questionnaire into Zulu, enhancing its cultural and linguistic appropriateness. By incorporating demographic considerations and employing rigorous pre-testing procedures, this study aimed to provide a nuanced and accurate portrayal of the experiences and practices of smallholder farmers in the Umbumbulu and Swayimana regions. The ethical considerations, such as informed consent and confidentiality, were diligently observed throughout the data collection process.

2.3. Analytical Framework

This study used an Ordered Probit Model and the STATA Version 15 statistical analysis software to address the limitations associated with the binary choice models that were used in previous food security studies. In this case, the Ordered Probit Regression Model is preferred to multinomial logit or binary choice models, in view of its discrete variables, the values of which are ordinal [24]. This study effectively unveils crucial insights into the genuine condition of household food security, by using the Ordered Probit Model.
The dependent variable that is used in this study is ordered, with respect to the categories of household food security. Ref. [25] stated that the selected model is helpful for determining the multiple determinants of household food security. Underlying the indexing in such models is a latent, but continuous, descriptor of the response, i.e.,
Yi* = β′Xi + εi
where Yi* is the latent and continuous measure, Xi is a vector of the explanatory variables describing the independent descriptors, β is a vector of the parameters to be estimated, and εi is a random error term.
The observed and coded discrete Yi is determined from the model as follows:
Yi = 0 if −∞ ≤ Yi* ≤ µ1
1 if µ1 < Y* ≤ µ2
2 if µ2 < Y* ≤ µ3
3 if µ3 < Y* ≤ ∞
The µ1 represents the thresholds to be estimated (along with the parameter vector β).

2.4. Data Analytical Methods

This study employs several data analytical methods, i.e., the Household Food Insecurity Access Scale (HFIAS) for food security measurement, Principal Component Analysis (PCA) for reducing the directionality in the permutations of combinations in the relationship between crop production systems and value chains, and an Ordered Probit Regression model for determining the factors that influence household food security. Collectively, these methods allow for a comprehensive analysis of the intricate dynamics between crop production systems, value chains, and household food security.

2.4.1. Food Security Measurement

This study used the HFIAS to assess the food insecurity situation in smallholder farmers’ households. The HFIAS has nine questions (Table 1) on the occurrence of food insecurity, each representing its increasing severity, followed by questions on the frequency of its occurrence. These frequency questions are aimed at determining how often the specific food security condition occurred over the previous 30 days. The HFIAS Indicator Guide v3 [26] provides detailed instructions on how to use this questionnaire. It categorises the household food security status into four categories, as follows:
  • A household categorised as HFIA category 1 rarely encounters food access issues and typically experiences worries (Household Food Insecurity Access Scale (HFIAS) [26].
  • For HFIA category 2, a mildly food-insecure household occasionally or frequently expresses concerns about insufficient food, leading to a less varied diet.
  • HFIA category 3 represents a moderately food-insecure household that often sacrifices food quality, occasionally reducing meal quantity [26].
  • In HFIA category 4, a severely food-insecure household takes more extreme measures, cutting down on meal size or facing severe conditions like running out of food [26].

2.4.2. Principal Component Analysis

The relationship between the crop production systems and value chains was explored by using a Principal Component Analysis (PCA). This study preferred a Principal Component Analysis (PCA) over a Factor Analysis (FA), as the former is primarily a dimensionality-reduction technique, which aims to capture the maximum variance in the data without making strong assumptions about the underlying structure [27]. In contrast, a Factor Analysis assumes the existence of latent constructs that drive the observed variable [28]. A PCA was chosen because of its ability to reduce dimensionality, capture maximum variance, provide uncorrelated components, and offer an objective criterion for component selection, all of which contribute to a more robust and interpretable analysis.
A PCA was performed on the dataset, transforming the original variables into a set of uncorrelated Principal Components (PCs). Table 2 lists the variables that were used in the PCA. The Kaiser criterion was used to decide how many PC domains to retain. According to this criterion, any component with eigenvalues below 1 (after standardising the data) is discarded. Eigenvalues greater than 1 indicate that the corresponding component explains more variance than a single variable [29].

2.5. Empirical Model: Ordered Probit Model

The household food security status depends on certain measurable factors (Xi) and unobservable factors (εi). The Ordered Probit Model was computed for a polychotomous dependent variable with four categories. In accordance with [24], the Ordered Probit Model for Y, conditioned on explanatory variables Xi, can be deduced from a latent variable model in a subsequent manner:
Yi* = β′Xi + εi,
where Yi* is the latent and continuous measure of food insecurity severity faced by smallholder farmers i in a rural area, Xi is a vector of the explanatory variables describing the socio-economic characteristics of farmers (as in Table 3), β is a vector of the parameters to be estimated, and εi is a random error term.
The odds associated with the coded responses of an Ordered Probit Model are as follows:
P n 0 = Pr Y n = 0 = Pr Y n * µ 1 = Pr β ` Xi   +   ε i µ 1 = Pr ( ε i µ 1 β ` Xi = µ 1   β ` Xi P n 1 = Pr Y n = 1 = Pr µ 1 Y n * µ 2 = Pr ε i µ 2 β ` Xi Pr ε i µ 1 β ` Xi = µ 2   β ` Xi µ 1   β ` Xi P n k = Pr Y n = k = Pr µ k < Y n * µ k   + 1 = µ k + 1   β ` Xi µ k   β ` Xi P n K = Pr Y n = K = Pr µ k < Y n * = 1 µ k   β ` Xi            
where n is an individual, k is a response alternative, P Y n = k is the probability that individual n responds in a manner k, and is the standard normal cumulative distribution function. In the increasing nature of the ordered classes, the interpretation of this model’s primary parameter is set β .
The smallholder farmer food security determinants were identified by means of a literature review. Table 3 describes the explanatory variables used in the model and the expected signs (hypothesised outcome) of the potential explanatory variables.

3. Results and Discussion

This section presents the results of various statistical analyses of the data received from 300 participants. These analyses include chi-square tests, one-way ANOVA, a multicollinearity test, a Principal Component Analysis (PCA), and an Ordered Probit Model. The analytical tools facilitated a thorough investigation of the intricate relationship between food security levels, socio-economic parameters, crop production systems, value chains, and their interactions.

3.1. Descriptive Analysis Results

Table 4 shows that 36% of the farmers were food secure, 33% were mildly food insecure, 22% were moderately food secure, and 9% were severely food insecure. The chi-square test was employed to check the association between the food security status, which is measured as the HFIAS and independent variables.
Table 4 shows a statistically significant relationship between education and the food security status (p < 0.05). The results show that 53.27% of households that did not go to school were food secure, and in households that had a primary education, about 23.36% were classified as food secure. About 18.82% had a secondary education, and 6.54% had a tertiary education and were classified as food secure. In the mildly food-insecure category, about 41.41% had no schooling, 24.24% had a primary education, 30.30% had a secondary education, and 4.04% had a tertiary education. The results further showed that, at the moderate food-insecurity level, about 46.97% of households had no schooling, 13.64% had a primary education, 31.82% had a secondary education, and 7.58% had a tertiary education. In the fourth food insecurity category, namely, severe food insecurity, the results showed that 28.57% of all household heads had no schooling, 14.29% had a primary education, 50% had a secondary education, and 7.14% had a tertiary education.
The results also showed a statistical significance between receiving remittances and household food security (p < 0.1). For households with “No” remittances, approximately 52.34% of households were classified as food secure, 41.41% of households were mildly food insecure, 51.52% of households were moderately food insecure, and 67.86% of households were severely food insecure. For households with “Yes” remittances, about 47.66% of households were food secure, 58.59% were mildly food insecure, 48.48% were moderately food insecure, and 32.14% were severely food insecure.
Table 5 shows the relationship between the household food security level and continuous variables, which was measured by using one-way ANOVA. The statistical analysis in this table revealed a significant difference in livestock-owned means across the different levels of food security (p < 0.01). Livestock ownership varied significantly among households with different levels of food security. The mean value of livestock owned by food-secure households was 22. In comparison, households with mild food insecurity had a mean livestock ownership of 18, while moderately food-insecure households had a mean livestock ownership of 11. The lowest mean livestock-owned value was among severely food-insecure households. These findings indicate that livestock ownership tends to decrease with an increase in food insecurity.

3.2. Multicollinearity Test of Variables

The multicollinearity among the independent variables was assessed by using the Variance Inflation Factor (VIF), which is considered to be acceptable if the values are below 10. The findings in Table 6 indicate no multicollinearity issues since all the VIF values were below this threshold [36].

3.3. Principal Component Analysis Results

A Principal Component Analysis (PCA) was conducted to reduce the dimensionality of the interactive relationship between crop production systems and value chains. When conducting a PCA, a set of three Principal Components (PCs) were derived, as shown in Table 7. The three PCs met the Kaiser criterion, as they had eigenvalues exceeding one, and they collectively explained 36.31% of the total variance in the utilised variables. Specifically, the three components accounted for 15.06%, 11.79%, and 9.46% of the variance, respectively, as specified in Table 7. The Kaiser–Meyer–Olkin (KMO) measure of sampling adequacy assesses the suitability of the data for the PCA. The value of 0.615 indicates that the sample size, as well as the intercorrelations among the variables, is suitable for it.
The PC1 domain represents a pattern that is related to modern agro-productivity practices. The positive loading values for the ‘crop yield per unit area’, ‘use of synthetic fertilisers’, ‘agrobiodiversity’, and ‘local market integration’ suggest that these variables are positively correlated with each other and contribute to modern agro-productivity practices. This positive correlation implies that systems exhibiting higher crop yields, the increased use of synthetic fertilisers, and a greater agrobiodiversity tend to integrate better into the local markets. This alignment of variables is consistent with the notion that modern agro-productivity practices often go hand in hand with increased market participation [15].
The PC2 domain represents a pattern that is related to sustainable market integration. The positive loading values for the reliance on traditional knowledge and practices, traceability and labelling practices, the use of natural pest control methods, the use of organic fertilisers, organic certification, post-harvest handling practices, and market integration (the wholesale market) indicate that these variables are positively correlated and contribute to sustainable market integration. High values in PC2 suggest an agricultural system that emphasises the markets, traditional knowledge, and traceability in the supply chain.
The PC3 domain represents a pattern that focuses on traditional knowledge and practices. The positive loading values for ‘direct marketing channels’ and ‘reliance on traditional knowledge and practices’ indicate that these variables are associated with a focus on traditional agricultural methods.

3.4. Impact of the Interaction between Crop Production Systems and Value Chains on Household Food Security

The Ordered Probit Model was utilised to identify the household characteristics that influence the food security status of smallholder farmers’ households (as shown in Table 8). The results demonstrated that, collectively, the estimated coefficients statistically and significantly determined food security, as indicated by the LR statistic (p < 0.01). The coefficients of the Ordered Probit Model do not directly indicate the size of the effects of the explanatory variables. Instead, the marginal effects are presented and discussed. In this context, a positive value of the coefficient suggests an increase in the HFIAS score, which indicates the higher likelihood of a household being food insecure. Conversely, a negative coefficient implies a higher probability of a household being food secure.
The results show that sustainable market integration has a significant and negative association (p < 0.01) with the food insecurity levels (Table 8). The marginal effect shows that the effects are twofold, i.e., there are further increases in food security when at the food-secure level, and increased food insecurity at high levels of food insecurity. The results of the marginal effects show that a unit increment in sustainable market integration at a food-secure level yields a statistically significant 7.8% decrease in food insecurity. Refs. [37,38] have emphasised the positive role of market access and integration in enhancing the food security of households that already meet their basic needs. Refs. [39,40] suggest that market access improves food availability, diversity, and stability. Households with surplus production sell their products at the markets, which generates an income so that they can purchase a wider variety of foods, which reduces the risk of food shortages [41]. Conversely, the results also entail a 3.7% probability of transitioning from moderately to severely food insecure, i.e., becoming more food insecure. The results reflect the complex and context-dependent nature of the food security outcomes. This finding is consistent with the concept of vulnerability to food insecurity. Households at higher food insecurity levels often need more resources and face various constraints, which prevent them from benefiting fully from market integration. Ref. [42] underscore the vulnerability of moderately food-insecure households to external shocks and stresses, which can exacerbate their food insecurity.
The result suggests that a focus on traditional knowledge has a statistically significant and negative impact (p < 0.1) on household food security. It indicates that an increase in the focus on traditional knowledge is associated with a statistically significant 3.9% decrease in food insecurity. These results are consistent with the findings of [43] on the role of traditional knowledge systems in promoting food security. Traditional knowledge encompasses an indigenous and local knowledge of agriculture, of natural resource management, and of food production [44]. Ref. [45] highlighted the value of integrating traditional knowledge practices into modern agricultural systems. For instance, [46] emphasised the contribution of traditional ecological knowledge to sustainable resource management and food production. Traditional knowledge often includes valuable practices for crop cultivation, pest control, and water management, which can enhance agricultural productivity and food security.
The results also show that the same increase in the focus on traditional knowledge results in a 1.8% probability of households transitioning from being moderately food insecure to becoming severely food insecure. The finding aligns with the recognition that traditional knowledge alone may not be a panacea for addressing food security, especially for households that are already facing moderate-to-severe food insecurity. The vulnerability of moderately food-insecure households to external shocks limits their capacity to fully leverage the traditional knowledge systems to improve their food security status [47].
Consistent with a priori expectations, larger households were more food insecure than smaller households (ceteris paribus). Overall, the household size positively, statistically, and significantly impacted household food insecurity (p < 0.01). The results of the marginal effects showed that an increase in the household size resulted in a 0.9% increase in the likelihood of becoming food insecure, as well as a 0.4% chance of sliding from being severely food insecure to becoming moderately food insecure, i.e., becoming more food secure. The finding that a larger family size leads to food insecurity, at the food security level, aligns with the notion that the household size adversely impacts food security. Ref. [23] stressed that larger families strain the resources, including food, in already food-secure households. In such cases, an increased family size leads to a higher demand for food, which potentially stretches the available resources and increases the risk of food insecurity [23].
Conversely, the observation is that, at higher levels of food insecurity, larger families benefit from the extra labour and sharing of tasks, which leads to improved food security outcomes. This finding is consistent with that of [48], who emphasised the role of household labour in food production and security. In resource-constrained settings that are dependent on labour-intensive practices, additional family members can contribute to the agricultural activities, such as farming and livestock management, which enhances food production and self-sufficiency [48]. The concept of labour sharing and cooperation within larger households has been explored in subsistence agriculture, where the division of labour among family members can improve food security outcomes [49].
The negative and statistically significant (p < 0.01) relationship between the level of education and the food insecurity status suggests that a higher educational level of the household head is associated with a higher likelihood of the household being food secure. The results of the marginal effects suggest that, at a food-secure level, a higher level of education is likely to lead to improved food security outcomes. A higher level of education leads to a 6.9% decrease in the chance of becoming food insecure. Ref. [50] obtained similar findings and stated that higher levels of education are often associated with increased knowledge and skills. Education equips individuals with a broader understanding of nutrition, agriculture, and economic concepts, which can positively influence food-related decision-making within the household [51]. Ref. [51] also noted that household heads with a higher educational level possess better agricultural and financial management skills, which enable them to make informed choices regarding crop production, income generation, and resource allocation, all of which can contribute to improved food security outcomes. However, the results of the marginal effects also show that there is a 3.3% increase in the chance of an educated household head sliding from moderately food insecure to severely food insecure. These findings align with those of [50], namely, that highly educated individuals allocate and invest a significant portion of their income in their education and career development, leaving less disposable income for immediate needs like food.
The negative coefficient for the livestock that is owned suggests that an increase in the number of livestock is associated with a higher likelihood of households being food secure (p < 0.01). A unit increase in livestock ownership results in a 0.8% increase probability in the likelihood of a household being food secure and a 0.4% increase in the likelihood of transitioning from severely food insecure to moderately food insecure, i.e., more food secure. Ref. [52] noted that livestock ownership provides households with an indirect and direct source of food, in the form of income, milk, meat, and eggs. According to [52], having more livestock means that more animal-sourced protein and nutrients are available within the household’s diet, which contributes to improved food security and nutritional outcomes. Livestock ownership represents an asset diversification strategy for households; however, to rely solely on crop production for food and income is risky, because of possible crop failures, pests, or market price fluctuations [53].
The results show that food expenditure has a positive and statistically significant impact (p < 0.01) on the food security status of households. The positive relationship implies that households with a higher expenditure on food are more likely to experience higher levels of food insecurity. Higher food expenditure leads to a statistically significant 15.6% increase in the chance of sliding from being food secure to being mildly food insecure and a 7.3% chance of transitioning from moderately to severely food insecure. Ref. [54] found that households that have a higher proportion of their expenditure allocated to food tend to be food insecure. The results suggest that these households have a lower purchasing power, or limited access to adequate food supplies.
Flooding was another major factor that determined the food security of farming households. A positive and statistically significant relationship (p < 0.1) exists between food insecurity and flood experiences. Table 8 indicates that experiencing floods leads to a statistically significant 8.9% increase in the chance of sliding from food secure to mildly food insecure, and a 4.2% chance of sliding from moderately to severely food insecure. The impact of floods on agricultural systems has various consequences, including crop damage and prolonged reduced productivity, which contribute significantly to food shortages within farming households, and ultimately lead to severe food scarcity [55]. This finding agrees with recent research that was conducted in Afghanistan [55] and Niger [34].
The relationship between access to credit and the level of household food security is positive and statistically significant (p < 0.1). The findings on the marginal effects suggest that having access to cash credit leads to a 19.3% probability of transitioning from a food-secure to a mildly food-insecure status, which suggests that cash credit worsens the food security of households. The findings of this study align with those of [56], which suggest that poor households turn to cash credit when they are facing financial difficulties, including unexpected expenses or income shortages. While credit provides immediate relief and helps to secure food, it often comes with interest and repayment obligations. Informal credit is accompanied by high interest rates, which results in poor households struggling to repay their loans [56]. In turn, this can lead to a cycle of debt and financial strain, which ultimately results in a shift from food security to mild food insecurity. The results of the marginal effects also show that, for households facing severe food insecurity, access to cash credit increases the probability of them transitioning from severely food insecure to moderately food insecure by 9%. For households facing severe food insecurity, access to credit provides a lifeline, by allowing them to purchase essential food items, or to cover emergency expenses.

4. Conclusions and Recommendations

This study investigated the impact of the interaction between crop production systems and value chains on household food security. The results of the Ordered Probit Model revealed that several significant factors influence the food insecurity status. Sustainable market integration (PC2) and a focus on traditional knowledge (PC3) showed a negative association with food insecurity. Furthermore, a larger household size was associated with a higher level of food insecurity, mainly due to the increased demand for food, with limited resources. The education level of the household head and the number of livestock owned negatively affected their food insecurity status. However, higher expenditure on food was associated with increased food insecurity, which indicates a limited purchasing power or access to adequate food supplies. Lastly, flooding contributed significantly to food insecurity, as it results in degraded infrastructure and production bases.
Policymakers and stakeholders should prioritise sustainable market integration initiatives that facilitate the smallholder farmers’ access to markets, for example, by improving their income opportunities and promoting environmentally friendly agricultural practices. Efforts should also be directed towards preserving and incorporating traditional knowledge into farming practices, in order to enhance their productivity and resilience in the face of challenges. Strategies, such as promoting family planning and providing support to mitigate food shortages, are crucial for addressing the negative impacts that a larger household size has on food security. Investing in the education and training of farmers can lead to better agricultural and financial management practices and it can contribute to improved food security outcomes. Encouraging livestock ownership and promoting asset diversification can serve as a risk-reducing strategy for households, and it can strengthen food security.
Interventions should be explored for supporting households with a limited purchasing power, in order to improve their access to an adequate and diverse food source. Finally, proactive measures should be taken to minimise flooding and to address its effects on agricultural systems, such as implementing flood-prevention programmes through an improved rural infrastructure. By implementing these recommendations, policymakers and stakeholders can work towards enhancing the food security of households and promoting sustainable agriculture.

Author Contributions

The following are the author contributions: conceptualization; technique; software; validation; formal analysis; investigation; resources; data curation; writing—preparation of the original draft; writing—review and editing; supervision; project administration; T.C. and M.M.; funding acquisition. All authors have read and agreed to the published version of the manuscript.

Funding

The National Research Foundation (Grant Number 131655), and the University of KwaZulu-Natal funded the research.

Institutional Review Board Statement

The University of KwaZulu-Natal provided a letter of ethical clearance approval to the researchers. The UKZN Research Ethics Office’s Humanities and Social Sciences Research Ethics Committee received the application for ethical clearance, and permission was granted. The extension officials at the location of the study provided the gatekeeper’s letter as well. In keeping with the study participants’ anonymity, informed consent was also acquired from the homes, discussants, and informants prior to data collection.

Informed Consent Statement

Informed consent was obtained from all subjects involved in the study.

Data Availability Statement

The authors want to declare that they can submit the data at any time based upon request. The datasets used and/or analysed during the current study will be available from the corresponding author upon reasonable request.

Acknowledgments

The authors acknowledge the respondent smallholder farmers and enumerators.

Conflicts of Interest

The authors declare no conflicts of interest.

References

  1. Meybeck, A.; Laval, E.; Lévesque, R.; Parent, G. Food security and nutrition in the age of climate change. In Proceedings of the International Symposium Organized by the Government of Québec in Collaboration with FAO, Québec City, QC, Canada, 24–27 September 2017. [Google Scholar]
  2. Mthembu, N.N.; Zwane, E.M. The adaptive capacity of smallholder mixed-farming systems to the impact of climate change: The case of KwaZulu-Natal in South Africa. Jàmbá J. Disaster Risk Stud. 2017, 9, 469. [Google Scholar] [CrossRef] [PubMed]
  3. Tawodzera, G. Local Food Geographies: The Nature and Extent of Food Insecurity in South Africa; Institute for Poverty, Land and Agrarian Studies, University of the Western Cape: Cape Town, South Africa, 2017. [Google Scholar]
  4. Statistics South Africa. Food Security and Hunger. 2023. Available online: https://www.statssa.gov.za/?cat=28 (accessed on 30 November 2023).
  5. Ngcuka, O.S.A. Needs Subsistence Farming for Food Security. Food for Mzansi. 2022. Available online: https://www.foodformzansi.co.za/sa-needs-subsistence-farming-for-food-security/ (accessed on 29 November 2023).
  6. Kristjanson, P.; Neufeldt, H.; Gassner, A.; Mango, J.; Kyazze, F.B.; Desta, S.; Sayula, G.; Thiede, B.; Förch, W.; Thornton, P.K.; et al. Are food insecure smallholder households making changes in their farming practices? Evidence from East Africa. Food Secur. 2012, 4, 381–397. [Google Scholar] [CrossRef]
  7. Warren, E.; Hawkesworth, S.; Knai, C. Investigating the association between urban agriculture and food security, dietary diversity, and nutritional status: A systematic literature review. Food Policy 2015, 53, 54–66. [Google Scholar] [CrossRef]
  8. Nkomoki, W.; Bavorová, M.; Banout, J. Adoption of sustainable agricultural practices and food security threats: Effects of land tenure in Zambia. Land Use Policy 2018, 78, 532–538. [Google Scholar] [CrossRef]
  9. Herrera, J.P.; Rabezara, J.Y.; Ravelomanantsoa, N.A.F.; Metz, M.; France, C.; Owens, A.; Pender, M.; Nunn, C.L.; Kramer, R.A. Food insecurity related to agricultural practices and household characteristics in rural communities of northeast Madagascar. Food Secur. 2021, 13, 1393–1405. [Google Scholar] [CrossRef]
  10. Akinnifesi, F.K.; Ajayi, O.C.; Sileshi, G.; Chirwa, P.W.; Chianu, J. Fertiliser trees for sustainable food security in the maize-based production systems of East and Southern Africa. A review. Agron. Sustain. Dev. 2010, 30, 615–629. [Google Scholar] [CrossRef]
  11. Wekesa, B.M.; Ayuya, O.I.; Lagat, J.K. Effect of climate-smart agricultural practices on household food security in smallholder production systems: Micro-level evidence from Kenya. Agric. Food Secur. 2018, 7, 80. [Google Scholar] [CrossRef]
  12. Mujeyi, A.; Mudhara, M.; Mutenje, M. The impact of climate smart agriculture on household welfare in smallholder integrated crop–livestock farming systems: Evidence from Zimbabwe. Agric. Food Secur. 2021, 10, 4. [Google Scholar] [CrossRef]
  13. Noort, M.W.J.; Renzetti, S.; Linderhof, V.; du Rand, G.E.; Marx-Pienaar, N.J.M.M.; de Kock, H.L.; Magano, N.; Taylor, J.R.N. Towards Sustainable Shifts to Healthy Diets and Food Security in Sub-Saharan Africa with Climate-Resilient Crops in Bread-Type Products: A Food System Analysis. Foods 2022, 11, 135. [Google Scholar] [CrossRef]
  14. Kissoly, L.; Faße, A.; Grote, U. The integration of smallholders in agricultural value chain activities and food security: Evidence from rural Tanzania. Food Secur. 2017, 9, 1219–1235. [Google Scholar] [CrossRef]
  15. Kumar, A.; Mishra, A.K.; Saroj, S.; Joshi, P. Impact of traditional versus modern dairy value chains on food security: Evidence from India’s dairy sector. Food Policy 2019, 83, 260–270. [Google Scholar] [CrossRef]
  16. Mossie, M.; Gerezgiher, A.; Ayalew, Z.; Elias, A. Food security effects of smallholders’ participation in apple and mango value chains in north-western Ethiopia. Agric. Food Secur. 2021, 10, 47. [Google Scholar] [CrossRef]
  17. Ndlovu, P.N.; Thamaga-Chitja, J.M.; Ojo, T.O. Impact of value chain participation on household food insecurity among smallholder vegetable farmers in Swayimana KwaZulu-Natal. Sci. Afr. 2022, 16, e01168. [Google Scholar]
  18. Devaux, A.; Torero, M.; Donovan, J.; Horton, D. Agricultural innovation and inclusive value-chain development: A review. J. Agribus. Dev. Emerg. Econ. 2018, 8, 99–123. [Google Scholar] [CrossRef]
  19. Tansey, G.; Worsley, A. The Food System; Routledge: London, UK, 2014. [Google Scholar]
  20. Mbatha, N.S.C. Trends and Challenges of Food Security Policy Implementation: A Case Study of uMgungundlovu District Municipality. Ph.D. Dissertation, University of KwaZulu-Natal, Durban, South Africa, 2021. [Google Scholar]
  21. Ndlovu, P.N.; Thamaga-Chitja, J.M.; Ojo, T.O. Factors influencing the level of vegetable value chain participation and implications on smallholder farmers in Swayimane KwaZulu-Natal. Land Use Policy 2021, 109, 105611. [Google Scholar] [CrossRef]
  22. Ngcobo, G.N. Assessment of the Constraints Limiting the Market Participation of Smallholder Farmers in the Umbumbulu Area of KwaZulu-Natal Province. Ph.D. Dissertation, University of KwaZulu-Natal, Durban, South Africa, 2019. [Google Scholar]
  23. Hawkins, P.; Geza, W.; Mabhaudhi, T.; Sutherland, C.; Queenan, K.; Dangour, A.; Scheelbeek, P. Dietary and agricultural adaptations to drought among smallholder farmers in South Africa: A qualitative study. Weather Clim. Extrem. 2022, 35, 100413. [Google Scholar] [CrossRef] [PubMed]
  24. Hlatshwayo, S.I.; Ojo, T.O.; Modi, A.T.; Mabhaudhi, T.; Slotow, R.; Ngidi, M.S.C. The Determinants of Market Participation and Its Effect on Food Security of the Rural Smallholder Farmers in Limpopo and Mpumalanga Provinces, South Africa. Agriculture 2022, 12, 1072. [Google Scholar] [CrossRef]
  25. Nkegbe, P.K.; Abu, B.M.; Issahaku, H. Food security in the Savannah Accelerated Development Authority Zone of Ghana: An ordered probit with household hunger scale approach. Agric. Food Secur. 2017, 6, 35. [Google Scholar] [CrossRef]
  26. Coates, J.; Swindale, A.; Bilinsky, P. Household Food Insecurity Access Scale (HFIAS) for Measurement of Food Access: Indicator Guide: Version 3; FANTA: Washington, DC, USA, 2007. [Google Scholar]
  27. Tripathi, M.; Singal, S.K. Use of Principal Component Analysis for parameter selection for development of a novel Water Quality Index: A case study of river Ganga India. Ecol. Indic. 2019, 96, 430–436. [Google Scholar] [CrossRef]
  28. Steenkamp, J.-B.E.M.; Maydeu-Olivares, A. Unrestricted factor analysis: A powerful alternative to confirmatory factor analysis. J. Acad. Mark. Sci. 2023, 51, 86–113. [Google Scholar] [CrossRef]
  29. Björklund, M. Be careful with your principal components. Evolution 2019, 73, 2151–2158. [Google Scholar] [CrossRef]
  30. Nkomoki, W.; Bavorová, M.; Banout, J. Factors associated with household food security in Zambia. Sustainability 2019, 11, 2715. [Google Scholar] [CrossRef]
  31. Abdullah; Zhou, D.; Shah, T.; Ali, S.; Ahmad, W.; Din, I.U.; Ilyas, A. Factors affecting household food security in rural northern hinterland of Pakistan. J. Saudi Soc. Agric. Sci. 2019, 18, 201–210. [Google Scholar] [CrossRef]
  32. Molina-Flores, B.; Manzano-Baena, P.; Coulibaly, M.D. The Role of Livestock in Food Security, Poverty Reduction, and Wealth Creation in West Africa; FAO: Rome, Italy, 2020. [Google Scholar]
  33. Lutomia, C.K.; Obare, G.A.; Kariuki, I.M.; Muricho, G.S. Determinants of gender differences in household food security perceptions in the Western and Eastern regions of Kenya. Cogent Food Agric. 2019, 5, 1694755. [Google Scholar] [CrossRef]
  34. Week, D.A.; Wizor, C.H. Effects of Flood on Food Security, Livelihood and Socio-economic Characteristics in the Flood-prone Areas of the Core Niger Delta, Nigeria. Asian J. Geogr. Res. 2020, 3, 1–17. [Google Scholar] [CrossRef]
  35. Sani, S.; Kemaw, B. Analysis of households food insecurity and its coping mechanisms in Western Ethiopia. Agric. Food Econ. 2019, 7, 5. [Google Scholar] [CrossRef]
  36. Gómez, R.S.; Sánchez, A.R.; García, C.G.; Pérez, J.G. The VIF and MSE in Raise Regression. Mathematics 2020, 8, 605. [Google Scholar] [CrossRef]
  37. Omiti, J.M.; Otieno, D.J.; Nyanamba, T.O.; McCullough, E.B. Factors influencing the intensity of market participation by smallholder farmers: A case study of rural and peri-urban areas of Kenya. Afr. J. Agric. Resour. Econ. 2009, 3, 57–82. [Google Scholar]
  38. Shiferaw, B.; Hellin, J.; Muricho, G. Improving market access and agricultural productivity growth in Africa: What role for producer organisations and collective action institutions? Food Secur. 2011, 3, 475–489. [Google Scholar] [CrossRef]
  39. Šūmane, S.; Kunda, I.; Knickel, K.; Strauss, A.; Tisenkopfs, T.; Rios, I.D.I.; Rivera, M.; Chebach, T.; Ashkenazy, A. Local and farmers’ knowledge matters! How integrating informal and formal knowledge enhances sustainable and resilient agriculture. J. Rural Stud. 2018, 59, 232–241. [Google Scholar] [CrossRef]
  40. Eke, M.O.; Elechi, J.O.G.; Bello, F. Effect of fortification of defatted Moringa oleifera seed flour on consumers acceptability and nutritional characteristics of wheat bread. Eur. Food Sci. Eng. 2022, 3, 18–25. [Google Scholar] [CrossRef]
  41. Cele, T.; Mudhara, M. Impact of market participation on household food security among smallholder irrigators in KwaZulu-Natal, South Africa. Agriculture 2022, 12, 261. [Google Scholar] [CrossRef]
  42. Smith, L.C.; Frankenberger, T.R. Does Resilience Capacity Reduce the Negative Impact of Shocks on Household Food Security? Evidence from the 2014 Floods in Northern Bangladesh. World Dev. 2018, 102, 358–376. [Google Scholar] [CrossRef]
  43. Ndalilo, L.; Wekesa, C.; Mbuvi, M.T. Indigenous and local knowledge practices and innovations for enhancing food security under climate change: Examples from Mijikenda communities in coastal Kenya. In Sustainability Challenges in Sub-Saharan Africa II: Insights from Eastern and Southern Africa; Springer: Berlin/Heidelberg, Germany, 2020; pp. 63–82. [Google Scholar]
  44. Williams, P.A.; Sikutshwa, L.; Shackleton, S. Acknowledging Indigenous and Local Knowledge to Facilitate Collaboration in Landscape Approaches—Lessons from a Systematic Review. Land 2020, 9, 331. [Google Scholar] [CrossRef]
  45. FAO. The Future of Food and Agriculture; FAO: Rome, Italy, 2017; Available online: https://www.fao.org/3/i6583e/I6583E.pdf (accessed on 1 October 2023).
  46. Bommarco, R.; Kleijn, D.; Potts, S.G. Ecological intensification: Harnessing ecosystem services for food security. Trends Ecol. Evol. 2013, 28, 230–238. [Google Scholar] [CrossRef]
  47. Diaz-Bonilla, E.; Piñeiro, V.; Elverdin, P. External Shocks, Food Security, and Development: Exploring Scenarios for Central America; Report 1592; IFPRI: Washington, DC, USA, 2016. [Google Scholar]
  48. Drammeh, W.; Hamid, N.A.; Rohana, A. Determinants of Household Food Insecurity and Its Association with Child Malnutrition in Sub-Saharan Africa: A Review of the Literature. Curr. Res. Nutr. Food Sci. J. 2019, 7, 610–623. [Google Scholar] [CrossRef]
  49. Naidoo, K.D.; Thamaga-Chitja, J.M.; Shimelis, H.A. Towards sustainable livelihoods through indigenous knowledge and water use security: Insights from small-scale irrigation schemes in Limpopo Province. Indilinga Afr. J. Indig. Knowl. Syst. 2013, 12, 301–324. [Google Scholar]
  50. Mutisya, M.; Ngware, M.W.; Kabiru, C.W.; Kandala, N.-B. The effect of education on household food security in two informal urban settlements in Kenya: A longitudinal analysis. Food Secur. 2016, 8, 743–756. [Google Scholar] [CrossRef]
  51. Parker, J.S.; Wilson, R.S.; LeJeune, J.T.; Doohan, D. Including growers in the “food safety” conversation: Enhancing the design and implementation of food safety programming based on farm and marketing needs of fresh fruit and vegetable producers. Agric. Hum. Values 2012, 29, 303–319. [Google Scholar] [CrossRef]
  52. Kariuki, J.; Njuki, J.; Mburu, S.; Waithanji, E. Women, Livestock Ownership and Food Security. In Women, Livestock Ownership and Markets; Routledge: London, UK, 2013. [Google Scholar]
  53. Mulwa, C.K.; Visser, M. Farm diversification as an adaptation strategy to climatic shocks and implications for food security in northern Namibia. World Dev. 2020, 129, 104906. [Google Scholar] [CrossRef]
  54. Akber, M.A.; Islam, M.A.; Rahman, M.M.; Rahman, M.R. Crop diversification in southwest coastal Bangladesh: Insights into farming adaptation. Agroecol. Sustain. Food Syst. 2022, 46, 316–324. [Google Scholar] [CrossRef]
  55. Samim, S.A.; Hu, Z.; Stepien, S.; Amini, S.Y.; Rayee, R.; Niu, K.; Mgendi, G. Food Insecurity and Related Factors among Farming Families in Takhar Region, Afghanistan. Sustainability 2021, 13, 10211. [Google Scholar] [CrossRef]
  56. Bahiru, A.; Senapathy, M.; Bojago, E. Status of household food security, its determinants, and coping strategies in the Humbo district, Southern Ethiopia. J. Agric. Food Res. 2023, 11, 100461. [Google Scholar] [CrossRef]
Figure 1. Location of study sites in the KwaZulu-Natal Province of South Africa.
Sustainability 16 00700 g001
Table 1. Household Food Insecurity Access Scale (HFIAS).
NoQuestion (Q)Response Options
0 = No
1 = Yes
If Yes, How Often Did This Happen?
1 = Rarely
2 = Sometimes
3 = Often
1.In the past four (4) weeks, did you worry that your household would not have enough food?
2.In the past four (4) weeks, were you, or any household member, not able to eat the kind of food you preferred because of a lack of resources?
3.In the past four (4) weeks, did you, or any household member, have to eat a limited variety of foods due to a lack of resources?
4.In the past four (4) weeks, did you, or any household member, have to eat some foods that you really did not want to eat, because of a lack of resources to obtain other types of food?
5.In the past four (4) weeks, did you, or any household member, have to eat a smaller meal than you felt you needed because there was not enough food?
6.In the past four (4) weeks, did you, or any household member, have to eat fewer meals in a day, because of a lack of resources to obtain food?
7.In the past four (4) weeks, was there ever no food of any kind to eat in your household, because of a lack of resources to obtain food?
8.In the past four (4) weeks, did you, or any household member, go to sleep hungry at night because there was not enough food?
9.In the past four (4) weeks, did you, or any household member, go a whole day and night without eating anything, because there was not enough food?
Table 2. Variables used in Principal Component Analysis.
Value Chain VariablesProduction System Variables
Reliance on traditional knowledge and practicesCrop yield per unit area
Traceability and labelling practicesUse of synthetic fertilisers
Direct marketing channelsUse of chemical pesticides
Organic certification Use of traditional seed varieties
Post-harvest handling practices Reliance on traditional knowledge and practices
Wholesale marketUse of natural pest control methods
Local market integration (local markets)Use of organic fertilisers
Traditional value-added productsAgrobiodiversity
Table 3. Variables used in the Ordered Probit Analysis.
Dependent VariableMeasurements Expected SignRationale
HFIAS 1 = Food secure, 2 = Mildly food insecure, 3 = Moderately food insecure, and 4 = Severely food insecure Household food security status, measured by using HFIAS.
Independent variables
HsizeContinuous variable measuring the number of people in the household +Larger households may have higher food requirements and face challenges in meeting those needs [30].
Age Number of years of the household headOlder household heads have more farming experience and are less likely to be food insecure [31].
Education0 = No school, 1 = Primary,
2 = Secondary, 3 = Tertiary
Higher education levels are often associated with better income potential and resource access, which can negatively affect food insecurity [31].
LivestockNumber of livestock owned by a household Households with more livestock may be better equipped to ensure their food security [32].
Household food expenditure0 = Low (≤60% total expenditure), 1 = High
(>60% total expenditure)
Higher food expenditure may show better food security, which suggests that a larger amount of income is allocated to food [32].
Occupation 0 = non-Farmer 1 = FarmerFarmers may have more direct control over food production and better access to nutritious food than non-farmers [33].
RemittancesReceives remittances 0 = No,
1 = Yes
Remittances, i.e., money sent by family members working in other locations, can contribute to household income and improve food security by increasing its purchasing power [31].
FloodsAffected by floods 0 = No,
1 = Yes
+Floods can have a significantly negative impact on agricultural production and food security [34].
Cash creditAccess to cash credit 0 = No,
1 = Yes
Households with access to cash credit may manage unexpected expenses and ensure food availability [35].
Modern agro-production practices (PC1)Factor score−/+Modern agro-production practices, such as the use of synthetic fertilisers and chemical pesticides, are known to influence crop yields and agricultural productivity. Including a PC1 allows us to investigate how modern farming techniques may affect food insecurity levels.
Sustainable market integration (PC2)Factor score−/+Sustainable market integration can enhance market access, income diversification, and supply chain efficiency, which potentially affects food availability and accessibility. Including PC2 enables us to explore the role of market-oriented approaches in mitigating food insecurity.
Traditional knowledge (PC3)Factor score −/+Traditional knowledge encompasses time-tested farming practices and local ability, which potentially contributes to agricultural resilience and sustainable resource management. Including PC3 allows us to assess the influence of traditional knowledge on food security outcomes.
Table 4. Association between food security and socio-economic parameters.
VariablesMeasureFood Secure (n = 107) 36%Mildly Food Insecure
(n = 99) 33%
Moderately Food Insecure (n = 66) 22%Severely Food Insecure
(n = 28) 9%
X2
Education1 = No School53.2741.4146.9728.57**
2 = Primary23.3624.2413.6414.29
3 = Secondary18.8230.3031.8250
4 = Tertiary6.544.047.587.14
Household food expenditure0 = Low56.6061.6257.5864.29n.s
1 = High43.4038.3842.4235.71
Occupation0 = non-farmer57.9457.5853.0375n.s
1 = Farmer42.0642.4246.9725
Remittances0 = No52.3441.4151.5267.86*
1 = Yes47.6658.5948.4832.14
Floods0 = No53.2760.6162.1264.29n.s
1 = Yes46.7339.3937.8835.71
Cash credit0 = No93.4693.9496.97100n.s
1 = Yes6.546.063.030
Note: * and ** means statistically significant at a 10% and 5% level, respectively; n.s means not significant.
Table 5. One-way ANOVA results for household food security determinants.
VariablesFood SecureMildly
Food Insecurity
Moderately
Food Insecurity
Severe
Food Insecurity
F Significance
Mean Std. Dev.MeanStd. Dev.MeanStd. Dev.Mean Std. Dev.
Household size84.2974.4284.1183.22n.s
Age 5313.285113.265414.854914.43n.s
Livestock owned220.88181.85111.9832.56***
Note: *** means statistically significant at a 1% level, respectively; n.s means not significant.
Table 6. Multicollinearity assessment: Variance Inflation Factor (VIF).
VariableVIF1/VIF
Modern agro-productivity practices3.660.27
Floods3.020.33
Household food expenditure1.440.69
Age1.390.72
Education1.260.79
Livestock owned1.210.82
Occupation1.150.87
Remittances1.120.89
Traditional knowledge focus1.090.92
Sustainable market integration1.090.92
Household size1.030.97
Cash credit1.010.99
Mean VIF1.54
Table 7. Principal Component Analysis.
VariablePC1—Modern Agro-Productivity PracticesPC2—Sustainable Market IntegrationPC3—Traditional Knowledge Focus
Crop yield per unit area0.5710.0360.336
Use of synthetic fertilisers0.7380.143−0.017
Use of chemical pesticides0.118−0.0900.110
Use of traditional seed varieties0.1340.2840.228
Reliance on traditional knowledge and practices −0.2270.4620.526
Traceability and labelling practices−0.1040.474−0.379
Direct marketing channels−0.0890.023 0.432
Use of natural pest control methods 0.0340.5620.254
Use of organic fertilisers−0.1790.4160.182
Organic certification−0.0040.470−0.517
Post-harvest handling practices−0.0180.455−0.142
Market integration (wholesale market)−0.2460.479−0.430
Agrobiodiversity0.8260.2070.066
Local market integration (local markets)0.7120.1750.210
Traditional value-added products−0.0550.035−0.135
Eigenvalue2.2581.7691.419
Proportion15.06%11.79%9.46%
Cumulative15.06%26.85%36.31%
KMO0.615
Alpha0.386
LR test: independent vs. saturated: chi2 (105) = 502.30; Prob > chi2 = 0.0000.
Table 8. Factors influencing household food insecurity status.
VariablesCoef.Std. Err.p-ValueMarginal Effects
Food SecureMildly Food
Insecure
Moderately Food InsecureSeverely Food
Insecure
Modern agro-productivity practices0.0510.0550.3490.018−0.001−0.008−0.008
Sustainable market integration−0.2280.0780.003 ***−0.078 *0.0050.037 **0.037 ***
Traditional knowledge focus−0.1130.0670.094 *−0.039 **0.0020.018 *0.018 *
Household size0.0260.0090.004 ***0.009 ***−0.001−0.004 ***−0.004 ***
Age0.0040.0050.4380.001−0.000−0.001−0.001
Education−0.2020.0730.006 ***−0.069 *0.0040.033 ***0.032 ***
Livestock owned−0.0220.0070.001 ***−0.008 ***0.0000.004 ***0.004 ***
Occupation0.0670.1400.6340.023−0.001−0.011−0.011
Household food expenditure0.4540.1700.008 ***0.156 ***−0.010−0.073 ***−0.073 **
Remittances0.1650.1330.2140.057−0.004−0.027−0.026
Floods0.2600.1520.088 *0.089 *0.0060.042 **0.042 *
Cash Credit0.5620.3070.067 *0.193 *−0.012−0.091 *−0.090 *
The number of obs = 300 LR Chi2 (12) = 42.60 Prob > Chi2 = 0.001 Pseudo R2 = 0.055 Log likelihood = −364.19357. Note: *, ** and *** means coefficient and dy/dx are statistically significant at the 10%, 5% and 1% levels, respectively.
Disclaimer/Publisher’s Note: The statements, opinions and data contained in all publications are solely those of the individual author(s) and contributor(s) and not of MDPI and/or the editor(s). MDPI and/or the editor(s) disclaim responsibility for any injury to people or property resulting from any ideas, methods, instructions or products referred to in the content.

